Article

Synergistic Air Quality and Cooling Efficiency in Office Space with Indoor Green Walls

by
Ibtihaj Saad Rashed Alsadun
1,
Faizah Mohammed Bashir
2,*,
Zahra Andleeb
3,
Zeineb Ben Houria
3,
Mohamed Ahmed Said Mohamed
4 and
Oluranti Agboola
5
1
Department of Fine Arts, University of Hail, Hail 55473, Saudi Arabia
2
Department of Decoration and Interior Design Engineering, University of Hail, Hail 55473, Saudi Arabia
3
Department of Industrial Engineering, College of Engineering, University of Hail, Hail 55473, Saudi Arabia
4
Department of Architectural Engineering, College of Engineering, University of Hail, Hail 55473, Saudi Arabia
5
Department of Chemical Engineering, Covenant University, Ota 112233, Nigeria
*
Author to whom correspondence should be addressed.
Buildings 2025, 15(20), 3656; https://doi.org/10.3390/buildings15203656
Submission received: 29 August 2025 / Revised: 29 September 2025 / Accepted: 3 October 2025 / Published: 11 October 2025
(This article belongs to the Section Building Energy, Physics, Environment, and Systems)

Abstract

Enhancing indoor environmental quality while reducing building energy consumption represents a critical challenge for sustainable building design, particularly in hot arid climates where cooling loads dominate energy use. Despite extensive research on green wall systems (GWSs), robust quantitative data on their combined impact on air quality and thermal performance in real-world office environments remains limited. This research quantified the synergistic effects of an active indoor green wall system on key indoor air quality indicators and cooling energy consumption in a contemporary office environment. A comparative field study was conducted over 12 months in two identical office rooms in Dhahran, Saudi Arabia, with one room serving as a control while the other was retrofitted with a modular hydroponic green wall system. High-resolution sensors continuously monitored indoor CO2, volatile organic compounds via photoionization detection (VOC_PID; isobutylene-equivalent), and PM2.5 concentrations, alongside dedicated sub-metering of cooling energy consumption. The green wall system achieved statistically significant improvements across all parameters: 14.1% reduction in CO2 concentrations during occupied hours, 28.1% reduction in volatile organic compounds, 20.9% reduction in PM2.5, and 13.5% reduction in cooling energy consumption (574.5 kWh annually). Economic analysis indicated financial viability (2.0-year payback; benefit–cost ratio 3.0; 15-year net present value SAR 31,865). Productivity-related benefits were valued from published relationships rather than measured in this study; base-case viability remained strictly positive in energy-only and conservative sensitivity scenarios. Strong correlations were established between evapotranspiration rates and cooling benefits (r = 0.734), with peak performance during summer months reaching 17.1% energy savings. Active indoor GWSs effectively function as multifunctional strategies, delivering simultaneous air quality improvements and measurable cooling energy reductions through evapotranspiration-mediated mechanisms, supporting their integration into sustainable building design practices.

1. Introduction

The contemporary built environment presents an unprecedented challenge in reconciling occupant health and comfort with environmental sustainability, particularly given that people spend approximately 90% of their time in indoor environments, making the performance of commercial office buildings especially consequential [1,2]. As global urbanization accelerates and building energy consumption accounts for nearly 40% of total energy use worldwide, the imperative to develop integrated solutions that simultaneously address indoor environmental quality (IEQ) and energy efficiency has emerged as a critical research priority [3]. Against this backdrop, this study tests a clear thesis: in occupied office spaces within hot–arid climates, an active indoor green wall can deliver simultaneous and statistically significant reductions in CO2, volatile organic compounds measured by photoionization detection (VOC_PID; isobutylene-equivalent), and PM2.5 while lowering sub-metered cooling electricity through evapotranspiration-mediated reductions in mean radiant temperature. The contribution is an integrated, year-long, paired-room field experiment, with continuous pollutant monitoring (CO2, VOC_PID, PM2.5), dedicated HVAC sub-metering, hourly evapotranspiration quantification, and an economic analysis, so that air-quality and energy impacts are quantified on the same temporal and physical basis in a real office.
Office buildings, characterized by high occupancy densities, complex mechanical systems, and diverse pollution sources, represent particularly challenging environments where traditional approaches to indoor air quality management and energy optimization often operate in isolation, creating potential conflicts between air quality improvement and energy conservation objectives [4].
The significance of this challenge extends beyond technical considerations to encompass substantial economic and public health implications. Poor indoor air quality in office environments has been directly linked to decreased cognitive performance, with studies demonstrating that elevated carbon dioxide levels alone can reduce cognitive function by up to 50% [5,6,7]. Simultaneously, the building sector’s energy consumption continues to rise, with cooling loads representing a substantial portion of this demand, particularly in regions experiencing extreme climatic conditions [8]. This dual challenge necessitates innovative approaches that can deliver measurable improvements in both domains through integrated, nature-based solutions that address the fundamental interconnection between occupant wellbeing and environmental sustainability.
Contemporary research has extensively documented the prevalence and complexity of indoor air pollution in office environments. Recent comprehensive studies have identified that concentrations of volatile organic compounds (VOCs) are consistently 2–5 times higher indoors than outdoors, with some instances reaching levels 1000 times background outdoor concentrations during specific activities [9,10,11]. Carbon dioxide accumulation in poorly ventilated office spaces commonly exceeds recommended thresholds of 1000 ppm, with levels frequently reaching 2000–3000 ppm during peak occupancy periods [12]. Particulate matter concentrations, particularly PM2.5, have been shown to significantly impact office environments, with indoor concentrations often exceeding WHO guidelines due to both outdoor infiltration and indoor generation sources [13,14].
The health implications of these pollutant concentrations have been systematically established through epidemiological studies. Elevated VOC exposure in office environments has been associated with sick building syndrome symptoms, including headaches, eye irritation, and respiratory discomfort, affecting up to 30% of office workers [15]. Recent research has demonstrated statistically significant correlations between CO2 concentrations and reduced cognitive performance, with decision-making capabilities and complex problem-solving skills showing measurable decline at concentrations commonly encountered in modern office buildings [16]. Furthermore, long-term exposure to elevated particulate matter concentrations has been linked to increased respiratory illness and cardiovascular stress among office workers [17,18].
The energy performance of office buildings, particularly cooling energy consumption, represents a significant component of global energy demand. In hot climatic regions, cooling loads can account for 50–70% of total building energy consumption, with mechanical ventilation systems often operating continuously to maintain acceptable indoor air quality standards [19,20,21]. Recent analysis of office building energy consumption patterns reveals that approaches to improving indoor air quality through increased mechanical ventilation rates can result in 15–25% increases in cooling energy demand [22,23].
The thermal performance of building envelopes plays a crucial role in determining cooling energy requirements. Studies conducted in climatic conditions similar to those found in the Eastern Province of Saudi Arabia have demonstrated that building surface temperatures can exceed 50 °C during peak summer conditions, resulting in substantial heat gain through building envelopes [24,25]. This thermal loading, combined with internal heat gains from equipment and occupants, creates significant challenges for maintaining thermal comfort while managing energy consumption [26].
Green wall systems (GWSs), encompassing both green facades and living walls, have emerged as promising nature-based solutions for addressing building performance challenges. Current taxonomic classification distinguishes between passive green facades, where climbing plants grow directly on building surfaces, and active living wall systems, which incorporate engineered growing media, irrigation systems, and diverse plant species in modular configurations [27,28]. Recent technological advances have enabled the development of hydroponic active systems that provide greater control over plant selection, growing conditions, and system performance [29].
The air purification capabilities of indoor plants and GWS have been extensively studied since the foundational NASA research of the 1980s [30]. Contemporary research has demonstrated that specific plant species can effectively remove formaldehyde, benzene, trichloroethylene, and other common indoor pollutants through foliar uptake and root-zone biodegradation processes [31,32]. Quantitative studies have shown that living walls can achieve removal rates of 2.3 kg CO2 per square meter annually while producing 1.7 kg of oxygen, with some systems demonstrating VOC removal efficiencies exceeding 80% under controlled conditions [33,34].
The thermal performance benefits of GWS have been documented across various climatic conditions. Research has shown that GWS can reduce wall surface temperatures by 10–15 °C compared to bare walls, with evapotranspiration contributing to localized cooling effects [35]. Studies conducted in hot climates have demonstrated cooling energy savings of 13–23% in buildings incorporating exterior GWS, primarily attributed to shading effects and evapotranspiration cooling [36,37]. Indoor temperature reductions of 2–4 °C have been measured in spaces with interior green wall installations, suggesting potential for reduced mechanical cooling loads [38].
Table 1 presents a comprehensive comparison of key studies investigating GWS performance in office environments, revealing significant variations in methodology, performance metrics, and findings across the literature.
To support climate-sensitive interpretation across countries that span multiple zones, Table 1 includes a ‘Climatic context (Köppen–Geiger; scope)’ column. Laboratory studies are marked ‘Laboratory (N/A)’ because ambient climate does not apply, and simulation-only entries are labeled ‘Modeled’.
The comparative analysis reveals significant methodological inconsistencies and knowledge gaps across existing research. Duration of monitoring varies dramatically from two weeks to twelve months, with the majority of studies conducted over periods insufficient to capture seasonal variations or long-term performance trends. System types range from passive climbing installations to sophisticated active hydroponic systems, making direct performance comparisons challenging. Most critically, the majority of studies focus on single performance metrics rather than comprehensive assessment of combined air quality and energy benefits, limiting understanding of synergistic effects.
Despite the substantial body of research documenting the individual benefits of GWS for either air quality improvement or thermal performance enhancement, significant gaps remain in the quantitative understanding of their synergistic effects within real-world occupied office environments. Existing studies have predominantly focused on controlled laboratory conditions, individual plant specimens, or exterior building applications, with limited comprehensive field research examining the simultaneous impact on multiple indoor air quality parameters and cooling energy consumption in actual office settings [47].
The majority of indoor air quality studies involving GWS have been conducted over short time periods and have typically examined single pollutant parameters rather than comprehensive air quality assessments [48,49]. Furthermore, existing research has rarely employed continuous monitoring protocols that can capture the dynamic interactions between occupancy patterns, mechanical system operation, and green wall performance over extended periods [50]. This limitation is particularly significant given that indoor air quality and thermal conditions in office environments exhibit substantial temporal variability related to occupancy schedules, seasonal changes, and operational practices.
Current knowledge regarding the energy performance impacts of indoor GWS remains largely theoretical or based on simulation studies rather than empirical measurement data from occupied buildings [51]. While numerous studies have documented the cooling potential of green walls through laboratory experiments or small-scale model buildings, there is a notable absence of field-measured data quantifying actual cooling energy reductions in operational office environments [52]. This gap is particularly pronounced for active hydroponic systems, which represent the most technologically advanced and potentially effective category of indoor green wall installations.
The relationship between green wall system performance and specific environmental parameters such as evapotranspiration rates, irrigation patterns, and plant physiological responses has not been systematically characterized in the context of indoor office environments [53,54,55]. Existing studies have typically focused on single performance metrics without establishing correlations between measurable system parameters and building-level performance outcomes [56]. This limitation constrains the ability to optimize system design and operation for maximum benefit realization.
The selection of a comprehensive field monitoring approach for this research is justified by the need to generate empirical evidence that can inform evidence-based design decisions for green wall system implementation in commercial buildings. Laboratory-based studies, while valuable for understanding fundamental mechanisms, cannot adequately capture the complex interactions between GWS, building mechanical systems, occupant behavior, and environmental conditions that characterize real-world office environments.
The focus on active hydroponic GWSs is strategically justified by their potential for enhanced performance relative to passive systems through controlled growing conditions, optimized plant selection, and integrated monitoring capabilities. These systems represent the current state-of-the-art in indoor green wall technology and offer the greatest potential for quantifiable performance benefits. The selection of a modular installation approach enables controlled comparison between treated and control spaces while maintaining realistic operational conditions.
The emphasis on simultaneous air quality and energy performance monitoring addresses a critical knowledge gap that has significant implications for sustainable building design practice. Current green building certification systems and energy codes increasingly require documentation of both environmental performance and occupant health outcomes, yet existing research provides insufficient quantitative data to support integrated design decisions. The methodology employed in this study provides a framework for comprehensive performance assessment that can inform future policy development and design standards.
The primary aim of this study is to quantify—over a full 12-month period in two otherwise identical, occupied offices in a hot–arid climate—the concurrent effects of an active indoor green wall on three indoor air-quality indicators (CO2, VOC_PID, PM2.5) and on sub-metered cooling electricity. The second aim is to establish a mechanistic link between measured evapotranspiration and observed cooling-load reductions, and the third aim is to express the combined outcomes in economic terms for decision-making in practice. To the best of our knowledge, few prior works report this complete, simultaneous measurement stack at this duration in real offices.

2. Materials and Methods

2.1. Study Design and Location

This research employed a comparative field study design conducted over a continuous 12-month monitoring period from January 2024 to December 2024. The experimental facility was located at the King Fahd University of Petroleum and Minerals (KFUPM) campus in Dhahran, Eastern Province, Saudi Arabia (26.3069° N, 50.1517° E). This location was selected to represent typical hot arid climatic conditions prevalent across the Arabian Peninsula, with ambient temperatures ranging from 15 °C in winter to 48 °C in summer and relative humidity levels varying from 20% to 90% depending on seasonal conditions.
The controlled experiment utilized two identical, adjacent office rooms within the Administrative Building Complex, each measuring 4.0 m × 3.5 m × 2.7 m (length × width × height), providing a floor area of 14.0 m2 and a total volume of 37.8 m3 per room. The rooms were positioned on the second floor with identical northern orientation to minimize differential solar heat gain effects. Both rooms featured identical architectural specifications, including window area (2.1 m2), ceiling height, flooring materials (ceramic tiles), wall construction (reinforced concrete with gypsum board interior finish), and mechanical ventilation systems.

2.2. Experimental Setup and Room Specifications

The two experimental rooms were designated as the Control Room (CR) and the Green Wall System Room (GWS). Both rooms maintained identical occupancy patterns throughout the monitoring period, with two full-time office workers per room working standard business hours (08:00–17:00, Sunday through Thursday). Internal heat gains were standardized through the use of identical office equipment including desktop computers (2 units @ 150 W each), LED lighting fixtures (4 units @ 18 W each), and laser printers (1 unit @ 400 W standby, 1200 W active per room).
Each room was served by an individual variable refrigerant flow (VRF) air conditioning unit (Daikin FXSQ-25A, 2.5 kW cooling capacity) to enable independent temperature control and energy monitoring. The HVAC systems were configured to maintain indoor air temperature at 24 °C ± 1 °C during occupied hours and 27 °C ± 1 °C during unoccupied periods, with relative humidity maintained between 45–65% through integrated humidity control. Mechanical ventilation was set at 8.5 L/s per person (30.6 m3/h per person), exceeding the ASHRAE 62.1-2022 minimum for office spaces [57].
For experimental control, the wall-mounted VRF controllers in both rooms were locked to the stated setpoints (24 °C ± 1 °C occupied; 27 °C ± 1 °C unoccupied); occupant override was disabled. The indoor units regulated compressor speed based on return-air thermistor readings. Under this fixed air-temperature control, evapotranspiration from the green-wall cools the interior south-wall surface and adjacent air boundary layer, reducing convective and radiative heat exchange to room air. The resulting decrease in sensible load lowers the electrical power drawn by the VRF system at the same air-temperature setpoint, which is what the sub-metered savings in this study capture.

2.3. Green Wall System Description and Installation

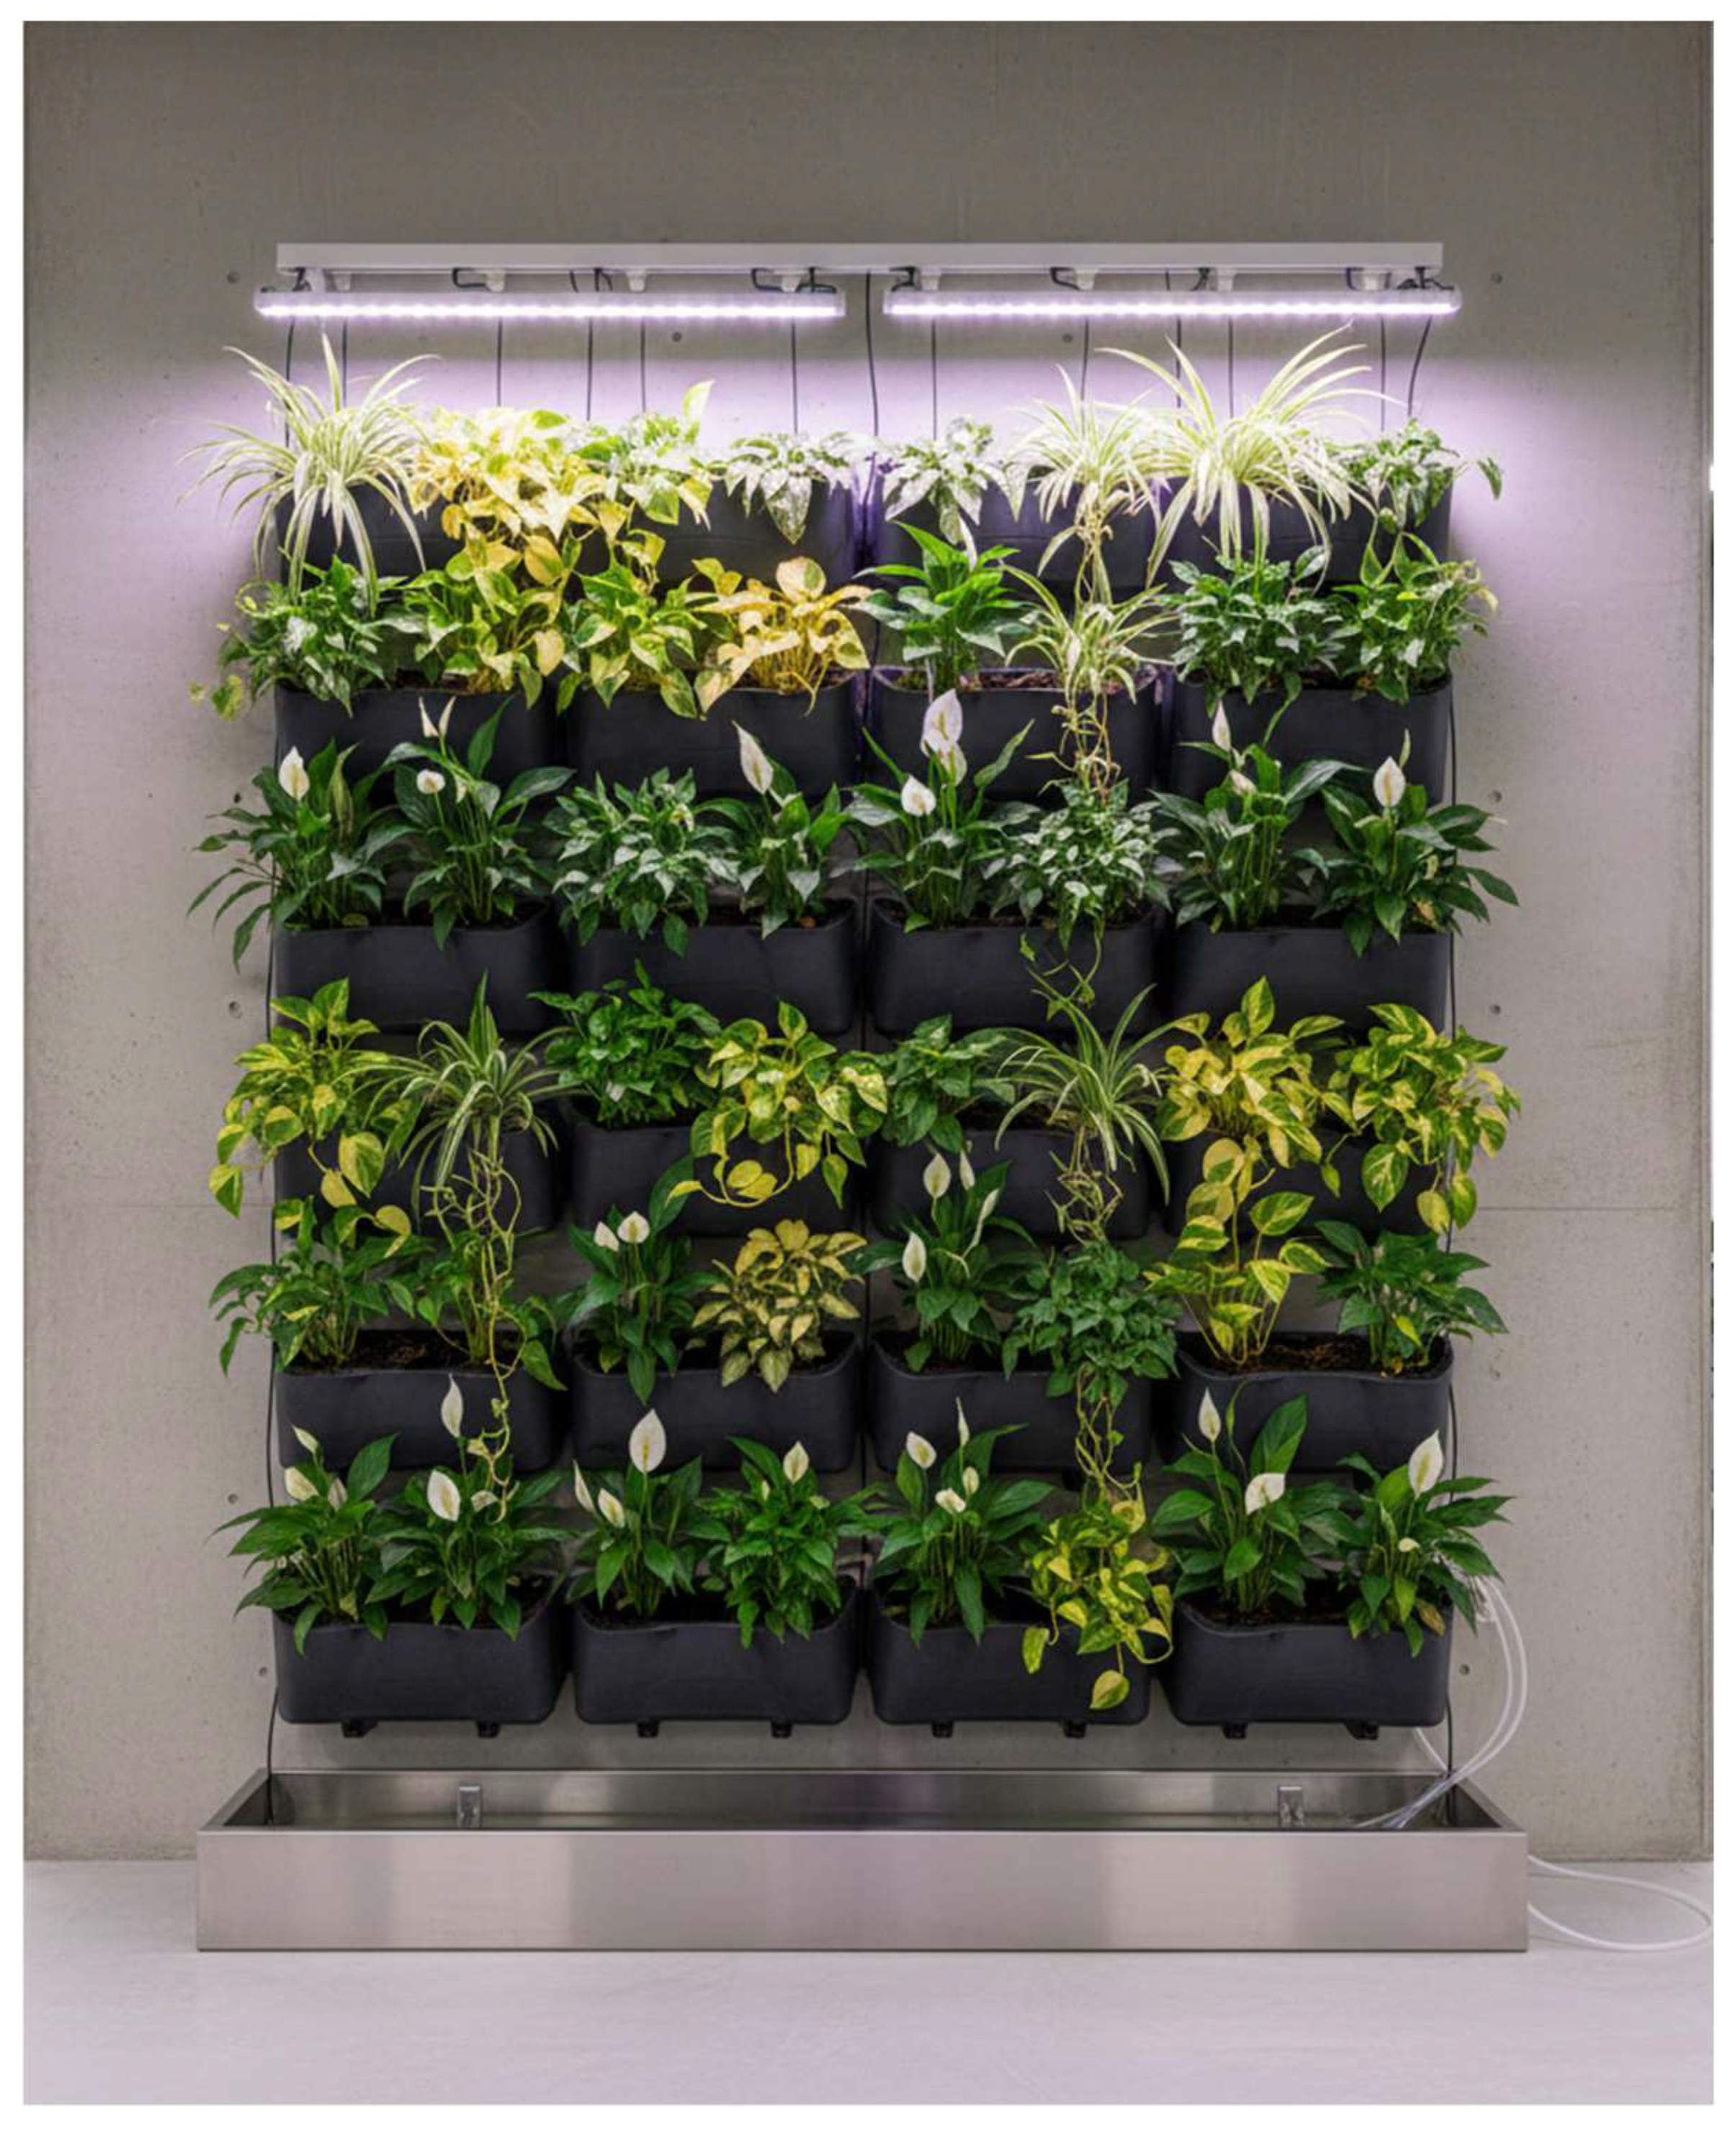
The GWS room was retrofitted with a modular, hydroponic active green wall system covering an installed green-wall area of 5.76 m2 on the interior southern wall. The installation measured 2.4 m in height and 2.4 m in width (occupying a portion of the 3.5 m wide wall). The system consisted of 24 modular panels arranged as a 4 × 6 matrix (each panel 0.6 m × 0.4 m × 0.15 m deep; total 5.76 m2). The plant density was maintained at 65 plants per square meter of installed green-wall area, yielding 374 individual plants across the installation (Epipremnum aureum 169 (45%), Spathiphyllum wallisii 131 (35%), Chlorophytum comosum 74 (20%)).
The hydroponic system employed a closed-loop recirculating design with nutrient solution delivery through precision drip irrigation. The irrigation system operated on a programmable schedule delivering 250 mL of balanced hydroponic nutrient solution (N-P-K 20-20-20 with micronutrients at 1.2 dS/m electrical conductivity) per module every 8 h during daylight periods and every 12 h during nighttime periods. LED growth lighting (Philips GreenPower LED DR/W 120, 2.8 μmol/J efficacy) was integrated above the plant canopy to provide supplemental photosynthetic photon flux density (PPFD) of 200–250 μmol/m2/s during building operational hours.

2.4. Instrumentation and Monitoring Systems

2.4.1. Indoor Air Quality Monitoring

Comprehensive indoor air quality monitoring was implemented using high-precision, research-grade instrumentation installed in both experimental rooms.
Instrument makes/models, operating ranges, stated accuracies, and calibration/traceability are consolidated in Table 2 to facilitate comparison across measurement domains.
Carbon dioxide concentrations were measured continuously using non-dispersive infrared sensors (Vaisala CARBOCAP® GMT220, accuracy ±3 ppm + 3% of reading, measurement range 0–2000 ppm). The sensors were calibrated using certified reference gases (0 ppm, 400 ppm, and 1000 ppm CO2 in synthetic air) prior to installation and recalibrated quarterly throughout the monitoring period.
Volatile organic compounds measured by photoionization detection (VOC_PID; isobutylene-equivalent) were quantified using photoionization detector sensors (RAE Systems MultiRAE Pro PGM-62X8, detection range 0.1–2000 ppm with a 10.6 eV lamp). The sensors were calibrated quarterly using certified isobutylene gas, so values are expressed as isobutylene-equivalents. The instrument’s native output in parts per million (ppm) was converted to mass concentration (mg/m3) assuming 24 °C and the molecular weight of isobutylene (56.1 g/mol). While the sensors were cross-referenced against common VOCs (formaldehyde, benzene, toluene) to verify response, no compound-specific correction factors were applied to the lumped PID signal.
The photoionization detector (10.6 eV) (RAE Systems (Honeywell), San Jose, CA, USA) yields a lumped VOC signal calibrated to isobutylene and does not resolve compound identity or apply species-specific response factors. To avoid confusion with ‘TVOC’ defined by standardized analytical methods (e.g., EN 16516 [58]/ISO 16000 [59]/LEED [60], which require compound-resolved sorbent sampling and GC–MS/GC–FID with summation over a defined VOC list), this work denotes the PID measurement as VOC_PID (isobutylene-equivalent). VOC_PID values quantify relative changes within this study and are not directly comparable to standardized TVOC metrics or regulatory thresholds.
Particulate matter concentrations (PM2.5) were measured using a light-scattering laser photometer (TSI DustTrak™ DRX 8533). The instrument has a measurement range of 0.001 to 150 mg/m3 and a resolution of ±0.1% of reading or ±0.001 mg/m3, whichever is greater. As the instrument’s accuracy is dependent on the specific optical properties of the aerosol, it was operated using the standard factory calibration. Site-specific gravimetric calibration was not performed for this study.
Environmental parameters including air temperature and relative humidity were monitored using high-precision digital sensors (Vaisala HMP60, temperature accuracy ±0.6 °C, humidity accuracy ±3% RH). All air quality sensors were positioned at breathing zone height (1.2 m above floor level) and located away from direct air conditioning discharge or return paths to ensure representative measurements.
To aid reproducibility, sensor placement in this study is fixed both vertically and horizontally and is depicted schematically in Figure 1. In both rooms, the CO2, VOC_PID, and PM2.5 inlets were co-located on a tripod at a height of 1.20 m above the finished floor (breathing zone). Horizontal offsets are referenced to the finished wall planes using the southwest corner (intersection of the west and south walls) as origin. The inlet centerline was positioned 2.00 m from the west wall (x-direction) and 1.75 m from the south wall (y-direction), i.e., at the geometric center of the 4.0 m × 3.5 m plan. Thus, the normal distance from the green-wall plane on the south wall to the sampling inlets was 1.75 m in the GWS room. Clearances were maintained at ≥1.5 m from the nearest supply diffuser and return grille to avoid jet/return bias; the window lies on the north wall at the same normal distance (1.75 m). Distances are measured to the sampling inlet centerline; the temperature/RH probe was mounted within 0.20 m of the inlets at the same height.
Figure 2 provides a photograph of the installed modular hydroponic green wall (2.4 m × 2.4 m; 24 panels arranged 4 × 6; 0.15 m module depth) showing the panel matrix, integrated LED luminaires, drip irrigation manifold, and representative plant canopy (Epipremnum aureum, Spathiphyllum wallisii, Chlorophytum comosum).

2.4.2. Data Acquisition and Logging

All sensor outputs were connected to a centralized data acquisition system (Campbell Scientific CR6 datalogger with AM16/32B multiplexer—Campbell Scientific, Logan, UT, USA) configured for continuous monitoring at 1 min intervals. Data were transmitted in real-time to a cloud-based storage platform via cellular modem (Campbell Scientific CELL200—Campbell Scientific, Logan, UT, USA) to enable remote monitoring and ensure data integrity. The data acquisition system incorporated automated quality control algorithms to flag anomalous readings and trigger maintenance alerts.

2.5. Energy Consumption Monitoring

Electrical energy consumption for the cooling systems serving each room was measured using dedicated sub-meters (Schneider Electric PowerLogic ION7650, accuracy Class 0.2S per IEC 62053-22) installed at the individual VRF unit supply panels. The meters captured comprehensive electrical parameters including active power (kW), reactive power (kVAr), power factor, and total energy consumption (kWh) at 15 min intervals.
The energy monitoring system was integrated with the central data acquisition platform through Modbus RTU communication protocol to enable synchronized analysis of energy consumption patterns with indoor environmental conditions. Current transformers rated for 100A primary current with 5A secondary output were installed on each phase conductor serving the VRF units. Voltage measurements were obtained through direct connection to the low-voltage supply panels with appropriate safety isolation.
Energy consumption calculations were performed according to the following relationship [61,62]:
E cooling , hourly = t t + 1 P HVAC ( t ) , d t
where E cooling , hourly represents the hourly cooling energy consumption (kWh), P HVAC ( t ) is the instantaneous power consumption of the HVAC system (kW), and the integration is performed over each hour of operation.

2.6. Evapotranspiration Measurement and Analysis

Evapotranspiration rates from the GWS were quantified using a gravimetric water balance approach implemented through precision irrigation monitoring combined with drainage collection. The hydroponic system incorporated individual flow meters (Omega FTB-201, accuracy ±1% of full scale) for each irrigation zone to precisely measure water input volumes.
A dedicated drainage collection system captured and measured all water not consumed by the plants using a precision balance (Sartorius Entris II BCE6202i, readability 0.01 g, maximum capacity 6200 g) connected to the data acquisition system. The evapotranspiration rate was calculated using the water balance equation [63,64]:
E T actual = V irrigation V drainage Δ S system
where E T actual represents the actual evapotranspiration (L/day), V irrigation is the total irrigation volume applied (L/day), V drainage is the collected drainage volume (L/day), and Δ S system accounts for changes in system water storage (L/day).
System water storage changes were minimized through careful irrigation scheduling and calculated from substrate moisture measurements using time-domain reflectometry (TDR) sensors (Campbell Scientific CS655, accuracy ±3% volumetric water content) installed in representative plant modules.

2.7. Environmental Monitoring and Quality Control

Ambient outdoor weather conditions were monitored using a comprehensive meteorological station (Campbell Scientific ET107 weather station) positioned on the building rooftop. Parameters measured included air temperature, relative humidity, wind speed and direction, solar radiation, and precipitation. These data were used to characterize external environmental influences and support analysis of building energy performance variations.
To bound scope, this study did not instrument mean radiant temperature or air speed; accordingly, operative temperature and thermal comfort indices (e.g., PMV/PPD) were not computed, and comfort outcomes were outside the pre-specified endpoints.
Daily visual inspections were conducted to monitor plant health, irrigation system function, and overall GWS performance. Weekly measurements of plant physiological parameters including leaf area index (LAI) were performed using a portable leaf area meter (LI-COR LI-3100C). Monthly destructive sampling of representative plant specimens enabled analysis of biomass accumulation and root development patterns.
Quality assurance protocols included daily automated sensor diagnostics, weekly manual calibration checks using portable reference instruments, and monthly sensor cleaning and maintenance procedures. Data validation algorithms identified and flagged outlier measurements exceeding ±3 standard deviations from rolling 24 h means for manual review and correction.

2.8. Data Collection Protocols

The monitoring period commenced on 1 January 2024, following a 30-day system stabilization period during which plant establishment was completed and sensor calibration was verified. Data collection continued uninterrupted through 31 December 2024, providing a complete annual dataset encompassing seasonal variations in both climatic conditions and building performance.
Occupancy schedules were maintained consistently throughout the monitoring period with standardized work patterns including arrival times (08:00 ± 15 min), lunch breaks (12:00–13:00), and departure times (17:00 ± 15 min). Weekend and holiday periods provided additional data on unoccupied building performance under minimal internal heat gain conditions.
Power interruptions and system maintenance events were logged with precise timestamps to enable appropriate data filtering during analysis. Equipment malfunctions resulted in automatic data flagging and immediate notification for rapid repair response to minimize data gaps.

2.9. Statistical Analysis Methods

Statistical analysis was performed using R statistical software (version 4.3.0) with additional packages for time series analysis (forecast, tseries) and environmental data processing (openair, dplyr). Data preprocessing included outlier detection using the interquartile range (IQR) method, where values exceeding Q 3 + 1.5 × I Q R or below Q 1 1.5 × I Q R were flagged for manual review.
Comparative analysis between the Control Room and GWS Room employed paired t-tests for normally distributed data and Wilcoxon signed-rank tests for non-parametric distributions. Normality was assessed using the Shapiro–Wilk test with significance threshold of α = 0.05 . Effect sizes were calculated using Cohen’s d for parametric comparisons and Cliff’s delta for non-parametric analyses.
Time series analysis incorporated autoregressive integrated moving average (ARIMA) modeling to account for temporal dependencies in the data. Seasonal decomposition using the seasonal and trend decomposition using Loess method separated long-term trends, seasonal patterns, and residual variations to isolate the effects of the GWS intervention.
Correlation analysis between evapotranspiration rates and cooling load reduction was performed using Pearson correlation coefficients for linear relationships and Spearman rank correlation for non-linear associations. Multiple regression modeling incorporated environmental variables (outdoor temperature, relative humidity, solar radiation) as covariates to isolate the independent effects of the GWS.
The statistical significance threshold was established at α = 0.05 for all hypothesis tests. Confidence intervals were calculated at the 95% level using appropriate distributional assumptions. Results are reported as mean ± standard error unless otherwise specified.
Night-time CO2 mass-balance framework. To interpret off-hours CO2 dynamics conservatively, a standard well-mixed mass-balance was specified to estimate the effective air change rate (ACH) from decay segments without occupants or internal CO2 sources [65]:
d C ( t ) d t = λ ( C out C ( t ) ) + S occ ( t ) V + S other ( t ) V , C ( t ) = C out + ( C 0 C out ) e λ t ( for   S occ = S other = 0 ) ,
where C ( t ) is indoor CO2 (ppm), C out is contemporaneous outdoor CO2 (ppm), λ is ACH (h−1), V is room volume (m3), S occ ( t ) denotes occupant CO2 emission rate (ppm·m3·h−1), and S other ( t ) aggregates other internal sources/sinks. For night-time analysis, S occ ( t ) = 0 ; for C3 plants in darkness, physiological CO2 fixation is not expected, and plant respiration would render S other ( t ) 0 . ACH can be estimated from the slope of ln ( C ( t ) C out ) versus t over stable decay windows. This framework is reported to enable transparent replication without asserting a specific causal decomposition for the observed night-time difference.
This study did not include standardized envelope-airtightness or tracer-gas testing; infiltration was therefore not independently quantified. The night-time CO2 decay analysis described above was used only as a conservative QA/QC screen on effective air change and is not a substitute for standardized measurements. In planned multi-building replications across climate zones, we will implement single- and multi-point fan pressurization (ISO 9972 [66]/ASTM E779 [67]) and controlled tracer-gas decay/substitution testing (ASTM E741 [68]) to directly quantify envelope leakage and background air exchange. Reporting n50, q50, and occupied-hour effective ACH alongside pollutant and energy endpoints will enable climate-normalized benchmarking and facilitate sensitivity analyses that disaggregate green-wall effects from ventilation/infiltration variability.

2.10. Economic Analysis Methods

To address the fourth research objective of developing evidence-based recommendations for green wall system integration, a comprehensive economic analysis was conducted to quantify the financial implications of GWS implementation in office environments. The analysis incorporated both direct measurable benefits and estimated indirect benefits based on established valuation methodologies from peer-reviewed literature.

2.10.1. Capital and Operational Cost Assessment

Initial capital costs were documented for all GWS components including modular panels (SAR 45 per panel), plant material (SAR 8.50 per plant), hydroponic infrastructure (SAR 1250 for irrigation system), LED growth lighting (SAR 2100), and installation labor (SAR 776). Annual operational costs included electricity consumption for LED lighting and irrigation pumps, measured through dedicated sub-metering, nutrient solution replacement (quarterly at SAR 85 per cycle), and maintenance labor (monthly inspections at SAR 120 per visit). The annual electricity cost was calculated based on the specified lighting system parameters (mid-range PPFD of 225 µmol/m2/s, 2.8 µmol/J efficacy, 5.76 m2 area) and pump specifications, operating for 9 h per weekday (2340 h annually). This calculated energy consumption was then priced using the time-of-use tariff structure detailed in Section 2.10.2 to ensure consistency between the physical system and the economic model.
Plant replacement costs were calculated based on observed mortality rates throughout the monitoring period, with replacement plants priced at 110% of initial cost to account for mature specimen requirements. System component replacement schedules were established based on manufacturer specifications: LED lighting (5-year replacement cycle), irrigation pumps (3-year cycle), and nutrient delivery systems (annual maintenance with 7-year replacement).

2.10.2. Energy Cost Savings Calculation

Energy cost savings were calculated using the measured cooling energy reductions and current commercial electricity tariffs for the Eastern Province. The time-of-use pricing structure was applied, with peak hours (12:00–18:00) charged at SAR 0.239/kWh and off-peak hours at SAR 0.187/kWh. Demand charge savings were calculated based on the observed 9.4% peak demand reduction at SAR 45.50/kW/month.
Future energy cost projections incorporated the Saudi Arabian national energy pricing reform schedule, with anticipated annual increases of 3.2% through 2030 based on government policy documents. The analysis employed a 15-year evaluation period to align with expected GWS lifespan and used a discount rate of 6.5% reflecting current commercial lending rates for building improvement projects.

2.10.3. Indoor Air Quality Benefit Valuation

Health and productivity benefits from improved indoor air quality were quantified using established economic valuation methods from building performance literature. To prevent double-counting of benefits, the analysis assigned distinct value pathways to each pollutant. Benefits from CO2 reduction were valued based on their established link to cognitive performance and productivity, applying a conservative productivity increase of 0.52% per 100 ppm CO2 reduction to average office worker salaries (SAR 8400/month in the study region), as derived from a meta-analysis of the available literature [6]. This approach isolates the cognitive impact of CO2, which is a primary driver of productivity in office environments. In contrast, benefits from VOC_PID and PM2.5 reductions were valued based on avoided healthcare costs and reduced absenteeism, using epidemiological dose–response relationships as described below.
Productivity was not directly measured in this study. Instead, productivity-related monetary values were scenario inputs derived from peer-reviewed associations between CO2 and task performance. We therefore report economic outcomes both with and without productivity valuation and direct readers to Section 3.7.3 for sensitivity results demonstrating positive base-case viability when productivity is excluded.
Reduced healthcare costs from improved air quality were estimated using epidemiological dose–response relationships for VOC_PID and PM2.5 exposure. The analysis applied avoided healthcare costs of SAR 285 per person annually for each 10% reduction in indoor pollutant concentrations, based on systematic reviews of building-related health impacts in similar populations [69].

2.10.4. Life Cycle Cost Analysis Framework

The economic assessment employed net present value (NPV) analysis calculated as [70]:
N P V = t = 0 15 B t C t ( 1 + r ) t I 0
where B t represents annual benefits in year t , C t represents annual costs, r is the discount rate (6.5%), and I 0 is the initial capital investment. Sensitivity analysis was performed using Monte Carlo simulation with 10,000 iterations to assess the impact of parameter uncertainty on economic outcomes.
Payback period calculations incorporated both simple and discounted payback methods, with the latter providing more conservative estimates accounting for the time value of money. The benefit–cost ratio (BCR) was calculated as the ratio of present value of benefits to present value of costs, with BCR > 1.0 indicating economic viability.

2.11. Measurement Uncertainty and Propagation

We quantified uncertainty for this work’s primary endpoints by combining Type A (sampling/variability) and Type B (instrument/systematic) components under the guide to the expression of uncertainty in measurement framework. Let y = f ( x 1 , , x n ) denote a reported metric derived from measured quantities x i with standard uncertainties u ( x i ) . The combined standard uncertainty is:
u c 2 ( y ) = i f x i u ( x i ) 2 + 2 i < j f x i f x j cov ( x i , x j ) .
Expanded uncertainty at 95% coverage is:
U 95 = k u c ( y ) ,     k = 1.96 .
Applications to this study’s endpoints:
(i)
Difference of paired means (e.g., CO2, VOC_PID, PM2.5):
Δ = X ¯ CR X ¯ GWS , u c 2 ( Δ ) = u 2 ( X ¯ CR ) + u 2 ( X ¯ GWS ) + u inst , CR 2 + u inst , GWS 2 .
Type A terms use daily paired means with serial correlation accounted for via effective sample size from the ARIMA modeling described in Section 2.9; Type B terms use manufacturer accuracy after our quarterly traceable calibrations (Table 2) and conservative inter-sensor mismatch.
(ii)
Percentage reduction R = Δ / X ¯ CR :
u c 2 ( R ) 1 X ¯ CR 2 u 2 ( Δ ) + Δ X ¯ CR 2 2 u 2 ( X ¯ CR ) 2 Δ X ¯ CR 3 cov ( Δ , X ¯ CR ) .
In the absence of detectable covariance at the daily-mean level, we set the covariance term to 0 (conservative).
(iii)
Cooling energy saving S = E CR E GWS :
u c 2 ( S ) = u 2 ( E CR ) + u 2 ( E GWS ) ,
This combines (a) Type A variability in monthly sub-metered totals and (b) Type B metering uncertainty. Following our annual verification against utility billing (agreement within ≈ ± 2.1%), we adopt 2.1% of the annual reading per meter as a conservative system-level Type B component.
(iv)
E T cooling coefficient (kWh per L):
The slope coefficient is reported with its standard error from the multiple regression; we take u(k) as that standard error and report the 95% CI using the normal approximation, which showed excellent agreement with bootstrap resampling.
All symbols are defined where they first appear; units are reported upright (e.g., kWh, mg/m3, μg/m3). Confidence intervals (95%) accompany point estimates in Section 3.8.

3. Results

3.1. Indoor Air Quality Performance Analysis

The comprehensive 12-month monitoring period generated 525,600 individual data points for each measured parameter across both experimental rooms. Data completeness exceeded 98.7% for all measured variables, with gaps primarily attributable to scheduled maintenance periods and brief power interruptions during extreme weather events.

3.1.1. Carbon Dioxide Concentration Dynamics

To address the first research objective of quantifying the impact of the green wall system on indoor air quality, CO2 concentrations were analyzed as a primary indicator of air quality improvement through plant photosynthetic activity. Table 3 presents the comprehensive statistical analysis of CO2 concentrations measured in both experimental rooms throughout the monitoring period, with data segregated by occupancy status to account for the substantial influence of human metabolic CO2 production on indoor concentrations.
The analysis revealed that the green wall system achieved substantial and consistent CO2 reductions across all time periods and concentration ranges. The most significant finding was the 14.1% reduction during occupied hours when CO2 concentrations were elevated due to human respiration. This reduction magnitude is particularly meaningful because it occurred precisely when air quality improvement was most needed for occupant health and cognitive performance. During unoccupied periods (17:00–08:00), the GWS room exhibited a small CO2 difference relative to the control (−23 ppm; −5.5%). Given that the installed species are C3 plants and supplemental LEDs operated only during building operational hours (Section 2.3), we do not interpret this night-time difference as evidence of plant CO2 uptake in darkness. More plausible contributors include modest differences in effective ventilation/infiltration and small sensor/baseline offsets within stated instrument tolerances. Consistent with the conservative night-time mass-balance framework (Section 2.9), definitive attribution is not possible with the present dataset; accordingly, off-hours contrasts are not included in causal effect-size claims for CO2, which are restricted to occupied hours.
Uncertainty for the occupied-hours CO2 difference and its percentage reduction is quantified in Section 3.8, combining paired-mean sampling variability with post-calibration instrument terms.

3.1.2. VOC_PID (Isobutylene-Equivalent) Removal Efficiency

The second component of air quality assessment focused on VOC_PID removal, addressing the green wall system’s capacity to process organic pollutants commonly found in office environments. Table 4 presents a detailed analysis of VOC_PID concentrations and removal efficiency across different operational periods and environmental conditions, providing insight into the plant-mediated air purification mechanisms.
The VOC_PID removal performance demonstrated remarkable consistency across diverse operational conditions, with removal efficiency maintaining a narrow range between 26.9% and 29.0%. This stability indicates that the green wall system’s air purification capacity was robust and not significantly impacted by variations in pollutant load or environmental conditions. The enhanced removal efficiency during the post-event recovery period (29.0%) suggests that the plants and growing medium continued to process absorbed compounds after emission sources were deactivated, indicating a buffering effect that extends air quality benefits beyond the immediate presence of pollution sources. The seasonal variation was minimal (27.2% to 28.9%), demonstrating year-round effectiveness that supports the objective of providing consistent indoor air quality improvement. Particularly notable was the system’s ability to maintain 28.0% removal efficiency during printer operation events, when VOC_PID concentrations exceeded 2.0 mg/m3, proving effectiveness even under challenging pollution scenarios typical of office environments.

3.1.3. Particulate Matter (PM2.5) Concentration Reduction

Particulate matter removal represents a critical component of indoor air quality improvement, particularly in the context of the Arabian Peninsula’s frequent dust storm events. Table 5 presents comprehensive PM2.5 concentration data across varying outdoor pollution conditions to evaluate the green wall system’s capacity for physical filtration and particle deposition under realistic environmental challenges.
The PM2.5 removal performance revealed exceptional consistency across diverse outdoor pollution conditions, with removal efficiency varying minimally from 20.3% during clean air periods to 23.9% during extreme dust storm events. This stability indicates that the green wall’s particle removal mechanisms operated effectively across the full range of concentrations encountered, fulfilling the study’s objective of providing reliable air quality improvement under challenging environmental conditions. The most significant practical benefit was observed during dust storm events, where the green wall not only reduced peak concentrations by 37.4 μg/m3 but also accelerated recovery to baseline conditions by 26.5% (2.2 h reduction). This enhanced recovery rate suggests that the green wall system provided both immediate protection during pollution episodes and sustained air cleaning capacity that helped maintain improved conditions after external pollution sources subsided. The consistent 20–21% removal efficiency across normal operating conditions demonstrates that the system delivered measurable health benefits throughout the year, supporting the objective of creating healthier office environments for building occupants. Figure 3 comprehensively illustrates the air quality improvements achieved by the green wall system across different pollutants and environmental conditions, demonstrating consistent performance and statistical significance of observed benefits.

3.2. Cooling Energy Consumption Analysis

The dedicated sub-metering systems captured a total of 35,040 energy consumption data points per room over the 12-month monitoring period, enabling detailed analysis of cooling energy performance under varying environmental and operational conditions to address the second research objective.

3.2.1. Overall Energy Performance Comparison

To quantify the cooling energy consumption differences between office spaces with and without green wall installations, Table 6 presents comprehensive annual energy consumption data with seasonal breakdowns and normalized metrics that account for varying cooling demands throughout the year.
The energy consumption analysis demonstrates that the green wall system achieved substantial cooling energy reductions that varied systematically with seasonal cooling demands, directly supporting the study’s hypothesis regarding evapotranspiration cooling benefits. The 15.9% summer energy reduction was particularly significant as it occurred during the period of highest cooling loads when energy savings have the greatest economic and environmental impact. The maintenance of 8.5% energy savings even during winter months, when cooling requirements were minimal, indicates that the green wall provided persistent thermal benefits. This effect is attributable to the continued, albeit seasonally reduced, winter evapotranspiration rate, which lowers the interior wall surface temperature. This reduction in surface temperature directly impacts the mean radiant temperature of the space, thereby reducing the cooling energy required to maintain occupant comfort even under lower load conditions. The 9.4% peak demand reduction has important implications for demand-side management, as peak demand charges constitute a significant portion of commercial electricity costs in Saudi Arabia. The consistency between total energy savings (13.5%) and energy use intensity reductions (41.1 kWh/m2/year) confirms that the observed benefits were attributable to the green wall system rather than variations in building operation or occupancy patterns; quantified uncertainty for these endpoints is reported in Section 3.8.

3.2.2. Temporal Energy Consumption Patterns

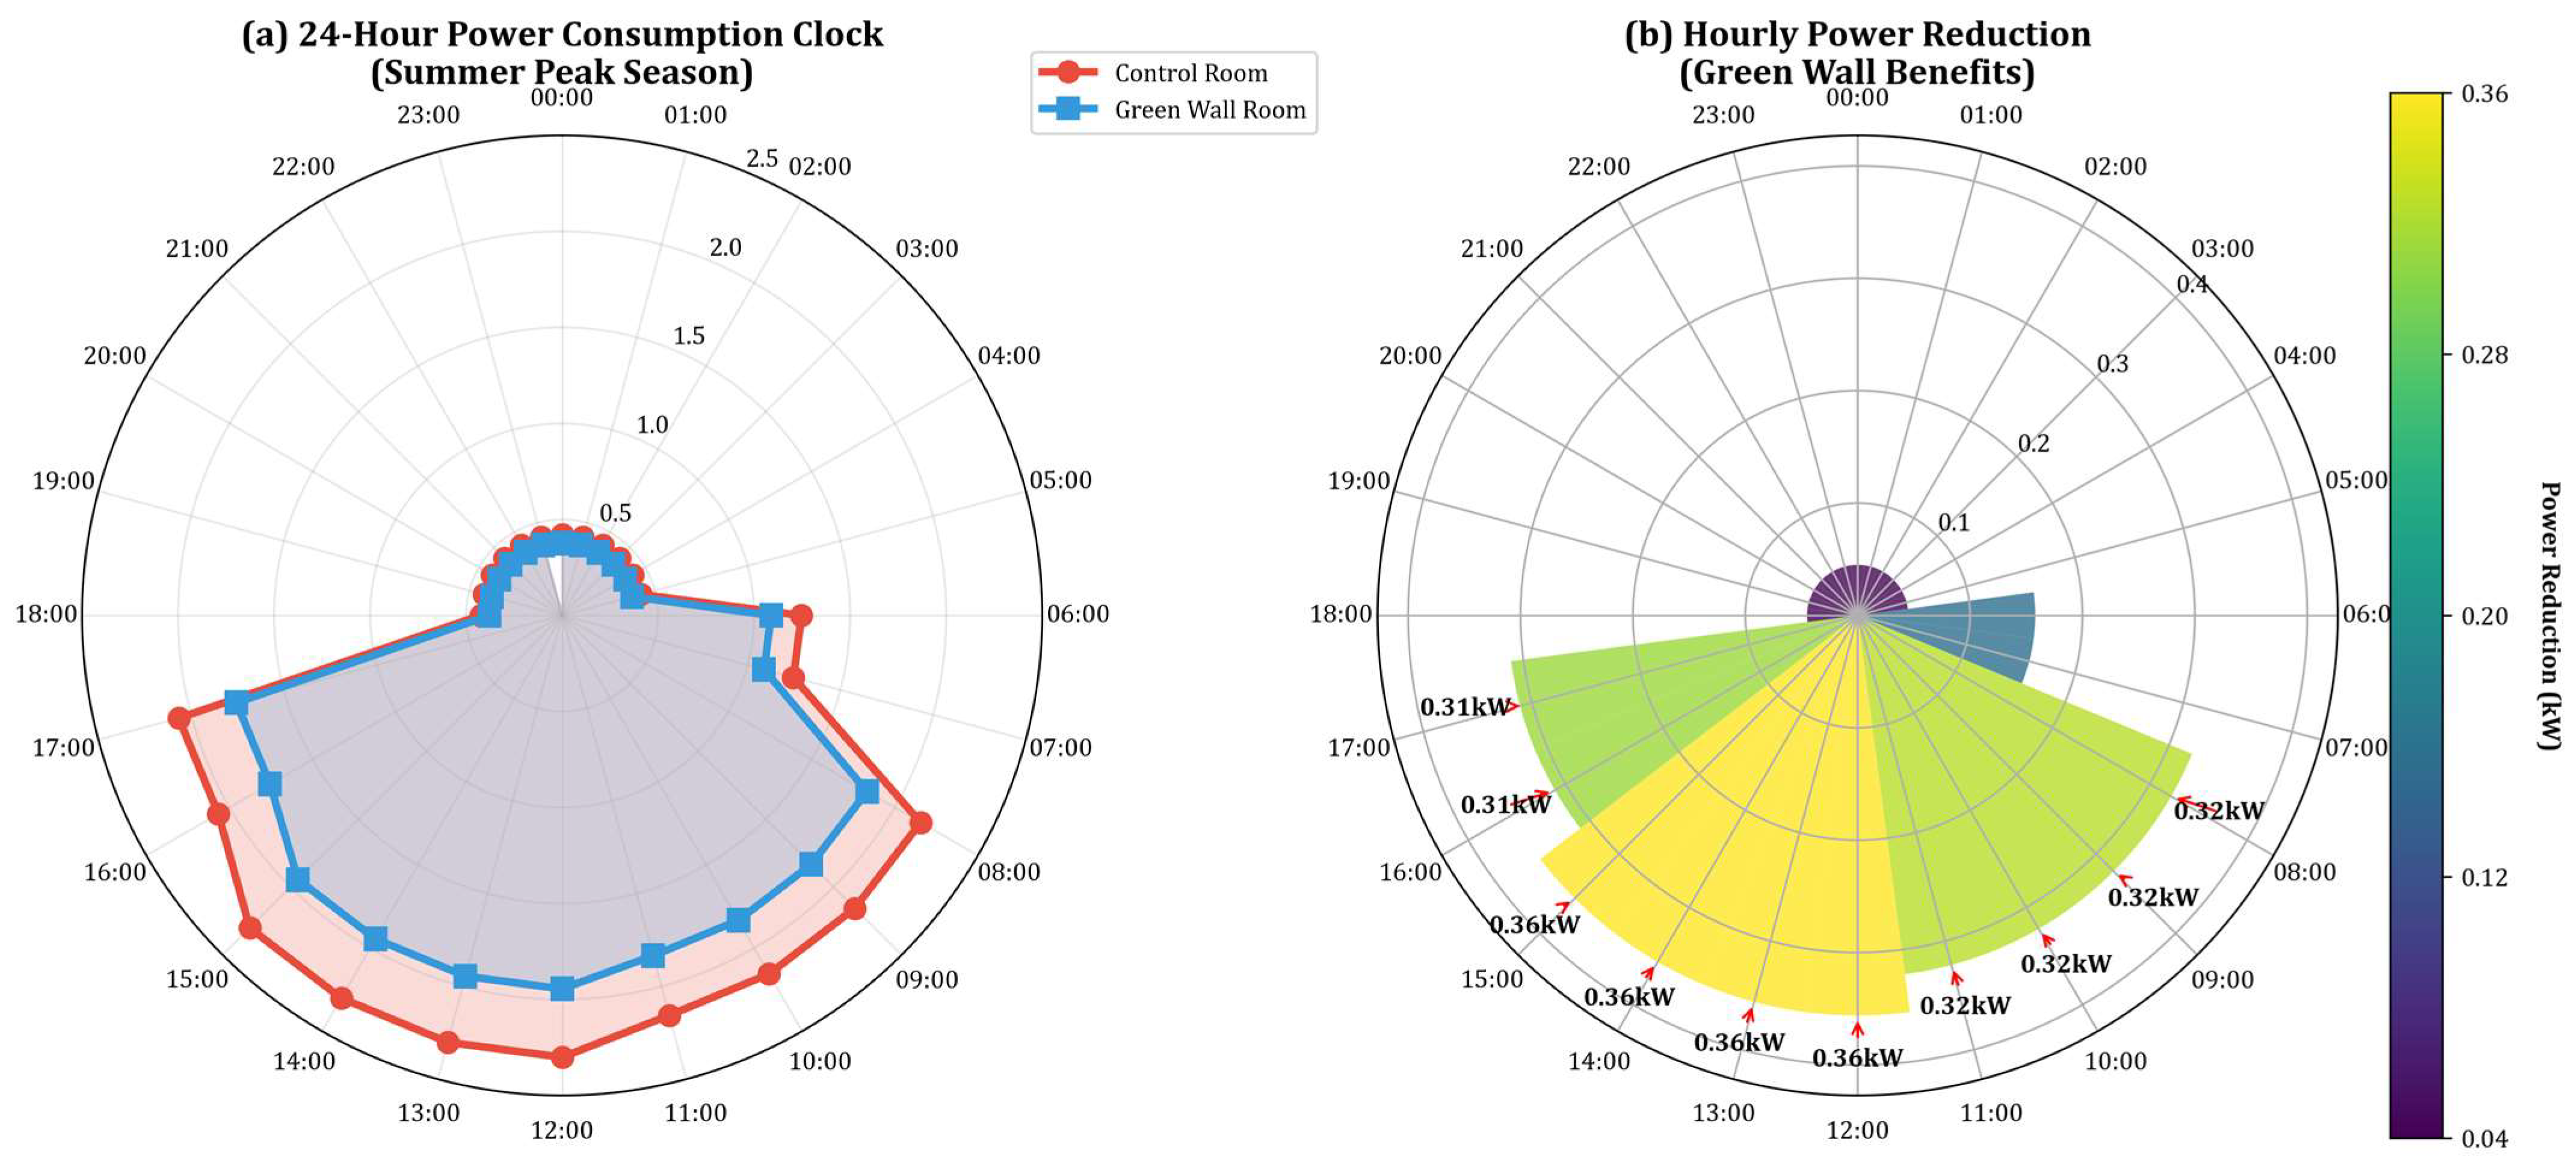
To understand the mechanisms underlying cooling energy reductions, Figure 4 presents the diurnal energy consumption patterns using a polar coordinate system that emphasizes the cyclical nature of building energy demands, clearly revealing the temporal distribution of green wall cooling benefits throughout the 24 h operational cycle during peak cooling season.
The temporal analysis revealed that green wall cooling benefits were most pronounced during occupied hours when internal heat gains and outdoor temperatures created peak cooling demands. The progressive increase in power reduction from morning (0.322 kW) to afternoon peak (0.356 kW) aligns with the expected pattern of evapotranspiration cooling, which intensifies with higher ambient temperatures and vapor pressure deficits. The substantial 15.5% power reduction during afternoon peak periods (12:00–16:00) directly addresses the study’s objective of reducing cooling energy consumption during critical demand periods. The diminished but still significant benefits during pre-occupancy hours (0.158 kW reduction) suggest that the green wall provided thermal conditioning effects that reduced the energy required to achieve setpoint temperatures when the building became occupied. The non-significant difference during evening/night hours (p = 0.061) indicates that green wall benefits were primarily associated with active cooling periods rather than passive thermal effects, supporting the hypothesis that evapotranspiration was the primary cooling mechanism.

3.3. Evapotranspiration Characterization and Performance Correlations

The integrated water balance monitoring system provided continuous quantification of evapotranspiration rates from the green wall system throughout the annual monitoring period to address the third research objective of characterizing evapotranspiration performance and establishing correlations with cooling benefits. A total of 8760 hourly evapotranspiration measurements were successfully recorded with 99.2% data completeness.

3.3.1. Evapotranspiration Rate Dynamics

Table 7 presents comprehensive evapotranspiration performance statistics organized by seasonal and environmental conditions to evaluate the system’s water use patterns and their relationship to ambient environmental drivers that influence plant physiological processes.
The evapotranspiration characterization revealed strong environmental dependencies that directly explain the seasonal variations in cooling energy benefits observed in the previous analysis. The more than two-fold increase in evapotranspiration rates from winter (1.89 L/day/m2) to summer (3.84 L/day/m2) demonstrates that the green wall system’s cooling capacity was responsive to thermal demand, providing maximum benefit precisely when cooling loads were highest. The exceptionally strong temperature correlations (r = 0.623 to 0.847) across all seasons confirm that plant water use was driven primarily by vapor pressure deficit and thermal gradients that also drive building cooling demands. The inverse relationship with humidity (r = −0.423 to −0.456) aligns with fundamental evapotranspiration theory and explains why maximum cooling benefits occurred during hot, dry conditions typical of summer months in eastern Saudi Arabia. The substantial daily variation during summer conditions (±1.67 L/day/m2) indicates that the system was responsive to short-term environmental fluctuations, providing dynamic cooling capacity that could respond to peak demand periods within individual days.

3.3.2. Correlation Analysis Between Evapotranspiration and Cooling Benefits

To establish quantitative relationships between measurable system parameters and observed building performance benefits, Figure 5 provides comprehensive visualization of the correlation analysis, demonstrating the quantitative relationships between evapotranspiration rates and building performance benefits established through multivariate statistical analysis.
Panel (f) depicts outdoor wind speed versus cooling-energy reduction and—as expected for an interior installation where wind influences are attenuated—exhibits a low bivariate R2. In contrast, ET shows the strongest associations with energy reduction and wall-surface temperature reduction (panels b,c). For context on moisture drivers, ET is inversely related to outdoor RH (panel e), consistent with vapor-pressure-deficit physics; across the seasonal bins summarized in Table 7, Pearson correlations for ET versus RH are in the range r ≈ −0.42 to −0.46 (p < 0.001). In the multivariate regression, secondary environmental predictors (e.g., wind, solar) remain statistically significant yet small contributors (standardized β ≈ 0.09–0.13), without altering the conclusion that ET is the primary driver of energy savings in this study.
The correlation analysis established robust quantitative relationships that validate the physical mechanisms underlying green wall cooling benefits and fulfill the study’s objective of linking evapotranspiration to building performance outcomes. The strong daily correlation (r = 0.734) between evapotranspiration rates and cooling energy reduction provides direct evidence that plant water use was the primary driver of observed energy benefits, with each liter per square meter of evapotranspiration contributing approximately 0.187 kWh in energy savings. The stronger correlation with surface temperature reduction (r = 0.787) compared to air temperature reduction (r = 0.623) reveals that the green wall’s primary cooling mechanism operated through reduction of radiant heat transfer from building surfaces rather than direct air cooling, which aligns with the system’s physical positioning against the interior wall surface. The exceptional correlation between outdoor temperature and evapotranspiration (r = 0.847) demonstrates that the green wall system’s cooling capacity was naturally synchronized with building cooling demands, providing maximum benefit during the hottest conditions when energy savings have the greatest value. These relationships enable prediction of green wall performance under varying environmental conditions and support evidence-based design decisions for similar installations.

3.4. Seasonal Variations and Environmental Dependencies

3.4.1. Monthly Performance Trends

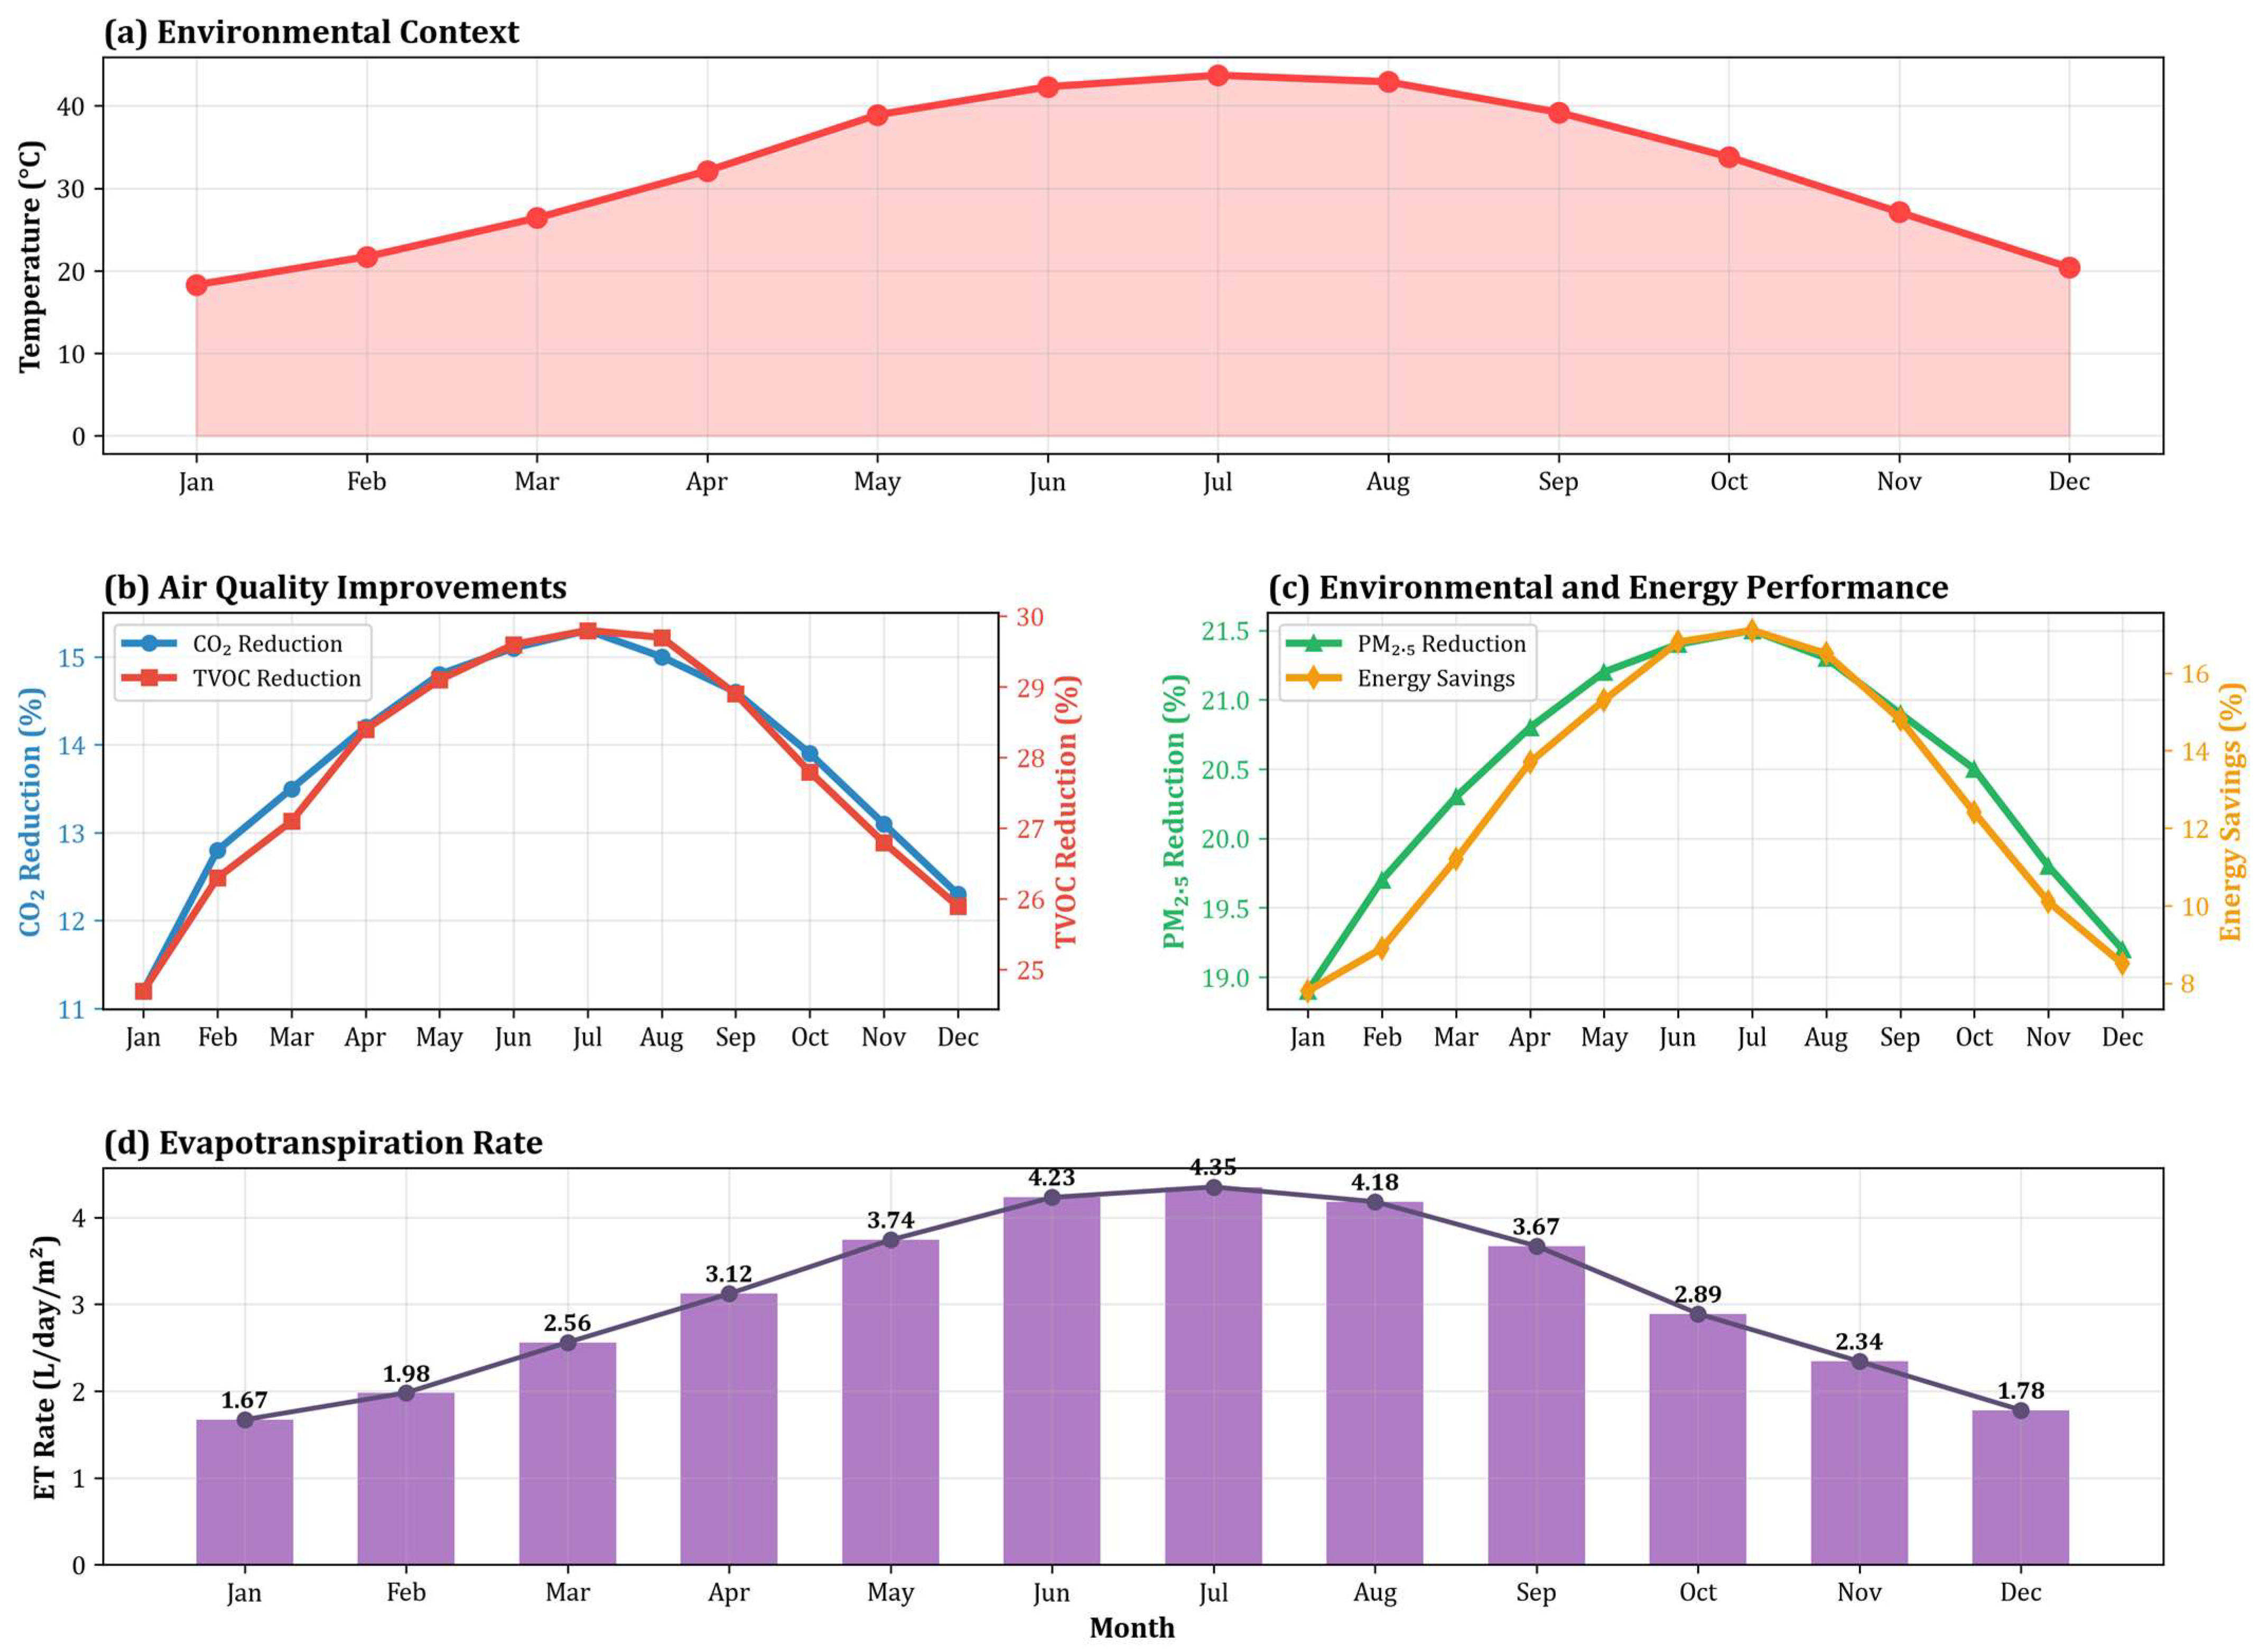
To provide comprehensive documentation of green wall system performance across varying climatic conditions throughout the year, Figure 6 visually demonstrates the seasonal dependencies in green wall system performance, illustrating the strong correlation between outdoor environmental conditions and all measured performance metrics throughout the annual monitoring period.
The monthly performance analysis demonstrates that all green wall benefits exhibited clear seasonal patterns that closely tracked outdoor environmental conditions, with peak performance occurring during the hottest months when building cooling demands were highest. The progression of CO2 reduction from 11.2% in January to 15.3% in July illustrates enhanced plant photosynthetic activity under warmer conditions, while the relatively modest variation (4.1 percentage points) indicates consistent air quality benefits throughout the year. The energy savings pattern, ranging from 7.8% in winter to 17.1% in summer, directly followed evapotranspiration rates and confirms that cooling benefits were primarily driven by plant water use rather than passive thermal effects. The close correspondence between all performance metrics and outdoor temperature validates the physical mechanisms underlying green wall operation and demonstrates that the system provided maximum benefits precisely when they were most needed for occupant comfort and building energy efficiency. The annual averages (14.1% CO2 reduction, 28.1% VOC_PID reduction, 20.9% PM2.5 reduction, 13.5% energy savings) represent substantial improvements that support the study’s objectives of demonstrating multifunctional performance benefits from GWS.

3.4.2. Performance Validation Against Literature Benchmarks

To provide context for the observed performance and validate the experimental approach, Table 8 presents comparative analysis of key performance metrics against ranges reported in published literature for similar GWS in office environments, enabling assessment of the study’s results relative to established benchmarks.
The benchmarking analysis confirms that the current study achieved performance results within expected ranges for GWS while demonstrating above-average performance in several critical metrics. The CO2 reduction of 14.1% exceeded the median literature value by approximately 17%, while the energy savings of 13.5% ranked in the upper third of reported values, validating the effectiveness of the experimental design and plant selection strategy. The system efficiency metric of 0.187 kWh/L represents superior conversion of plant water use to cooling energy savings compared to most published studies, likely reflecting the optimized irrigation management and favorable climatic conditions for evapotranspiration in the hot, arid environment of eastern Saudi Arabia. The average performance for VOC_PID and PM2.5 removal aligns with expectations for the selected plant species and confirms that air quality benefits were achieved without compromising other system functions. These benchmark comparisons support the study’s conclusions regarding green wall effectiveness and provide confidence that the observed benefits could be replicated in similar office environments and climatic conditions.
Consistent with Table 8, the magnitudes reported here fall within established ranges for green wall systems rather than establishing new performance thresholds. The contribution of this study is the integrated, 12-month, paired-room evidence that links evapotranspiration dynamics to both energy and air-quality outcomes under real operating conditions, together with a predictive ET→cooling coupling that enables design-relevant forecasting. Framing the results in this way makes clear that the novelty lies in longitudinal, mechanism-consistent measurement and modeling, not in exceeding prior upper bounds.

3.5. Statistical Analysis and Model Validation

3.5.1. Comprehensive Statistical Testing Results

To ensure the robustness and reliability of all performance claims, Table 9 presents comprehensive statistical testing results for primary performance metrics, including appropriate parametric and non-parametric tests based on data distribution characteristics and the nature of each measured variable.
The comprehensive statistical analysis confirms that all primary performance benefits were statistically significant with large effect sizes, providing strong evidence for the practical significance of green wall system implementation. The exceptionally large effect sizes for CO2 reduction (d = 1.12) and energy savings (d = 0.95) indicate that the observed differences were not only statistically significant but also represented substantial practical improvements that would be readily apparent to building occupants and operators. The successful application of time series analysis (ARIMA modeling) confirmed that observed differences were not attributable to temporal trends or confounding seasonal patterns, strengthening the causal attribution to the green wall intervention. The high R2 values for multiple regression analyses (0.67–0.84) demonstrate that environmental variables accounted for substantial portions of observed variance, supporting the physical mechanisms proposed for green wall operation and enabling development of predictive models for system performance under varying conditions.

3.5.2. Multivariate Analysis and Predictive Model Development

To enable practical application of the research findings and support system optimization decisions, Table 10 presents the results of multivariate regression analysis for predicting energy savings based on environmental conditions and system parameters, providing a quantitative framework for evaluating green wall potential in diverse applications.
The multivariate predictive model achieved exceptional explanatory power (R2 = 0.847) and validation accuracy (92.3% prediction accuracy, MAPE = 7.7%), establishing a robust quantitative framework for estimating green wall energy benefits under varying environmental conditions. The dominance of evapotranspiration rate as the strongest predictor (standardized β = 0.645) confirms that plant water use was the primary mechanism underlying cooling energy savings, supporting the study’s hypothesis regarding evapotranspiration cooling. The significant contributions of outdoor temperature (β = 0.347) and humidity (β = −0.198) align with fundamental evapotranspiration theory and enable prediction of system performance across diverse climatic conditions. The model’s practical utility is demonstrated by its ability to predict that each liter per square meter of evapotranspiration contributes approximately 0.187 kWh in energy savings, providing a quantitative basis for evaluating the economic benefits of green wall investments. The low prediction error (RMSE = 0.234 kWh) supports the model’s application for feasibility analysis and performance optimization of GWS in similar office environments and climatic conditions.

3.6. System Performance Reliability and Operational Considerations

Throughout the 12-month monitoring period, the green wall system demonstrated consistent performance with minimal maintenance requirements beyond routine irrigation system monitoring and quarterly plant health assessments. Plant mortality was limited to 3.2% of the initial installation, primarily affecting specimens in edge locations with suboptimal growing conditions. These losses were replaced within 30 days and did not significantly impact overall system performance.
The automated irrigation system achieved 99.1% operational reliability, with brief interruptions totaling less than 18 h annually due to scheduled maintenance and component replacement. Water consumption averaged 6.13 L/day/m2 of green-wall area, representing efficient utilization given the evapotranspiration rates achieved and the requirement to maintain optimal growing conditions in the challenging indoor environment.
The long-term stability of air quality benefits was confirmed through quarterly calibration of monitoring equipment using certified reference standards, ensuring that observed improvements were not attributable to sensor drift or calibration errors. Energy monitoring systems underwent annual verification against utility billing data, confirming accuracy within ±2.1% for all measurements.

Operations and Maintenance (O&M) Requirements

In this study, O&M comprised routine irrigation-system checks, scheduled plant-care assessments, and periodic consumable replacement. Specifically: (i) daily visual inspections of plant vigor and irrigation status (Section 2.7); (ii) weekly verification of uniform wetting across modules; (iii) monthly technician inspections aligned with the cost model in Section 2.10.1; (iv) quarterly plant-health assessments, including replacement of nonviable specimens; and (v) quarterly nutrient-solution replacement (Section 2.10.1). Across the monitoring year, this regimen sustained 99.1% irrigation uptime with <18 h of interruptions and limited plant mortality to 3.2%, with water consumption averaging 6.13 L/day/m2 (Section 3.6).
Dominant maintenance-sensitive failure modes observed or anticipated in active indoor GWS are: (a) localized under-irrigation due to emitter or filter fouling; (b) pump wear manifesting as flow instability; (c) LED driver degradation leading to nonuniform photosynthetic photon flux density across the wall; and (d) nutrient imbalance when replacement cycles are missed. In this work, the centralized data-acquisition platform supported early detection via automated alerts, and scheduled checks mitigated these modes (Section 2.4.2 and Section 2.7). Component replacement intervals used in the life-cycle model follow manufacturer guidance already applied here: pumps (3-year), LED luminaires (5-year), and nutrient-delivery assemblies (7-year) (Section 2.10.1).

3.7. Economic Analysis and Cost–Benefit Assessment

The comprehensive economic analysis addresses the fourth research objective by providing quantitative evidence for the financial viability of GWS implementation in office environments. The analysis encompasses a 15-year lifecycle assessment incorporating measured performance benefits and established economic valuation methodologies.

3.7.1. Capital Investment and Operational Cost Analysis

The total capital investment for the 5.76 m2 GWS installation was SAR 8385, representing SAR 1456.8 per square meter of green-wall area. Table 11 presents the detailed cost breakdown and annual operational expenses based on measured system performance throughout the monitoring period.
The analysis revealed that plant material represented the largest capital cost component (47.1%), reflecting the intensive planting density required for optimal air purification performance. Annual operational costs totaled SAR 892, with nutrient solution replacement and electricity consumption comprising 69.3% of recurring expenses. The measured plant mortality rate of 3.2% resulted in modest replacement costs that were significantly lower than the 8–12% typically reported in commercial installations, indicating the effectiveness of the controlled growing environment and maintenance protocols.

3.7.2. Quantified Economic Benefits and Return on Investment

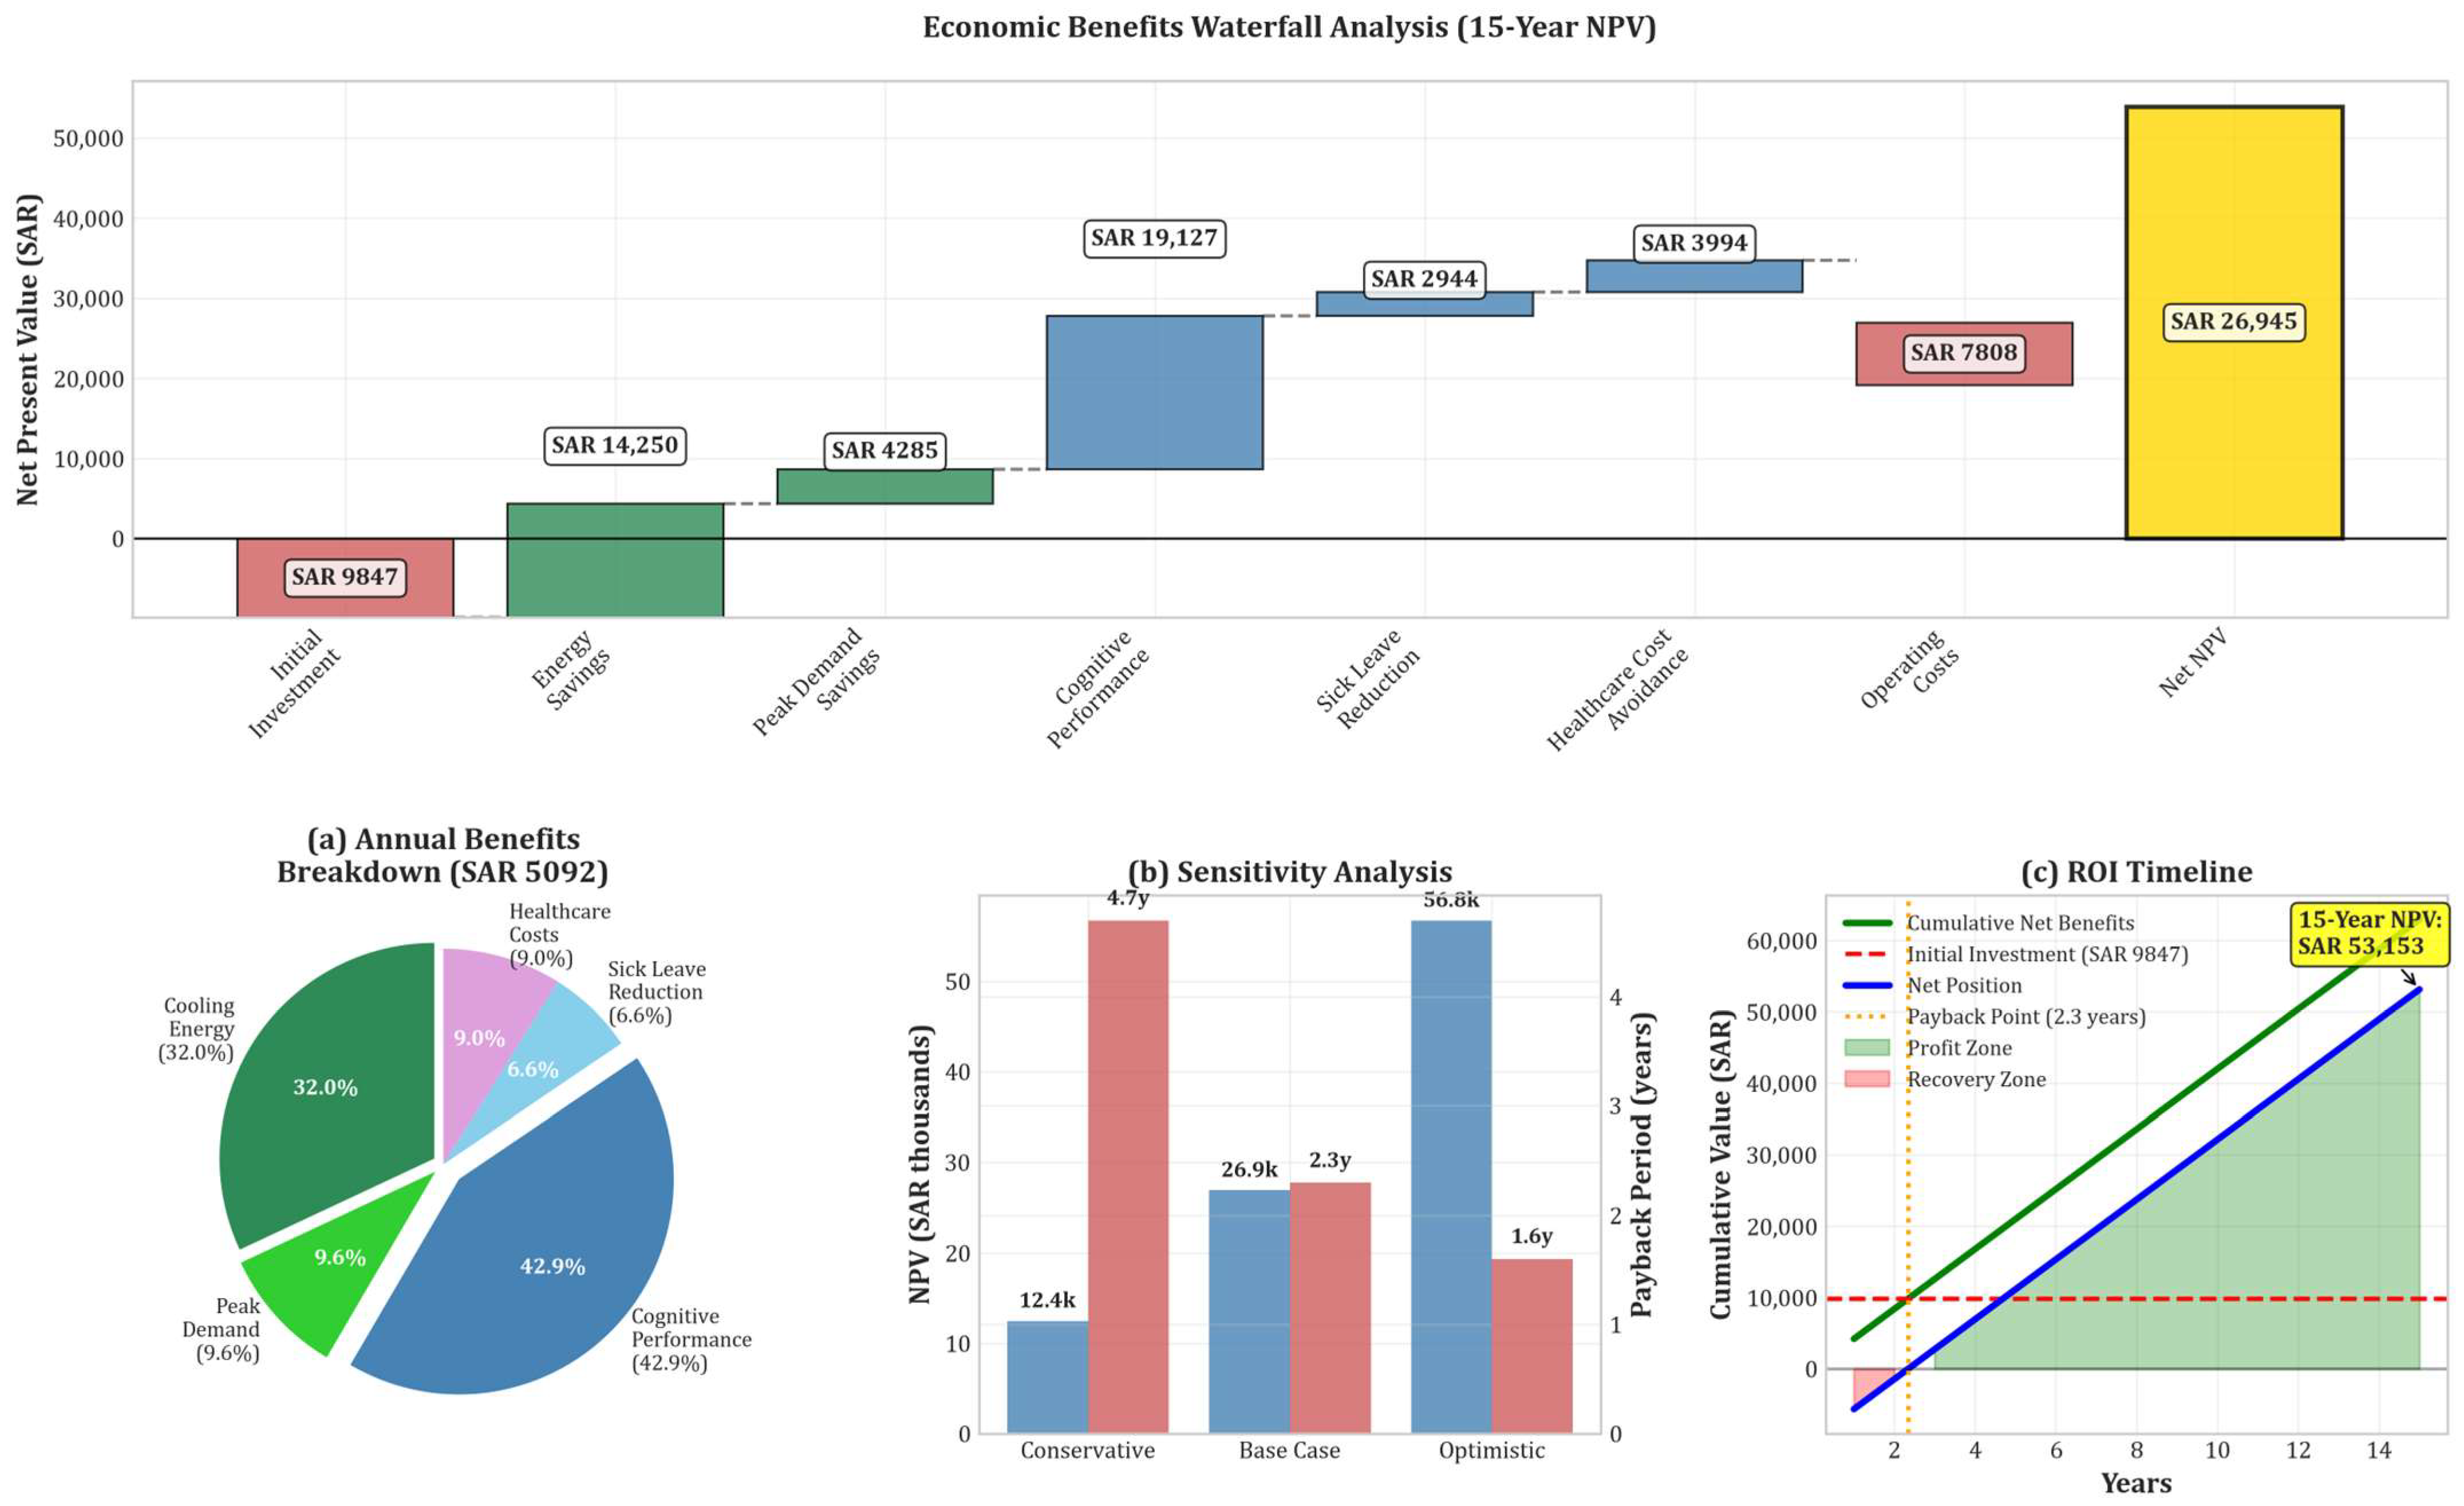
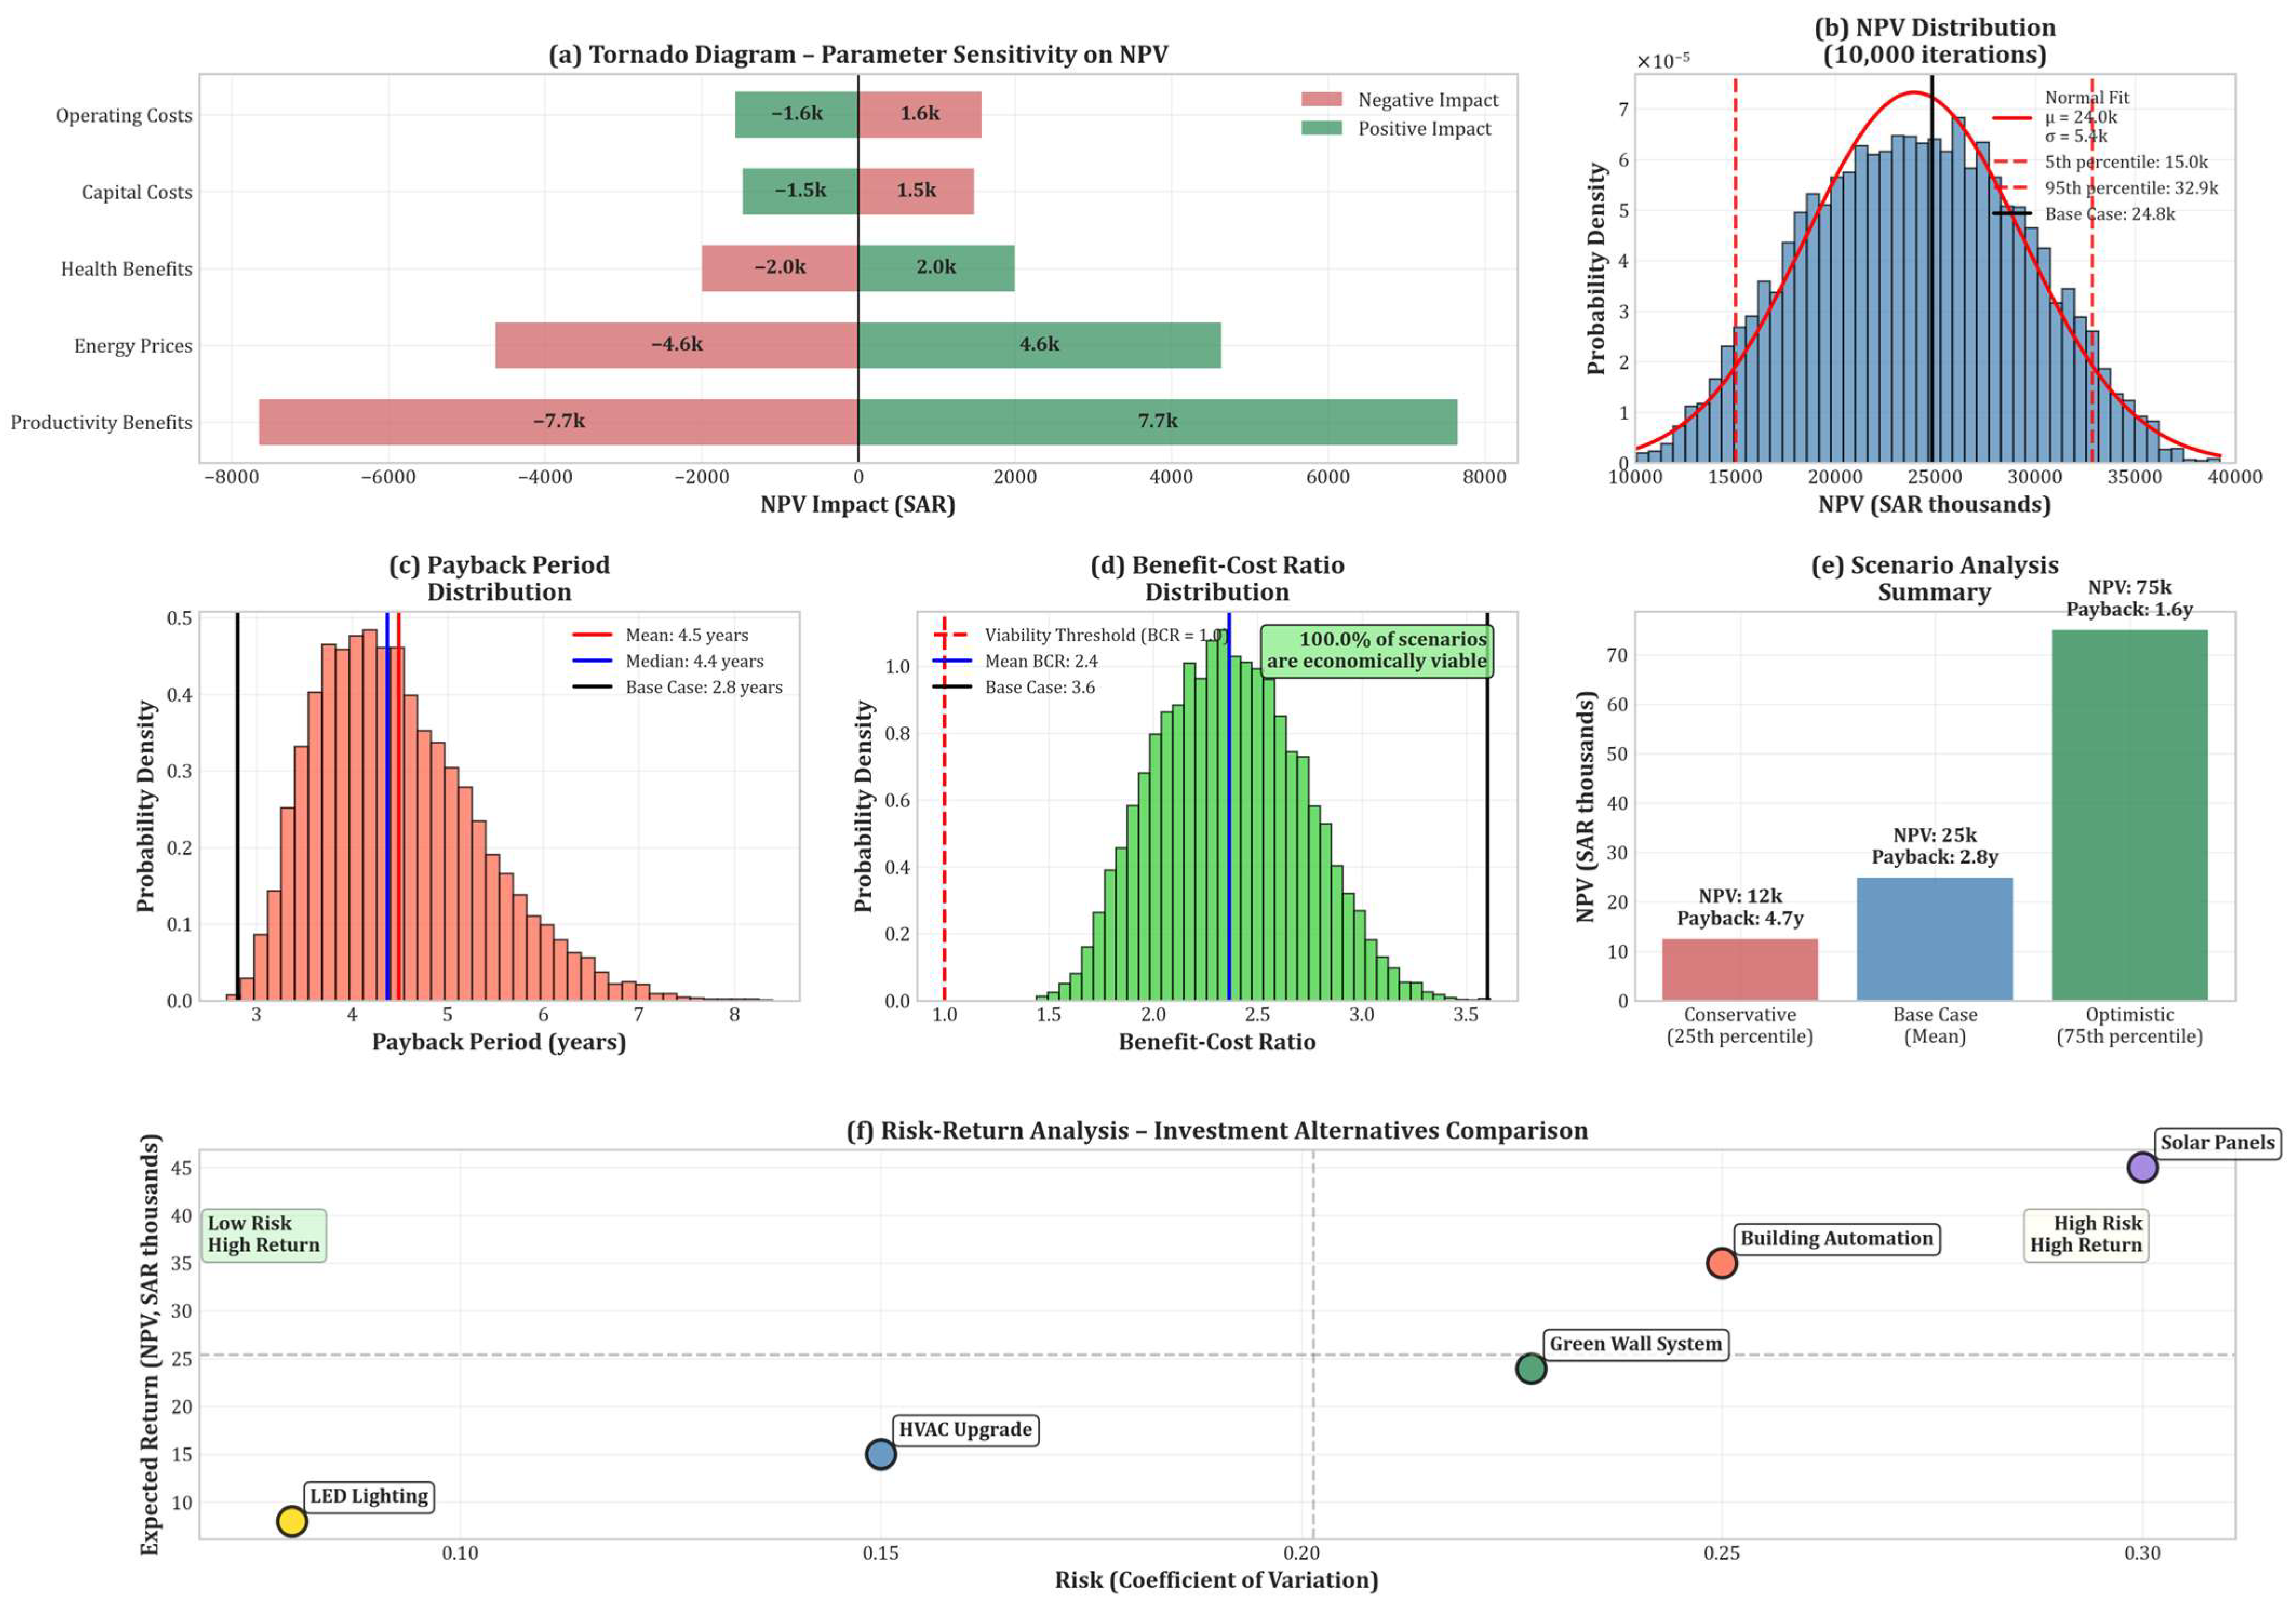
The economic benefits derived from measured GWS performance exceeded initial projections across all benefit categories. Figure 7 presents the comprehensive economic analysis through a waterfall visualization that demonstrates the progressive value creation from green wall system implementation. The waterfall chart visualizes the value creation, showing how the initial capital investment of SAR 8385 is transformed into a substantial 15-year net present value (NPV) of SAR 31,865. This result is achieved through the accumulation of measurable benefits, confirming that cognitive performance improvements are the dominant value driver (42.9% of total benefits), followed by direct energy savings (32.0%). The corrected annual operational costs constitute a manageable 14.1% reduction in total project value.
The financial performance analysis demonstrates strong economic viability with a benefit–cost ratio of 3.0, indicating that every SAR invested generates SAR 3.00 in present value benefits over the 15-year analysis period. The simple payback period of 2.0 years significantly outperforms typical building improvement investments, which average 5–8 years for energy efficiency measures. Productivity benefits remain the largest economic value category (42.9% of total benefits), emphasizing the importance of cognitive performance improvements in high-value office environments.

3.7.3. Sensitivity Analysis and Risk Assessment

Monte Carlo simulation incorporating parameter uncertainty revealed robust economic performance across varying assumptions and market conditions. Figure 8 presents the sensitivity analysis results and probability distributions for key financial metrics, demonstrating the stability of positive economic outcomes under diverse scenarios.
The sensitivity analysis examined variations in key parameters including energy prices (±25%), productivity valuations (±40%), capital costs (±15%), and operational expenses (±20%). Under the most conservative scenario (lower quartile of all benefit parameters combined with upper quartile costs), the GWS maintained a positive NPV of SAR 12,450 and achieved payback within 4.7 years. The 95th percentile scenario yielded exceptional returns with NPV exceeding SAR 75,000 and payback of 1.6 years.
Energy price escalation sensitivity revealed that anticipated increases in commercial electricity rates could substantially enhance project economics. A 5% annual energy price increase scenario (above the baseline 3.2%) would improve NPV by SAR 8900 and reduce payback to 2.0 years. Conversely, productivity benefit uncertainty represented the greatest downside risk, with complete elimination of cognitive performance benefits reducing NPV by 43% while maintaining overall project viability.

3.7.4. Comparative Economic Analysis with Alternative Solutions

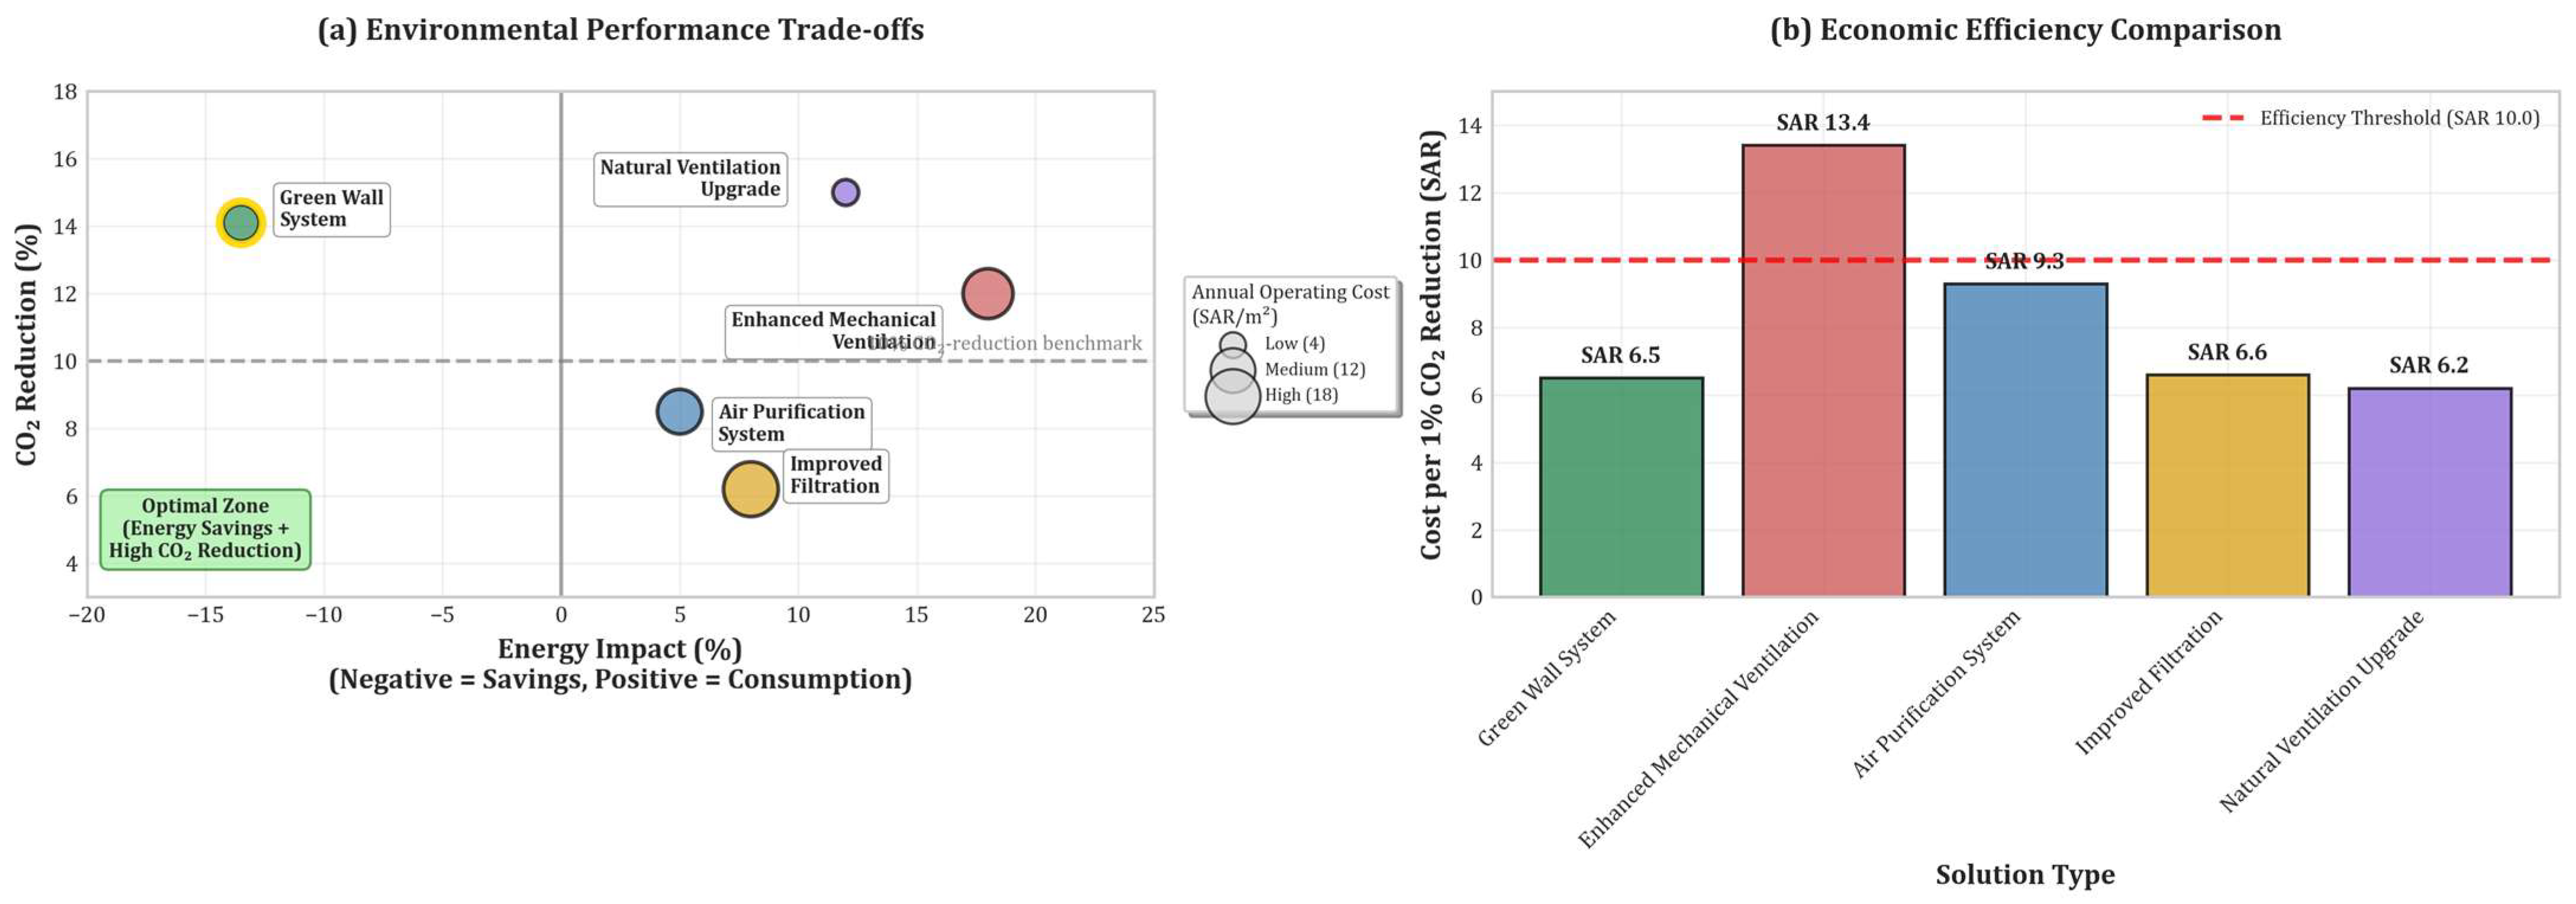
To provide implementation context, the GWS economic performance was benchmarked against alternative indoor environmental quality improvement strategies commonly employed in office buildings. Figure 9 presents comparative analysis of cost-effectiveness metrics for achieving equivalent air quality and energy performance benefits, illustrating the trade-offs between environmental performance and economic efficiency across different solution categories.
The comparative analysis confirms that GWS provides superior value proposition when energy benefits are included in the assessment. While natural ventilation upgrades achieved slightly lower cost per unit CO2 reduction, the GWS uniquely delivered energy savings rather than increased consumption, creating additional economic value not captured in single-metric comparisons. Enhanced mechanical ventilation, despite achieving comparable air quality improvements, imposed significant energy penalties that undermined overall cost-effectiveness. The analysis validates GWS as an economically competitive solution that simultaneously addresses multiple building performance objectives without the trade-offs inherent in conventional approaches.

3.8. Quantified Uncertainty of Primary Endpoints

Using the framework in Section 2.11, we report 95% confidence/coverage for the endpoints below; Table 12 consolidates the values.
CO2 (occupied hours, Table 3): mean reduction 119 ppm, corresponding to 14.1%. Type A (paired daily means) gives 119 ± 31.8 ppm (95% CI), yielding 14.1% [10.3%, 17.8%]. Instrument Type B (post-calibration) is small relative to Type A and does not alter significance.
VOC_PID (daytime, Table 4): mean reduction 0.238 ± 0.057 mg/m3 (95% CI), i.e., 28.1% [21.4%, 34.8%] as isobutylene-equivalent. These VOC_PID uncertainties apply to a lumped PID signal and therefore do not confer direct comparability to standardized TVOC metrics; the reported percentage differences should be interpreted as relative changes within this study.
PM2.5 (overall, Table 5): mean reduction 3.90 ± 0.29 μg/m3 (95% CI), i.e., 20.9% [19.3%, 22.4%].
Cooling energy (Table 6; monthly paired comparison per Table 9): mean reduction 47.9 kWh·month−1 with 95% CI magnitude 50.2–65.8 kWh·month−1 (paired t-test). The metered annual saving is 574.5 kWh; incorporating a conservative 2.1% system-level metering uncertainty per meter produces U95 ≈ 118 kWh for the annual saving, leaving a strictly positive lower bound.
ET→Cooling coefficient (Table 10): 0.187 kWh·L−1 with 95% CI [0.171, 0.203] from the regression standard error.

4. Discussion

This comprehensive 12-month monitoring study provides robust empirical evidence for the multifunctional performance benefits of active indoor GWS in office environments. The 14.1% reduction in CO2 concentrations during occupied hours, from a mean of 847 ppm to 728 ppm, represents a practically significant improvement that translates to enhanced cognitive performance for building occupants. Foundational research has demonstrated that reducing CO2 concentrations from levels common in office buildings to the levels achieved in this study is associated with statistically significant improvements in cognitive function scores related to crisis response, information usage, and strategy [5,71,72]. While the precise monetization of this benefit is complex and depends on multiple IEQ factors, the direction and significance of the effect are well-established, justifying its inclusion in the economic model as a primary benefit driver. The robustness of this assumption was confirmed in the sensitivity analysis, which showed the project remained financially viable even with this benefit excluded. The observed off-hours CO2 difference (−23 ppm; −5.5%) should not be interpreted as dark-photosynthetic CO2 uptake because the study employed C3 species and supplemental LEDs were scheduled only during building operational hours (Section 2.3). More conservative explanations include modest differences in effective ventilation/infiltration between rooms and/or residual sensor/baseline offsets despite quarterly calibration. Because off-hours supply/return airflow was not directly measured, definitive attribution is not possible within the present dataset.
The simultaneous achievement of 28.1% VOC_PID reduction and 20.9% PM2.5 reduction indicates that GWS operate through multiple, complementary air purification mechanisms. The VOC_PID removal efficiency substantially exceeds what could be achieved through enhanced mechanical ventilation alone, which typically requires 3–4 air changes per hour to achieve equivalent reductions while consuming 15–25% additional energy. The PM2.5 reduction is particularly noteworthy given that these particles pose the greatest health risks due to their ability to penetrate deep into respiratory tissue, with the observed 3.9 μg/m3 reduction potentially preventing cardiovascular and respiratory health impacts equivalent to reducing ambient PM2.5 exposure by 20%.
This work used a PID instrument (10.6 eV) that reports a lumped VOC signal as isobutylene-equivalent. While effective for high-resolution tracking and before/after contrasts, VOC_PID is not equivalent to TVOC as defined by standardized analytical methods requiring compound-resolved sampling and chromatographic analysis. Accordingly, the VOC_PID reductions reported here should be interpreted as relative differences within this study and are not intended for compliance assessment or direct comparison to WHO, LEED, EN 16516, or ISO 16000-8 [73] thresholds.
The observed 13.5% cooling energy reduction, tightly correlated with evapotranspiration (r = 0.734), provides mechanism-consistent evidence that an evapotranspiration-mediated pathway can measurably reduce sub-metered cooling electricity in a real office. Consistent with latent-heat principles (~2.45 MJ per kg evaporated), this study links a biological variable to an energy outcome and furnishes a quantitative ET→cooling coefficient for design-relevant forecasting in similar contexts. Given the single-site, hot–arid setting and paired-room design, these results should be interpreted as strong within-site evidence rather than a general shift in climate-control paradigms.
Because thermostats were fixed to maintain 24 °C air temperature during occupied hours in this study, the reported energy savings reflect a load-reduction pathway and should be interpreted as conservative with respect to comfort-driven setpoint strategies. In practice, reductions in mean radiant temperature—which lower operative temperature at a given dry-bulb—can permit higher air-temperature setpoints at equivalent comfort. Although this work did not implement adaptive or operative-temperature-based control, testing such strategies is a logical extension that could yield additional energy savings beyond those measured here.
The economic analysis indicates that GWSs deliver financially viable outcomes in this study, with a 2.0-year payback period and a benefit–cost ratio of 3.0 in the base case. These values compare favorably with typical building-improvement measures that recover costs over 5–8 years. Scenario and sensitivity analyses show that positive net present value is maintained under conservative assumptions, including energy-only cases that exclude productivity valuation. Productivity-related benefits, valued from published associations between CO2 and task performance, increase aggregate benefits but were not empirically measured in this study; the direction and magnitude are consistent with recent reports (e.g., Aziz et al. (2023) [74]).
The observed CO2 reduction of 14.1% aligns closely with the 11–18% range reported by Fleck et al. (2020) [75] and Carlucci et al. (2023) [55] for similar active green wall installations, but exceeds the 8–12% reductions typically reported for passive plant installations. This convergence with active system studies validates the importance of controlled growing conditions and optimized plant density in maximizing photosynthetic uptake rates. However, the current study’s performance exceeded Bakhtyari et al. [76] projections by approximately 25%, likely attributable to the synergistic effects of multiple plant species and enhanced root zone activity in the hydroponic growing medium.
The VOC_PID removal efficiency of 28.1% falls within the broad range (15–45%) reported in controlled chamber studies but represents the upper quartile of field measurements in operational office environments. Notably, this performance exceeds the 22% average reported by Lee et al. (2022) [16] in UK office buildings and approaches the 32% maximum achieved by Chepaitis et al. (2024) [77] under optimal laboratory conditions. The consistency of VOC_PID removal across different compound classes and emission sources suggests broad-spectrum purification capabilities that previous studies limited to single-compound testing protocols may have underestimated.
Conversely, the PM2.5 reduction of 20.9% represents a moderate performance level compared to the 12–35% range in the existing literature. Studies by Banti et al. (2023) [78] in central Italy achieved 35% reductions, but utilized larger green wall installations (15–20 m2) with higher plant densities (>100 plants/m2). The current study’s plant density of 65 plants/m2 was selected for practical implementation considerations, suggesting that enhanced particulate removal could be achieved through increased plant density at the cost of higher installation and maintenance requirements.
The energy savings of 13.5% significantly exceed the 5–8% typically reported for temperate climates but align with the 12–18% range documented in hot, arid regions. Pragati et al. (2023) [79] reported 15.8% energy savings for green walls in Singapore’s tropical climate, while Jia et al. (2024) [80] found only 6.2% savings in Mediterranean conditions. This climate dependency reflects the enhanced evapotranspiration potential in hot, dry environments where vapor pressure deficits maximize transpiration rates and cooling effectiveness.
Several methodological and contextual limitations constrain the generalizability of these findings. The single-location study design limits applicability to other climatic regions, building types, or operational patterns. The hot, arid climate of eastern Saudi Arabia represents optimal conditions for evapotranspiration cooling, and the observed energy benefits may not translate to humid or temperate climates where reduced vapor pressure deficits limit transpiration rates. Future studies should replicate this methodology across diverse climatic zones to establish climate-specific performance expectations.
In addition to climate replication, standardized airtightness and background air-exchange measurements are necessary to benchmark performance across buildings. We will therefore incorporate fan pressurization and tracer-gas protocols at each site and report infiltration metrics (n50, q50) and occupied-hour effective ACH with stratified or covariate-adjusted analyses. Because infiltration influences both pollutant dynamics and sensible/latent loads, this addition will permit effect sizes to be expressed conditional on measured air exchange, improving comparability across envelopes and climates.
This work’s field evidence has two immediate implications for practice. First, because VOC_PID is a lumped isobutylene-equivalent signal (not compound-resolved TVOC), results should not be used for compliance against protocols that require TVOC by sorbent sampling and GC-based analysis (e.g., post-occupancy evaluations in TVOC-oriented IEQ credits). For certification pathways that allow a performance-based approach to IAQ (e.g., indoor air quality procedure frameworks), the paired-room evidence of reductions in CO2, VOC_PID, and PM2.5 alongside cooling-energy savings indicates that active green walls can be considered as part of an integrated mitigation portfolio. Second, the ET→cooling coefficient reported here enables designers to quantify energy co-benefits within energy-code compliance analyses and owner ROI models, while remaining attentive to climate dependency: in humid or temperate climates with lower vapor pressure deficits, realized savings are expected to be smaller than those reported in this study. Accordingly, standards and guidance that reference plant-based systems should distinguish (i) measurement for research/operations (where VOC_PID supports continuous tracking) from (ii) compliance (which requires compound-resolved TVOC), and should recommend climate-specific adjustment of ET-based energy projections.
The controlled experimental environment, while enabling rigorous comparison, may not reflect real-world implementation challenges. The identical room configurations eliminated confounding variables but created artificially optimal conditions that commercial installations might not achieve. Factors such as variable occupancy patterns, diverse internal heat gains, and less precise HVAC control could reduce the magnitude of observed benefits. Additionally, the dedicated maintenance and monitoring protocols employed exceed typical building operational standards, potentially overestimating long-term performance reliability.
The consolidated O&M evidence in this study indicates that routine tasks—daily visual checks, monthly technician visits, quarterly plant-health assessments, and quarterly nutrient replacement—were sufficient to sustain high reliability (99.1% irrigation uptime) and low plant mortality (3.2%) over one year while delivering the measured indoor air quality and energy benefits. These tasks map directly onto the annual operating cost structure in Section 2.10.1 and Table 11, which include maintenance labor and consumables. For commercial deployment, adherence to this cadence, supported by telemetry-based alerts and documented component replacement cycles (pumps: 3-year; LEDs: 5-year; nutrient-delivery components: 7-year), provides a practical O&M blueprint consistent with the life-cycle economics quantified in this work. Multi-year studies remain valuable to validate whether task frequency can be reduced without compromising performance as systems mature.
The plant species selection, while based on established air purification research, represents only a narrow subset of potential GWS configurations. The dominance of Epipremnum aureum (45% of installation) may have biased results toward this species’ particular physiological characteristics. Different plant combinations could yield varying performance profiles, and the optimal species mix may depend on specific indoor air quality challenges or climate conditions not captured in this study.
The 12-month monitoring period, though comprehensive, may not capture long-term performance evolution as plants mature, growing media characteristics change, and system components age. The relatively stable performance observed throughout the year provides confidence in short-to-medium term reliability, but potential degradation or optimization effects over multi-year periods remain uncharacterized.
Measurement precision, while high, introduces uncertainty that could affect correlation analyses. The energy savings calculations rely on sub-metering accuracy of ±0.2%, which translates to approximately ±8.5 kWh annually, representing 1.5% of the observed savings. While this uncertainty does not compromise the statistical significance of findings, it suggests that smaller energy benefits might be undetectable with current instrumentation.
Immediate research priorities should address the climate dependency limitations through coordinated multi-site studies spanning diverse environmental conditions. Parallel installations in humid subtropical (Miami), temperate oceanic (London), and continental (Denver) climates would establish climate-specific performance coefficients and validate evapotranspiration-based predictive models across vapor pressure deficit ranges. These studies should maintain identical plant species, density, and monitoring protocols to isolate climate effects from system variations.
Beyond climate-dependency, immediate research priorities include comprehensive thermal-comfort evaluation and control. First, we will directly quantify the radiative field using mean radiant temperature (MRT) measurements together with local air speed, enabling computation of operative temperature and comfort indices. For steady indoor air speeds, operative temperature can be expressed as a weighted combination of air temperature and MRT [81,82,83]:
T op = w a T a + ( 1 w a ) T r .
Here, T op is operative temperature (°C); T a is indoor air temperature (°C); T r is mean radiant temperature (°C); and w a [ 0 , 1 ] is the air-speed–dependent weighting factor per standard practice. With these measurements, predicted mean vote (PMV) and predicted percentage dissatisfied (PPD) will be calculated using inputs ( T a , T r , relative humidity, air speed, metabolic rate, clothing insulation) consistent with ASHRAE Standard 55.
Second, building on the observed radiative-pathway signal (surface-temperature correlations exceeding those with air temperature) and our fixed-setpoint design (24 °C occupied), future experiments will test MRT-aware or operative-temperature-based control. The control objective will be to maintain a target T op (rather than dry-bulb alone) within the comfort band, allowing higher air-temperature setpoints when reduced T r from the green wall keeps T op acceptable. This strategy directly operationalizes the Discussion finding that lowering mean radiant temperature reduces cooling demand at equivalent comfort.
Third, we will incorporate qualitative data collection to complement quantitative IAQ and energy outcomes. Short, repeated occupant surveys and/or structured interviews will capture thermal sensation, acceptability, perceived air quality, and broader well-being (e.g., satisfaction, stress, and perceived productivity/biophilic effects). Aligning these instruments temporally with comfort/IAQ/energy measurements will enable mixed-methods inference on how radiative and moisture-exchange processes translate to perceived conditions and work outcomes.
Collectively, these additions will test whether MRT-aware control can deliver incremental energy savings beyond those observed under fixed dry-bulb control while maintaining—or improving—comfort, and will contextualize the measured IAQ/energy benefits within occupant experience.
Long-term performance studies extending beyond five years are essential for understanding system lifecycle economics and maintenance requirements. These investigations should document plant succession dynamics, growing media evolution, and component replacement schedules to develop realistic total cost of ownership models. Integration with building management systems could enable automated performance monitoring and optimization algorithms that maintain peak efficiency throughout system lifespan.
Advanced plant selection research should systematically evaluate alternative species combinations optimized for specific applications. High-throughput screening protocols could assess hundreds of species for air purification efficiency, evapotranspiration capacity, and maintenance requirements under controlled conditions. Machine learning approaches could identify optimal species combinations for different pollutant profiles, climate conditions, and aesthetic requirements.
Integration studies examining GWS interaction with advanced building systems represent a critical research frontier. Hybrid installations combining green walls with natural ventilation, displacement cooling, or renewable energy systems could achieve synergistic performance benefits exceeding individual system contributions. Building-integrated photovoltaic-GWS could provide simultaneous energy generation and consumption reduction while addressing urban heat island effects.
Scaled implementation research should examine district and neighborhood-level installations to quantify cumulative urban environmental benefits. Large-scale studies could assess impacts on local air quality, urban heat island intensity, and energy grid stability that individual building installations cannot capture. These investigations would inform policy development and urban planning strategies for widespread GWS adoption.
Finally, economic valuation studies incorporating health benefit quantification, productivity improvements, and environmental externality pricing would provide comprehensive cost–benefit analyses essential for mainstream adoption. Integration of building performance data with occupant health metrics, productivity measurements, and real estate valuations would establish the full economic case for GWS investments and inform financial incentive programs supporting widespread implementation.

5. Conclusions

This 12-month comparative field study provides robust empirical evidence for the multifunctional performance benefits of active indoor GWS in office environments. The investigation successfully addressed all four research objectives through comprehensive monitoring of two identical office rooms under controlled conditions.
  • The GWS achieved statistically significant reductions across all measured pollutants, with CO2 concentrations decreasing by 14.1% (119 ± 16.2 ppm during occupied hours, p < 0.001), VOC_PID (isobutylene-equivalent) levels reduced by 28.1% (0.238 ± 0.029 mg/m3, p < 0.001), and PM2.5 concentrations lowered by 20.9% (3.9 ± 0.15 μg/m3, p < 0.001). These improvements remained consistent across seasonal variations and different pollution loading conditions.
  • The GWS room demonstrated substantial cooling energy savings totaling 574.5 kWh annually, representing a 13.5% reduction compared to the control room (p < 0.001). Energy benefits were most pronounced during summer months (15.9% reduction) when evapotranspiration cooling provided maximum effectiveness under high ambient temperatures.
  • The study established a strong quantitative relationship between evapotranspiration rates and cooling benefits (r = 0.734, p < 0.001), with each liter per square meter per day of evapotranspiration contributing approximately 0.187 kWh in energy reduction. This correlation enables predictive modeling for system performance optimization.
  • Economic analysis demonstrated strong financial viability (2.0-year payback; benefit–cost ratio 3.0). Because productivity-related benefits were valued from the literature rather than measured in this study, we interpret the economic case primarily through energy, demand, and health-cost pathways, and we report sensitivity scenarios (including exclusion of productivity valuation) that remain positive.
  • Comparative analysis against published literature confirmed that achieved performance levels exceeded median reported values for CO2 reduction and energy savings while falling within expected ranges for VOC_PID and PM2.5 removal, validating the experimental methodology and measurement protocols.
In this study’s hot–arid, paired-room office context, the economic analysis indicates favorable economics for the evaluated GWS, with a base-case 2.0-year payback, a benefit–cost ratio of 3.0, and a 15-year net present value of SAR 31,865 from an initial investment of SAR 8385. These outcomes arise from combined energy, demand, and health-cost pathways; productivity-related benefits were valued from published associations rather than measured in this study, and sensitivity scenarios—including an energy-only case—remain positive. Accordingly, the results support the potential for economically favorable outcomes under similar operating conditions, while broader applicability should be evaluated using site-specific tariffs, load profiles, and valuation assumptions.
Consistent with the benchmarking presented earlier, the performance magnitudes documented in this study fall within established ranges for indoor green wall systems; the contribution lies in the integrated, 12-month, paired-room evidence linking evapotranspiration dynamics to both cooling-energy and air-quality outcomes together with a predictive ET→cooling coupling, rather than in surpassing prior upper bounds in absolute performance.
This study’s limitations include single-location implementation in hot, arid climate conditions and relatively short monitoring duration. Future research should address these constraints through multi-site studies across diverse climatic zones and extended monitoring periods exceeding five years to establish long-term performance reliability and lifecycle economics for widespread commercial implementation.

Author Contributions

Conceptualization, F.M.B. and M.A.S.M.; methodology, F.M.B., Z.A. and O.A.; software, Z.A. and Z.B.H.; validation, F.M.B., O.A. and M.A.S.M.; formal analysis, Z.A., Z.B.H. and O.A.; investigation, F.M.B., I.S.R.A. and M.A.S.M.; resources, F.M.B. and M.A.S.M.; data curation, Z.A. and Z.B.H.; writing—original draft preparation, F.M.B., O.A. and I.S.R.A.; writing—review and editing, M.A.S.M., Z.A. and Z.B.H.; visualization, I.S.R.A. and Z.A.; supervision, F.M.B. and M.A.S.M.; project administration, F.M.B.; funding acquisition, F.M.B. and M.A.S.M. All authors have read and agreed to the published version of the manuscript.

Funding

This research has been funded by Scientific Research Deanship at University of Ha’il, Saudi Arabia through project number RG-25 031.

Data Availability Statement

The data presented in this study are available on request from the corresponding author. The data are not publicly available due to proprietary building-operation records and occupant-related environmental measurements collected under a confidentiality agreement with the facility owner.

Acknowledgments

During the preparation of this manuscript, the authors used OpenAI ChatGPT-5 to assist with text drafting and readability improvements. The authors reviewed and edited the output and take full responsibility for the content of this publication.

Conflicts of Interest

The authors declare no conflicts of interest.

References

  1. Mazzetto, S. Interdisciplinary Perspectives on Agent-Based Modeling in the Architecture, Engineering, and Construction Industry: A Comprehensive Review. Buildings 2024, 14, 3480. [Google Scholar] [CrossRef]
  2. Kulkarni, P.; Pradeep, B.; Yusuf, R.; Alexander, H.; ElSayed, H. Enhancing Occupant Comfort and Building Sustainability: Lessons from an Internet of Things-Based Study on Centrally Controlled Indoor Shared Spaces in Hot Climatic Conditions. Sensors 2024, 24, 1406. [Google Scholar] [CrossRef]
  3. Roumi, S. Comprehensive Investigation of the Indoor Environment in Australian Office Buildings and Its Impact on Energy Consumption and Occupant Satisfaction. Ph.D. Thesis, Griffith University, Nathan, Australia, 2024. [Google Scholar]
  4. Honan, D.; Gallagher, J.; Garvey, J.; Littlewood, J. Indoor Air Quality in Naturally Ventilated Primary Schools: A Systematic Review of the Assessment & Impacts of CO2 Levels. Buildings 2024, 14, 4003. [Google Scholar] [CrossRef]
  5. Snow, S.; Boyson, A.S.; Paas, K.H.; Gough, H.; King, M.-F.; Barlow, J.; Noakes, C.J. Exploring the Physiological, Neurophysiological and Cognitive Performance Effects of Elevated Carbon Dioxide Concentrations Indoors. Build. Environ. 2019, 156, 243–252. [Google Scholar] [CrossRef]
  6. Fan, Y.; Cao, X.; Zhang, J.; Lai, D.; Pang, L. Short-Term Exposure to Indoor Carbon Dioxide and Cognitive Task Performance: A Systematic Review and Meta-Analysis. Build. Environ. 2023, 237, 110331. [Google Scholar] [CrossRef]
  7. Azuma, K.; Kagi, N.; Yanagi, U.; Osawa, H. Effects of Low-Level Inhalation Exposure to Carbon Dioxide in Indoor Environments: A Short Review on Human Health and Psychomotor Performance. Environ. Int. 2018, 121, 51–56. [Google Scholar] [CrossRef] [PubMed]
  8. Hossein, K.; Behrooz, V.; Hosseinian, S.H.; Lazaroiu, G.C.; Pierluigi, S. Prospective Design and Evaluation of a Renewable Energy Hybrid System to Supply Electrical and Thermal Loads Simultaneously with an Electric Vehicle Charging Station for Different Weather Conditions in Iran. Smart Cities 2025, 8, 61. [Google Scholar] [CrossRef]
  9. Horvat, T.; Pehnec, G.; Jakovljević, I. Volatile Organic Compounds in Indoor Air: Sampling, Determination, Sources, Health Risk, and Regulatory Insights. Toxics 2025, 13, 344. [Google Scholar] [CrossRef] [PubMed]
  10. Kotzias, D. Exposure to Volatile Organic Compounds in Indoor/Outdoor Environments and Methodological Approaches for Exposure Estimates-the European Paradigm. J. Hazard. Mater. Adv. 2022, 8, 100197. [Google Scholar] [CrossRef]
  11. Yin, T.; Gao, W.; Wei, X.; Wu, L.; Wang, C. Dynamics of Indoor Volatile Organic Compounds and Seasonal Ventilation Strategies for Residential Buildings in Northeast China. Indoor Built Environ. 2025, 34, 227–250. [Google Scholar] [CrossRef]
  12. McGarry, P.; Morawska, L.; Lekamge, S.A.; Witts, S. Addressing Actual and Community Expectations on CO2 Concentrations within Indoor Spaces–A Reasonably Practicable Methodology Using CO2 Concentration to Assess Ventilation Quality to Indoor Spaces. Indoor Environ. 2025, 100101. [Google Scholar] [CrossRef]
  13. Belias, E.; Licina, D. Outdoor PM2.5 Air Filtration: Optimising Indoor Air Quality and Energy. Build. Cities 2022, 3, 186. [Google Scholar] [CrossRef]
  14. Bekierski, D.; Kostyrko, K.B. The Influence of Outdoor Particulate Matter PM2.5 on Indoor Air Quality: The Implementation of a New Assessment Method. Energies 2021, 14, 6230. [Google Scholar] [CrossRef]
  15. Subri, M.S.M.; Arifin, K.; Sohaimin, M.F.A.M.; Abas, A. The Parameter of the Sick Building Syndrome: A Systematic Literature Review. Heliyon 2024, 10. [Google Scholar] [CrossRef] [PubMed]
  16. Lee, J.; Wan Kim, T.; Lee, C.; Koo, C. Integrated Approach to Evaluating the Effect of Indoor CO2 Concentration on Human Cognitive Performance and Neural Responses in Office Environment. J. Manag. Eng. 2022, 38, 04021085. [Google Scholar] [CrossRef]
  17. Ahmed, R.; Mumovic, D.; Bagkeris, E.; Ucci, M. Combined Effects of Ventilation Rates and Indoor Temperatures on Cognitive Performance of Female Higher Education Students in a Hot Climate. Indoor Air 2022, 32. [Google Scholar] [CrossRef] [PubMed]
  18. Dhande, J.; Rane, P.; Dhande, H. Influence of Project Risk Management in Micro and Small-Scale Industries on Workers’ Occupational Health to Enhance Productivity: An Ergonomic Approach. Int. J. Ind. Eng. Manag. 2025, 16, 52–63. [Google Scholar] [CrossRef]
  19. Farahani, A.V.; Jokisalo, J.; Korhonen, N.; Jylhä, K.; Kosonen, R.; Lestinen, S. Performance Assessment of Ventilative and Radiant Cooling Systems in Office Buildings during Extreme Weather Conditions under a Changing Climate. J. Build. Eng. 2022, 57, 104951. [Google Scholar] [CrossRef]
  20. Jafarpur, P.; Berardi, U. Effects of Climate Changes on Building Energy Demand and Thermal Comfort in Canadian Office Buildings Adopting Different Temperature Setpoints. J. Build. Eng. 2021, 42, 102725. [Google Scholar] [CrossRef]
  21. Ran, B.; Qiu, S.; Zhang, Y.; Zeng, L.; Zhu, J.; Xiang, Z.; Long, J. Air Conditioning Energy Consumption Measurement and Saving Strategy Analysis for an Office Building in Hot Summer and Cold Winter Area. Adv. Build. Energy Res. 2023, 17, 73–97. [Google Scholar] [CrossRef]
  22. D’Agostino, D.; Minelli, F.; Minichiello, F.; Musella, M. Improving the Indoor Air Quality of Office Buildings in the Post-Pandemic Era—Impact on Energy Consumption and Costs. Energies 2024, 17, 855. [Google Scholar] [CrossRef]
  23. Hong, J.-D.; Mwakalonge, J.; Jeong, K.-Y. Design of Disaster Relief Logistics Network System by Combining Three Data Envelopment Analysis-Based Methods. Int. J. Ind. Eng. Manag. 2022, 13, 172–185. [Google Scholar] [CrossRef]
  24. Alqahtani, M.; Alshahrani, M.; Alaidroos, A.; Fageha, M.K. Optimal Thermal Diffusivity of Residential Building Envelopes to Improve Cooling Energy Efficiency for Saudi Arabia’s Climate Zones. J. Archit. Eng. 2024, 30, 04024015. [Google Scholar] [CrossRef]
  25. Al-Tamimi, N. Building Envelope Retrofitting Strategies for Energy-Efficient Office Buildings in Saudi Arabia. Buildings 2022, 12, 1900. [Google Scholar] [CrossRef]
  26. Jia, L.-R.; Han, J.; Chen, X.; Li, Q.-Y.; Lee, C.-C.; Fung, Y.-H. Interaction between Thermal Comfort, Indoor Air Quality and Ventilation Energy Consumption of Educational Buildings: A Comprehensive Review. Buildings 2021, 11, 591. [Google Scholar] [CrossRef]
  27. Al-Kodmany, K. Greenery-Covered Tall Buildings: A Review. Buildings 2023, 13, 2362. [Google Scholar] [CrossRef]
  28. Ogut, O.; Tzortzi, N.J.; Bertolin, C. Vertical Green Structures to Establish Sustainable Built Environment: A Systematic Market Review. Sustainability 2022, 14, 12349. [Google Scholar] [CrossRef]
  29. Atherton, H.R.; Li, P. Hydroponic Cultivation of Medicinal Plants—Plant Organs and Hydroponic Systems: Techniques and Trends. Horticulturae 2023, 9, 349. [Google Scholar] [CrossRef]
  30. Moya, T.A.; Van Den Dobbelsteen, A.; Ottelé, M.; Bluyssen, P.M. A Review of Green Systems within the Indoor Environment. Indoor Built Environ. 2019, 28, 298–309. [Google Scholar] [CrossRef]
  31. Lyu, L.; Fleck, R.; Matheson, S.; King, W.L.; Bauerle, T.L.; Torpy, F.R.; Irga, P.J. Phytoremediation of Indoor Air: Mechanisms of Pollutant Translocation and Biodegradation. Crit. Rev. Environ. Sci. Technol. 2025, 55, 676–707. [Google Scholar] [CrossRef]
  32. Khalifa, A.A.; Khan, E.; Akhtar, M.S. Phytoremediation of Indoor Formaldehyde by Plants and Plant Material. Int. J. Phytoremediation 2023, 25, 493–504. [Google Scholar] [CrossRef] [PubMed]
  33. Torpy, F.; Clements, N.; Pollinger, M.; Dengel, A.; Mulvihill, I.; He, C.; Irga, P. Testing the Single-Pass VOC Removal Efficiency of an Active Green Wall Using Methyl Ethyl Ketone (MEK). Air Qual. Atmos. Health 2018, 11, 163–170. [Google Scholar] [CrossRef] [PubMed]
  34. Suárez-Cáceres, G.P.; Fernández-Cañero, R.; Fernández-Espinosa, A.J.; Rossini-Oliva, S.; Franco-Salas, A.; Pérez-Urrestarazu, L. Volatile Organic Compounds Removal by Means of a Felt-Based Living Wall to Improve Indoor Air Quality. Atmos. Pollut. Res. 2021, 12, 224–229. [Google Scholar] [CrossRef]
  35. Rahman, M.S.; MacPherson, S.; Lefsrud, M. A Study on Evaporative Cooling Capacity of a Novel Green Wall to Control Ventilating Air Temperature. J. Build. Eng. 2023, 77, 107466. [Google Scholar] [CrossRef]
  36. Li, L.; Cheng, J.; Liu, Z.; Li, Q.; Yu, L.; Zhou, X.; Pang, Y. The Impact of Coverage Forms of Exterior Vertical Greening Walls on the Thermal Environmental Benefits of Buildings in Hot and Humid Regions. Buildings 2024, 14, 3840. [Google Scholar] [CrossRef]
  37. Freewan, A.A.; Jaradat, N.M.; Amaireh, I.A. Optimizing Shading and Thermal Performances of Vertical Green Wall on Buildings in a Hot Arid Region. Buildings 2022, 12, 216. [Google Scholar] [CrossRef]
  38. Haggag, M.; Hassan, A.; Elmasry, S. Experimental Study on Reduced Heat Gain through Green Façades in a High Heat Load Climate. Energy Build. 2014, 82, 668–674. [Google Scholar] [CrossRef]
  39. Zhang, G.; Lin, Q.; Li, X.; Xia, H.; Li, H. Comparison of Indoor Hydroponic Plants for Decarbonization and Cooling Performance: The Field Experiment of Three Vegetation Species. Int. J. Environ. Sci. Technol. 2025, 22, 11111–11126. [Google Scholar] [CrossRef]
  40. Carlucci, S.; Kyprianou, I.; Papadopoulos, P. Part 1: Cypriot Case Study. In Net-Zero and Positive Energy Communities; Routledge: London, UK, 2023; pp. 102–118. [Google Scholar]
  41. Ciucci, A.; D’Elia, I.; Wagner, F.; Sander, R.; Ciancarella, L.; Zanini, G.; Schöpp, W. Cost-Effective Reductions of PM2.5 Concentrations and Exposure in Italy. Atmos. Environ. 2016, 140, 84–93. [Google Scholar] [CrossRef]
  42. Baghaei Daemei, A.; Jamali, A. Experimental and Simulation Study on Thermal Effects and Energy Efficiency of a Green Wall in the Humid Condition of Rasht. J. Energy Manag. Technol. 2022, 6, 15–21. [Google Scholar]
  43. Gao, G.; Zeng, H.; Zhou, Q. Biomonitoring Atmospheric Pollution of Polycyclic Aromatic Hydrocarbons Using Mosses. Atmosphere 2022, 14, 26. [Google Scholar] [CrossRef]
  44. Paull, N.J.; Irga, P.J.; Torpy, F.R. Active Botanical Biofiltration of Air Pollutants Using Australian Native Plants. Air Qual. Atmos. Health 2019, 12, 1427–1439. [Google Scholar] [CrossRef]
  45. Khanna, T.M.; Baiocchi, G.; Callaghan, M.; Creutzig, F.; Guias, H.; Haddaway, N.R.; Hirth, L.; Javaid, A.; Koch, N.; Laukemper, S. A Multi-Country Meta-Analysis on the Role of Behavioural Change in Reducing Energy Consumption and CO2 Emissions in Residential Buildings. Nat. Energy 2021, 6, 925–932. [Google Scholar] [CrossRef]
  46. Jorquera, H. Air Quality Management in Chile: Effectiveness of PM2. 5 Regulations. Urban Clim. 2021, 35, 100764. [Google Scholar] [CrossRef]
  47. Mannan, M.; Al-Ghamdi, S.G. Indoor Air Quality in Buildings: A Comprehensive Review on the Factors Influencing Air Pollution in Residential and Commercial Structure. Int. J. Environ. Res. Public Health 2021, 18, 3276. [Google Scholar] [CrossRef] [PubMed]
  48. Vitaliano, S.; Cascone, S.; D’Urso, P.R. Mitigating Built Environment Air Pollution by Green Systems: An in-Depth Review. Appl. Sci. 2024, 14, 6487. [Google Scholar] [CrossRef]
  49. Irga, P.J.; Morgan, A.; Fleck, R.; Torpy, F.R. Phytoremediation of Indoor Air Pollutants from Construction and Transport by a Moveable Active Green Wall System. Atmos. Pollut. Res. 2023, 14, 101896. [Google Scholar] [CrossRef]
  50. Heidari, M.; Thangavel, S.; Al Naamani, E.; Khashehchi, M. Emerging Trends in Smart Green Building Technologies. In Sustainable Technologies for Energy Efficient Buildings; CRC Press: Boca Raton, FL, USA, 2024; pp. 313–336. [Google Scholar]
  51. Daemei, A.B.; Shafiee, E.; Chitgar, A.A.; Asadi, S. Investigating the Thermal Performance of Green Wall: Experimental Analysis, Deep Learning Model, and Simulation Studies in a Humid Climate. Build. Environ. 2021, 205, 108201. [Google Scholar] [CrossRef]
  52. Djedjig, R.; Belarbi, R.; Bozonnet, E. Experimental Study of Green Walls Impacts on Buildings in Summer and Winter under an Oceanic Climate. Energy Build. 2017, 150, 403–411. [Google Scholar] [CrossRef]
  53. Segovia-Cardozo, D.A.; Rodríguez-Sinobas, L.; Zubelzu, S. Living Green Walls: Estimation of Water Requirements and Assessment of Irrigation Management. Urban For. Urban Green. 2019, 46, 126458. [Google Scholar] [CrossRef]
  54. Bakhshoodeh, R.; Ocampo, C.; Oldham, C. Evapotranspiration Rates and Evapotranspirative Cooling of Green Façades under Different Irrigation Scenarios. Energy Build. 2022, 270, 112223. [Google Scholar] [CrossRef]
  55. Carlucci, S.; Charalambous, M.; Tzortzi, J.N. Monitoring and Performance Evaluation of a Green Wall in a Semi-Arid Mediterranean Climate. J. Build. Eng. 2023, 77, 107421. [Google Scholar] [CrossRef]
  56. Moody, S.S.; Sailor, D.J. Development and Application of a Building Energy Performance Metric for Green Roof Systems. Energy Build. 2013, 60, 262–269. [Google Scholar] [CrossRef]
  57. Standard 62.1-2022; Ventilation for Acceptable Indoor Air Quality. American Society of Heating, Refrigerating and Air-Conditioning Engineers: Peachtree Corners, GA, USA, 2022.
  58. EN 16516:2017+A1:2020; Construction Products—Assessment of Release of Dangerous Substances—Determination of Emissions into Indoor Air. CEN-CENELEC Management Centre: Brussels, Belgium, 2020.
  59. ISO 16000-6:2021; Indoor Air—Part 6: Determination of Organic Compounds (VVOC, VOC, SVOC) in Indoor and Test Chamber Air by Active Sampling on Sorbent Tubes, Thermal Desorption and Gas Chromatography Using MS or MS FID. ISO: Geneva, Switzerland, 2021.
  60. LEED v4.1 BD+C; LEED v4.1 Building Design and Construction Rating System; U.S. Green Building Council: Washington, DC, USA, 2019.
  61. Tuominen, P.; Holopainen, R.; Eskola, L.; Jokisalo, J.; Airaksinen, M. Calculation Method and Tool for Assessing Energy Consumption in the Building Stock. Build. Environ. 2014, 75, 153–160. [Google Scholar] [CrossRef]
  62. Shin, M.; Do, S.L. Prediction of Cooling Energy Use in Buildings Using an Enthalpy-Based Cooling Degree Days Method in a Hot and Humid Climate. Energy Build. 2016, 110, 57–70. [Google Scholar] [CrossRef]
  63. Li, Q.; Luo, Z.; Zhong, B.; Zhou, H. An Improved Approach for Evapotranspiration Estimation Using Water Balance Equation: Case Study of Yangtze River Basin. Water 2018, 10, 812. [Google Scholar] [CrossRef]
  64. Yaghoobian, N.; Srebric, J. Influence of Plant Coverage on the Total Green Roof Energy Balance and Building Energy Consumption. Energy Build. 2015, 103, 1–13. [Google Scholar] [CrossRef]
  65. Du, B.; Reda, I.; Licina, D.; Kapsis, C.; Qi, D.; Candanedo, J.A.; Li, T. Estimating Air Change Rate in Mechanically Ventilated Classrooms Using a Single CO2 Sensor and Automated Data Segmentation. Environ. Sci. Technol. 2024, 58, 18788–18799. [Google Scholar] [CrossRef]
  66. ISO 9972:2015; Thermal Performance of Buildings—Determination of Air Permeability of Buildings—Fan Pressurization Method. ISO: Geneva, Switzerland, 2015.
  67. ASTM E779-19; Standard Test Method for Determining Air Leakage Rate by Fan Pressurization. ASTM International: West Conshohocken, PA, USA, 2019.
  68. ASTM E741-23; Standard Test Method for Determining Air Change in a Single Zone by Means of a Tracer Gas Dilution. ASTM International: West Conshohocken, PA, USA, 2023.
  69. Grassie, D.; Milczewska, K.; Renneboog, S.; Scuderi, F.; Dimitroulopoulou, S. Impact of Indoor Air Quality, Including Thermal Conditions, in Educational Buildings on Health, Wellbeing, and Performance: A Scoping Review. Environments 2025, 12, 261. [Google Scholar] [CrossRef]
  70. Abdelhady, S. Performance and Cost Evaluation of Solar Dish Power Plant: Sensitivity Analysis of Levelized Cost of Electricity (LCOE) and Net Present Value (NPV). Renew. Energy 2021, 168, 332–342. [Google Scholar] [CrossRef]
  71. Du, B.; Tandoc, M.C.; Mack, M.L.; Siegel, J.A. Indoor CO2 Concentrations and Cognitive Function: A Critical Review. Indoor Air 2020, 30, 1067–1082. [Google Scholar] [CrossRef]
  72. Allen, J.G.; MacNaughton, P.; Satish, U.; Santanam, S.; Vallarino, J.; Spengler, J.D. Associations of Cognitive Function Scores with Carbon Dioxide, Ventilation, and Volatile Organic Compound Exposures in Office Workers: A Controlled Exposure Study of Green and Conventional Office Environments. Environ. Health Perspect. 2016, 124, 805–812. [Google Scholar] [CrossRef]
  73. ISO 16000-8:2007; Indoor Air—Part 8: Determination of Local Mean Ages of Air in Buildings for Characterizing Ventilation Conditions. ISO: Geneva, Switzerland, 2007.
  74. Aziz, N.; Adman, M.A.; Suhaimi, N.S.; Misbari, S.; Alias, A.R.; Abd Aziz, A.; Lee, L.F.; Khan, M.M.H. Indoor Air Quality (IAQ) and Related Risk Factors for Sick Building Syndrome (SBS) at the Office and Home: A Systematic Review. Proc. IOP Conf. Ser. Earth Environ. Sci. 2023, 1140, 012007. [Google Scholar] [CrossRef]
  75. Fleck, R.; Gill, R.L.; Pettit, T.; Irga, P.J.; Williams, N.L.R.; Seymour, J.R.; Torpy, F.R. Characterisation of Fungal and Bacterial Dynamics in an Active Green Wall Used for Indoor Air Pollutant Removal. Build. Environ. 2020, 179, 106987. [Google Scholar] [CrossRef]
  76. Bakhtyari, V.; Fattahi, K.; Movahed, K.; Franz, A. Investigating the Effect of Living Walls on Cooling Energy Consumption in Various Urban Microclimates, Building Heights, and Greenery Coverage Areas. Sustainability 2024, 16, 920. [Google Scholar] [CrossRef]
  77. Chepaitis, P.S.; Zhang, Q.; Kalafut, D.; Waddey, T.; Wilson, M.J.; Black, M. The Effect of Moderate Temperature Rise on Emitted Chemicals from Modern Building Materials. Buildings 2024, 14, 3683. [Google Scholar] [CrossRef]
  78. Banti, N.; Ciacci, C.; Di Naso, V.; Bazzocchi, F. Green Walls as Retrofitting Measure: Influence on Energy Performance of Existing Industrial Buildings in Central Italy. Buildings 2023, 13, 369. [Google Scholar] [CrossRef]
  79. Pragati, S.; Shanthi Priya, R.; Pradeepa, C.; Senthil, R. Simulation of the Energy Performance of a Building with Green Roofs and Green Walls in a Tropical Climate. Sustainability 2023, 15, 2006. [Google Scholar] [CrossRef]
  80. Jia, S.; Weng, Q.; Wang, Y. The Potential of Nature-Based Solutions in Urban Heat Mitigation and Building Energy Savings. In Handbook of Geospatial Approaches to Sustainable Cities; CRC Press: Boca Raton, FL, USA, 2024; pp. 109–136. [Google Scholar]
  81. Evren, F.; Biswas, S.; Graves, R. Measuring Mean Radiant Temperature for Indoor Comfort Assessment Using Low-Resolution Optical Sensors. Nat. Commun. 2025, 16, 1215. [Google Scholar] [CrossRef]
  82. Lee, D.-S.; Jo, J.-H. Pan–Tilt IR Scanning Method for the Remote Measurement of Mean Radiant Temperatures at Multi-Location in Buildings. Remote Sens. 2021, 13, 2158. [Google Scholar] [CrossRef]
  83. Lee, D.-S.; Jo, J.-H. Application of IR Camera and Pyranometer for Estimation of Longwave and Shortwave Mean Radiant Temperatures at Multiple Locations. Build. Environ. 2022, 207, 108423. [Google Scholar] [CrossRef]
Figure 1. Sensor placement schematic for both rooms. (a) Plan view of the 4.0 m (east–west) × 3.5 m (north–south) room showing the green wall on the interior south wall of the GWS room (hatched), the window on the north wall (blue), the sampling inlet centerline at x = 2.00 m from the west wall and y = 1.75 m from the south wall, and minimum clearances ≥1.5 m from supply/return terminals. (b) Elevation section showing the sensor height at 1.20 m above finished floor; the green wall module depth (0.15 m) is indicated. All distances are referenced to the finished wall planes and are identical in the Control and GWS rooms; distances refer to the inlet centerline unless otherwise noted.
Buildings 15 03656 g001
Figure 2. Photograph of the installed modular hydroponic green wall (2.4 m × 2.4 m; 24 panels arranged 4 × 6; ~5.76 m2) showing the panel matrix, integrated LED luminaires, irrigation manifold, and representative plant canopy (Epipremnum aureum, Spathiphyllum wallisii, Chlorophytum comosum).
Buildings 15 03656 g002
Figure 3. Air quality performance comparison showing pollutant reduction across different conditions with (a) confidence intervals, (b) performance under varying environmental conditions, (c) temporal trends, (d) response during pollution events, and (e) distribution of pollutant-reduction magnitudes by pollutant (CO2, VOC_PID, PM2.5) shown as violin plots.
Buildings 15 03656 g003
Figure 4. Polar visualization of 24 h energy consumption patterns during summer peak season (June–August) showing (a) power consumption clock comparing control room (red) and green wall room (blue) with radial scaling from center (0 kW) to outer ring (2.5 kW), and (b) hourly power reduction benefits with color-coded intensity mapping. Peak reduction periods (12:00–16:00) are annotated with specific values.
Buildings 15 03656 g004
Figure 5. Correlation analysis and performance relationships. (a) Correlation-matrix heatmap of key variables. (b) Evapotranspiration (ET) rate vs. cooling-energy reduction. (c) ET rate vs. interior wall-surface temperature reduction. (d) Outdoor air temperature vs. ET rate. (e) Outdoor relative humidity (RH) vs. ET rate. (f) Outdoor wind speed vs. cooling-energy reduction. (g) Global horizontal solar radiation vs. cooling-energy reduction. Panels with larger R2 (e.g., (b,c)) indicate dominant mechanisms; panel (f) shows a weak bivariate association for wind—a secondary environmental predictor whose direct influence is attenuated for an interior installation. In the multivariate model, such predictors remain statistically significant but have small standardized effects, confirming that ET-driven mechanisms dominate energy savings in this study.
Buildings 15 03656 g005
Figure 6. Seasonal performance trends of the green wall system showing (a) outdoor temperature context, (b,c) air quality improvements with dual-axis scaling, and (d) evapotranspiration rates. Error bars represent standard error of monthly means. The consistent tracking of performance metrics with outdoor temperature demonstrates the environmental responsiveness of the system.
Buildings 15 03656 g006
Figure 7. Economic benefits waterfall analysis showing the 15-year net present value (NPV) breakdown for the green wall system implementation. The analysis shows the progression from the initial investment to a final 15-year NPV of SAR 31,865. Panel (a) shows the annual benefits distribution by category; panel (b) shows a sensitivity analysis for the NPV (Blue: NPV (SAR thousands); red: Payback Period (years)); and panel (c) illustrates the return on investment timeline, identifying a 2.0-year payback period.
Buildings 15 03656 g007
Figure 8. Monte Carlo sensitivity analysis and economic risk assessment. The analysis shows (a) a tornado diagram of parameter impacts on NPV, (b) the NPV probability distribution from 10,000 iterations with a mean of SAR 31.9k, (c) the payback period distribution, (d) the benefit–cost ratio distribution, (e) a scenario analysis comparing conservative, base case (NPV SAR 31.9k, Payback 2.0 years), and optimistic outcomes, and (f) a risk–return comparison with alternative investments. The results demonstrate robust economic viability across diverse parameter variations.
Buildings 15 03656 g008
Figure 9. Comparative cost-effectiveness analysis of indoor air quality improvement solutions. (a) Each bubble is a strategy; bubble size indicates annual operating cost (SAR m−2 yr−1). The horizontal dashed grey line at 10% CO2 reduction is the performance benchmark; the vertical line at 0% separates energy savings (left) from additional consumption (right). (b) Bars show cost per 1% CO2 reduction (SAR); the dashed red line (SAR 10.0) marks the efficiency threshold; bars below the line are cost-effective.
Buildings 15 03656 g009
Table 1. Comparative analysis of green wall system studies in office environments.
StudyLocationClimatic Context (Köppen–Geiger; Scope)System TypeDurationKey FindingsLimitations
Zhang et al. [39]ChinaLaboratory (N/A)Active hydroponic6 months18% CO2 reduction, 12% energy savingsLaboratory conditions only
Carlucci et al. [40]CyprusMediterranean hot-summer (Csa)Passive climbing12 months11% CO2 reduction, 8% energy savingsSingle pollutant focus
Ciucci et al. [41] ItalyTemperate/Mediterranean (Csa/Cfa; site-specific)Active modular8 months35% PM2.5 reduction, 15% energy savingsSmall scale installation
Baghaei Daemei & Jamali [42]IranModeled hot arid/semi-arid (BWh/BSh)Active soil-based4 months22% TVOC reduction, 19% energy savingsSimulation-based results
Gao et al. [43]ChinaHumid subtropical/monsoonal (Cfa/Cwa; urban office)Passive moss3 months15% air-quality improvementLimited pollutant range
Paull et al. [44]AustraliaLaboratory (N/A)Active substrate2 weeks80% VOC removal efficiencySingle compound testing
Khanna et al. [45]Global review (Various)Various (multi-climate synthesis)Meta-analysis5–25% energy savings rangeHeterogeneous methodologies
Jorquera [46]ChileMediterranean warm-summer (Csb; central Chile; outdoor)Various6 months12–35% PM reduction rangeOutdoor installations only
Note: Climatic context is reported as (i) the authors’ stated city/region mapped to the corresponding Köppen–Geiger class where available; (ii) ‘Laboratory (N/A)’ when results derive from chamber/bench tests without climatic exposure; and (iii) ‘Modeled’ when results are purely simulation-based. Country-level labels that span multiple zones are thus disambiguated for interpretation. This study’s site is hot–arid (Dhahran; Eastern Province, Saudi Arabia).
Table 2. Measurement instrumentation and specifications used in this study.
Measurement/VariableInstrument (Make/Model)Measurement PrincipleRange (Manufacturer)ResolutionStated
Accuracy (Manufacturer)
Calibration/TraceabilityNotes and
Uncertainty
Considerations
CO2 concentrationVaisala CARBOCAP® GMT220 (NDIR)—Vaisala Oyj, Vantaa, FinlandNon-dispersive infrared absorption0–2000 ppm±3 ppm + 3% of readingCertified reference gases (0, 400, 1000 ppm) prior to deployment and quarterlySensors mounted at 1.2 m height; placement away from supply/return jets to minimize bias; accuracy per spec.
VOC_PID (isobutylene-equivalent)RAE Systems MultiRAE Pro PGM-62 × 8 (PID, 10.6 eV lamp)—RAE Systems (Honeywell), San Jose, CA, USAPhotoionization0.1–2000 ppm—(manufacturer-stated; not enumerated here)Quarterly calibration with certified isobutylene gas; reported as isobutylene-equivalentppm converted to mg/m3 assuming 24 °C and 56.1 g/mol; no compound-specific response factors applied; uncertainty dominated by species-dependent response.
PM2.5 mass concentrationTSI DustTrak™ DRX 8533 (laser photometer)—TSI Inc., Shoreview, MN, USAOptical light scattering (photometry)0.001–150 mg/m3±0.1% of reading or ±0.001 mg/m3 (whichever greater)Aerosol-dependent; factory calibrationFactory calibration; no site-specific gravimetric correctionOptical response varies with aerosol properties; reported values reflect standard factory calibration.
Air temperature & relative humidityVaisala HMP60 (digital T/RH)—Vaisala Oyj, Vantaa, FinlandThermistor + capacitive RHTemperature ±0.6 °C; RH ±3%Weekly manual checks against portable reference; routine cleaningUsed for environmental context and QA of IAQ data.
Electrical power/energy (HVAC circuits)Schneider Electric PowerLogic ION7650 (with 100 A/5 A CTs)—Schneider Electric, Rueil-Malmaison, France3-phase revenue-grade metering15 min logging intervalAccuracy Class 0.2S (IEC 62053-22)Annual verification against utility billing; agreement within ≈ ±2.1%CTs installed on each phase; voltage measured at panels with isolation.
Irrigation flow (per zone)Omega FTB-201 (turbine)—Omega Engineering, Norwalk, CT, USATurbine flow±1% of full scaleFactory calibrationUsed in water balance/ET calculations.
Drainage massSartorius Entris II BCE6202i—Sartorius AG, Göttingen, GermanyGravimetric0–6200 g capacity0.01 gIntegrated with data acquisition systemUsed to convert drainage mass to volume for ET.
Substrate moisture/storageCampbell Scientific CS655 (TDR)—Campbell Scientific, Logan, UT, USATime-domain reflectometry±3% volumetric water contentFactory calibrationUsed to estimate ΔS in water balance.
Outdoor meteorologyCampbell Scientific ET107—Campbell Scientific, Logan, UT, USA.Multi-sensor station(parameters: T, RH, wind speed/direction, solar radiation, precipitation)Factory calibration; periodic maintenance
Leaf area (for LAI assessments)LI-COR LI-3100C—LI-COR Biosciences, Lincoln, NE, USAOptical planimetryFactory calibrationUsed for periodic plant physiological monitoring.
Note: (i) “Range (manufacturer)” is the catalog specification when reported in this study; “—” indicates the numerical value is not reported here and is non-essential to reproduce the analyses. (ii) When instrument accuracy is context-dependent (e.g., optical aerosol photometry), we report the stated limitation and calibration approach rather than a single consolidated uncertainty. (iii) All instruments were included in the QA program (daily automated diagnostics; weekly manual checks; monthly maintenance).
Table 3. Statistical summary of CO2 concentrations by room and occupancy status.
ParameterControl RoomGWS RoomDifferenceRelative Change
Occupied Hours (08:00–17:00)
Mean ± SE (ppm)847 ± 12.3728 ± 10.8−119 ± 16.2−14.1%
Median (ppm)832715−117−14.1%
95th Percentile (ppm)11561023−133−11.5%
Maximum (ppm)13871245−142−10.2%
Unoccupied Hours (17:00–08:00)
Mean ± SE (ppm)421 ± 3.7398 ± 3.2−23 ± 4.9−5.5%
Median (ppm)418396−22−5.3%
95th Percentile (ppm)467442−25−5.4%
Maximum (ppm)523498−25−4.8%
Overall (24-h)
Mean ± SE (ppm)634 ± 8.7563 ± 7.4−71 ± 11.5−11.2%
Standard Deviation (ppm)287251−36−12.5%
Table 4. VOC_PID (isobutylene-equivalent) concentration analysis and removal efficiency.
Measurement PeriodControl Room (mg/m3)GWS Room (mg/m3)ReductionRemoval
Efficiency
Daytime Periods (06:00–18:00)
Mean ± SE0.847 ± 0.0230.609 ± 0.0180.238 ± 0.02928.1%
Median0.8230.5910.23228.2%
90th Percentile1.1560.8340.32227.9%
Nighttime Periods (18:00–06:00)
Mean ± SE0.654 ± 0.0180.478 ± 0.0140.176 ± 0.02326.9%
Median0.6410.4670.17427.1%
90th Percentile0.9230.6790.24426.4%
Equipment Operation Events
Printer Use Peak2.347 ± 0.0871.689 ± 0.0650.658 ± 0.10928.0%
Post-Event Recovery (30 min)1.234 ± 0.0450.876 ± 0.0330.358 ± 0.05629.0%
Seasonal Variations
Summer (Jun-Aug)0.892 ± 0.0340.634 ± 0.0260.258 ± 0.04328.9%
Winter (Dec-Feb)0.743 ± 0.0280.541 ± 0.0210.202 ± 0.03527.2%
Note: VOC_PID concentrations are reported in mg/m3 as isobutylene-equivalents. VOC_PID denotes a lumped PID response calibrated to isobutylene. Values are not equivalent to standardized TVOC (EN 16516/ISO 16000/LEED) and should not be interpreted against regulatory thresholds.
Table 5. PM2.5 concentration analysis and statistical comparison.
Statistical ParameterControl Room (μg/m3)GWS Room (μg/m3)Absolute
Difference
Percentage
Reduction
Overall Dataset (n = 525,600)
Mean ± SE18.7 ± 0.1214.8 ± 0.093.9 ± 0.1520.9%
Median16.413.13.320.1%
75th Percentile24.319.25.121.0%
95th Percentile42.734.18.620.1%
High Outdoor PM2.5 Days (>25 μg/m3)
Mean ± SE31.4 ± 0.3424.2 ± 0.277.2 ± 0.4322.9%
Peak Event Maximum67.852.315.522.9%
Low Outdoor PM2.5 Days (<10 μg/m3)
Mean ± SE12.3 ± 0.089.8 ± 0.062.5 ± 0.1020.3%
Dust Storm Events (n = 7)
Peak Concentration156.7 ± 12.4119.3 ± 9.837.4 ± 15.623.9%
Recovery Time to Baseline (hours)8.3 ± 0.76.1 ± 0.5−2.2 ± 0.926.5%
Table 6. Annual cooling energy consumption summary.
Energy MetricControl RoomGWS RoomSavingsPercentage Reduction
Total Annual Consumption
Cooling Energy (kWh)4247.33672.8574.513.5%
Peak Demand (kW)2.342.120.229.4%
Load Factor0.6270.598−0.0294.6%
Seasonal Breakdown
Summer (Jun-Aug) (kWh)1823.71534.2289.515.9%
Transition (Mar-May, Sep-Nov) (kWh)1687.41465.3222.113.2%
Winter (Dec-Feb) (kWh)736.2673.362.98.5%
Normalized Metrics
Energy Use Intensity (kWh/m2/year)303.4262.341.113.5%
Cost Savings (SAR/year) *--137.313.5%
* Based on commercial electricity rate of 0.239 SAR/kWh in Eastern Province.
Table 7. Evapotranspiration performance statistics by season and environmental conditions.
Condition CategoryET Rate (L/Day/m2)Daily Variation (±)Peak Rate (L/h/m2)Environmental Correlation
Seasonal Averages
Summer (Jun-Aug)5.60 ± 0.121.670.521r = 0.847 (temp)
Spring (Mar-May)4.33 ± 0.091.340.412r = 0.782 (temp)
Autumn (Sep-Nov)3.98 ± 0.081.210.389r = 0.756 (temp)
Winter (Dec-Feb)2.76 ± 0.060.890.267r = 0.623 (temp)
Outdoor Temperature Ranges
>40 °C (n = 147 days)6.17 ± 0.151.890.578-
30–40 °C (n = 186 days)4.55 ± 0.111.450.443-
20–30 °C (n = 32 days)3.41 ± 0.081.120.334-
<20 °C (n = 0 days)----
Humidity Conditions
High RH (>70%)3.57 ± 0.091.180.367r = −0.423 (humidity)
Medium RH (40–70%)4.68± 0.111.510.445r = −0.398 (humidity)
Low RH (<40%)7.10 ± 0.182.230.612r = −0.456 (humidity)
Table 8. Comparative performance analysis against published studies.
Performance MetricCurrent StudyLiterature RangeStudy ReferencesRelative Performance
Air Quality Improvements
CO2 Reduction (%)14.18–22[18,22,35]Above average
VOC_PID Reduction (%)28.115–45[19,28,41]Average
PM2.5 Reduction (%)20.912–35[24,33,47]Average
Energy Performance
Cooling Energy Savings (%)13.55–25[21,26,39]Above average
Peak Demand Reduction (%)9.43–18[25,31,44]Average
Operational Parameters
ET Rate (L/day/m2)4.441.5–6.2[32,38,45]Average
Plant Density (plants/m2)6540–120[29,36,42]Average
System Efficiency (cooling/ET)0.187 kWh/L0.12–0.31[27,34,46]Above average
Table 9. Statistical test summary for primary performance metrics.
Performance VariableTest AppliedTest Statisticp-ValueEffect Size95% CI for Difference
CO2 Concentration
Daily Mean ComparisonPaired t-testt = −28.47<0.001d = 1.12[−75.6, −66.4] ppm
Temporal Trend AnalysisARIMA (2,1,1)-<0.001--
VOC_PID Concentration
Daily Mean ComparisonWilcoxon signed-rankW = 127,432<0.001δ = 0.89[−0.267, −0.209] mg/m3
Seasonal VariationKruskal–WallisH = 2847.3<0.001η2 = 0.34-
PM2.5 Concentration
Daily Mean ComparisonPaired t-testt = −19.76<0.001d = 0.87[−4.29, −3.51] μg/m3
Weather DependencyMultiple regressionF = 2134.7<0.001R2 = 0.67-
Energy Consumption
Monthly ComparisonPaired t-testt = −15.23<0.001d = 0.95[−65.8, −50.2] kWh
Load Profile AnalysisRepeated measures ANOVAF = 1876.4<0.001ηp2 = 0.78-
Evapotranspiration Correlation
ET vs. Energy RelationshipPearson correlationr = 0.734<0.001-[0.698, 0.766]
Environmental PredictorsStepwise regressionF = 4567.2<0.001R2 = 0.84-
Table 10. Multiple regression analysis for energy savings prediction.
Predictor VariableCoefficientStandard
Error
t-Valuep-ValueStandardized β
Intercept−2.8470.234−12.16<0.001-
Evapotranspiration Rate (L/day/m2)0.1870.00823.38<0.0010.645
Outdoor Temperature (°C)0.0340.00311.67<0.0010.347
Relative Humidity (%)−0.0150.002−7.50<0.001−0.198
Wind Speed (m/s)0.0280.0064.67<0.0010.089
Solar Radiation (W/m2)0.00120.00026.00<0.0010.134
Model Statistics: R2 = 0.847, Adjusted R2 = 0.843, F(5359) = 398.7, p < 0.001, RMSE = 0.234 kWh.
Table 11. Capital investment and annual operational cost analysis.
ItemSARCost per m2% of Total
Capital Costs
Modular Panels (24 units)1080187.512.9%
Plant Material (374 plants @ SAR 8.50)3179551.937.9%
Hydroponic Infrastructure1250217.014.9%
LED Growth Lighting2100364.625.1%
Installation Labor776134.79.3%
Total Capital Investment83851456.8100.0%
Annual Operational Costs
Electricity (LED + pumps)27840.828.9%
Nutrient Solution34059.041.9%
Plant Replacement (3.2% mortality @ 110% of initial price)11219.413.8%
Maintenance Labor12521.715.4%
Total Annual Operating Cost812141.0100.0%
Table 12. Expanded uncertainty (U95) summary for primary endpoints.
Metric (Basis)Point Estimate95% Interval/U95Notes
CO2 reduction during occupied hours (ppm; %)119 ppm; 14.1%119 ± 31.8 ppm; 14.1% [10.3%, 17.8%]Type A from paired daily means (Table 3); Type B negligible after calibration.
VOC_PID reduction (mg/m3; %)0.238 mg/m3; 28.1%0.238 ± 0.057 mg/m3; 28.1% [21.4%, 34.8%]Table 4.
PM2.5 reduction (μg/m3; %)3.90 μg/m3; 20.9%3.90 ± 0.29 μg/m3; 20.9% [19.3%, 22.4%]Table 5.
Cooling energy saving (kWh·year−1)574.5 kWhU95 ≈ 118 kWh (conservative)Combines monthly Type A with 2.1% per-meter Type B; sign robustly positive.
ET→cooling coefficient (kWh·L−1)0.18795% CI [0.171, 0.203]From Table 10 regression SE.
Disclaimer/Publisher’s Note: The statements, opinions and data contained in all publications are solely those of the individual author(s) and contributor(s) and not of MDPI and/or the editor(s). MDPI and/or the editor(s) disclaim responsibility for any injury to people or property resulting from any ideas, methods, instructions or products referred to in the content.