1. Introduction
Reinforced composite piles are a new pile foundation system formed by combining a rigid core pile with a compliant plain-concrete outer casing, offering both high load-carrying capacity and strong pile–soil synergy. A detailed illustration of the RCPHS system is provided in the
Figure 1. The reinforced pile primarily resists vertical loads through shaft friction, whereas cement–soil mixing piles exhibit excellent lateral resistance; integrating these features can markedly enhance the overall strength and stiffness of the foundation system [
1]. Such piles have been applied across a wide range of ground conditions—including silty soils, clays, silts, and sands—and have shown favorable constructability and bearing performance particularly in sandy sites. In sandy foundations, however, high mobility and a pronounced risk of borehole collapse often complicate conventional jacking methods, leading to instability of bore formation and excessive concrete overfill ratios that impair pile quality [
2]. By contrast, reinforced composite piles, formed through a composite construction process, reconcile structural stiffness with the densification effect on the surrounding soil and therefore exhibit strong potential in these settings. Unlike many studies employing cement–soil mixing casings, the present work adopts a plain concrete casing: its higher elastic modulus and overall stiffness, better durability, and inspectability—combined with borehole stabilization by grouting and deliberate interface roughening—are conducive to sustained and controllable mobilization of shaft friction in sands. On this basis, this study focuses on the vertical bearing performance of reinforced composite piles in dense sandy foundations.
The concept of a composite foundation originally referred to a load-bearing system created during ground improvement by replacing or strengthening part of the natural soil, such that the matrix (in situ soil) and the reinforcement act together [
3]. In recent years, the concept has evolved from a narrow to a generalized definition whose essence is a pile–interpile soil co-bearing system; analyzing the load-transfer paths of shallow foundations, single piles, and composite foundations clarifies this working mechanism [
4]. Prior research indicates that reinforced composite piles—as a generalized composite pile type—combine the high strength of prestressed tubular piles with the high lateral resistance characteristic of cement–soil mixing piles, yielding superior bearing capacity, seismic performance, and adaptability to complex foundations [
5,
6,
7]. Liu Shechuan et al. [
8] reported that composite piles formed by cement-treated soil reinforcement effectively suppress excess pore-pressure development and enhance seismic capacity in liquefiable foundations. Zhu Rui et al. [
9,
10] demonstrated that this pile type significantly increases the effective stress and sidewall resistance of the surrounding soil, thereby achieving effective pile–soil interaction. In comparison to traditional cement-soil materials, using concrete as the casing material in reinforced composite piles offers the following advantages: Concrete has a significantly higher compressive strength, which effectively enhances the load-bearing capacity of the composite pile [
11]. Z Yang emphasized that concrete exhibits superior long-term durability in underground engineering, where it faces complex environmental influences such as soil stress, water penetration, and salt corrosion. Despite these challenges, concrete demonstrates remarkable resistance to erosion and permeability, making it a reliable material in such demanding conditions [
12]. Hua Bao et al. [
13] stated that, in most cases, the vertical bearing capacity of reinforced composite piles is governed by the strength of their external interface. Concrete used as the casing material provides a significantly higher shear stress. This enhances the transfer of vertical load from the core pile to the pile casing, effectively converting the load into frictional resistance, so that both the core pile and casing can fully utilize their individual load-bearing capacities [
14]. Due to its higher elastic modulus, concrete reduces the settlement and lateral displacement of the pile, thereby improving the overall stability of the structure [
15]. Concrete possesses excellent durability, maintaining stable mechanical properties even under long-term loading conditions.
Thus, utilizing concrete as the infill material in reinforced composite piles can significantly improve the pile’s load-bearing capacity and deformation performance. This is particularly valuable in applications requiring high load-bearing capacity and in soft soil foundations, offering significant practical benefits for engineering applications.
The bearing performance of reinforced composite piles is governed by pile structural form, soil properties, construction method, and embedment depth, and accurate prediction of ultimate capacity remains a key problem in geotechnical engineering [
16,
17]. Li Liye et al. [
18] emphasized that capacity calculations for reinforced composite piles should explicitly account for four potential failure modes of the composite system and for the enhanced pile–soil shaft resistance within the composite segment to obtain safe and rational design values. References [
19,
20,
21,
22] outline the prevailing Chinese standards and technical regulations for the calculation of horizontal bearing capacity of reinforced composite piles. While the widely adopted m-method serves as the principal design reference for engineers, its application generally lacks specificity regarding pile type. Consequently, this approach may not fully capture the nuanced behavior of reinforced composite piles, such as RCPHS, potentially limiting the accuracy of horizontal capacity predictions. To address the limitations of the conventional m-value, researchers [
23,
24] proposed two correction approaches. One approach considers the influence of the casing material, thereby amplifying the m-value accordingly. The other approach is based on finite-element analysis data, using curve-fitting techniques to derive a modified m-value formula that accounts for the cement-soil strength and the compressibility of the surrounding soil. In recent years, indoor model tests and numerical simulations have deepened the understanding of the behavior of reinforced composite piles. Liu Xiaoyan et al. [
25] used PLAXIS 3D (a finite element software for geotechnical analysis) to analyze how different ground-improvement pile types affect the bearing capacity and settlement of adjacent piles. Jamsawang P. et al. [
26] and Wonglert et al. [
27] investigated, from numerical and experimental perspectives, how failure modes and parameter variations influence bearing behavior. Józefiak, K. [
28] conducted a linear simulation analysis using ABAQUS (a software suite for finite element analysis and computer-aided engineering), which demonstrated a good fit during the loading phase. However, the simulation exhibited significant deviations from the actual behavior during the unloading phase. Despite substantial progress, three gaps remain: (i) existing theoretical models still struggle to predict in situ behavior of composite piles with sufficient accuracy, leading to discrepancies between models and field observations; (ii) notable differences persist between laboratory and field test results, complicating theoretical validation; and (iii) the accuracy of numerical simulations is limited by uncertainties in input parameters [
29].
This study aims to address existing gaps in the understanding of RCPHS piles by combining field vertical static load tests with three-dimensional finite-element simulations. The focus is on investigating the vertical bearing characteristics and pile–soil interaction mechanisms of the RCPHS piles in dense sandy soil foundations. Special attention is given to the interaction between the plain-concrete casing, the core pile, and the surrounding soil, with the ABAQUS model being validated against measured data to ensure its accuracy and applicability.
This research introduces a novel composite pile system with a plain-concrete casing and prestressed hollow square core, validated through full-scale static load tests in dense sands. A 3D ABAQUS model calibrated with field P–s curves is employed to quantify the core–casing–soil load-sharing ratio and its variation with depth, as well as the resulting economic benefits under equal capacity. These innovations set this study apart from previous works on cement–soil–casing composite piles, offering significant advancements in both performance and cost-efficiency.
2. Experimental Program
2.1. Design and Fabrication of Test Piles
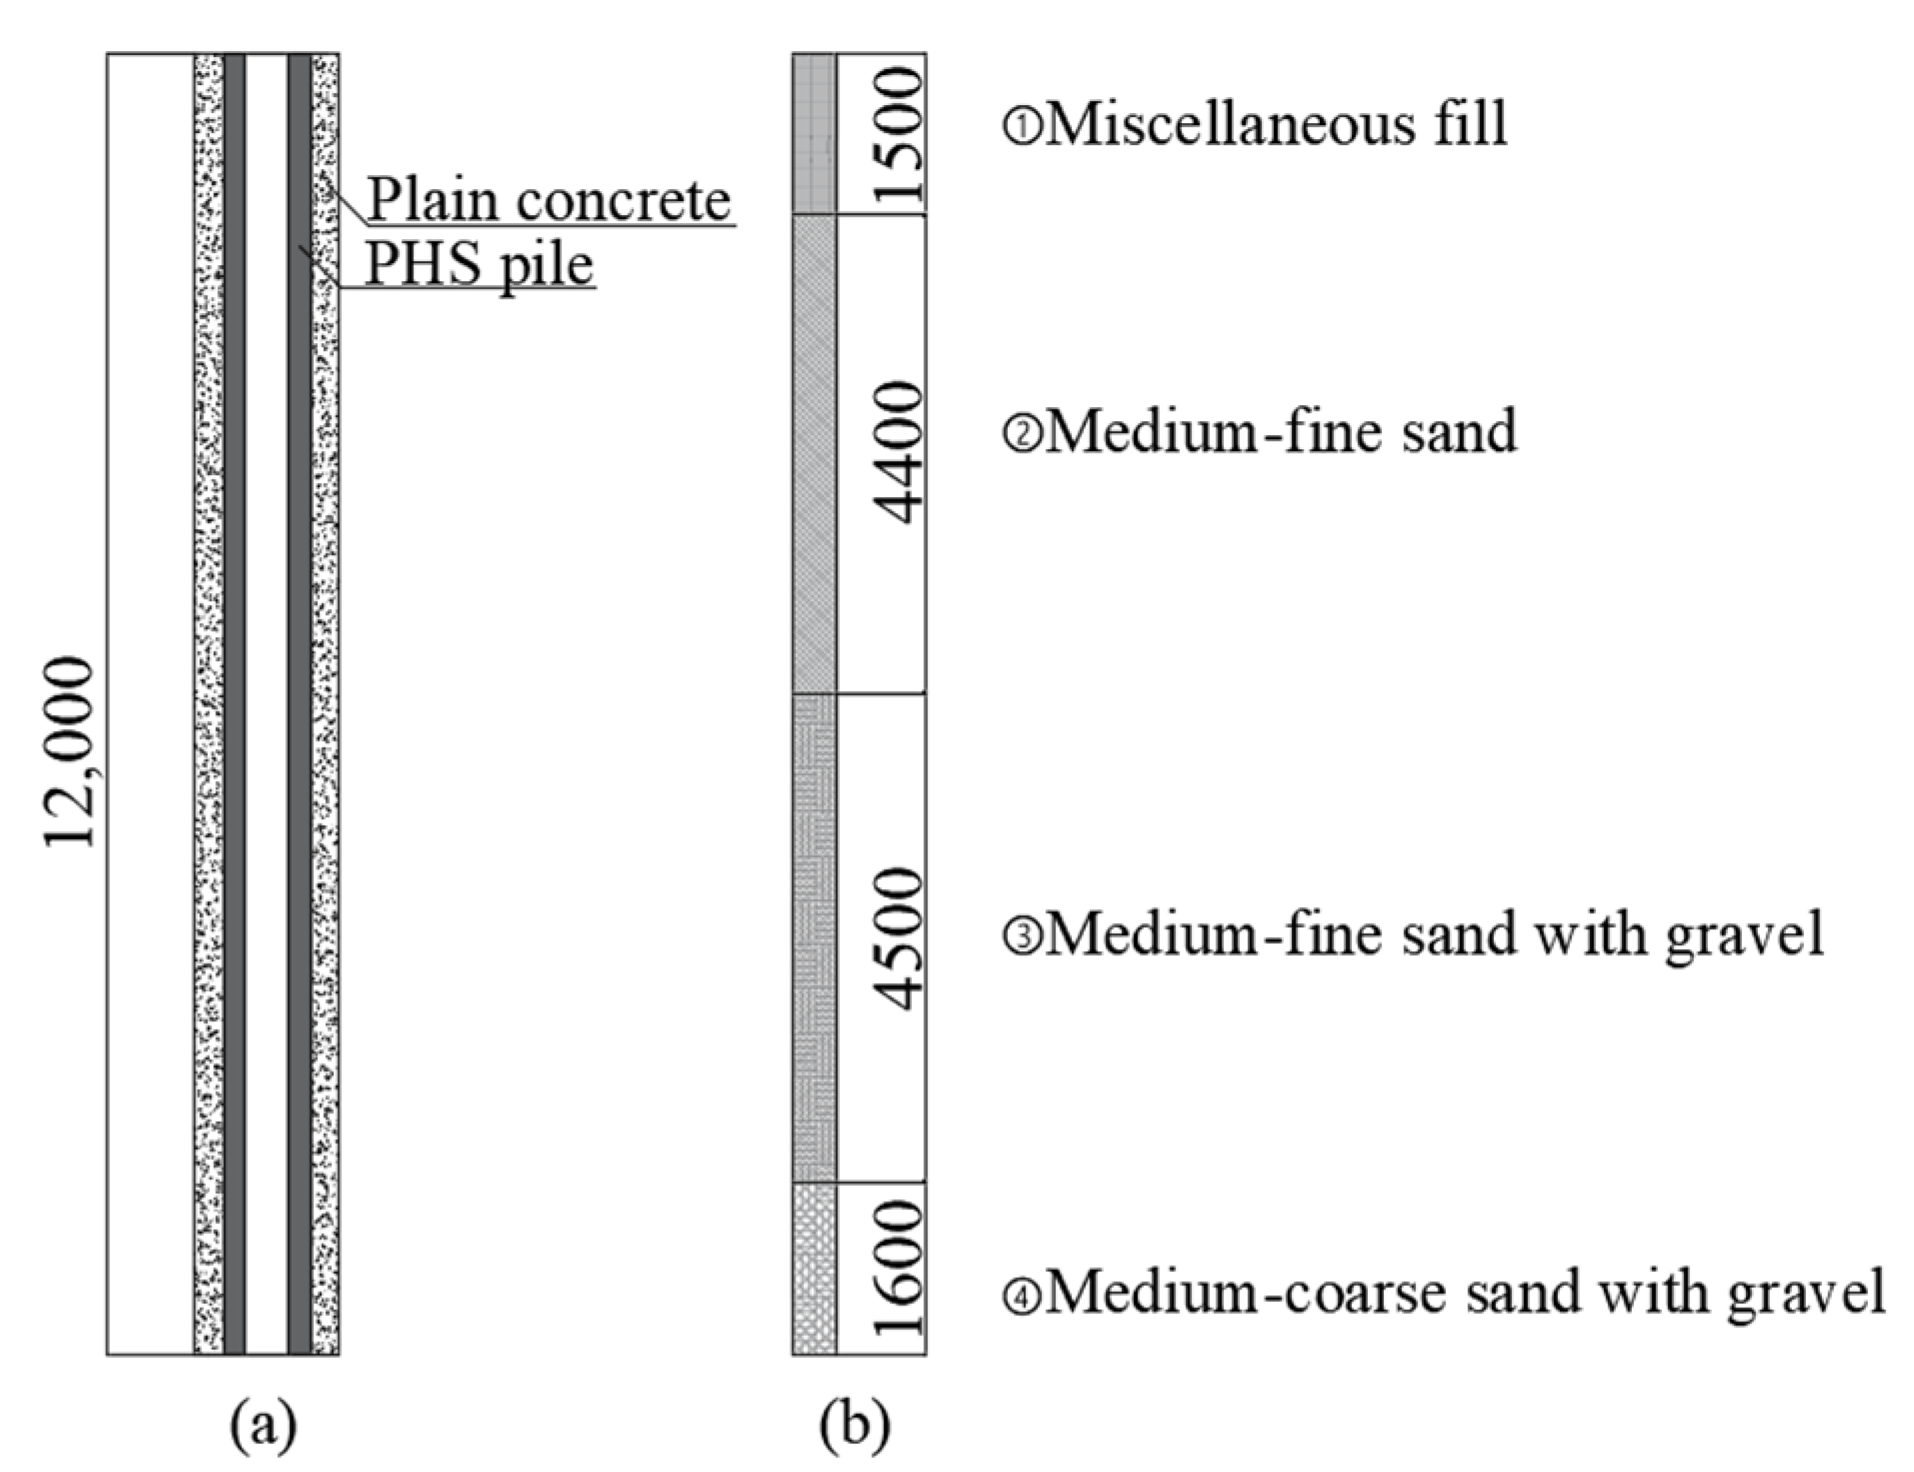
A total of three PHS core piles (designated PHS1, PHS2, and PHS3) and three RCPHS piles (designated SJ1, SJ2, and SJ3) were designed and tested. The PHS core piles are 300 mm × 300 mm square piles cast in C80 concrete and internally reinforced with hot-ribbed bar with a yield strength of 400 MPa (HRB400). Each RCPHS pile consists of a PHS core pile encased with plain concrete to form a circular pile with an overall diameter of 500 mm. The detailed design parameters of the piles are listed in
Table 1, and the cross-sectional dimensions are shown in
Figure 1.
2.2. Test Site and Sandy Foundation Conditions
Before testing, Shandong Jiankan Group Co., Ltd. (Jinan, China)was commissioned to conduct Standard Penetration Tests (SPT) and Cone Penetration Tests (CPT) for the determination of soil parameters.
The test site is situated on flat terrain characterized by relatively uniform sandy soil. The investigation results indicate that the site is divided into four layers based on the depth of the drilling. The surface layer consists of miscellaneous fill, underlain by medium-fine sand and medium-to-coarse sand with gravel. The lithology and distribution of each geotechnical layer are summarized as follows:
Miscellaneous Fill: This layer is gray-brown, brown, and variously colored, moist, loose, and in a soft-plastic state. It mainly consists of clay and miscellaneous fill materials, with plant roots and stems in the surface layer. The layer has not been compacted, resulting in poor density and high compressibility. It is a recent backfilled layer, approximately 3–5 years old, with a thickness of about 1.5 m.
Medium-Fine Sand: This layer is gray-yellow, brown-yellow, and yellow in color, moist, loose to slightly dense, and rounded in shape. It contains minerals such as quartz and mica, with a noticeable shaking response and no luster. Locally, there is a small amount of medium sand, yellow-brown in color, slightly moist, and moderately dense, mainly composed of quartz and feldspar particles. The thickness of this layer is approximately 4.4 m.
Medium-Fine Sand with Gravel: This layer is gray-yellow, brown-yellow, and gray in color, with a moderately dense to dense state. The medium-fine sand is yellow-brown, slightly moist, and moderately dense, mainly composed of quartz and feldspar particles. The gravel content is about 30–40%, and the gravel mainly consists of quartz sandstone and siliceous rock, round to sub-rounded in shape, with good roundness, and in a moderately dense state. The grain size ranges from 20 mm to 60 mm, with a small amount of clayey soil. The thickness is approximately 4.5 m.
Medium-Coarse Sand with Gravel: This layer is gray-yellow, brown-yellow, and gray in color, with a dense state. The medium-coarse sand is yellow-brown, slightly moist, and dense, primarily composed of quartz and feldspar particles. The gravel content is about 40–50%, consisting mainly of quartz sandstone and siliceous rock, round to sub-rounded in shape, with good roundness, and in a dense state. The grain size ranges from 20 mm to 60 mm, with a small amount of clayey soil locally. The thickness is approximately 10.2 m.
The pile sectional details and the surrounding soil stratigraphy are shown in
Figure 2. The site conditions meet the necessary criteria for evaluating the vertical capacity of RCPHS piles in sandy soil. The representative parameters are provided in
Table 2.
2.3. Equipment and Testing Method
To form large-diameter sections with small jacked cores while minimizing the risk of liquefaction and preventing hole collapse or necking, a long-auger pre-drilling method combined with static jacking was employed [
30]. Although this technique is economical, quiet, and reliable, its capacity can vary. Therefore, theoretical capacity estimates, destructive static load tests, and ABAQUS simulations were integrated to assess the feasibility and bearing performance.
The on-site testing of RCPHS piles aims to confirm that their bearing capacity meets design expectations and to ensure the structural integrity of the piles, thereby preventing foundation-related failures under superstructure loading [
31].
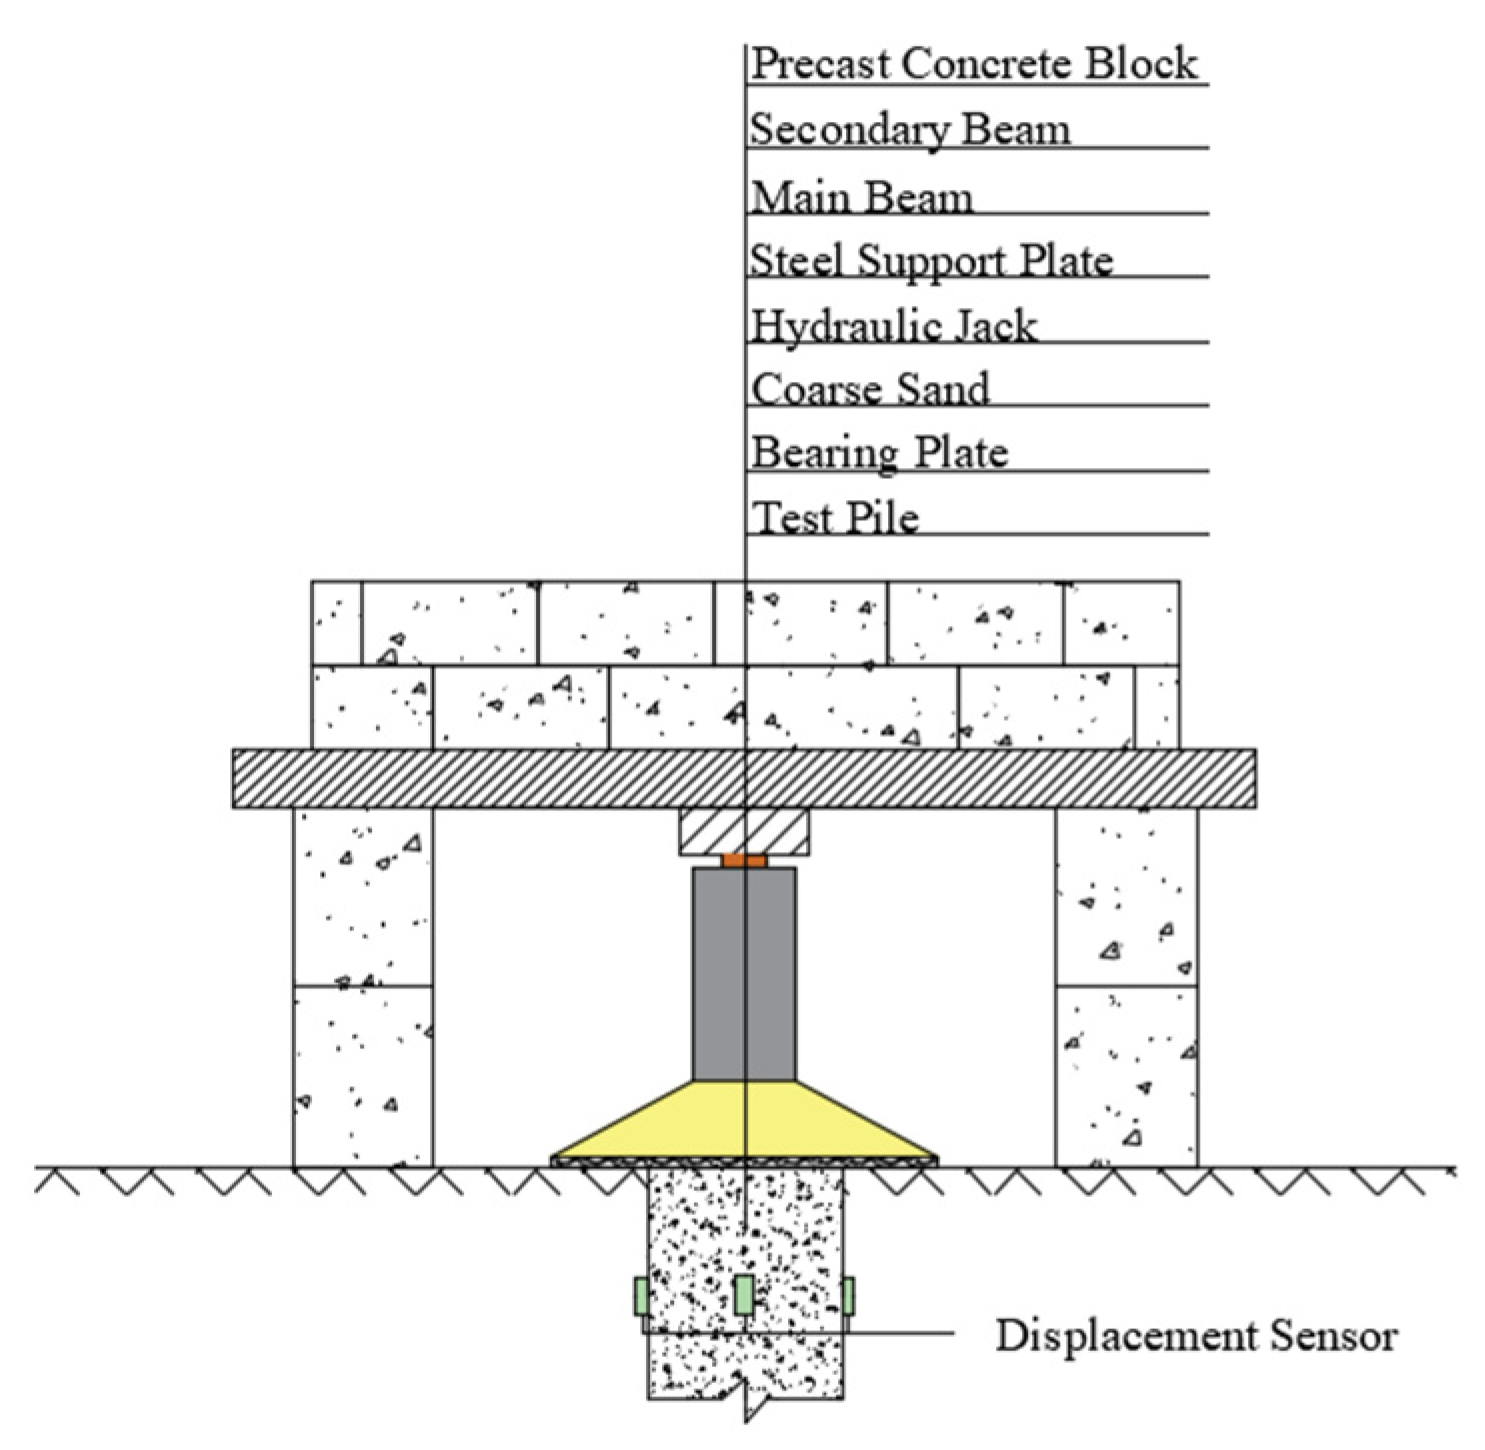
All engineering piles met integrity requirements in sonic testing; wave velocities were normal and integrity grades were acceptable, satisfying the static-load protocol. Three RCPHS piles (SJ1–SJ3) and three PHS piles (PHS1–PHS3) were tested under vertical loads using a maintained-load (slow-step) method and incremental loading per the code [
21] (≥10 load steps). The loading system and field setup are shown in
Figure 3 and
Figure 4.
2.4. Load Scheme and Data Acquisition
Design provisions were adhered for determining the characteristic vertical compressive resistance through static load tests. For preliminary design, the characteristic value can be estimated using published formulae for composite piles. According to Li Mengyao’s method [
32], when shear failure along the core–casing interface governs, the characteristic value of the vertical compressive bearing capacity of the base pile can be estimated using the following formula:
where is:
—The pile’s vertical compressive bearing capacity characteristic value (kPa);
—The circumference of the core pile body inside the pile (m);
—The length of the composite section (m);
—The thickness of the non-composite section soil layer (m);
—The cross-sectional area of the core pile body inside the pile (m2);
—The characteristic value of the side resistance of the core section inside the composite pile (kPa);
—The characteristic value of the side resistance of the core pile in the non-composite section at the j th soil layer (kPa);
—The end resistance characteristic value of the core pile at the pile tip in the soil (kPa).
The characteristic compressive capacity for the pile was calculated as 3024.2 kN, and the preliminary ultimate design load was set at 6080 kN.
3. Results and Analysis
3.1. RCPHS Performance
3.1.1. Incremental (Per-Step) Displacement
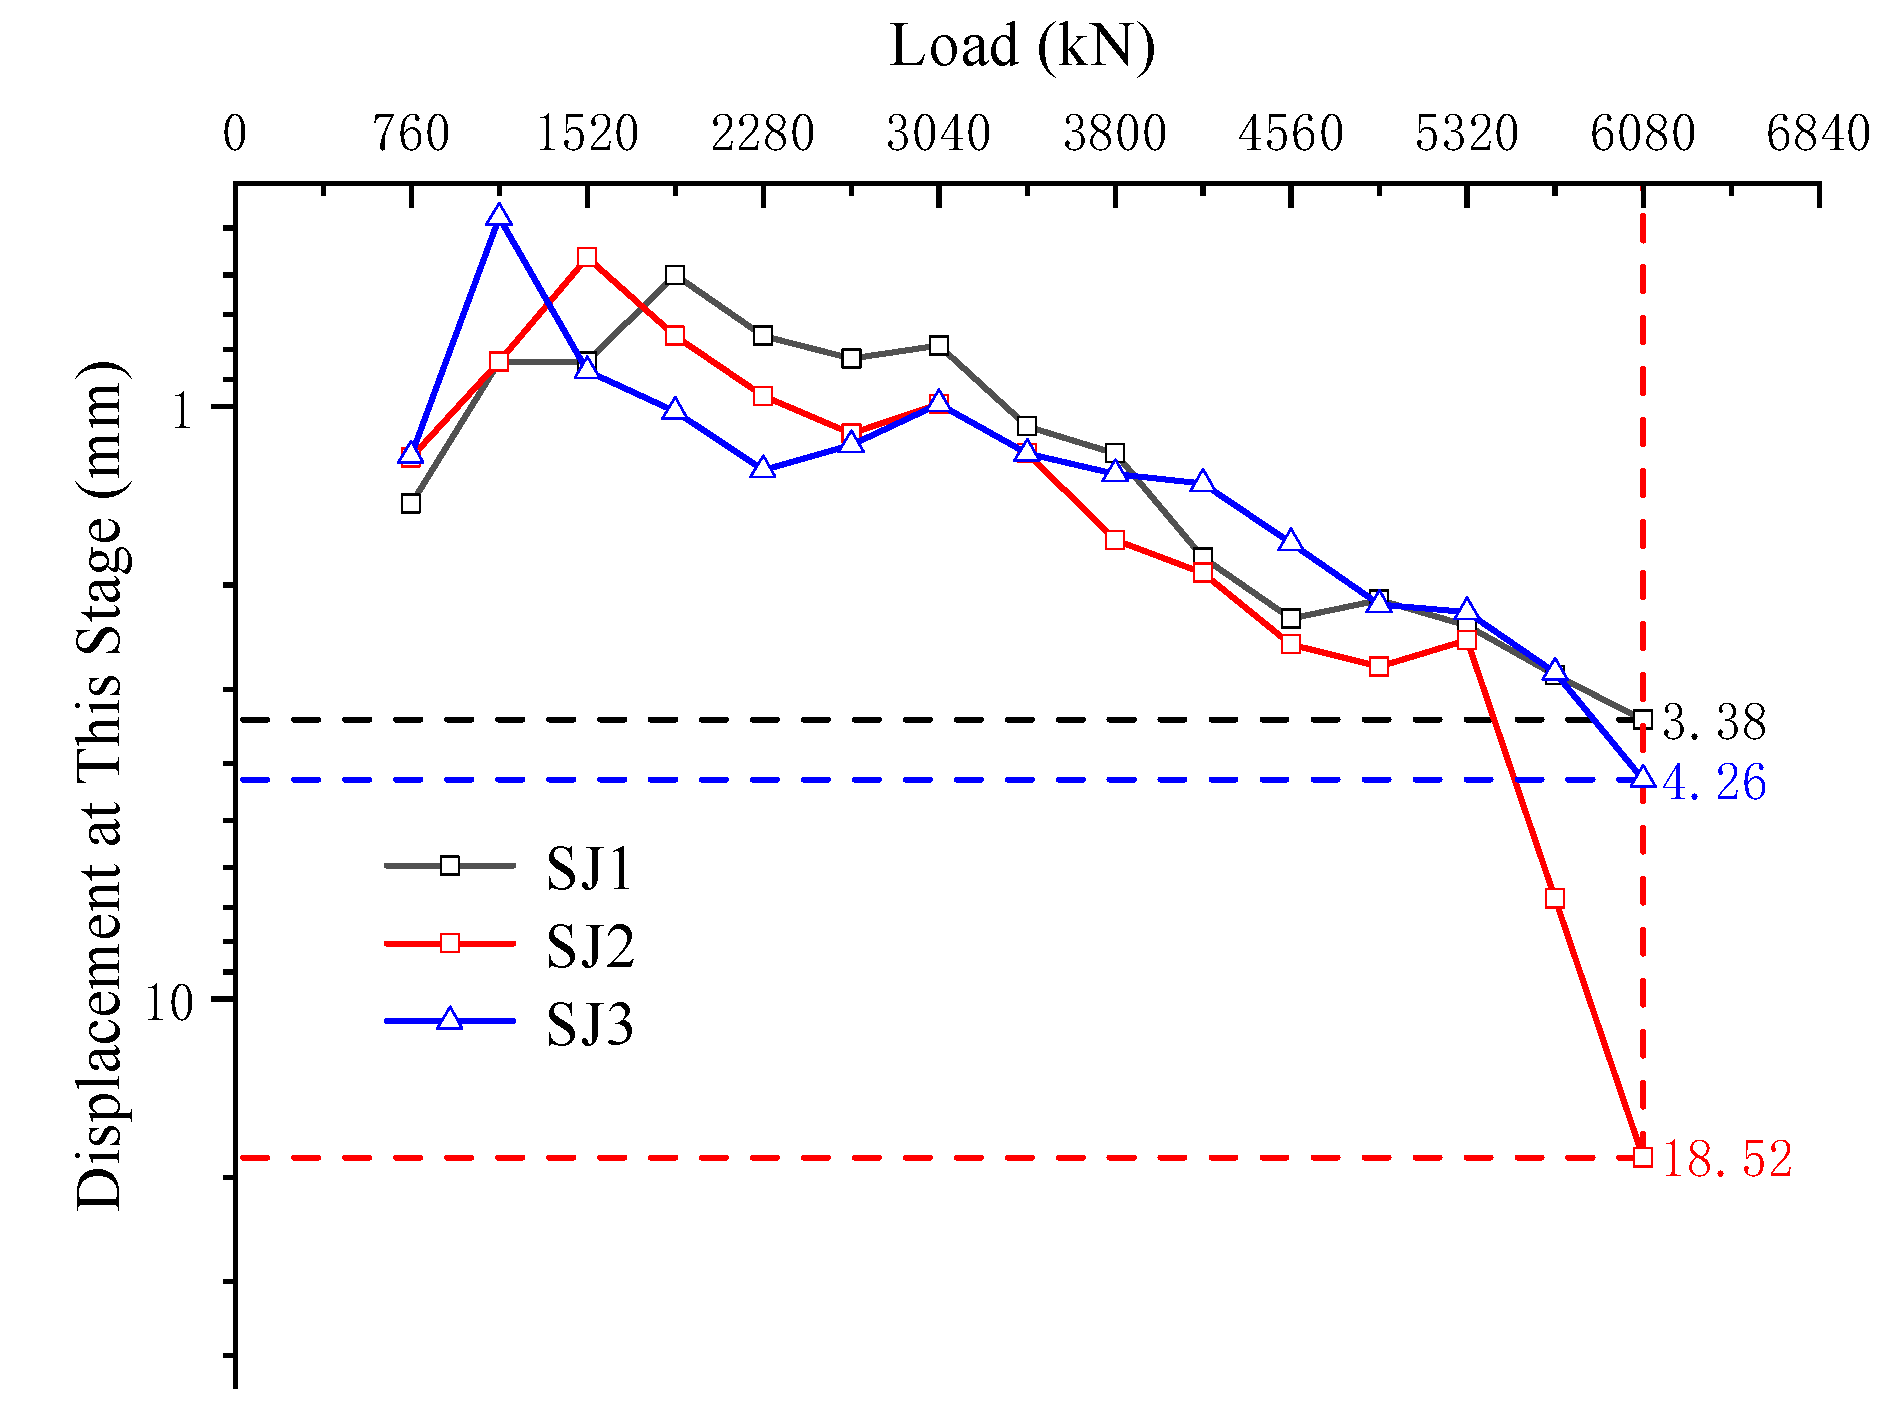
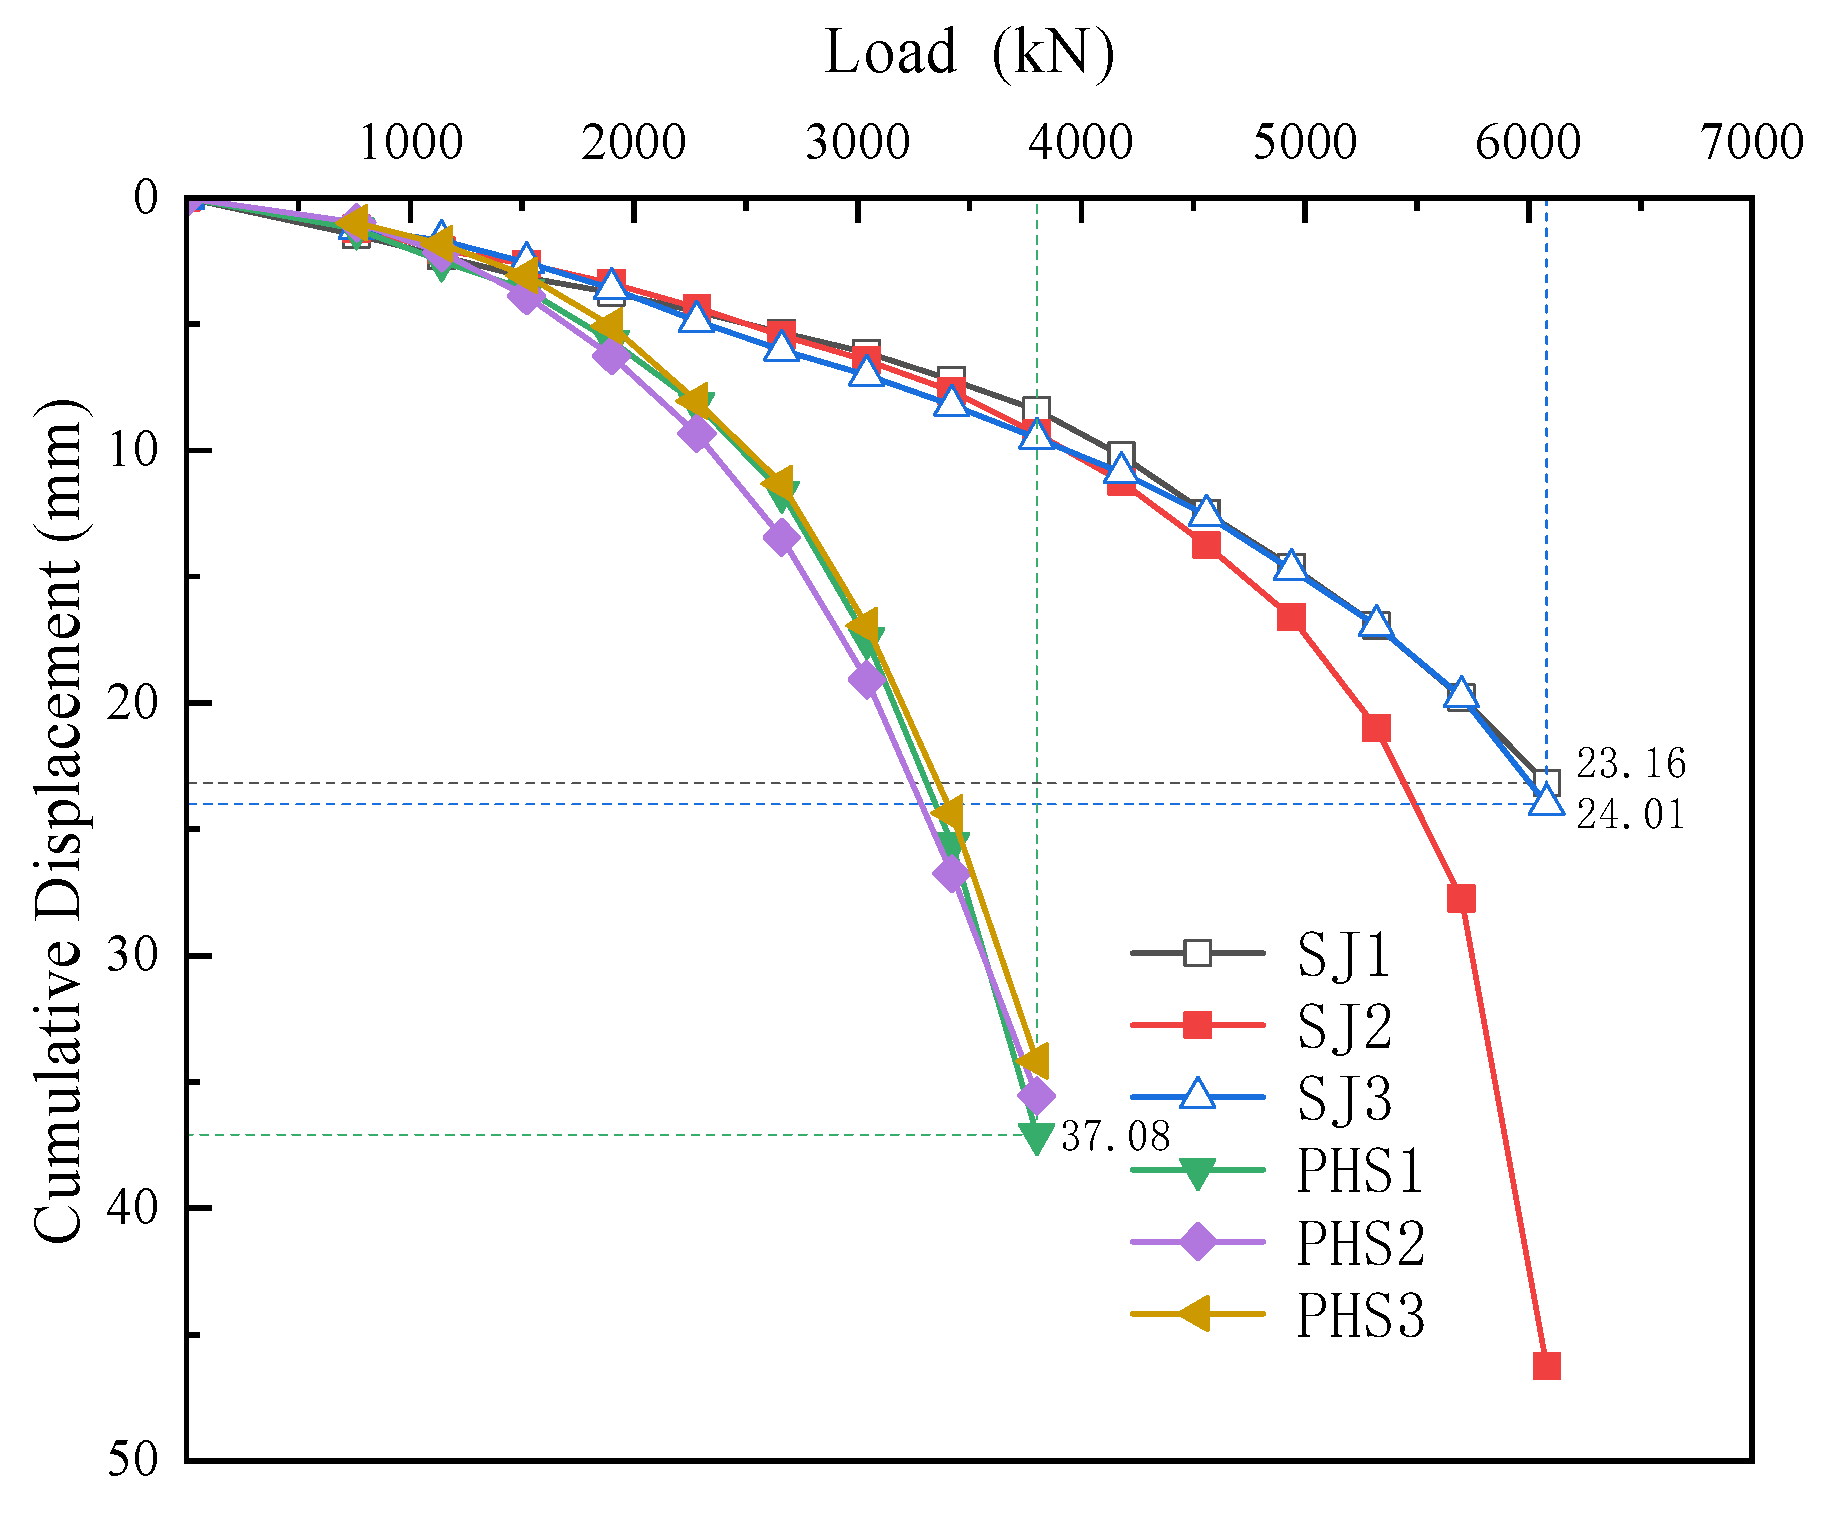
The RCPHS piles were loaded in 13 steps and unloaded in 7 steps, with a maximum test load of 6080 kN. The load–incremental-settlement (P–lgs) responses, which represent the displacement at the pile head, are plotted in
Figure 5 to illustrate the relationship between load and settlement.
SJ1 (loading): From 1900 kN to 6080 kN, per-step settlement increased monotonically. The minimum per-step settlement was 0.60 mm (at 1900 kN), and the maximum was 3.4 mm (at 6080 kN), with a range of 2.8 mm.
SJ2 (loading): Per-step settlement decreased from 760 kN to 1520 kN and then increased from 1520 kN to 6080 kN. The minimum was 0.6 mm (at 1520 kN) and the maximum was 18.5 mm (at 6080 kN), with a range of 18 mm.
SJ3 (loading): From 760 kN to 1140 kN, per-step settlement decreased due to early densification and adjustment. Subsequently, per-step settlement increased with the load. The minimum was 0.5 mm (at 760 kN) and the maximum was 4.3 mm (at 6080 kN), with a range of 3.8 mm.
When the applied load increased from 760 kN to 1140 kN, the incremental displacement exhibited a decreasing trend. This can be attributed to the initial loose state of the foundation soil, which caused larger settlements at the beginning due to primary consolidation or dilatancy adjustments. As loading progressed, the soil gradually transitioned into a working state, with improved stress transfer and more uniform contact pressure at the pile–soil interface. Consequently, the stiffness of the pile–soil system increased, leading to reduced displacement increments at subsequent loading stages [
33].
Due to damage to SJ2, only SJ1 and SJ3 were analyzed during unloading (
Figure 6).
SJ1 (unloading): From 5320 to 3040 kN, rebound increased; from 3040 kN to zero, rebound decreased. The minimum per-step rebound was 0.5 mm (5320 kN) and the maximum 1.9 mm (3040 kN), a range of 1.4 mm.
SJ3 (unloading): From 5320 to 1520 kN, rebound increased; below 1520 kN, it decreased. The minimum was 0.5 mm (5320 kN) and the maximum 2 mm (1520 kN), a range of 1.5 mm.
3.1.2. Full Loading–Unloading P–s Curves
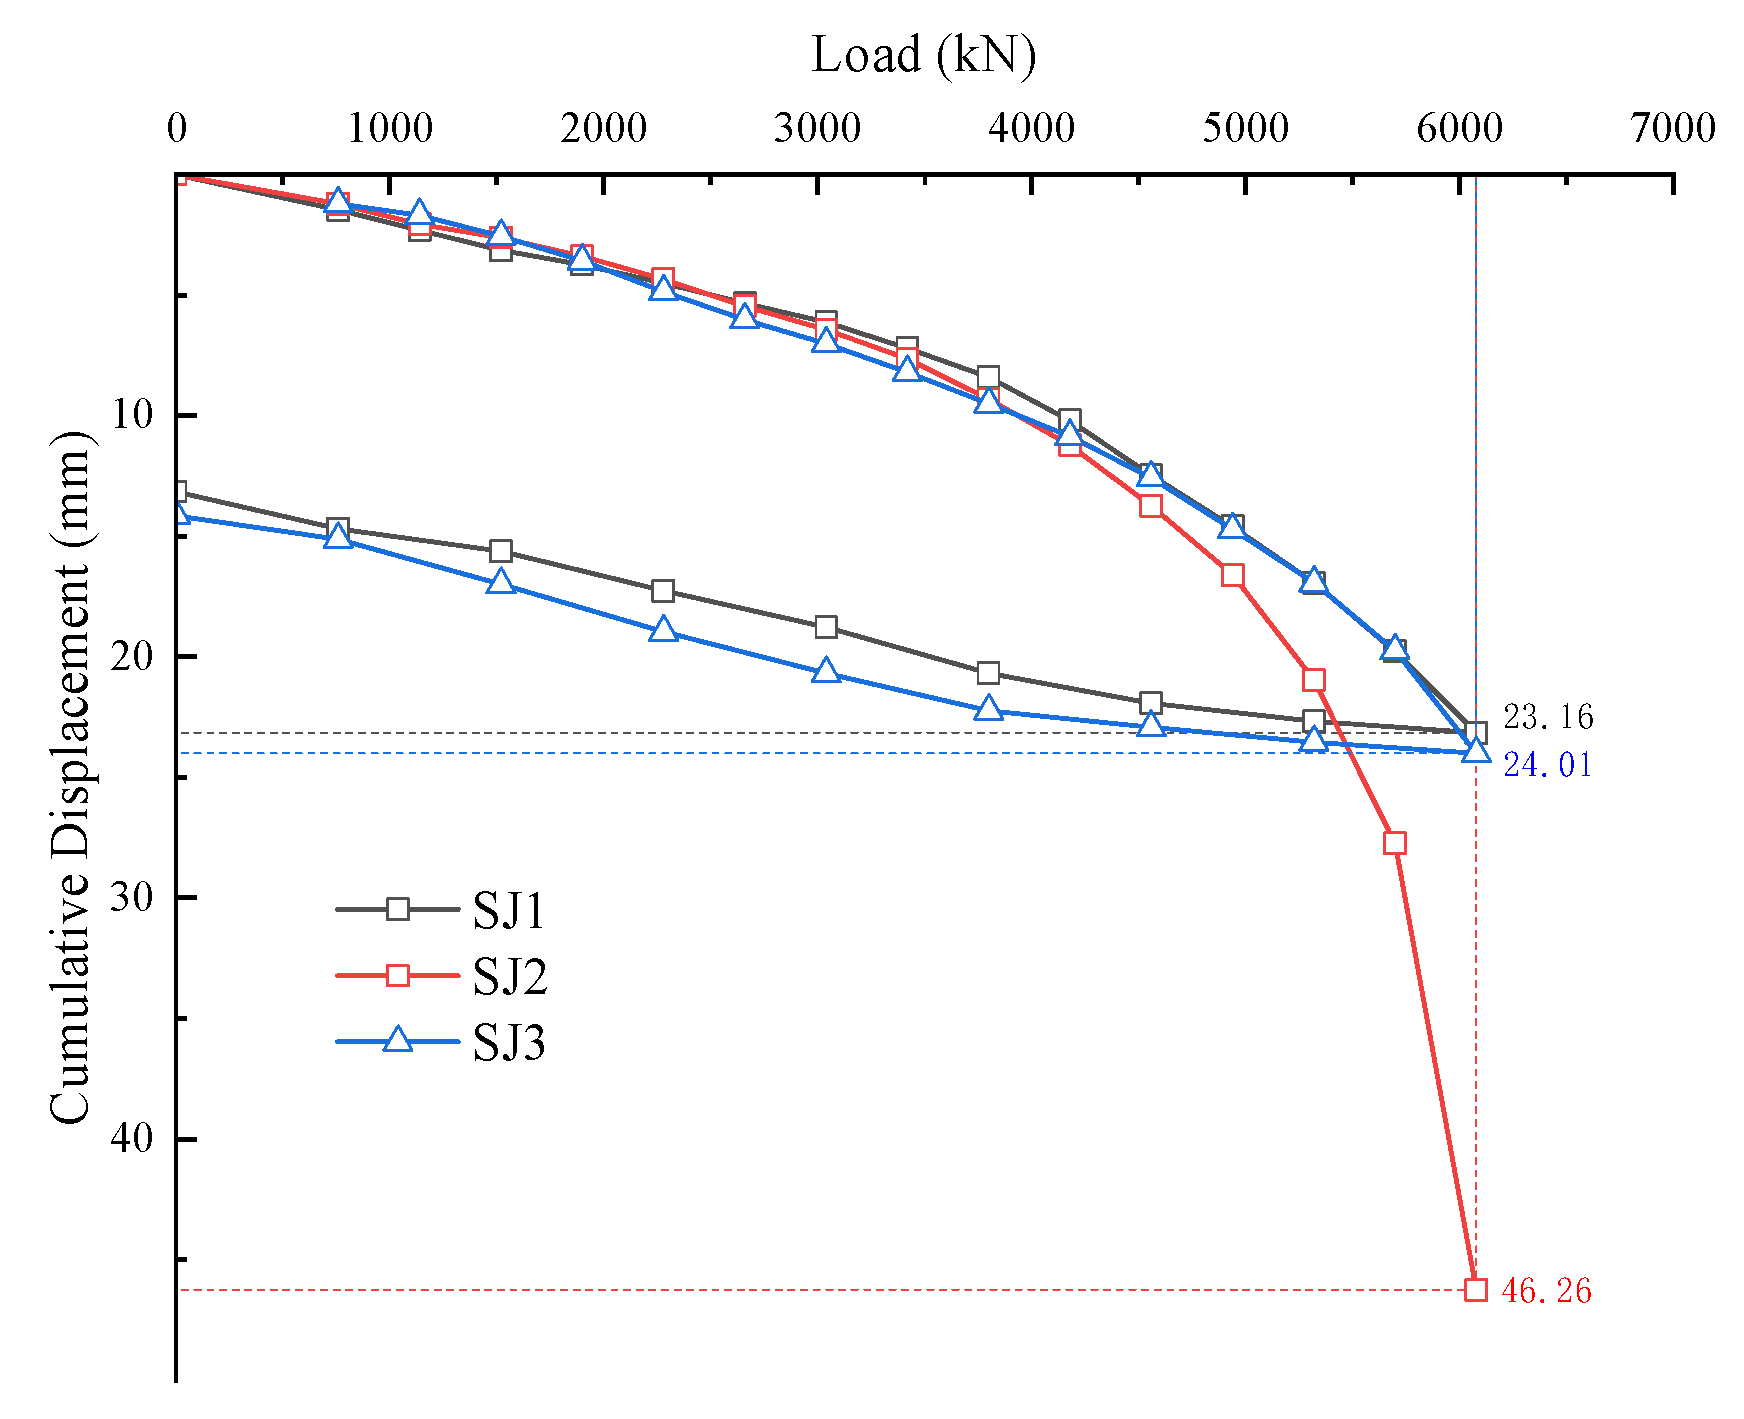
As shown in
Figure 7, SJ1 and SJ3 exhibit quasi-linear P–s behavior at low loads and parabolic growth at higher loads; settlement increases smoothly with no sudden jumps. During unloading, the response was approximately linear and did not return to the origin, indicating residual settlement. At 6080 kN, maximum settlements were 23.2 mm (SJ1) and 24 mm (SJ3); after full unloading, residual settlements were 10 mm for both piles, and the rebound ratios were about 43%. Both piles met the relative stability criterion at the maximum test load, implying the ultimate capacity is not less than 6080 kN [
21].
For SJ2, settlement increased smoothly until a sharp rise from 5700 to 6080 kN. At 6080 kN, the maximum settlement reached 46 mm, and the per-step increment exceeded twice that of the previous step; the test was terminated and the ultimate capacity was taken as the previous step (5700 kN).
The sharp rise in settlement observed for SJ2 can be attributed to several potential factors, as follows:
Micro-cracks or Voids in the Pile: During the construction process, micro-cracks or voids may have developed in the pile body. While these issues did not affect the acoustic integrity test, they could have contributed to sudden failure under high load conditions.
Installation-induced Deformation or Discrepancy: Another possibility is that SJ2 experienced some form of deformation or installation error, which did not immediately affect the acoustic integrity test. However, such discrepancies could have impacted the distribution of forces on the pile during loading, leading to excessive settlement or localized failure under higher loads.
3.2. Comparison with PHS Piles
By analyzing the vertical static load field test results of the SJ and PHS piles in
Figure 8, specifically the pile-head load–displacement curves, the following conclusions can be drawn:
At 3600 kN (the ultimate load for PHS), the pile-head settlements were 34.2, 35.5, and 37.1 mm (average 35.6 mm). Under the same load, the settlements for SJ1–SJ3 were 7.8, 8.4, and 8.8 mm (average 8.3 mm). Thus, the average settlement for PHS is about 4 times greater than that of SJ, indicating lower stiffness. The percentage difference in settlement is approximately 76.6%, demonstrating the improved stiffness of the RCPHS piles.
At a settlement of 23 mm, the PHS loads were 3133, 3071, and 3181 kN (average 3128 kN), while the SJ loads were 6080, 5442, and 6004 kN (average 5842 kN). Therefore, the capacity of SJ is about 2 times greater than that of PHS under the same settlement. This corresponds to a percentage difference of approximately 87%, highlighting the superior bearing capacity of the RCPHS piles.
The dataset includes three RCPHS and three PHS piles at a single sandy site; statistical inference is therefore constrained. Nonetheless, the improvement of RCPHS are significant (e.g., about 76% lower settlement at 3600 kN; about 87% higher capacity at 23 mm settlement), and trends are consistent across specimens. These factors support representativeness, while multi-site, multi-scale validation is planned.
At 3600 kN, the average settlement of SJ is about 77% smaller than that of PHS. At 23 mm settlement, the average capacity of SJ is approximately 87% higher. The RCPHS P–s response transitions smoothly from linear to nonlinear behavior, with minimal residuals and strong stiffness, reflecting enhanced shaft resistance due to improved casing–soil interlock under increasing load. The core–casing–soil triad exhibits a graded modulus and coordinated stress distribution, effectively transferring load across the section and into the surrounding soil.
The performance disparity primarily stems from the differing interaction mechanisms between end-bearing and shaft friction. P–s curve analysis from vertical static load tests indicates that RCPHS piles exhibit higher bearing capacity and a more gradual load-settlement response. This is attributed to the lateral expansion of the plain concrete shell under vertical compression, which generates outward pressure on the surrounding soil and enhances the frictional resistance at the pile-soil interface [
34].
Moreover, the RCPHS pile forms a tripartite system comprising the core, casing, and surrounding soil, with a gradient in elastic modulus and stress distribution. This configuration enables progressive stress transfer and coordinated deformation, reducing stress concentration and improving load distribution. In the core-casing-soil triad, stress transfer occurs through a synergistic interaction between the core, casing, and surrounding soil. Initially, the core pile bears the vertical load, with stress concentrated at the pile tip and transferring to the adjacent soil. As loading increases, the casing material, which provides significant lateral friction resistance, begins to share the load. This is particularly evident as the surrounding soil compresses and the lateral pressure increases. The interaction between these components enhances the overall load transfer efficiency, with the casing facilitating the transfer of stress from the core to the surrounding soil, resulting in a more effective and integrated load-bearing system [
35]. This synergy facilitates balanced load sharing, thereby significantly enhancing the overall bearing performance.
4. Finite-Element Modeling and Analysis
4.1. Model Development
The model was established based on the following assumptions:
- (1)
The soil is assumed to be isotropic.
- (2)
The pile core is considered as an elasto-plastic material, and the Mohr–Coulomb constitutive model is adopted to accurately represent its mechanical behavior, while the pile body is modeled using a standard linear elastic model. In addition, contact elements are introduced between the pile and the surrounding soil to simulate the actual interface conditions.
- (3)
To simplify the analysis, the deformation of the composite pile is assumed to be primarily induced by external loads. Specifically, for step 2, the self-settlement of the pile is considered to be complete, and its influence on further deformation is neglected.
- (4)
During the analysis, drainage consolidation of the surrounding soil and seepage within the soil are ignored, and the effect of pore water pressure is not considered, to simplify the calculation process [
36].
The ABAQUS finite element software (version 6.13) provides a powerful platform for conducting both linear and nonlinear static analyses in three dimensions, with results that align well with the actual construction process. Its flexibility in defining material properties, along with the use of interface models, enables accurate simulation of pile–soil interactions. In this study, ABAQUS was employed to simulate the stress–strain evolution between the pile and soil during the construction of RCPHS piles, as well as to capture the idealized ultimate bearing capacity. The load–displacement response during pile loading and the overall bearing behavior of composite piles were effectively reproduced [
27]. A three-dimensional numerical model was developed to represent the interaction among the precast concrete core pile, the plain concrete shell, and the surrounding sandy soil, incorporating field conditions. To minimize the boundary effects on the results, the model dimensions were set to 15 times the diameter of the plain concrete shell pile in the horizontal directions [
37,
38]. The final model dimensions were 7.5 × 7.5 × 12 m.
The material parameters are summarized in
Table 1 before. A surface-to-surface contact scheme was applied at the interface between the core pile and the plain concrete shell. The surrounding soil was modeled using the Mohr–Coulomb constitutive model, while the pile body was modeled as linearly elastic [
39]. It should be noted that while the Duncan–Chang model can better represent stiffness nonlinearity and dilatancy, it requires site-specific calibration that was not available for this study. In contrast, the Mohr–Coulomb parameters are fundamental geotechnical properties that can be readily determined from standard laboratory tests. Since accurately calibrating the complete set of sensitive Duncan–Chang parameters requires extensive experimental data that are often unavailable, a well-calibrated Mohr–Coulomb model was considered more reliable than a Duncan–Chang model with uncertain parameters. The contact interface was defined as frictional and deformable [
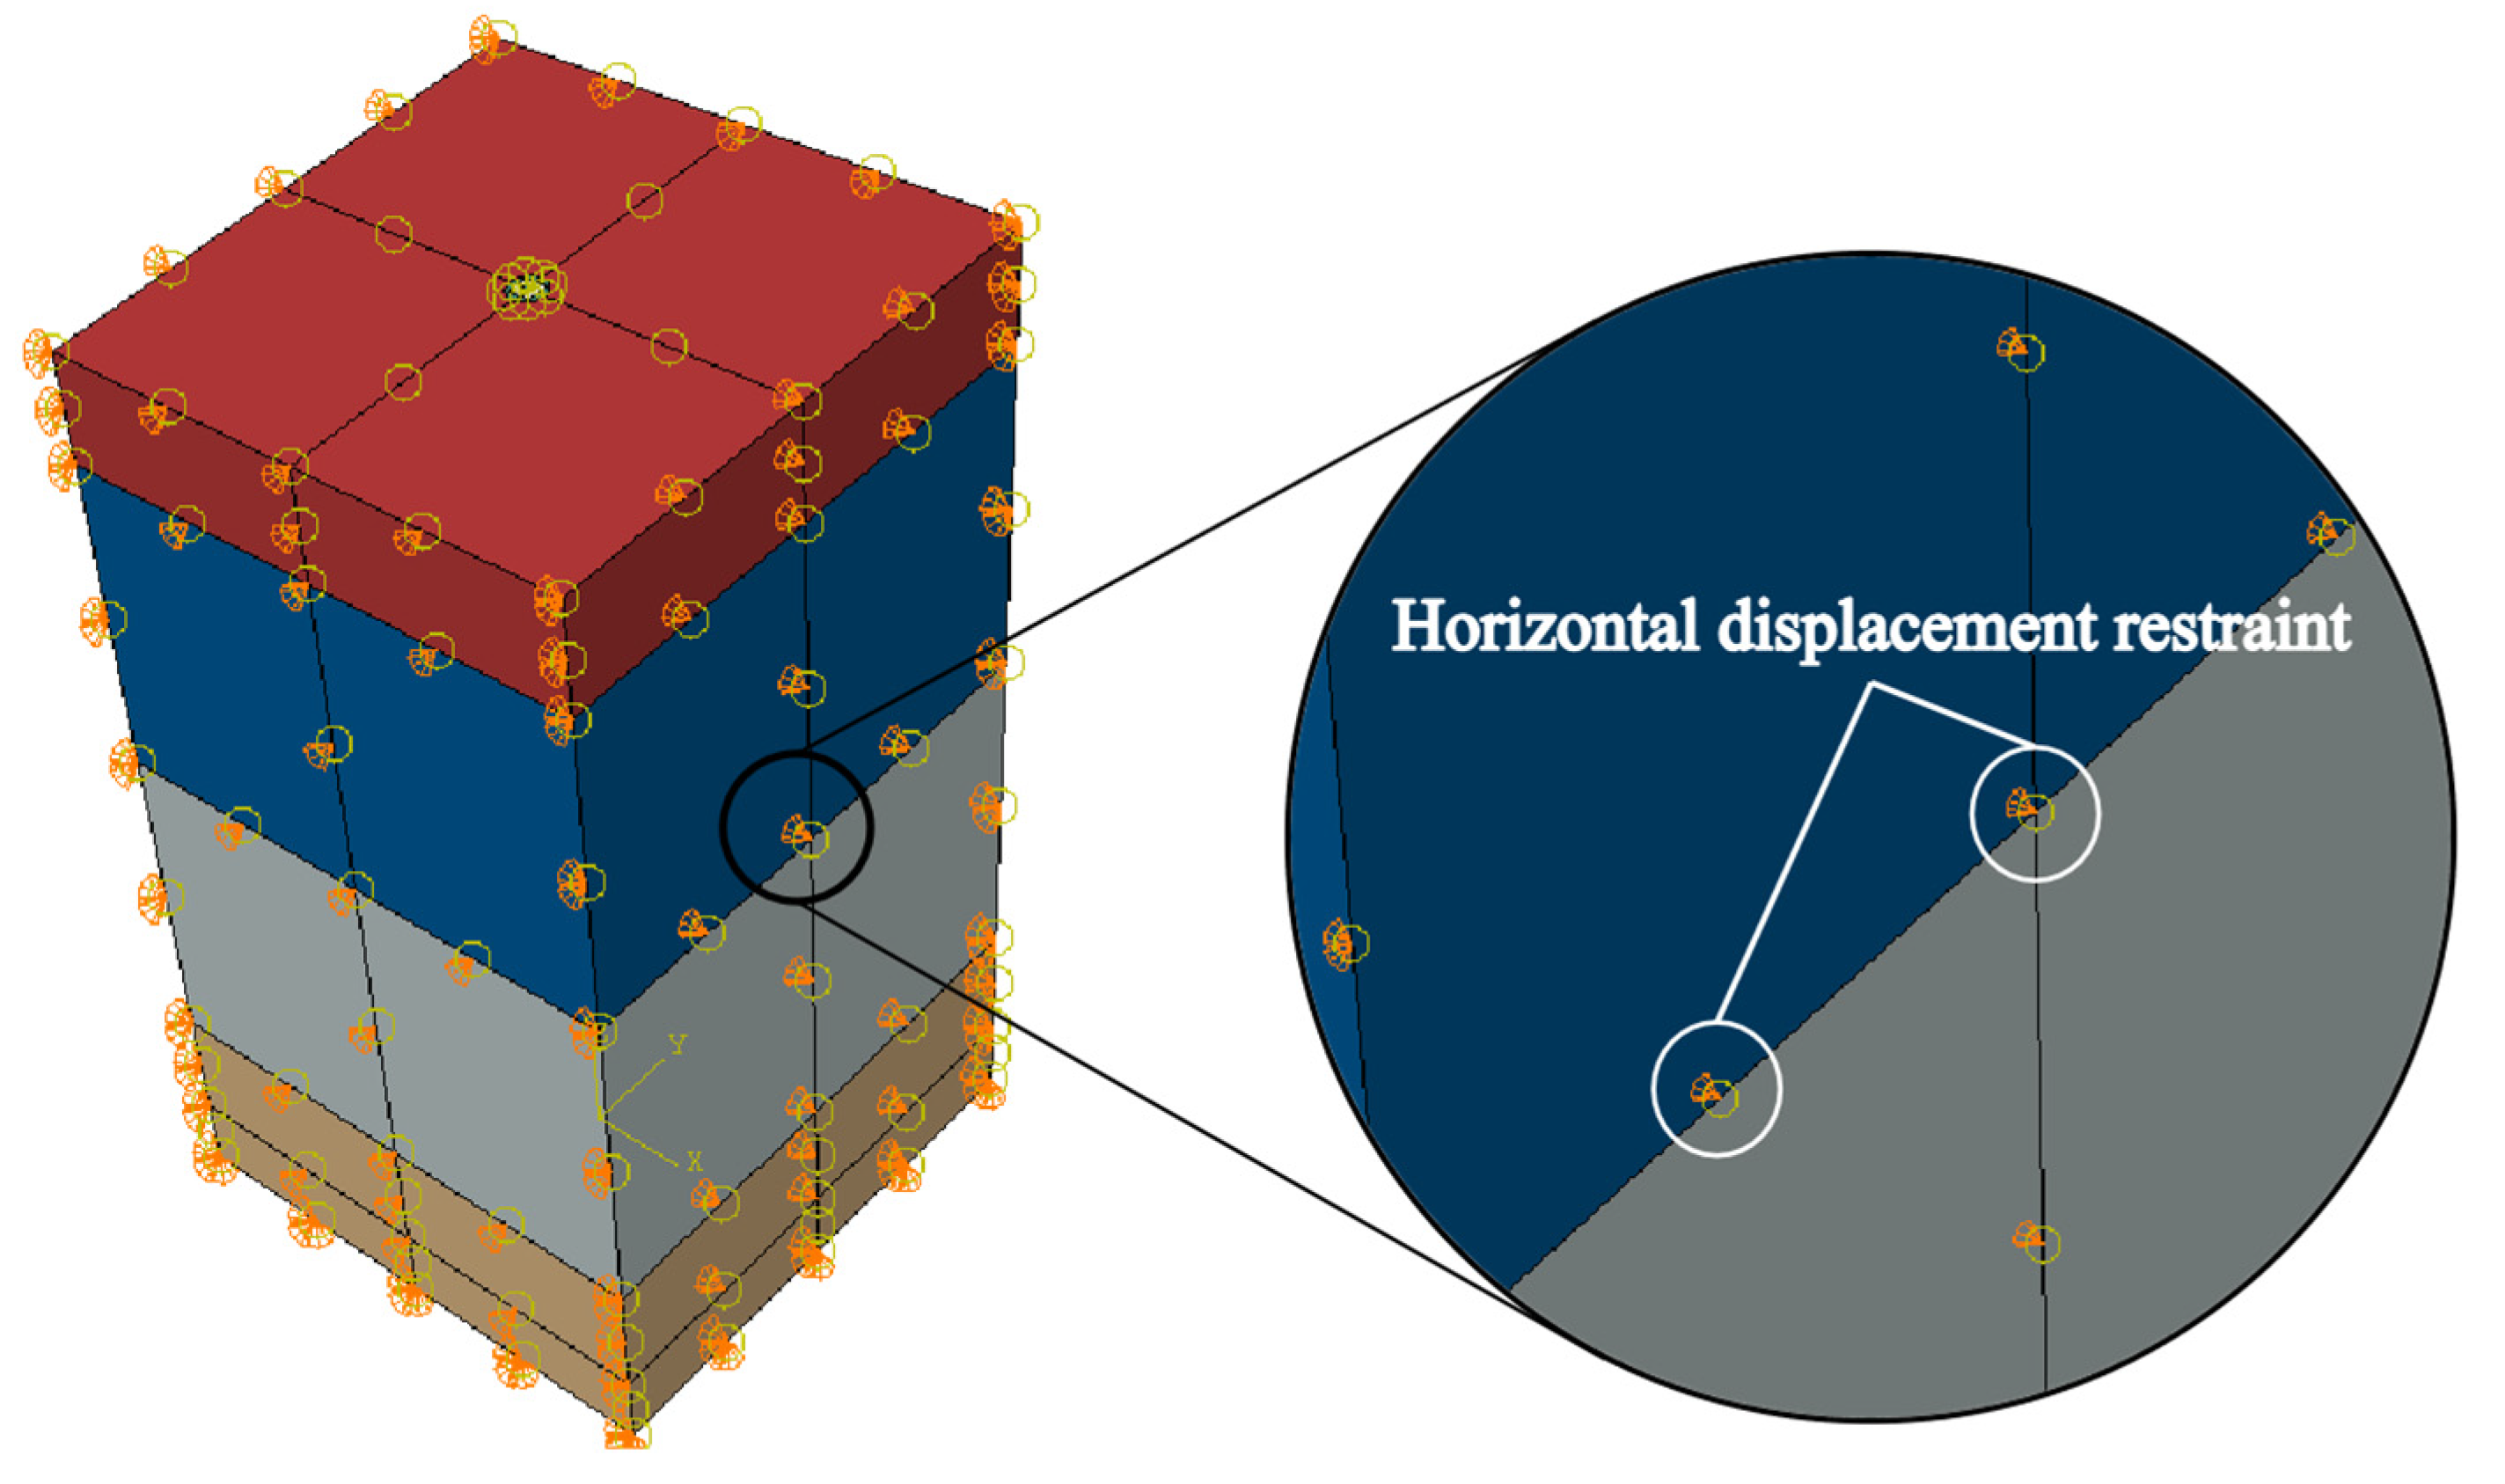
40]. The meshing scheme of the simulated test pile (sSJ) is shown in
Figure 9.
4.2. Boundary Conditions and Load Application
In the model, zero normal displacement boundary conditions were applied to the lateral and bottom surfaces of the surrounding soil to simulate the confinement and support provided by the soil to the pile, thereby preventing vertical displacement on these boundaries, as illustrated in
Figure 10. The computational model comprised two primary analysis steps: (1) the geostatic stress equilibrium step, in which the geostatic state was established using the Output Database (ODB, a file format used in ABAQUS to store the results of finite element analysis, including displacement, stress, and strain data, was utilized to import the stress field data for further analysis) import method, resulting in vertical displacements on the order of 10
−6 m after equilibrium; and (2) the loading analysis step, in which a stepwise loading method was employed to apply vertical loads at the top of the composite pile. A coupled loading scheme was adopted to ensure the loading plate dimensions matched those of the composite pile [
41]. Following the completion of the geostatic stress equilibrium, vertical loading was imposed on the pile body. To ensure consistency with the static compression tests of composite piles, the loading levels were set identically to those used in the field tests.
4.3. Results of FE Simulations
4.3.1. P–s Comparison
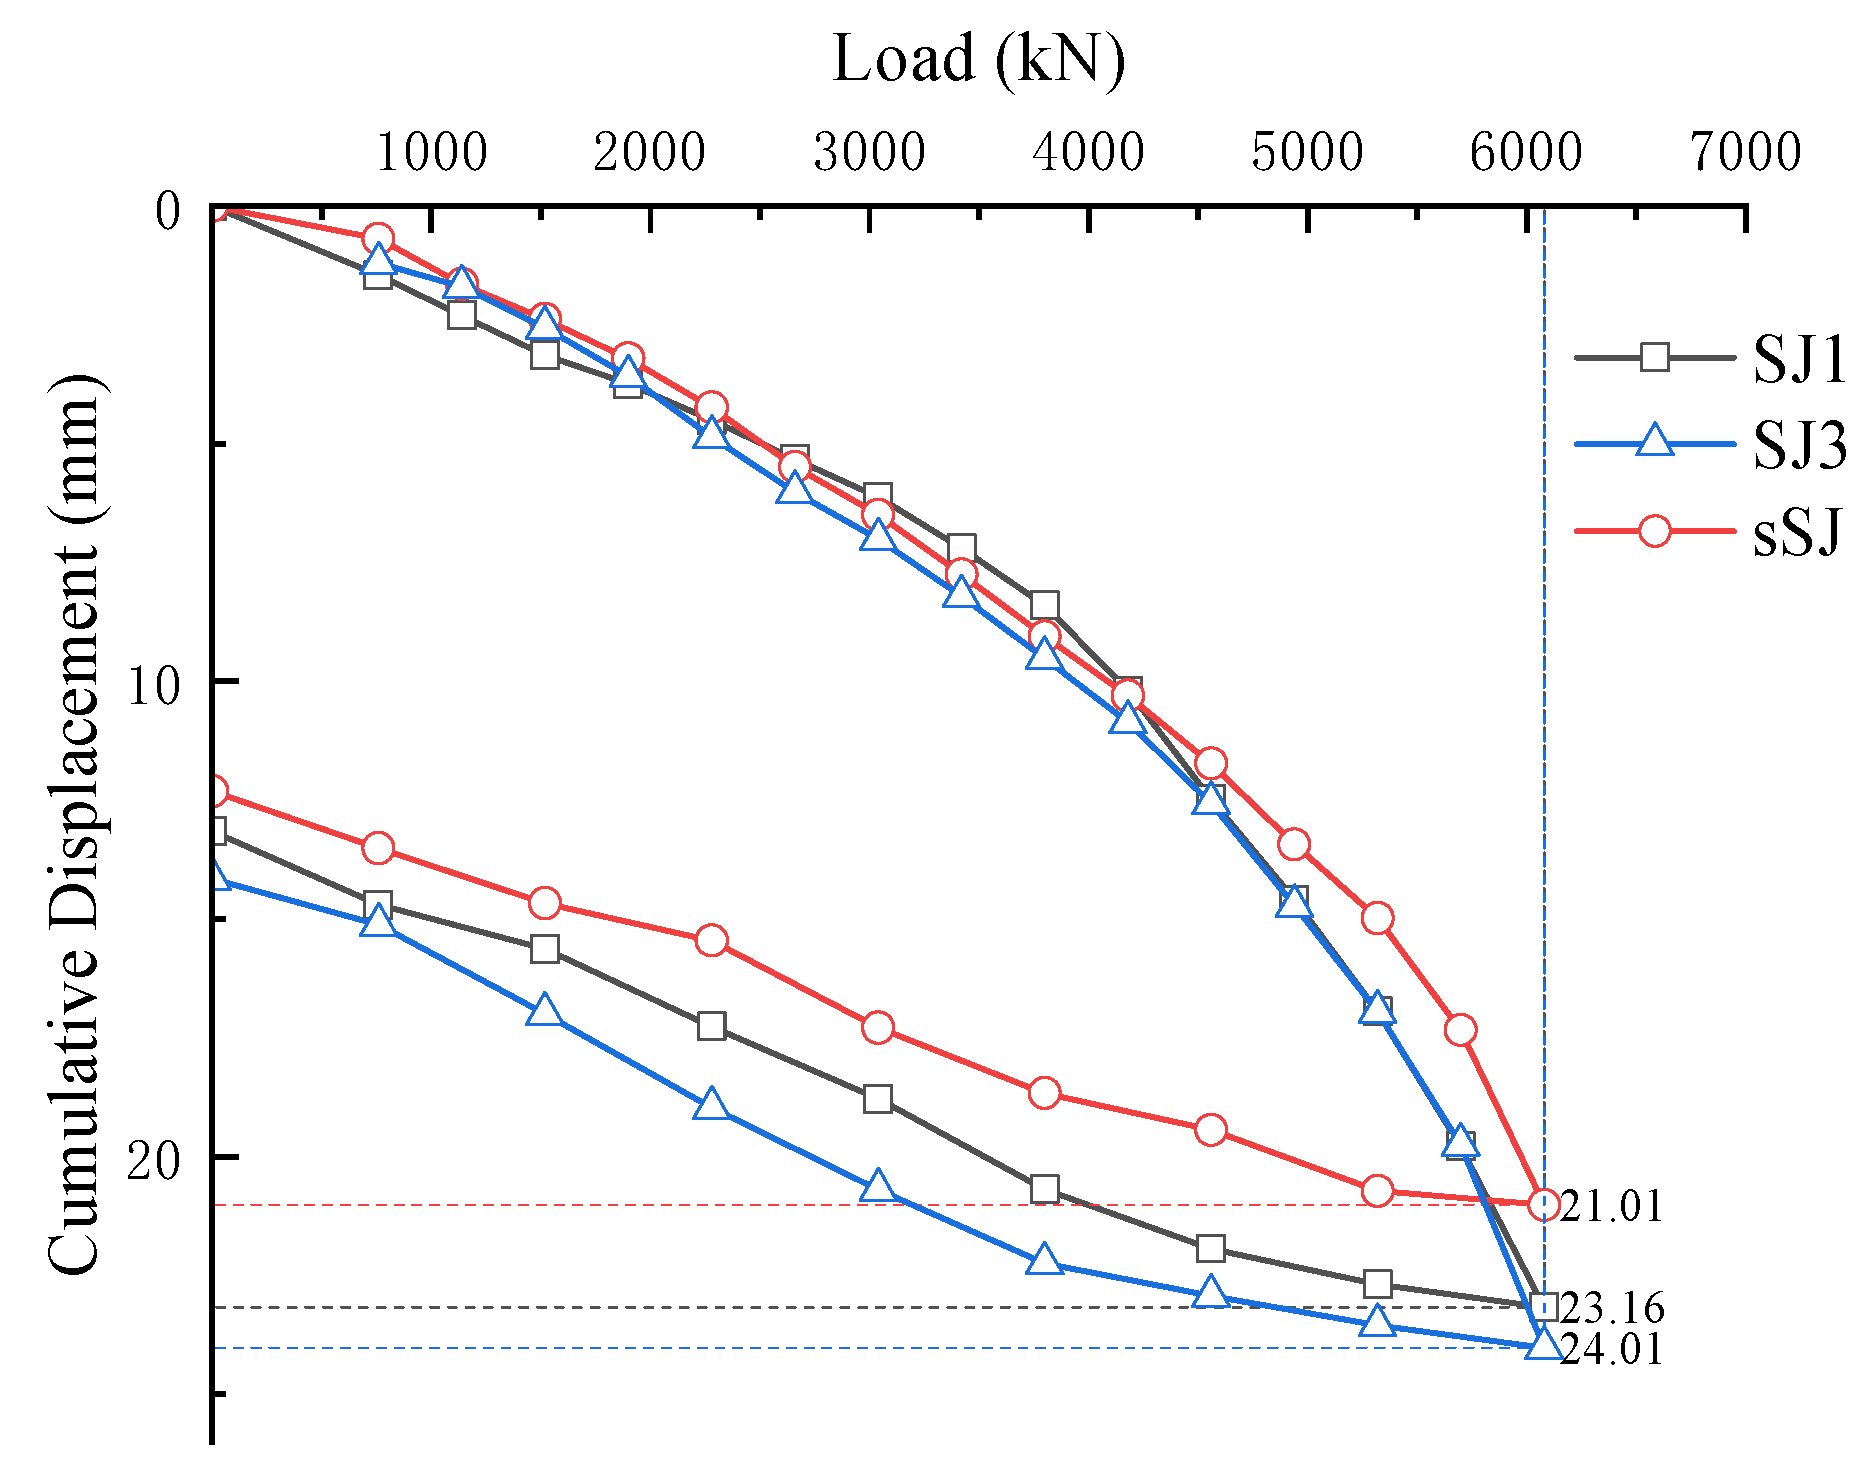
Based on the comparative analysis of the P–s curves between the field test piles and the finite element simulation piles in
Figure 11, it can be concluded that during both the loading and unloading stages, the vertical load–settlement curves of the proposed computational model exhibit a trend generally consistent with the finite element results, although certain deviations remain.
Through the comparative analysis in
Figure 11, the P–s curves of sSJ and SJ1/SJ3 exhibit consistent overall trends. In the low-load stage (0–4180 kN), settlement increases almost linearly with load, and the curves remain relatively smooth. When the load reaches 4180 kN, the P–s curves gradually assume a parabolic shape, entering the nonlinear growth region, which reflects the progressive approach of both the soil and the pile toward their ultimate states.
Throughout the loading process, the settlement of the sSJ pile remains consistently lower than that of SJ1 and SJ3. At a load of 4180 kN, the pile-head settlement of sSJ is 10.3 mm, compared to an average settlement of 10.5 mm for the test piles, yielding a difference of 0.2 mm and a relative error of 2%. At the maximum applied load of 6080 kN, the settlement of sSJ reaches 21 mm, while the test piles exhibit an average settlement of 23.6 mm, with the difference increasing to 2.6 mm and the error to 12%. These results indicate that although the absolute deviation between numerical simulation and field test settlement gradually increases with load, the overall trends of the load–settlement curves remain consistent.
4.3.2. Accuracy Analysis
The finite element model demonstrates good agreement with field test results in the low- to mid-load stages, with the simulated P–s curves accurately capturing the bearing characteristics of the pile foundation. The overestimation of capacity primarily occurs in the high-load stage; however, the error remains within an acceptable range [
35]. Potential sources of this discrepancy include:
- (1)
Idealized pile–soil contact parameters: a fixed friction coefficient was adopted, which does not dynamically reflect the evolving contact behavior of sand at different strain levels [
42];
- (2)
Simplification of the sand constitutive model: although the Mohr–Coulomb model can describe basic shear failure, it has limitations in representing densification, dilatancy, and large-deformation behavior of sand;
- (3)
Mesh sensitivity at the pile tip: despite mesh refinement within three pile diameters around the pile tip, the complex local deformation of sand may still introduce artificial stiffening effects.
Overall, the finite element model effectively reproduces the deformation characteristics and load-bearing trends of composite piles in sandy foundations during the low- to mid-load stages, with simulation errors remaining within engineering tolerance. This confirms the applicability of the numerical model for analyzing the bearing capacity of RCPHS piles in sandy soils. Future work should consider incorporating more advanced constitutive models (e.g., Duncan–Chang) and refining pile–soil contact parameter calibration to further improve predictive accuracy [
43].
4.3.3. Comparative Analysis of Multi-Size Models
Due to the inherent limitations of field testing on RCPHS piles, this study employed a parametric finite element analysis in ABAQUS to systematically evaluate the effect of core pile size on vertical bearing behavior, with comparisons drawn against conventional pile types. The model adopted the calibrated parameters established in
Section 2, while only the geometry and corresponding material properties of the core pile were modified. All other settings, including meshing, boundary conditions, contact definitions, and loading schemes, were kept consistent to ensure comparability [
44] (
Table 3).
4.3.4. Core Pile Effect
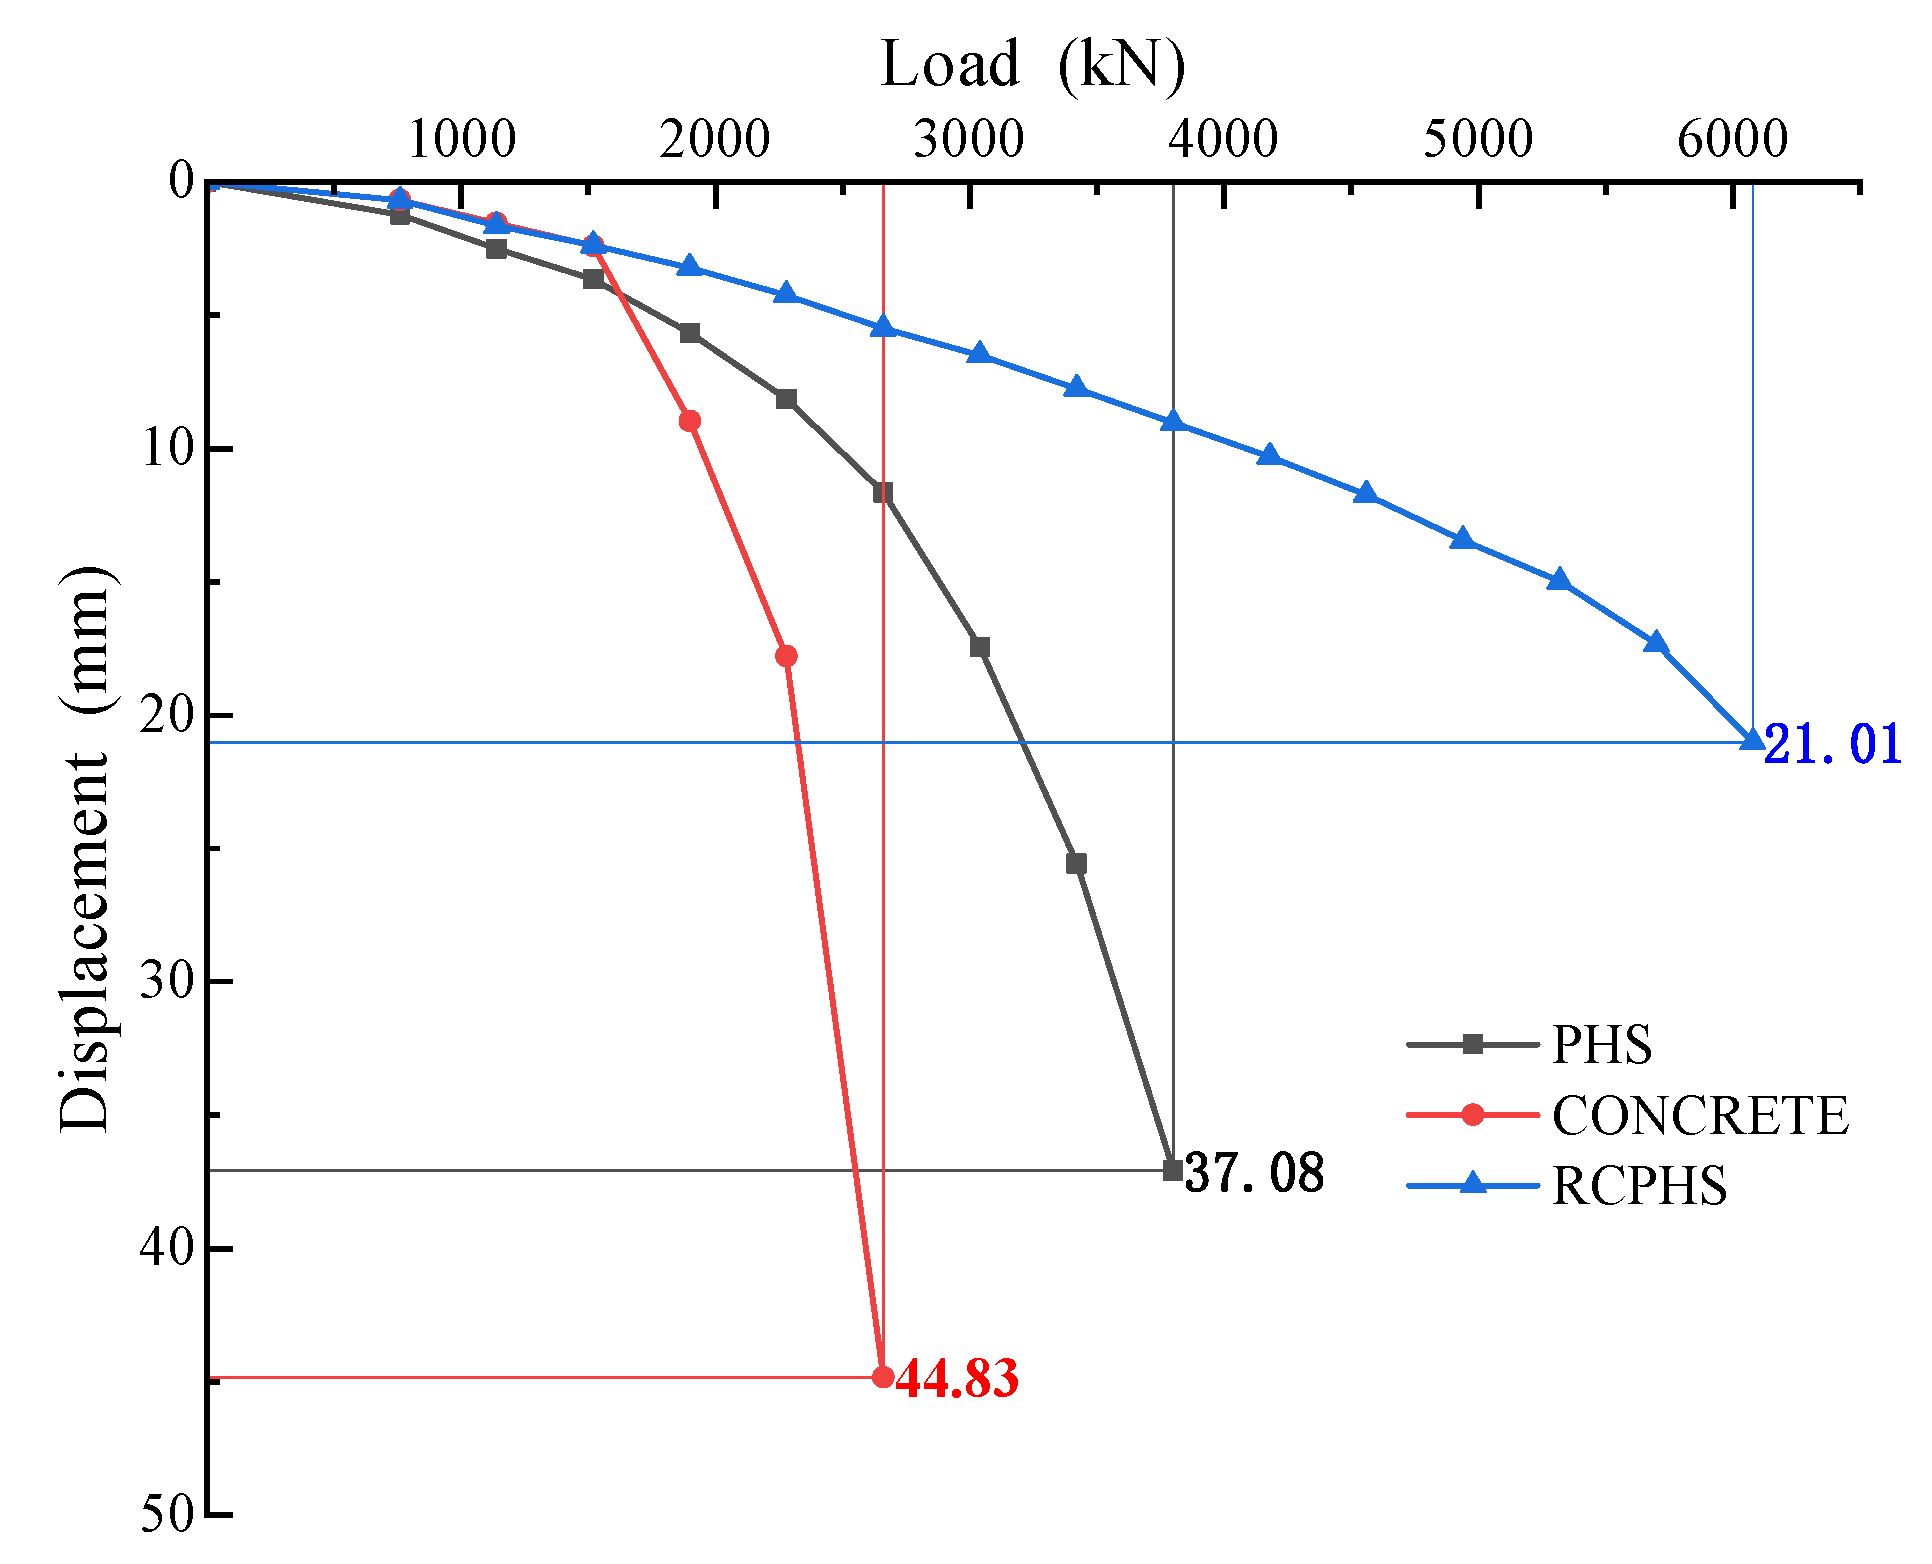
Figure 12 presents the load–displacement curves of piles under different core pile conditions, alongside the standalone PHS pile analysis in
Section 3.2.
The results indicate significant differences in mechanical behavior and deformation response among the three pile types, emphasizing the decisive role of structural configuration in bearing performance.
At small settlements, both the core pile and the composite pile show greater stiffness than the plain concrete shell pile, confirming that the core pile dominates early load resistance. In contrast, the plain concrete shell contributes little due to its lower strength and higher deformability. With increasing load, the plain concrete pile rapidly fails in the plastic stage, while the core pile curve flattens near the ultimate load of the plain concrete pile, suggesting it remains the principal load-bearing component and has not fully yielded.
Notably, the composite pile exhibits an ultimate bearing capacity far exceeding the simple sum of the core and shell contributions. This nonlinear enhancement arises from two mechanisms: (1) mutual confinement and synergistic interaction between the core and shell, which optimize stress distribution and stiffness; and (2) progressive mobilization of the shell with settlement, enabling stepwise load transfer and redistribution that enhance ductility and reserve strength [
45].
In summary, the RCPHS composite pile demonstrates a clear synergistic strengthening effect, characterized by superior stiffness development and substantial reserve capacity. These attributes support its use in complex foundation conditions and high-load scenarios, while highlighting the necessity of considering coupled core–shell interaction rather than treating them as independent units in pile capacity evaluation and structural design.
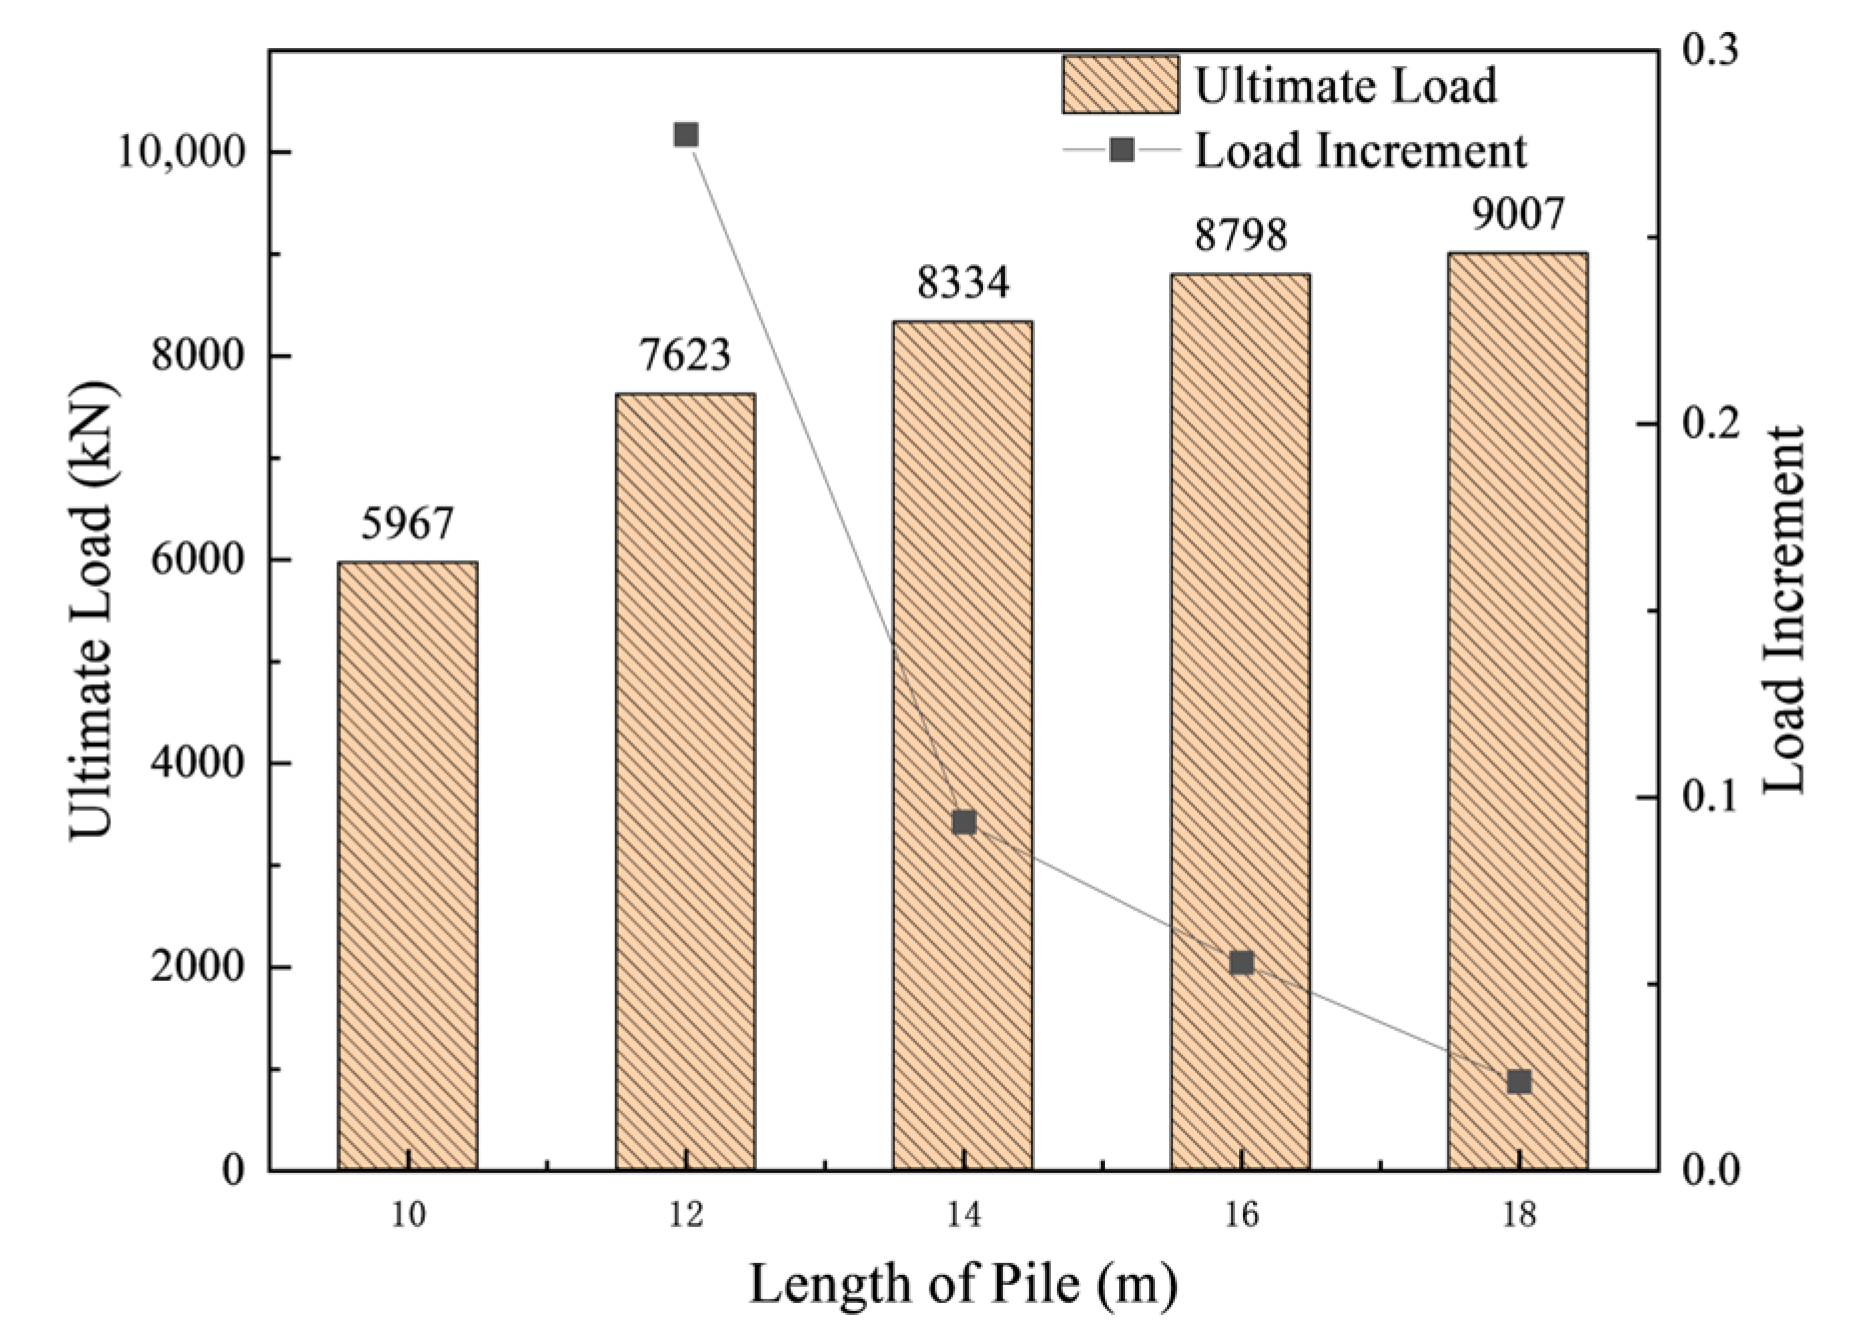
4.3.5. Influence of Pile Length
Figure 13 presents the ultimate bearing capacity curves of RCPHS piles under different pile lengths.
To determine the settlement-controlled ultimate load, the load corresponding to a pile head settlement of 40 mm was defined as the ultimate bearing capacity of a single pile, in accordance with relevant design codes [
21,
22]. As shown in
Figure 13, the ultimate bearing capacity of RCPHS piles increases in a stepwise manner with the increase of pile length. Specifically, for pile lengths of 10, 12, 14, 16, and 18 m, the ultimate bearing capacities are 5967, 7623, 8334, 8798, and 9007 kN, respectively, with growth rates of 27.8%, 9.3%, 5.6%, and 2.4%. These results indicate that the enhancement effect of pile length on bearing capacity diminishes as the pile length increases. When the pile length ranges from 10 m to 14 m, the increase in pile length contributes significantly to the ultimate bearing capacity. However, beyond 14 m, the growth rate of bearing capacity gradually slows down. When the pile length reaches 18 m, the improvement effect becomes negligible. Considering that the pile must effectively penetrate weak soil layers and be anchored in stronger bearing strata, as well as construction cost efficiency, a pile length of 12 m is considered optimal.
4.4. Analysis of Load Transfer Mechanism
To investigate the load transfer mechanism of rigid composite piles under vertical loading, further analysis is conducted from three perspectives: the axial force distribution along the pile shaft, the load-sharing ratio, and the axial stress ratio.
4.4.1. Axial Force Distribution
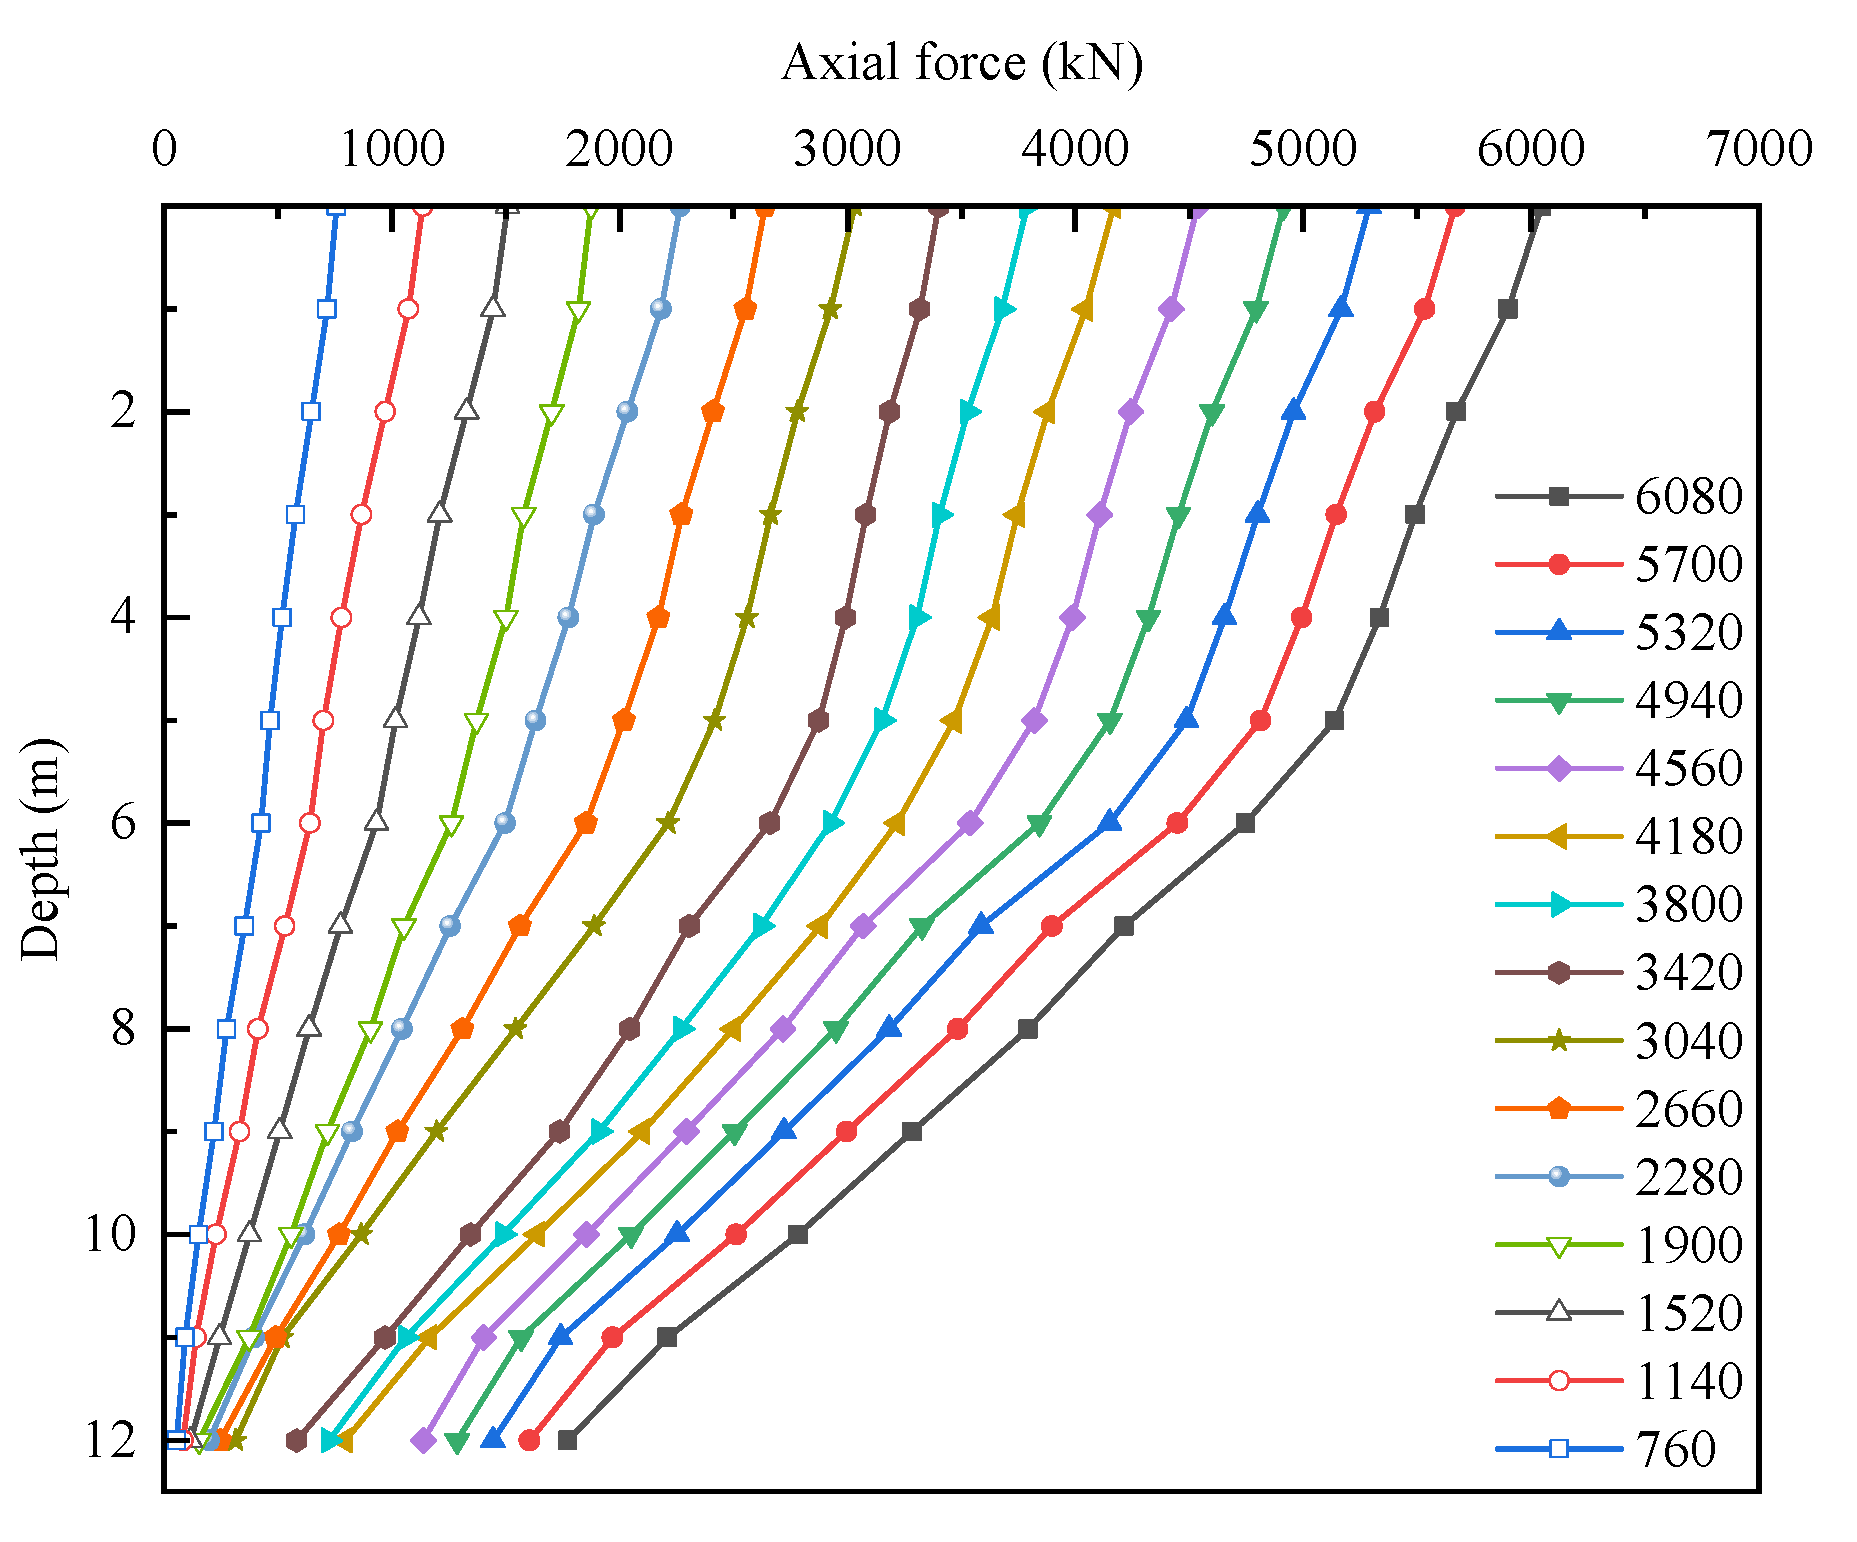
As illustrated in
Figure 14, the axial force distributions of the composite pile, the core pile, and the pile shell under different loading levels are presented.
With the increase in applied load, the slope of the composite pile’s axial force distribution curve becomes steeper, reflecting the progressive top-to-bottom load transfer and the gradual mobilization of shaft resistance. When the applied load exceeds 4180 kN, the shaft resistance becomes fully mobilized. Further load increments cause the axial force distribution curve to shift rightward in a nearly parallel manner, indicating that the pile end resistance begins to play a dominant role, accounting for approximately 29% of the total load. This behavior is mainly attributed to the relatively weak upper soil layers, which provide limited shaft resistance, thereby forcing a greater proportion of the load to be borne by the pile tip soil.
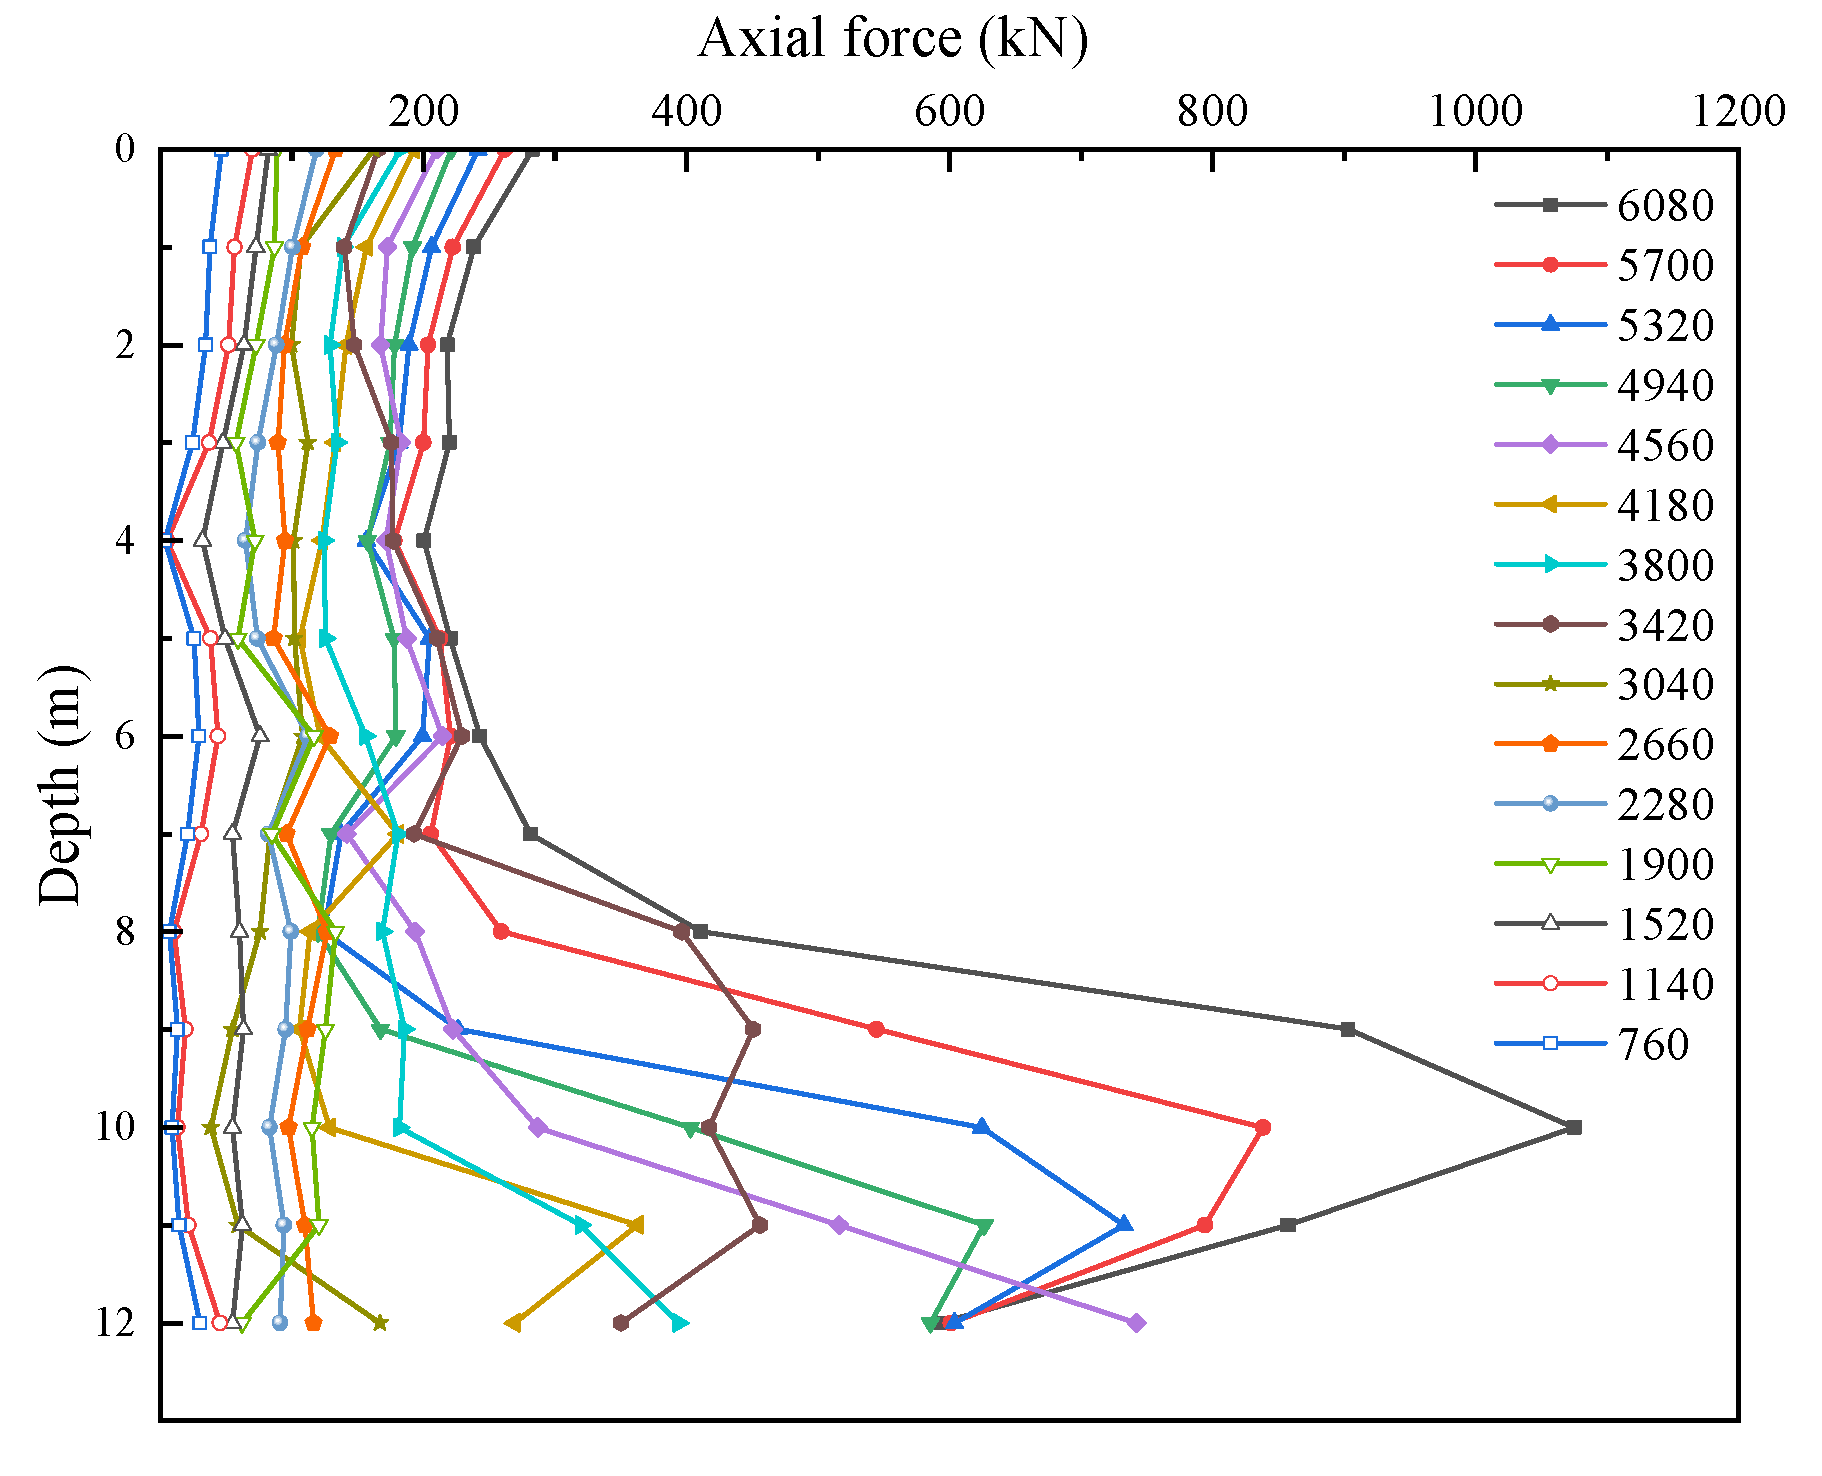
Similarly, the axial force distribution of the PHS core pile (
Figure 15) shows a trend consistent with that of the composite pile.
The key difference lies in the fact that, once the load exceeds 4180 kN, the slope of the core pile’s axial force distribution curve continues to increase with further loading, and the pile end resistance accounts for about 19% of the total load.
When the pile-head load is below 4180 kN, the axial force distribution of the plain concrete pile shell is characterized by relatively high axial forces at both the top and bottom, with lower values in the middle section. However, once the pile-head load exceeds 4180 kN, the axial force distribution of the pile shell exhibits a more complex variation. Within the depth range of 7–10 m, the axial force increases sharply. This phenomenon is mainly due to the weak soil layers above 6.1 m, which are unable to sustain additional loads, resulting in the load being predominantly transferred to the soil layers below 6 m.
4.4.2. Load Sharing Ratio
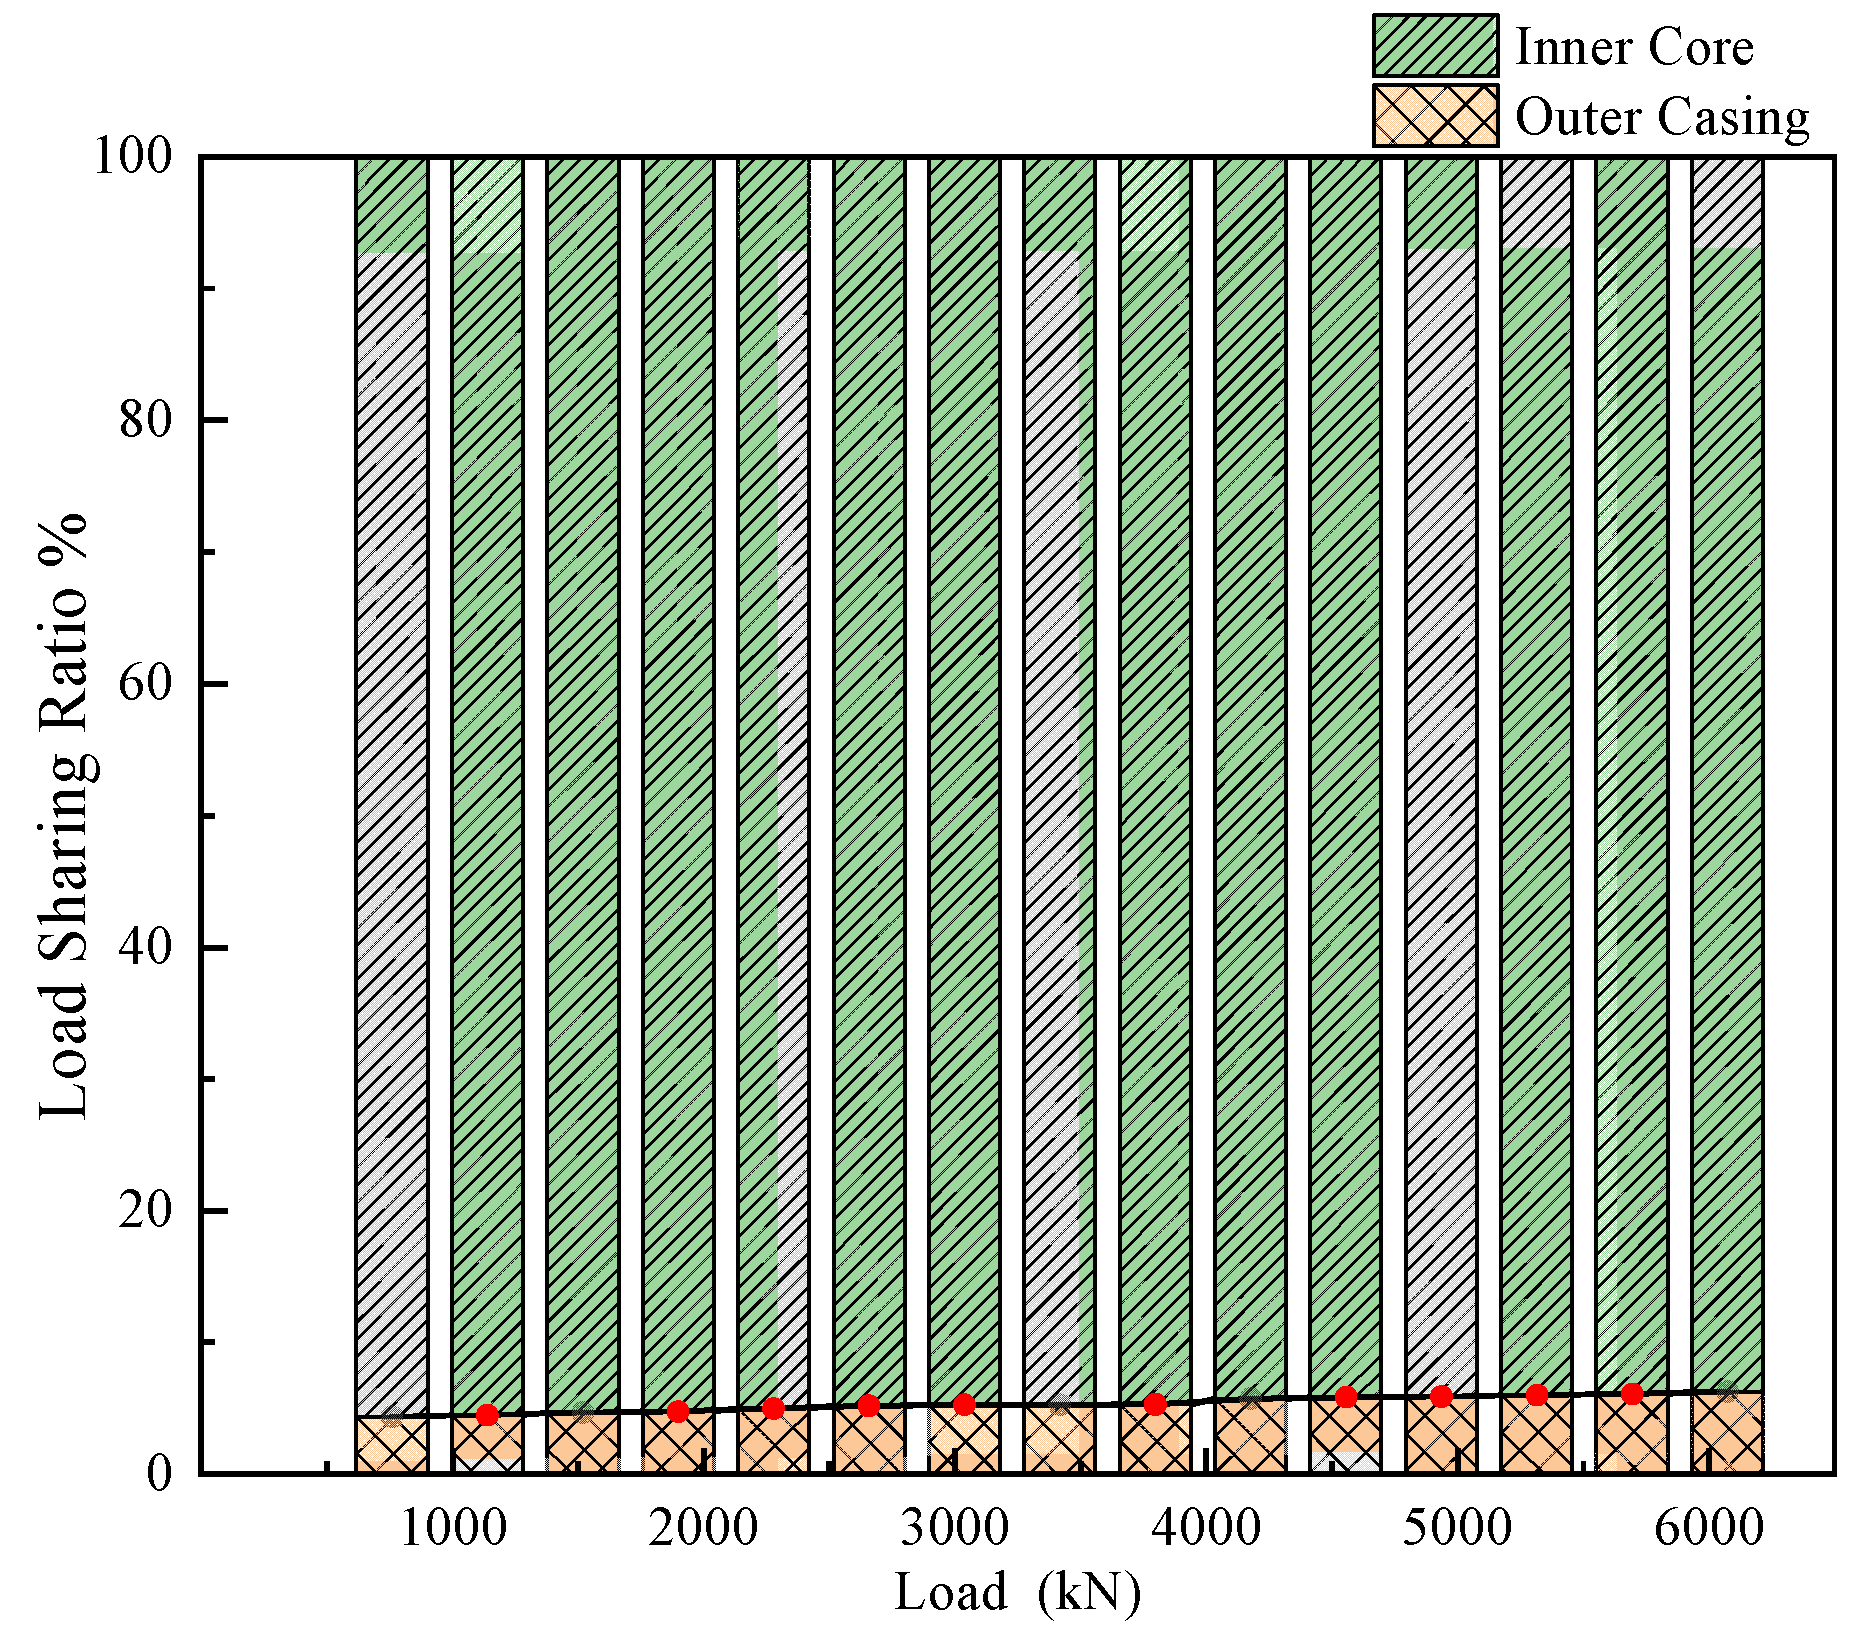
Under vertical loads ranging from 760 kN to 6080 kN, the load-sharing ratios of the core pile and the pile shell are illustrated in
Figure 17.
It can be observed that the core pile carries approximately 94% of the vertical load, while the pile casing accounts for only 6%. This finding demonstrates that, within the bearing system of reinforced composite piles, the core pile undertakes the vast majority of the vertical load, while the pile shell contributes only a minor share, primarily providing lateral frictional resistance. Furthermore, with the increase in vertical load, the proportion borne by the pile shell gradually rises; however, once the load exceeds 4560 kN, the rate of increase slows down.
4.5. Economic Evaluation and Regional Variability
Using a project in Tai’an (Media Convergence Demonstration Park) as an example, the geographic conditions of this project are particularly suited to the study of dense sandy soil, which aligns with the focus of the topic.
Table 4 compares the costs of Conventional Cast-in-Place Piles and the RCPHS Piles alternatives for the same total required capacity of 3,232,000 kN. In the case of a single pile design with a load-bearing capacity of 3500 kN, a total of 923 piles are required. The total cost for the RCPHS piles is 17,444,700 Chinese yuan (CNY), whereas the total cost for the Conventional Cast-in-Place Piles is 23,813,400 CNY. The RCPHS piles reduce costs by 6,368,700 CNY, representing a saving of approximately 36.5% compared to the Conventional Cast-in-Place Piles, while maintaining the same design bearing capacity of 3500 kN.
Regional Variability refers to the differences in material properties, construction practices, and environmental conditions that can vary significantly across different geographical locations. These variations can impact the cost, performance, and behavior of construction projects, including those involving foundations and piling systems.
In geotechnical engineering, regional variability can influence the following aspects:
Soil Properties: Soil characteristics such as type, density, cohesion, friction angle, and compaction properties can vary greatly depending on the region. These differences can significantly affect the design and performance of foundations and piles. For example, sandy soils in coastal areas might behave differently from clayey soils in inland regions.
Material Costs: The cost of materials, such as concrete, steel, and aggregate, can fluctuate based on regional supply chains, transportation costs, and local market conditions. These variations can influence the overall project cost, making it crucial to consider local pricing when estimating construction budgets.
Construction Practices: Different regions may have varying construction techniques and standards due to local practices, available technology, and regulatory requirements. For example, pile installation methods and equipment may vary depending on the region’s infrastructure and experience with specific soil types.
Environmental Conditions: Factors such as temperature, rainfall, and seismic activity can differ across regions and influence construction timelines, material performance, and safety standards. For example, extreme weather conditions like heavy rainfall can affect the construction schedule, while areas with higher seismic activity might require more robust foundation designs.

