Article

Seismic Performance of Existing Reinforced Concrete L-Shaped Columns Strengthened with Wing Walls

College of Civil and Transportation Engineering, Shenzhen University, Shenzhen 518060, China
*
Author to whom correspondence should be addressed.
Buildings 2025, 15(20), 3645; https://doi.org/10.3390/buildings15203645
Submission received: 6 September 2025 / Revised: 1 October 2025 / Accepted: 8 October 2025 / Published: 10 October 2025
(This article belongs to the Special Issue Strengthening and Rehabilitation of Structures or Buildings)

Abstract

In this study, the seismic performance of reinforced concrete (RC) L-shaped columns, strengthened with 100 mm and 150 mm wing walls, was determined using quasi-static tests. A total of nine L-shaped column specimens were designed and tested under cyclic loading. This study found that strengthening with wing walls increased the lateral stiffness and horizontal load bearing capacity of L-shaped columns. Notably, such improvement was found to be more significant under higher axial compression ratios, exhibiting maximum increases of 254% and 194% in load bearing capacity, in the positive and negative loading directions, respectively. Additionally, ductility was influenced by the wing wall length and axial compression ratios. Under a low axial compression ratio, the ductility coefficient first increased and then decreased with an increase in the wall length. Conversely, under a high axial compression ratio, ductility was consistently improved with increasing wall length. Furthermore, finite element (FE) models were established, and they successfully validated the experimental results, such as load–displacement responses, hysteresis behavior, skeleton curves and ultimate bearing capacity. The numerical results further strengthened the significant effect of the wing wall addition on the seismic performance of the L-shaped columns. Based on the results, a lateral capacity calculation formula is developed, providing a reliable method for assessing the seismic performance of the strengthened L-shaped columns. Therefore, the findings of this study present theoretical insights and practical guidance for the seismic retrofitting of existing RC structures with special-shaped columns.

1. Introduction

Earthquakes are among the most destructive natural hazards, and result in severe damage to buildings and infrastructure [1,2]. The dynamic and irregular nature of seismic loads put significant demands on structural systems, where columns play a significant role in ensuring the overall stability and safety of a structural system [3]. To meet both architectural and functional (safety) requirements, special-shaped columns such as L-, T-, and cross-shaped (+) columns have been widely employed in residential buildings owing to their advantages of avoiding column protrusion from walls and increasing the indoor area [4,5,6,7,8,9,10]. L- and T-shaped columns can be employed as corner and edge columns, respectively, based on their location within a structure. Consequently, special-shaped columns are highly favored by both designers and users. Reinforced concrete (RC) frame structures with special-shaped columns have been extensively employed in residential construction for over two decades [11]. However, several of these structures no longer comply with the current seismic design standards due to revisions and upgrades to the seismic codes. Additionally, the progressive aging and deterioration of concrete materials over time further compromise the structural performance. Hence, there is an urgent need to reassess the seismic performance of the existing special-shaped column structures and to develop effective strengthening strategies [12,13].
Extensive research has been conducted over the past three decades to develop effective strengthening techniques for existing RC structures to enhance their strength and ductility. The strengthening methods used for existing RC columns primarily involve direct strengthening techniques, such as cross-section enlargement [14,15,16], carbon-fiber-reinforced polymer (CFRP) wrapping [17,18,19], and steel plate bonding [20,21,22]. Although these methods have been extensively employed for conventional rectangular columns, limited research has been conducted on their application to special-shaped columns. Cross-sectional enlargement reduces the interior space utilized, thereby contradicting the architectural intent of special-shaped columns. CFRP wrapping and steel plate bonding also face significant challenges owing to the complex geometries and numerous inflection points inherent to special-shaped columns, thereby presenting higher material consumption and reduced bonding efficiency [23]. Conversely, the wing wall strengthening method presents a simple but efficient solution by installing wing walls on all sides of a column to improve lateral stiffness and enhance seismic performance [24,25]. During seismic events, added wing walls are designed to yield and crack prior to the original columns, thereby dissipating the seismic energy and improving the overall structural seismic performance [26]. When compared with conventional methods, wing wall strengthening presents superior adaptability to the geometry of special-shaped columns, thereby enhancing both the lateral stiffness and load bearing capacity while maintaining the original architectural profile of the column without protrusions. Therefore, wing wall strengthening is considered to be one of the most prevalent techniques for retrofitting existing RC columns, and it has received significant research attention, resulting in practical advancements in enhancing structural seismic performance.
In the past, several studies investigated the seismic performance of RC columns strengthened with wing walls [27,28,29,30,31,32]. Liu et al. [27] conducted quasi-static tests on 11 plain and wing wall-strengthened RC column specimens and analyzed the effect of wing wall length, width, concrete strength, and reinforcement. Their results indicated that wing wall strengthening significantly increased the seismic performance of RC columns. It was found that when the wing wall width was increased to twice as that of the column, the shear capacity of the specimen was increased by approximately four times. Klatakci and Yavuz [28] analyzed the seismic behavior of RC frames using three 1/3-scale, two-story, two-span frame specimens subjected to low-cycle lateral loading. The results indicated that wing wall strengthening significantly improved the frame strength, stiffness, and energy dissipation capacity. However, a reduction in the structural ductility with an increase in the wing wall length was observed. Bai et al. [29] evaluated the impact of the wing wall arrangement through pseudo-dynamic and quasi-static tests. Longitudinal wing walls effectively reduced the severity of column damage and prevented collapse, while transverse wing walls suppressed brittle shear failure in short columns and beam–column joints. Yang et al. [30] developed a 1/4-scale, three-story RC wing wall frame model based on the damaged Beichuan Salt Bureau building from the Wenchuan earthquake. Shaking table tests and numerical simulations indicated the load bearing mechanisms of wing wall strengthening and demonstrated its effectiveness in improving seismic performance and collapse resistance. Furthermore, Li and Sanada [31,32] analyzed RC beam–column joints that were strengthened with wing walls. The quasi-static tests and simulations conducted on these joints demonstrated that symmetrically arranged bilateral wing walls significantly enhanced the joint’s seismic performance, increasing the peak bending moments by up to 80% and shifting the failure modes from brittle joint rupture to ductile beam yielding. Additionally, it was reported that inner-wing strengthening was more effective than outer-wing strengthening. Wang et al. [33] extended the research to steel-reinforced-concrete (SRC) column-to-RC beam composite joints and employed quasi-static cyclic loading tests. The results indicated that the wing walls significantly improved the seismic performance, with longitudinal and transverse–longitudinal configurations increasing the maximum bearing capacities by 25% and 142%, respectively, when compared with the unreinforced joints. Zhang et al. [34] compared a single-span RC frame and an identical wing wall-strengthened frame using shaking table tests under 20 simulated earthquake scenarios. It was found that bidirectional wing wall strengthening reduced peak floor displacement responses by 30–40%. Conclusively, these studies demonstrated that wing wall strengthening effectively enhanced the seismic performance of the existing RC structures. However, optimal design requires careful consideration of the layout configuration, the dimensional parameters, and strengthening to balance strength enhancement with ductility preservation.
Several studies have been conducted on the structural system of RC special-shaped columns. However, limited research exists on the seismic performance of RC L-shaped columns strengthened with wing walls, and the calculation method for their ultimate carrying capacity remains uninvestigated. To address these gaps, this study aims to comprehensively assess the seismic performance enhancement of such strengthened columns, with a key focus on systematically investigating the interaction effect between wing wall length and axial compression ratio, and establishing the bearing capacity formula applicable to L-shaped columns. In this study, nine L-shaped columns were fabricated in the test, including three specimens each for the un-strengthened series and the series strengthened with wing walls measuring 100 mm and 150 mm in length. The three specimens under each strengthening condition were subjected to axial compressive forces of 287 kN, 344 kN, and 401 kN, respectively, and low-cycle reversed loading tests were conducted to investigate the effect of axial compression ratio and wing wall length on the strengthening effect. In addition, the finite element (FE) model established using DIANA v10.10 software was used to simulate the test results. Furthermore, a calculation method for the ultimate carrying capacity is proposed based on the results obtained from the experimental results and FE analyses, thereby providing theoretical support and practical guidance for the design of wing wall-strengthened existing special-shaped columns.

2. Framework

The framework of this study is shown in Figure 1, which comprises experimental, numerical and analytical investigations. During the experimental investigation, nine different L-shaped columns were constructed, which included three un-strengthened control specimens and six specimens strengthened with wing walls. A quasi-static loading test was applied to investigate the effect of wing wall strengthening on L-shaped columns. Later, different results, i.e., failure patterns, hysteresis curves, ductility index, skeleton curves, stiffness degradation, strain relations, etc., were used to highlight wing wall strengthening on L-shaped columns. Later, during the numerical investigation, FE analysis was conducted to simulate the experimental results and further extend the investigation using parametric effects. The numerical results also confirmed the significance of wing wall strengthening. Finally, the equation for the computation of the load bearing capacity of L-shaped columns was proposed based on experimental and numerical investigation.

3. Experiment Program

3.1. Specimen Design and Fabrication

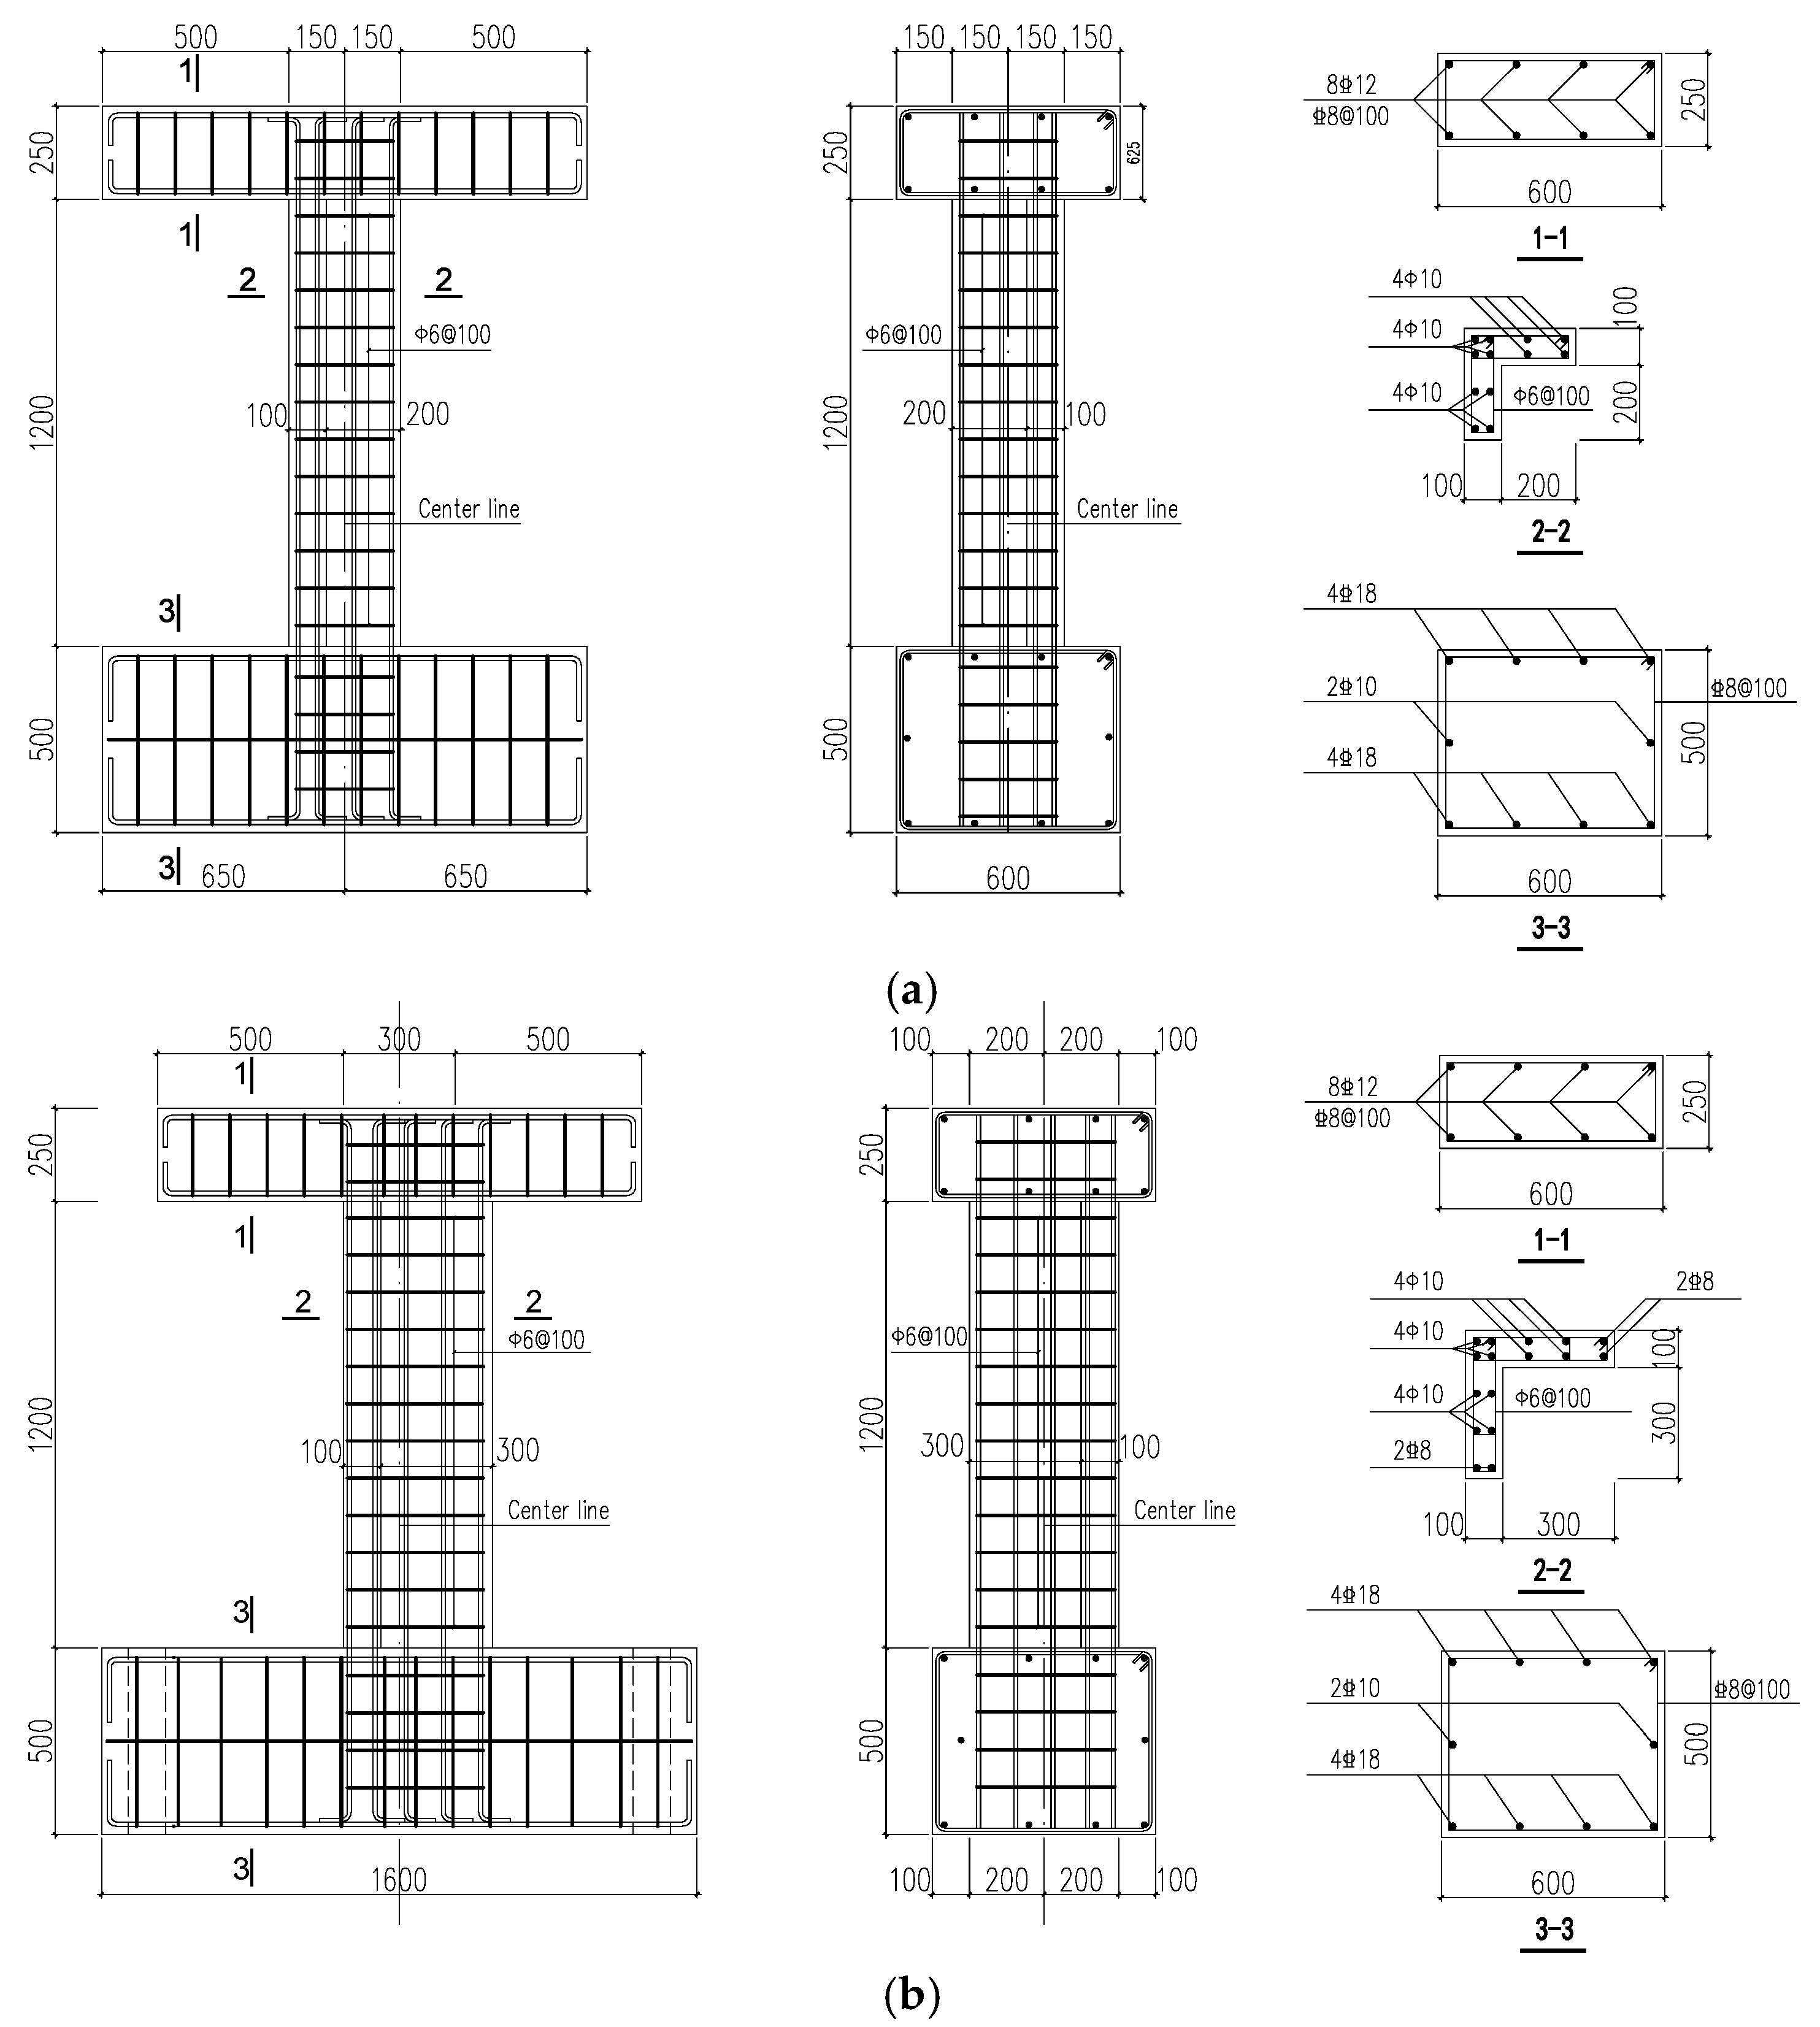
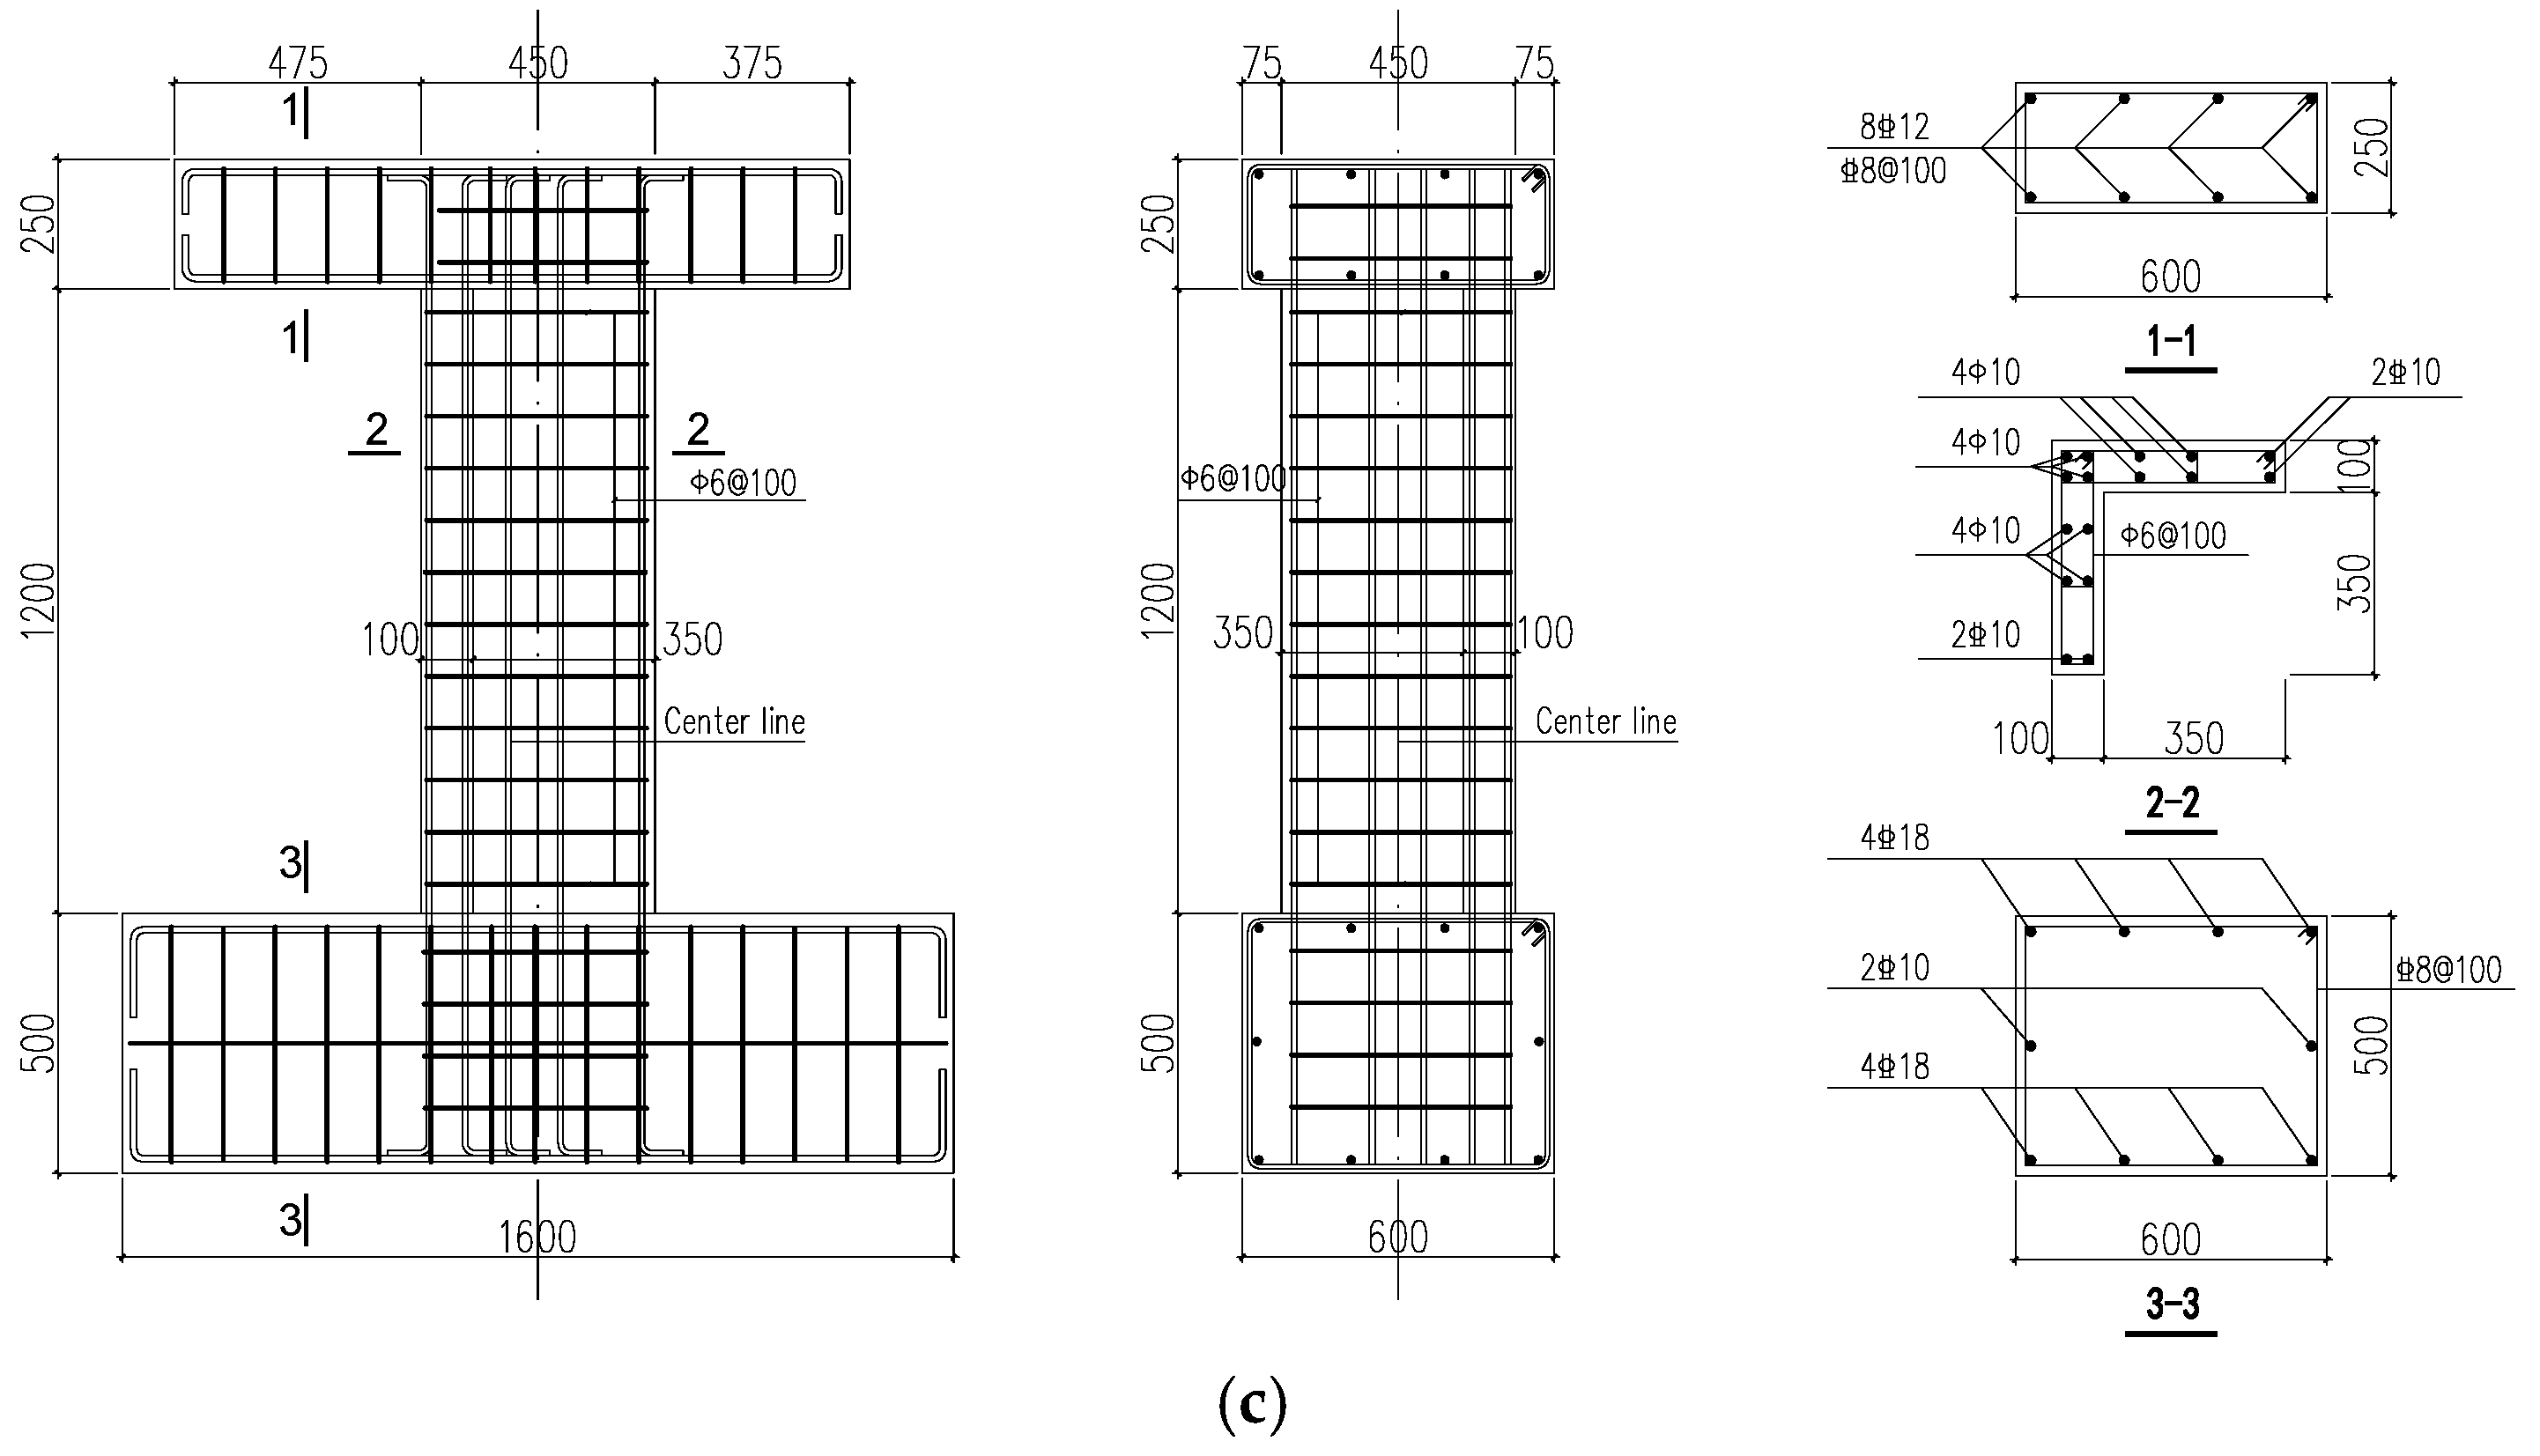
In this study, nine RC L-shaped column specimens were designed and fabricated, consisting of three un-strengthened control specimens and six specimens strengthened with the wing wall. All the columns had a height of 1200 mm, limb thickness of 100 mm, limb height of 300 mm, and concrete cover of 20 mm. For the un-strengthened specimens, the longitudinal reinforcement of HPB 300-grade steel bars with a diameter of 10 mm was used, whereas the stirrups were HPB 300-grade steel bars with a diameter of 6 mm, spaced at intervals of 100 mm. For the strengthened specimens, wing walls with lengths of 100 mm and 150 mm were used. The 100 mm long wing walls were reinforced by using HRB 400-grade steel bars with a diameter of 8 mm, whereas the 150 mm long wing walls used bars with a diameter of 10 mm. In both cases, the stirrup configuration remained consistent with that of the original column. The wing walls were connected to the original columns using bonding adhesive, with an embedment depth 15 times the bar diameter, and were confined using closed-loop stirrups to ensure composite action between the new and existing structures. Figure 2 shows the detailed design of the specimens, and the detailed design parameters of the specimens are presented in Table 1. In particular, the original column’s axial compression ratio refers to the axial compression ratio of the specimen under the corresponding axial load in its un-strengthened state. When calculating the cross-sectional area, the leg height and leg thickness were both adopted as the original column dimensions, i.e., 300 mm and 100 mm, respectively. Therefore, the original column’s axial compression ratios for the three specimens, L1-A, L2-A, and L3-A, were equal. The actual axial compression ratio refers to the axial compression ratio exhibited by the specimen under the corresponding axial load, considering the increase in cross-sectional area due to the addition of wing walls. When calculating the cross-sectional area for the actual axial compression ratio, the leg height and leg thickness were the combined values of the original column dimensions and the wing wall dimensions, i.e., the actual total cross-sectional area was used. Therefore, the actual axial compression ratios of all six strengthened specimens were lower than the original column’s axial compression ratio.
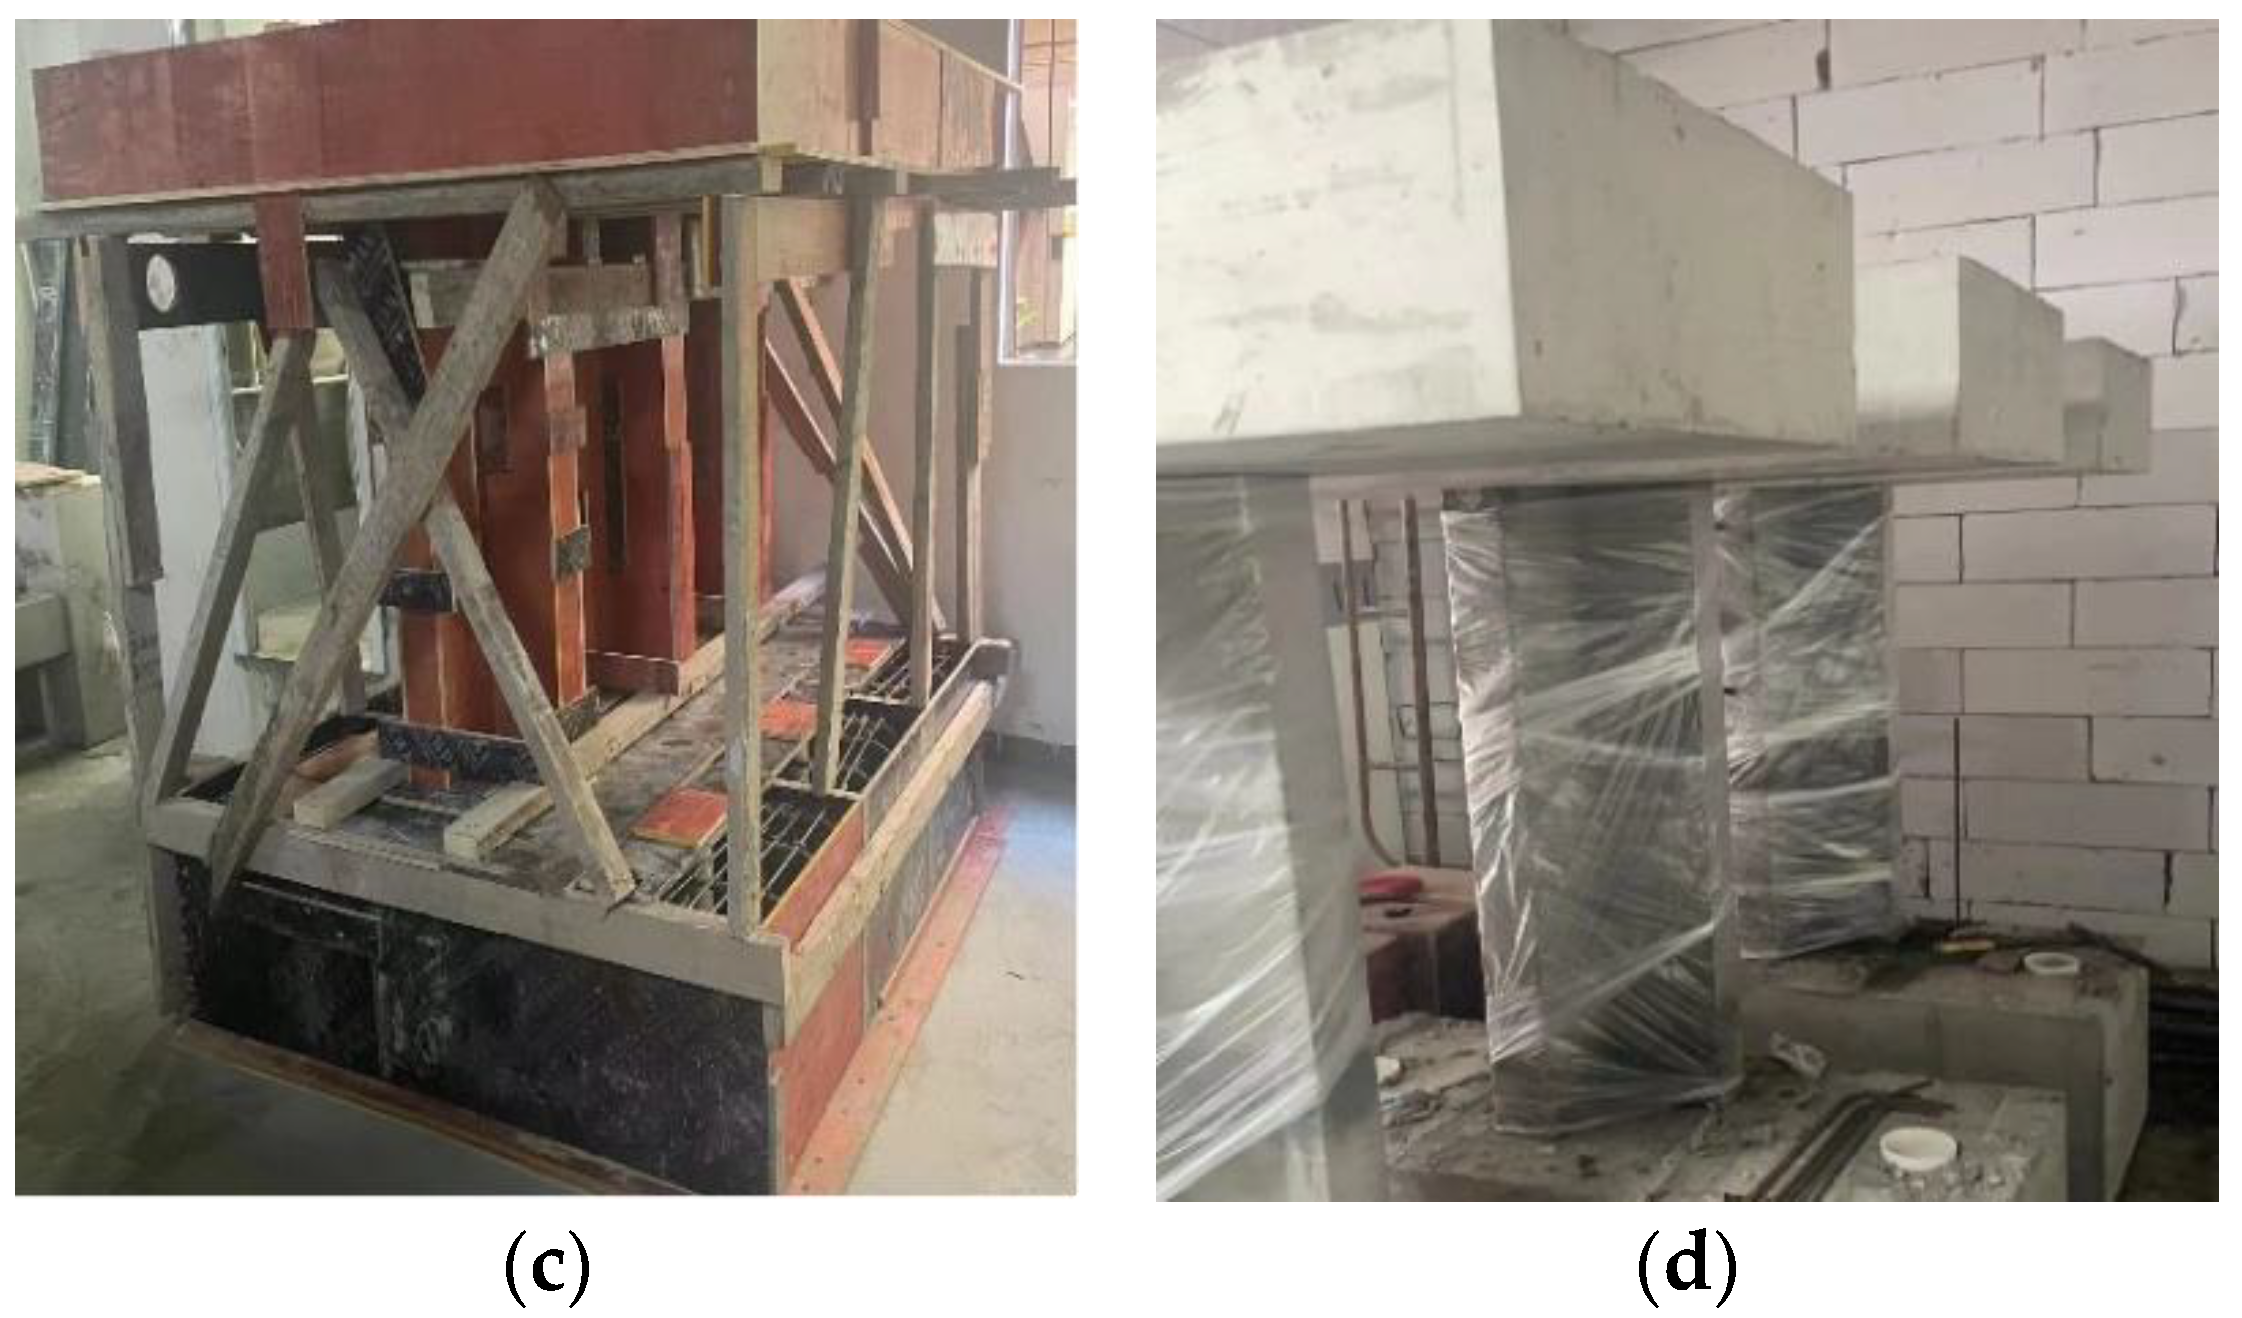
The fabrication of the un-strengthened specimens involved standard procedures such as reinforcement cage assembly, strain gauge installation, concrete casting, and curing. Figure 3 shows the manufacturing process of the strengthened specimens. Additional fabrication steps were required to ensure effective integration between the wing walls and the original columns:
(a)
The concrete cover at the ends of the column limbs was chipped away to expose the longitudinal reinforcement and stirrups of the original column, as shown in Figure 3a.
(b)
Holes corresponding to the diameters of the wing wall reinforcement bars were drilled into the base and the loading beam. Bonding adhesive was injected, and longitudinal bars for the wing walls were embedded to a depth 15 times the bar diameter, followed by curing.
(c)
New stirrups for the wing walls were tied to the exposed longitudinal bars of the original columns using closed-loop connections and by maintaining the original stirrup spacing to ensure consistent confinement, as shown in Figure 3b.
(d)
The wooden formwork was assembled and concrete was poured with adequate compaction, as shown in Figure 3c. The specimens were then cured under the same conditions as the original columns to ensure consistency, as shown in Figure 3d.
The critical quality controls included bonding adhesive curing, ensuring reliable connection between the new and existing reinforcement, and precise formwork positioning to ensure force transfer compatibility between the wing walls and original columns.

3.2. Material Properties

All the specimens were cast using ordinary concrete, with three 100 mm × 100 mm × 100 mm cubes prepared per batch and cured under the same conditions as those of the RC column specimens. The average compressive strength was determined based on the average of the three cubes (GB/T 50081-2019) [35,36]. The tensile properties of the steel, including the yield, ultimate strengths, and elastic modulus, were determined through tests conducted based on the metallic materials-tensile testing-part 1: method at room temperature (GB/T 228.1-2021) [37]. Table 2 presents the detailed material properties for the concrete and reinforcement. Additionally, a high-performance planting adhesive was employed to anchor the wing wall reinforcement, featuring high bond strength, durability, weather resistance, and rapid curing, corresponding to the technical specification for the seismic strengthening of buildings (JGJ 116-2009) [38].

3.3. Test Setup and Loading Protocol

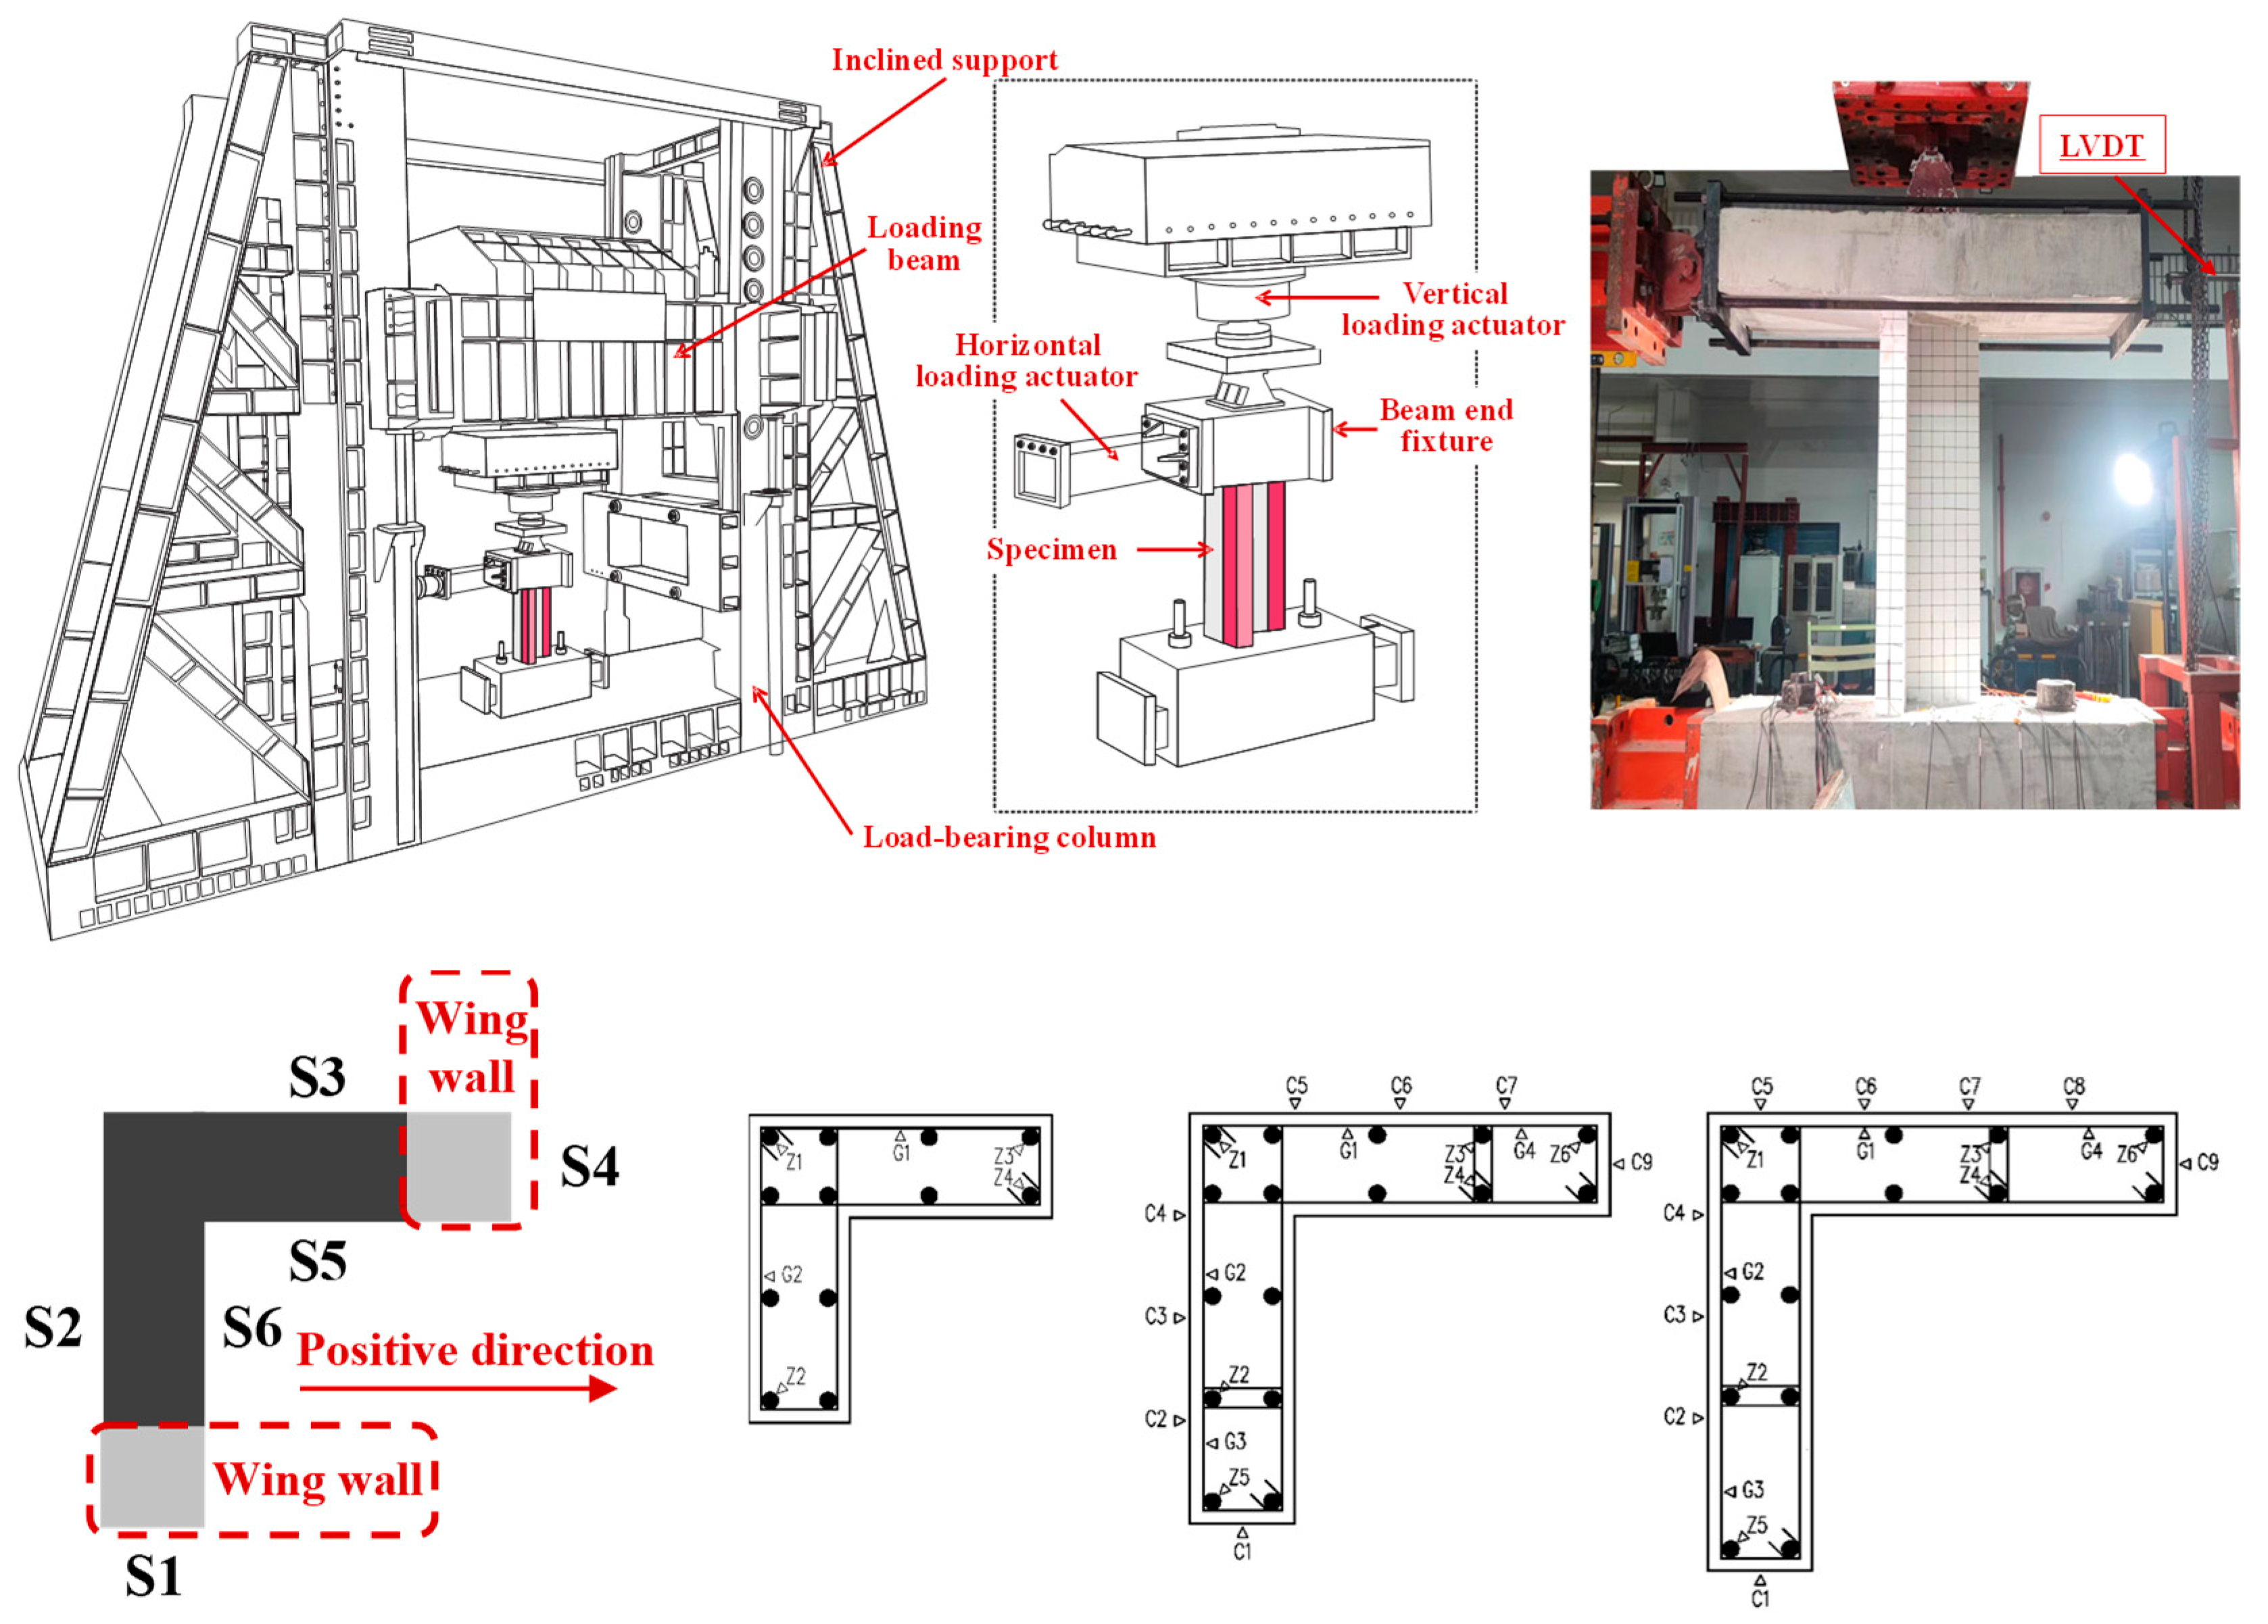
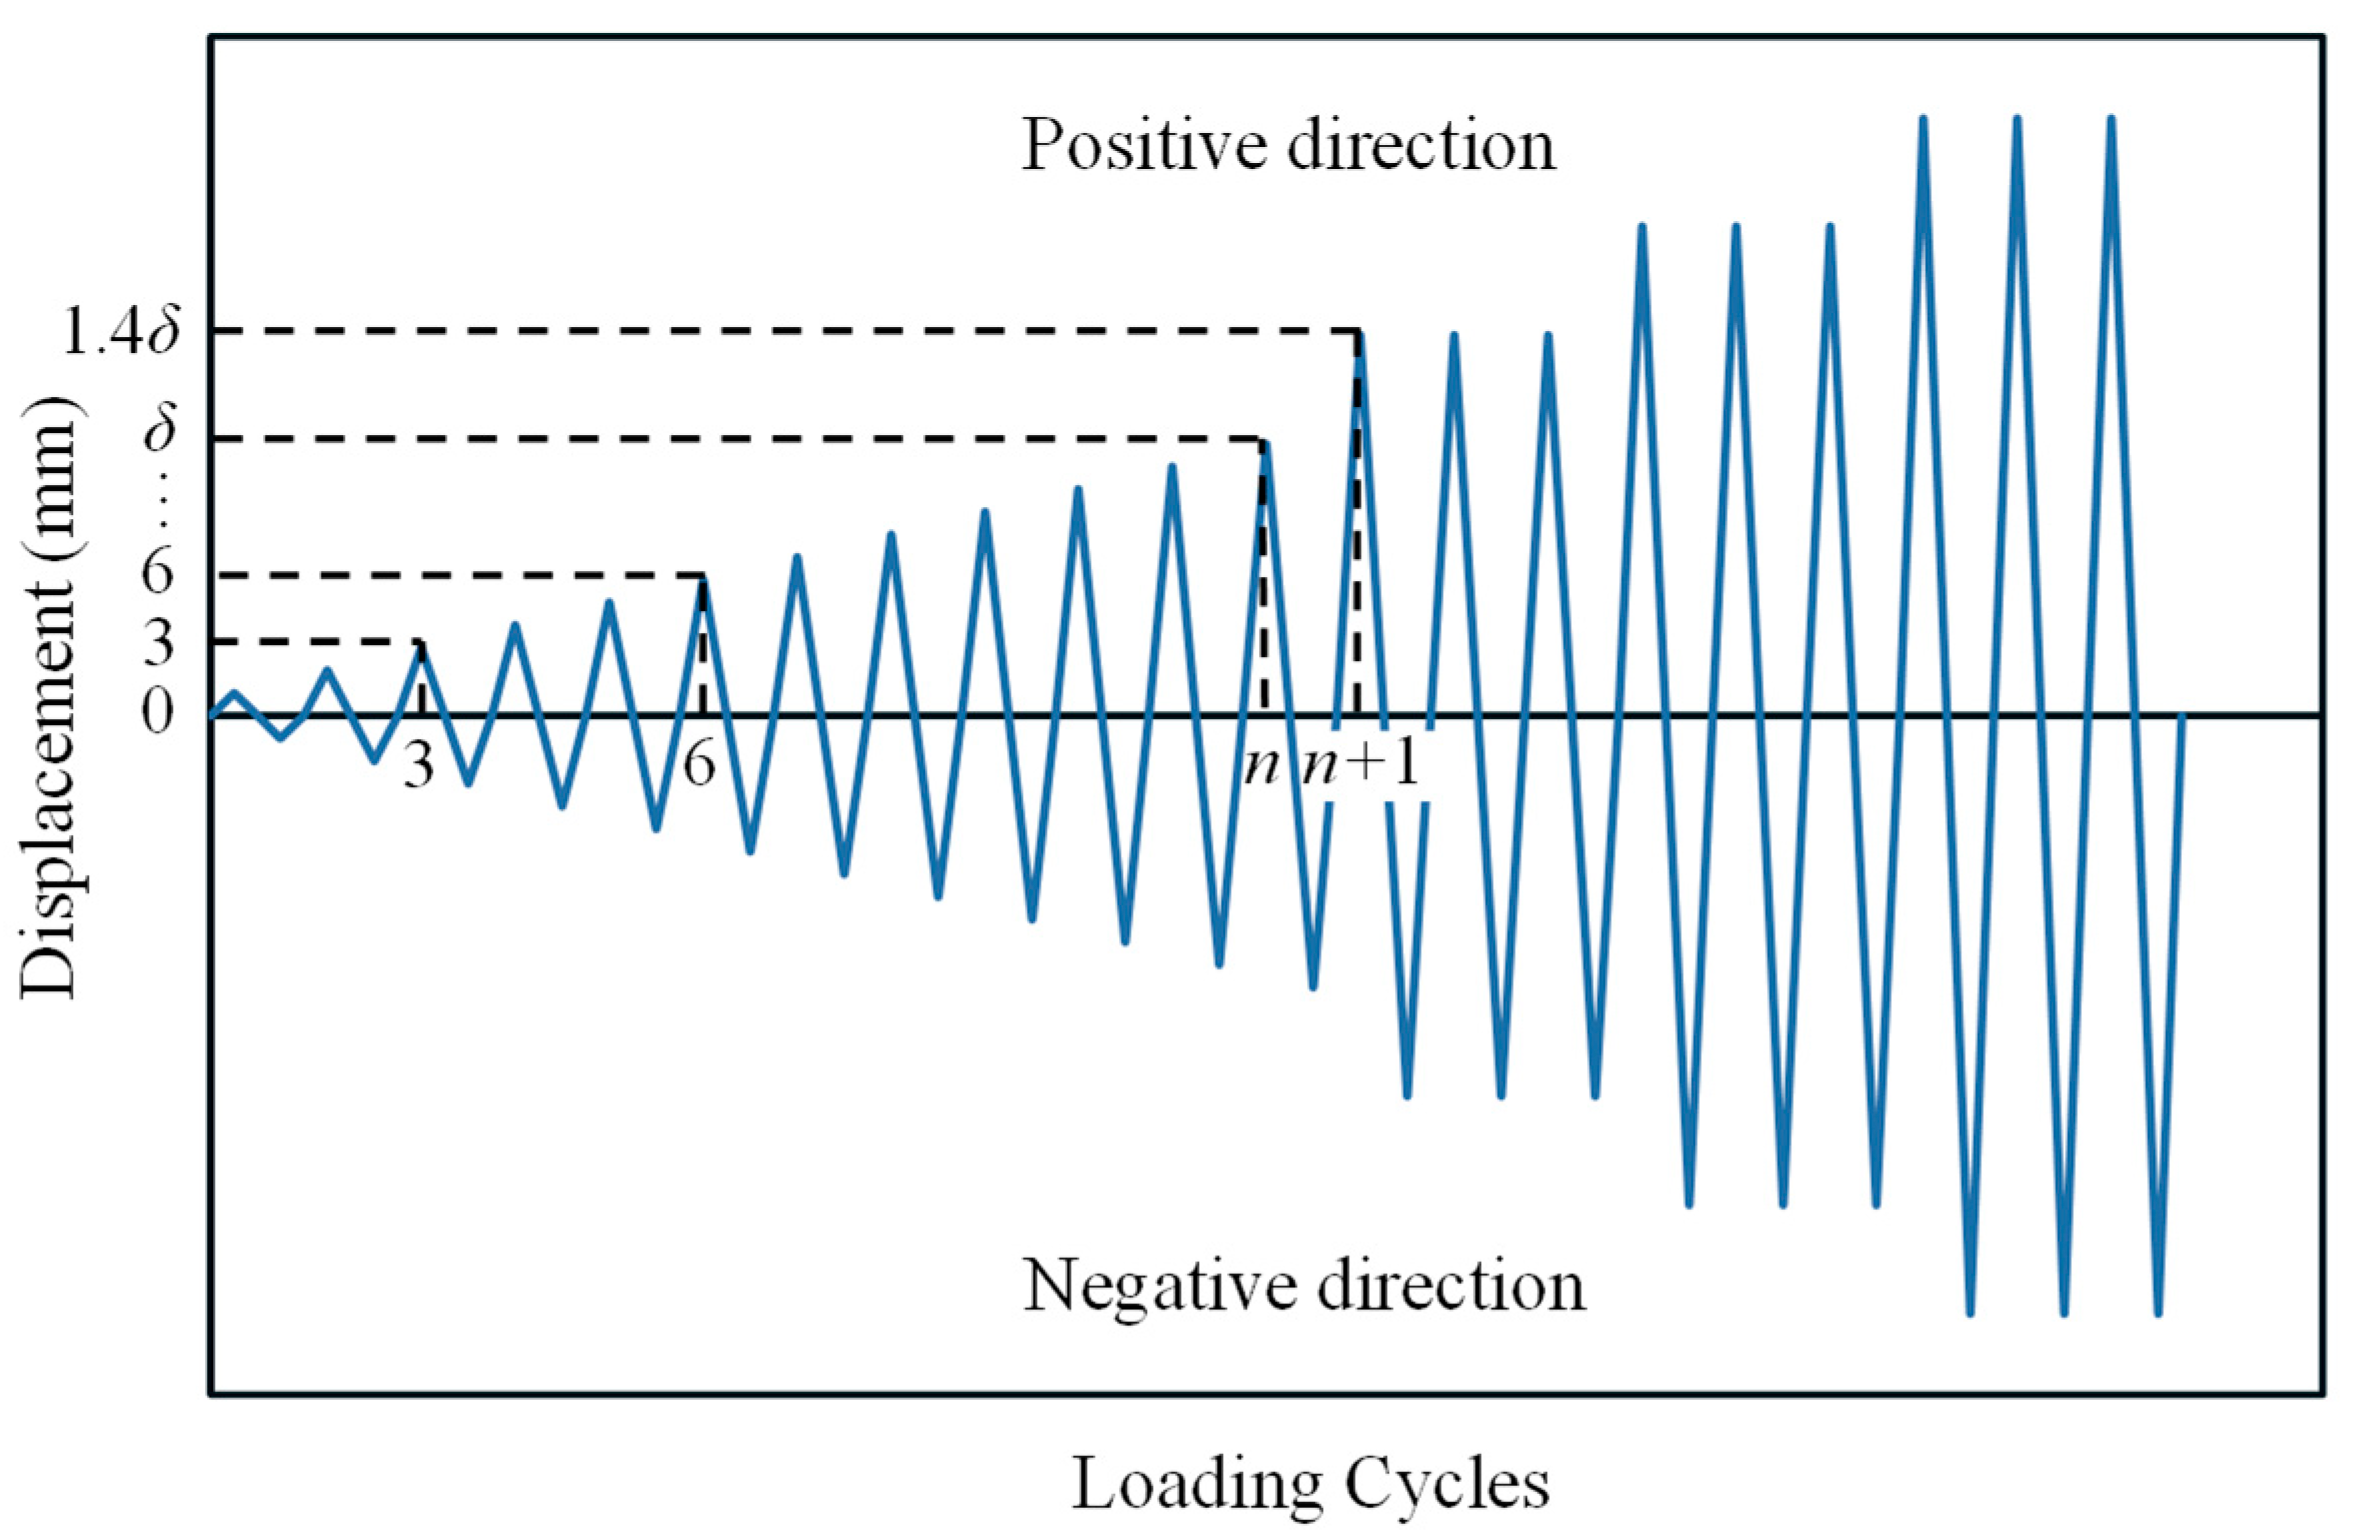
This experiment was conducted at the Structural Laboratory of College of Civil and Transportation Engineering, Shenzhen University, China. A quasi-static loading method was employed in this study [39,40,41]. The test setup primarily comprised a vertical and a horizontal loading actuator. Figure 4 depicts the schematic test setup (POPWIL Electromechanical Control Engineering Co., Ltd., Hangzhou, China). The loading sequence included initial axial loading, followed by lateral cyclic loading. In this test, the axial compression ratios were set at 0.26, 0.32, and 0.37, corresponding to the axial compressive loads of 287 kN, 344 kN, and 401 kN, respectively, based on the cross-sectional area of the L-shaped columns. Following the stabilization of the axial load, displacement-controlled lateral cyclic loading was applied based on the loading protocol, as depicted in Figure 5. Prior to formal testing, preloading was performed with a displacement increment of 2 mm per cycle, to test the working behavior of each test device and the accuracy of the data acquisition equipment, and to eliminate the gap in the connections. Before yielding, displacement increments of 1 mm per cycle were used for stepwise loading, with one cycle per displacement level. The hysteresis curves of the specimens were monitored to assess their mechanical behavior. Upon yielding, the displacement increment for each level was set as 0.4δ (where δ denotes the displacement corresponding to the yielding load). Each cycle was repeated three times. The test was completed when the lateral load was decreased to 85% of the maximum load capacity, which was considered the failure of the specimen. For L-shaped columns, the ductility and energy dissipation capacity of the specimens were the worst along the loading direction of 0° [42]. Therefore, the loading direction in this test was kept as 0°, representing the worst load orientation. The pushing direction of the horizontal actuator was defined as the positive loading direction. The limb of the L-shaped column parallel to the loading direction was defined as the web, whereas the perpendicular limb was defined as the flange.

3.4. Measurement

The measurement includes the installation of the linear variable differential transformers (LVDTs, Keyence (China) Co., Ltd., Shanghai, China) and electrical resistance strain gauges (Chengdu Sweettec Technology Co., Ltd., Chengdu, China). LVDTs were installed to capture the lateral displacement at the loading point. The strain gauges were attached at the base of the column to monitor the development of diagonal cracks under shear forces and the failure modes. Strain gauges were also installed on four limb-end longitudinal bars, which were approximately 50 mm above the column base. Additionally, strain gauges were attached on both the longitudinal and transverse stirrups, also at a distance of 50 mm from the column base. The specific location and number of strain gauges, as well as the LVDT position, are depicted in Figure 4, in which measuring points Z1–Z6 correspond to the strain gauges installed on longitudinal bars, G1–G4 denote strain gauges installed on stirrups, and C1–C9 indicate the locations of strain gauges installed on concrete surfaces. The strain gauges and LVDT readings were continually recorded using a data acquisition system.

4. Experimental Results and Discussion

4.1. Experimental Phenomena

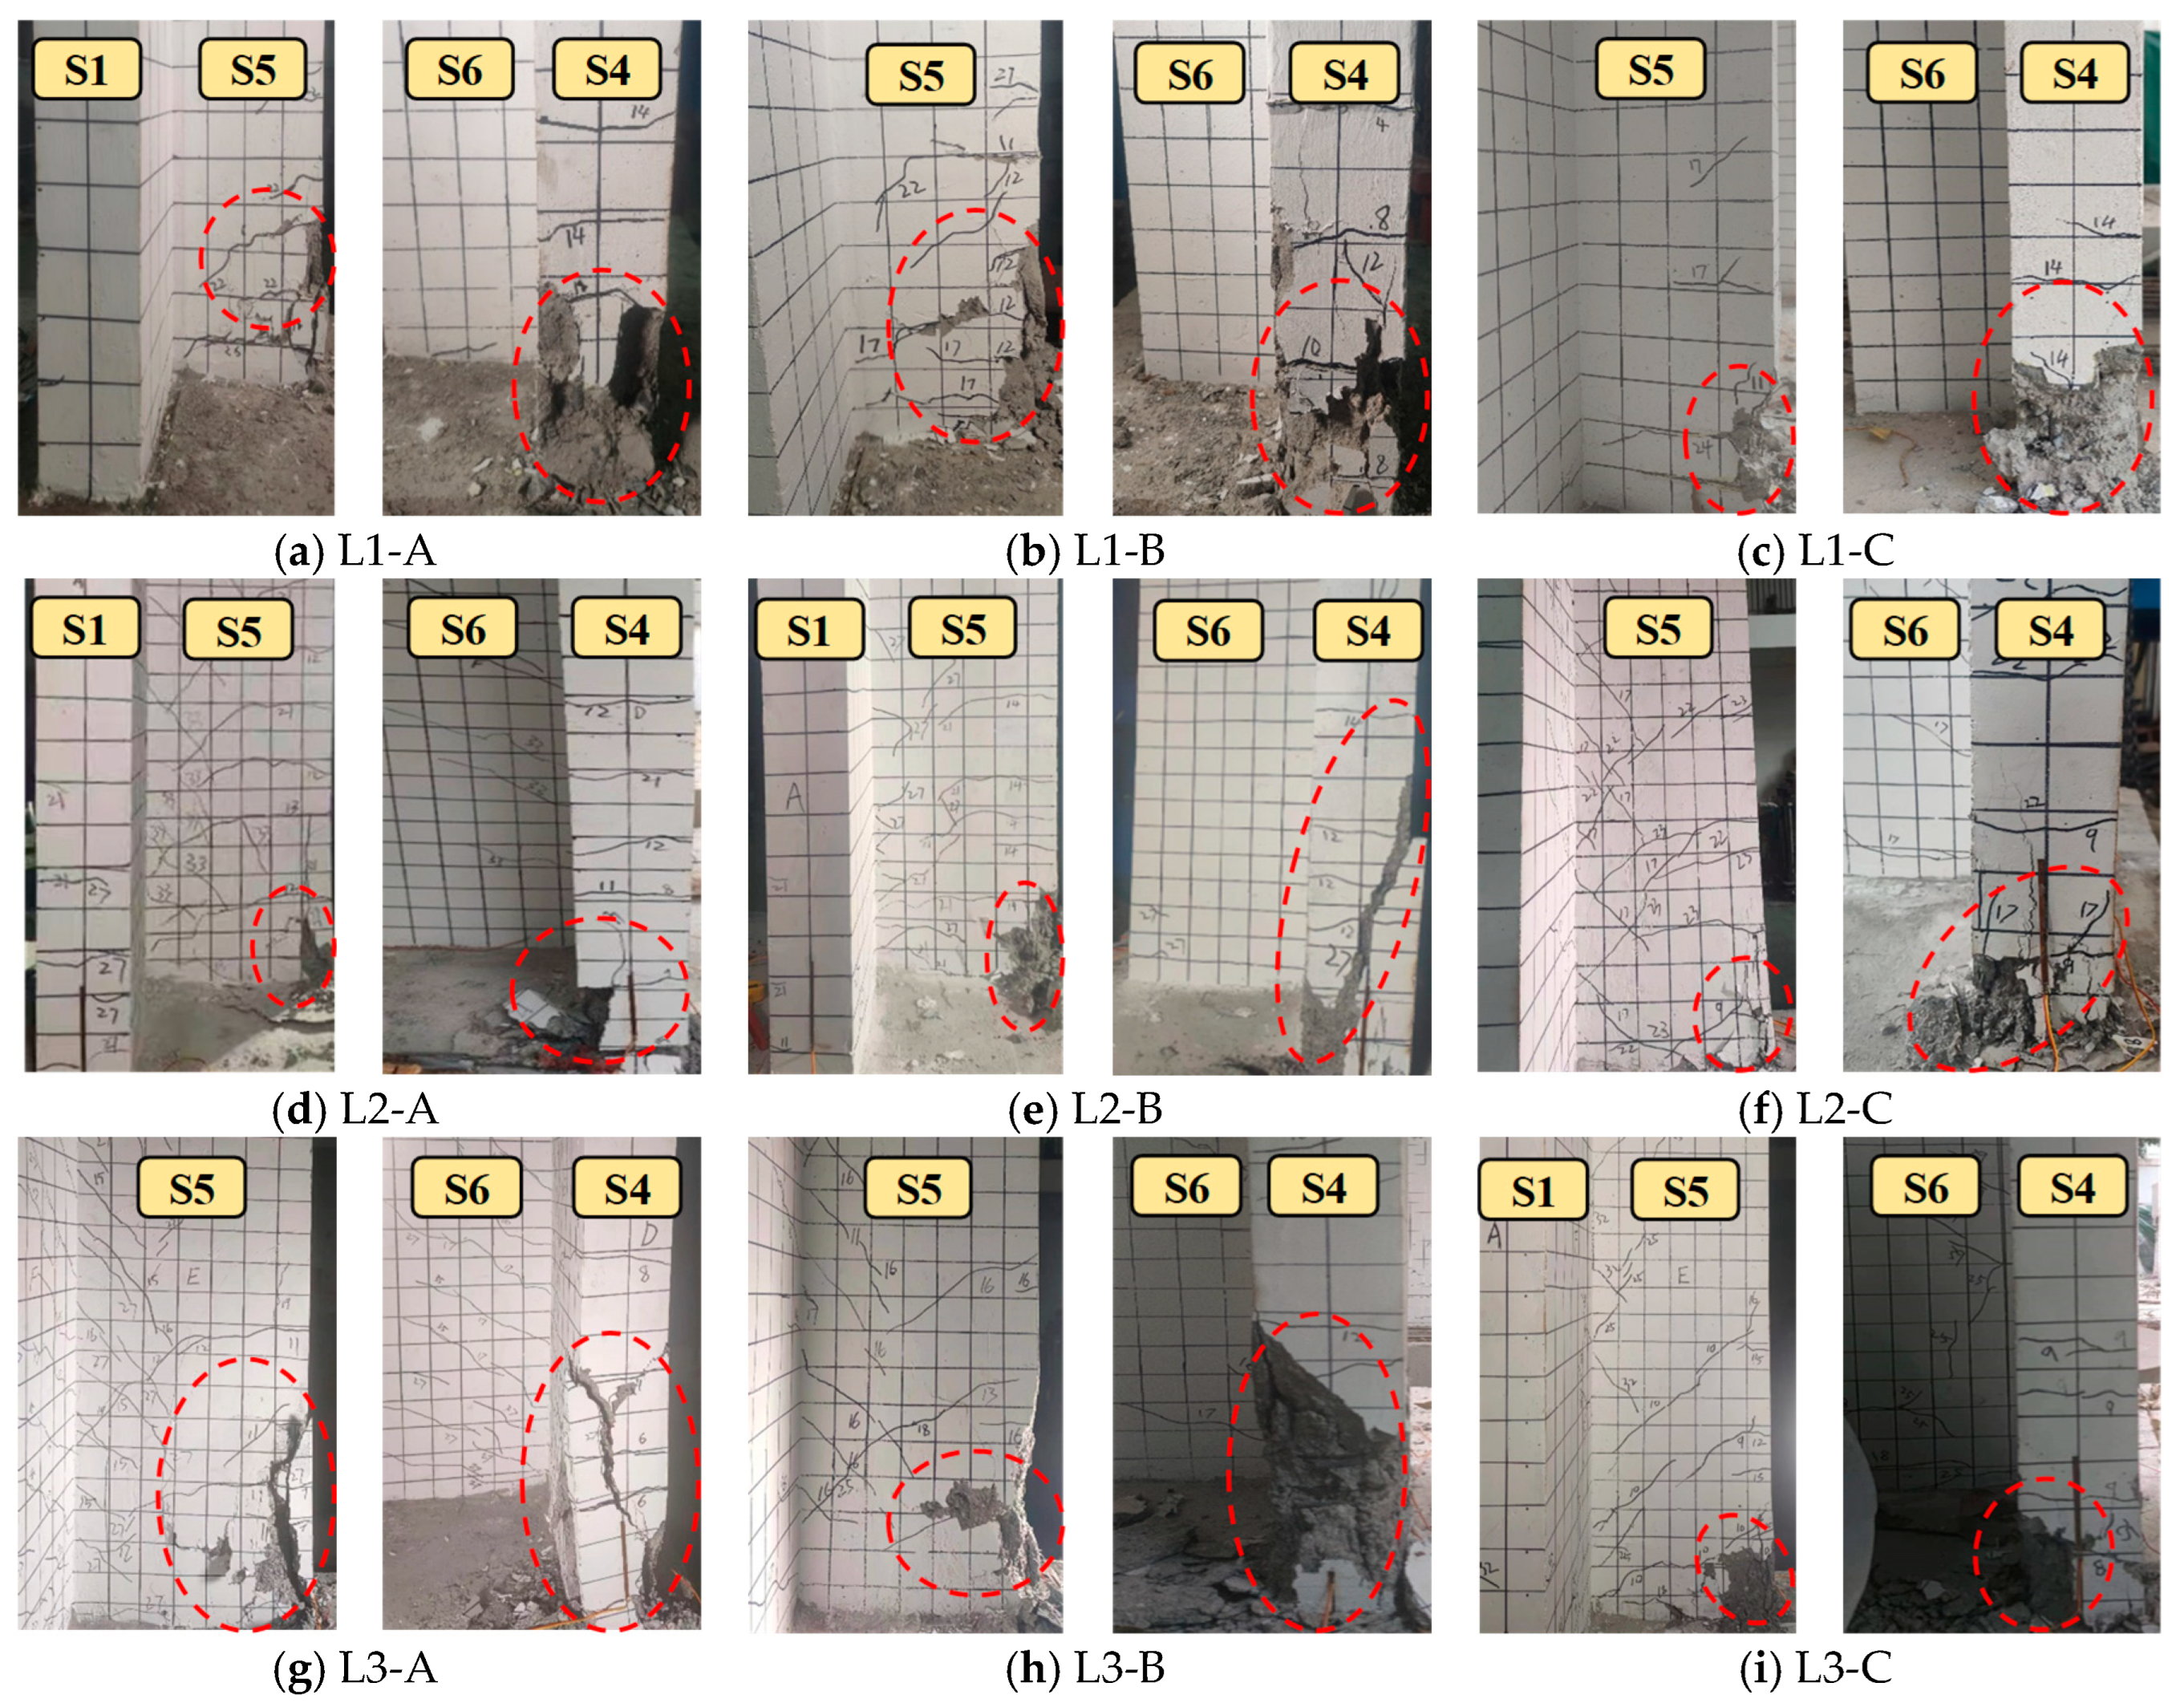
The RC L-shaped columns, both un-strengthened and strengthened with wing walls, exhibited flexural–shear failure modes. Figure 6 depicts the failure morphology and crack pattern of the specimens. In the elastic stage, several micro-horizontal cracks were first observed in the web and flange regions. These cracks gradually widened with the increase in the lateral displacement, and new diagonal cracks were developed. Once the longitudinal reinforcement yielded, the hysteresis curves demonstrated significant residual deformation, with crack widths and numbers continuing to increase until the formation of through-cracks. Specimen deformation persisted even under constant load, eventually resulting in the concrete’s crushing and failure.

4.1.1. Test Observation of Group L1 Specimens (Un-Strengthened Specimens)

For the un-strengthened group (L1), the specimens primarily exhibited bending–shear failure, with cracks concentrated at the junction between the web and flange. In specimen L1-A, the first horizontal crack was observed approximately 200 mm above the column base on surfaces S2 and S3. Significant concrete crushing was observed on surface S4 with an increase in the displacement, until it reached 34 mm, as shown in Figure 6a. For specimen L1-B, vertical cracks were intensified at the column base, the crack propagation was extended to surface S5 with the enlargement of the concrete cover spalling area, and ultimately, the displacement was decreased to 32 mm, as shown in Figure 6b. Under further increased axial compression ratios (specimen L1-C), the crack quantity was significantly reduced, accompanied by a slower rate of crack propagation. Only short cracks were observed around 100 mm above the base on surfaces S2 and S3. This indicates that high axial pressure limited crack development due to aggregate interlocking.

4.1.2. Test Observation of Group L2 Specimens (Strengthened with 100 mm Wing Walls)

The addition of the 100 mm wing walls improved the deformation capacity of the specimens, but presented a denser distribution of cracks. In specimen L2-A, diagonal cracks were observed on surface S3 at a height of approximately 300 mm from the column base. On surface S4, the number of continuous horizontal surface cracks increased to four, and the ultimate displacement increased to 39 mm, as shown in Figure 6d. For specimen L2-B, the crack density increased on surfaces S2 and S4. Notably, the concrete was crushed at the web end, as shown in Figure 6e, and the displacement reached 33 mm. For specimen L2-C, X-shaped diagonal cracks were observed on surface S5, whereas concrete spalling became more severe at the base of surface S4, as shown in Figure 6f; the displacement decreased to 28 mm. Both the height of cracks and the proportion of diagonal cracks increased significantly with an increase in the axial compressive ratio, indicating that the axial compressive ratio influenced the cracking pattern and failure mode.

4.1.3. Test Observation of Group L3 Specimens (Strengthened with 150 mm Wing Walls)

Specimens in the L3 group, strengthened with 150 mm wing walls, demonstrated more pronounced shear failure characteristics. In specimen L3-A, a 150 mm vertical crack was formed at the center of surface S3. X-shaped intersecting cracks were observed across surfaces S5 and S6, as shown in Figure 6g, and the displacement increased to 43 mm. For specimen L3-B, the concrete spalling zone at the web end significantly expanded, and the diagonal cracks on surface S5 increased significantly. Signs of brittle behavior were observed, as shown in Figure 6h, and the displacement decreased to 32 mm. In specimen L3-C, long vertical cracks with a length of approximately 300 mm were observed at a height of one meter above the base on surface S3. Intersecting diagonal cracks were developed on surfaces S5 and S6, forming a dense cracking pattern, as shown in Figure 6i. The web-end reinforcement was exposed, and the displacement was further reduced to 26 mm. These results indicated that although wing walls enhance the lateral load capacity, an increase in the axial compression ratio may suppress the ductility.

4.2. Hysteretic Curve

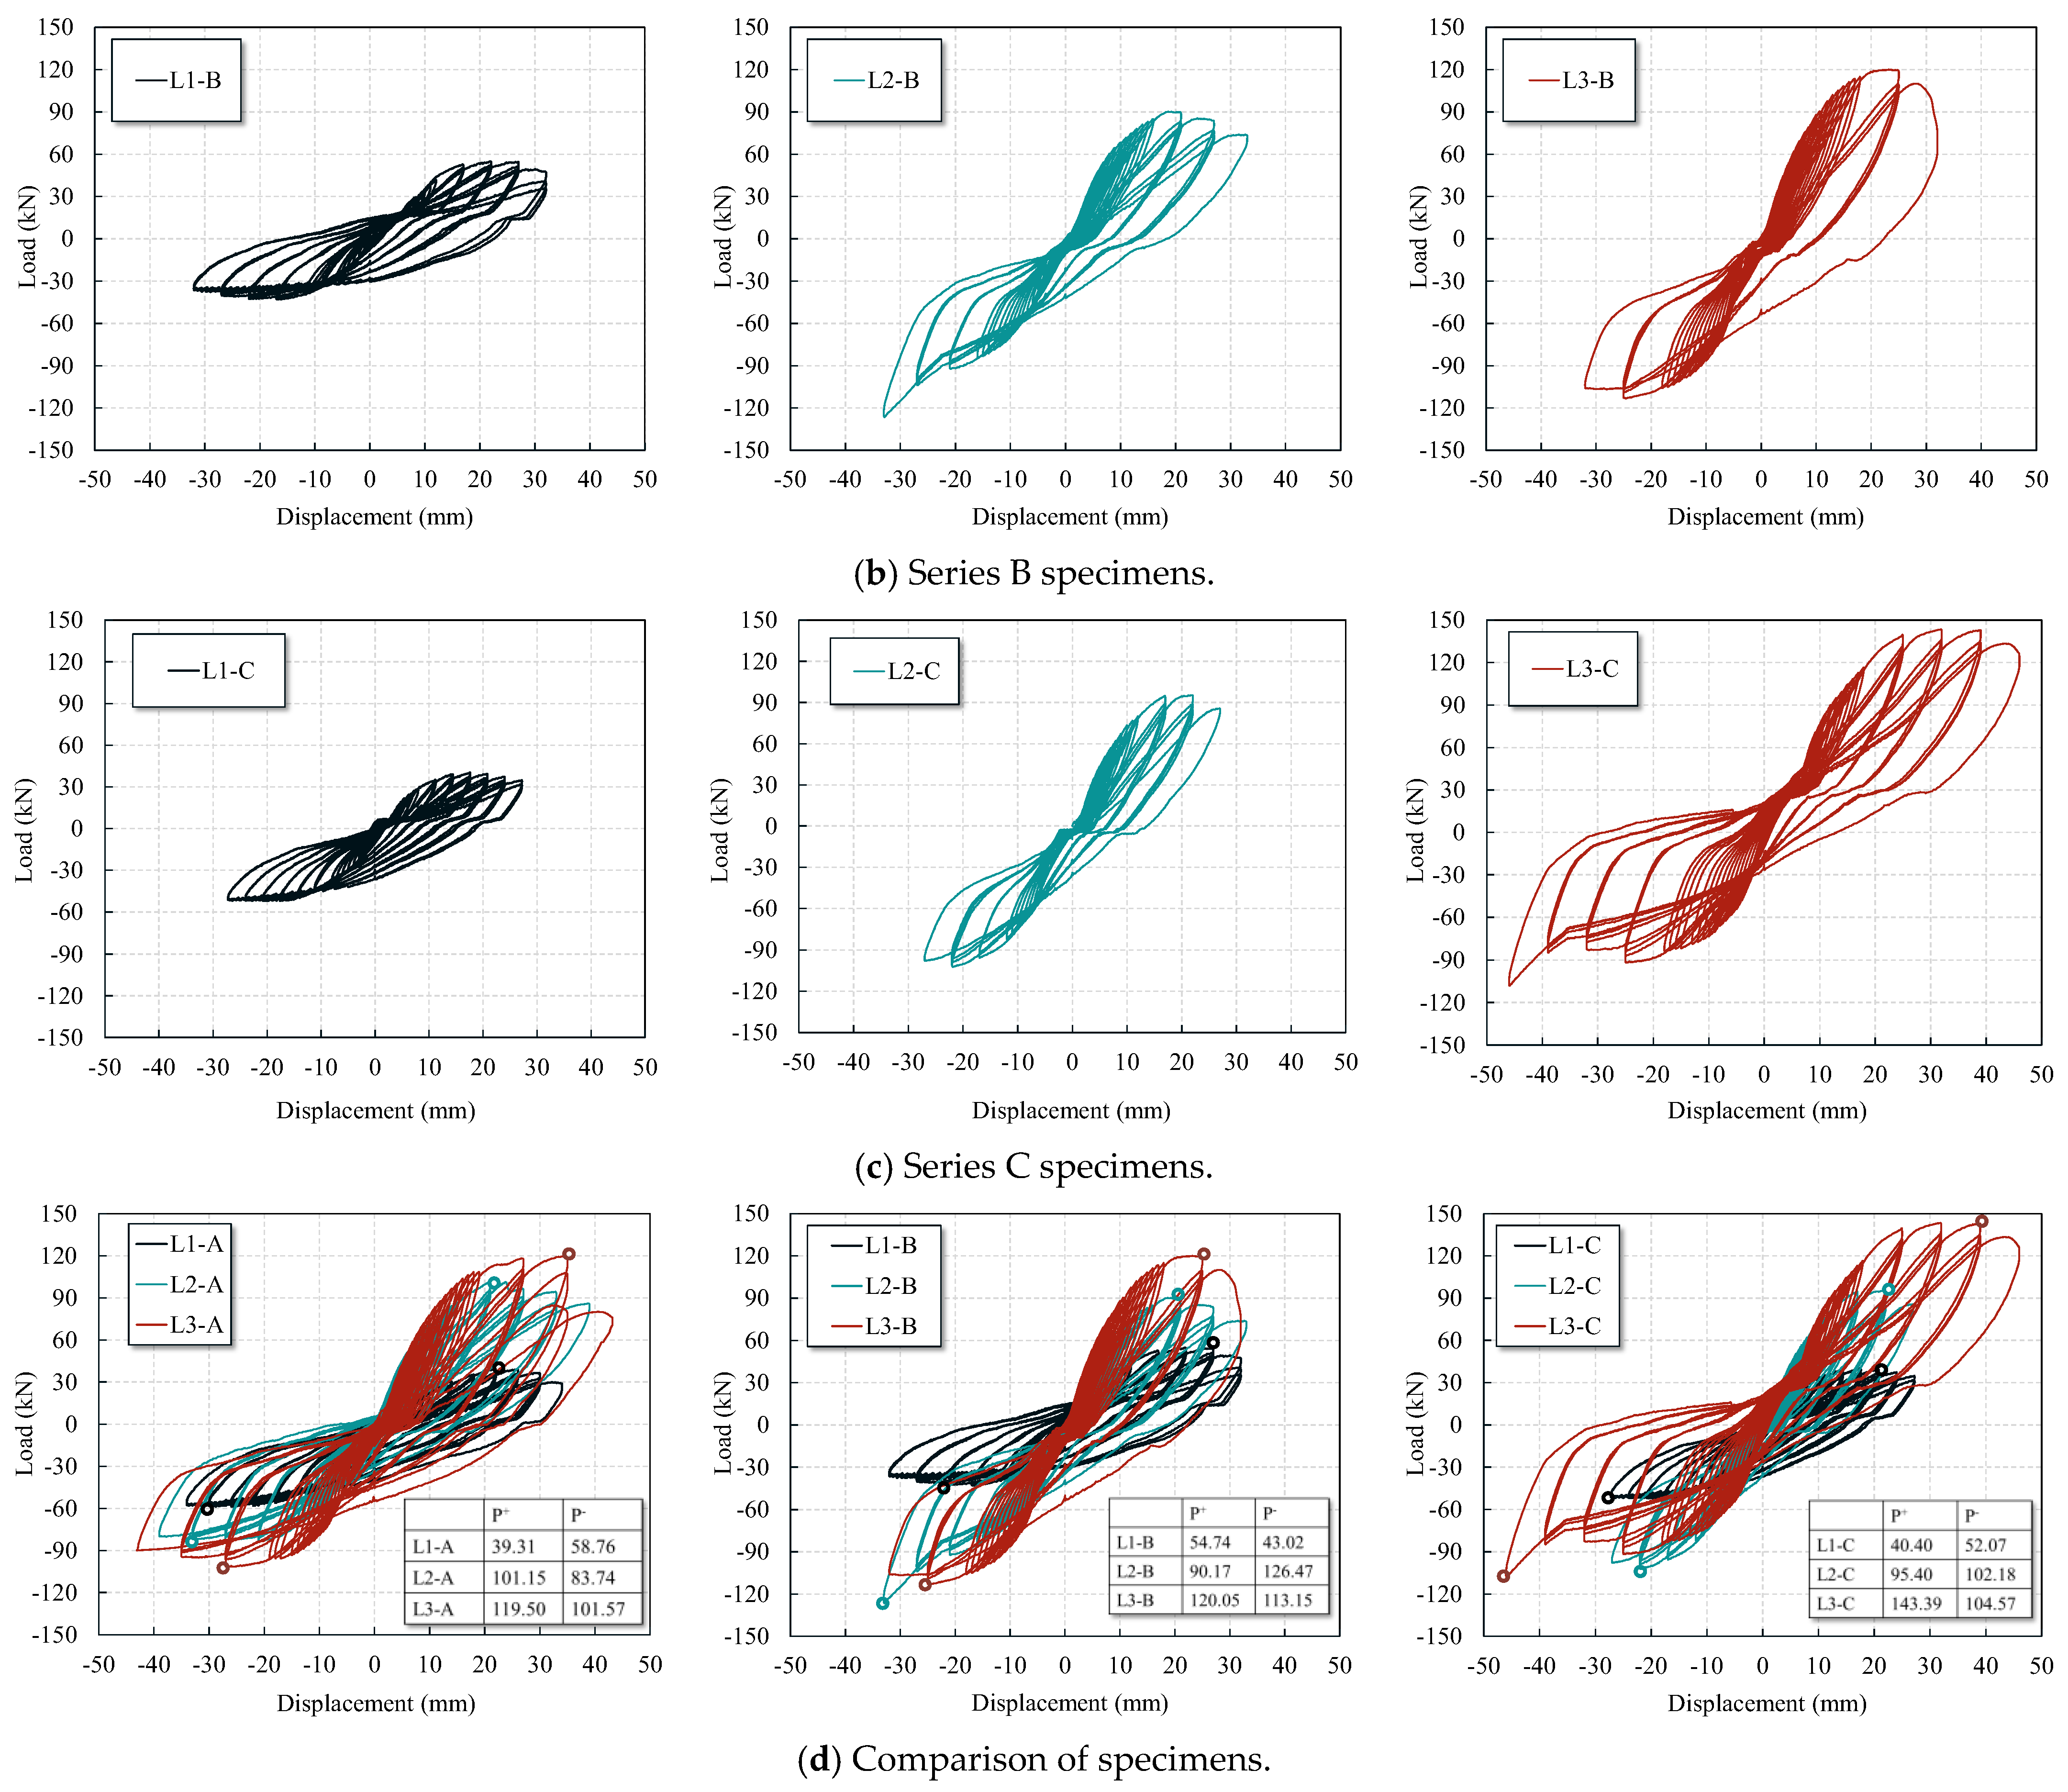
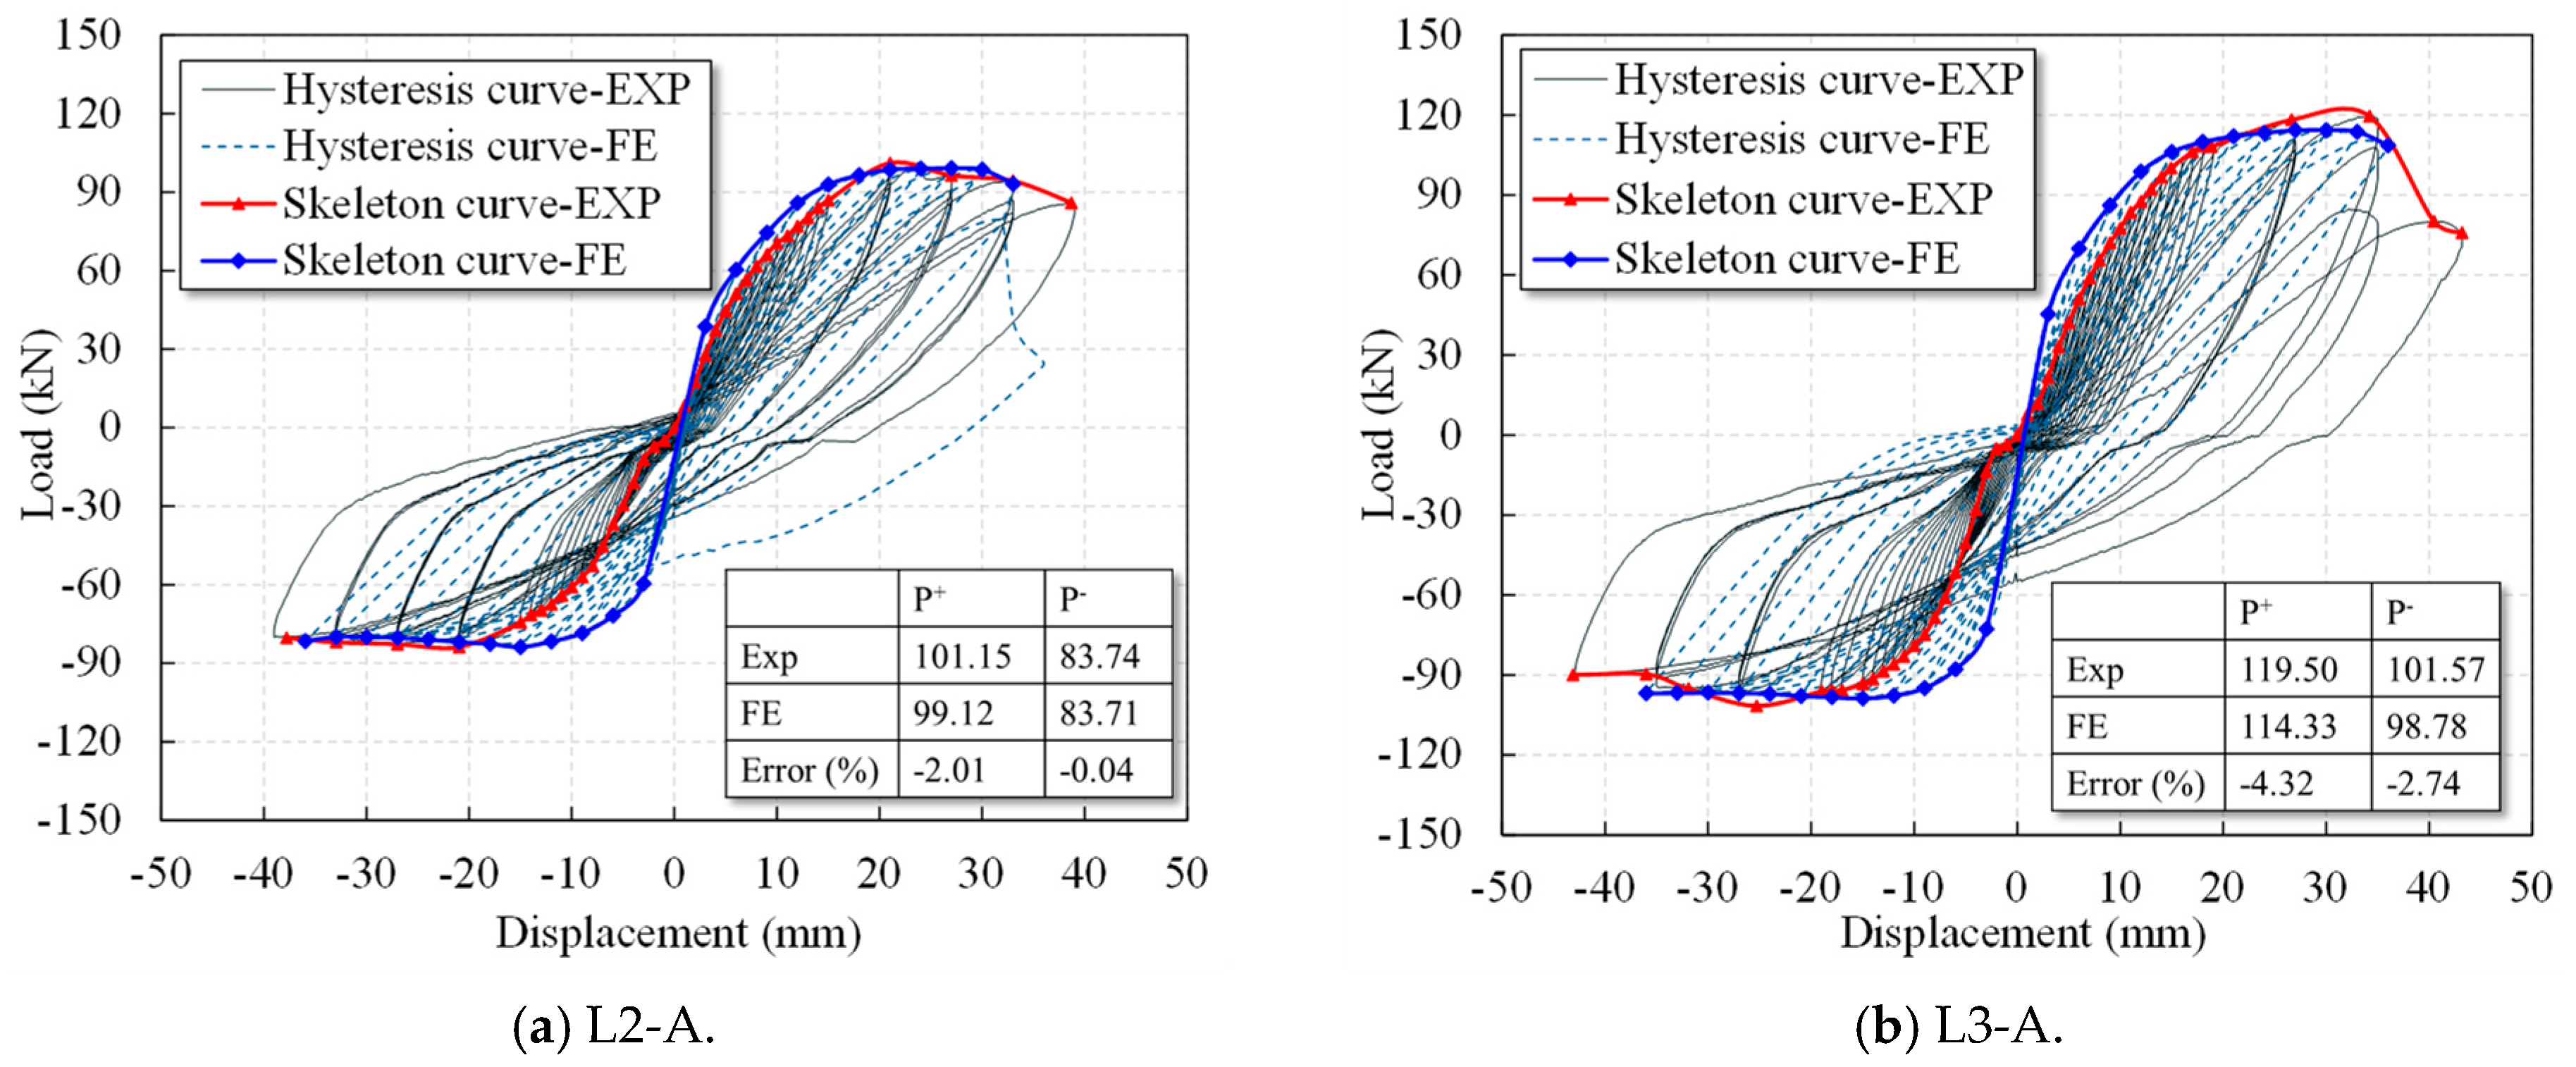
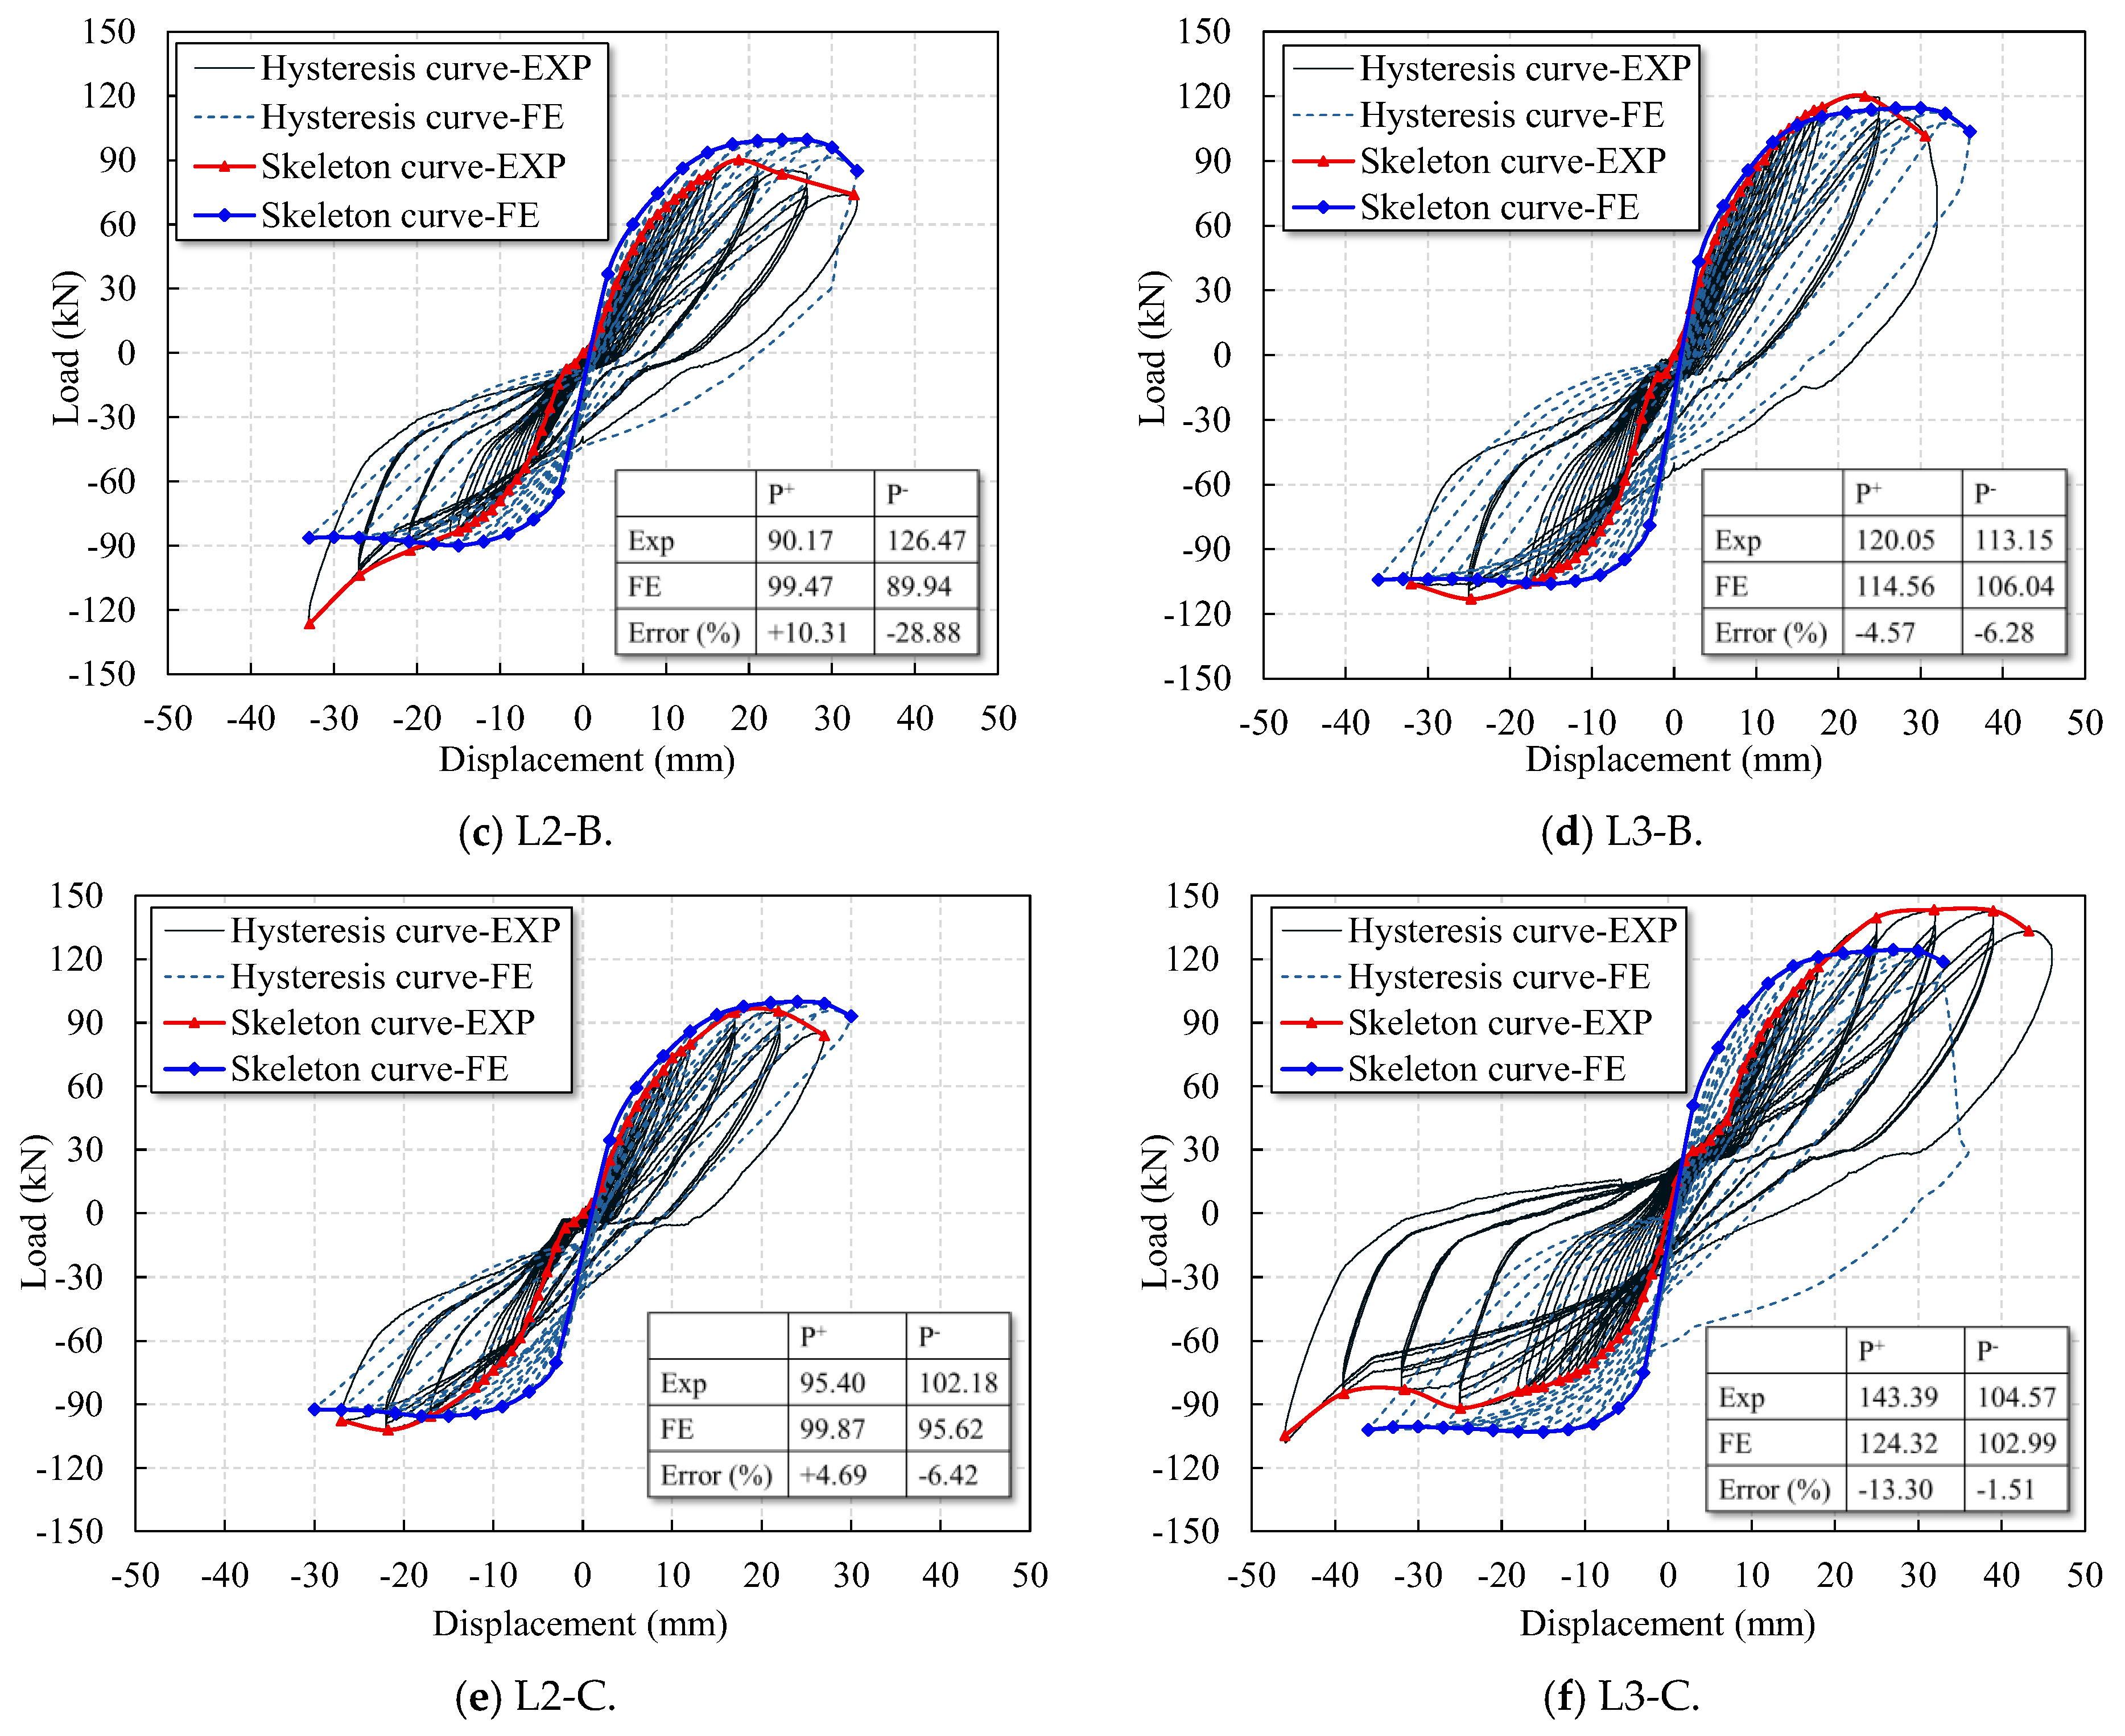
A hysteretic curve characterizes the deformation capacity, stiffness degradation, and energy dissipation of a structure under lateral cyclic loading. These seismic performance attributes were quantitatively reflected in the area enclosed by the load–displacement loops. Figure 7 depicts the hysteretic curves of all the specimens exhibiting a distinct hysteretic evolution, transitioning from “spindle-shaped” to “bow-shaped,” and lastly to “inverse S-shaped” loops. Initially, the curve exhibited linear growth, indicating that this stage corresponded to the elastic stage. Narrow spindle-shaped loops indicated minimal energy dissipation. The residual deformations were increased, loop areas were expanded, and the energy dissipation capacity was improved with the occurrence of cracking. Once the reinforcement yielded, the loops evolved into fuller bow-shaped forms. With continued loading and damage accumulation, the loops adopted an inverse S-shape owing to the considerable stiffness degradation. The asymmetric cross-section of L-shaped columns introduced significant loading-direction-dependent behavior. Under positive loading, concrete spalling and compressive failure was observed at the web limb, which was unsupported by the flange, causing a rapid decrease in the load-bearing capacity. Conversely, reverse loading induced slower post-peak degradation owing to the stabilizing effect of the flange, presenting increasingly asymmetric hysteresis loops in both shape and strength.
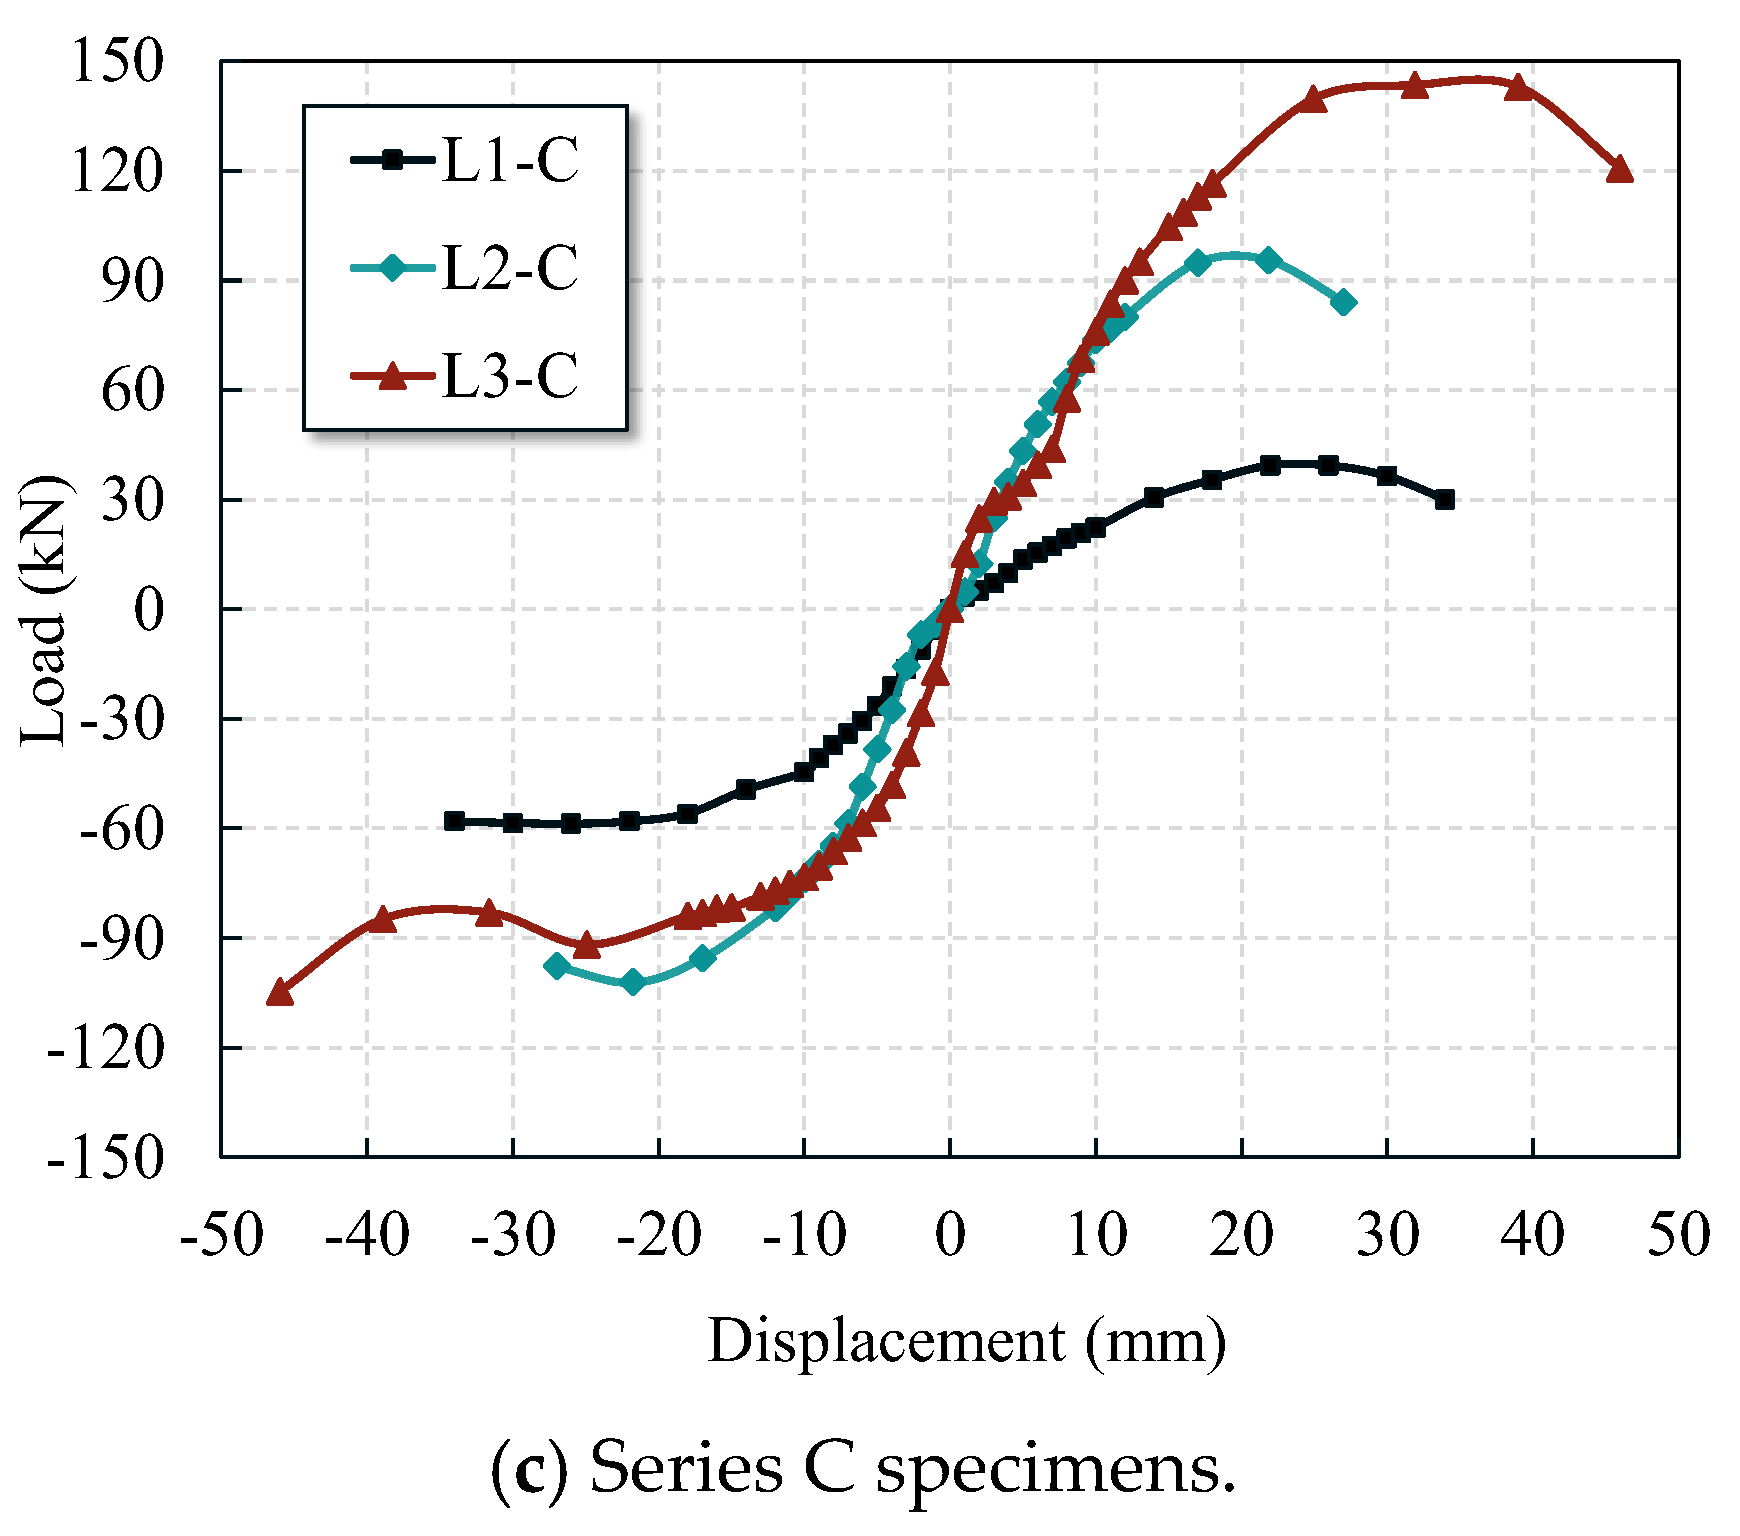
Figure 7 also presents the load bearing performance of specimens. The six specimens strengthened with wing walls (L2 and L3 series) presented significantly improved load-bearing performance under three levels of axial load, with improvements observed along both the positive and negative directions of the ultimate bearing capacity. Overall, the enhancement effect was positively correlated with the length of the added wing walls. For the columns with an axial compression ratio of 0.26, the incorporation of the 100 mm and 150 mm wing walls increased the positive peak load of the original specimen from 39.31 kN to 101.15 kN and 119.50 kN, representing an increase of 157% and 204%, respectively, as shown in Figure 7a. The negative peak load also increased from 58.76 kN to 83.74 kN and 101.57 kN, representing improvements of 43% and 73%, as shown in Figure 7a. Comparable trends were observed under the axial compression ratio of 0.32. For the two strengthening configurations, the positive peak load was improved by 65% and 119%, whereas the negative peak load was increased by 194% and 163%, respectively, when compared with the un-strengthened specimens, as shown in Figure 7b. At a higher axial compression ratio of 0.37, the positive and negative peak capacities were enhanced by 111% and 254%, and by 96% and 101%, respectively, under the two wing wall configurations, as shown in Figure 7c. These results indicated that the strengthening effect was increased with increasing wing wall length and axial load level. Additionally, Specimen L2-B exhibited a higher negative peak capacity than L2-C, despite the latter having a longer wing wall. This anomaly can be attributed to several factors observed during the later stages of testing. In L2-B, the longitudinal reinforcement at the end of the web had already yielded, whereas severe spalling was observed in the wing wall concrete on the flange-free side. This condition likely triggered the engagement of the previously unyielded longitudinal bars on the opposite side in resisting the tensile forces, thereby contributing to a continual increase in the negative bearing capacity.
It is summarized that wing wall strengthening significantly improved the lateral stiffness and load bearing capacity. However, the strengthened specimens subjected to higher axial compression ratios exhibited more pronounced pinching behavior in their hysteretic curves, indicating reduced ductility and increased stiffness degradation.

4.3. Skeleton Curve and Load Bearing Capacity

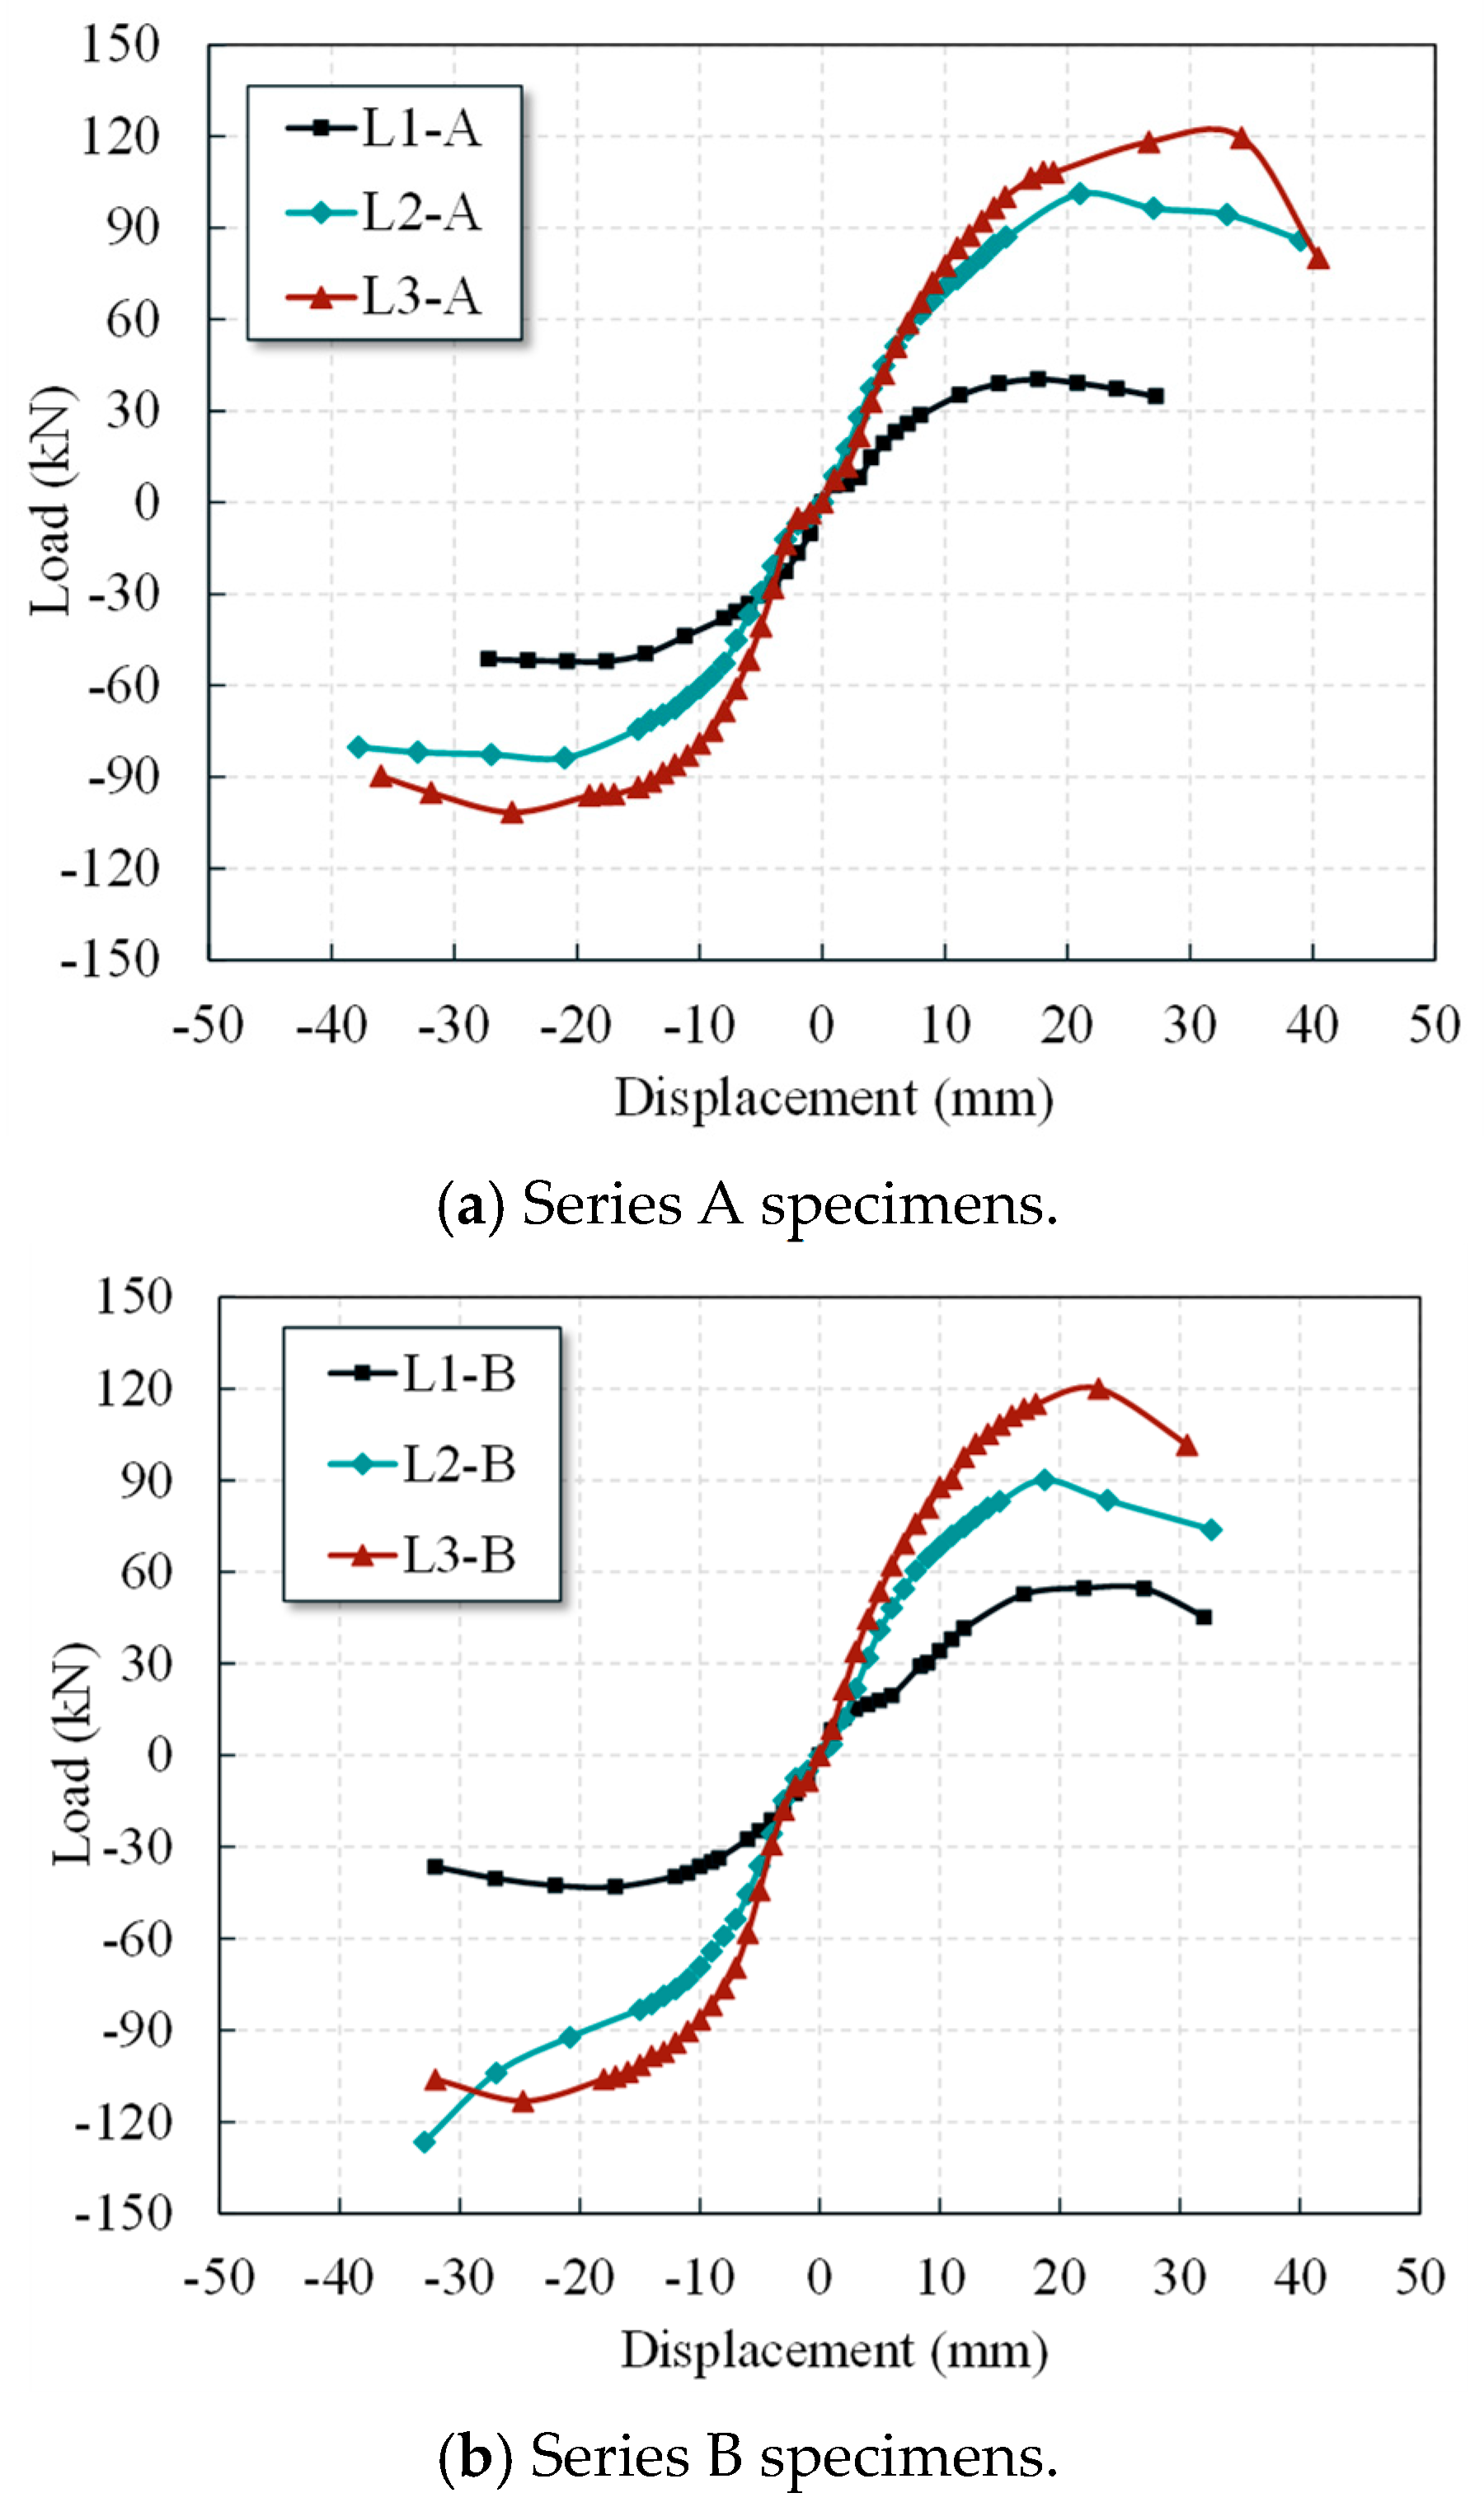
The skeleton curve, which serves as a crucial performance indicator for structures under lateral loading, reveals key parameters such as the stiffness, ductility, and load bearing capacity. Figure 8 depicts the skeleton curves derived from the hysteretic curves under three axial load levels.
Additionally, the skeleton curves of all the specimens exhibited consistent trends. In particular, the degradation rate of the pull strength was significantly slower than that of the push strength. This asymmetric behavior indicates lower negative-direction ductility when compared with the positive-direction ductility in the L-shaped columns under low-cycle loading, which can be attributed to the inherent cross-sectional asymmetry of L-shaped columns. During positive loading, the flange side of the specimen was subjected to tension, whereas the web side without flange restraint experienced compression. The smaller compression zone area on the web side, along with the higher quantity of tensile reinforcement on the flange side, exhibited relatively reduced positive-direction ductility, thereby manifesting in the asymmetry of the observed skeleton curve.

4.4. Ductility Analysis

Ductility quantifies the plastic deformation capacity of structures prior to failure. In Section 4.3, the asymmetric skeleton curves qualitatively revealed the relative magnitudes of the positive and negative ductility in specimens under low-cycle loading. To further quantify and characterize the ductility of the nine L-shaped columns, the displacement ductility coefficient was calculated as follows:
μ = δ u / δ y
where μ represents the ductility coefficient, δu represents the ultimate displacement corresponding to the displacement when the load drops to 85% of the peak load, and δy represents the yield displacement corresponding to the yield load.
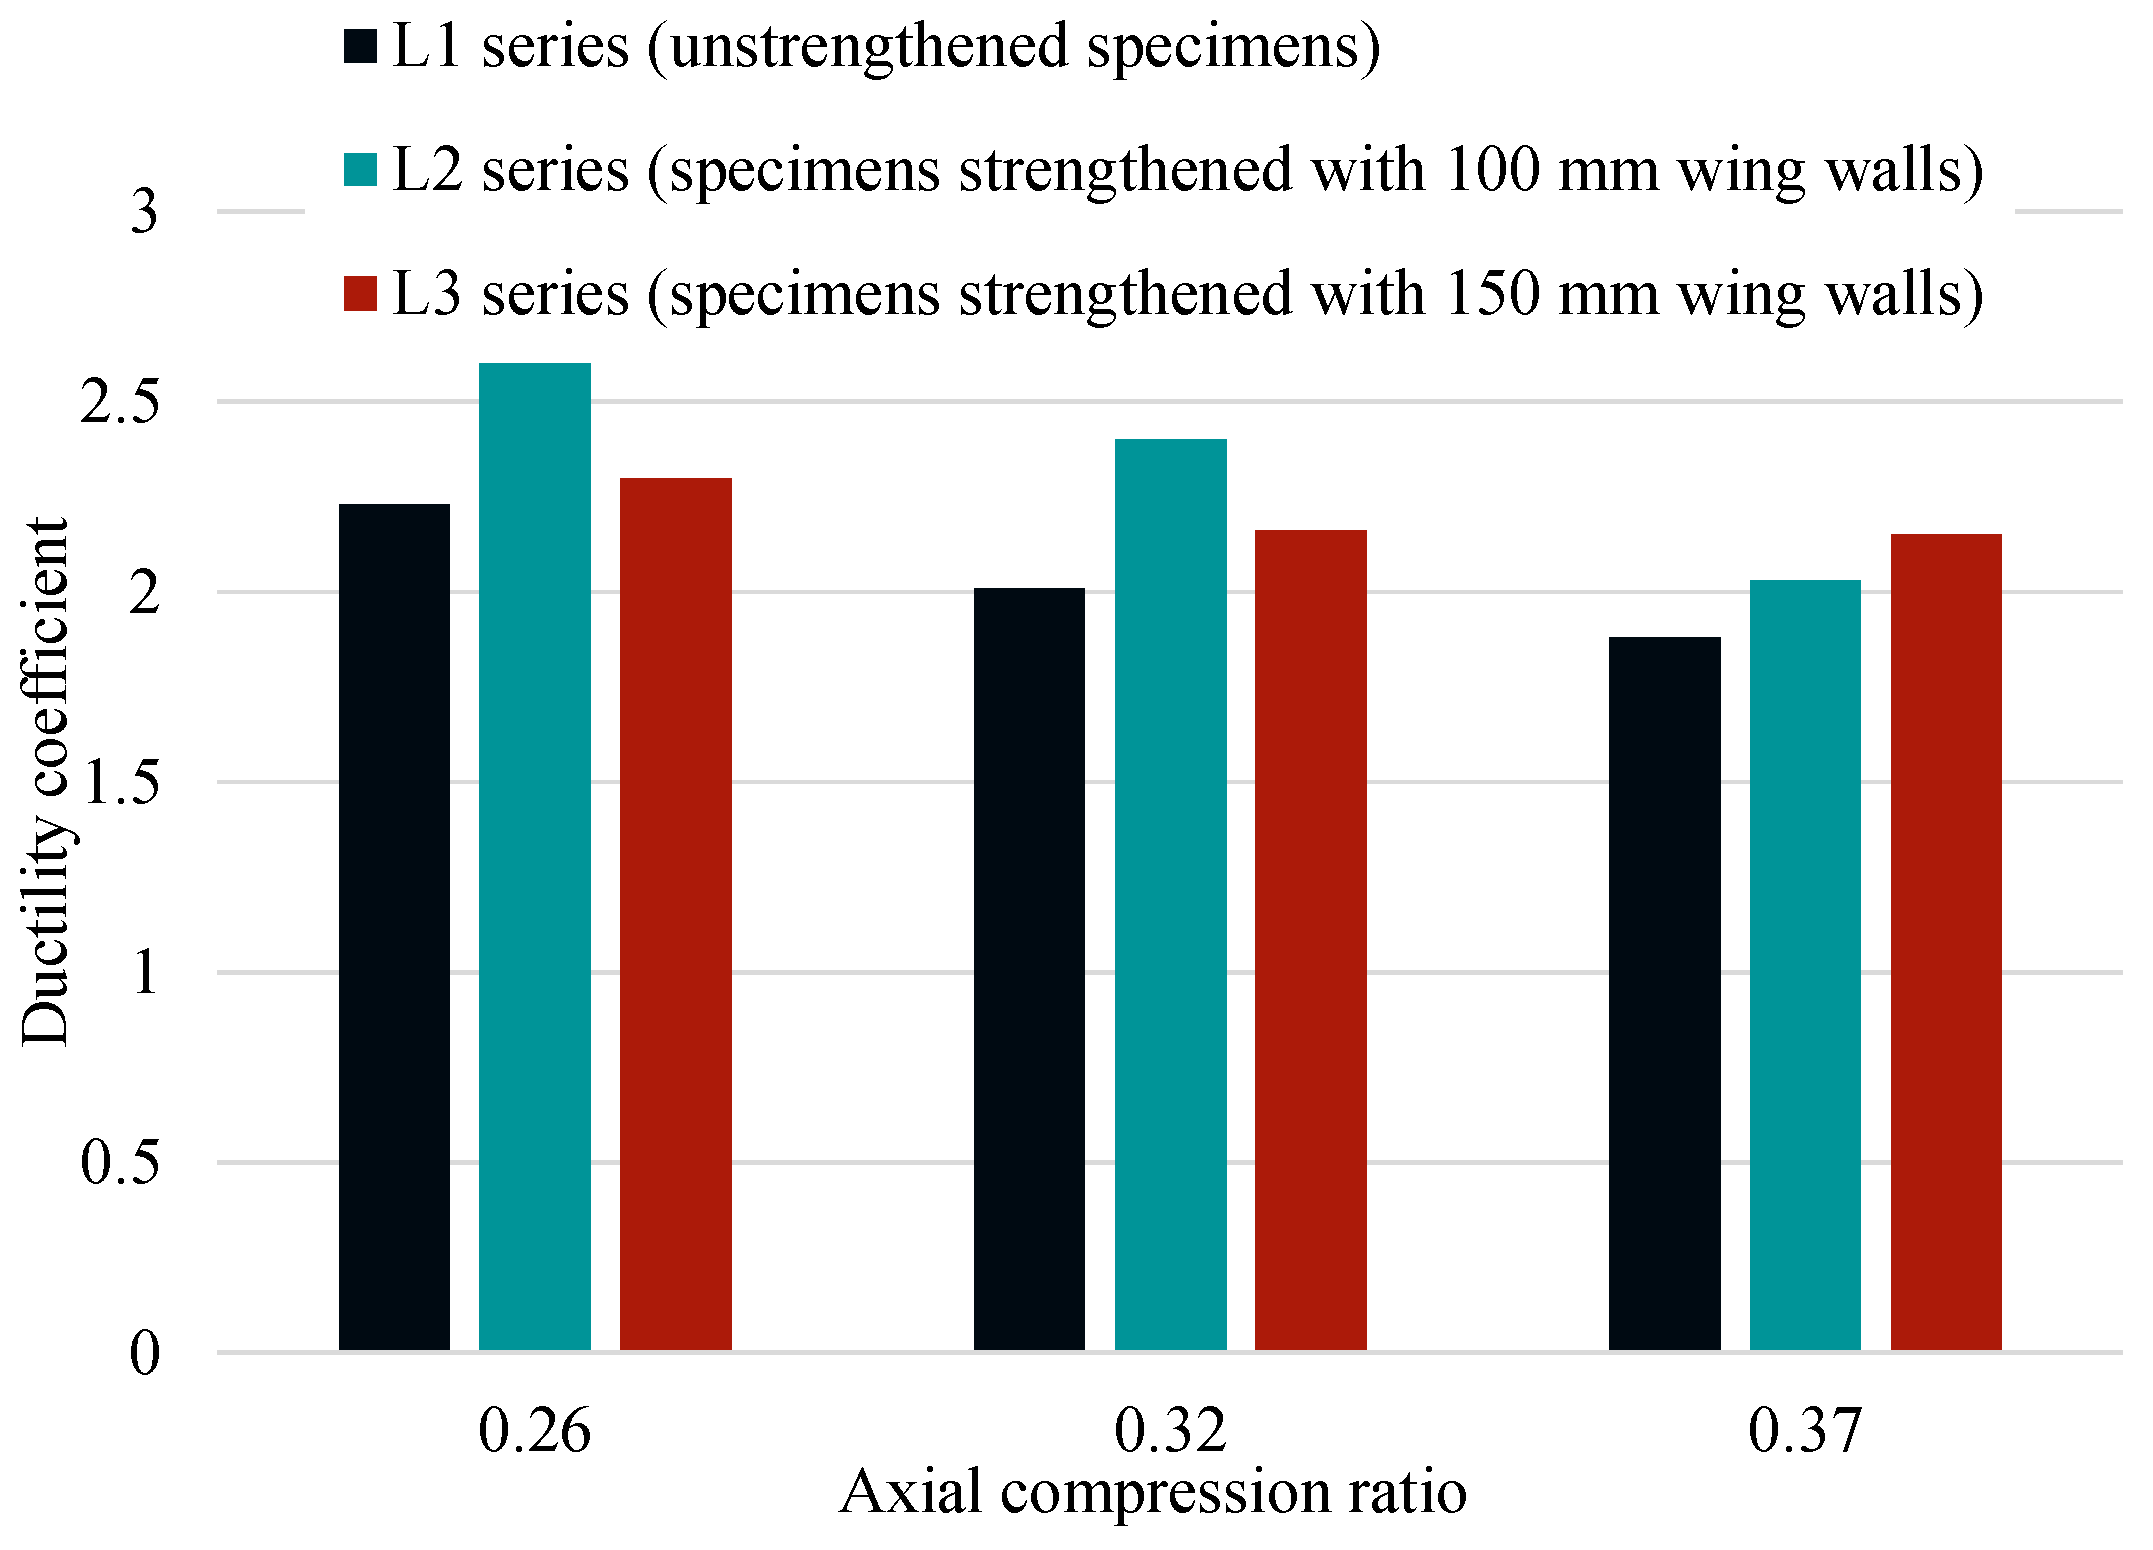
Figure 9 shows the ductility coefficient for all the specimens. The positive-direction ductility coefficient was analyzed in this study. For specimens under an axial load of 287 kN, the experimental axial compression ratio was decreased from 0.26 to 0.19 and 0.16 after being strengthened with wing walls with a length of 100 mm and 150 mm, respectively. The ductility coefficient was also increased by 17% and 3%, respectively. Under higher axial compression ratios of 0.32 and 0.37, the ductility improvements reached 19% and 7%, and 8% and 14%, respectively. These results indicate that the wing wall strengthening effectively increased the ductility. Comparing the ductility coefficient of specimens with various wing wall lengths under the same axial compression force, it was found that although the ductility factors of all the strengthened specimens with varying wing wall lengths improved when compared to the un-strengthened specimens, the trends in ductility factor variation with increasing wing wall length varied between low-to-medium and high axial compression levels. For the three L-shaped columns with high axial compression ratios (0.37), the ductility of the specimens gradually increased with the length of the wing walls. Longer wing walls presented a relatively lower experimental axial compression ratio for the specimens, which continuously improved the ductility performance. Conversely, for the six L-shaped columns subjected to a low-to-medium axial compression ratio (0.26 and 0.32), the ductility coefficient of the specimens exhibited a “first increase then decrease”, trend with an increase in the wing wall length. Considering the three specimens with an axial compression ratio of 0.15 (A series) as an example, the ductility coefficient increased from 2.23 to 2.60 with the incorporation of the wing walls with a length of 100 mm, and then decreased to 2.30 when the wing wall length was extended to 150 mm. This is because an increase in the limb height-to-thickness ratio induced a gradual transition in the failure mode of the L-shaped columns to brittle failure mode, which is similar to shear wall failure. This effect was particularly evident under low and medium axial compression ratios, which ultimately reduced the ductility.

4.5. Stiffness Degradation

Stiffness degradation refers to the phenomenon where the lateral stiffness of the RC members gradually decreases with an increase in the displacement amplitudes under lateral cyclic loading. The secant stiffness, K, is introduced to characterize the stiffness performance at different loading and deformation stages, and is calculated as follows:
K = F + + F + +
where F+ and F represent the positive and negative peak loads under the same displacement cycle, and Δ+ and Δ represent the corresponding positive and negative maximum displacements at the column top under the same displacement cycle.
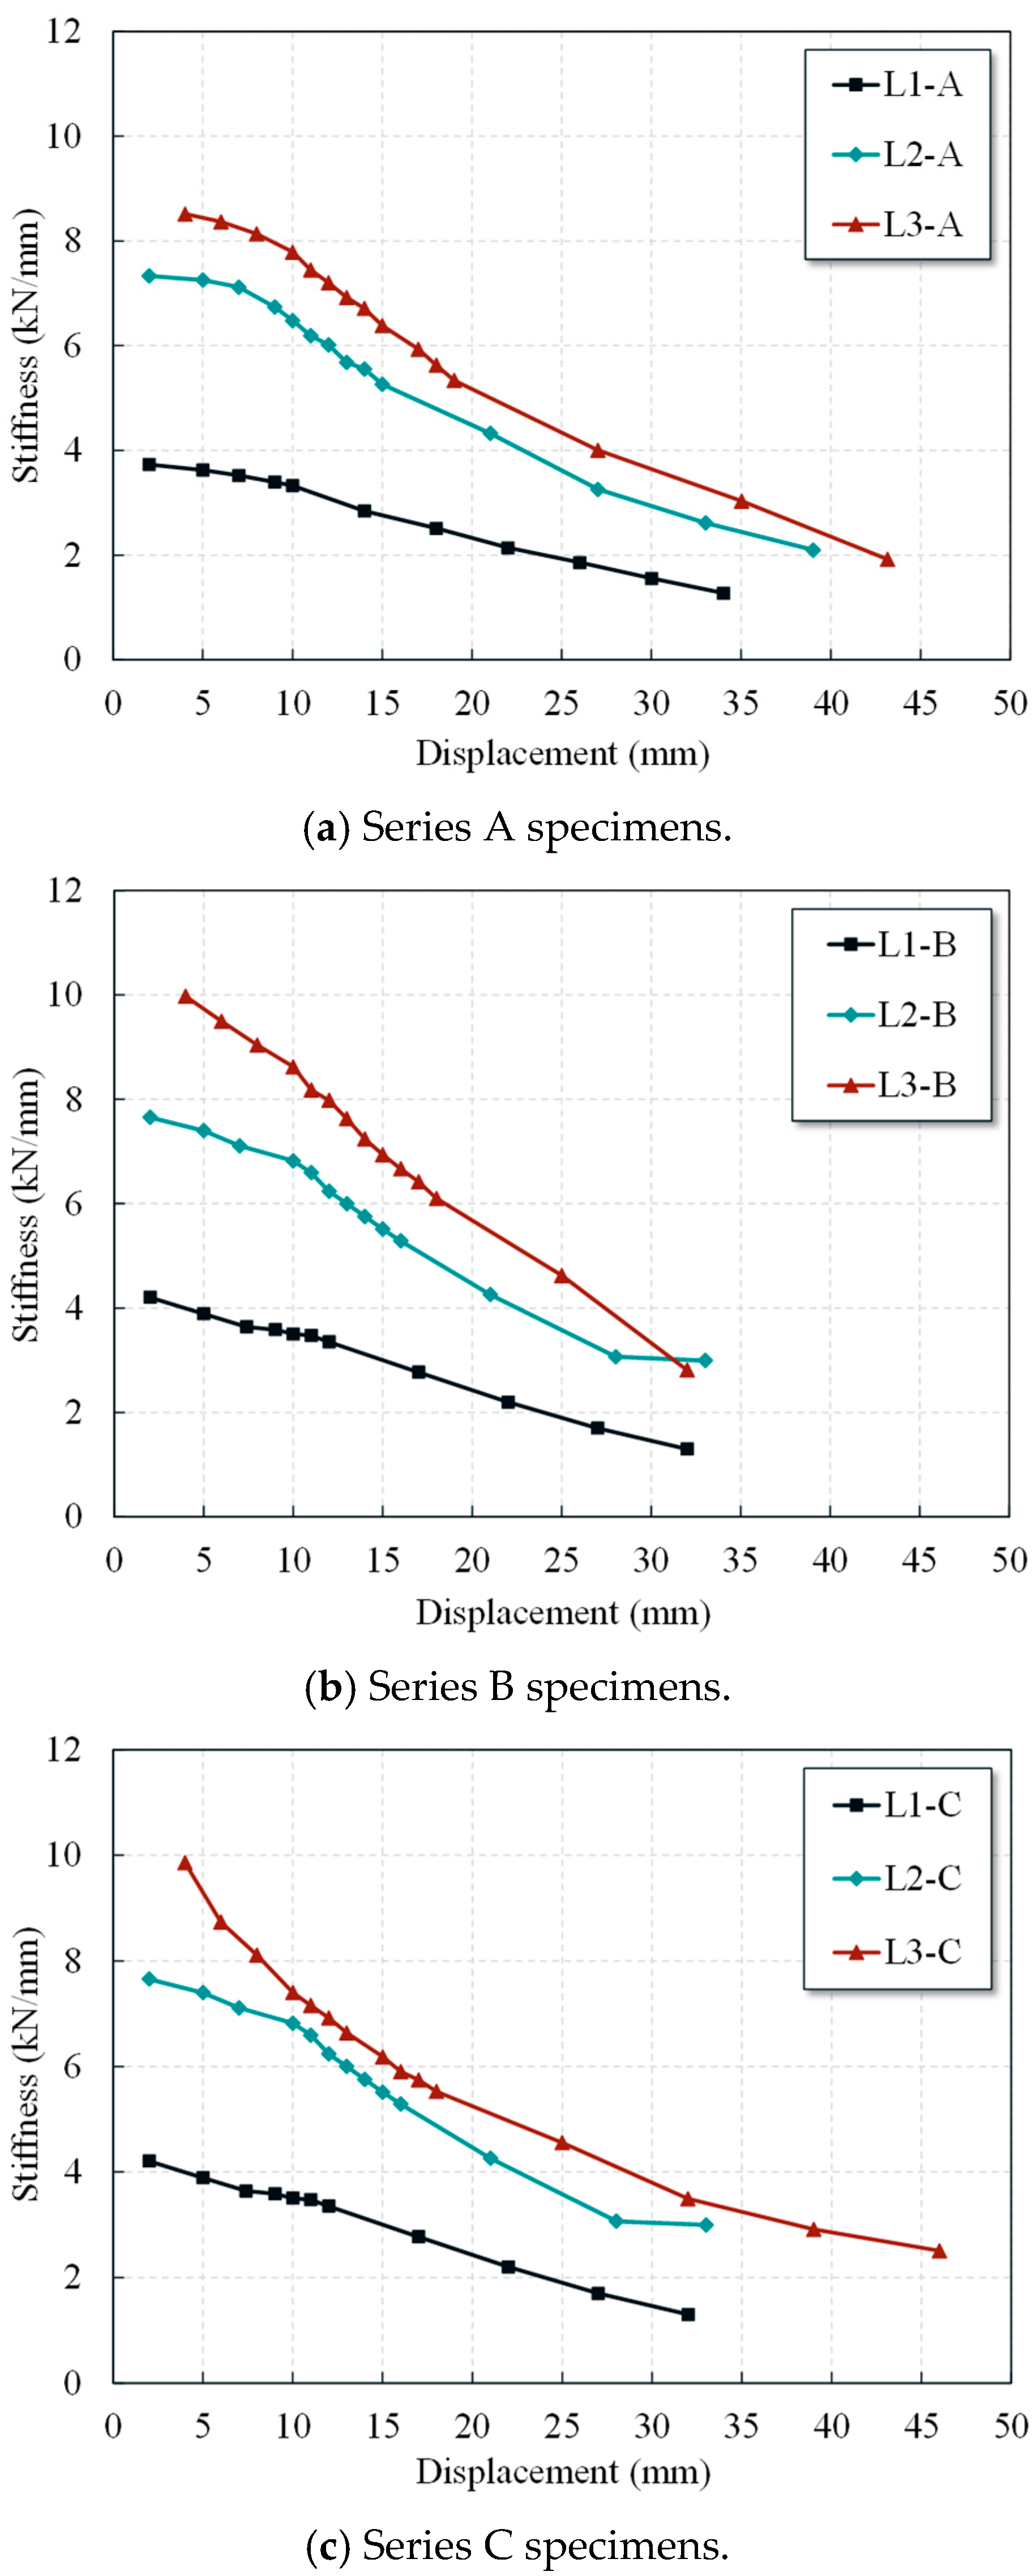
Figure 10 depicts the stiffness degradation curves of each specimen. When the column axial compression ratio was 0.26, the incorporation of the 100 mm and 150 mm wing walls increased the initial stiffness of the specimens by 97% and 128%, respectively, as shown in Figure 10a. Similarly, for specimens under an axial compression ratio of 0.32, the improvements reached 82% and 137%, as shown in Figure 10b. For specimens with an axial compression ratio of 0.37, the initial stiffness increased by 76% and 110%, respectively, as shown in Figure 10c. These results indicate a significant enhancement in the overall initial stiffness of the L-shaped columns following wing wall strengthening.
The stiffness degradation curves of all the specimens can be generally divided into two stages: the first stage during initial loading, where the stiffness degradation rate is relatively rapid, and the second stage characterized by progressive crack development, during which the stiffness degradation rate slows down as the energy dissipation capacity of the specimens becomes fully utilized. Specimens strengthened with different lengths of wing walls under the same axial compression load exhibited distinct trends in stiffness degradation. Specimens L3-A and L3-B exhibited steeper stiffness degradation curves in the later loading stages when compared with L2-A and L2-B, which can be attributed to the accelerated development of diagonal cracks. This suggests that when the wing wall length reached 150 mm, ductility decreased, compared to that of specimens with wing walls with a length of 100 mm, and brittle failure was observed. Conversely, a comparison between specimens L3-C and L2-C under an axial compression ratio of 0.37 indicated that the stiffness degradation curve of L3-C was more gradual in the later loading stages. This indicates that under higher axial compression ratios, increasing wing wall length improved ductility, as shown in Figure 10c.

4.6. Energy Dissipation Capacity

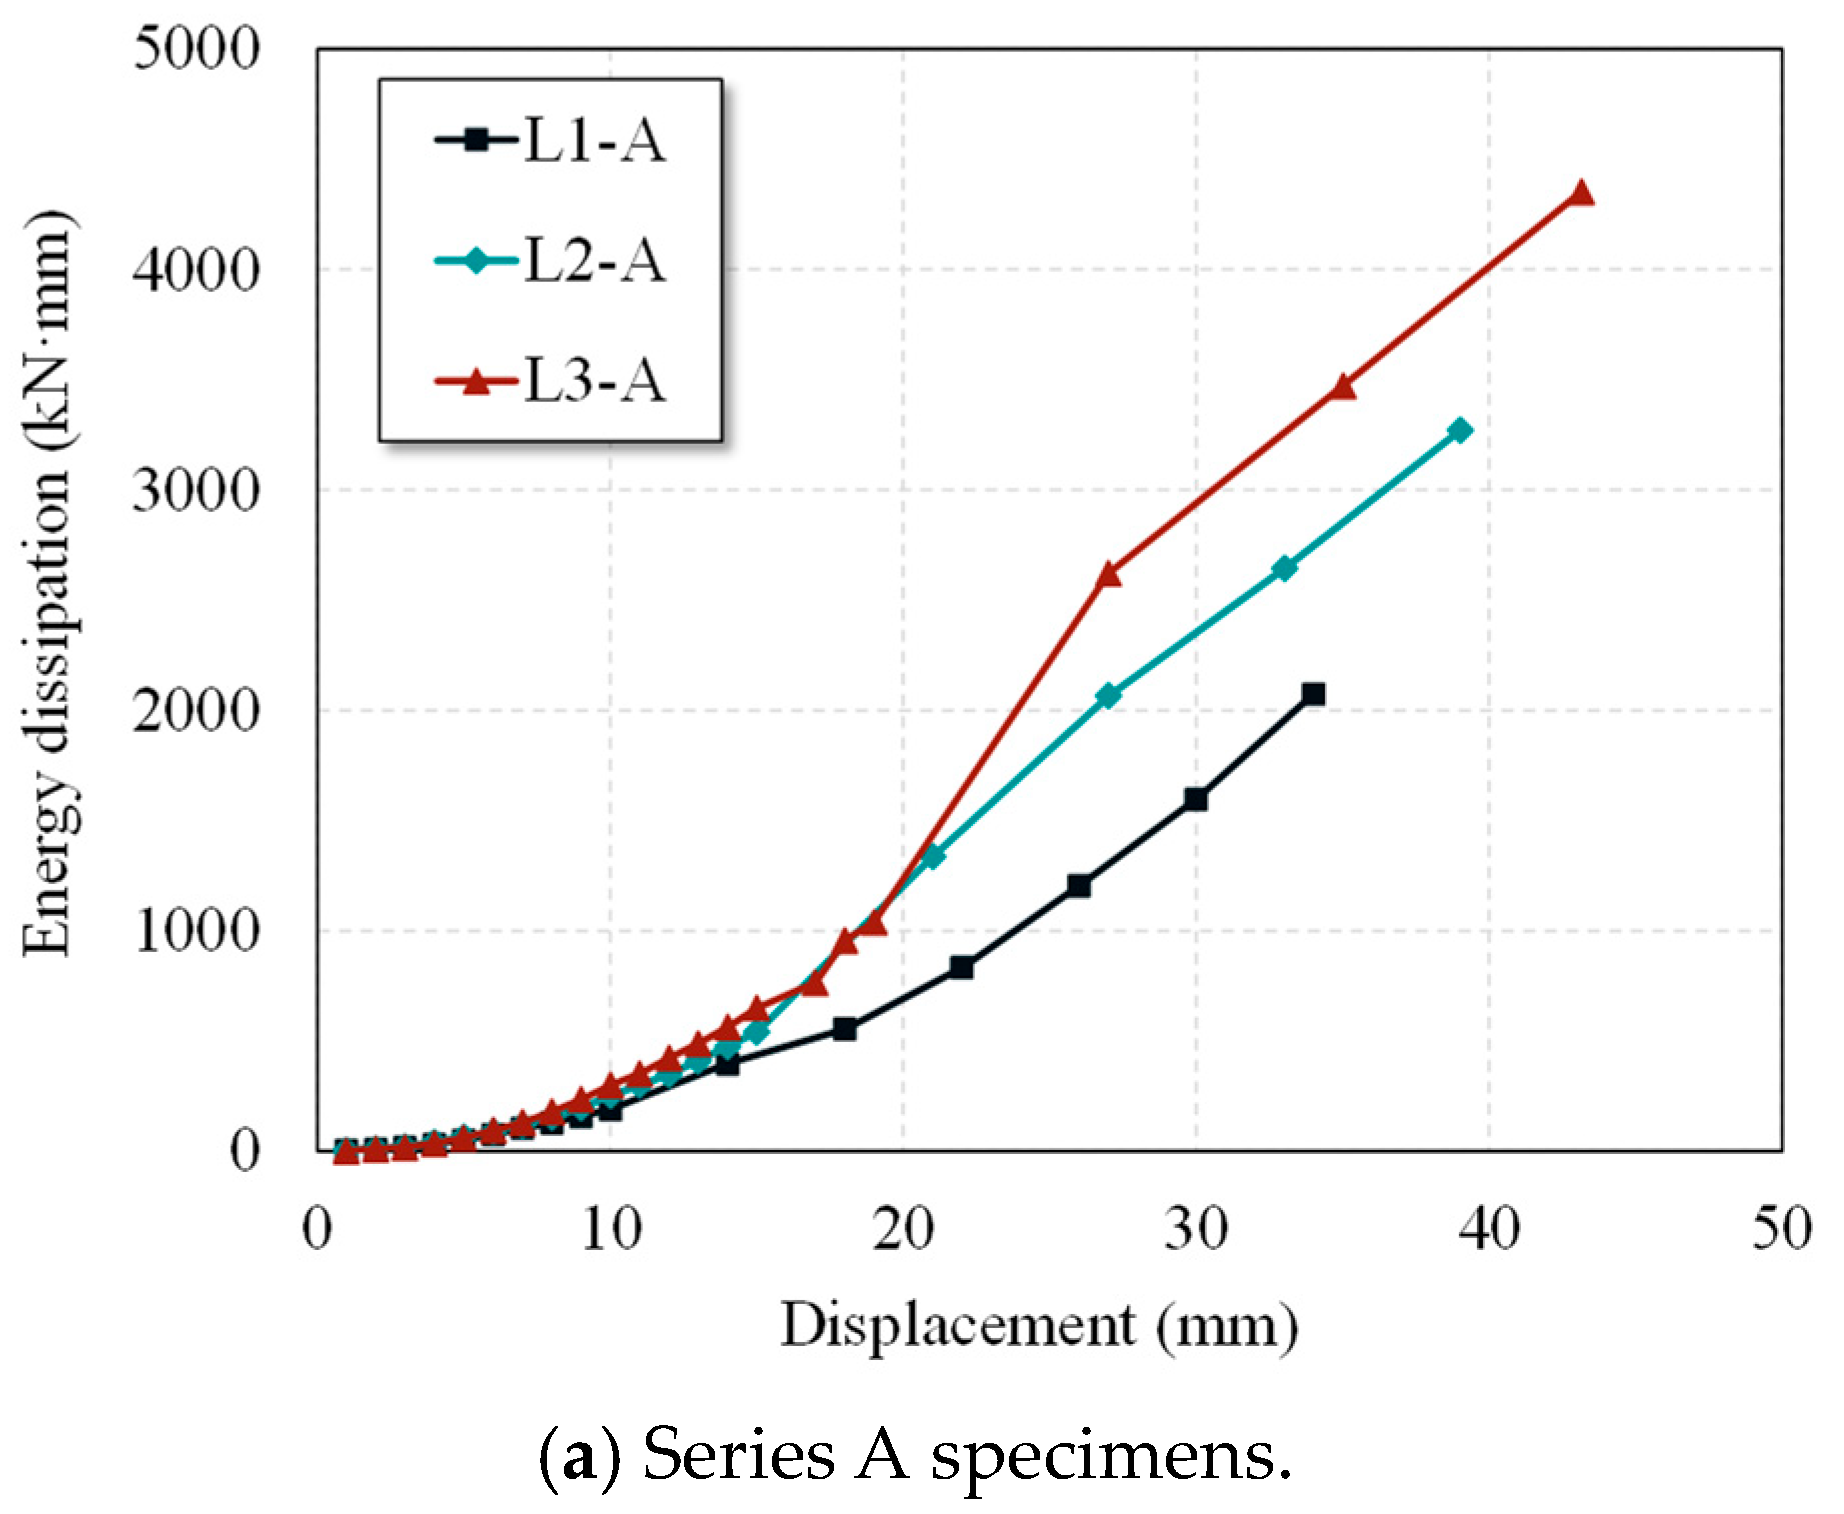
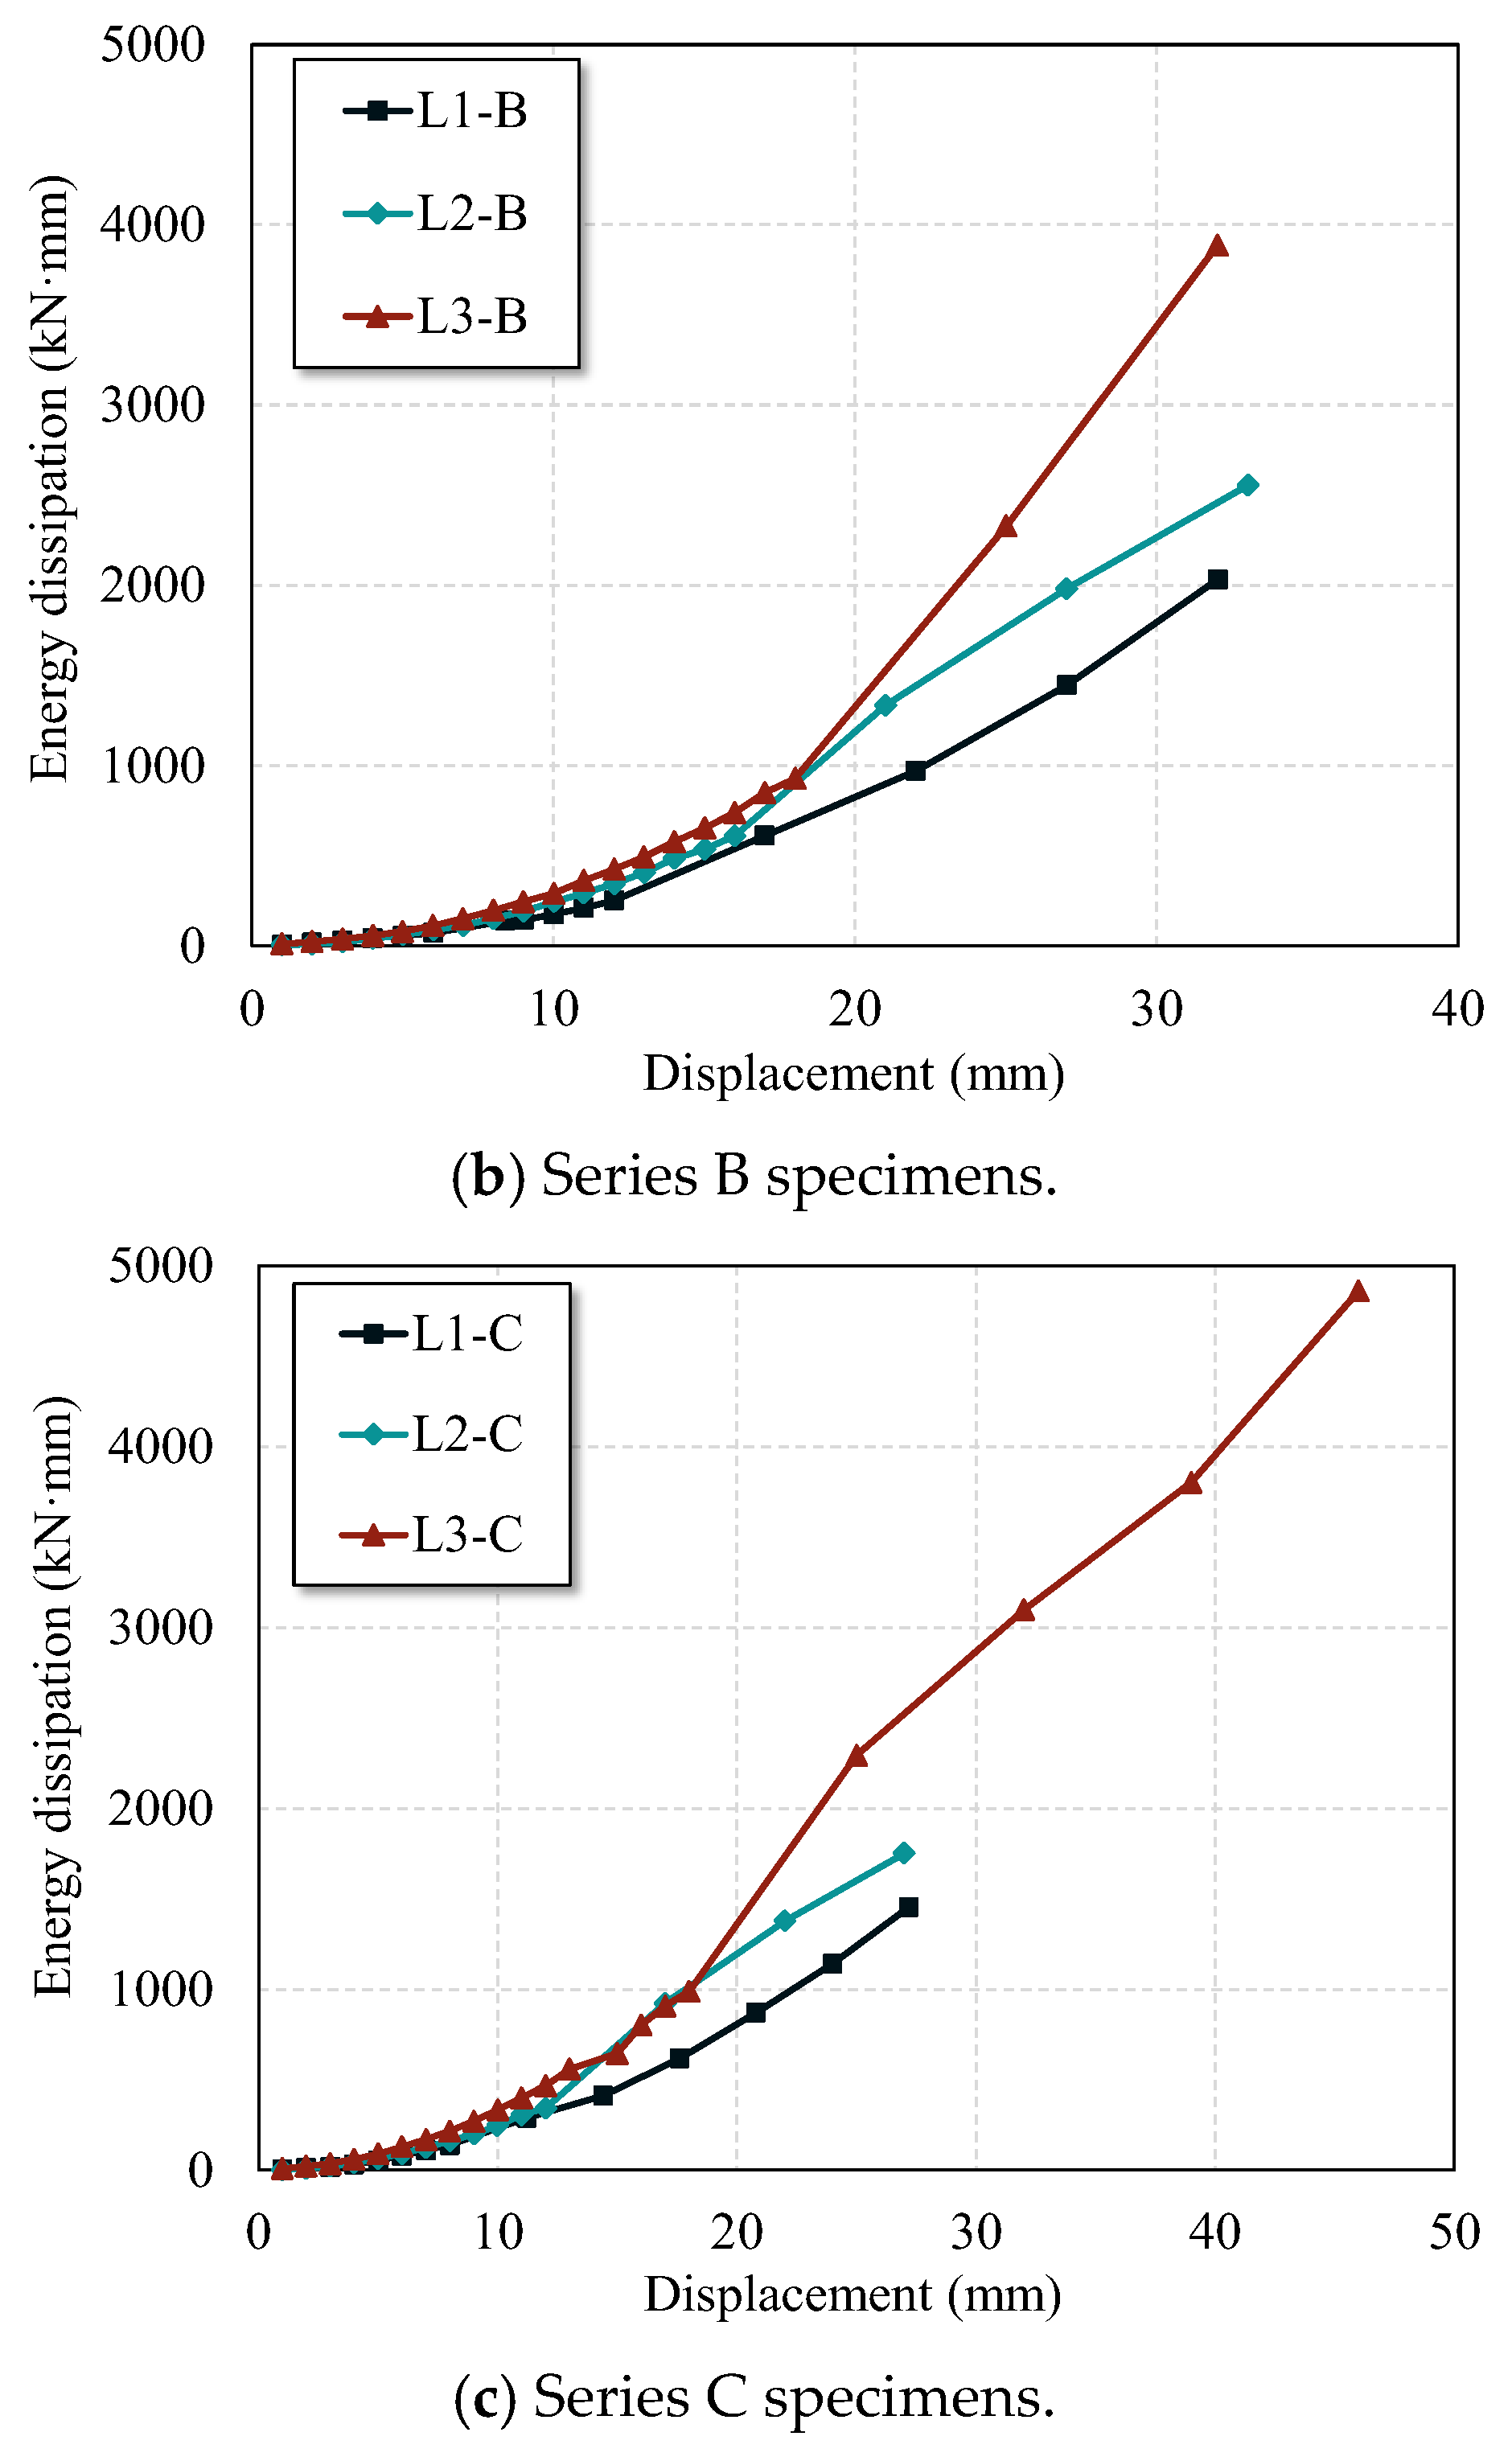
The area under the load versus displacement curve up to the ultimate state is typically used as a quantitative metric with which to evaluate the energy dissipation performance of the specimens. Figure 11 shows a comparison of the energy dissipation curves of the strengthened and un-strengthened specimens under various axial compression ratios. It is observed that under varying axial compression ratios, the energy dissipation at failure for the un-strengthened specimens was only 2074.78 kN·mm, 2031.86 kN·mm, and 1455.33 kN·mm. These values increased to 3270.84 kN·mm, 2554.03 kN·mm, and 1751.95 kN·mm, respectively, for specimens with wing walls with a length of 100 mm, and further increased to 4353.28 kN·mm, 3885.11 kN·mm, and 4861.10 kN·mm, respectively, for those with wing wall lengths of 150 mm. Under an axial compression ratio of 0.37, strengthening using a wing wall with a length of 150 mm presented the most significant improvement, with the cumulative energy dissipation increasing by 334% when compared with that of the un-strengthened specimen under the same axial load conditions. These results clearly exhibit that wing wall strengthening significantly improved the energy dissipation capacity of the RC L-shaped columns across all the axial compressive ratio states, and this improvement increased with increasing wing wall length.
The energy dissipation curves indicated that during the initial loading phase, all the specimens remained in the elastic stage, primarily exhibiting elastic flexural deformation. The energy dissipation among all the specimens exhibited minimal variation and remained at a relatively low level. The specimens progressed into the elastoplastic phase with an increase in the loading displacement, characterized by the onset of yielding in the compressed longitudinal reinforcement and the development of plastic strains in the concrete. This transition caused the expansion of the hysteresis loop areas and gradual accumulation of the energy dissipation. At this stage, the wing wall-strengthened specimens demonstrated significantly accelerated energy dissipation growth rates when compared with the un-strengthened specimens, with the former’s energy dissipation values considerably exceeding those of the latter. This observation further indicates that wing walls can effectively redistribute lateral loads and actively contribute to the elastoplastic deformation process under cyclic loading, thereby significantly enhancing the energy dissipation capacity of RC L-shaped columns.

4.7. Strain Analysis

4.7.1. Steel Strain

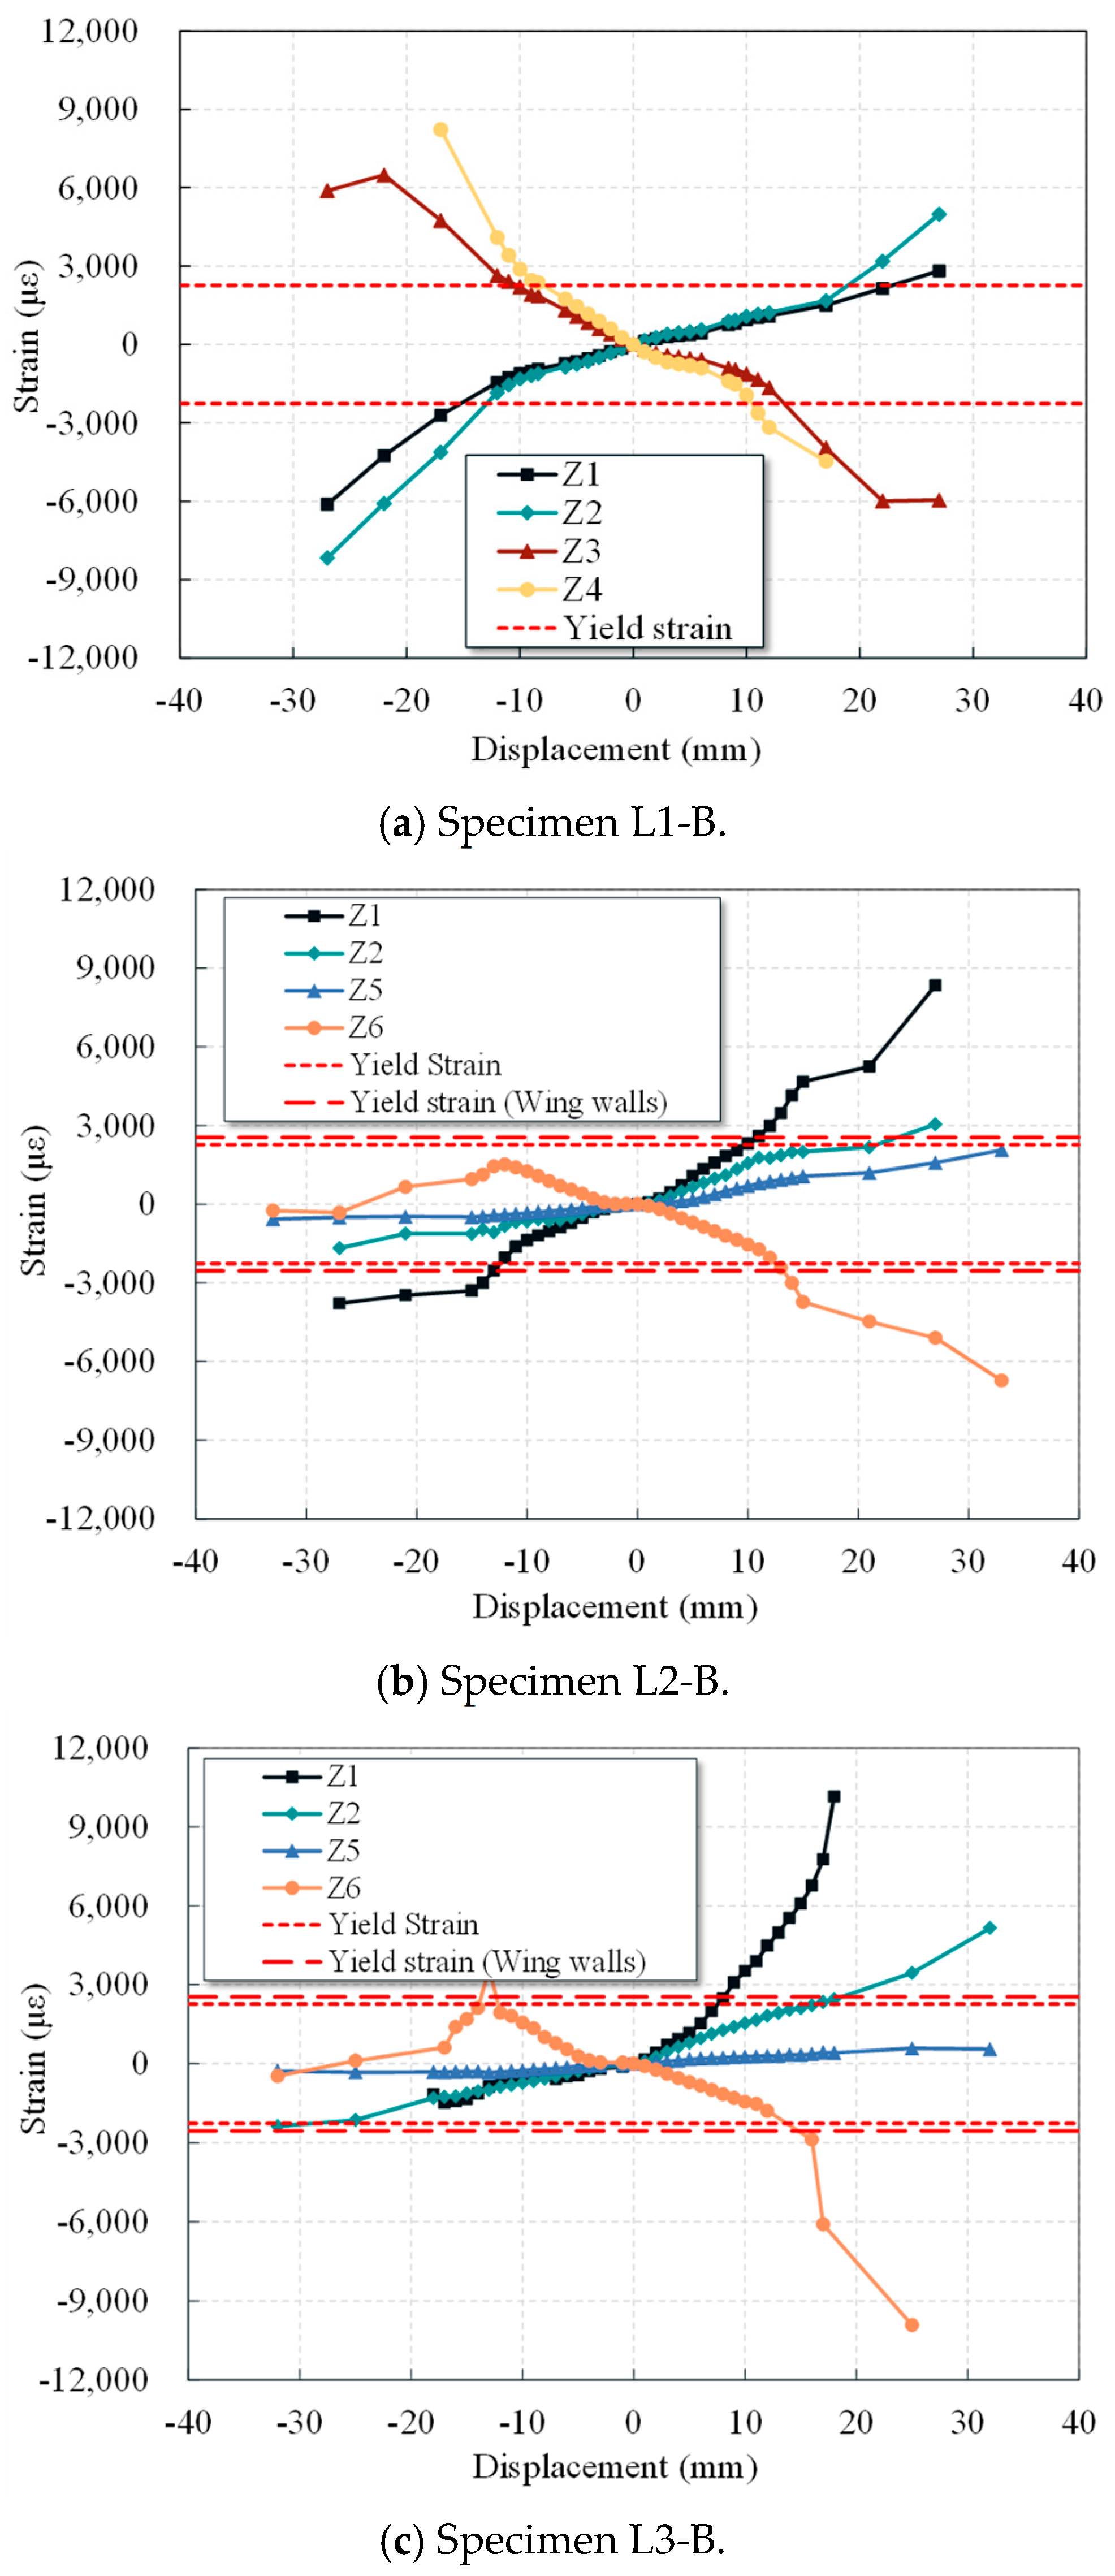
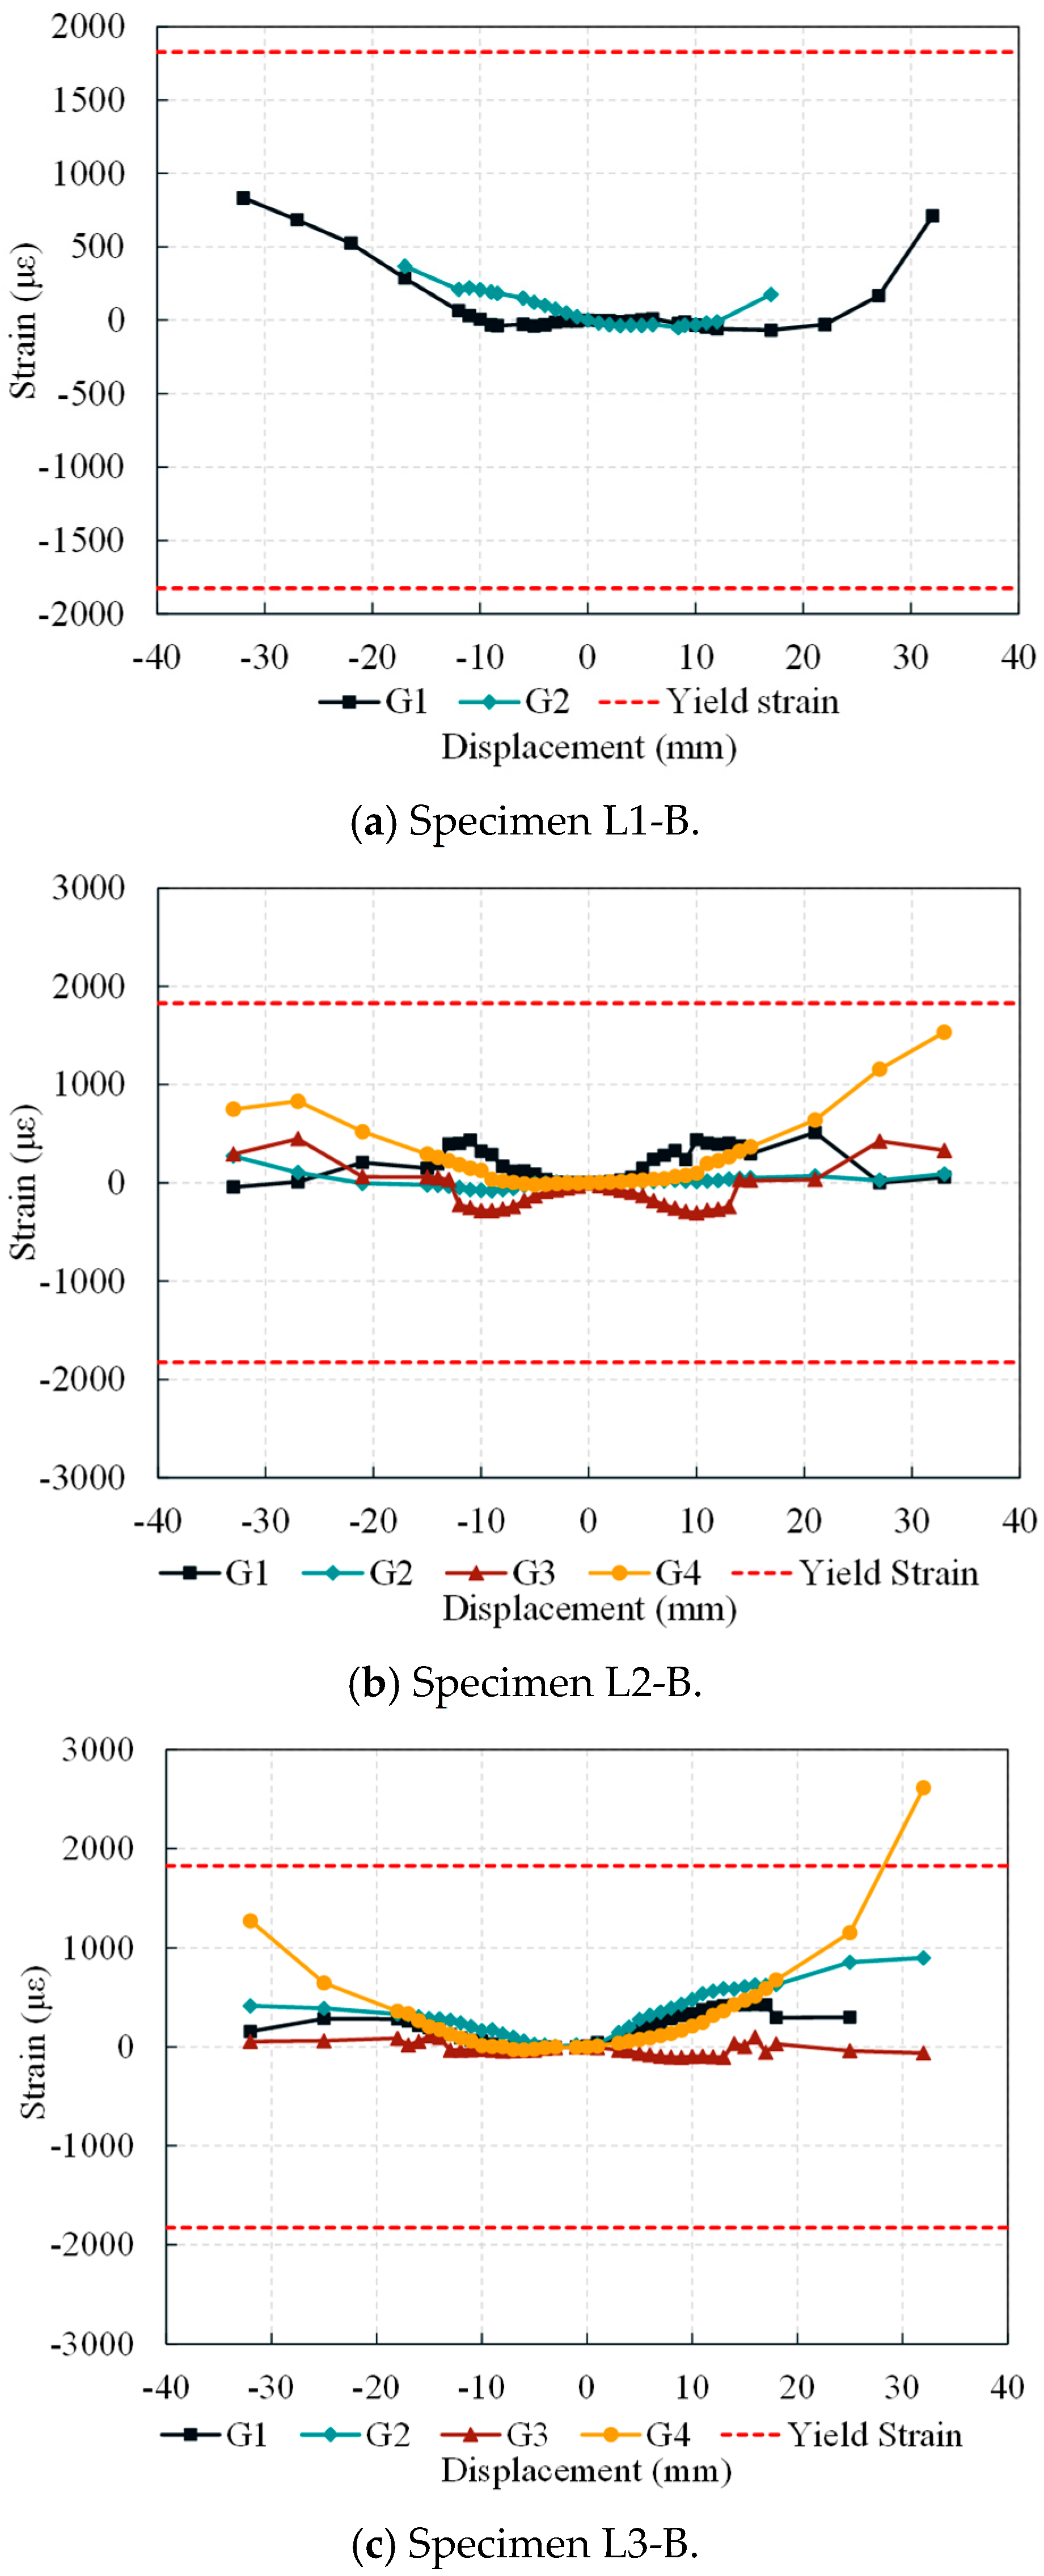
Owing to the similarity in the failure modes and stress evolution patterns across all the specimens, the strain test results of the longitudinal bars and stirrups from representative specimens (L1-B, L2-B, L3-B) were analyzed, as shown in Figure 12 and Figure 13. The longitudinal bars exhibited alternating tension and compression with increasing displacement. The yielding sequence was significantly influenced by the asymmetric cross-section. In the un-strengthened specimen, L1-B, bars Z1 and Z2 yielded under the positive-direction tension, whereas in the negative direction, the strain increased more rapidly due to the insufficient reinforcement bars. Rebars Z3 and Z4, under negative-direction tension, exceeded the yield strain early, exhibiting smaller negative-direction yield displacements when compared with those in the positive direction.
With wing wall strengthening, the longitudinal bar strain distribution varied significantly. In specimen L2-B, the strain at point Z5 remained below the yielding point due to the addition of the wing walls, whereas the strain at point Z6 was increased during negative loading as the unyielded bars resumed tension following concrete spalling. In L3-B, the extended wing wall length caused rebar Z6 to yield under the positive-direction compression. The improved enhancement also caused greater strain fluctuations under negative-direction tension. Overall, the strengthened specimens exhibited more yielding. The rebars on the wing wall side exhibited limited strain due to redundancy, whereas the rebars on the non-wing wall side exhibited more significant strain changes, which were influenced by crack propagation.
The stirrup strains in all three specimens remained mostly below the yielding limit and closely corresponded to the presence of diagonal cracks. It should be noted that, in L1-B, strain gauge G2 yielded and became damaged due to the direct intersection with a diagonal crack (the data after strain gauge damage is not shown in the figure). In L2-B and L3-B, the stirrup strain distribution was more symmetric. However, only G4 in L3-B intersected a crack and yielded owing to the randomness of the crack propagation. It is noted that other measurement points remained below 1000 με.

4.7.2. Concrete Strain

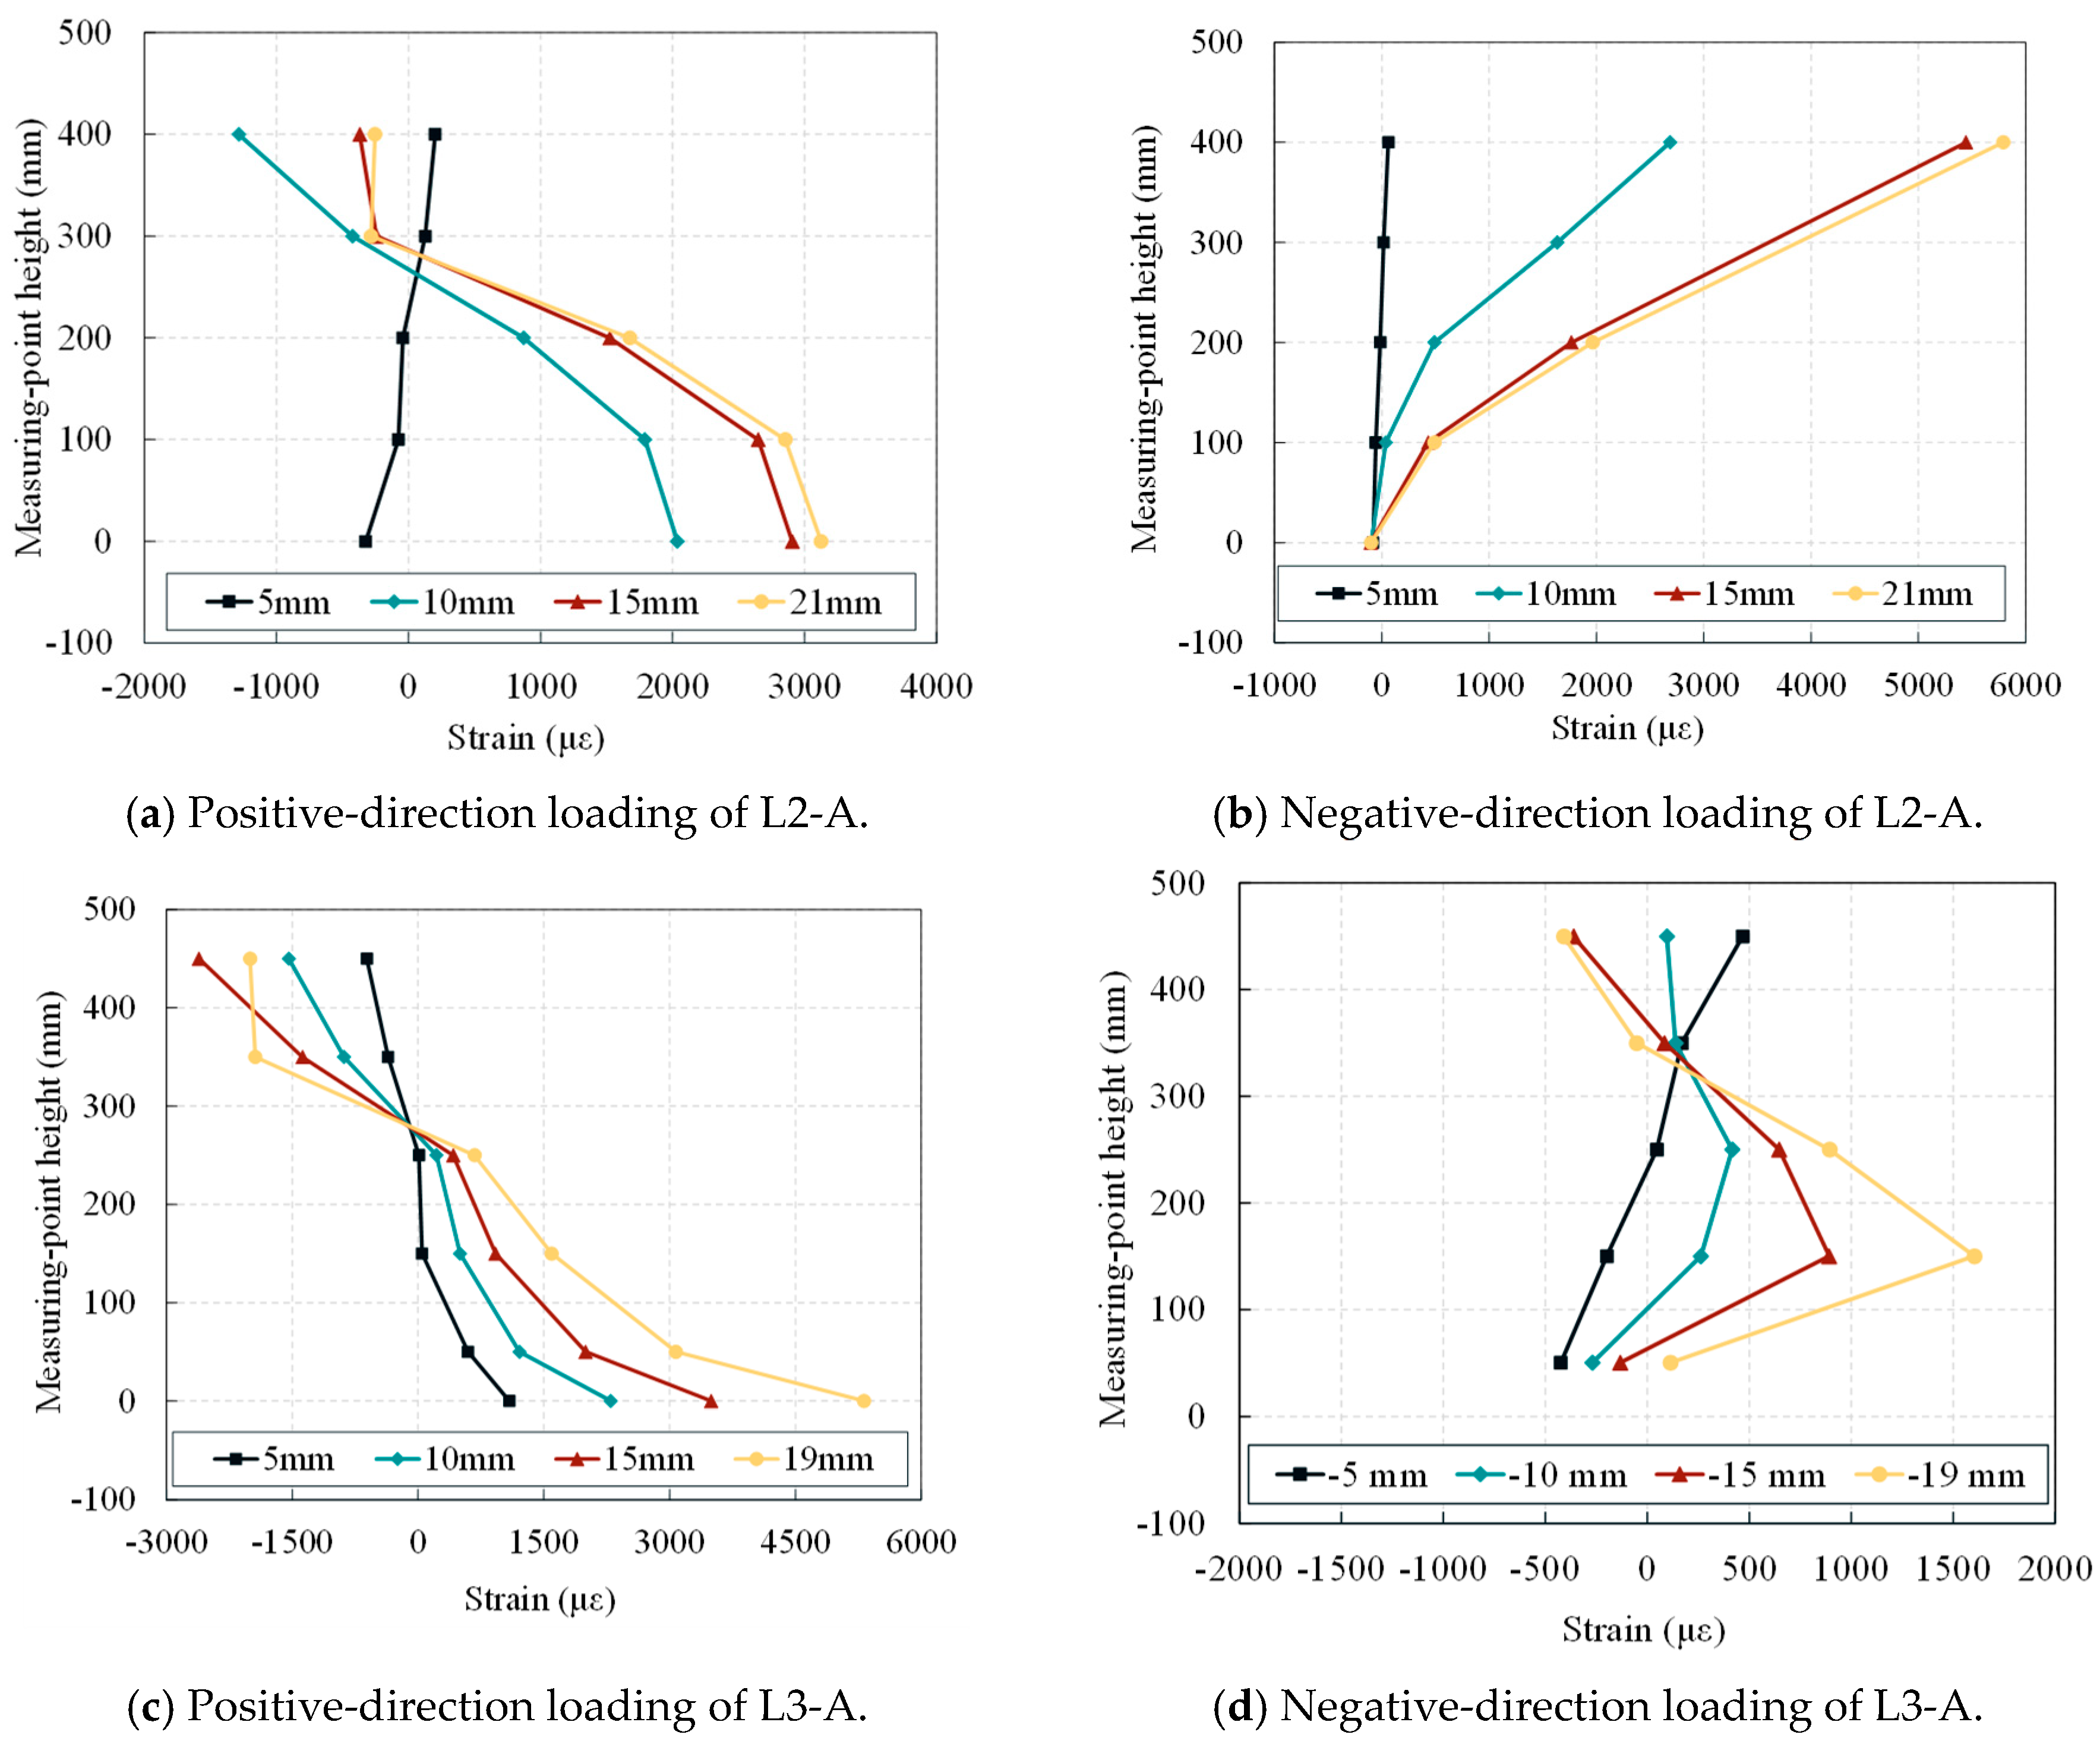
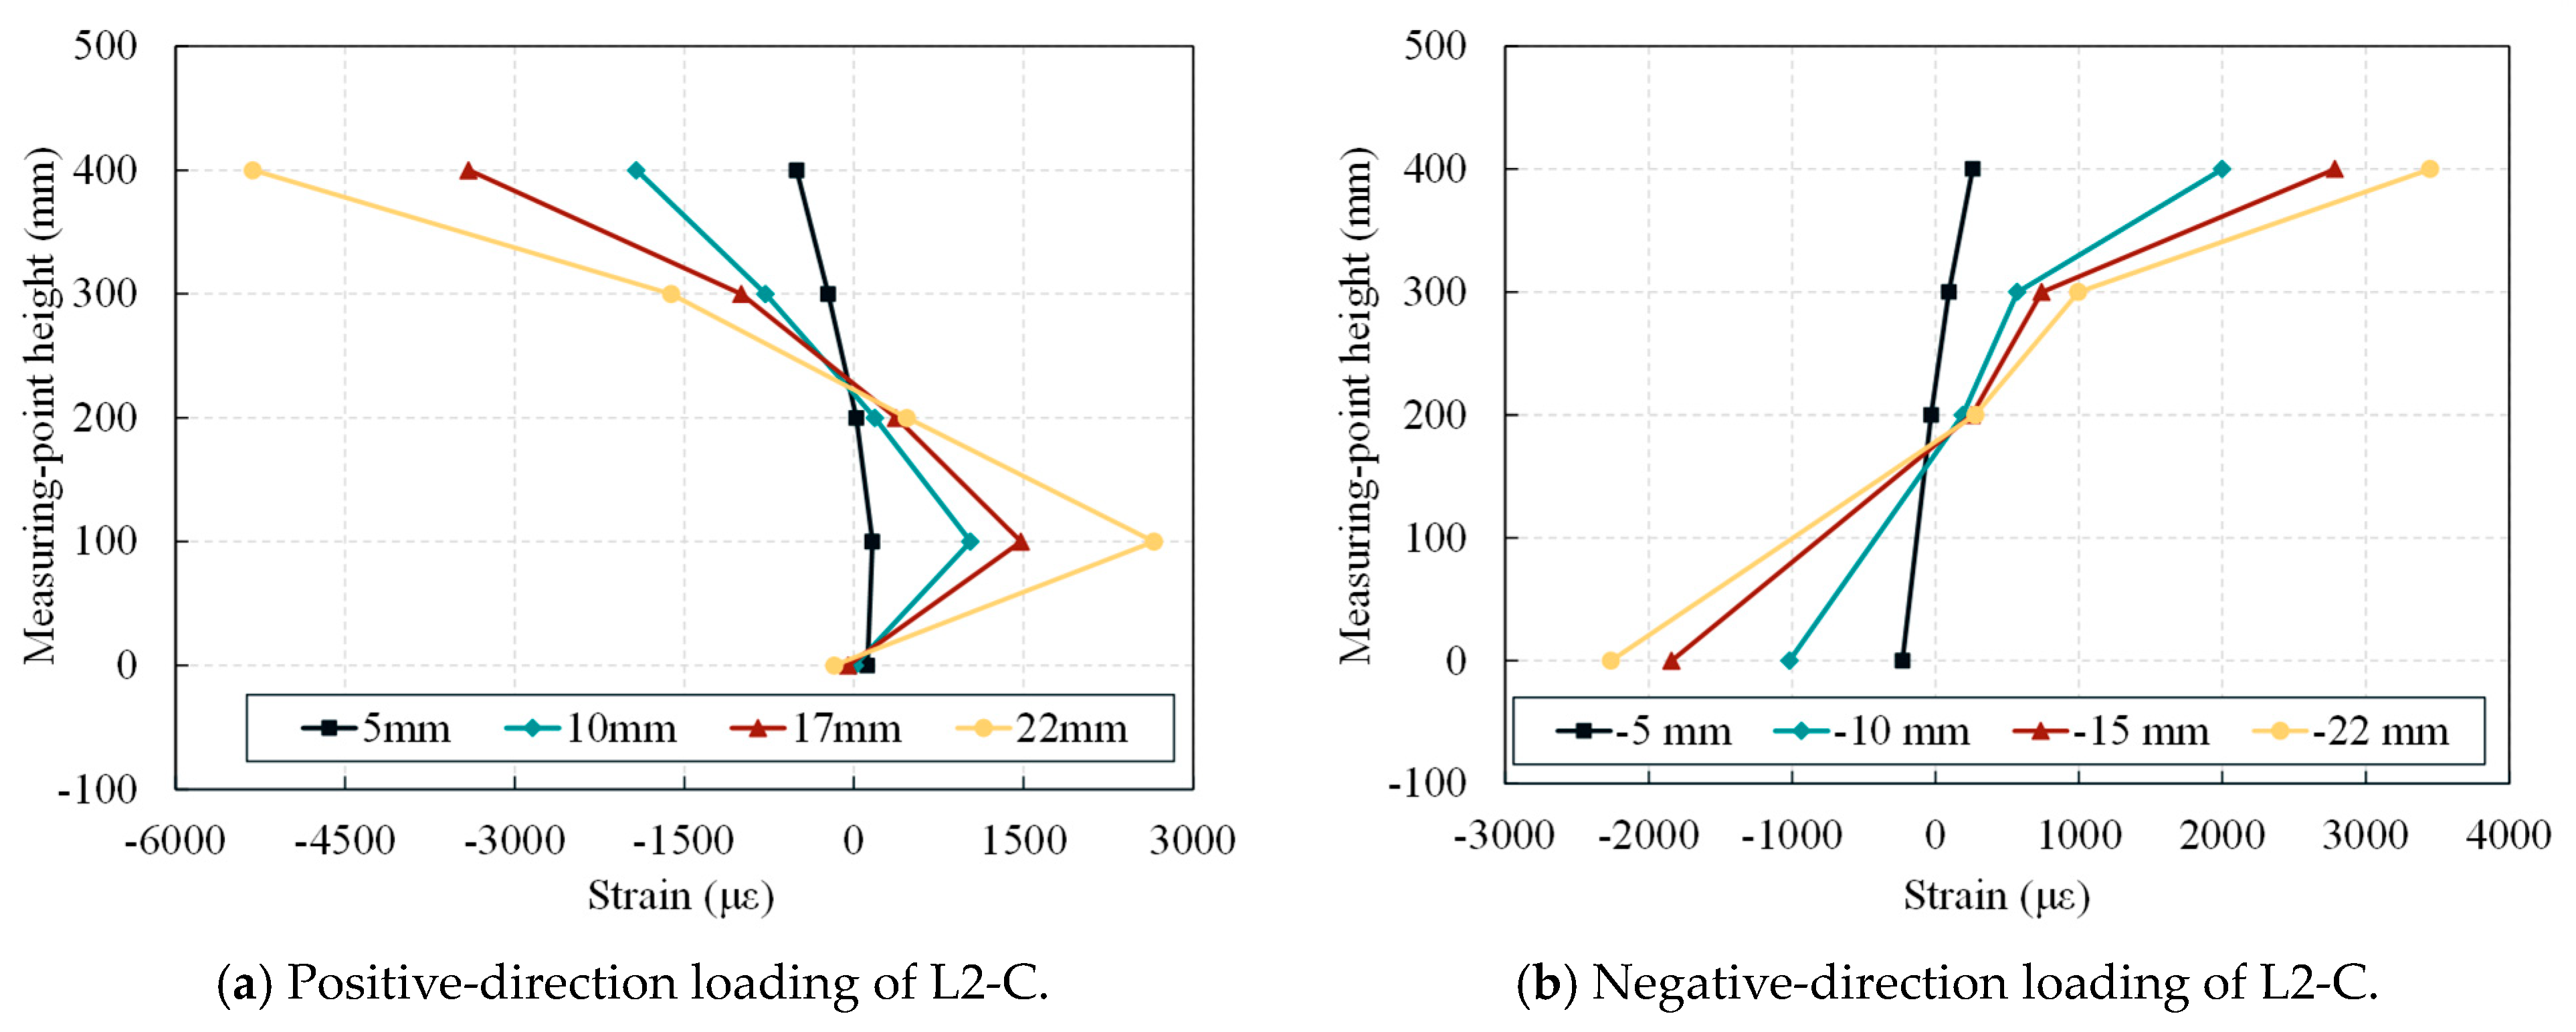
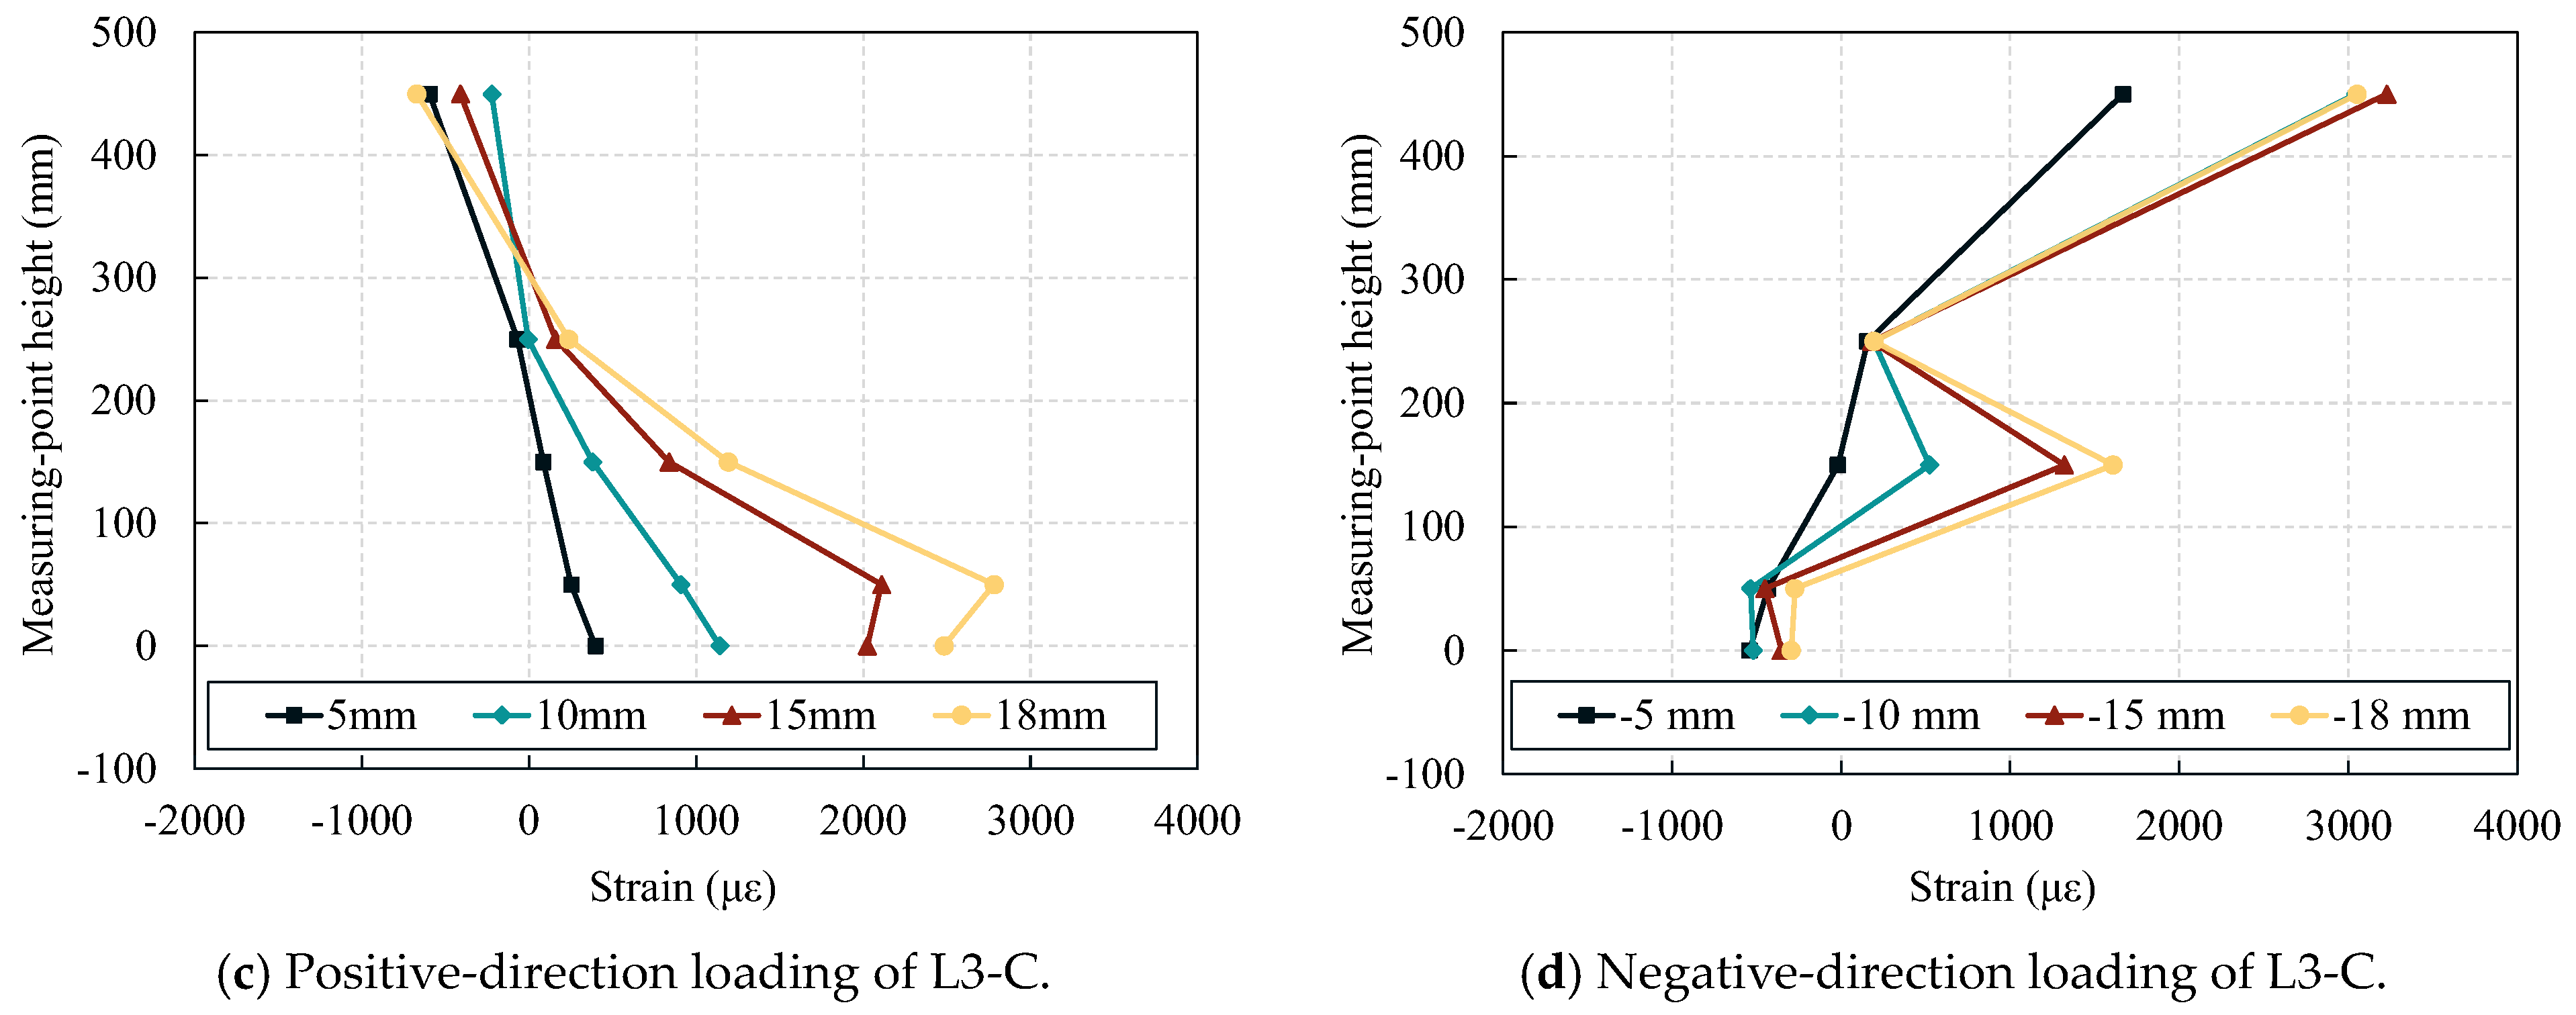
To evaluate whether the wing wall-strengthened specimens corresponded to the plane sections during loading, the concrete strain at the column base was measured using 100 mm electrical resistance strain gauges placed approximately 50 mm above the column base. The strain data was recorded at the peak displacement of each loading cycle with a step size of 5 mm. The strain versus section height curves were plotted for the strengthened specimens, as shown in Figure 14, Figure 15 and Figure 16. Typically, the concrete strain increased with an increase in the displacement. The strain distribution evolution can be divided into three phases: (1) The initial loading phase, in which limited cracking was observed at small displacements. The strain–height curves remained approximately linear, demonstrating that the plane sections remained plane. (2) The crack development phase, in which the cracks propagated and occasionally intersected the strain gauges with an increase in displacement, resulting in localized distortions and abrupt changes in the curves. For example, at a negative displacement of 10 mm, the concrete at a height of 250 mm cracked under tension. Excluding these affected data points, the overall trend remained nearly linear. (3) The severe cracking phase, where, in the later loading stages, intensive crack propagation caused significant data distortion, making some strain readings unreliable.

5. Finite Element Analysis

In this section, the FE models of nine L-shaped RC specimens are established using the commercial FE software DIANA v10.10. The FE analysis results are compared with the experimental results to validate the FE models. A design methodology needs to be established to calculate the lateral load bearing capacity owing to the limited number of test specimens. Therefore, the parameters are varied to supplement the experimental data based on the validated model, ultimately deriving a lateral load bearing capacity calculation formula for the wing wall-strengthened L-shaped columns through linear regression.

5.1. Finite Element Model

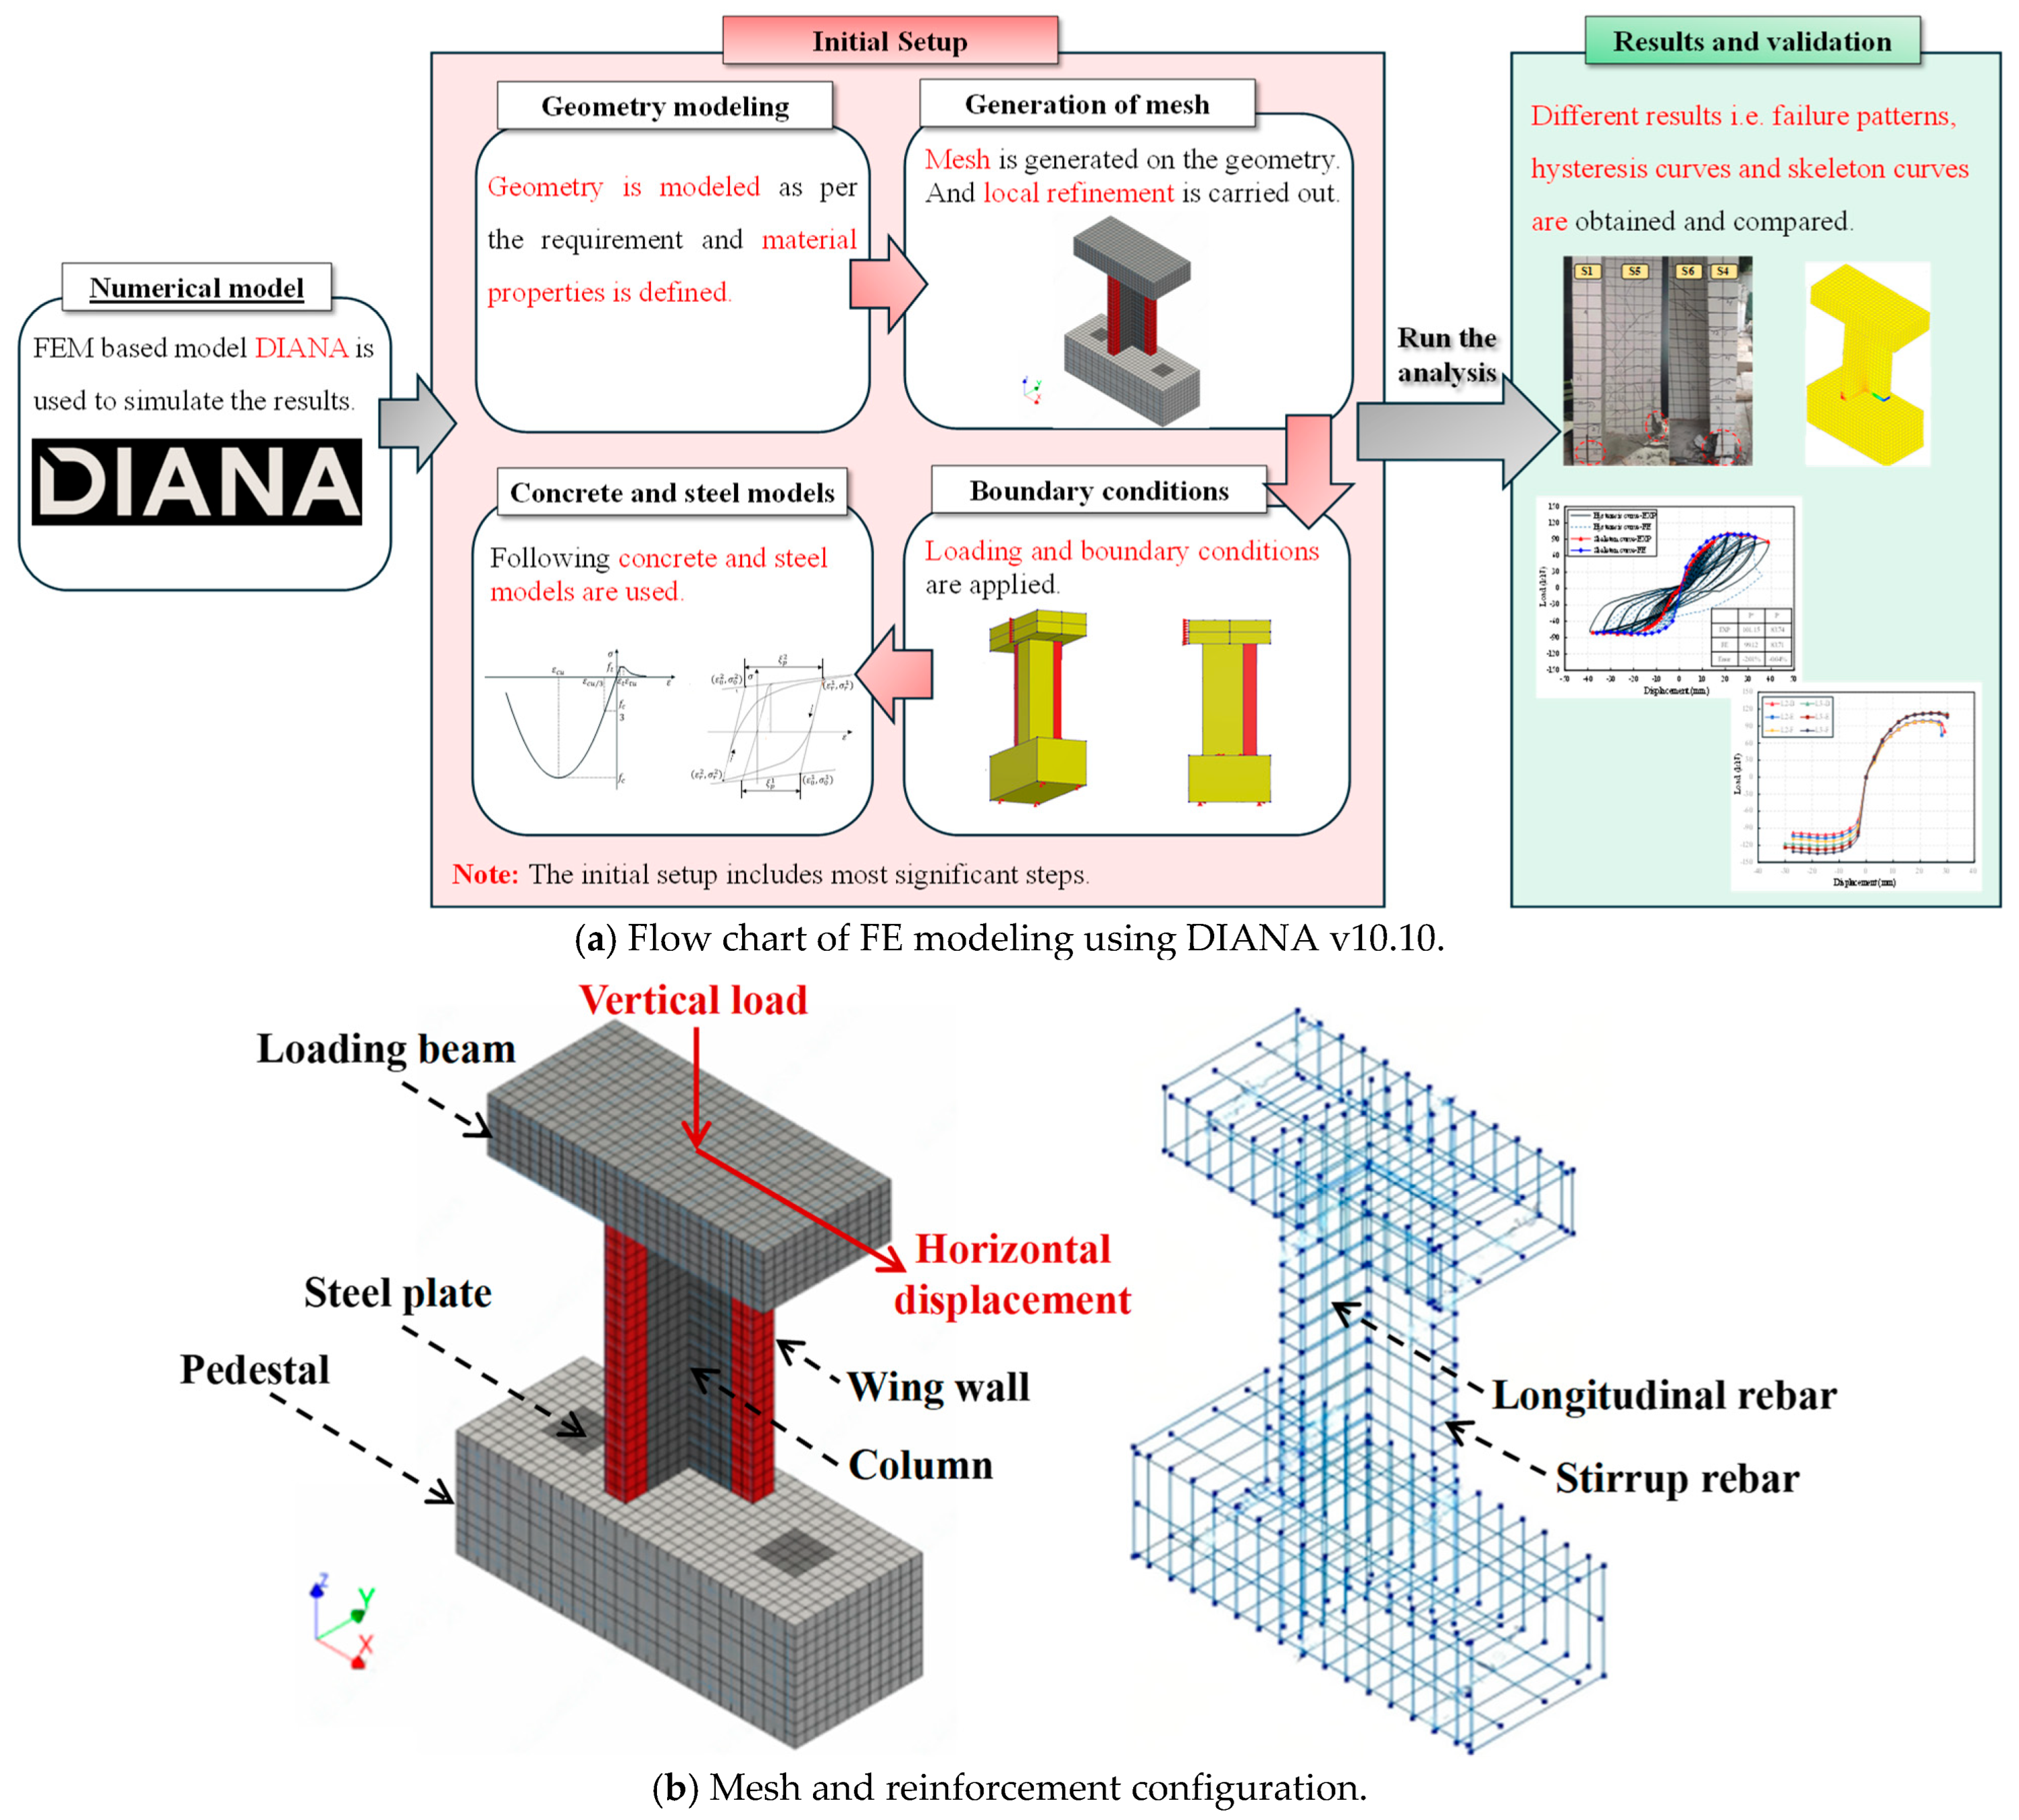
Figure 17a shows the flowchart of FE modeling. For the initial setup in DIANA v10.10, the geometry of the L-shaped column was established, and material properties were defined. After that, a mesh was generated, along with the application of loading and the boundary condition. Further, with the application of concrete and steel models, the analysis was run, and different numerical results were compared with the experimental results. Figure 17b depicts the FE model and its reinforcement configuration. In the FE model, the concrete was modeled using eight-node solid elements (HX24L), whereas the reinforcement was represented using truss elements (L2TRU). A rotating crack model was employed to determine the concrete cracking behavior, wherein the crack direction was continuously updated corresponding to the principal stress orientation. The selection of mesh size is very significant and various researchers in the past carried out mesh sensitivity on the structural behavior of RC members [43,44,45]. Nguyen and Nguyen [43] found that the RC member with mesh size varied between 20 mm and 60 mm exhibited almost similar load carrying capacity. Therefore, in this study, the mesh size was determined to be 50 mm to balance the calculation accuracy and efficiency. Notably, the criterion for convergence was based on the energy method. The convergence tolerance was set to 0.01 in this study.
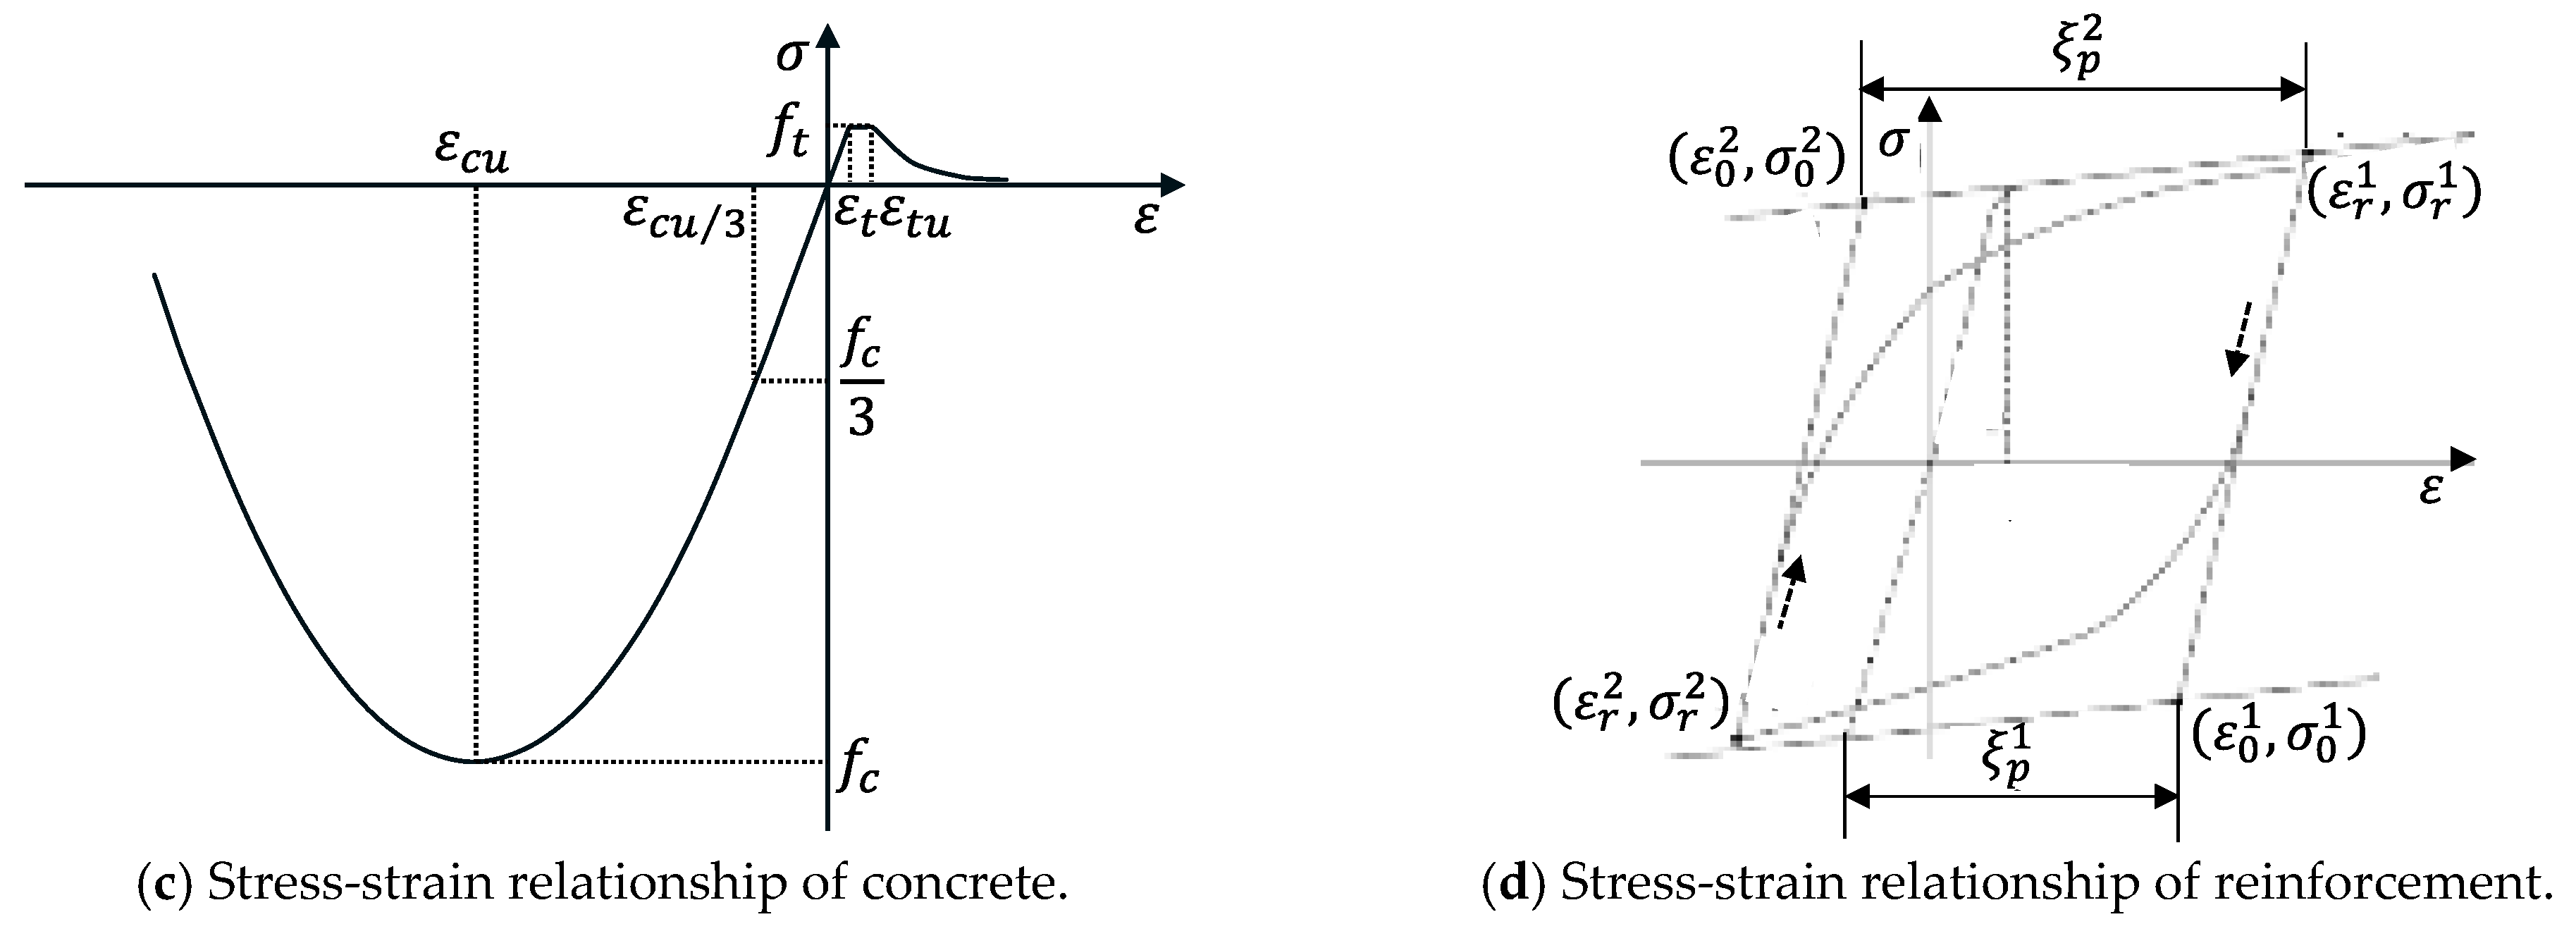
To simulate the nonlinear stress–strain behavior of concrete in compression, a parabolic constitutive model was employed. The compressive stress–strain relationship was defined as shown in Equations (3) and (4). The compression strains were computed based on the compressive fracture energies Gfc, which were calculated using the equation proposed by Nakamura and Higai [46].
σ c = f c 1 3 ε c ε c u / 3 ,   ε c u / 3 < ε c 0 f c 1 3 1 + 4 ε c ε c u / 3 ε c u ε c u / 3 2 ε c ε c u / 3 ε c u ε c u / 3 2 ,   ε c u < ε c ε c u / 3 f c 1 ε c ε c u ε u ε c u 2 ,   ε u < ε c ε c u 0 ,   ε c < ε u
ε c u / 3 = 1 3 f c E ε c u = 5 3 f c E = 5 ε c u / 3 ε u = m i n ε c u 3 2 G f c h f c , 2.5 ε c u
where σc and εc represent the compressive stress and compressive strain, respectively; fc is the concrete compressive strength; h is the characteristic element length; E is the elastic modulus of concrete; εcu and εu are the maximum and ultimate strain corresponding to the concrete compressive strength.
For the tensile behavior of concrete, the constitutive model in the Standard Specifications for Concrete Structures of Japan Society of Civil Engineers (JSCE) [47] was adopted. Figure 17c depicts the tensile stress–strain curve, which is given by the following:
σ t = E ε t ,   ε t < ε e f t ,   ε e ε t ε t u f t ε t u ε t c ,   ε t > ε t u
where σt and εt represent the tensile stress and strain, respectively; ft denotes the concrete tensile strength; εe denotes the maximum elastic strain of concrete; εtu denotes the maximum strain corresponding to the concrete tensile strength, taken as the recommended value, 0.0002; and c denotes the softening slope parameter, which is set to 0.4, as per the JSCE guidelines.
For the steel reinforcement, the Menegotto–Pinto hysteretic constitutive model [47] was utilized to simulate its cyclic nonlinear behavior. Figure 17d shows the hysteretic curve, with the governing equations expressed as follows:
σ * = b ε * + 1 b ε * 1 + ε * R 1 R
ε * = ε ε r n ε y n + 1 ε r n
σ * = σ σ r n σ y n + 1 σ r n
where b represents the strain hardening coefficient; R represents the curvature parameter; σ * and ε * are the dimensionless stress and scaled strain, respectively;   σ and ε represent the actual stress and strain, respectively; ( ε r n , σ r n ) and ( ε y n + 1 , σ y n + 1 ) are the last reversal point and the updated yield point, respectively.
Regarding the boundary conditions, the base of the specimen was fully restrained in all degrees of freedom (X, Y, and Z directions). Horizontal cyclic loading was applied at the center of the loading beam under displacement control, and the beam was kinematically coupled to ensure planar behavior. The axial load was applied as a constant surface pressure at the beam center, following the same loading sequence used in the experimental protocol (i.e., the initial application of axial load followed by incrementally increasing lateral cyclic displacements).

5.2. Validation of Numerical FE Model

To validate the FE model, the simulated hysteresis curves and skeleton curves were systematically compared with the experimental results of six L-shaped column specimens that were strengthened with wing walls. The hysteresis and skeleton curves obtained from the FE model concurred well with the corresponding experimental data, as shown in Figure 18. In terms of the hysteresis and skeleton curves, the FE models exhibited marginally higher initial stiffness and slightly lower ultimate displacements when compared with the experimental results. These discrepancies are primarily attributed to the idealized boundary conditions (particularly the fixed-base constraints) employed in the simulations, when compared with the minor base slippage observed during testing. However, the overall deformation patterns and behavioral trends remained consistent, thereby demonstrating the validity of the FE model. Additionally, it is also suggested that subsequent research should be prioritized in future, considering the development of models accounting for soil structure interaction or semi-rigid base conditions as a true representative of actual field conditions.
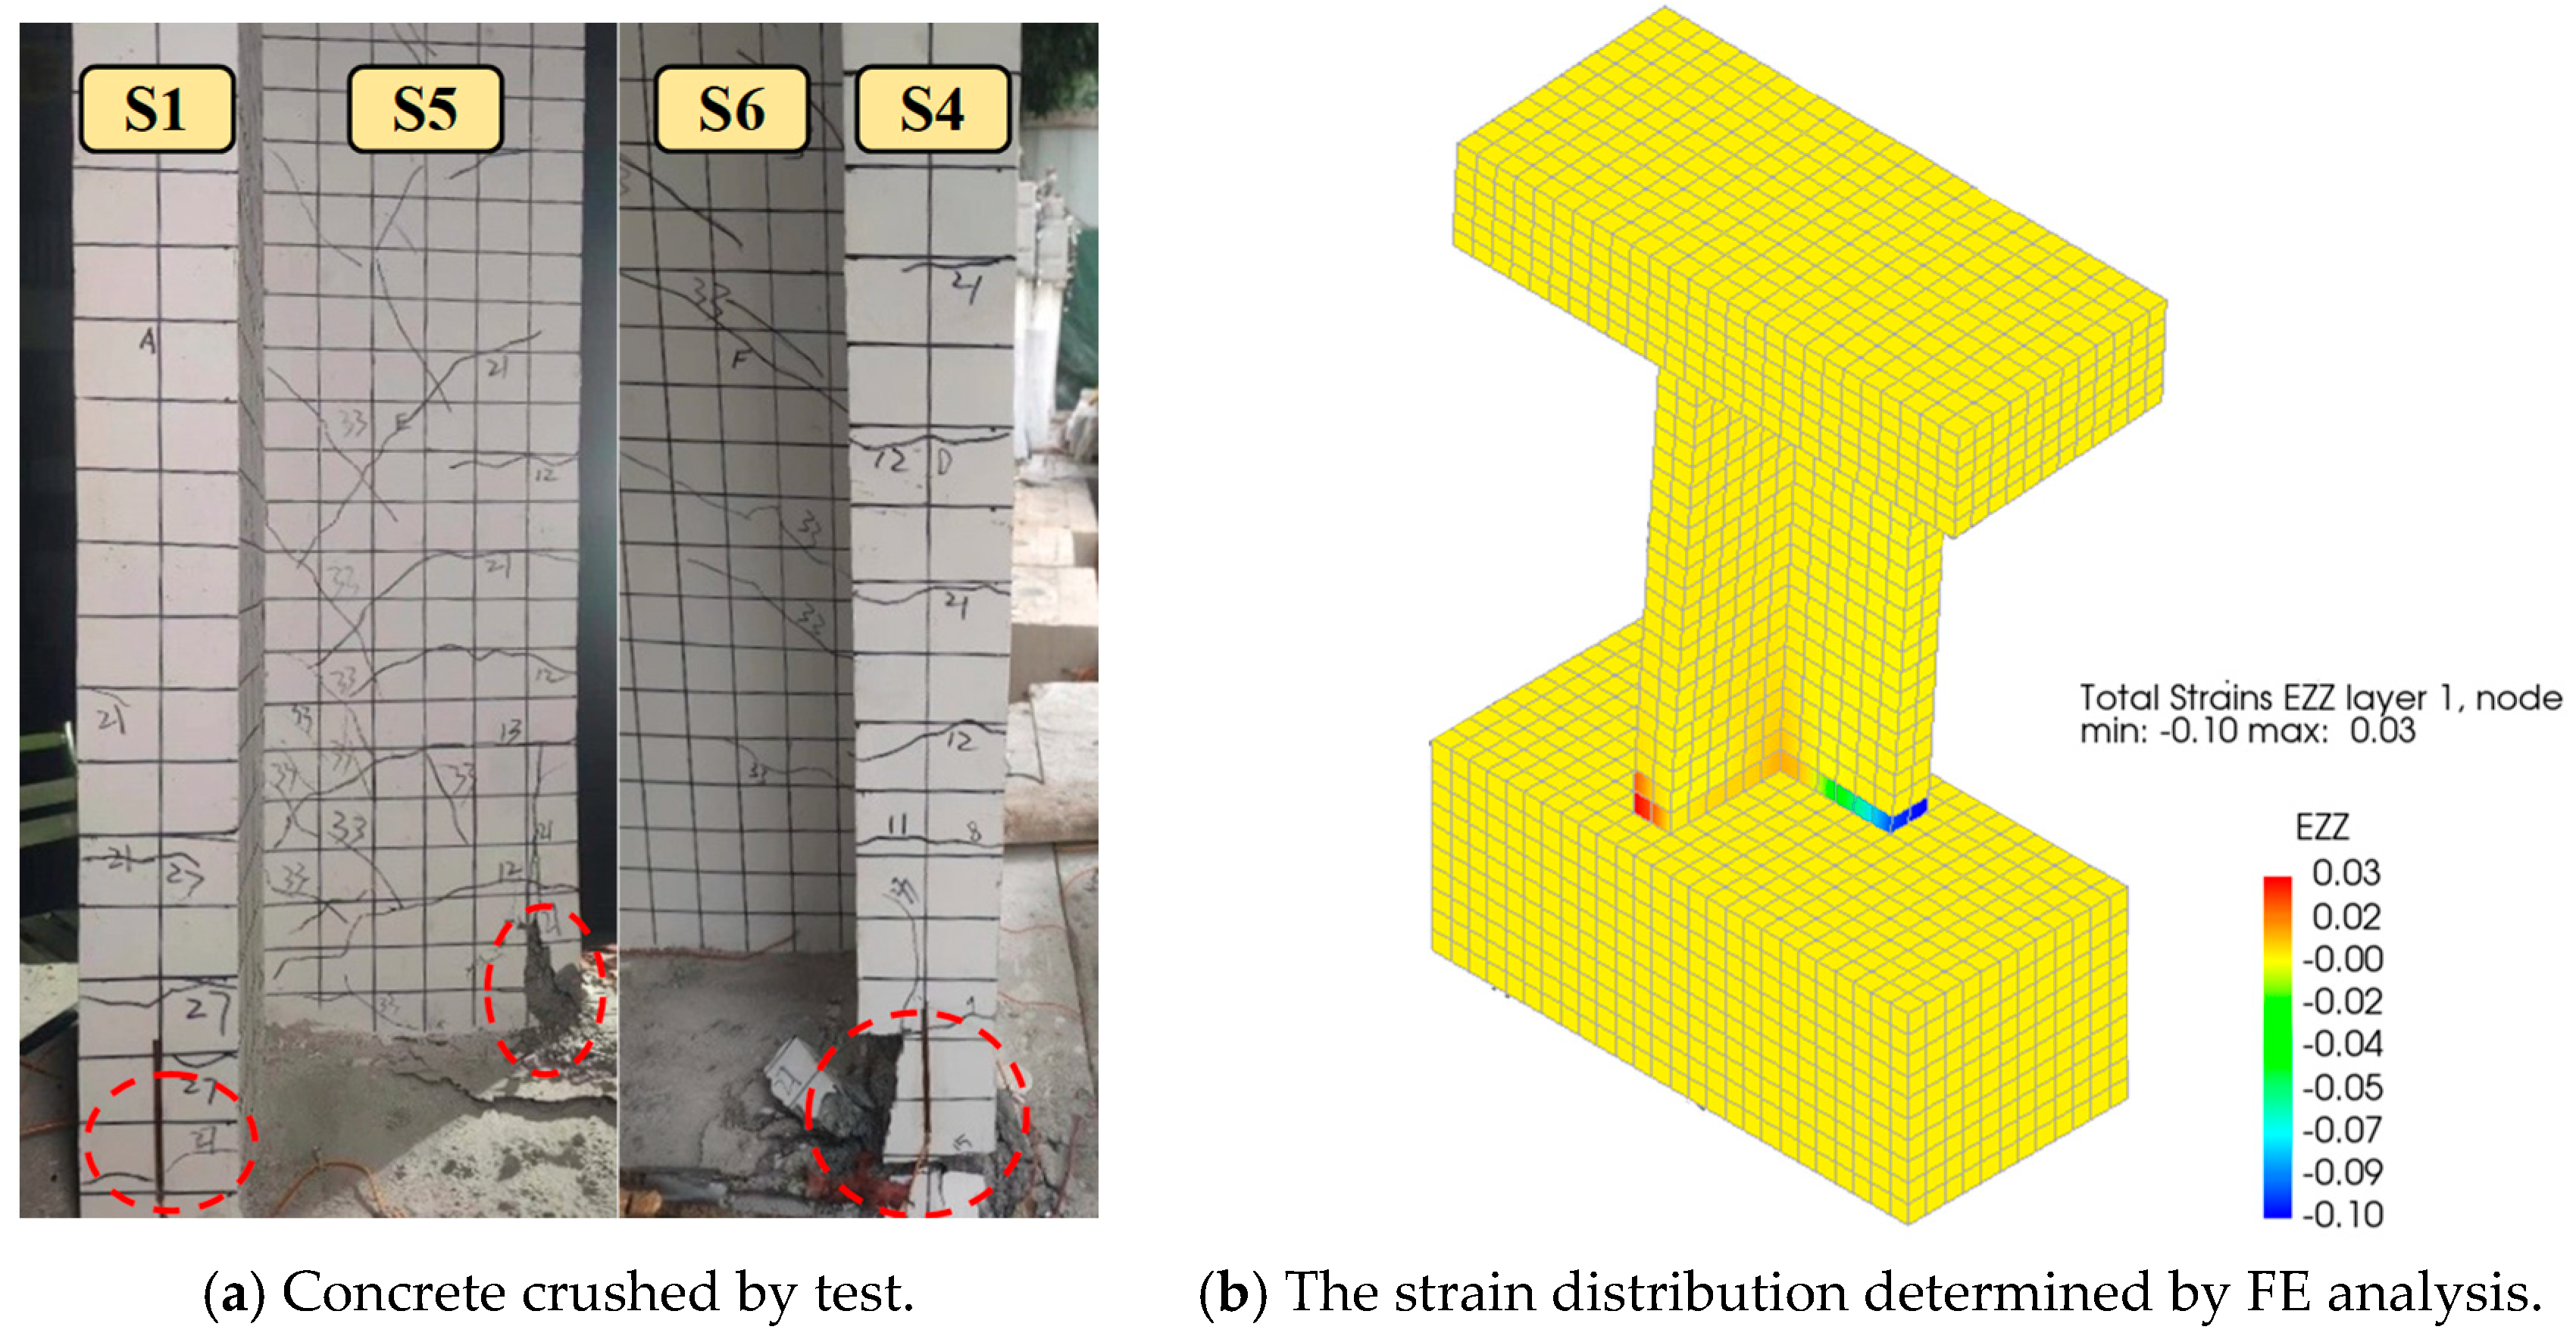
For the ultimate lateral load bearing capacity, the simulated results correspond closely with the experimental measurements. These findings substantiate the high predictive accuracy of the FE model in modeling the lateral load bearing capacity of the L-shaped columns that were strengthened with wing walls, presenting a comprehensive analytical basis for the design and application of this strengthening strategy. Furthermore, the simulated strain results demonstrated a high degree of consistency with the observed failure patterns from the experiments, as shown in Figure 19. In the wing wall-strengthened specimens, the damage was predominantly concentrated near the column base and primarily manifested as flexural–compressive damage along the midline of the web. The FE model effectively captured these failure characteristics, demonstrating its capability to simulate the progression of damage mechanisms in reinforced concrete columns strengthened with wing walls.

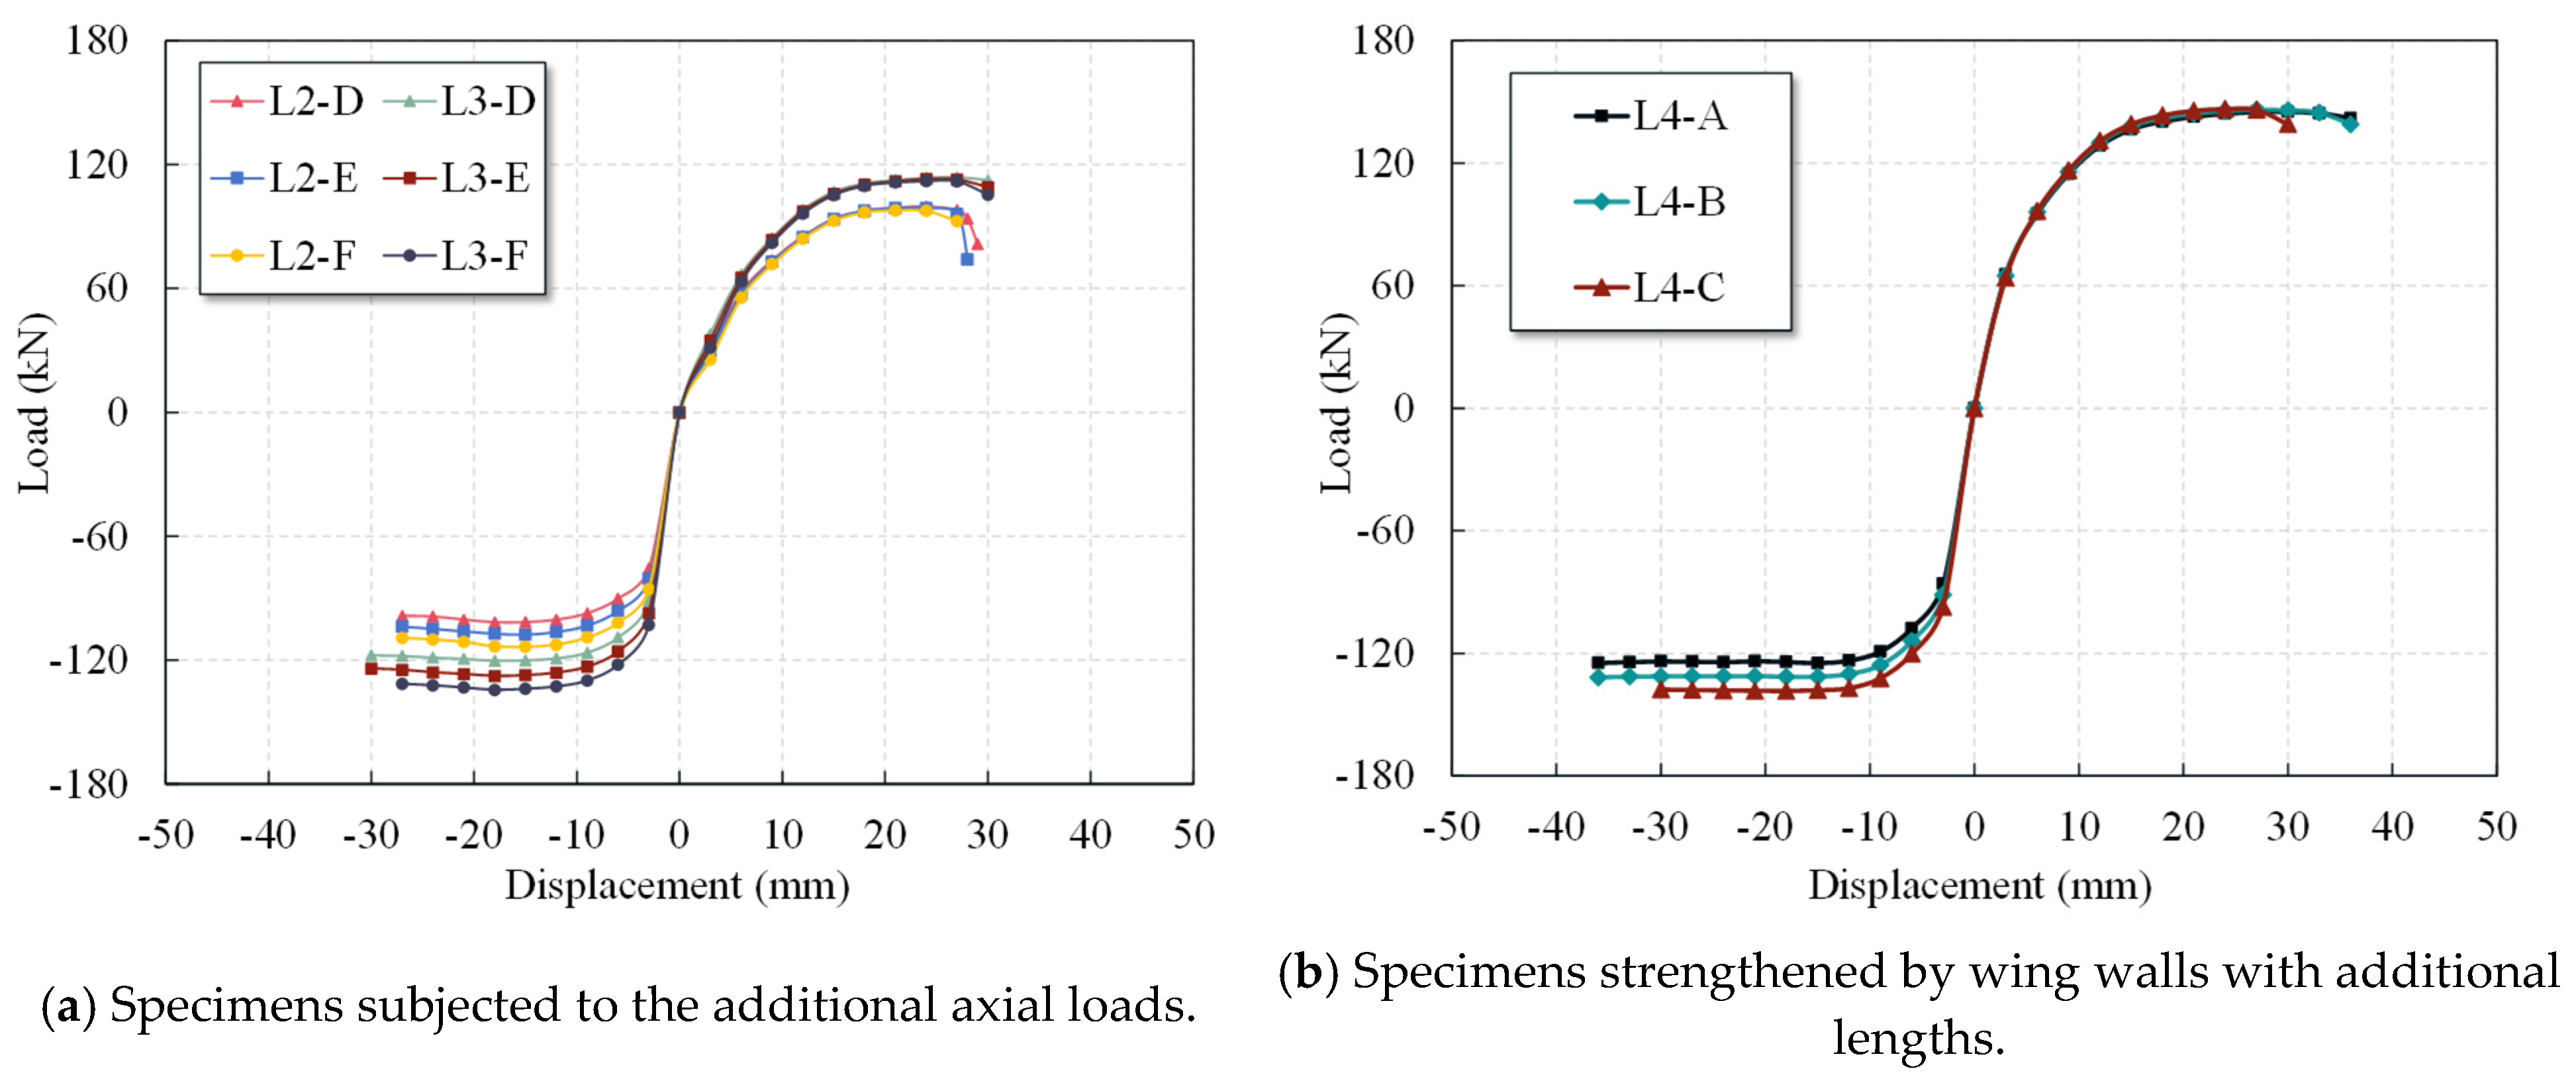
5.3. Parametric Investigation

To further analyze the seismic performance of the L-shaped columns strengthened with wing walls under varying axial compression ratios and wing wall lengths, a parametric investigation was carried out. In this investigation, all the other variables were maintained constant while increasing the axial loads to 458 kN, 515 kN, and 572 kN (corresponding to original column axial compression ratios of 0.42, 0.47, and 0.52) and strengthening with wing walls measuring a length of 200 mm. The numerical simulations were conducted to evaluate the behavior of the L-shaped columns that were strengthened with the wing walls. Table 3 presents the parameters, and Figure 20 shows a comparison of the skeleton curves. The skeleton curves indicate that the negative bearing capacity of columns with 100 mm and 150 mm wing walls was improved with an increase in the axial compression ratios, whereas the positive bearing capacity remained unchanged. Additionally, the degradation rate under cyclic loading became more pronounced with higher axial compression ratios. Although the average peak load increased with the axial load, the initial stiffness remained relatively stable. The results indicate that increasing the wing wall length significantly improves both the lateral load -bearing capacity and initial stiffness. Under various axial compression ratios, every 50 mm increase in the wing wall length presented an approximate increase of 12–16% in the peak load and 17–23% in the initial stiffness.

5.4. Regression Analysis of Lateral Load Bearing Capacity Calculation

When applying wing wall strengthening to L-shaped columns, the lateral load bearing capacity must be comprehensively considered in the design process. In accordance with the current Technical Specification for Concrete Structures with Specially Shaped Columns [31], when combined with earthquake actions, the lateral capacity of the special-shaped columns with a limb height-to-thickness ratio not exceeding 4 is calculated as shown in Equation (9).
V = 1.05 1 λ + 1 f t b c h c 0 + f y v A s v s h c 0 + 0.056 N
where λ is the shear span ratio of the specimen; b c is the thickness of the web of the L-shaped column; h c 0 is the effective height of the L-shaped column section; f t is the tensile strength of the concrete; f y v is the yield strength of the column stirrups; A s v is the cross-sectional area of a single stirrup; s is the spacing of the stirrup; N is the axial load applied to the L-shaped column.
Considering the preceding considerations and the influence of two key variables (i.e., axial compression ratios and the length of the additional wing wall) on the observed lateral load bearing capacity, a regression equation for the lateral load capacity of L-shaped columns strengthened with additional wing walls is proposed. Using the 15 sets of experimental and numerical data obtained in this study, the regression coefficients were determined through regression. Accordingly, the final regression formula for the lateral load bearing capacity of the L-shaped columns strengthened with wing walls is given as follows:
V = 1.83 b c f t h c 0 + f t l λ + 1 + 0.45 A s v s f y v h c 0 + f y v l 0.04 N
where f t is the tensile strength of the concrete of the wing wall; f y v is the yield strength of the wing walls stirrups; l is the length of additional wing walls.
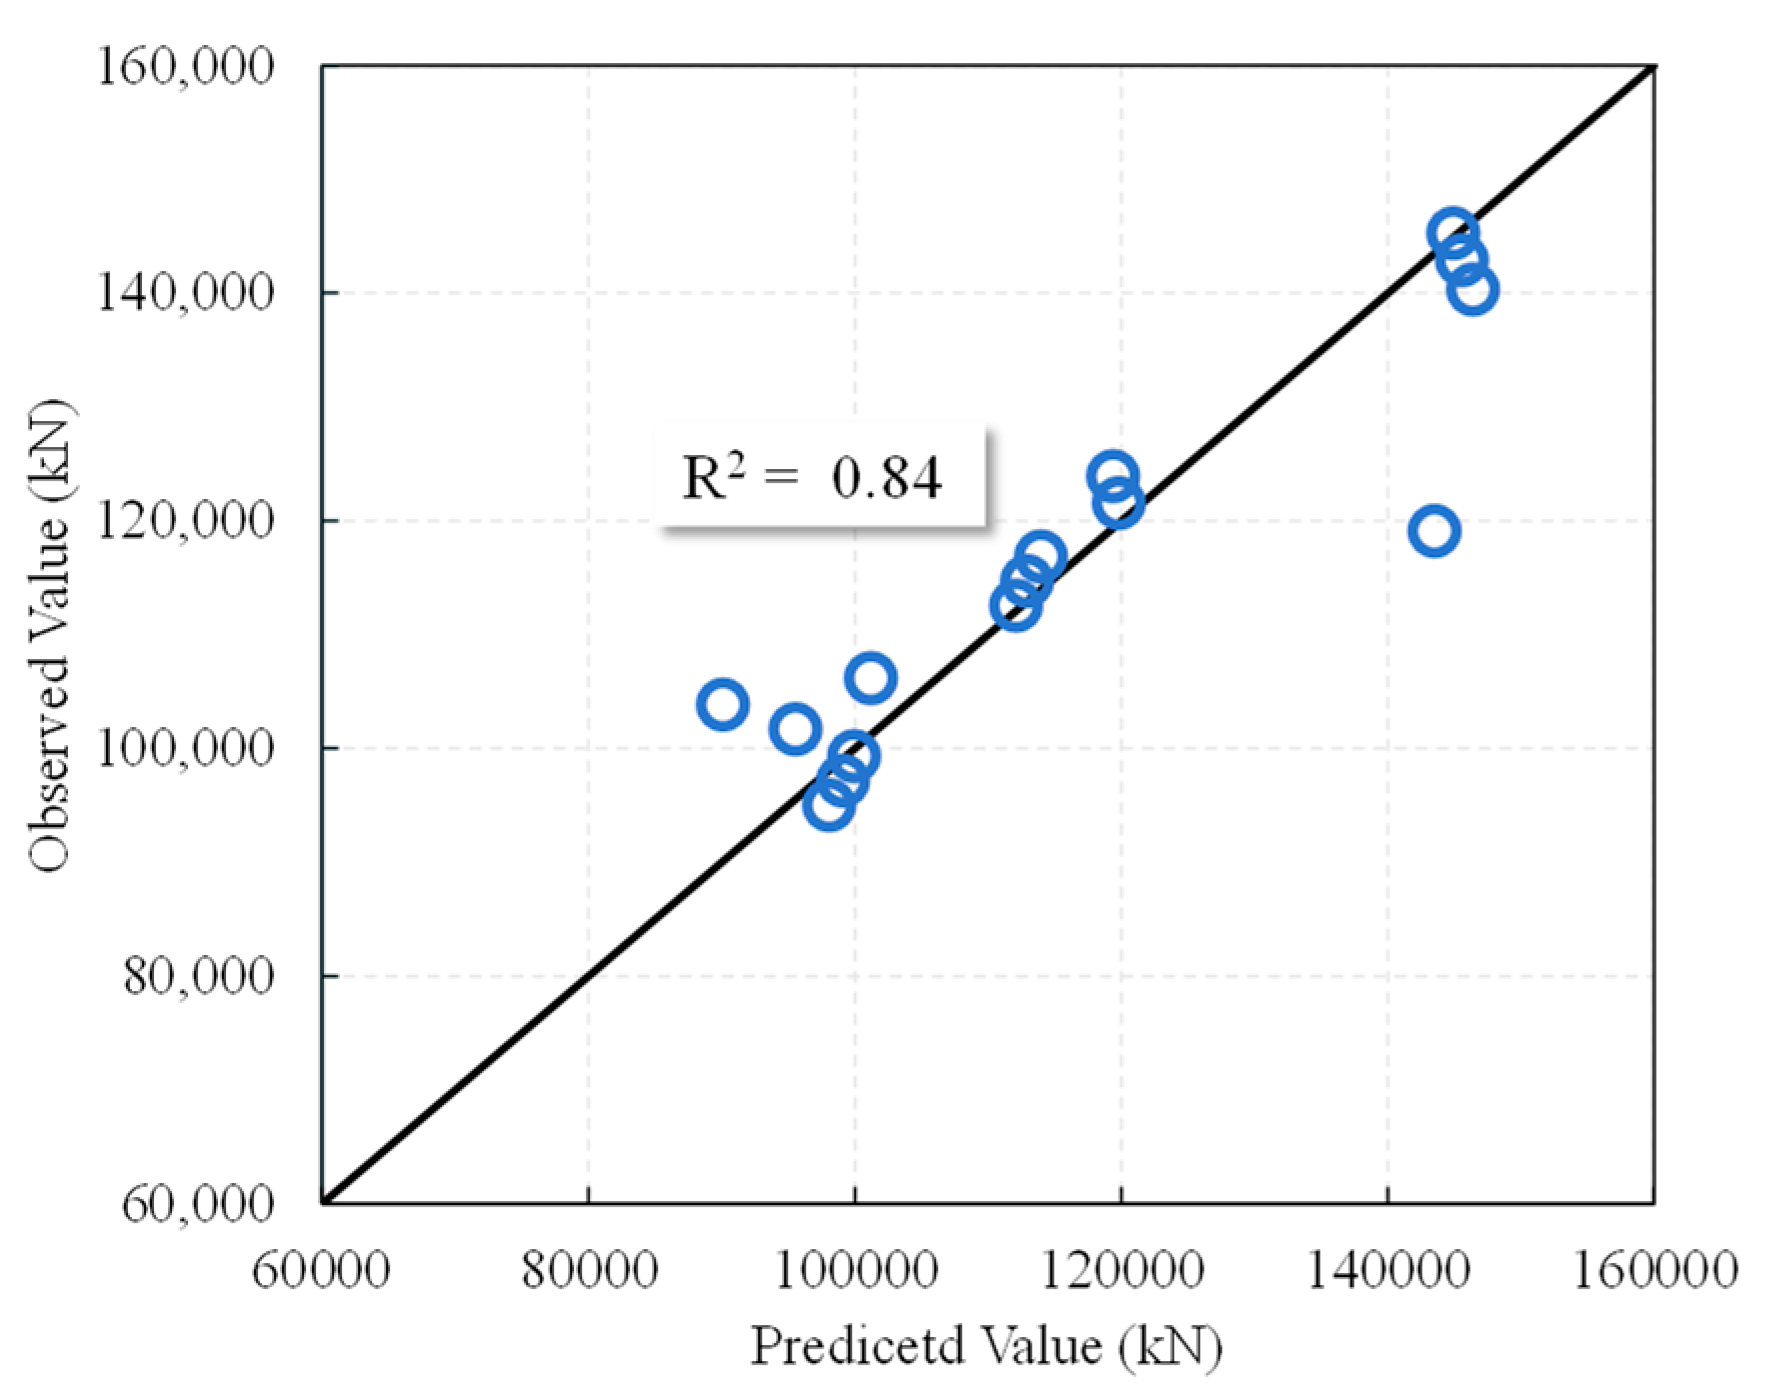
The lateral load capacities of the 15 tested specimens were calculated using Equation (10), and the results were compared with the corresponding experimental values, as shown in Figure 21. The comparative analysis demonstrates that the load bearing capacity formula derived through linear regression exhibits high predictive accuracy. A strong correlation was observed between the calculated and observed results, with a coefficient of determination (R2) of 0.84. These findings demonstrated that the regression-based equation presents high reliability in estimating the lateral load bearing capacity of L-shaped columns strengthened with wing walls. Accordingly, the proposed formulation serves as a robust theoretical basis and practical reference for the structural design and evaluation of L-shaped columns.

6. Conclusions

In this study, a wing wall strengthening method was implemented for the structural strengthening of special-shaped column structures in urban areas that do not meet current seismic design requirements. The influence of this strengthening technique on the seismic performance of L-shaped columns through quasi-static tests under low-cycle loading was comprehensively analyzed, combined with FE numerical simulations. The main conclusions of this study are as follows.
  • The failure process of both the un-strengthened and wing wall-strengthened L-shaped columns was similar, characterized by bending–shear failure, with damage typically occurring at the base of the limb on the side without flange. However, when the length of the added wing wall was increased to 150 mm, the failure mode gradually changed from the conventional column failure mode to a shear wall-type failure, accompanied by more brittle behavior. Therefore, when strengthening the wing wall, the length of the added wing wall must be selected appropriately based on the height-to-thickness ratio of the limb in the L-shaped column.
  • Wing wall strengthening significantly improves the lateral load-bearing capacity of the L-shaped columns, with the enhancement becoming more pronounced under higher axial compression ratios. The addition of wing walls with lengths of 100 mm and 150 mm increased the lateral load bearing capacity by approximately 43–194% and 73–254%, respectively. Specifically, under the strengthening condition with 100 mm wing walls, the positive load bearing capacity was increased by up to 157% at the original column axial compression ratio of 0.26, and the negative load bearing capacity was increased by up to 194% at the original column axial compression ratio of 0.32. Additionally, under the strengthening condition with 150 mm wing walls, the positive and negative load bearing capacities were increased by up to 254% and 169%, respectively, at the original column axial compression ratios of 0.37 and 0.32. Furthermore, this strengthening significantly increased the initial stiffness of the columns and the energy dissipation capacity. Consequently, the strengthened specimens exhibited slower stiffness degradation in the later loading stages, reflecting improved seismic performance.
  • The addition of a wing wall also significantly affected the positive ductility of the specimens. This effect varied with the change in wing wall length and the axial compression ratio level. Under high axial compression ratios, the ductility coefficient continued to increase with increasing wing wall length. Conversely, under low axial compression ratios, the increasing leg height-to-thickness ratio with increasing wing wall lengths resulted in a gradual shift toward the brittle failure mode of the L-shaped column, similarly to that of a shear wall. Consequently, an increasing trend in the ductility coefficient was found, with a decrease in later stages, as the wing wall length was increased. This observation is consistent with the characteristics of the component failure modes.
  • The FE model concurred well with the experimental results in terms of the hysteresis behavior, skeleton curves, and load bearing capacity. Furthermore, a lateral load bearing capacity prediction formula for the L-shaped columns that were strengthened with wing walls was established through regression analysis. This formula provides theoretical support and serves as a practical reference for the seismic strengthening design of L-shaped columns with wing walls.
It should be noted that in this study, L-shaped columns were used, so future experimental and numerical studies are recommended to use other special-shaped columns (such as T-shaped and cruciform cross-sections), with diverse wing wall dimensions (length and thickness) and higher reinforcement ratios. It is also necessary to establish a more universal design data base through parametric finite element analysis and experimental investigations. Furthermore, subsequent studies should also compare the effectiveness of strengthening in different cross-sections to formulate unified design recommendations and develop a method of statistical analysis to show the significant changes in the cross-sections when determining the structural behavior of special-shaped columns. Notably, to fully evaluate the dynamic response of structures under earthquake action, it is significant to adopt shake table tests or hybrid simulation methods to account for strain rate effects, cumulative damage, and dynamic instability phenomena. Additionally, it is necessary to further clarify the trade-off mechanism between stiffness/strength and ductility to determine the optimal wing wall–column dimension ratio. Therefore, future studies should also be conducted to quantify the interactions among the degree of reinforcement, lateral load bearing capacity, and ductility by increasing the wing wall lengths, in order to deeply investigate the seismic performance of special-shaped columns strengthened with wing walls.

Author Contributions

Conceptualization, W.W. and M.Z.; methodology, J.L., M.X. and C.F.; validation, C.F., M.A., M.Z., Z.L. and J.L.; formal analysis, J.L.; investigation, J.L. and M.Z.; data curation, Z.L.; writing—original draft preparation, W.W.; writing—review and editing, J.L., M.A. and M.Z.; visualization, J.L.; supervision, W.W.; project administration, W.W.; funding acquisition, W.W. and M.Z. All authors have read and agreed to the published version of the manuscript.

Funding

The authors acknowledge the financial support from the National Natural Science Foundation of China (Grant No. 52208197), Guangdong Basic and Applied Basic Research Foundation (Grant No. 2025A1515010872), and Shenzhen Municipal Center for Transport Infrastructure Construction Research Project (Eastern Transit Expressway Connection Project “Research and Application of Key Technologies for the Durability of Tunnel Concrete Structures”).

Data Availability Statement

The raw data supporting the conclusions of this article will be made available by the authors on request.

Conflicts of Interest

The authors declare no conflicts of interest.

References

  1. Ahmed, A.A.; Ozturk, H.; Aslan, T.A. Comparative Analysis of Buildings with Different Story Heights According to TBDY 2018 and Eurocode 8. J. Çukurova Univ. Fac. Eng. 2025, 40, 265–272. [Google Scholar] [CrossRef]
  2. Unsal, I.; Balca, N.; Sahan, M.F. Comparison of structural system types given in the TBDY 2018 regulation for medium-rise buildings using linear analysis method. Adıyaman Univ. J. Eng. Sci. 2022, 9, 431–446. [Google Scholar] [CrossRef]
  3. Jafari, A.; Shahmansouri, A.A.; Bengar, H.A.; Zhou, Y. Flexural rigidity of SFRC columns at the onset of buckling failure: Analytical and numerical study. Steel Compos. Struct. 2025, 55, 533–552. [Google Scholar] [CrossRef]
  4. Marin, J. Design aids for L-shaped reinforced concrete columns. J. Am. Concr. Inst. 1979, 76, 1197–1216. [Google Scholar]
  5. Li, Q.; Wang, K.; Xue, Y.; Tian, Q.; Tao, Y. Dynamic fracture process of T-shaped beam-column specimens with prefabricated cracks under offset impact. Theor. Appl. Fract. Mech. 2022, 121, 103518. [Google Scholar] [CrossRef]
  6. Chen, Z.; Ning, F.; Chen, J.; Liu, X.; Xu, D. Test on mechanical behavior of SRC L-shaped columns under combined torsion and bending moment. Earthq. Eng. Eng. Vib. 2021, 20, 161–177. [Google Scholar] [CrossRef]
  7. Zhou, T.; Jia, Y.; Xu, M.; Wang, X.; Chen, Z. Experimental study on the seismic performance of L-shaped column composed of concrete-filled steel tubes frame structures. J. Constr. Steel Res. 2015, 114, 77–88. [Google Scholar] [CrossRef]
  8. Yang, Y.; Wang, Y.; Fu, F.; Liu, J. Static behavior of T-shaped concrete-filled steel tubular columns subjected to concentric and eccentric compressive loads. Thin Wall Struct. 2015, 95, 374–388. [Google Scholar] [CrossRef]
  9. Zhang, J.; Zhao, C.; Shang, F.; Wang, L.; Wang, L.; Chen, J.; Zhang, L.; Nehdi, M.L. Seismic behavior of full-scale precast assembly frame joints of special-shaped columns. Structures 2025, 75, 108781. [Google Scholar] [CrossRef]
  10. Zhang, Z.; Shi, G.; Wang, S.; Zhou, L. Investigation on buckling behavior of T-shaped box-T section columns under axial load. Eng. Struct. 2022, 254, 113904. [Google Scholar] [CrossRef]
  11. Chen, H.; Wang, L.; Chen, H.; Cui, W. Experimental study on the seismic behavior of prefabricated L-shaped concrete-filled steel tube with rectangular multi-cell columns under different lateral loading directions. J. Constr. Steel Res. 2021, 177, 106480. [Google Scholar] [CrossRef]
  12. Li, W.; Ye, H.; Sun, L. Experimental study on seismic behavior of T-shaped steel fiber reinforced concrete columns. Struct. Concr. 2023, 24, 612–633. [Google Scholar] [CrossRef]
  13. Li, Y.; Cao, X.-Y.; Feng, D.-C. A numerical model database for seismic retrofitting of existing RC structures towards urban renewal. Bull. Earthq. Eng. 2025, 23, 3295–3325. [Google Scholar] [CrossRef]
  14. Zhong, S.; Hu, X.; Peng, G.; Hou, J. The effect of section enlargement with cementitious grout on the eccentric compression behavior of RC columns. KSCE J. Civ. Eng. 2024, 28, 3378–3393. [Google Scholar] [CrossRef]
  15. Ramírez, J.L. Ten concrete column repair methods. Constr. Build. Mater. 1996, 10, 195–202. [Google Scholar] [CrossRef]
  16. Mahmoud, K.M.; Sallam, E.A.; Ibrahim, H.M.H. Behavior of partially strengthened reinforced concrete columns from two or three sides of the perimeter. Case Stud. Constr. Mater. 2022, 17, e01180. [Google Scholar] [CrossRef]
  17. Nematzadeh, M.; Mousavimehr, M.; Shayanfar, J.; Omidalizadeh, M. Eccentric compressive behavior of steel fiber-reinforced RC columns strengthened with CFRP wraps: Experimental investigation and analytical modeling. Eng. Struct. 2021, 226, 111389. [Google Scholar] [CrossRef]
  18. Khorramian, K.; Sadeghian, P. Hybrid system of longitudinal CFRP laminates and GFRP wraps for strengthening of existing circular concrete columns. Eng. Struct. 2021, 235, 112028. [Google Scholar] [CrossRef]
  19. Samy, K.; Fouda, M.A.; Fawzy, A.; Elsayed, T. Enhancing the effectiveness of strengthening RC columns with CFRP sheets. Case Stud. Constr. Mater. 2022, 17, e01588. [Google Scholar] [CrossRef]
  20. Ciampa, E.; Ceroni, F.; De Angelis, A.; Pecce, M.R. Bond tests on concrete elements externally bonded with steel plates and assessment of bond strength models. Eng. Struct. 2023, 296, 116835. [Google Scholar] [CrossRef]
  21. Hamoda, A.; Shahin, R.I.; Ahmed, M.; Abadel, A.A.; Baktheer, A.; Yehia, S.A. Strengthening of reinforced concrete columns incorporating different configurations of stainless-steel plates. Structures 2024, 64, 106577. [Google Scholar] [CrossRef]
  22. Huang, H.; Guo, M.; Zhang, W.; Huang, M. Seismic behavior of strengthened RC columns under combined loadings. J. Bridge Eng. 2022, 27, 05022005. [Google Scholar] [CrossRef]
  23. Zhang, Y.; Zhao, Q.; Zhao, K.; Hao, J.; Hu, Y. Experimental study on seismic performance of shear wall with insufficient concrete strength strengthened by partial concrete replacement. Structures 2024, 69, 107537. [Google Scholar] [CrossRef]
  24. Wardi, S.; Sanada, Y.; Saha, N.; Takahashi, S. Improving integrity of RC beam-column joints with deficient beam rebar anchorage. Earthq. Eng. Struct. Dyn. 2020, 49, 234–260. [Google Scholar] [CrossRef]
  25. Zhang, L.; Chen, X.; Skalomenos, K.A.; Lin, X.; Zhu, B. Investigation on the seismic performance of single-span RC frame school buildings retrofitted with wing walls under different seismic design intensities. Structures 2022, 44, 1945–1961. [Google Scholar] [CrossRef]
  26. Li, Y.; Wang, H.; Xing, S.; Shan, L.; Wang, X. Influence of the vertical load bearing status on the seismic performance of weak-joint-type RC frames strengthened by the wing wall installation method. J. Earthq. Tsunami 2024, 18, 2450017. [Google Scholar] [CrossRef]
  27. Liu, K.-C.; Liu, Y.-W.; Huang, W.-C.; Chen, C.-Y. The structure behavior of reinforced concrete wing–wall under earthquake. Int. J. Phys. Sci. 2010, 5, 1164–1174. Available online: http://www.academicjournals.org/IJPS (accessed on 4 August 2025).
  28. Kaltakci, M.Y.; Yavuz, G. An experimental study on strengthening of vulnerable RC frames with RC wing walls. Struct. Eng. Mech. 2012, 41, 691–710. [Google Scholar] [CrossRef]
  29. Bai, Y.; Bai, G. Pseudo-dynamic and quasi-static testing of an irregular steel concrete composite frame with wing walls. Int. J. Struct. Stab. Dyn. 2016, 16, 1450095. [Google Scholar] [CrossRef]
  30. Yang, W.; Guo, X.; Xu, W.; Yuan, X. Wing walls for enhancing the seismic performance of reinforced concrete frame structures. Earthq. Eng. Eng. Vib. 2016, 15, 411–423. [Google Scholar] [CrossRef]
  31. Li, Y.; Sanada, Y. Seismic strengthening of existing RC beam-column joints by wing walls. Earthq. Eng. Struct. Dyn. 2017, 46, 1987–2008. [Google Scholar] [CrossRef]
  32. Li, Y.; Sanada, Y.; Maekawa, K.; Katayama, H.; Choi, H.; Matsukawa, K.; Takahashi, S. Seismic strengthening and rehabilitation of RC frame structures with weak beam-column joints by installing wing walls. Bull. Earthq. Eng. 2019, 17, 2533–2567. [Google Scholar] [CrossRef]
  33. Wang, B.; Guan, S.; Zhang, Y.; Bai, Y. Experimental behavior and failure modes of hybrid beam-to-column connections with RC wing-walls in industrial construction. Constr. Build. Mater. 2019, 218, 628–643. [Google Scholar] [CrossRef]
  34. Zhang, L.; Wang, C.; Chen, Y. Comparing seismic performances of single-span RC frames with and without wing wall retrofitting by shaking table tests. J. Build. Eng. 2024, 88, 109158. [Google Scholar] [CrossRef]
  35. JGJ 149-2017; Technical Specification for Concrete Structures with Specially Shaped Columns. China Construction Industry Press: Beijing, China, 2017.
  36. GB/T 50081-2019; Standard for Test Methods of Concrete Physical and Mechanical Properties. China Construction Industry Press: Beijing, China, 2019.
  37. GB/T 228.1-2021; Metallic Materials—Tensile Testing—Part 1: Method of Test at Room Temperature. China Construction Industry Press: Beijing, China, 2021.
  38. JGJ 116-2009; Technical Specification for Seismic Strengthening of Buildings. China Construction Industry Press: Beijing, China, 2009.
  39. Oh, Y.; Han, S.W.; Lee, L. Effect of boundary element details on the seismic deformation capacity of structural walls. Earthq. Eng. Struct. Dyn. 2002, 31, 1583–1602. [Google Scholar] [CrossRef]
  40. Su, R.K.L.; Wong, S.M. Seismic behaviour of slender reinforced concrete shear walls under high axial load ratio. Eng. Struct. 2007, 29, 1957–1965. [Google Scholar] [CrossRef]
  41. Lestuzzi, P.; Bachmann, H. Displacement ductility and energy assessment from shaking table tests on RC structural walls. Eng. Struct. 2007, 29, 1708–1721. [Google Scholar] [CrossRef]
  42. Wang, T.C.; Chen, X.S. Experimental study on shear capacity of broad-limb special-shaped columns. Adv. Mater. Res. 2011, 250–253, 2412–2417. [Google Scholar] [CrossRef]
  43. Nguyen, T.K.; Nguyen, N.T. Finite element investigation of the shear performance of corroded RC deep beams without shear reinforcement. Case Stud. Constr. Mater. 2021, 15, e00757. [Google Scholar] [CrossRef]
  44. Abdullah, M.; Nakamura, H.; Miura, T. A numerical evaluation on the effect of vertical stirrup legs to shear failure behavior in RC beams based on 3D RBSM. Eng. Struct. 2025, 343, 121268. [Google Scholar] [CrossRef]
  45. Abdullah, M.; Nakamura, H.; Miura, T. Numerical Investigation on Influence of Vertical Shear Leg Stirrups to Shear Failure Behavior in Wide Beams Using 3D-RBSM. Build. Future Durable Sustain. Resilient 2023, 349, 1567–1577. [Google Scholar] [CrossRef]
  46. Nakamura, H.; Higai, T. Compressive fracture energy and fracture zone length of concrete. In Modeling of Inelastic Behavior of RC Structures under Seismic Loads; Shing, B., Tanabe, T., Eds.; ASCE: Reston, VA, USA, 2001; pp. 471–487. [Google Scholar]
  47. Japan Society of Civil Engineers. JSCE Guidelines for Concrete: Standard Specifications for Concrete Structures—2007 "Design"; Japan Society of Civil Engineers: Tokyo, Japan, 2010. [Google Scholar]
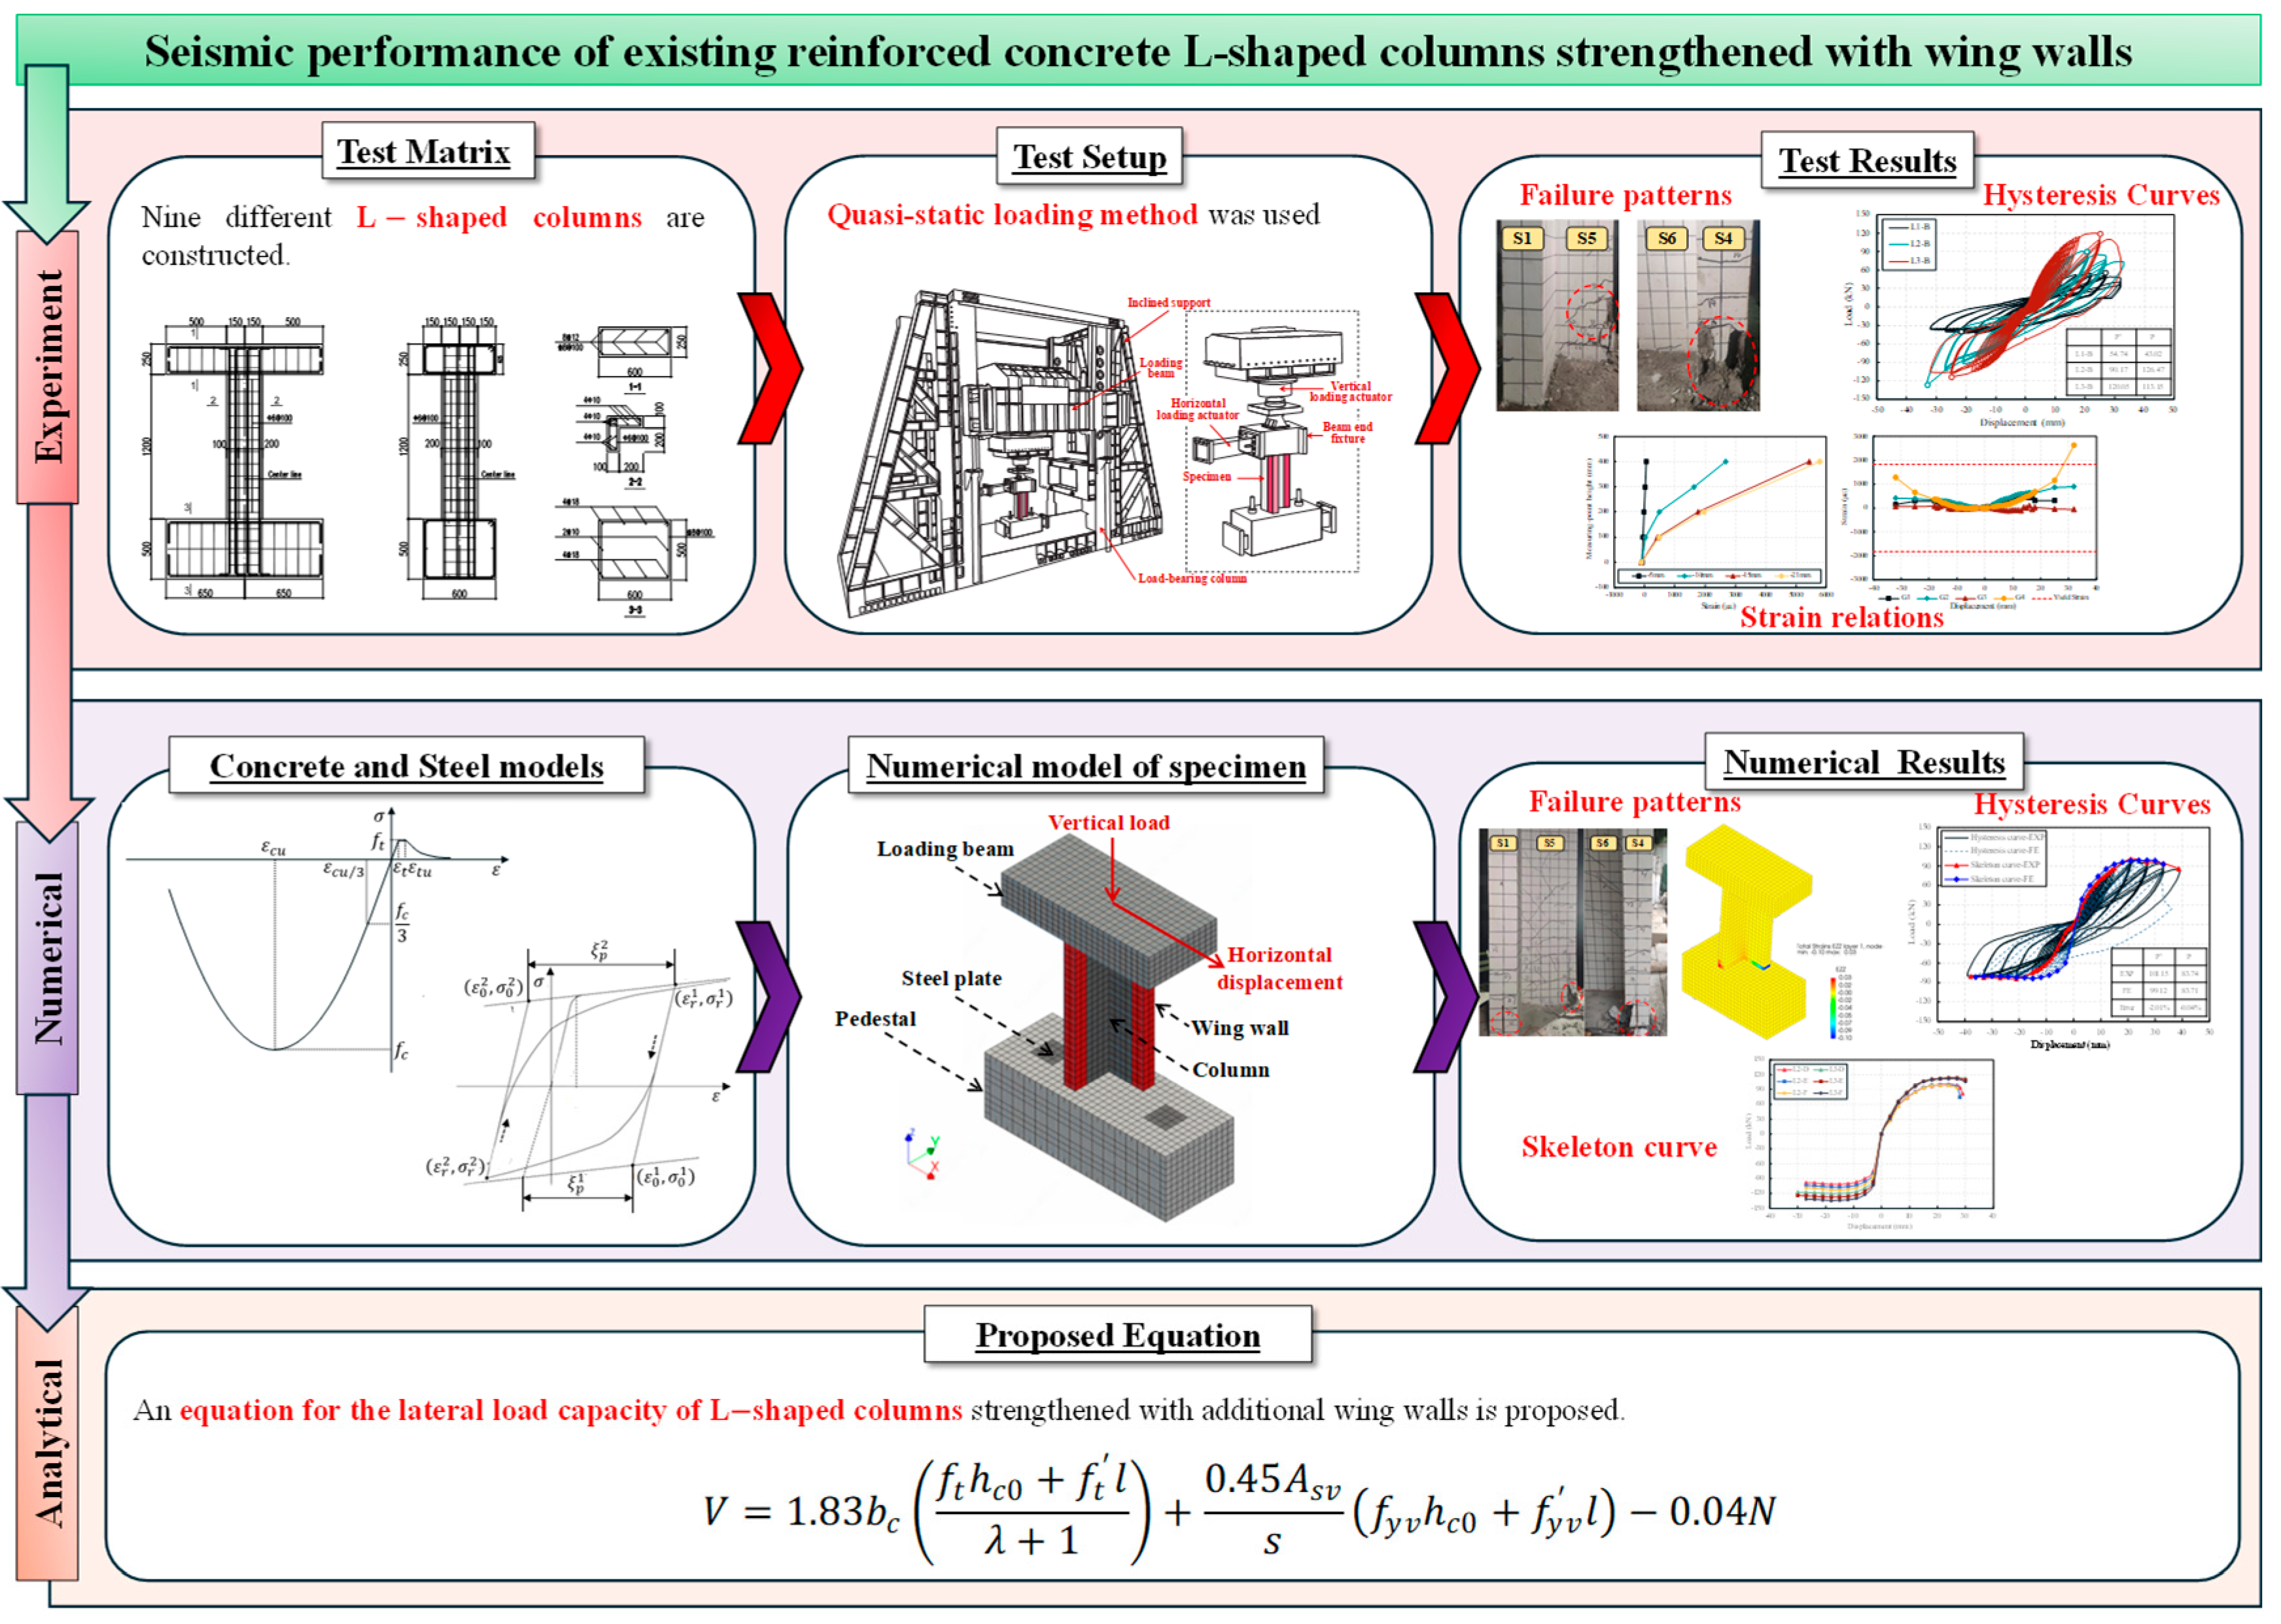
Figure 1. Framework of this study.
Buildings 15 03645 g001
Figure 2. Dimensions and reinforcement of specimens. (a) Un-strengthened specimen; (b) 100 mm wing wall specimen; (c) 150 mm wing wall specimen. (unit: mm).
Buildings 15 03645 g002aBuildings 15 03645 g002b
Figure 3. Manufacturing process of specimens: (a) chipping of the concrete cover and exposure of the steel reinforcement of existing columns; (b) installation of new stirrups with the exposed longitudinal bars of the original columns; (c) assemblage of wooden framework; (d) curing of strengthened specimens.
Buildings 15 03645 g003aBuildings 15 03645 g003b
Figure 4. Schematic diagram of the test setup and strain measuring positions.
Buildings 15 03645 g004
Figure 5. Loading scheme of lateral load.
Buildings 15 03645 g005
Figure 6. Failure morphology and crack pattern of the specimens.
Buildings 15 03645 g006
Figure 7. Hysteretic curves of specimens.
Buildings 15 03645 g007aBuildings 15 03645 g007b
Figure 8. Skeleton curves.
Buildings 15 03645 g008aBuildings 15 03645 g008b
Figure 9. Ductility coefficient.
Buildings 15 03645 g009
Figure 10. Stiffness degradation curves of specimens.
Buildings 15 03645 g010
Figure 11. Comparison of energy dissipation.
Buildings 15 03645 g011aBuildings 15 03645 g011b
Figure 12. Strain of longitudinal reinforcement.
Buildings 15 03645 g012
Figure 13. Strain of stirrups.
Buildings 15 03645 g013
Figure 14. Concrete strain distribution of the specimens with an axial compression ratio of 0.26.
Buildings 15 03645 g014
Figure 15. Concrete strain distribution of the specimens with an axial compression ratio of 0.32.
Buildings 15 03645 g015
Figure 16. Concrete strain distribution of the specimens with an axial compression ratio of 0.37.
Buildings 15 03645 g016aBuildings 15 03645 g016b
Figure 17. FE model.
Buildings 15 03645 g017aBuildings 15 03645 g017b
Figure 18. Comparison of experiment and simulation of hysteresis curve and skeleton curve.
Buildings 15 03645 g018aBuildings 15 03645 g018b
Figure 19. Comparison of damage pattern of specimen L2-A.
Buildings 15 03645 g019
Figure 20. Skeleton curves of the specimens obtained via FE analysis.
Buildings 15 03645 g020
Figure 21. Comparison between lateral load bearing capacity determined via a test and FE simulations and the proposed equation.
Buildings 15 03645 g021
Table 1. Parameters of test specimens.
SpecimenLength of Wing Walls
(mm)
Original Columns Axial Compression RatioActual Axial Compression RatioAxial Load
(kN)
L1-A00.260.26287
L1-B00.320.32344
L1-C00.370.37401
L2-A1000.260.19287
L2-B1000.320.23344
L2-C1000.370.26401
L3-A1500.260.16287
L3-B1500.320.20344
L3-C1500.370.23401
Table 2. Mechanical properties of materials.
ReinforcementConcrete
Rebar Typesd
(mm)
fy
(MPa)
fu
(MPa)
E
(105 N/mm2)
Part of Columnsfc (MPa)
HPB30064225182.31Original column34.3
104125311.82Wing wall35.8
HRB40085246182.06
104495621.73
124295331.91
184465612.01
Note: d = rebar diameter; fy = yield strength; fu = ultimate strength; E = elastic modulus; fc = compressive strength.
Table 3. Seismic performance of specimens with additional axial loads and wing wall lengths.
SpecimenLength of Wing Walls
(mm)
Axial Load
((kN)
Peak Load of Positive Direction (kN)Peak Load of Negative Direction (kN)Initial Stiffness
((kN/mm)
L2-D10045899.73101.6617.89
L3-D150458113.81120.2621.55
L2-E10051598.97107.6018.24
L3-E150515113.08127.6522.01
L2-F10057297.86113.5718.57
L3-F150572112.04134.4022.38
L4-A200287145.07124.7725.26
L4-B200344146.06131.7926.04
L4-C200401146.50138.4526.85
Disclaimer/Publisher’s Note: The statements, opinions and data contained in all publications are solely those of the individual author(s) and contributor(s) and not of MDPI and/or the editor(s). MDPI and/or the editor(s) disclaim responsibility for any injury to people or property resulting from any ideas, methods, instructions or products referred to in the content.