Article

Experimental Study on the Estimation of Structural Strength Correction for Concrete Using Ordinary Portland Cement

1
Department of Smart City Engineering, Hanyang University, 1271 Sa 3-dong, Sangnok-gu, Ansan-si 15588, Republic of Korea
2
Department of Architectural Engineering, Hanyang University, 1271 Sa 3-dong, Sangnok-gu, Ansan-si 15588, Republic of Korea
*
Author to whom correspondence should be addressed.
Buildings 2025, 15(20), 3642; https://doi.org/10.3390/buildings15203642
Submission received: 3 September 2025 / Revised: 25 September 2025 / Accepted: 9 October 2025 / Published: 10 October 2025
(This article belongs to the Collection Advanced Concrete Structures in Civil Engineering)

Abstract

This study investigates the influence of seasonal curing conditions on the compressive strength development of reinforced concrete, focusing on the gap between standard-cured cylinders and in situ structural performance. Concrete mixes with water-to-binder ratios of 0.35, 0.45, and 0.55 were cast under summer, autumn, and winter conditions. Large-scale specimens were instrumented to monitor the internal heat of hydration at center and outer regions, and 91-day core strengths were compared with 28-day standard-cured cylinders. Results revealed that seasonal temperature variations significantly affect hydration kinetics, producing thermal gradients that lead to spatial strength differences. Normal distribution analysis (28S91 values) was used to quantify strength deviations and derive correction factors. Outer-region cores consistently showed lower strengths, confirming them as conservative indicators for design. Based on μ + 2σ, correction factors of approximately 8 MPa are recommended for summer and winter conditions and 5 MPa for autumn, ensuring a conservative estimate of in situ strength. The proposed approach provides a rational, data-driven basis for mix design strength adjustments, improving the reliability of structural safety evaluations and supporting climate-responsive construction planning for durable and safe reinforced concrete structures.

1. Introduction

The assessment of quality control and strength development in reinforced concrete (R/C) structural elements is generally determined by the compressive strength of cylindrical samples cured in standard laboratory settings, usually kept at a temperature of 20 °C and with relative humidity exceeding 95%, or through prolonged water curing [1,2,3]. This standard procedure has historically acted as the criterion for evaluating concrete quality and confirming that design specifications are satisfied. Nonetheless, considerable differences frequently arise between the compressive strength of these standard-cured cylinders and the true in situ strength of the structural concrete utilized in actual construction projects [4,5,6]. These inconsistencies present significant obstacles in accurately forecasting and ensuring the structural performance and safety of concrete structures.
Specifically, core samples taken directly from structural elements often show lower compressive strength compared to their corresponding standard-cured cylinders, even when evaluated at the same age. Worryingly, these fundamental specimens might persist in displaying diminished strength long after the typical 28-day testing timeframe, and at times may never attain the strength levels demonstrated by the standard-cured specimens [7,8]. This ongoing disparity indicates that existing testing and assessment methods may not adequately reflect the intricate in situ conditions encountered by structural concrete during hydration and strength development [9,10].
The primary causes of this strength variation mainly arise from the differences in the curing conditions of structural concrete and laboratory test samples. Significantly, elements like temperature changes, humidity differences, and the heat generated during hydration, which is affected by the dimensions and shape of the concrete element, lead to uneven strength progression [11,12,13]. Among these factors, the curing temperature is well-known as one of the most significant parameters that influence cement hydration kinetics and, consequently, the mechanical properties of hardened concrete [14,15,16]. Cement hydration is an exothermic reaction; therefore, the hydration heat produced closely relates to the curing temperature and can greatly influence the microstructure and strength development of the concrete [17,18,19,20,21].
It is widely recognized that increased curing temperatures enhance early-age strength development by facilitating quicker hydration reactions. Nonetheless, this quick increase in strength frequently results in a compromise on long-term strength, as it may cause the creation of a microstructure that is less dense and more porous [22,23]. However, this accelerated hydration can lead to coarser pore structures and microcracking, which may limit later-age strength gain and long-term durability. In contrast, concrete that is cured in low-temperature environments often shows slower early strength growth. Although this gradual hydration process might theoretically improve long-term microstructural refinement, research indicates that it may also lead to lower ultimate strength when compared to concrete cured under moderate conditions [24,25,26]. These insights underscore the intricate relationship among temperature, hydration rates, and sustained performance that requires careful management in application.
The issue is exacerbated by the thermal characteristics of large structural elements, in which internal temperature variations are fundamentally uneven. In large elements, the core areas hold onto more heat produced during hydration, sustaining elevated internal temperatures for longer durations. In contrast, the outer areas, more exposed to surrounding conditions, lose heat more rapidly, leading to relatively lower hydration temperatures [27,28,29]. These internal thermal variations result in inconsistent hydration rates, ultimately causing uneven strength development throughout the cross-section of the structural element [27,28,29,30]. These inconsistencies can compromise structural effectiveness, particularly if design and quality assurance procedures do not sufficiently address them.
Acknowledging these challenges, design codes and guidelines have implemented several correction techniques to reconcile mix design strength with the real in situ performance of structural concrete. For example, the American Concrete Institute (ACI) and the Korean Concrete Standard Specification (KCS) offer temperature-specific correction factors to modify mix design strength, thereby addressing variations in curing temperature during construction (Table 1). Moreover, the Japanese JASS code introduces the mSn correction factor, which specifically accounts for the effects of temperature and the common strength variations noted between structural concrete and standard-cured test samples [31,32,33]. Although these methods signify noteworthy advancement, they primarily rely on empirical data and broad assumptions, frequently missing the accuracy needed for varied construction conditions and member geometries.
Consequently, additional studies are crucial to enhance understanding of the in situ strength development characteristics of structural concrete during real construction scenarios, particularly regarding internal heat generation during hydration. These studies can offer more dependable analytical models to assess performance disparities between standard-cured samples and concrete in structural components. Additionally, it is essential to develop a quantitative approach that can estimate strength correction factors reflecting the actual curing conditions, internal temperature histories, and strength discrepancies noted between the structural core and test samples. This would not only guarantee a sufficient safety margin but also promote the enhancement of mix design and quality control methods customized for particular project needs.
Accordingly, the present study aims to quantitatively determine a strength correction factor for structural concrete that accounts for seasonal variations in curing temperature and internal heat evolution. To achieve this objective, the internal heat of hydration was continuously monitored at both the center and edge of large structural specimens to capture thermal gradients during early-age curing. Core specimens were then extracted from both locations at 91 days and tested for compressive strength. These results were systematically compared with the companion standard-cured cylinders tested at 28 days. Based on this comparison, a temperature- and location-dependent correction factor, designated as the 28S91 correction factor, is proposed. This parameter provides a quantitative measure of the strength deviation between field-cured and standard-cured concretes, enabling more accurate estimation of in situ strength. The proposed approach is intended to enhance the reliability of strength prediction, provide a rational basis for mix design adjustments, and ultimately contribute to safer and more durable reinforced concrete structures under varying seasonal conditions.
The novelty of this study lies in its quantitative evaluation of temperature-dependent strength differences between standard-cured and in-situ concrete, supported by real-time internal heat monitoring under seasonal conditions. Unlike conventional approaches, this work introduces the 28S91 correction factor, derived from normal-distribution analysis, to accurately estimate in-situ strength. The proposed methodology provides a rational and data-driven basis for developing temperature- and location-specific correction factors applicable to practical mix design and structural safety assessment.

2. Materials and Methods

2.1. Materials

In this study, Ordinary Portland Cement (OPC) was used as the primary binder for both the structural concrete and the standard-cured cylinder specimens. The cement was procured from Sungshin Cement, South Korea, and its chemical composition was analyzed using X-ray fluorescence (XRF). The results of the XRF analysis are presented in Table 2. The cement exhibited typical oxide compositions suitable for normal-strength structural concrete applications, with CaO as the major component (65.4%), along with SiO2 (18.6%), Al2O3 (4.8%), Fe2O3 (3.9%), and smaller amounts of other oxides.
The aggregates consisted of coarse crushed granite and fine, washed natural seashore sand. Table 3 presents the physical properties of the aggregates, including maximum particle size, density, absorption capacity, and fineness modulus. In addition, Figure 1 shows the results of the sieve analysis conducted for both types of aggregates to evaluate the particle size distribution and ensure compliance with relevant standards. The fineness modulus of the coarse aggregate was determined to be 7.27, indicating a relatively coarse grading that is desirable for reducing paste content and enhancing dimensional stability. The fine aggregate exhibited a fineness modulus of 2.47, reflecting its suitability for improving the workability and cohesiveness of fresh concrete.

2.2. Method

2.2.1. Mixture Design and Ambient

Table 4 presents the detailed mix proportions of the normal-strength concrete prepared for this study, covering both the structural specimens and the standard-cured cylinder specimens. The mixture design aimed to produce comparable concrete quality across different environmental conditions while allowing the effect of curing temperature on strength development to be systematically investigated.
For the standard (autumn) and summer curing conditions, identical mix designs were adopted to maintain consistency in cement content, water content, aggregate proportions, and water-to-cement (W/C) ratios. The W/C ratios were set at 0.35, 0.45, and 0.55, representing a practical range of low, medium, and relatively high-water contents commonly used in structural concrete. Under winter conditions, where ambient temperatures are substantially lower, the cement content in the mixes with W/C ratios of 0.35 and 0.45 was deliberately increased by 20 kg/m3 compared to the standard and summer mixes. This adjustment was made to compensate for the reduced rate of cement hydration at low ambient temperatures and to secure adequate early-age strength necessary for formwork removal and structural load carrying. In addition, the sand-to-aggregate ratio (S/a) was fixed at 51% for all mixtures to prevent segregation caused by vibration compaction. These adjustments were intended to compensate for the reduced rate of cement hydration and delayed strength development typically observed at low curing temperatures, thereby ensuring that the concrete could achieve sufficient early-age strength and overall performance [34,35,36,37].
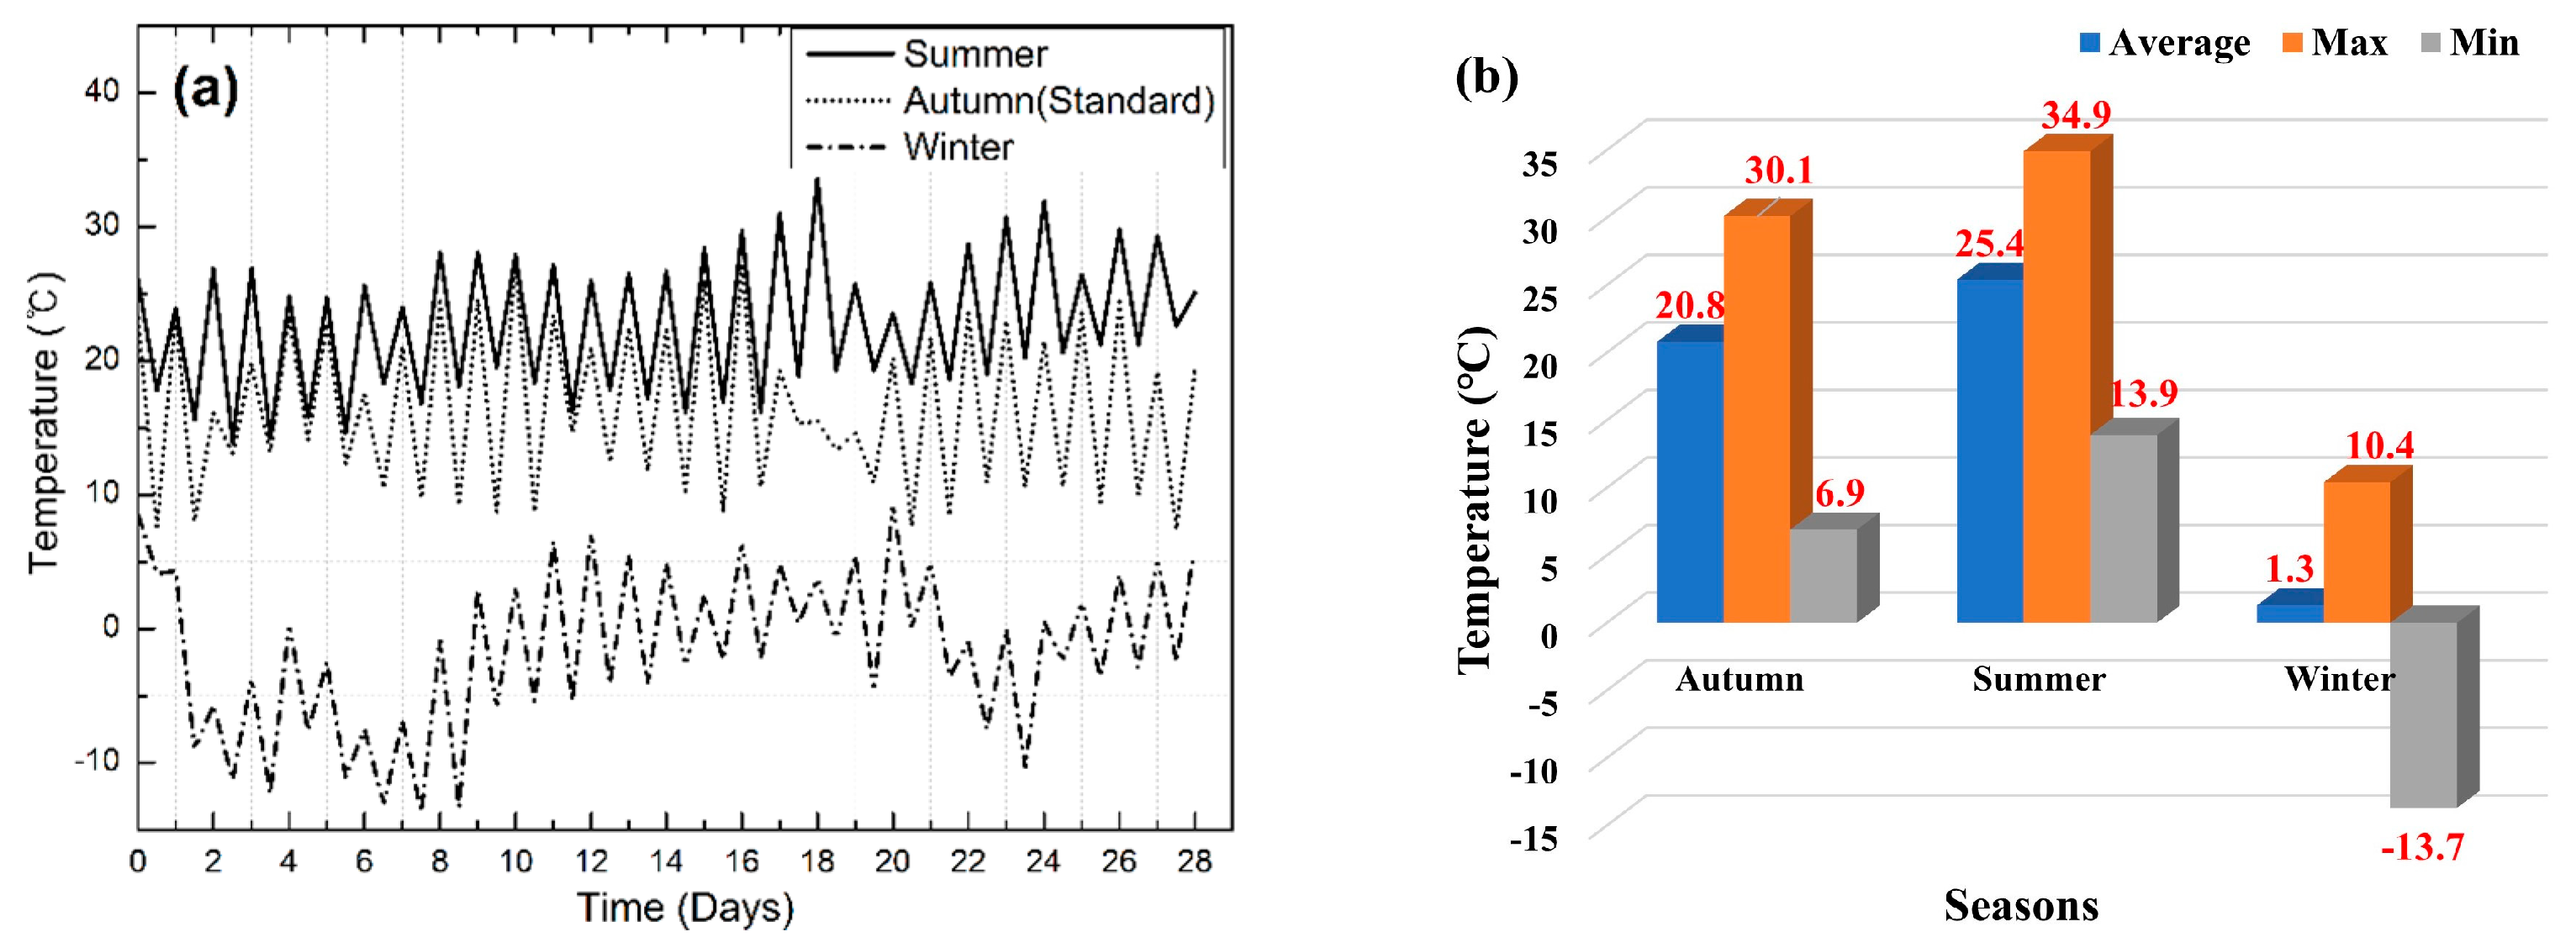
Figure 2a,b provide a summary of the ambient temperature data recorded throughout the curing period of the structural concrete specimens. These temperature records are critical for interpreting the effects of environmental conditions on the heat of hydration and the subsequent strength development of the concrete. During the standard (autumn) season, ambient temperatures ranged from approximately 6.9 °C to 30.1 °C, with an average temperature around 20.8 °C, representing moderate curing conditions. In the summer season, higher ambient temperatures were observed, ranging from about 13.9 °C to 34.9 °C, and averaging 25.4 °C, which could accelerate early hydration and strength gain. Conversely, the winter season experienced significantly lower temperatures, from −13.7 °C to 10.4 °C, with an average of approximately 1.3 °C, conditions that could slow hydration and potentially reduce early-age strength.

2.2.2. Experimental Procedure

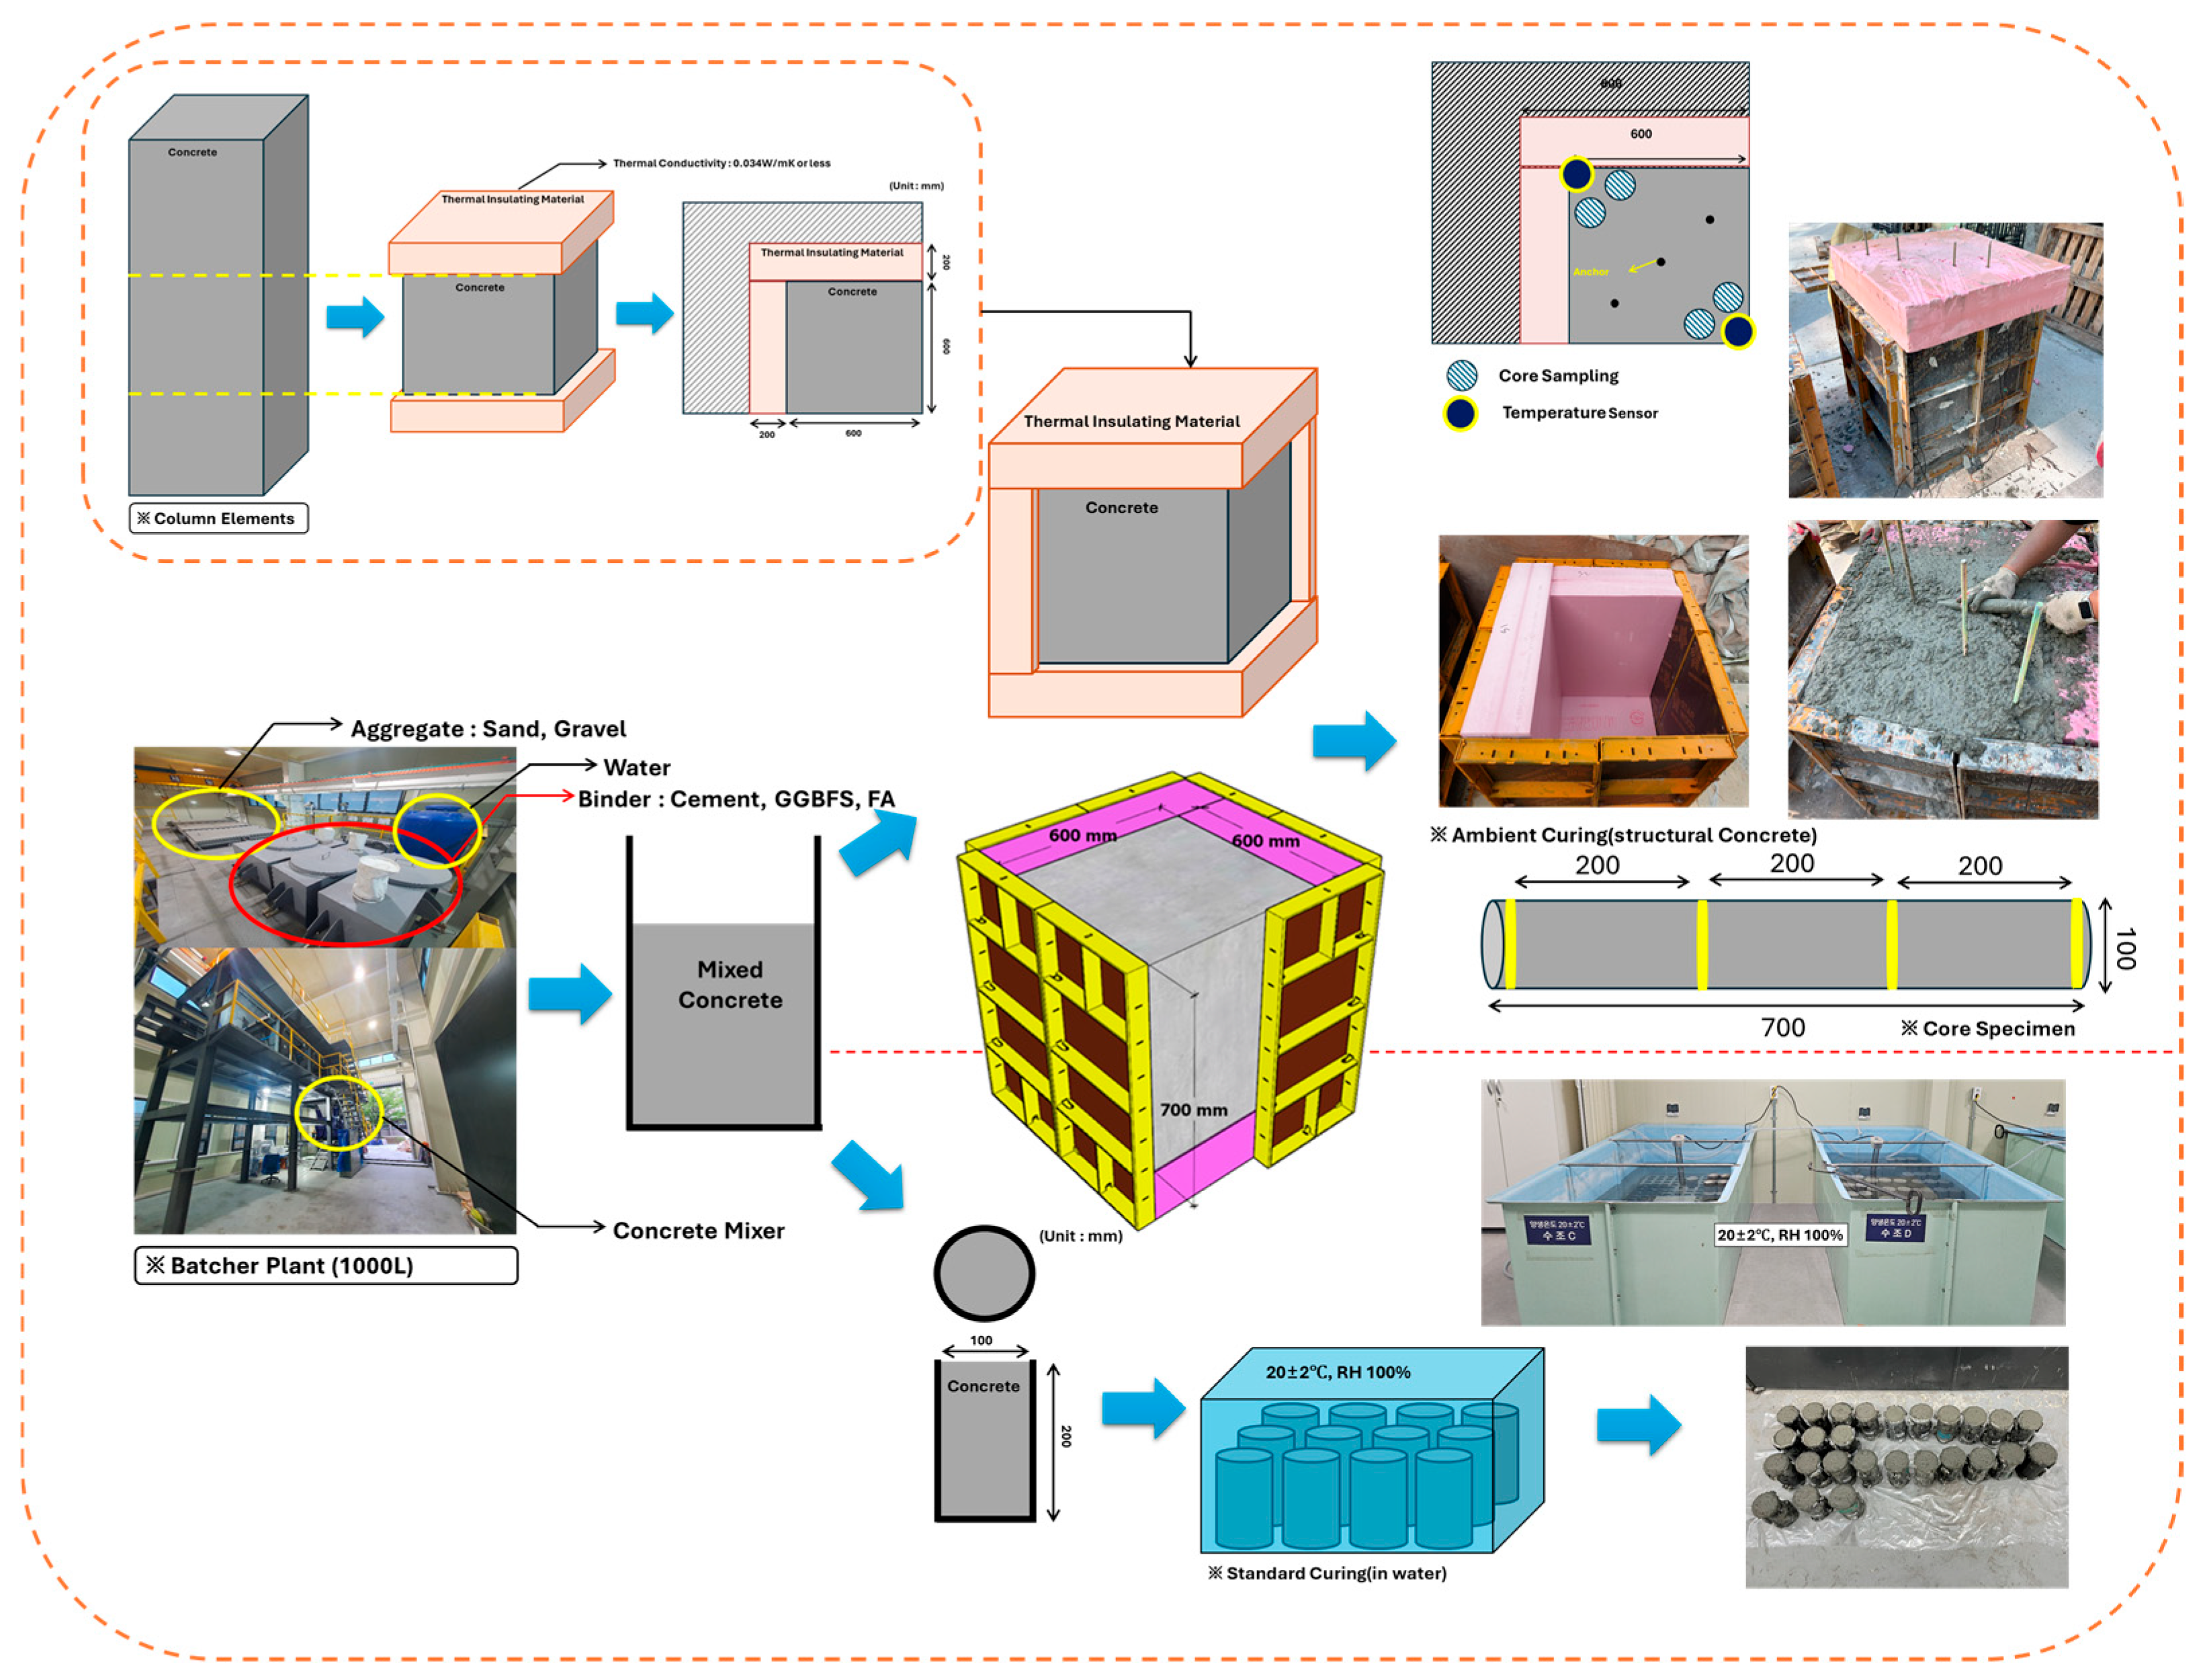
The overall experimental procedure is illustrated in the schematic diagram shown in Figure 3. Concrete mixing was carried out using a fully automated batch plant with a capacity of 1000 L, ensuring uniform mixing and homogeneous quality across all test batches. Both the structural concrete specimens and the standard-cured cylinder specimens were prepared simultaneously from the same fresh concrete batch, enabling a direct and reliable comparison of their compressive strength development under different curing conditions. This procedure was conducted separately during the summer, autumn, and winter seasons.
The structural concrete specimens were cast into molds with dimensions of 800 × 800 × 900 mm, but with thermal insulation inserted to produce effective specimen dimensions of 600 × 600 × 700 mm, reflecting the thermal behavior of moderately sized structural members in practice. To replicate the temperature conditions typically observed in the core regions of mass concrete elements, three vertical sides of the molds were carefully covered with thermal insulation boards having a thermal conductivity of ≤0.034 W/m·K. Immediately after casting and surface finishing, the top surface was also covered with the same insulation material, resulting in four-sided insulation. This setup minimized heat dissipation to the surroundings and enabled a realistic measurement of internal hydration heat and its effect on strength development [38,39].
In contrast, the standard-cured cylinder specimens were stored indoors in a controlled curing room maintained at 20 ± 1 °C and a relative humidity of ≥95%, in accordance with KS F 2403. This ensured that the cylinders developed strength under ideal laboratory conditions, serving as a reference for evaluating the performance of structural concrete exposed to actual outdoor curing environments [40].
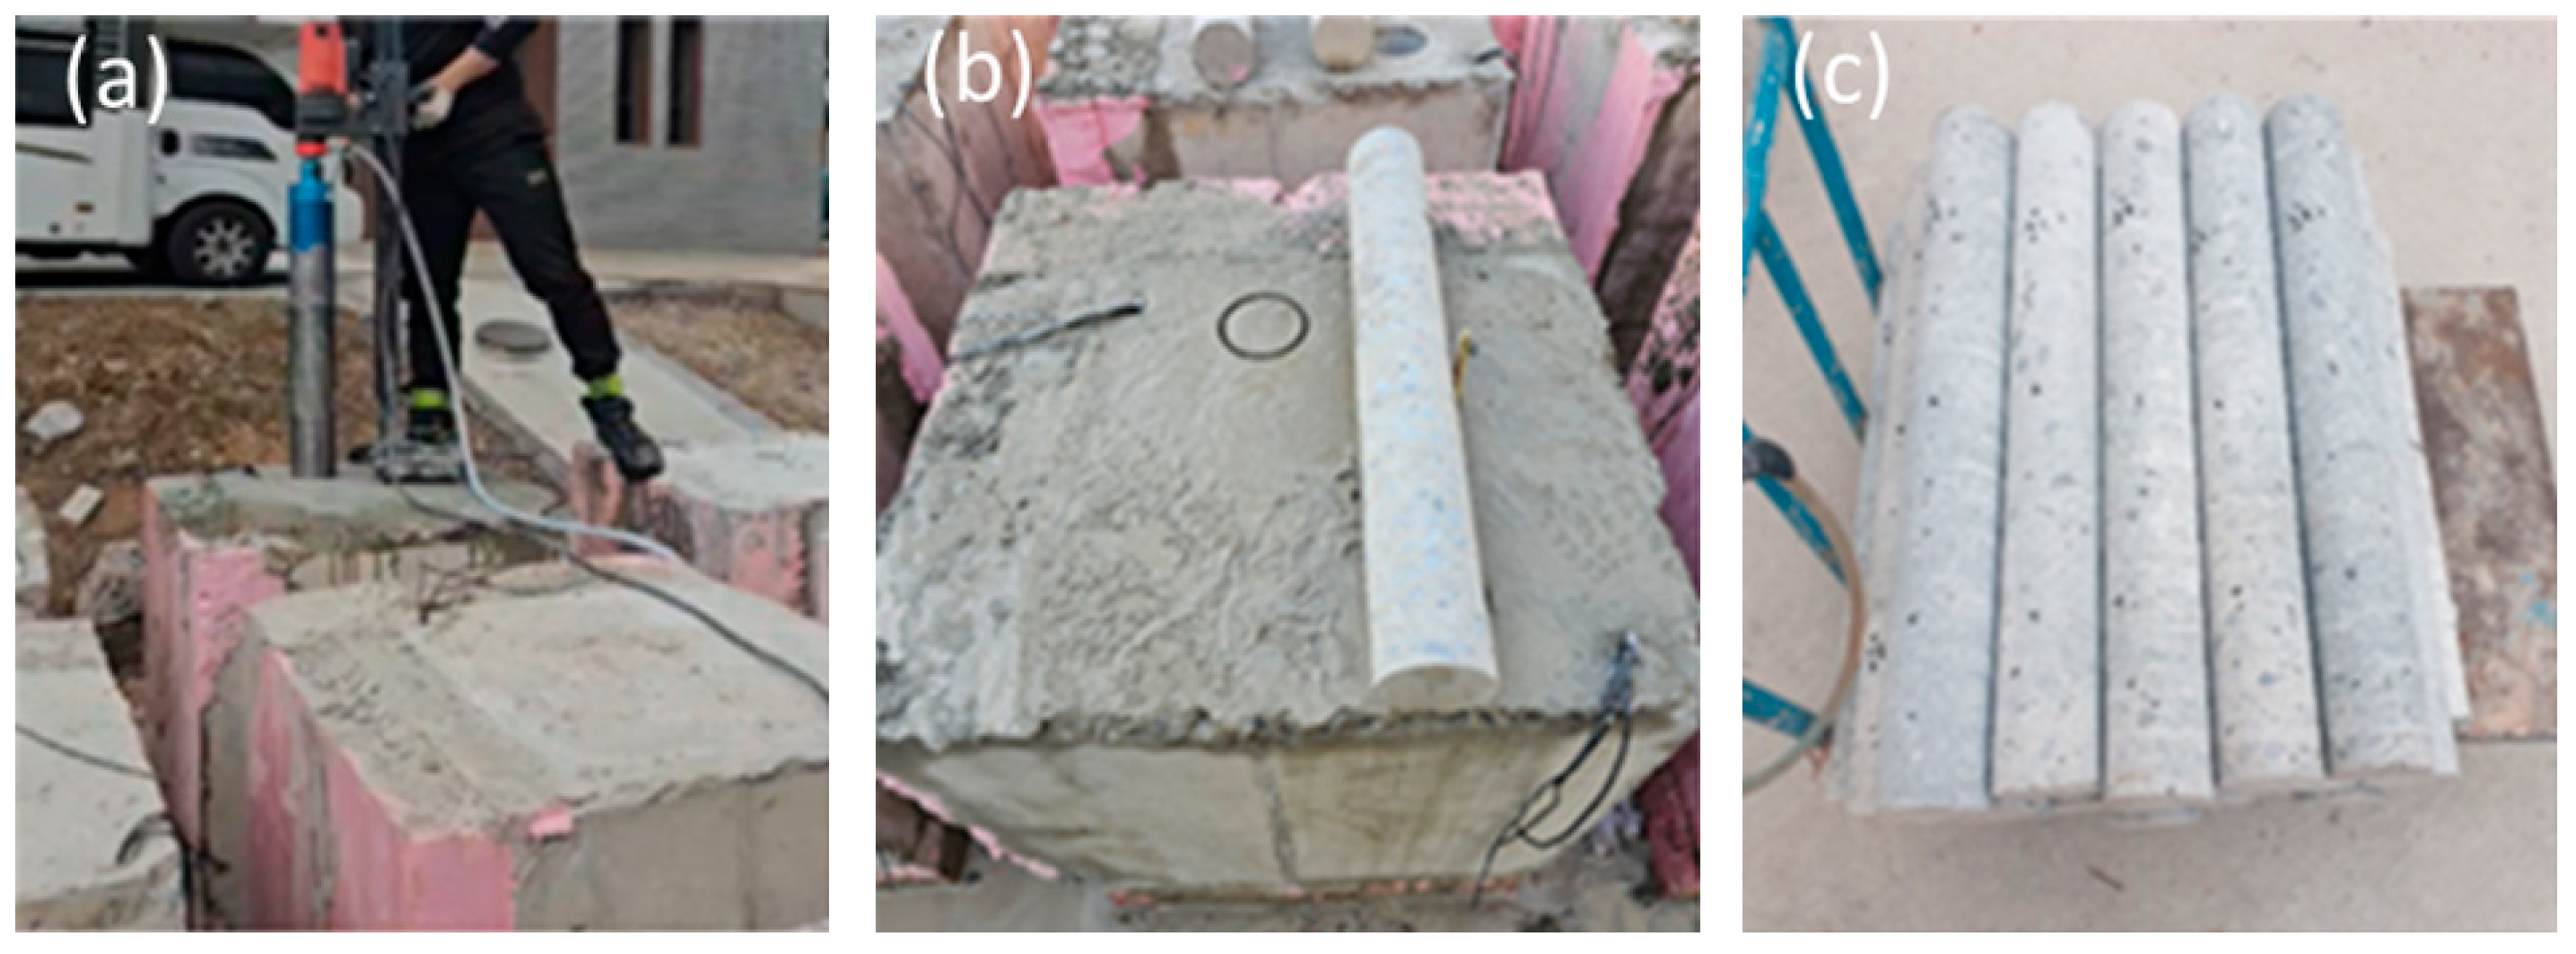
After the curing period, core sampling was carried out to investigate spatial variations in compressive strength within the structural specimens. As shown in Figure 3, the top insulation layer was first removed, and core drilling was performed to extract cylindrical samples from two locations: the central region (representing the core area with higher internal curing temperatures) and the edge region (representing areas more influenced by external ambient conditions). Each extracted core had an initial dimension of Φ100 × 700 mm. In addition, the sensors for measuring hydration heat were installed at both the center and edge regions, spaced 100 mm horizontally and vertically, with depths of 100 mm, 300 mm, and 600 mm measured from the bottom insulation layer.
For compressive strength testing, the cores were cut into standard test dimensions of Φ100 × 200 mm, as indicated in Figure 4. This size matched that of the standard-cured cylinders, enabling a consistent and direct comparison of compressive strength results between the structural cores and the reference specimens.

3. Results and Discussions

3.1. Heat of Hydration Under Different Seasonal Conditions

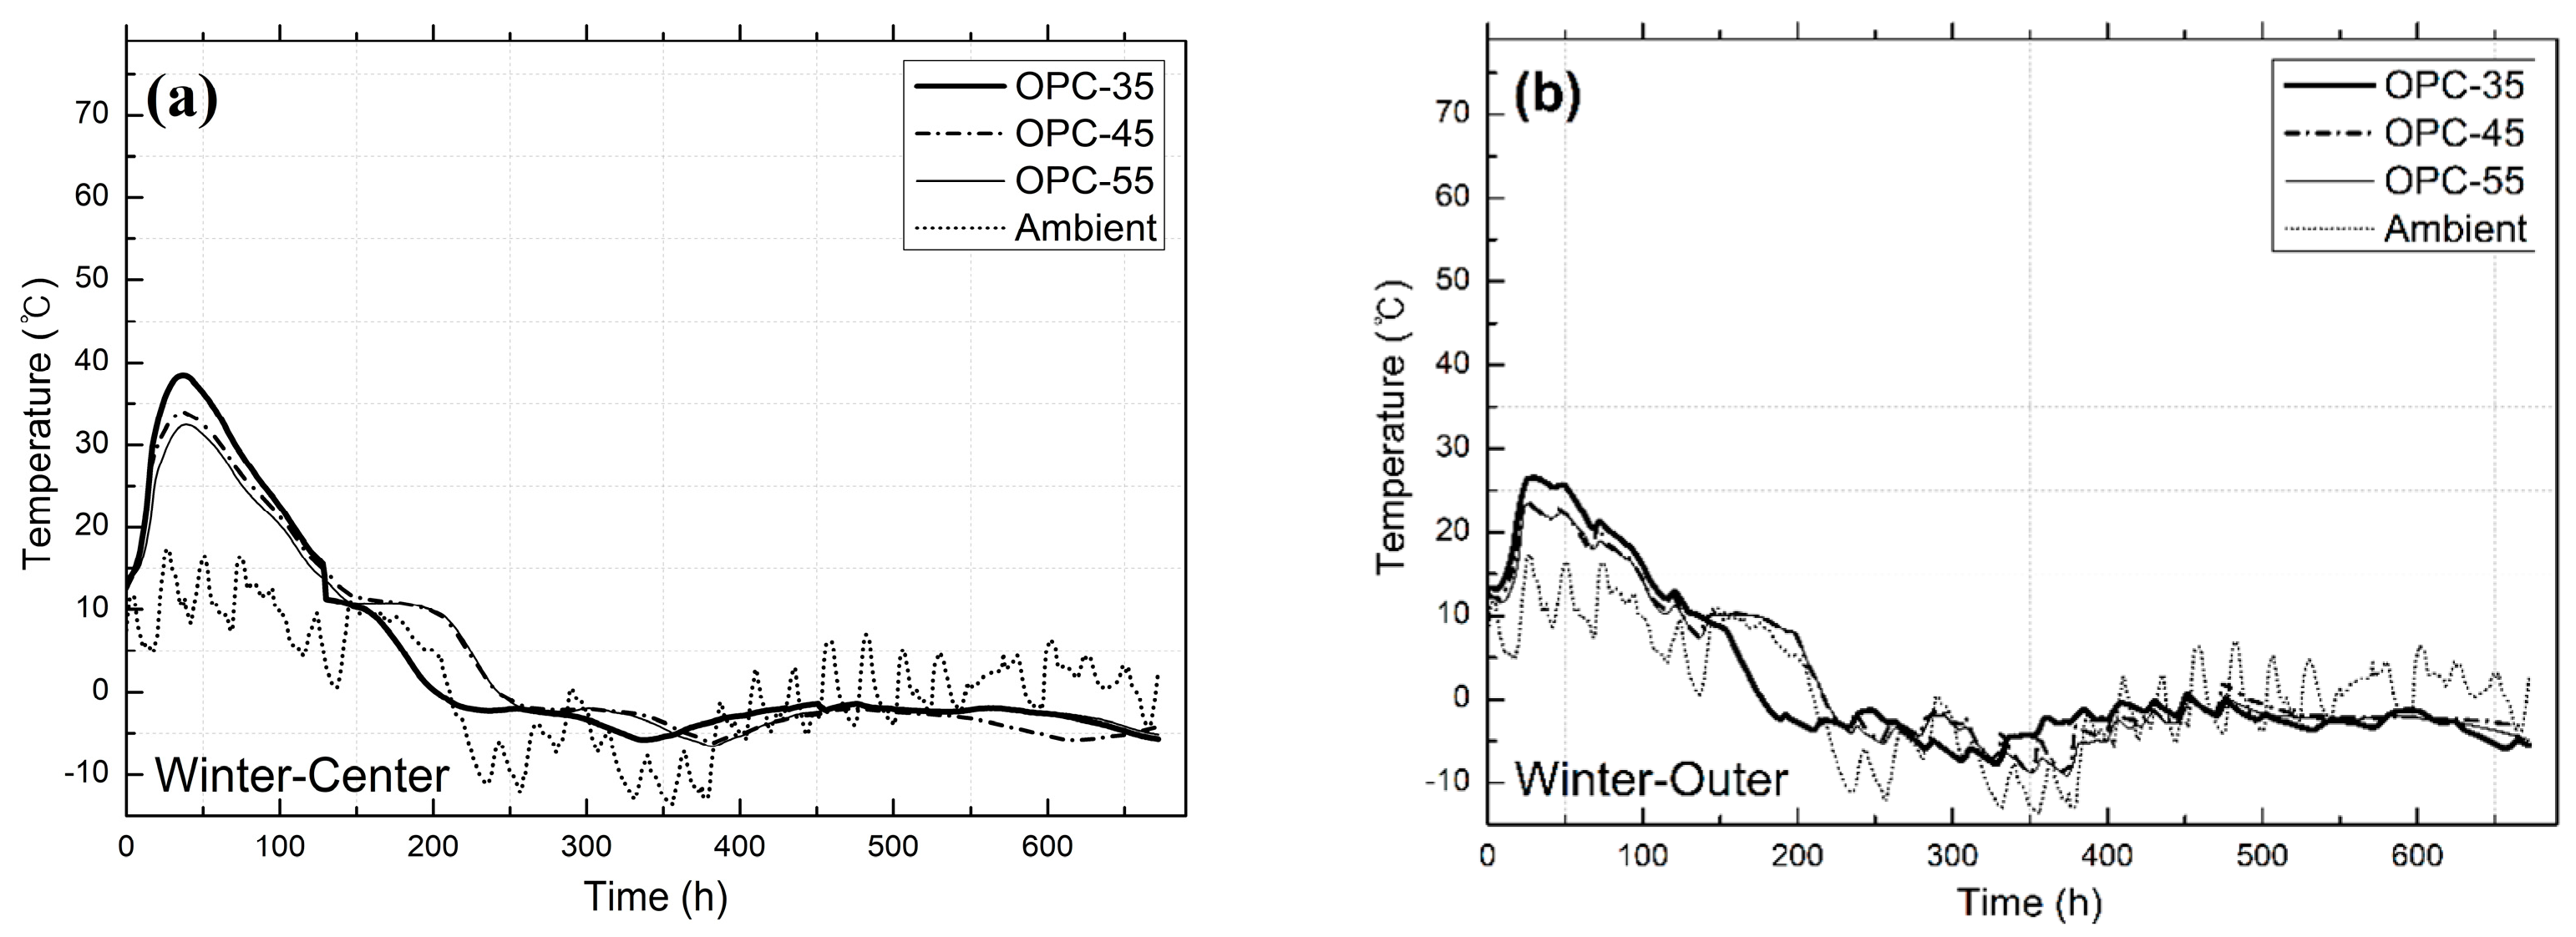
Figure 5 presents the measured heat of hydration of the structural concrete specimens placed under winter conditions, highlighting the thermal behavior at two critical locations within the specimen: (a) the center and (b) the outer region.
In Figure 5a, which illustrates the internal temperature profiles measured at the center, the OPC-35 mixture exhibited the highest peak temperature, reaching approximately 39.5 °C. This was followed by the OPC-45 and OPC-55 mixtures in descending order of peak temperature. The observed trend indicates that mixes with lower water-to-cement (W/C) ratios generally generate higher heat of hydration, attributable to their higher cement content and denser matrix that retains heat more effectively.
Figure 5b shows the temperature evolution at the outer region of the specimen. Although the OPC-35 mix again demonstrated the highest peak temperature at around 26.7 °C, the difference in peak temperatures between OPC-45 and OPC-55 was comparatively small, with a maximum variation of about 2 °C. This reduced difference at the specimen’s periphery can be attributed to greater heat dissipation into the surrounding environment, which moderates the thermal gradient and limits the peak temperatures, especially in colder ambient conditions.
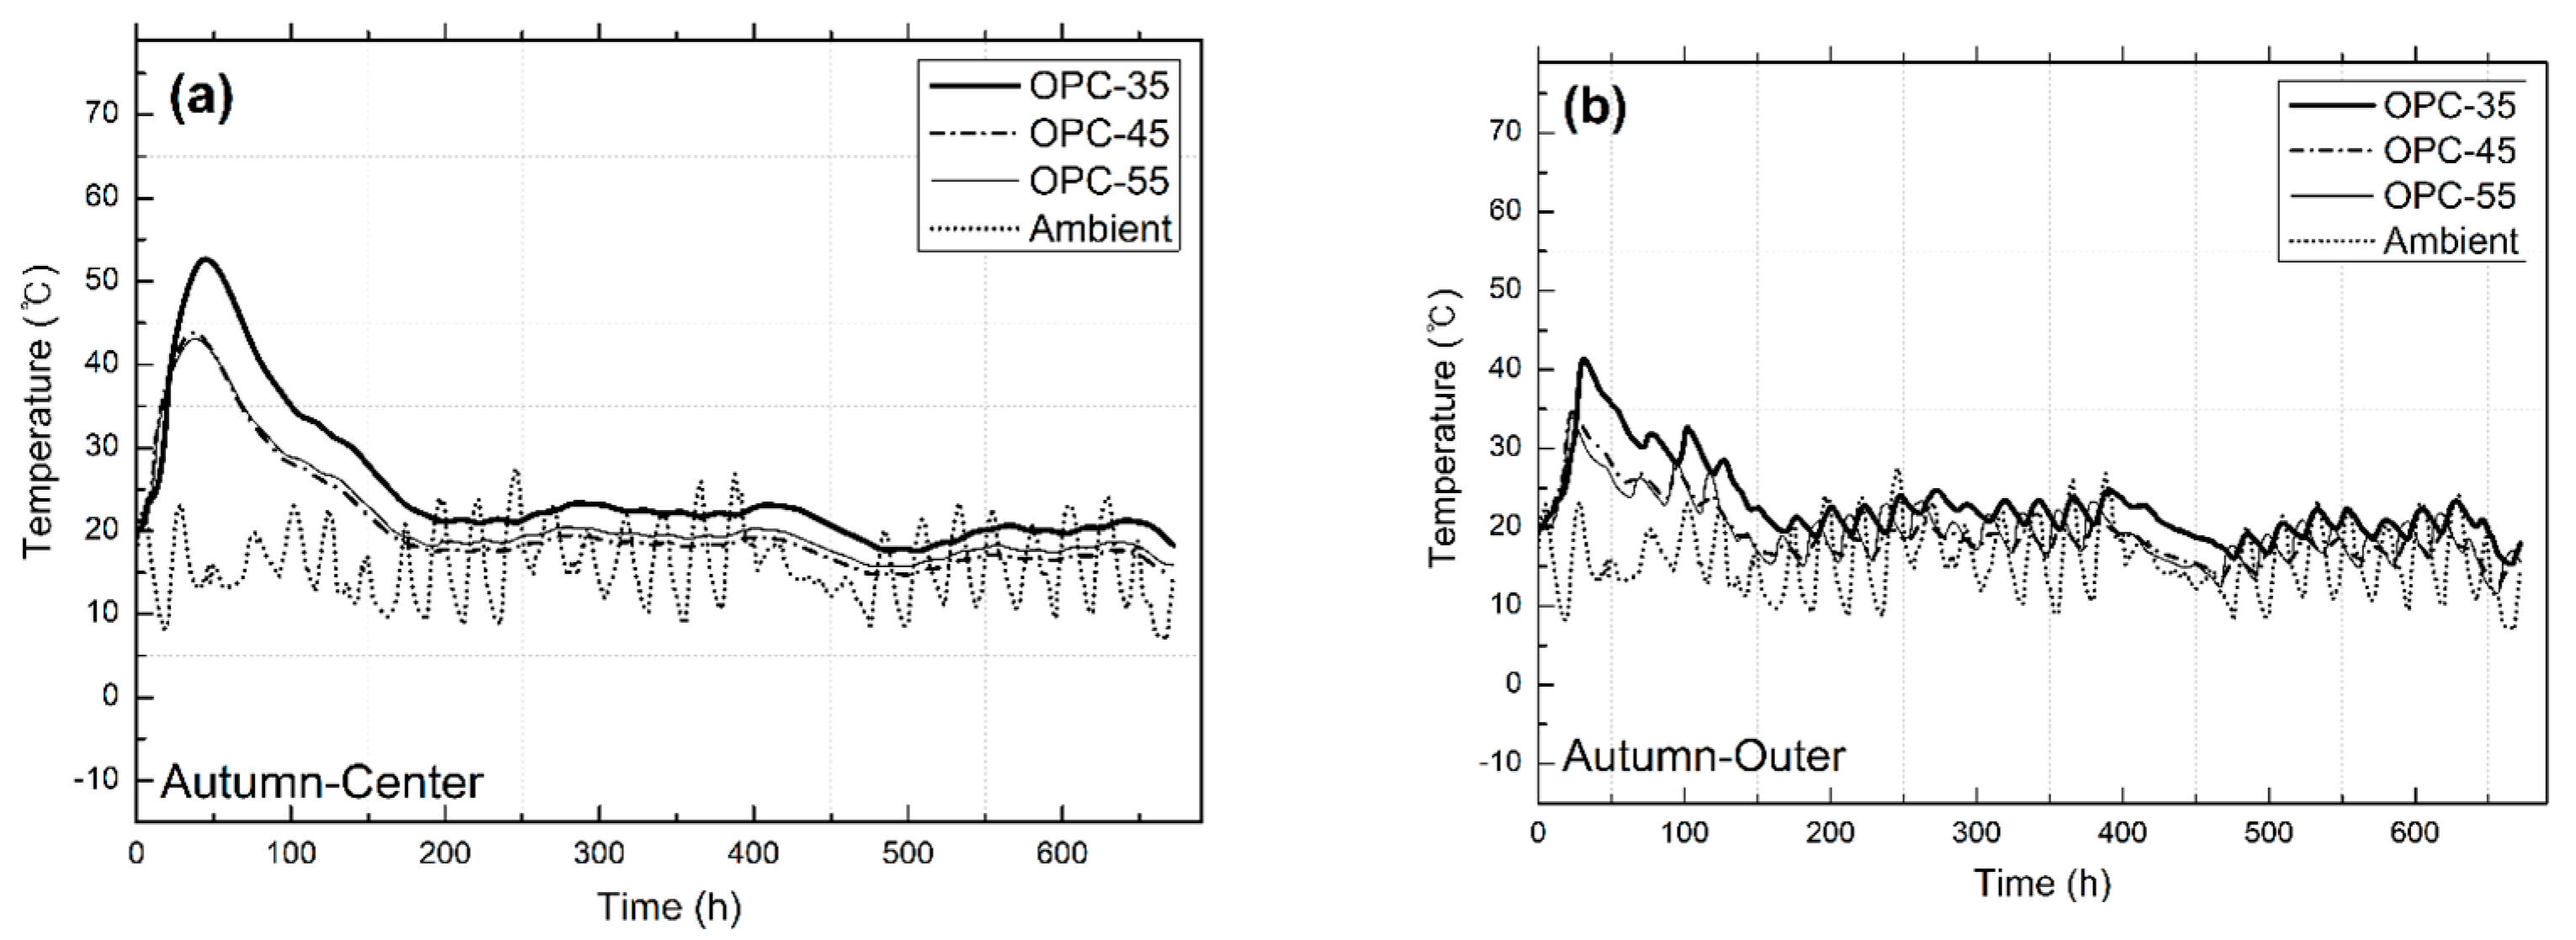
Figure 6 shows the heat of hydration measurements obtained from the structural concrete specimens placed under standard-season (autumn) conditions, which experienced moderate ambient temperatures.
In Figure 6a, the center region of the OPC-35 mix again exhibited the highest peak temperature, approximately 54.9 °C, significantly higher than the peak recorded under winter conditions. The OPC-45 and OPC-55 mixes followed in order, though the temperature difference between these two mixes was less than 1 °C, suggesting that under moderate external temperatures, the influence of W/C ratio on the peak hydration temperature becomes more pronounced primarily in the lower W/C mixes.
In contrast, Figure 6b displays the heat of hydration measured at the outer region of the specimen. The OPC-35 mix maintained the highest peak temperature at approximately 41.8 °C, reflecting consistent thermal performance trends across both central and peripheral zones. The maximum temperature difference between OPC-45 and OPC-55 at the outer region was about 5 °C, which is approximately 3 °C lower than the difference observed at the center. This difference implies that while internal regions benefit from retained hydration heat, outer regions are more directly influenced by ambient cooling, resulting in lower peak temperatures and smaller differences among mixtures with different W/C ratios.
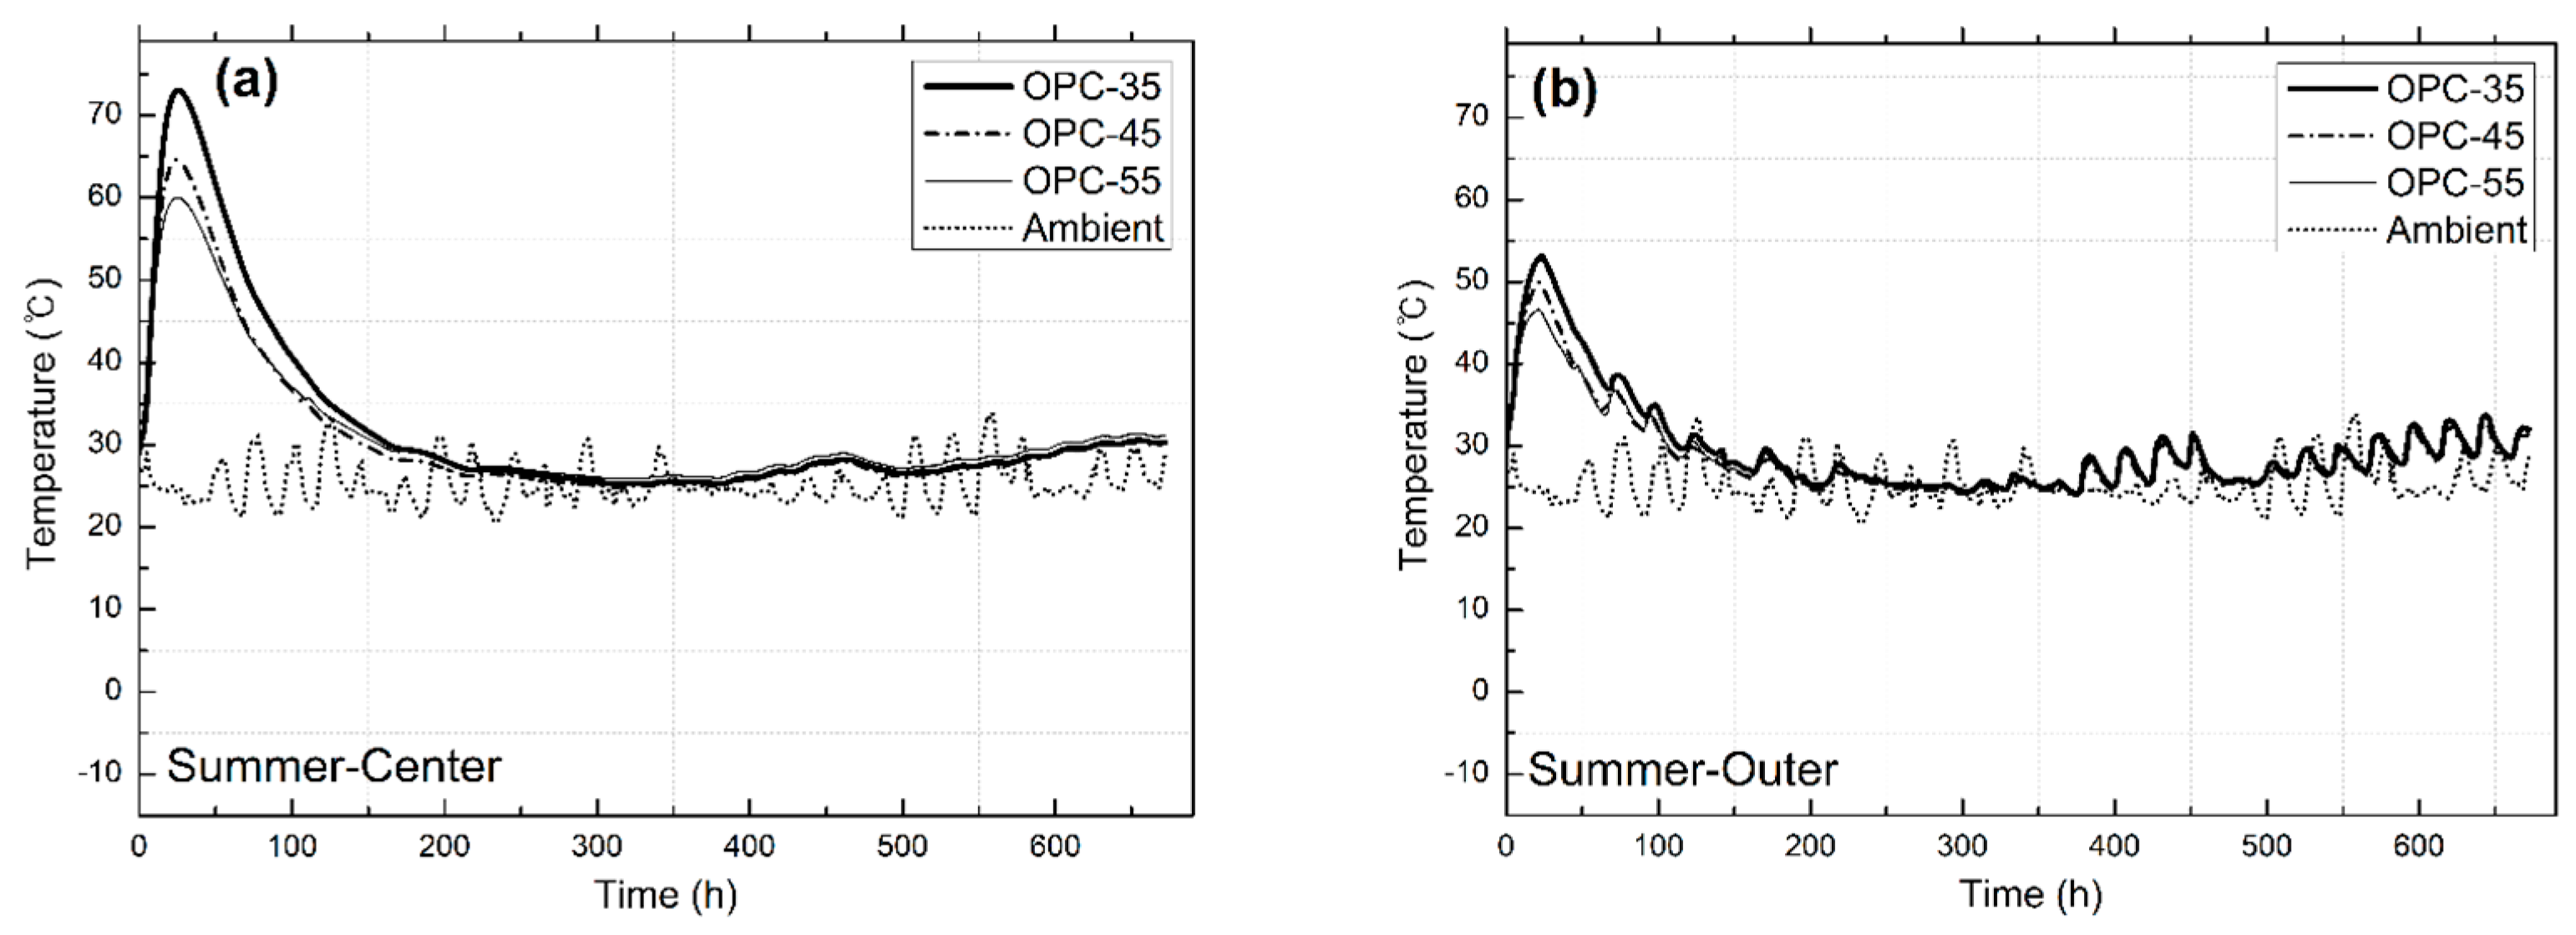
Figure 7 illustrates the heat of hydration behavior of structural concrete placed under summer conditions, characterized by the highest ambient temperatures among the three seasonal scenarios.
In Figure 7a, representing the center of the specimen, the OPC-35 mix exhibited a notably higher peak temperature of approximately 72.5 °C, which is around 33 °C higher than the peak observed under winter conditions and about 17 °C higher than under standard-season conditions. This significant rise highlights the combined effect of elevated ambient temperature and lower W/C ratio in intensifying the exothermic hydration reaction. The OPC-45 and OPC-55 mixes also demonstrated elevated peak temperatures of roughly 65.0 °C and 60.0 °C, respectively, again following the trend where lower W/C mixes generate more heat.
In Figure 7b, the outer region measurements similarly reflected the trend observed at the center. The OPC-35 mix showed the highest peak temperature at approximately 54.8 °C, followed by OPC-45 at 50.1 °C and OPC-55 at 45.6 °C. Compared to the winter and standard conditions, the outer region under summer conditions recorded substantially higher peak temperatures, highlighting the pronounced effect of external ambient temperature on the thermal performance of concrete, even in peripheral zones where heat typically dissipates more quickly.
These results demonstrate that the heat of hydration and consequently, the internal temperature evolution of structural concrete, are significantly influenced by both the mix design (specifically, W/C ratio) and the curing environment’s seasonal temperature. Lower W/C mixes consistently produced higher peak temperatures, attributed to higher cement content and denser matrices. Furthermore, the effect of ambient temperature was most evident in the summer condition, leading to the highest observed heat evolution and peak temperatures, while winter conditions resulted in lower heat retention and reduced peak temperatures, especially in the outer regions of the specimens. These findings highlight the importance of accounting for seasonal temperature variations and mix design parameters in predicting the thermal behavior and strength development of structural concrete [41,42,43].
These observed differences in internal heat of hydration and peak temperature profiles are directly relevant to the strength development of structural concrete. Higher internal curing temperatures—typically associated with lower water-to-cement ratios and warmer ambient conditions—accelerate cement hydration, leading to faster early-age strength gain. However, excessively high peak temperatures, such as those recorded under summer conditions (e.g., ≈72.5 °C for OPC-35), can also increase the risk of thermal cracking and may result in non-uniform microstructural densification, ultimately compromising long-term strength and durability.
Conversely, the lower peak temperatures observed during winter conditions slow down hydration kinetics, which delays early strength development and may reduce the ultimate compressive strength achievable over time. Additionally, the pronounced temperature gradients between the core and outer regions of the specimens highlight the inherently non-uniform curing environments present in large concrete members. These gradients can produce localized variations in strength and stiffness, affecting overall structural performance.
Understanding and quantifying these thermal effects is therefore essential for accurately estimating the in situ strength of structural concrete. This knowledge enables the adjustment of mix designs and the application of strength correction factors to ensure adequate safety margins and reliable performance across different seasonal conditions. In the following Section 3.2, we build on these thermal observations by examining the compressive strength test results from both core specimens (center and edge) and standard-cured cylinders, aiming to assess how internal heat evolution and curing temperature differences translate into actual strength development.

3.2. Compressive Strength

As discussed in the preceding section, the differences in internal heat of hydration and peak temperature profiles, driven by seasonal conditions and mix proportions, have direct implications for the strength development of structural concrete. Elevated internal curing temperatures tend to accelerate early hydration and strength gain, while lower temperatures slow hydration kinetics, potentially reducing both early and ultimate strength. Moreover, the observed thermal gradients between the core and outer regions introduce spatial variability in strength across the structural cross-section. Understanding how these thermal effects translate into actual compressive strength is essential for accurately estimating In Situ performance and ensuring structural safety.
In this section, the compressive strengths of the standard-cured specimens at 28 days and the structural concrete cores at 91 days, representing the most comparable stages of strength development—are evaluated and compared [44,45]. Accordingly, the compressive strength results of the standard-cured cylinder specimens tested at 28 days and the structural core specimens extracted and tested at 91 days are systematically presented. The results are organized by mix design and seasonal curing condition to highlight the combined effects of W/B ratio, ambient temperature, and specimen location (Center Vs. Outer) on strength development. Through this analysis, the study aims to clarify the relationship between curing conditions, internal heat evolution, and strength performance, thereby providing essential data for subsequent correction factor estimation [46].
Table 5 presents the average compressive strengths of standard-cured cylinder specimens tested at 28 days alongside the structural core specimens tested at 91 days, categorized by mix proportions and seasonal curing conditions. Among the three seasons studied, the highest average compressive strength was observed under standard-season (autumn) conditions, while the lowest was recorded during winter. This general trend highlights the significant influence of ambient temperature on strength development: moderate curing temperatures in the standard season favored optimal hydration, whereas low winter temperatures slowed hydration and strength gain despite extended curing.
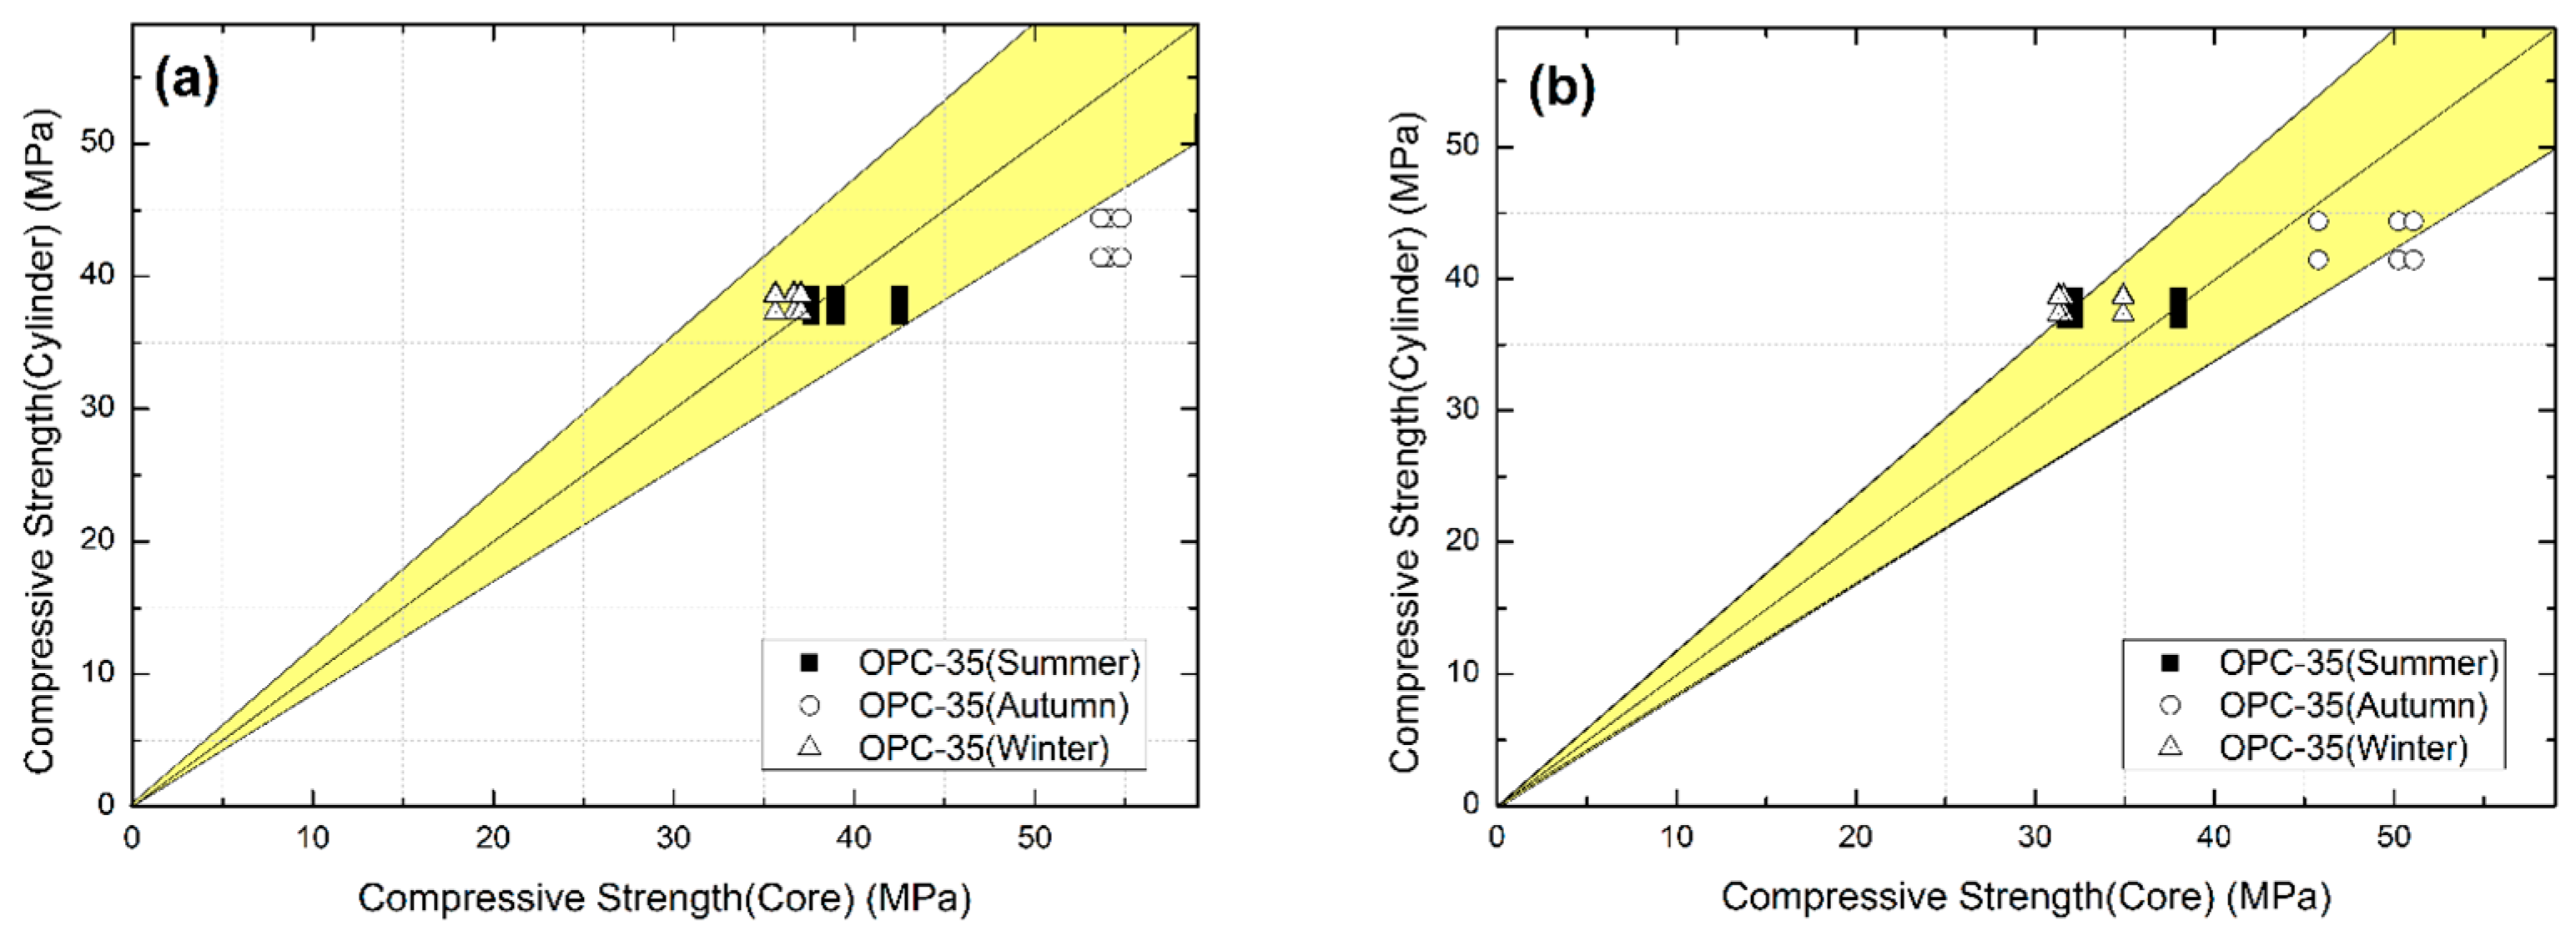
Figure 8 compares the compressive strength results between standard-cured cylinders and structural core specimens for the OPC-35 mix under different seasonal conditions. In Figure 8a, which shows the center-region cores, under standard-season conditions, core specimens exhibited compressive strengths more than 9 MPa higher than the corresponding cylinders. This suggests that the higher internal curing temperature in the specimen’s core promoted enhanced hydration and strength development over time. In the summer season, the difference was smaller, with core strengths ranging from slightly lower (−1 MPa) to slightly higher (+5 MPa) than the cylinders, reflecting the more rapid but balanced hydration under warmer conditions. Under winter conditions, however, the standard-cured cylinders showed higher compressive strengths than the center cores, with a maximum difference of about 3 MPa, highlighting the negative effect of low curing temperatures on In Situ strength. Figure 8b shows the outer-region cores compared to the cylinders. In the standard season, outer-region cores were still stronger by 1–9 MPa. However, in both summer and winter, the outer-region cores recorded lower compressive strengths than the cylinders, with maximum reductions of about 6 MPa in summer and 7 MPa in winter. These reductions likely reflect greater heat loss at the outer regions, which limits hydration compared to the better-insulated cores.
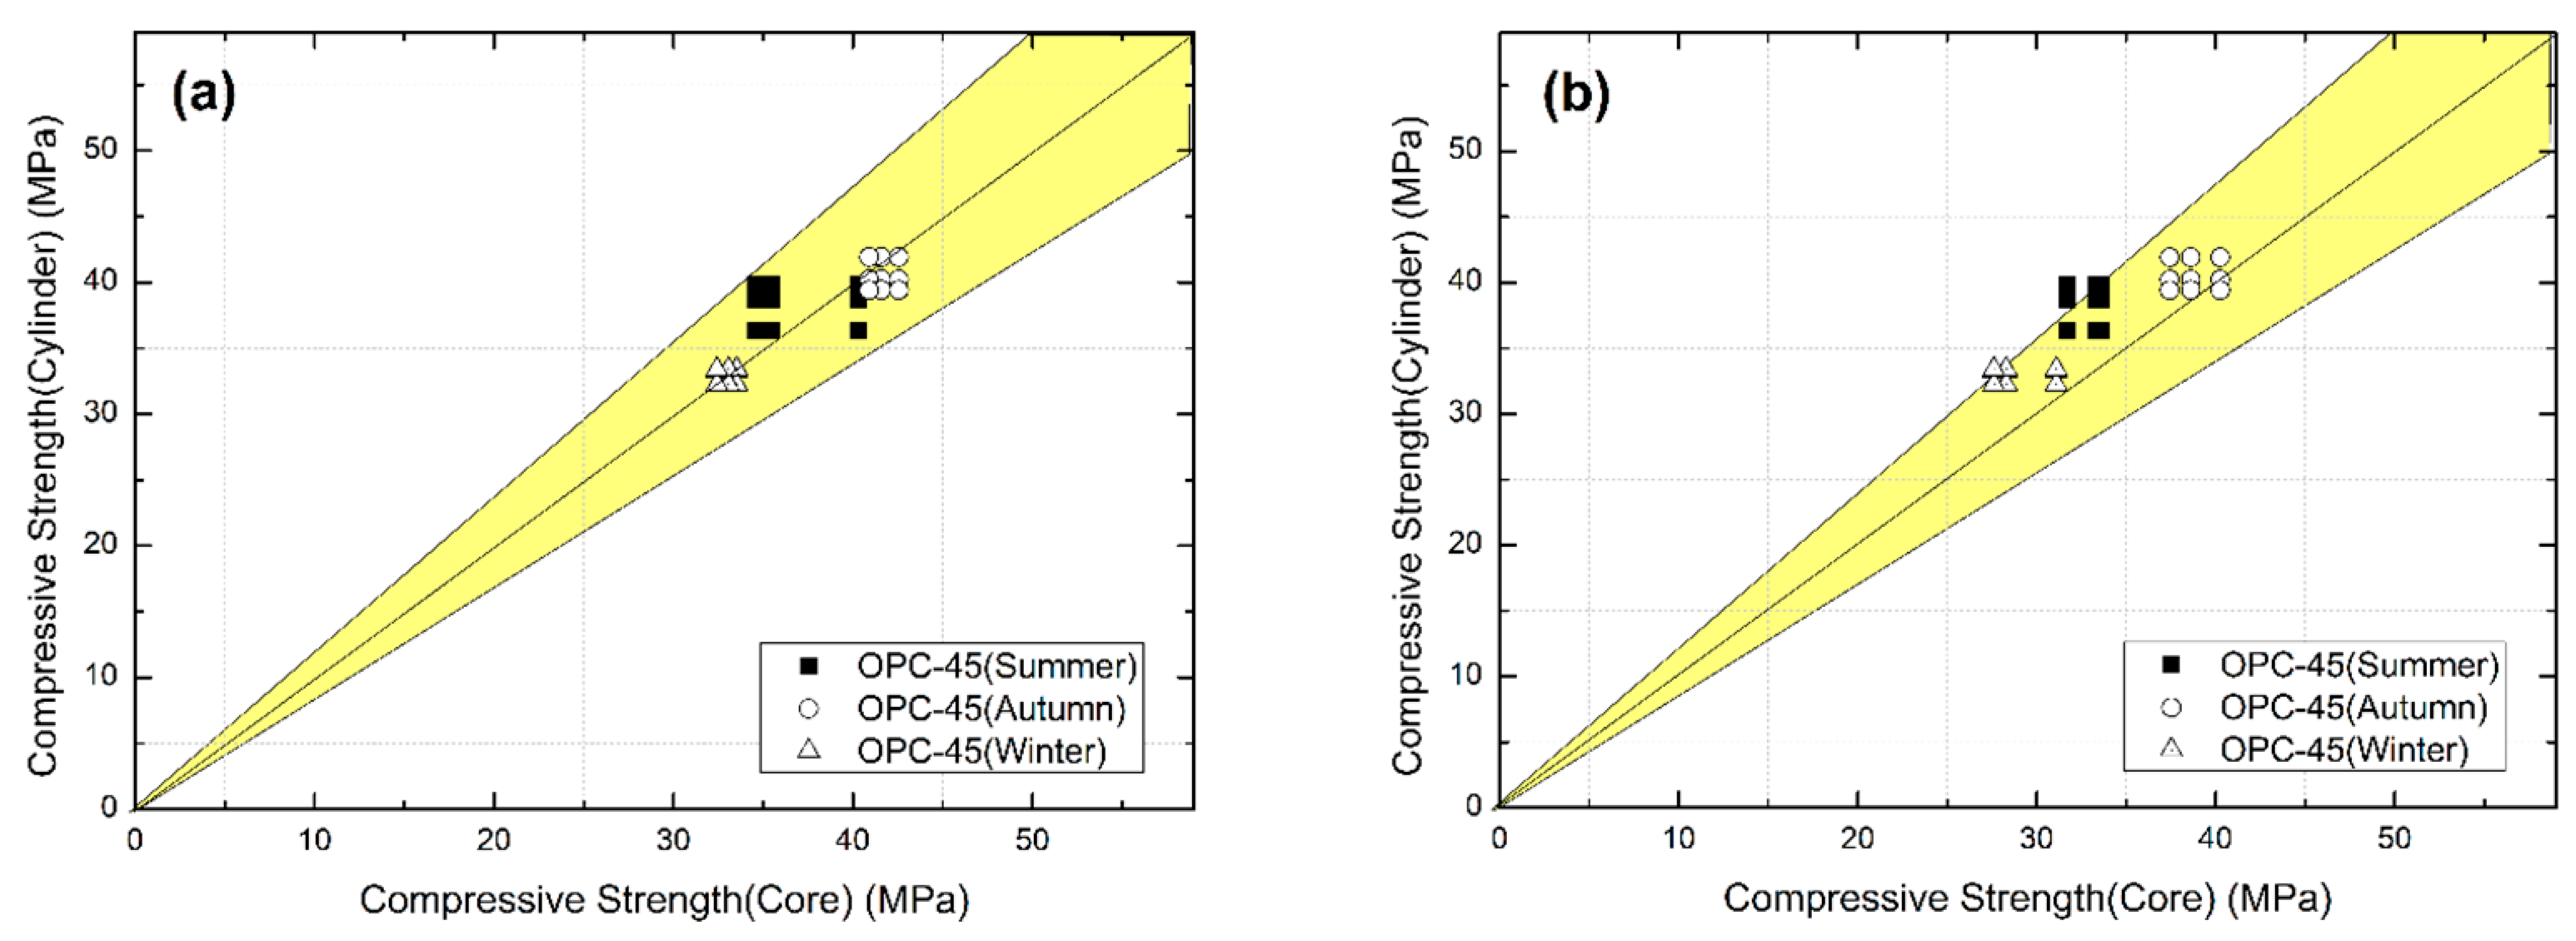
Figure 9 presents similar comparisons for the OPC-45 mix. In Figure 9a (center cores), under standard-season conditions, most center cores still had higher compressive strengths than the cylinders. During the summer season, the center core strengths were up to 4 MPa lower than those of the cylinders, suggesting potential thermal gradients or excessive early heat leading to microstructural imperfections. Under winter conditions, the strength difference between the cores and cylinders was minimal, less than 1 MPa, indicating nearly equivalent hydration performance between In Situ and standard curing. In Figure 9b, the outer-region cores consistently showed lower compressive strengths than the cylinders. Under standard-season conditions, the reduction was up to 4 MPa, while in the summer and winter, the maximum reductions increased to about 8 MPa and 6 MPa, respectively. This indicates that outer regions are more vulnerable to ambient temperature fluctuations, especially in mixes with intermediate W/C ratios.
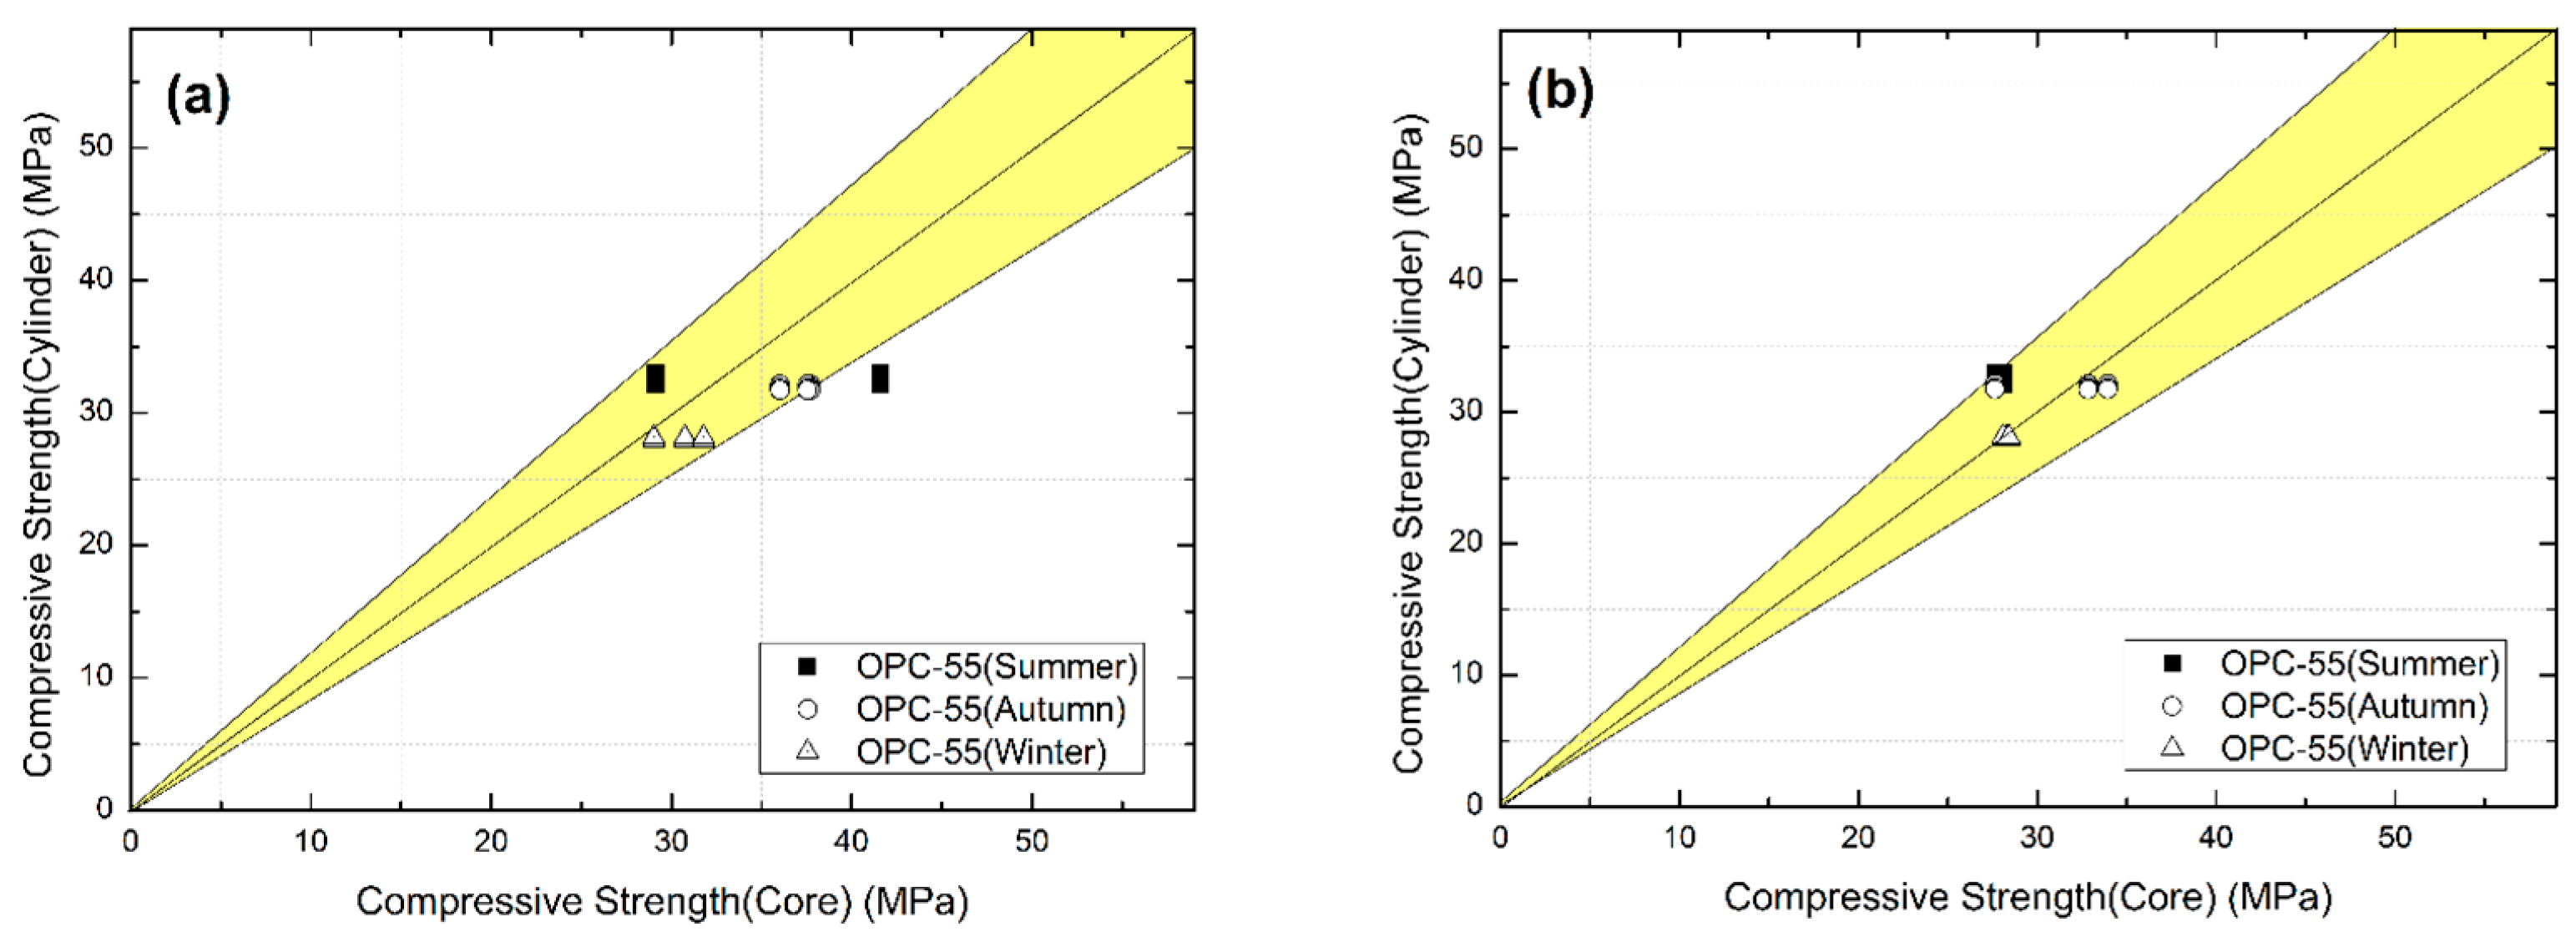
Figure 10 shows the compressive strength results for the OPC-55 mix. In Figure 10a, center cores tested under standard-season conditions exhibited compressive strengths up to 3 MPa higher than the cylinders, reflecting modest benefits of internal curing heat. During the summer season, some center cores recorded compressive strengths up to 3 MPa lower than the cylinders, likely due to accelerated early hydration compromising long-term strength. Interestingly, in winter, all center cores achieved higher compressive strengths than the cylinders, possibly because prolonged hydration at moderate core temperatures allowed further strength development over 91 days. Figure 10b shows the outer-region cores for OPC-55. Under standard-season conditions, some outer cores were about 3 MPa lower than the cylinders. In summer, reductions increased up to 6 MPa, while in winter, the difference between core and cylinder strengths was minimal (less than 1 MPa). These observations again emphasize the combined effects of seasonal temperature, curing location within the specimen, and mix proportion on the compressive strength distribution.
The compressive strength results reveal clear effects of curing temperature, mix proportion, and specimen location on concrete strength development. Therefore, under standard-season conditions, core specimens, especially from the center region, generally exhibited higher strengths than standard-cured cylinders, reflecting beneficial internal heat retention that promotes continued hydration. In contrast, summer curing led to reduced or only marginally higher core strengths due to excessive early heat, which can accelerate hydration but potentially compromise long-term strength [47,48,49,50,51]. Winter conditions resulted in overall lower strengths, particularly in outer-region cores, due to insufficient curing temperatures. These findings emphasize the significance of thermal gradients and ambient conditions in influencing actual In Situ strength compared to laboratory-cured specimens [51,52,53,54,55].
Interestingly, for the OPC-55 mix under winter conditions, the compressive strength of the center core specimens exceeded that of the standard-cured cylinders. This outcome may be attributed to the interaction between low ambient temperatures and the internal heat of hydration retained within the mass concrete. The slower rate of hydration likely reduced thermal microcracking and allowed for more continuous strength development over the 91-day period. Additionally, the relatively moderate temperature regime within the specimen core may have promoted a denser, more refined microstructure compared to the constant 20 °C curing environment of the standard cylinders. These observations suggest that under certain conditions, extended curing under stable thermal profiles can yield superior long-term strength performance, particularly for mixes with higher water-to-binder ratios.

3.3. 28S91 Value of Core Specimen vs. Cylinder Specimen

The compressive strength results discussed in the previous section highlight significant seasonal and spatial variations in the strength development of structural concrete compared to standard-cured cylinders. These differences emphasize the need for a quantitative correction factor that accounts for curing temperature effects and internal heat evolution, ensuring that the design strength used in structural calculations reflects the actual In Situ performance.
To address this need, the 28S91 value was introduced as a correction index. This parameter represents the ratio between the compressive strength of core specimens tested at 91 days (reflecting In Situ conditions) and the compressive strength of standard-cured cylinders tested at 28 days. By comparing the 28-day standard-cured cylinder strength with the 91-day core strength, the 28S91 value provides an empirical basis to adjust mix design strength, thereby accounting for curing temperature variations and positional differences within the structural member [38,39,56,57,58,59].
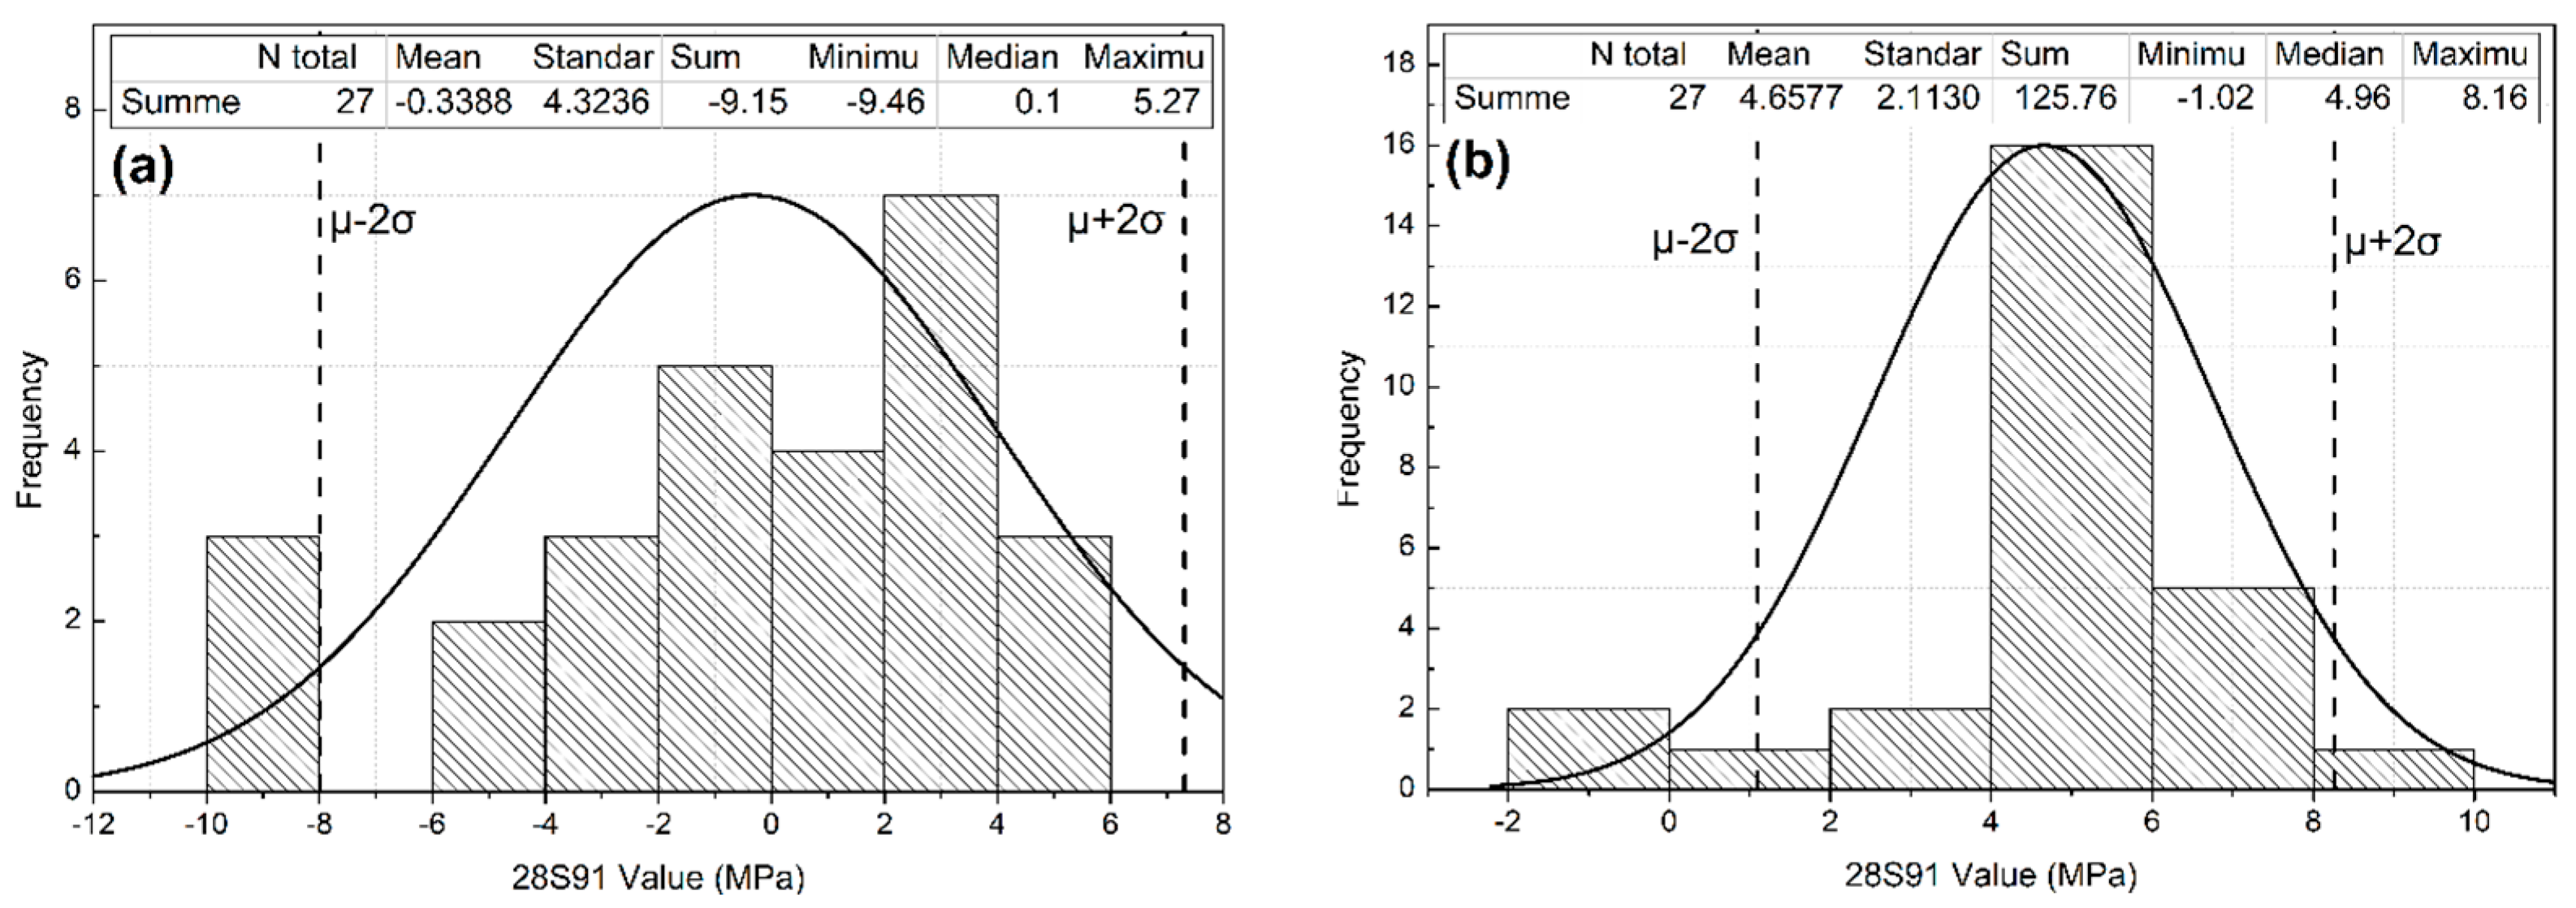
Table 6 presents the differences in compressive strength between structural core specimens and standard-cured cylinder specimens across seasonal conditions, together with results of normal distribution analysis. To quantitatively evaluate seasonal variations, the compressive strength differences between the core specimens, extracted from both the center and outer regions of the structural concrete, and the standard-cured cylinders were statistically analyzed. These differences were fitted to normal distributions, and as expressed in Equation (1), the range covering approximately 95% of the data was determined using μ ± 2σ, where μ is the mean and σ the standard deviation. To conservatively estimate potential underperformance of structural concrete relative to standard-cured cylinders, the upper bound μ + 2σ was used to establish correction factors [60,61,62,63,64,65,66,67].
Approximately 95% of total data = μ ± 2σ
where µ = Mean, σ = Standard deviation.
The upper bound, μ + 2σ, was selected as the correction value because it represents the point below which approximately 95% of the strength difference data lie in a normal distribution. This conservative approach ensures that even in cases where structural concrete exhibits lower compressive strength than standard-cured cylinders, the corrected design strength does not exceed the expected In Situ strength. Using the mean (μ) alone could underestimate the potential strength loss, while using the lower bound (μ − 2σ) would be overly conservative and may lead to uneconomical mix designs. Thus, μ + 2σ offers a rational balance between safety and practicality for design applications.
During the summer, center core specimens exhibited a slight positive mean difference of around 0.3 MPa, indicating marginally higher strength compared to cylinders, with a standard deviation of approximately 4.3 MPa. This led to a conservative correction value (μ + 2σ) of about 8.3 MPa. In contrast, outer cores had a negative mean difference of −4.6 MPa, suggesting cylinders were stronger by about 15%, yet the μ + 2σ correction still reached roughly 8.9 MPa.
For the autumn season, the center cores showed a mean difference of −6 MPa, reflecting about 13% lower strength than the cylinders, with σ ≈ 4.6 MPa, yielding a correction of around 3.2 MPa. The outer cores had a mean difference of 1.4 MPa, slightly exceeding the cylinder strength, and σ ≈ 4.4 MPa, giving a correction of ~7.4 MPa.
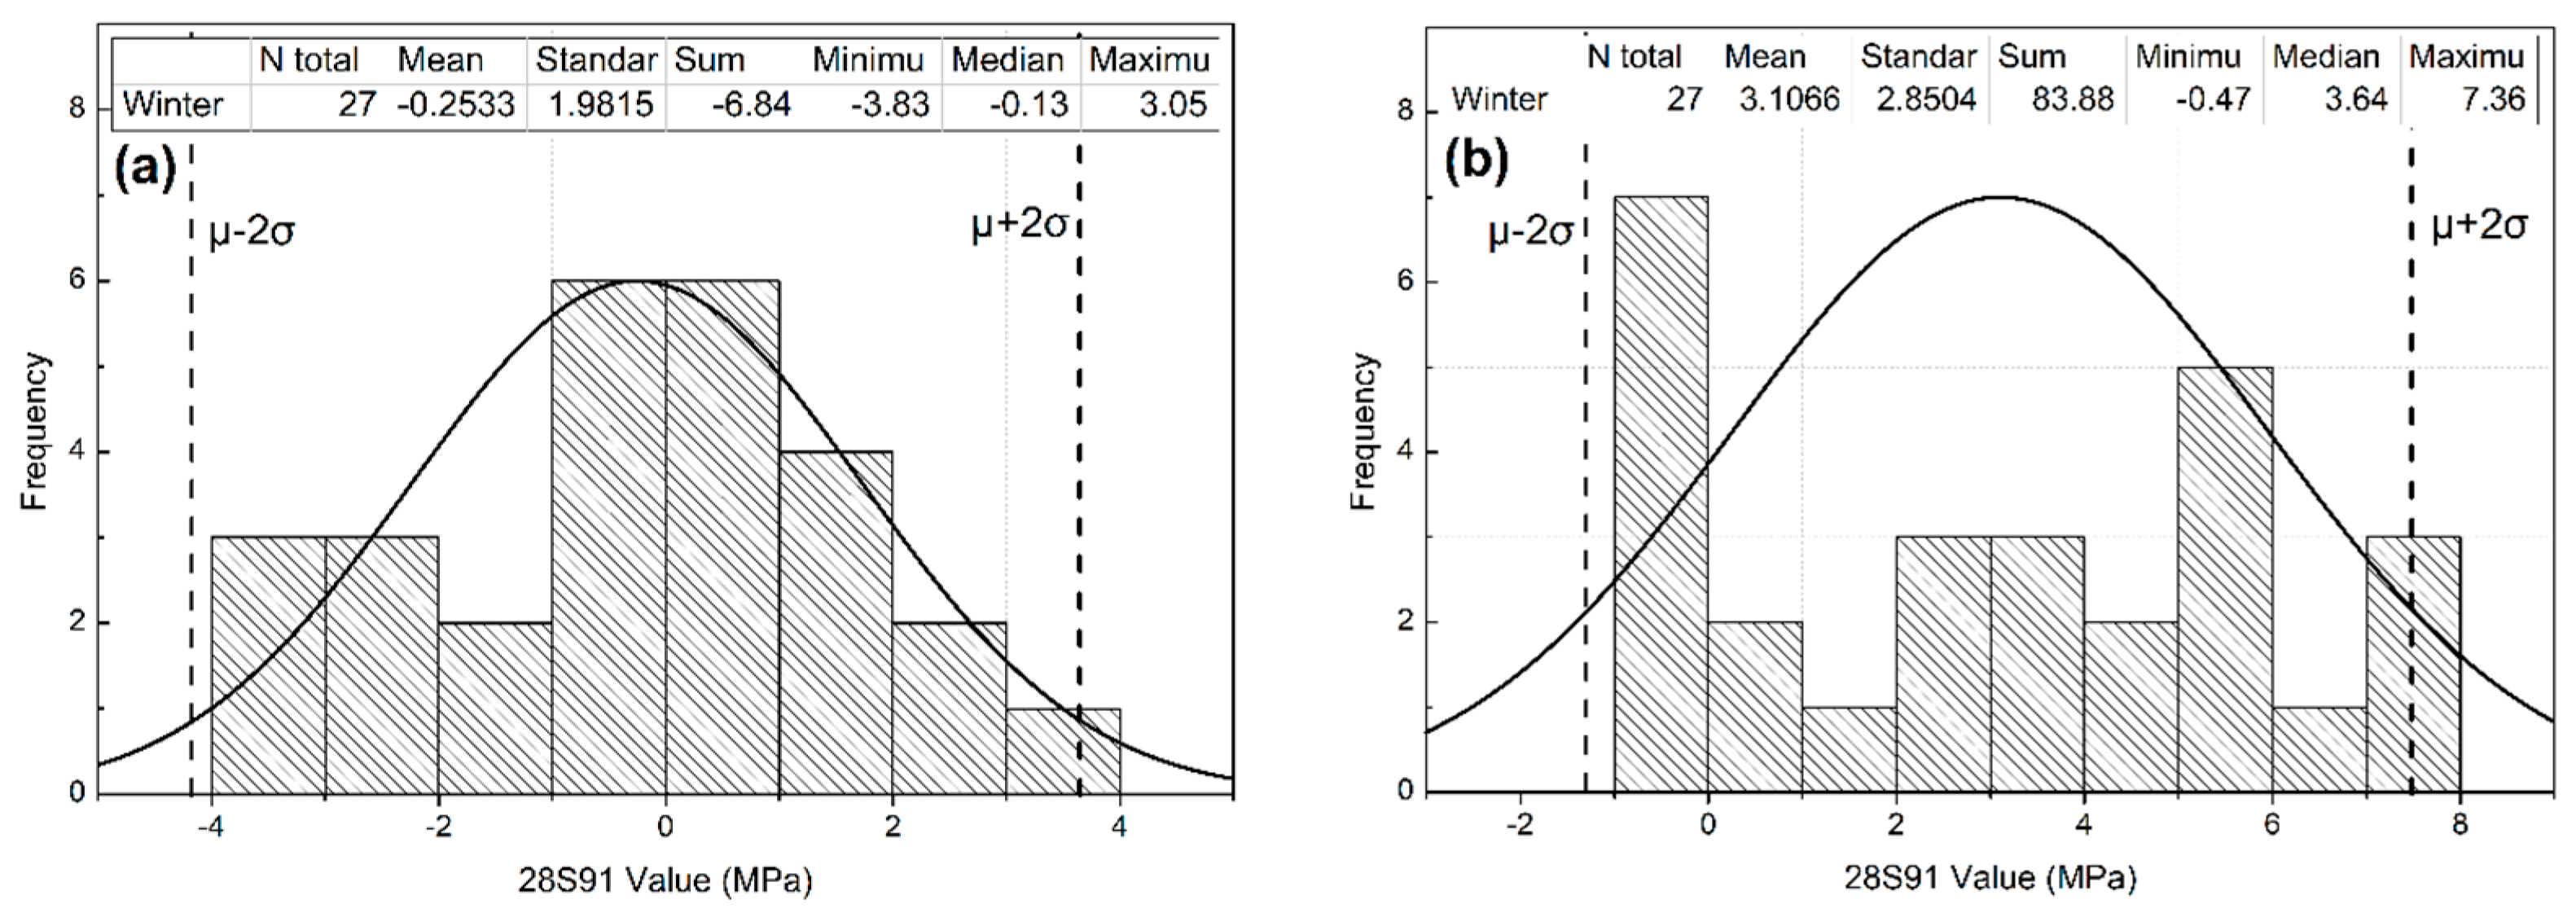
In winter, center cores displayed a near-zero mean difference (≈0.2 MPa), suggesting almost equal strength to cylinders, while the outer cores showed a negative mean of −3.1 MPa, indicating the cylinders were stronger. The corresponding μ + 2σ corrections were approximately 3 MPa and 8.8 MPa, respectively.
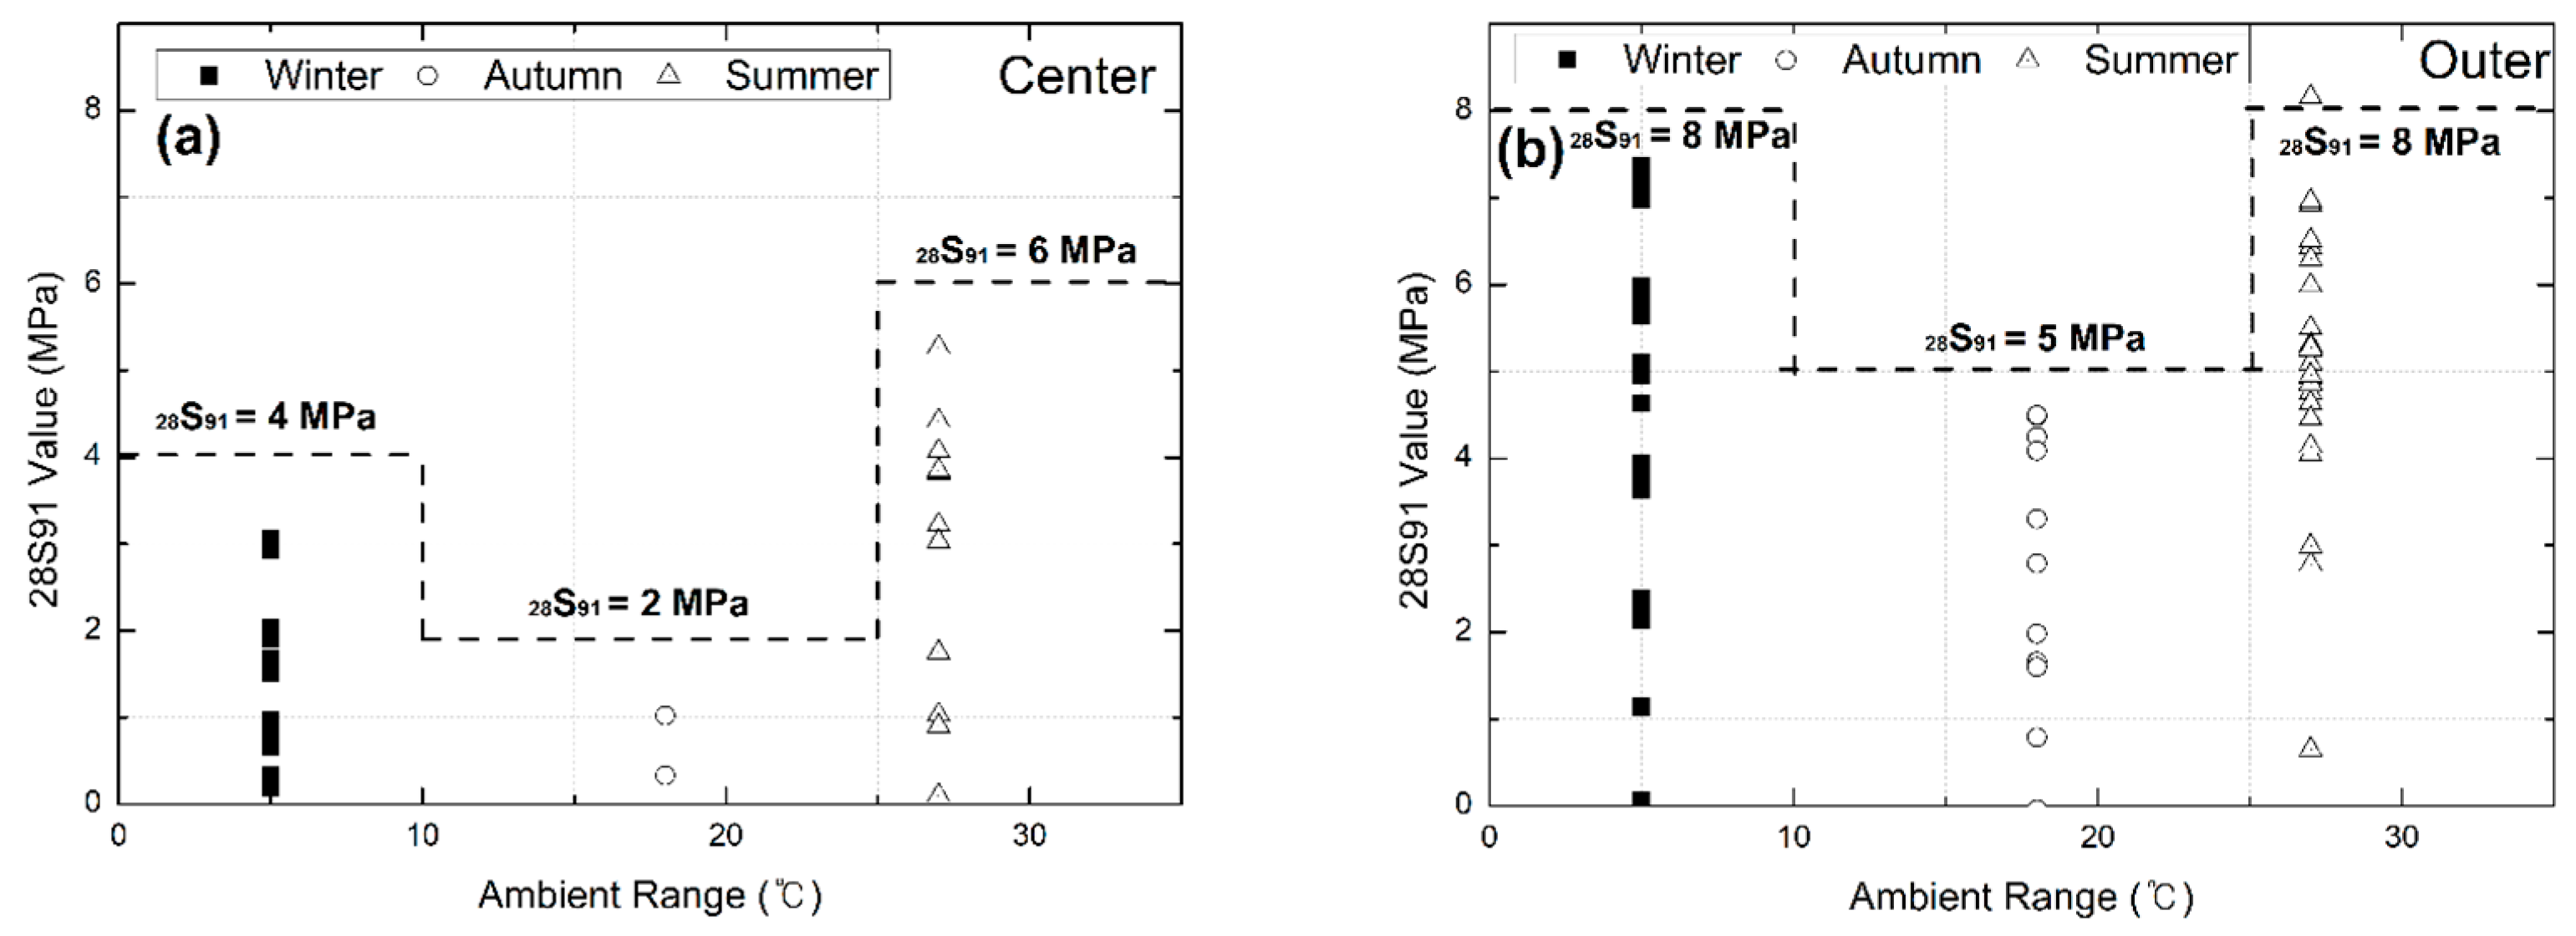
Figure 11, Figure 12 and Figure 13 graphically represent these normal distributions, emphasizing how seasonal temperature variations and core extraction location (Center Vs. Outer) affect strength outcomes. Further, Figure 14 and Figure 15 present temperature-specific correction values needed to adjust standard-cured cylinder strength to more accurately reflect In Situ concrete performance: ~4–8 MPa in extreme temperatures (winter and summer) and lower values of about 2–5 MPa in moderate (standard) conditions.
These results demonstrate that to conservatively and reliably estimate the In Situ strength of structural concrete from standard-cured cylinders, temperature- and location-dependent correction factors must be applied. For safety, it is recommended to use correction values based on the outer region, where lower strengths were more common: ≈8 MPa for winter and summer curing, and ≈5 MPa under standard curing conditions. This approach ensures that design strength accurately reflects the actual performance of large reinforced concrete members across seasons.
These analyses demonstrate the necessity of applying tailored correction factors based on both ambient curing conditions and sampling location to ensure the structural safety and performance reliability of reinforced concrete under diverse field environments [39,59,60,61,62,63,68,69].

4. Conclusions

This study evaluated the correction factors for the compressive strength of structural concrete by comparing core specimens extracted under different seasonal curing conditions with standard-cured cylinder specimens. To achieve this, measurements of the internal heat of hydration, temperature gradient analysis, and statistical assessments of compressive strength deviations were conducted to provide deeper insight into the influence of actual curing environments on the performance of reinforced concrete structures. Furthermore, by synthesizing existing standards such as ACI, KCS, and JASS, the study proposed correction factors in line with the JASS framework, adjusted according to ambient temperature conditions. The main findings can be summarized as follows:
(i) Internal heat monitoring revealed that peak temperatures varied substantially with season, reaching approximately 72.5 °C in summer (OPC-35) and only 39.5 °C in winter, confirming the strong influence of ambient conditions on hydration kinetics.
(ii) Center regions consistently exhibited higher peak temperatures than outer regions, reflecting significant thermal gradients that can lead to spatially non-uniform strength development within large members.
(iii) Under autumn (standard) curing conditions, core specimens—particularly from the center—generally exceeded the compressive strength of standard-cured cylinders, indicating beneficial heat retention and continued hydration.
(iv) In summer, accelerated early-age hydration produced comparable or slightly higher strengths in cores but also greater variability, suggesting a risk of microstructural coarsening at very high curing temperatures.
(v) In winter, lower ambient temperatures delayed hydration, resulting in reduced strengths, especially in the outer region. Interestingly, center cores of OPC-55 showed higher 91-day strength than cylinders, likely due to prolonged, moderated hydration and refined microstructure.
(vi) Normal distribution analysis of strength differences (28S91) quantified the deviation between field- and laboratory-cured concretes. The parameter μ + 2σ was adopted to capture 95% of observed data and provide a conservative upper-bound correction value.
(vii) The derived temperature- and location-specific correction factors suggest that approximately 8 MPa should be subtracted from standard-cured cylinder strength under summer and winter curing conditions, and 5 MPa under standard conditions, using outer-region cores as the reference.
(viii) Selecting outer-region cores ensures a conservative approach, as these consistently exhibit the lowest strengths due to greater heat dissipation. This provides a robust safety margin, preventing the overestimation of design strength and aligning with structural code principles.
(ix) The proposed correction factors improve the reliability of structural safety assessments and support mix design adjustments and construction planning under diverse climate conditions.

Author Contributions

Conceptualization, M.-G.J. and H.-S.L.; Data curation, M.-G.J.; Formal analysis, M.-G.J.; Methodology, M.-G.J.; Investigation, M.-G.J.; Writing—original draft, M.-G.J.; Supervision, H.-S.L.; Funding acquisition, H.-S.L.; Writing—review and editing, H.-S.L. All authors have read and agreed to the published version of the manuscript.

Funding

This research was funded by the Ministry of Science and ICT of Korea and the National Research Foundation (Project Number: NRF-2022R1A2C1093253).

Institutional Review Board Statement

Not applicable.

Informed Consent Statement

Not applicable.

Data Availability Statement

The original contributions presented in this study are included in the article. Further inquiries can be directed to the corresponding authors.

Acknowledgments

This research was conducted as part of the project supported by the Ministry of Science and ICT of Korea and the National Research Foundation (Project Number: NRF-2022R1A2C1093253). We express our gratitude for their support.

Conflicts of Interest

The authors declare no conflicts of interest.

References

  1. Atsbha, T.G.; Zhutovsky, S. The effect of external curing methods on the development of mechanical and durability-related properties of normal-strength concrete. Constr. Build. Mater. 2022, 324, 126706. [Google Scholar] [CrossRef]
  2. Cristofaro, M.T.; Nudo, R.; Tanganelli, M.; D’Ambrisi, A.; De Stefano, M.; Pucinotti, R. Issues concerning the assessment of concrete compressive strength in existing buildings: Application to a case study. Struct. Concr. 2018, 19, 795–805. [Google Scholar] [CrossRef]
  3. Hasuo, K.; Matsuda, T. 1123 The effect of core sampling on concrete strength test results (Testing and Inspection (1), Materials and Construction, 2012 Annual Conference (Tokai), Academic Lecture and Architectural Design Presentation). Mater. Constr. 2012, 245–246. [Google Scholar]
  4. Bartlett, F.M.; MacGregor, J.G. Statistical analysis of the compressive strength of concrete in structures. Mater. J. 1996, 93, 158–168. [Google Scholar]
  5. Price, W.F.; Hynes, J.P. In-situ strength testing of high strength concrete. Mag. Concr. Res. 1996, 48, 189–197. [Google Scholar] [CrossRef]
  6. Gavilan, S.; Da, S.; Filho, L.C.P. Variations of in situ concrete strength by European Standard and American Code. Struct. Concr. 2018, 19, 1185–1194. [Google Scholar] [CrossRef]
  7. Haavisto, J.; Husso, A.; Laaksonen, A. Compressive strength of core specimens drilled from concrete test cylinders. Struct. Concr. 2021, 22, E683–E695. [Google Scholar] [CrossRef]
  8. Che, Y.; Ban, S.L.; Cui, J.Y.; Chen, G.; Song, Y.P. Effect of specimen shape and size on compressive strength of concrete. Adv. Mater. Res. 2011, 163, 1375–1379. [Google Scholar] [CrossRef]
  9. Malhotra, H.L. The effect of temperature on the compressive strength of concrete. Mag. Concr. Res. 1956, 8, 85–94. [Google Scholar] [CrossRef]
  10. Canpolat, F.; Naik, T.R. Effect of curing conditions on strength and durability of high-performance concrete. Sci. Iran. 2017, 24, 576–583. [Google Scholar] [CrossRef]
  11. Roller, J.J.; Russell, H.G.; Bruce, R.N.; Hassett, B. Effect of curing temperatures on high strength concrete bridge girders. PCI J. 2003, 48, 72–79. [Google Scholar] [CrossRef]
  12. Kadri, E.H.; Duval, R.; Aggoun, S.; Kenal, S. Silica Fume Effect on Hydration Heat and Compressive Strength of High-Performance Concrete. ACI Mater. J. 2009, 106, 107. [Google Scholar] [CrossRef]
  13. Kim, T.; Rens, K.L. Concrete maturity method using variable temperature curing for normal-strength concrete mixes. II: Theoretical study. J. Mater. Civ. Eng. 2008, 20, 735–741. [Google Scholar] [CrossRef]
  14. Kim, J.K.; Moon, Y.H.; Eo, S.H. Compressive strength development of concrete with different curing time and temperature. Cem. Concr. Res. 1998, 28, 1761–1773. [Google Scholar] [CrossRef]
  15. Klieger, P. Effect of mixing and curing temperature on concrete strength. J. Proc. 1958, 54, 1063–1081. [Google Scholar]
  16. Schindler, A.K. Concrete Hydration, Temperature Development, and Setting at Early-Ages; The University of Texas at Austin: Austin, TX, USA, 2002. [Google Scholar]
  17. Schindler, A.K.; Folliard, K.J. Heat of hydration models for cementitious materials. ACI Mater. J. 2005, 102, 24. [Google Scholar] [CrossRef] [PubMed]
  18. Wang, X.Y.; Lee, H.S. Heat of hydration models of cementitious materials. Adv. Cem. Res. 2012, 24, 77–90. [Google Scholar] [CrossRef]
  19. Escalante-Garcia, J.I.; Sharp, J.H. The effect of temperature on the early hydration of Portland cement and blended cements. Adv. Cem. Res. 2000, 12, 121–130. [Google Scholar] [CrossRef]
  20. Schindler, A.K. Effect of temperature on hydration of cementitious materials. Mater. J. 2004, 101, 72–81. [Google Scholar]
  21. Goto, S. Hydration of hydraulic materials–a discussion on heat liberation and strength development. Adv. Cem. Res. 2009, 21, 113–117. [Google Scholar] [CrossRef]
  22. Matsuda, T.; Kawakami, H.; Koide, T.; Noguchi, T. Development of Mechanical Properties of Ultra-High-Strength Concrete Subjected to Early Heat Curing. J. Adv. Concr. Technol. 2009, 7, 183–193. [Google Scholar] [CrossRef]
  23. Bentz, D.P.; Stutzman, P.E. Curing, hydration, and microstructure of cement paste. ACI Mater. J. 2006, 103, 348. [Google Scholar] [CrossRef]
  24. Khatib, J.M. Low temperature curing of metakaolin concrete. J. Mater. Civ. Eng. 2009, 21, 362–367. [Google Scholar] [CrossRef]
  25. Lopes, A.; Lopes, S.; Pinto, I. Influence of curing temperature on the strength of a metakaolin-based geopolymer. Materials 2023, 16, 7460. [Google Scholar] [CrossRef] [PubMed]
  26. Hossain, K.M.A. Influence of extreme curing conditions on compressive strength and pulse velocity of lightweight pumice concrete. Comput. Concr. 2014, 6, 437–450. [Google Scholar] [CrossRef]
  27. Oh, B.H.; Cha, S.W. Nonlinear analysis of temperature and moisture distributions in early-age concrete structures based on degree of hydration. Mater. J. 2003, 100, 361–370. [Google Scholar]
  28. Rastrup, E. Heat of hydration in concrete. Mag. Concr. Res. 1954, 6, 79–92. [Google Scholar] [CrossRef]
  29. Branco, F.A.; Mendes, P.; Mirambell, E. Heat of hydration effects in concrete structures. Mater. J. 1992, 89, 139–145. [Google Scholar]
  30. Pane, I.; Hansen, W. Concrete hydration and mechanical properties under nonisothermal conditions. Mater. J. 2002, 99, 534–542. [Google Scholar]
  31. ACI Committee, 3. 301-16 Specifications for Structural Concrete. 2016. Available online: https://www.concrete.org/Portals/0/Files/PDF/Previews/301_16_preview.pdf (accessed on 2 September 2025).
  32. Korea Concrete Institute. KCS 14 20 10 Normal Concrete. 2024. Available online: https://www.kcsc.re.kr/standardCode/viewer/KCS%2014%2020%2010:2024-12-30 (accessed on 2 September 2025).
  33. Architectural Institute of Japan. JASS 5 Standard Specifications for Building Construction and Commentary. In Reinforced Concrete Construction; Architectural Institute of Japan: Tokyo, Japan, 2005; Available online: https://item.rakuten.co.jp/guruguru2/9784818915558/?scid=af_pc_etc&sc2id=af_113_1_10002790&icm_tgid=1&icm_agid=60810&icm_mt=guruguru2%3A13423489%3A9784818915558&icm_acid=1372271&icm_kw=359158&icm_cid=30609 (accessed on 2 September 2025).
  34. Sedaghatdoost, A. Cold Weather Concrete: Current Practices and Innovative Mix Designs and Protection Methods. 2023. Available online: https://mspace.lib.umanitoba.ca/server/api/core/bitstreams/635f9f55-70c5-47c5-8c1a-d0ed3422ae09/content (accessed on 2 September 2025).
  35. Krylov, B.A. Cold Weather Concreting; CRC Press: Boca Raton, FL, USA, 2020. [Google Scholar]
  36. Kay, E.A. Hot and cold weather concreting. In Advanced Concrete Technology, Concrete Properties; Newman, J., Choo, B.S., Eds.; Elsevier: Amsterdam, The Netherlands, 2003. [Google Scholar]
  37. ACI Committee, 3. 306R-16 Guide to cold Weather Concreting. 2016. Available online: https://www.studocu.com/en-us/document/louisiana-state-university-at-eunice/consruction-material-and-methods/aci-306r-16-guide-to-cold-weather-concreting/96557663 (accessed on 2 September 2025).
  38. Fukudome, K.; Saito, J. Curing planning method based on cement hydration analysis. J. Concr. Eng. 2021, 32, 35–47. [Google Scholar] [CrossRef]
  39. Masuda, Y.; Abe, M. Architectural Institute of Japan, Revised JASS 5-2009. Concr. Eng. 2009, 47, 63–610. [Google Scholar]
  40. KS F 2403; Standard Test Method for Making Concrete Specimens. Korea Standard Institute: Daejeon, Republic of Korea, 2019.
  41. Wang, X.Y. Modeling of hydration, compressive strength, and carbonation of portland-limestone cement (PLC) concrete. Materials 2017, 10, 115. [Google Scholar] [CrossRef]
  42. Park, K.B.; Jee, N.Y.; Yoon, I.S.; Lee, H.S. Prediction of temperature distribution in high-strength concrete using hydration model. ACI Mater. J. 2008, 105, 180. [Google Scholar] [CrossRef]
  43. Ng, I.Y.T.; Ng, P.L.; Kwan, A.K.H. Effect of Cement and Water Contents on Adiabatic Temperature Rise of Concrete. ACI Mater. J. 2009, 106, 42. [Google Scholar] [CrossRef] [PubMed]
  44. Mitarai, Y.; Ohike, T.; Moriya, M.; Ogata, T.; Koyama, T. Long-term Study on Properties of High-strength Mass Concrete in PCCV (Prestressed Concrete Containment Vessel) (Monitoring Test Results and Durability of Concrete over 22 Years). 2007. Available online: https://repository.lib.ncsu.edu/server/api/core/bitstreams/acfa84c0-a88d-4d8d-be34-08e88618c71b/content (accessed on 2 September 2025).
  45. Awasthy, N.; Schlangen, E.; Hordijk, D.; Šavija, B.; Luković, M. The role of eigen-stresses on apparent strength and stiffness of normal, high strength, and ultra-high performance fibre reinforced concrete. Dev. Built Environ. 2023, 16, 100277. [Google Scholar] [CrossRef]
  46. Szypula, A.; Grossman, J.S. Cylinder vs. core strength. Concr. Int. 1990, 12, 55–61. [Google Scholar]
  47. Akca, A.H.; Özyurt, N. Effects of re-curing on residual mechanical properties of concrete after high temperature exposure. Constr. Build. Mater. 2018, 159, 540–552. [Google Scholar] [CrossRef]
  48. Shahraki, M.; Hua, N.; Elhami-Khorasani, N.; Tessari, A.; Garlock, M. Residual compressive strength of concrete after exposure to high temperatures: A review and probabilistic models. Fire Saf. J. 2023, 135, 103698. [Google Scholar] [CrossRef]
  49. Rawan, R.; Hassan, G.; Jamal, K.; Adel, E. Effect of hot weather concreting on the mechanical and durability properties of concrete—A review. BAU J.-Sci. Technol. 2022, 4, 4. [Google Scholar]
  50. Ishee, C.; Surana, S. Hot weather concreting. In Developments in the Formulation and Reinforcement of Concrete; Woodhead Publishing: Sutton, UK, 2019; pp. 131–150. [Google Scholar]
  51. Shumuye, E.D.; Zhao, J.; Wang, Z. Effect of the curing condition and high-temperature exposure on ground-granulated blast-furnace slag cement concrete. Int. J. Concr. Struct. Mater. 2021, 15, 15. [Google Scholar] [CrossRef]
  52. Kovler, K.; Schamban, I.; Igarashi, S.I.; Bentur, A. Influence of mixture proportions and curing conditions on compressive strength of high-performance concrete. Mater. J. 2000, 97, 21–26. [Google Scholar]
  53. Lee, J.; Lee, T. Influences of chemical composition and fineness on the development of concrete strength by curing conditions. Materials 2019, 12, 4061. [Google Scholar] [CrossRef]
  54. Liu, Y.; Zhang, J.; Chang, J.; Xie, S.; Zhao, Y. Effect of the Thermal Insulation Cover Curing on Temperature Rise and Early-Age Strength of Concrete. Materials 2022, 15, 2781. [Google Scholar] [CrossRef]
  55. Lee, G.C.; Han, M.C.; Baek, D.H.; Koh, K.T. Effect of heat curing methods on the temperature history and strength development of slab concrete for nuclear power plant structures in cold climates. Nucl. Eng. Technol. 2012, 44, 523–534. [Google Scholar] [CrossRef]
  56. Bartlett, F.M.P. Assessment of Concrete Strength in Existing Structures; National Library of Canada: Ottawa, ON, Canada, 1994. [Google Scholar]
  57. Otsuka, S.; Nakata, Y.; Oki, S. Effects of sampling depth for distribution of compressive strength and strength development of core specimens in full-scale model of high-strength concrete column using various cements. J. Archit. Build. Sci. 2011, 76, 8. [Google Scholar] [CrossRef]
  58. Hasuo, K.; Matsu, T. Report: Effect of core sampling on the results of concrete strength tests. Proc. Jpn. Concr. Inst. 2013, 35, 6. [Google Scholar]
  59. Ishiyoshi, Y. Report: Experimental study on concrete mix design using large amounts of fly ash. Proc. Jpn. Concr. Inst. 2015, 37, 6. [Google Scholar]
  60. Zhai, Y. Experimental study on the size effect on the probability distribution of concrete compressive strength. Adv. Civ. Eng. 2022, 2022, 7568279. [Google Scholar] [CrossRef]
  61. Yue, Q.; Wang, W.; Zhang, X. Probabilistic analysis and time variation model of concrete compressive strength in existing buildings. ASCE-ASME J. Risk Uncertain. Eng. Syst. Part A Civ. Eng. 2023, 9, 04023026. [Google Scholar] [CrossRef]
  62. Shimizu, Y.; Hirosawa, M.; Zhou, J. Statistical analysis of concrete strength in existing reinforced concrete buildings in Japan. In Proceedings of the 12th World Conference on Earthquake Engineering, Auckland, New Zealand, 30 January–4 February 2000. [Google Scholar]
  63. Aichouni, M.; Messaoudene, N.A.; Touahmia, M.; Al-Ghonamy, A. Statistical analysis of concrete strength variability for quality assessment: Case study of a Saudi construction project. Int. J. Adv. Appl. Sci. 2017, 4, 101–109. [Google Scholar] [CrossRef]
  64. Vu, C.C.; Ho, N.K. A comparative study on the probability distribution model for the compressive strength of concrete with consideration of the size effect. J. Eng. Res. 2025, 13, 1403–1413. [Google Scholar] [CrossRef]
  65. Shen, Z.; Deifalla, A.F.; Kamiński, P.; Dyczko, A. Compressive strength evaluation of ultra-high-strength concrete by machine learning. Materials 2022, 15, 3523. [Google Scholar] [CrossRef]
  66. Rai, B.; Singh, N.K. Statistical and experimental study to evaluate the variability and reliability of impact strength of steel-polypropylene hybrid fiber reinforced concrete. J. Build. Eng. 2021, 44, 102937. [Google Scholar] [CrossRef]
  67. Silvestri, S.; Gasparini, G.; Trombetti, T.; Ceccoli, C. Statistical analysis towards the identification of accurate probability distribution models for the compressive strength of concrete. In Proceedings of the 14th World Conference on Earthquake Engineering, Beijing, China, 12–17 October 2008. [Google Scholar]
  68. Momeni, K.; Madandoust, R.; Ranjbar, M.M. Evaluating the application of reinforcement correction factor for concrete core testing. J. Rehabil. Civ. Eng. 2019, 7, 166–182. [Google Scholar]
  69. Qasrawi, H. Effect of the position of core on the strength of concrete of columns in existing structures. J. Build. Eng. 2019, 25, 100812. [Google Scholar] [CrossRef]
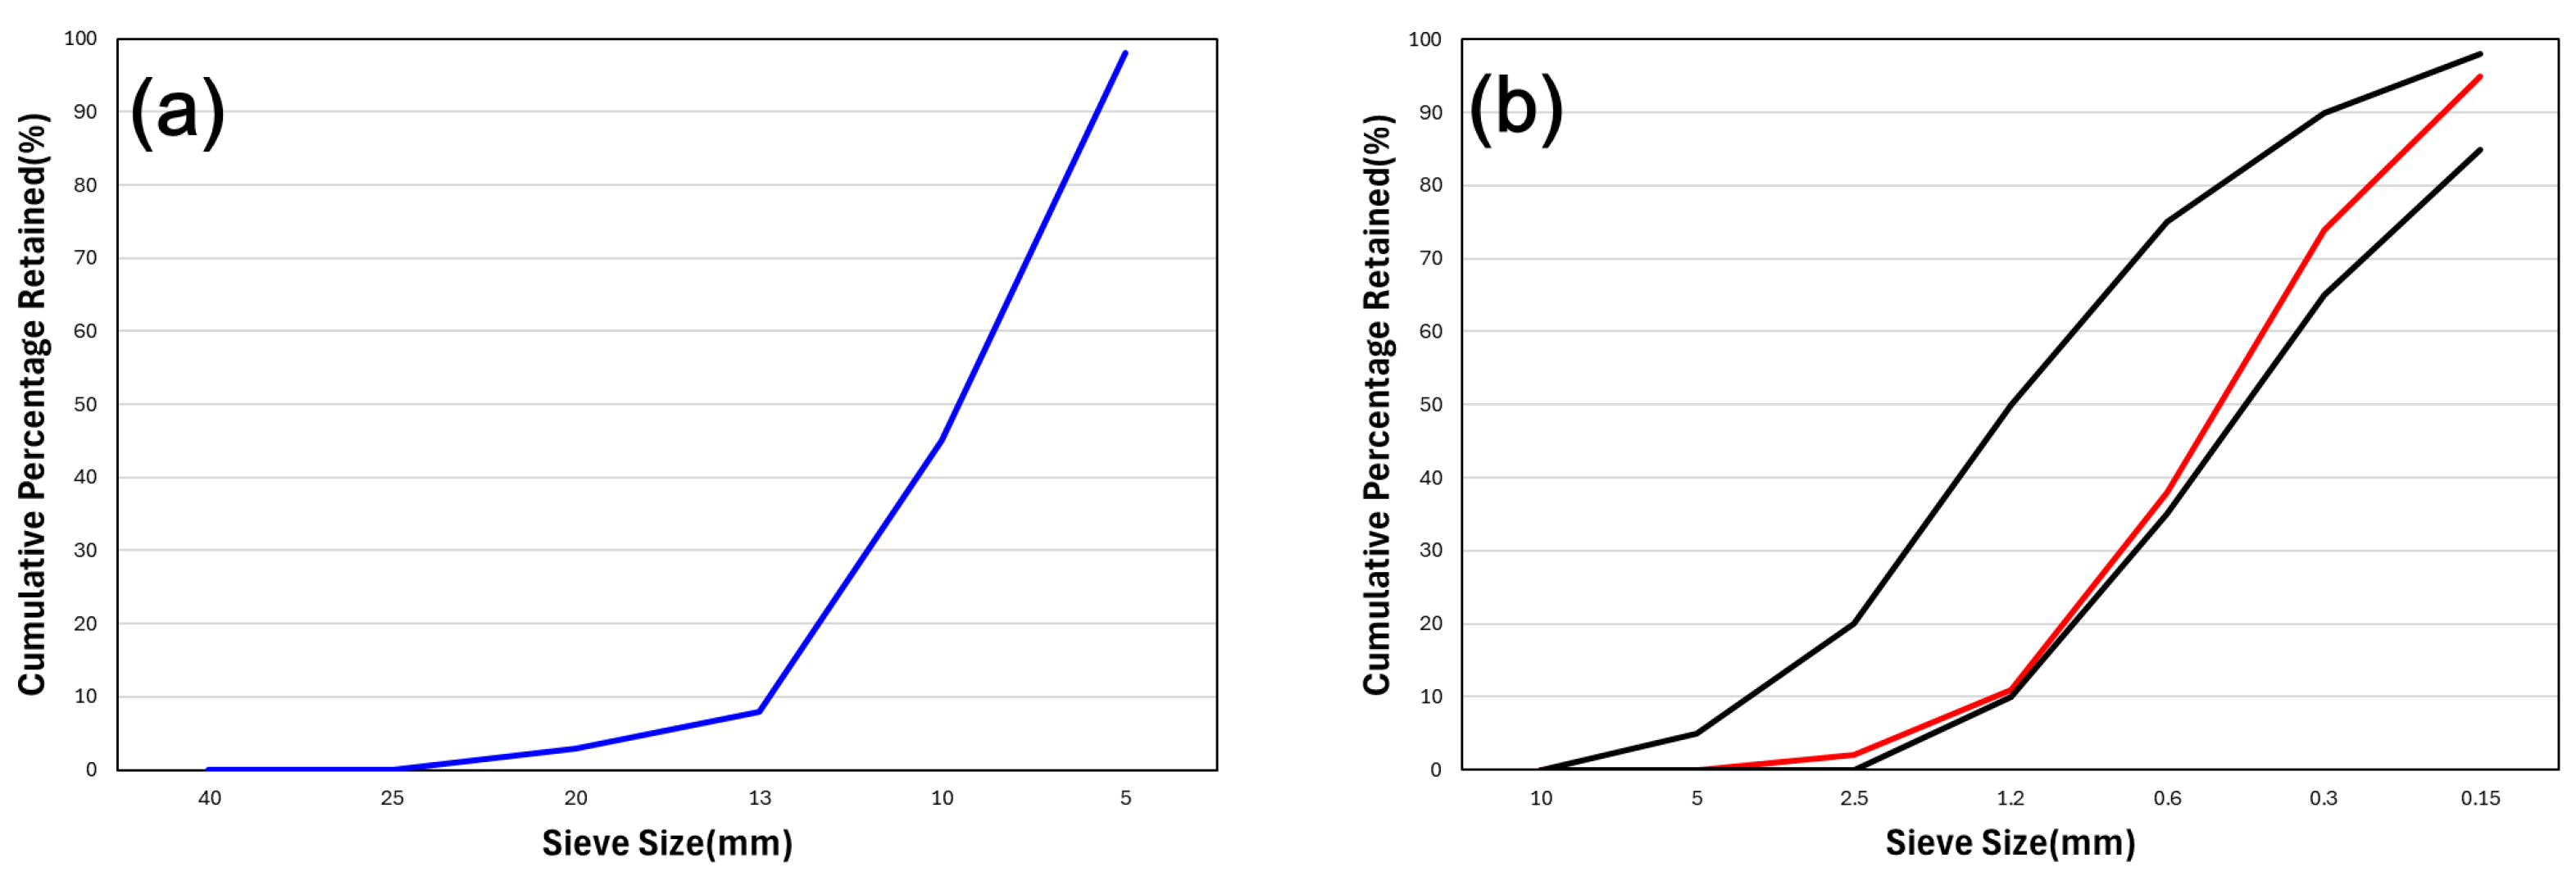
Figure 1. Results of the (a) coarse aggregate sieve test and (b) Fine aggregate sieve test. All aggregates were thoroughly washed and air-dried to remove dust and impurities before mixing. Potable tap water, meeting the requirements of KS L 5206, was used throughout as the mixing water to ensure consistent hydration and concrete quality.
Buildings 15 03642 g001
Figure 2. (a) Recorded ambient temperature variations during curing, (b) temperatures in different seasons.
Buildings 15 03642 g002
Figure 3. Schematic diagram of the structural concrete casting and curing process.
Buildings 15 03642 g003
Figure 4. (ac) Procedure for extracting and preparing core samples from the structural concrete specimen.
Buildings 15 03642 g004
Figure 5. Measured heat of hydration of structural concrete specimens placed under winter conditions. Temperature evolution at the (a) center and (b) outer regions of the specimen.
Buildings 15 03642 g005
Figure 6. Measured heat of hydration of structural concrete specimens placed under standard-season (autumn) conditions. Temperature evolution at the (a) center and (b) outer regions of the specimen.
Buildings 15 03642 g006
Figure 7. Measured heat of hydration of structural concrete specimens placed under summer conditions. Temperature evolution at the (a) center and (b) outer regions of the specimen.
Buildings 15 03642 g007
Figure 8. Comparison of compressive strengths between standard-cured cylinders and (a) center-region core specimens, and (b) outer-region core specimens of OPC-35 concrete across summer, autumn, and winter conditions.
Buildings 15 03642 g008
Figure 9. Comparison of compressive strengths between standard-cured cylinders and (a) center-region core specimens, and (b) outer-region core specimens of OPC-45 concrete across summer, autumn, and winter conditions.
Buildings 15 03642 g009
Figure 10. Comparison of compressive strengths between standard-cured cylinders and (a) center-region core specimens, and (b) outer-region core specimens of OPC-55 concrete across summer, autumn, and winter conditions.
Buildings 15 03642 g010
Figure 11. Normal distribution of compressive strength differences (28S91 values) between standard-cured cylinders and structural core specimens under summer conditions: (a) center-region cores, (b) outer-region cores.
Buildings 15 03642 g011
Figure 12. Normal distribution of compressive strength differences (28S91 values) under autumn (standard) curing conditions: (a) center-region cores, (b) outer-region cores.
Buildings 15 03642 g012
Figure 13. Normal distribution of compressive strength differences (28S91 values) under winter conditions: (a) center-region cores, (b) outer-region cores.
Buildings 15 03642 g013
Figure 14. Average 28S91 correction strength values by ambient temperature range, based on cases where structural cores exhibited lower strength than standard-cured cylinders.
Buildings 15 03642 g014
Figure 15. Estimated 28S91 correction strength values for (a) center-region core specimens and (b) outer-region core specimens by ambient temperature range.
Buildings 15 03642 g015
Table 1. Mixture design formulas for the United States of America, Republic of Korea, and Japan.
CountryMixture Design FormulaReferences
United States of America
f c n 35   MPa
(1) 
f c r = f c n + 1.34 s
(2) 
f c r = ( f c n 3.5 ) + 2.33 s
f c n > 35   MPa
(1) 
f c r = f c n + 1.34 s
(2) 
f c r = 0.9 f c n + 2.33 s
ACI 301 [31]
Republic of KoreaKCS 14 20 10 [32]
Japan f m = f q + mSn (MPa)JASS 5 [33]
Where fcn, fq = Specified Compressive Strength of Concrete (MPa). fcr, fm = Mix Design Strength of Concrete (MPa). s = Strength Margin Based on Standard Deviation. mSn = Strength Correction Between Standard-Cured Cylinder Strength at Day m and In-Place Concrete Strength at Day n (MPa).
Table 2. Ordinary Portland Cement XRF Test Results.
ComponentContent (%)
Na2O0.2
MgO1.5
Al2O34.8
SiO218.6
SO33.5
K2O1.3
CaO65.4
Fe2O33.9
Others0.9
Table 3. Physical properties of aggregates.
TypeMax Size (mm)Density (g/cm3)Absorption (%)F.M.
FineUnder 32.591.502.47
Coarse252.622.027.27
Table 4. Concrete mix proportions.
Curing SeasonSpecimen IDCement (Kg/m3)Water (Kg/m3)W/B (%)Sand (Kg/m3)Gravel (Kg/m3)S/a (%)
Autumn
(Standard)
OPC 353601263596493351
OPC 4536016245916887
OPC 55330181.555903874
SummerOPC 3536012635964933
OPC 4536016245916887
OPC 55330181.555903874
WinterOPC 3538013335946916
OPC 4538017145896868
OPC 55360181.555903874
Table 5. Average compressive strengths of standard-cured cylinder specimens (28 days) and structural core specimens (91 days) by mix proportion and seasonal curing condition.
W/B of Specimen28—Day Mold Cylinder Strength (MPa)91—Day In Situ Core Specimen Strength (MPa)
SummerAutumnWinterSummerAutumnWinter
0.3537.742.438.236.951.634.5
0.4538.340.533.034.940.231.0
0.5532.732.028.130.734.329.4
Table 6. Summary of mSn correction strength and compressive strength differences for structural concrete across seasonal conditions.
TypeSummer SeasonAutumn SeasonWinter Season
Compressive Strength difference−9.5~8.2 MPa−13.4~4.5 MPa−3.8~7.4 MPa
Normal distribution of Center 28S91 Value (μ + 2σ)0~8 MPa0~3 MPa0~3 MPa
Normal distribution of Outer 28S91 Value (μ + 2σ)0~8 MPa0~7 MPa0~8 MPa
Disclaimer/Publisher’s Note: The statements, opinions and data contained in all publications are solely those of the individual author(s) and contributor(s) and not of MDPI and/or the editor(s). MDPI and/or the editor(s) disclaim responsibility for any injury to people or property resulting from any ideas, methods, instructions or products referred to in the content.