
Experimental Study on the Seismic Performance of Buckling-Restrained Braces with Different Lengths


Abstract
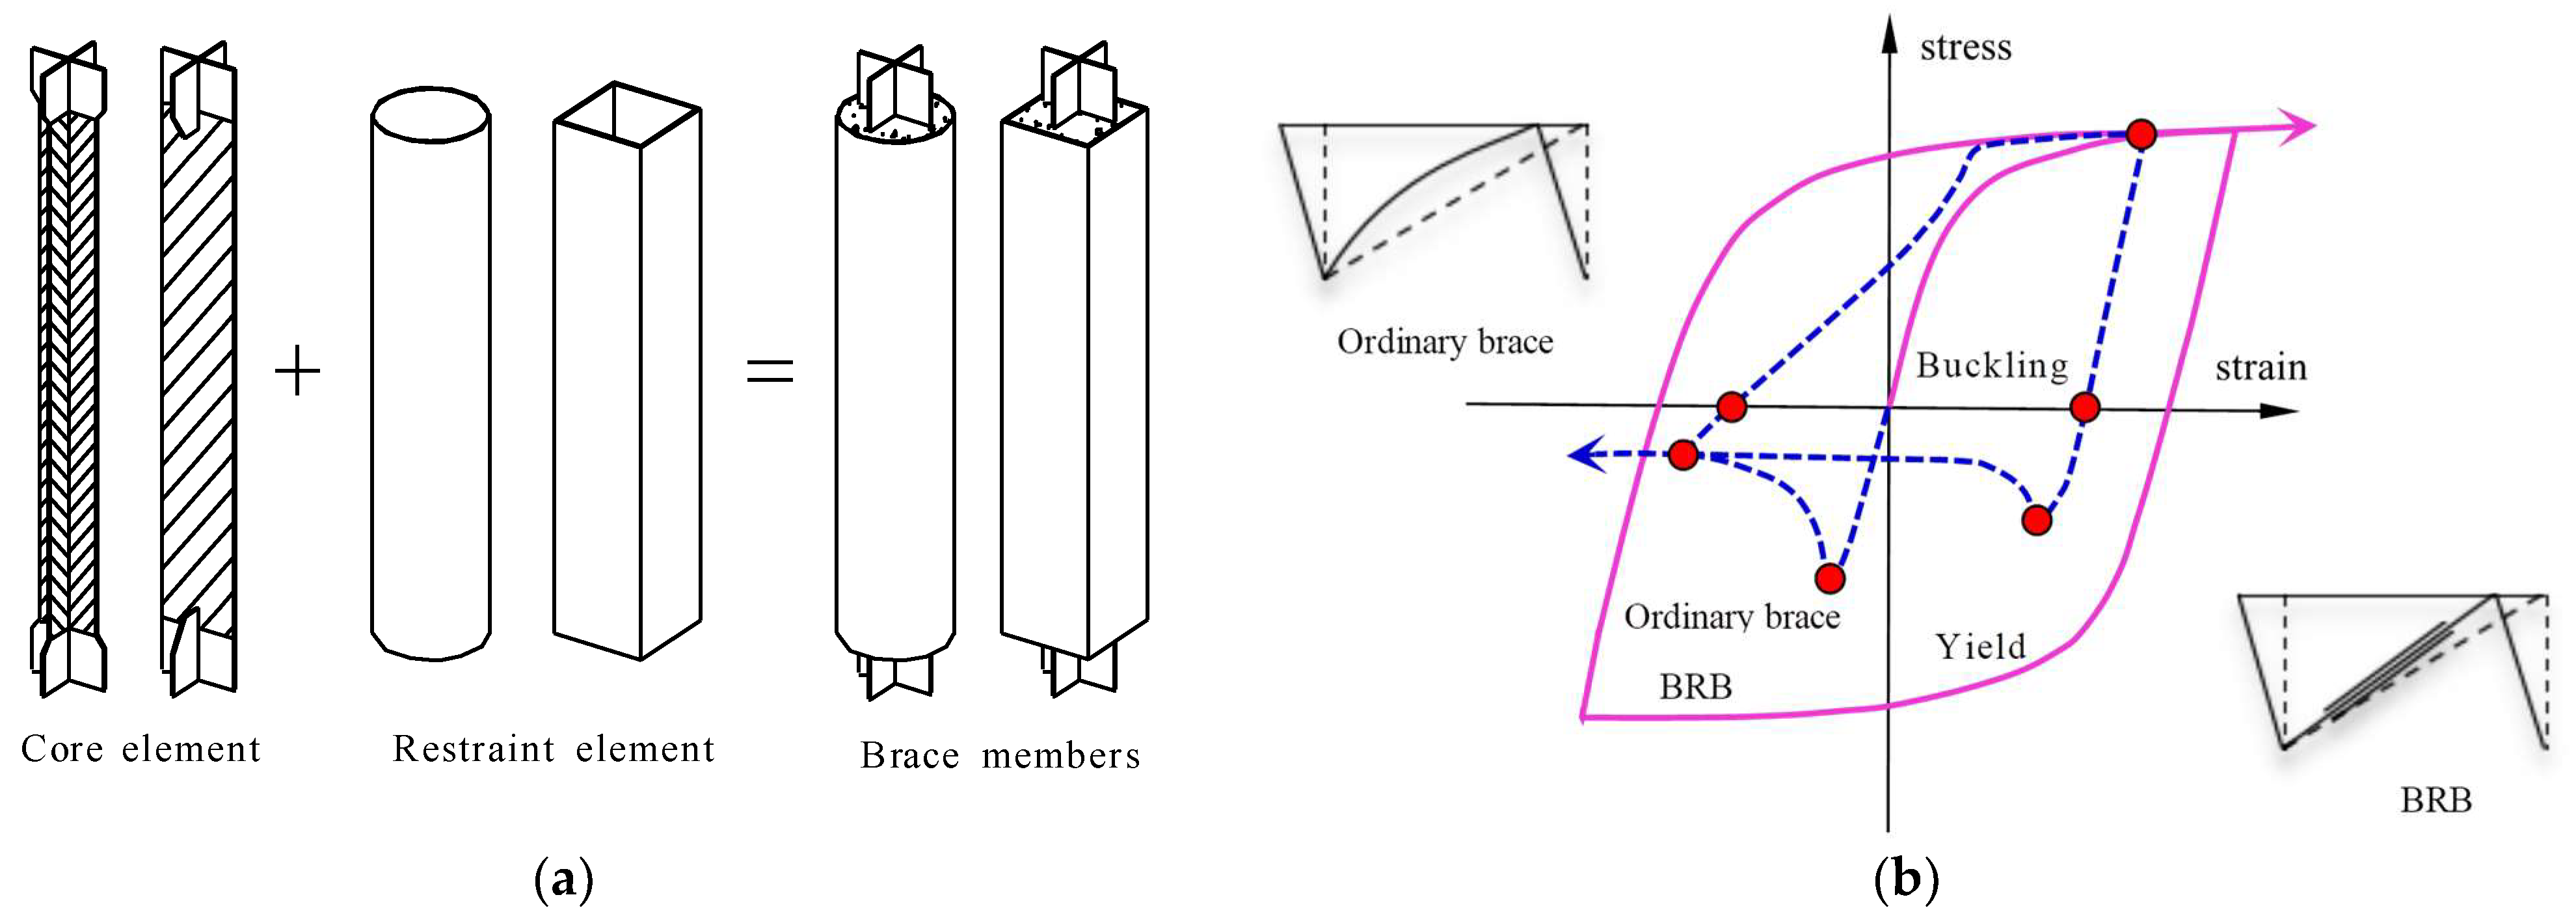
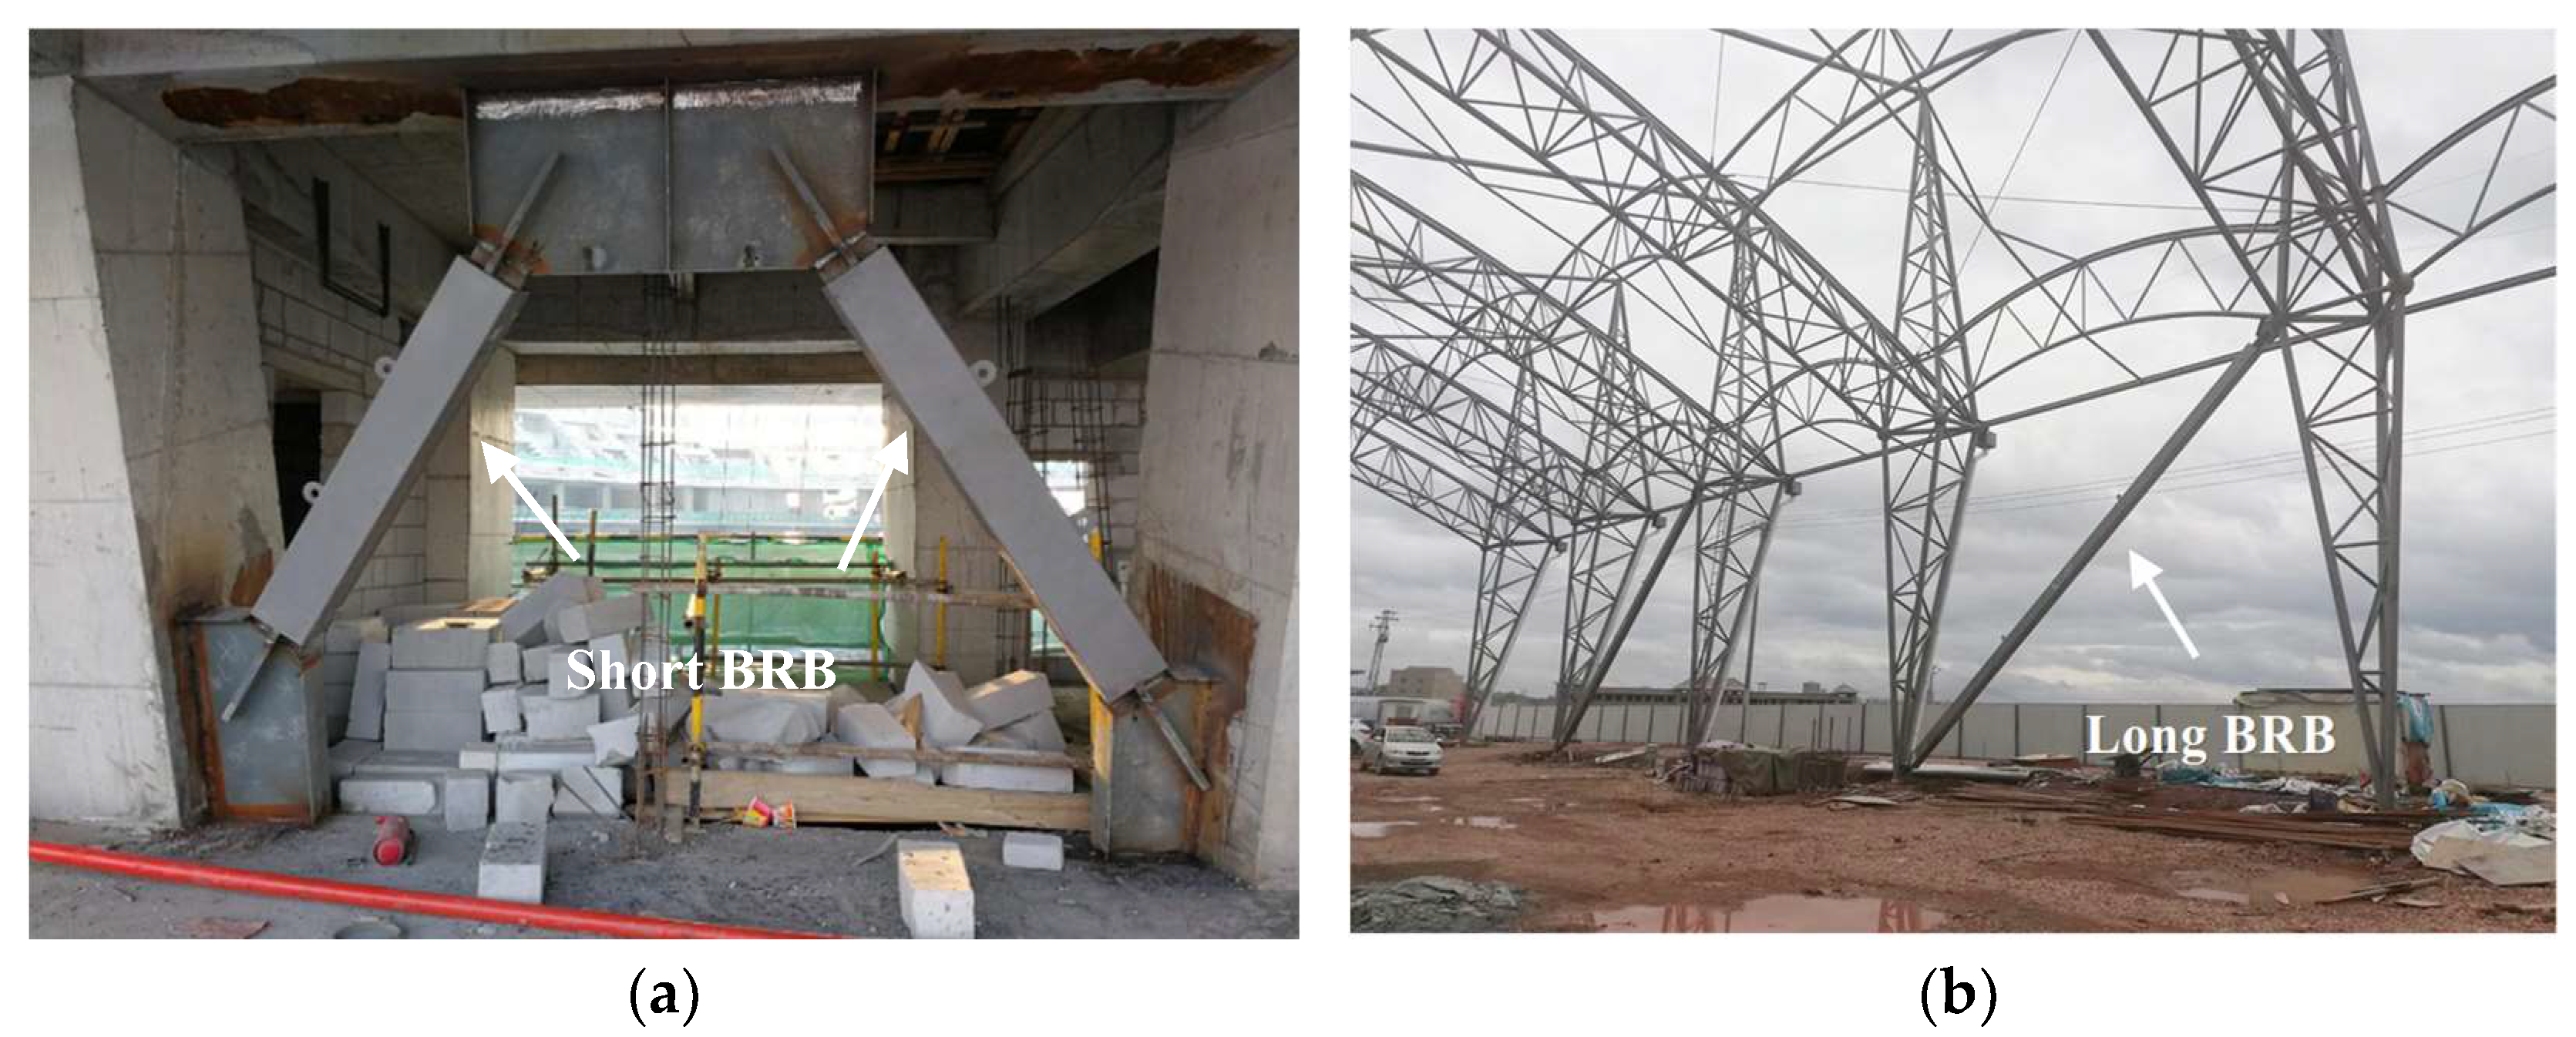
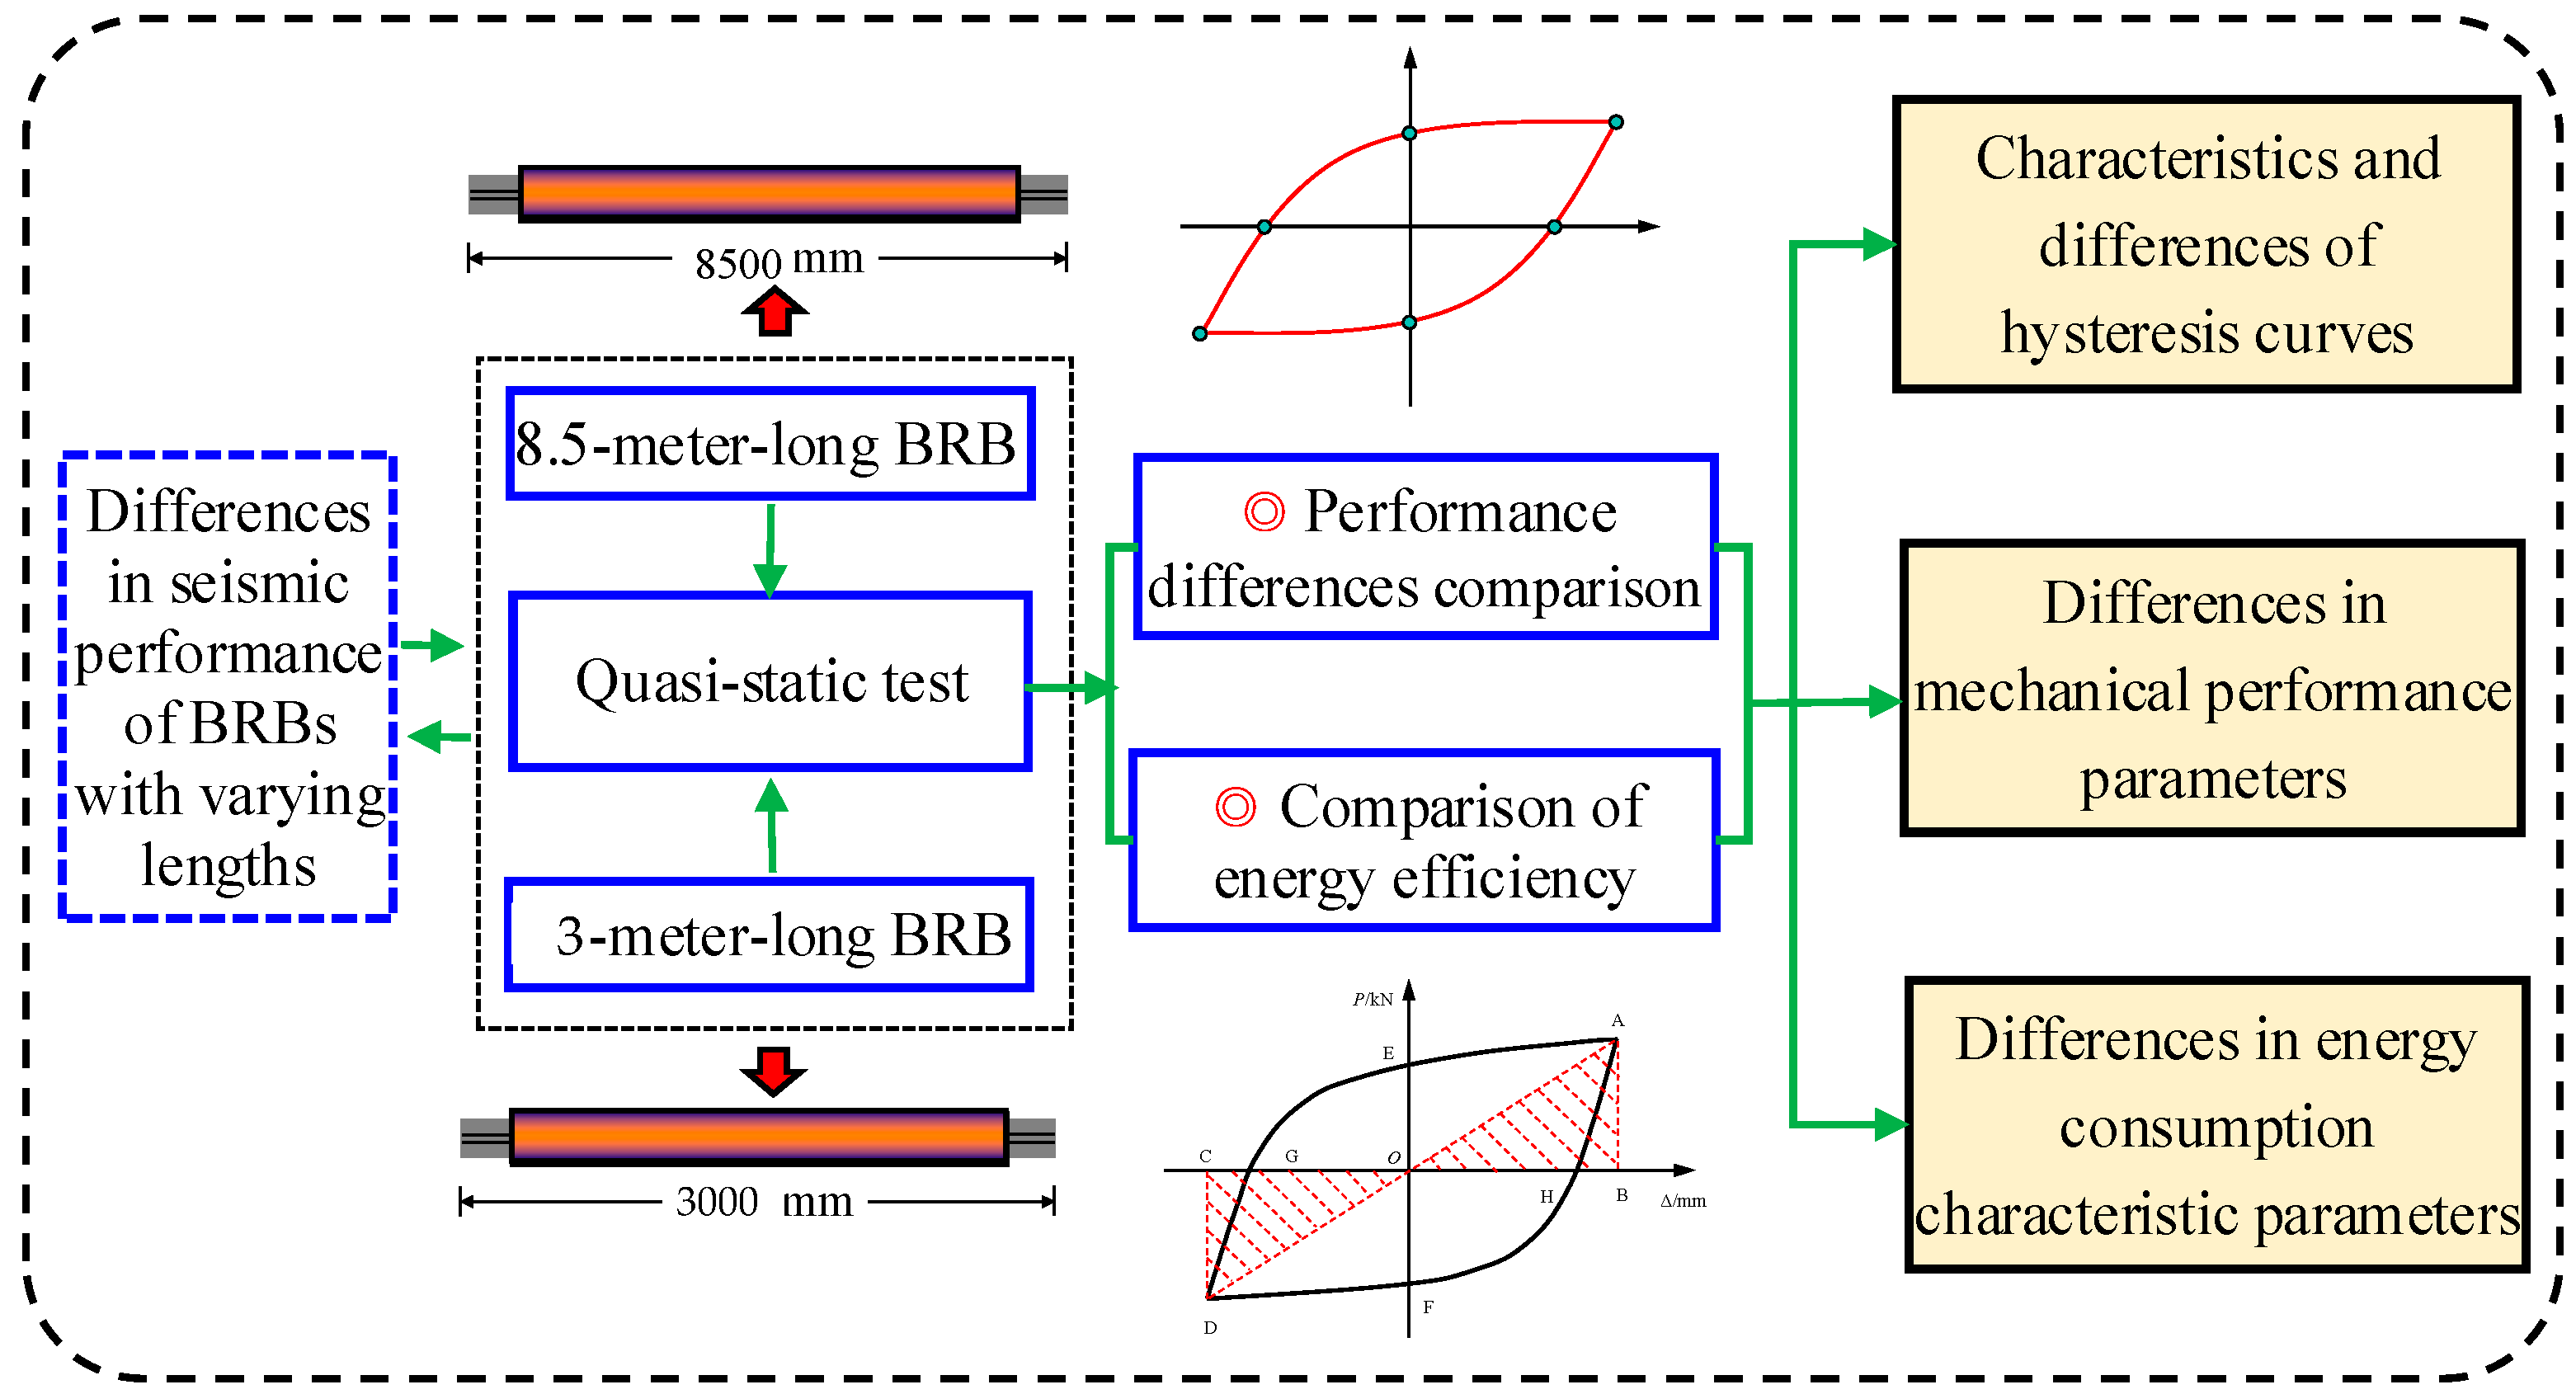
1. Introduction
2. Experimental Overview
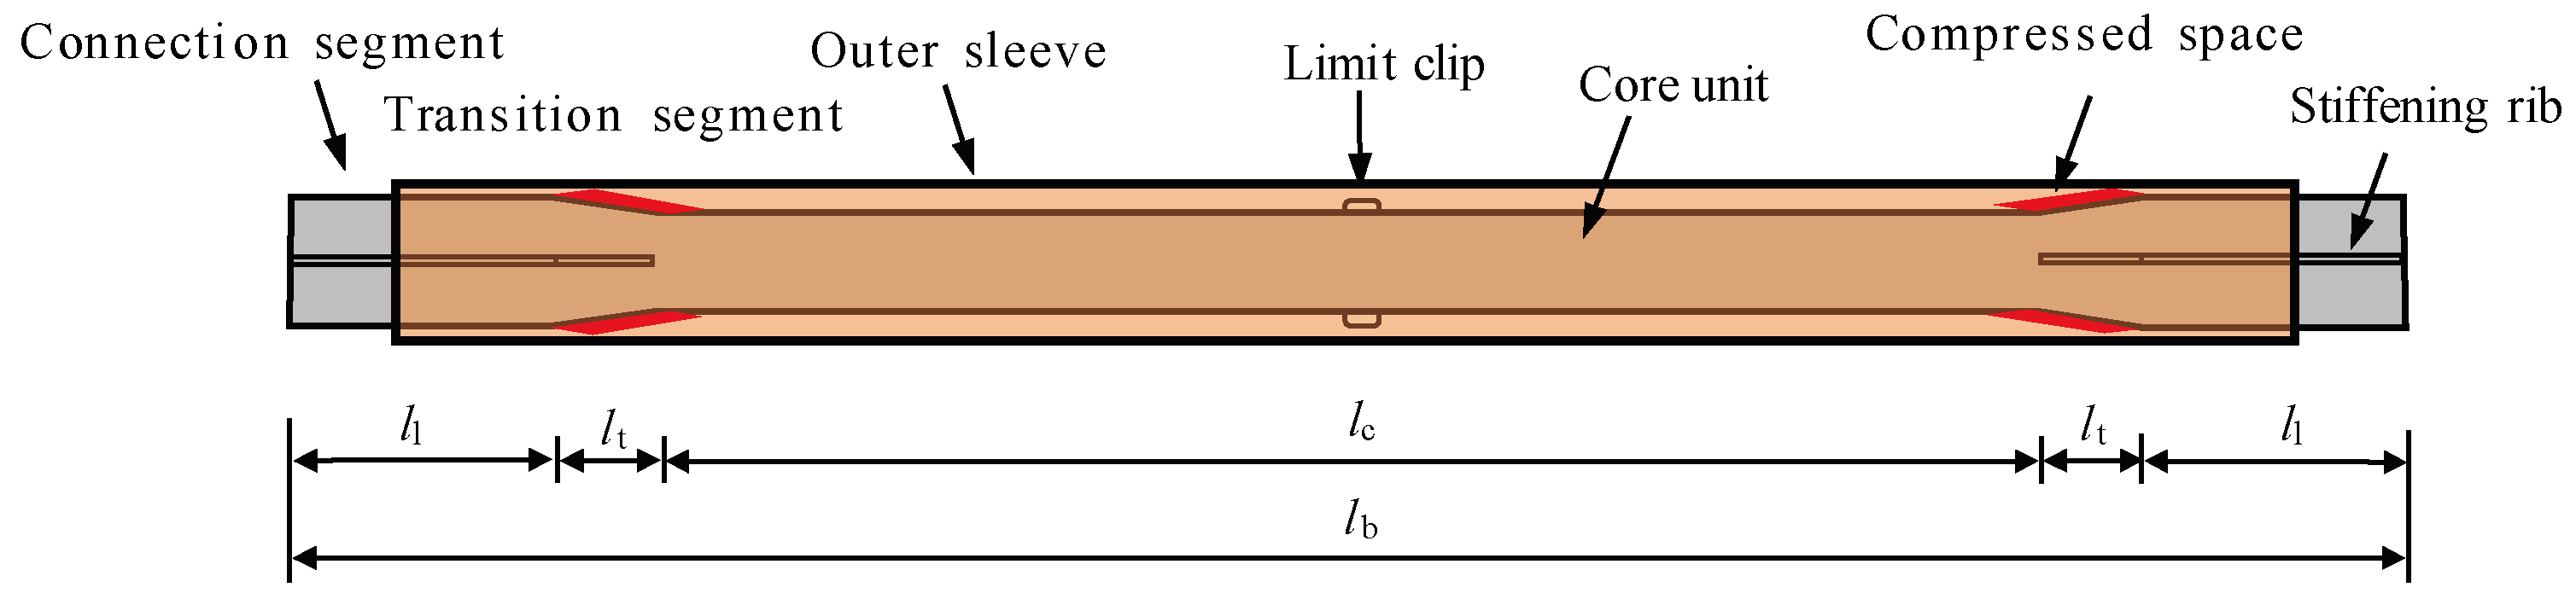
2.1. Specimen Design
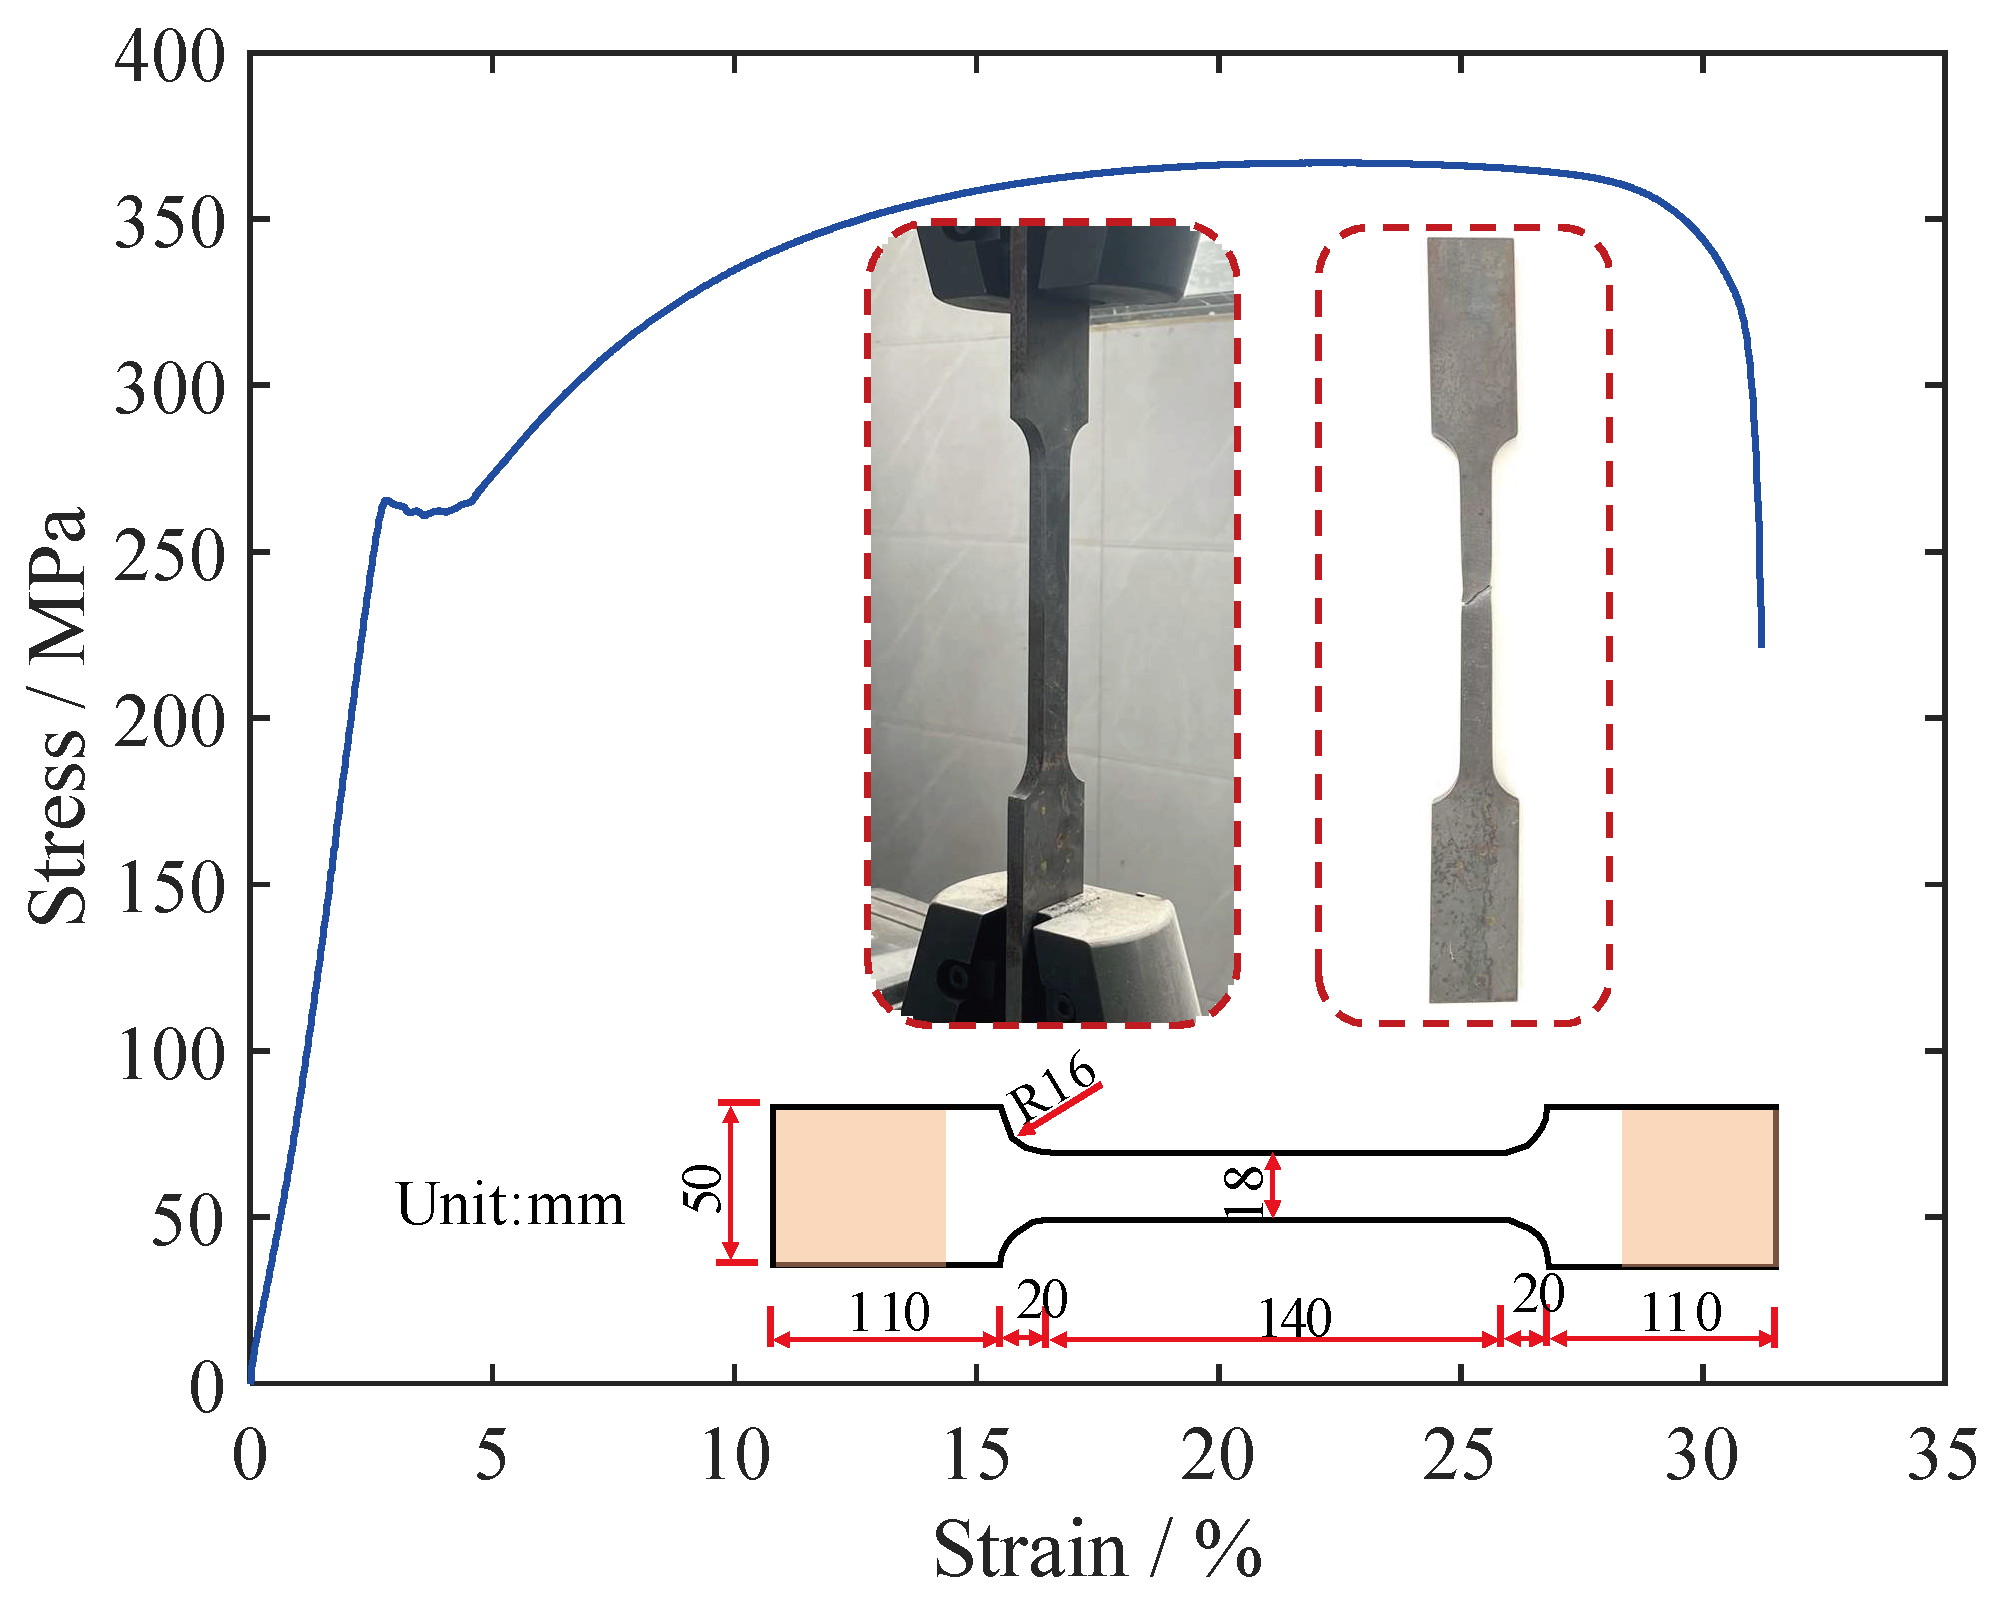
2.2. Material Property Test
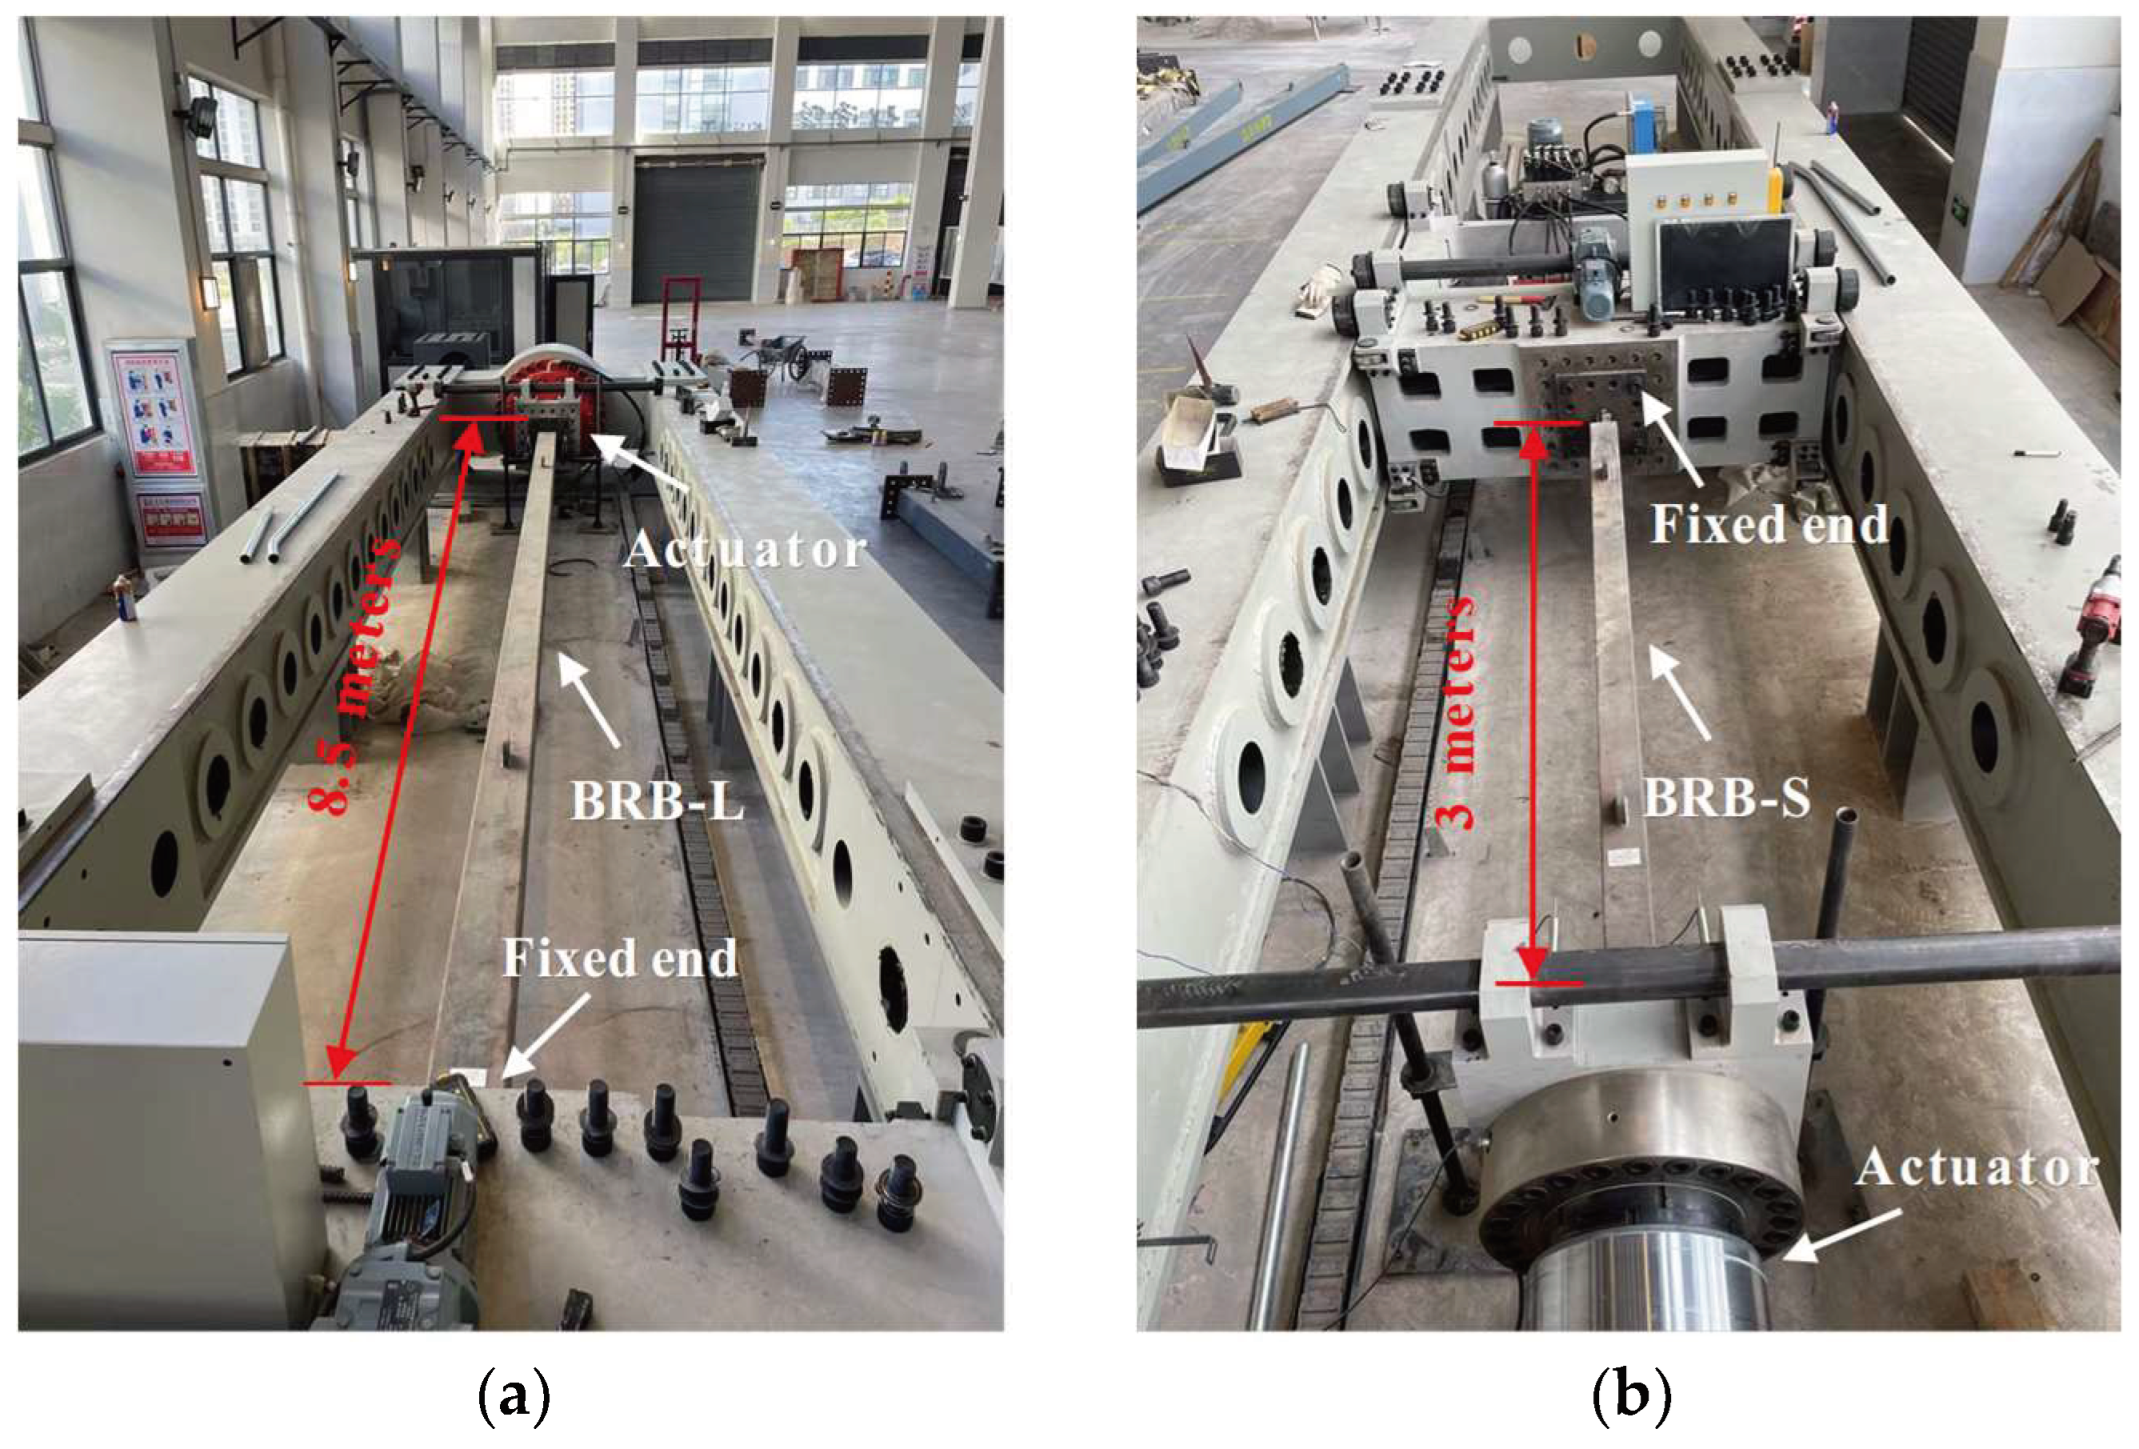
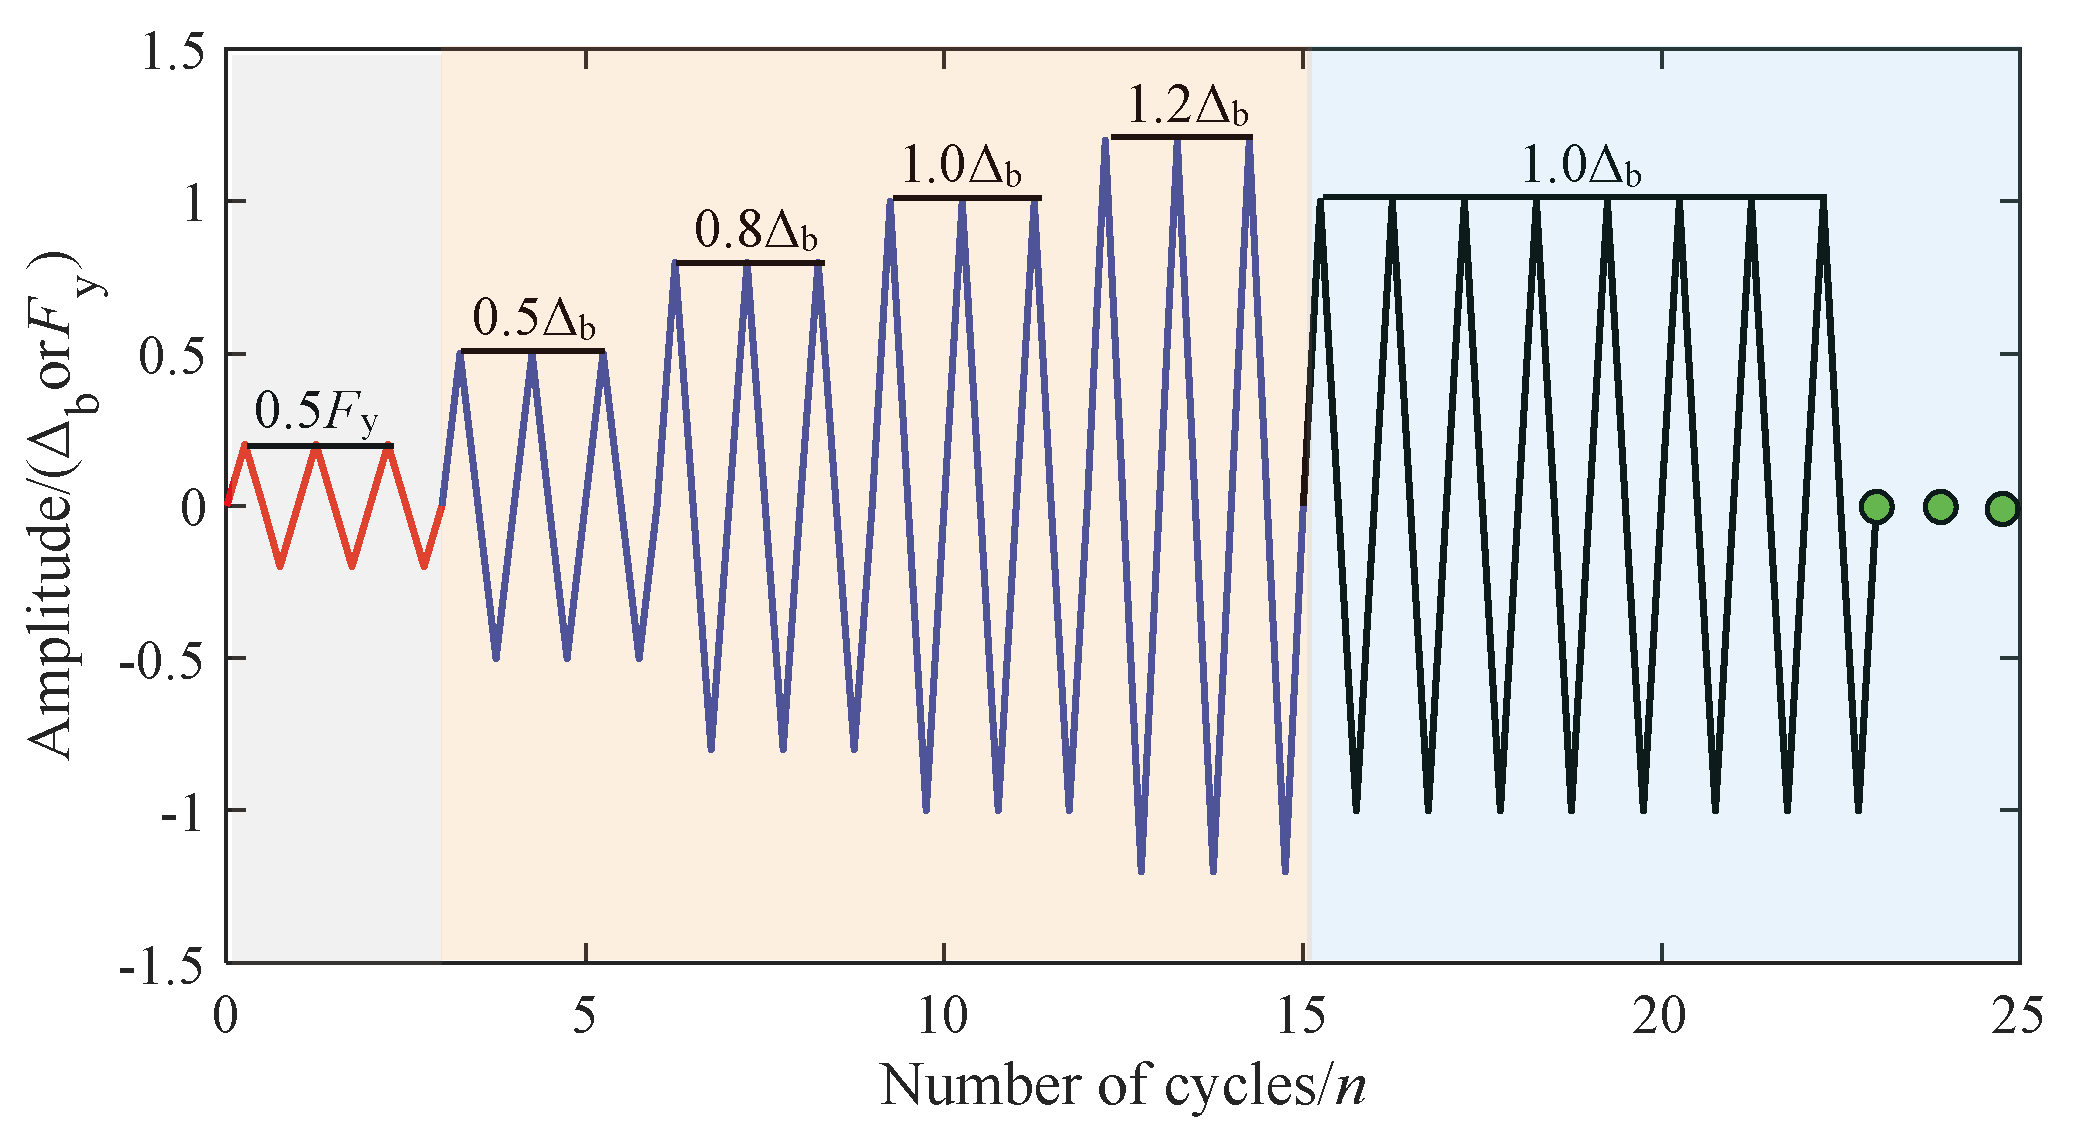
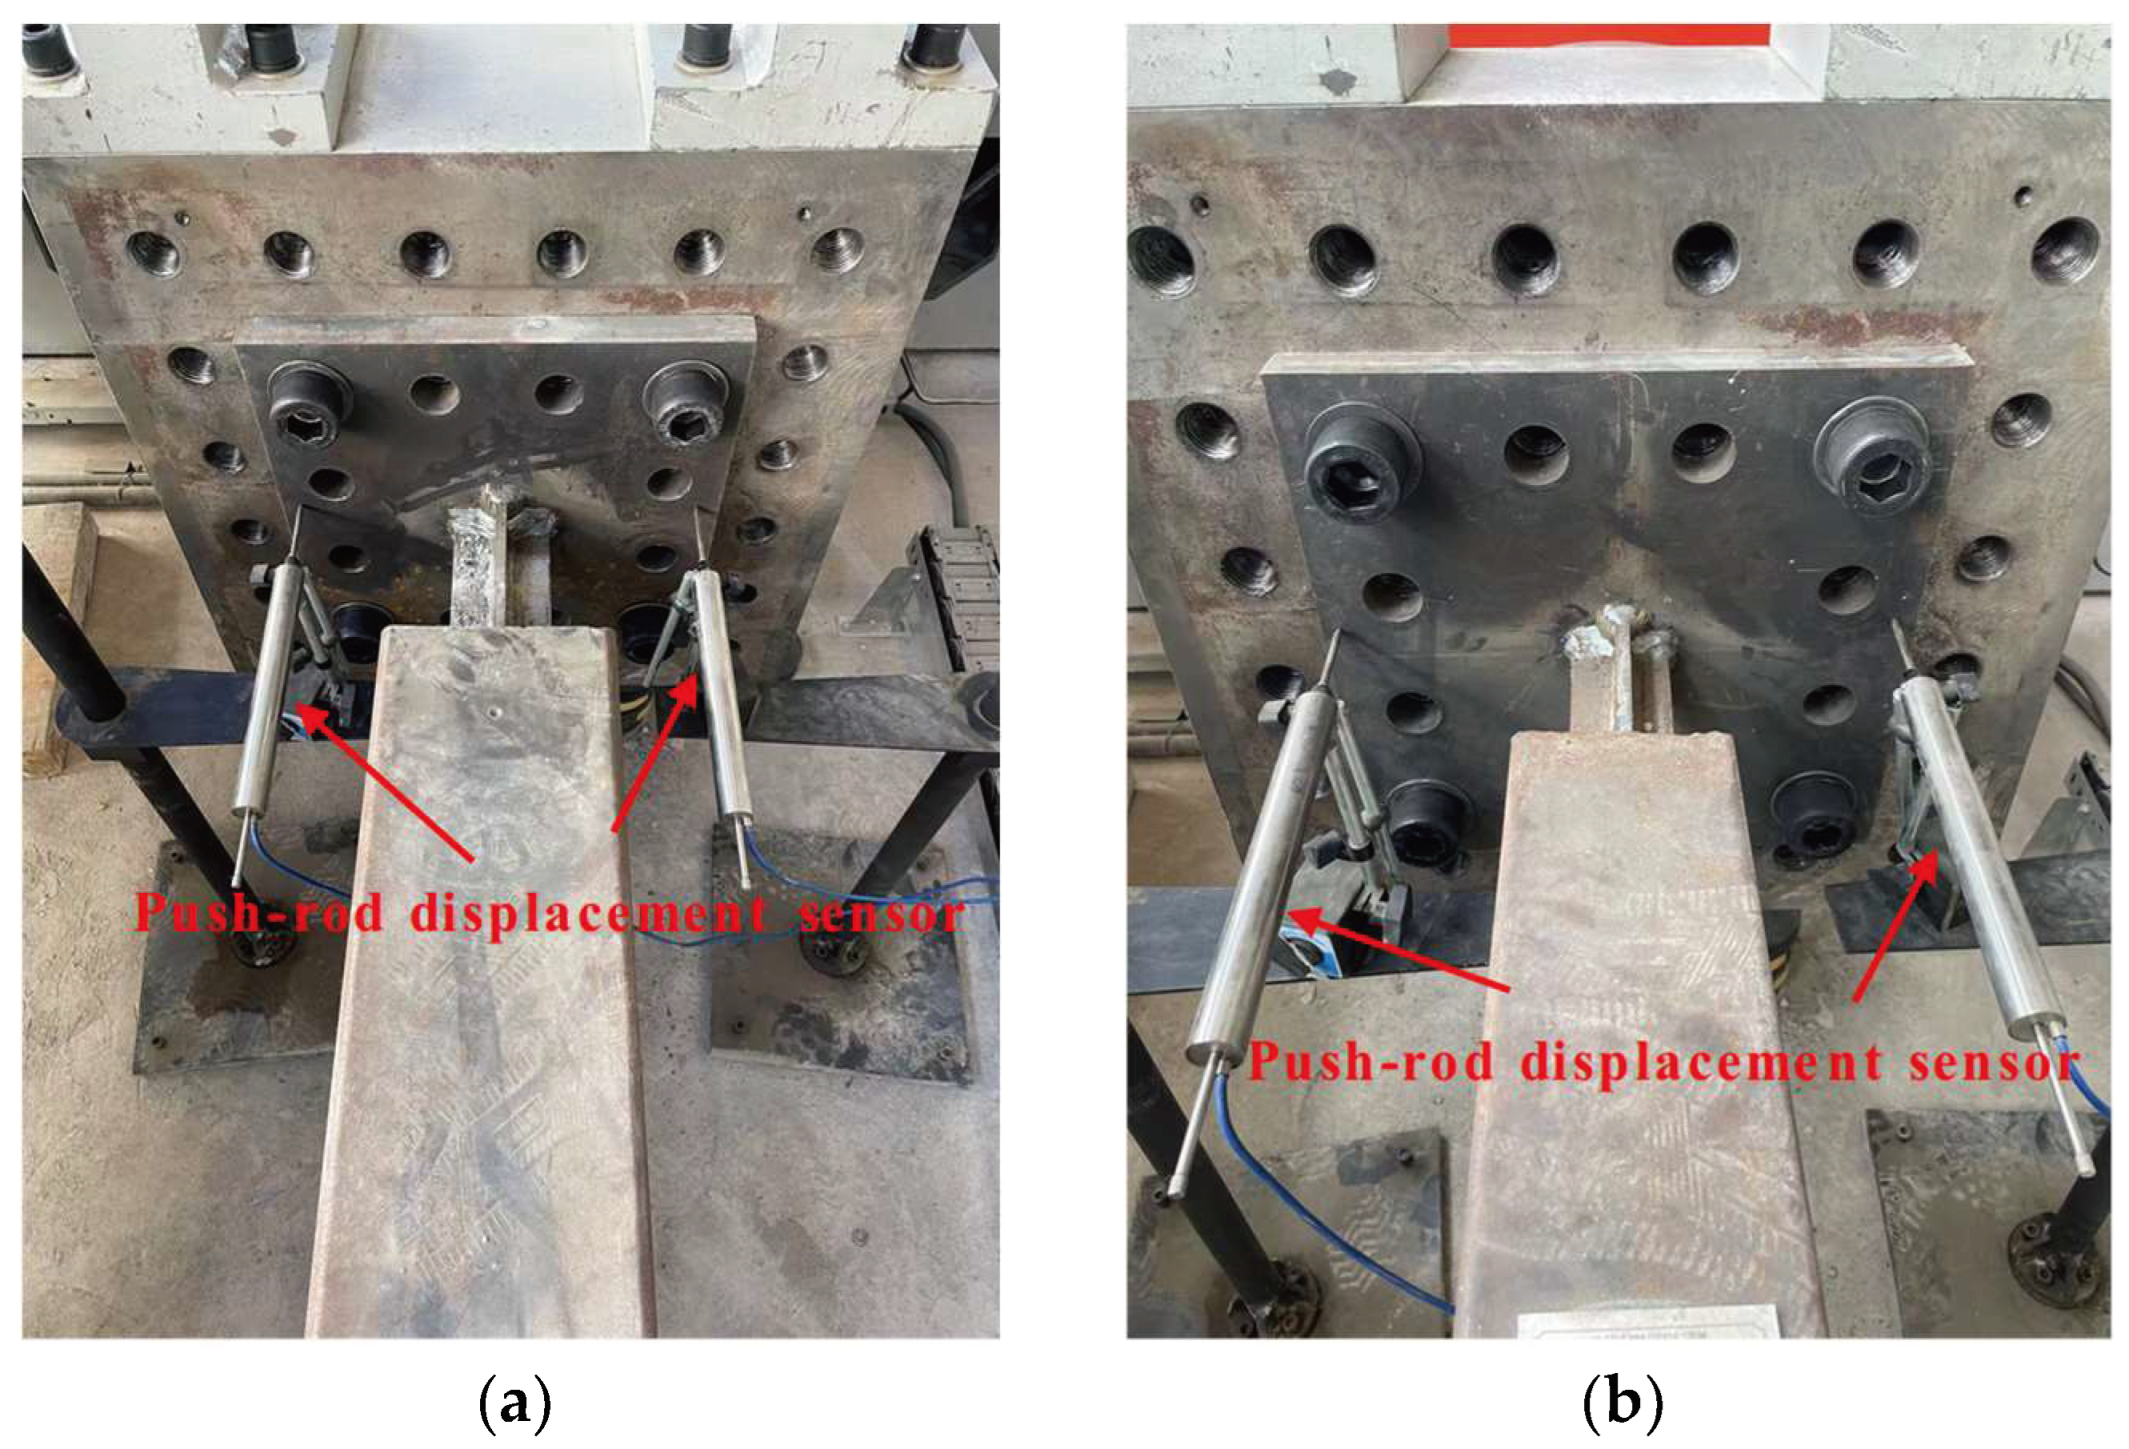
2.3. Experimental Loading and Measurement Scheme
3. Experimental Results and Analysis
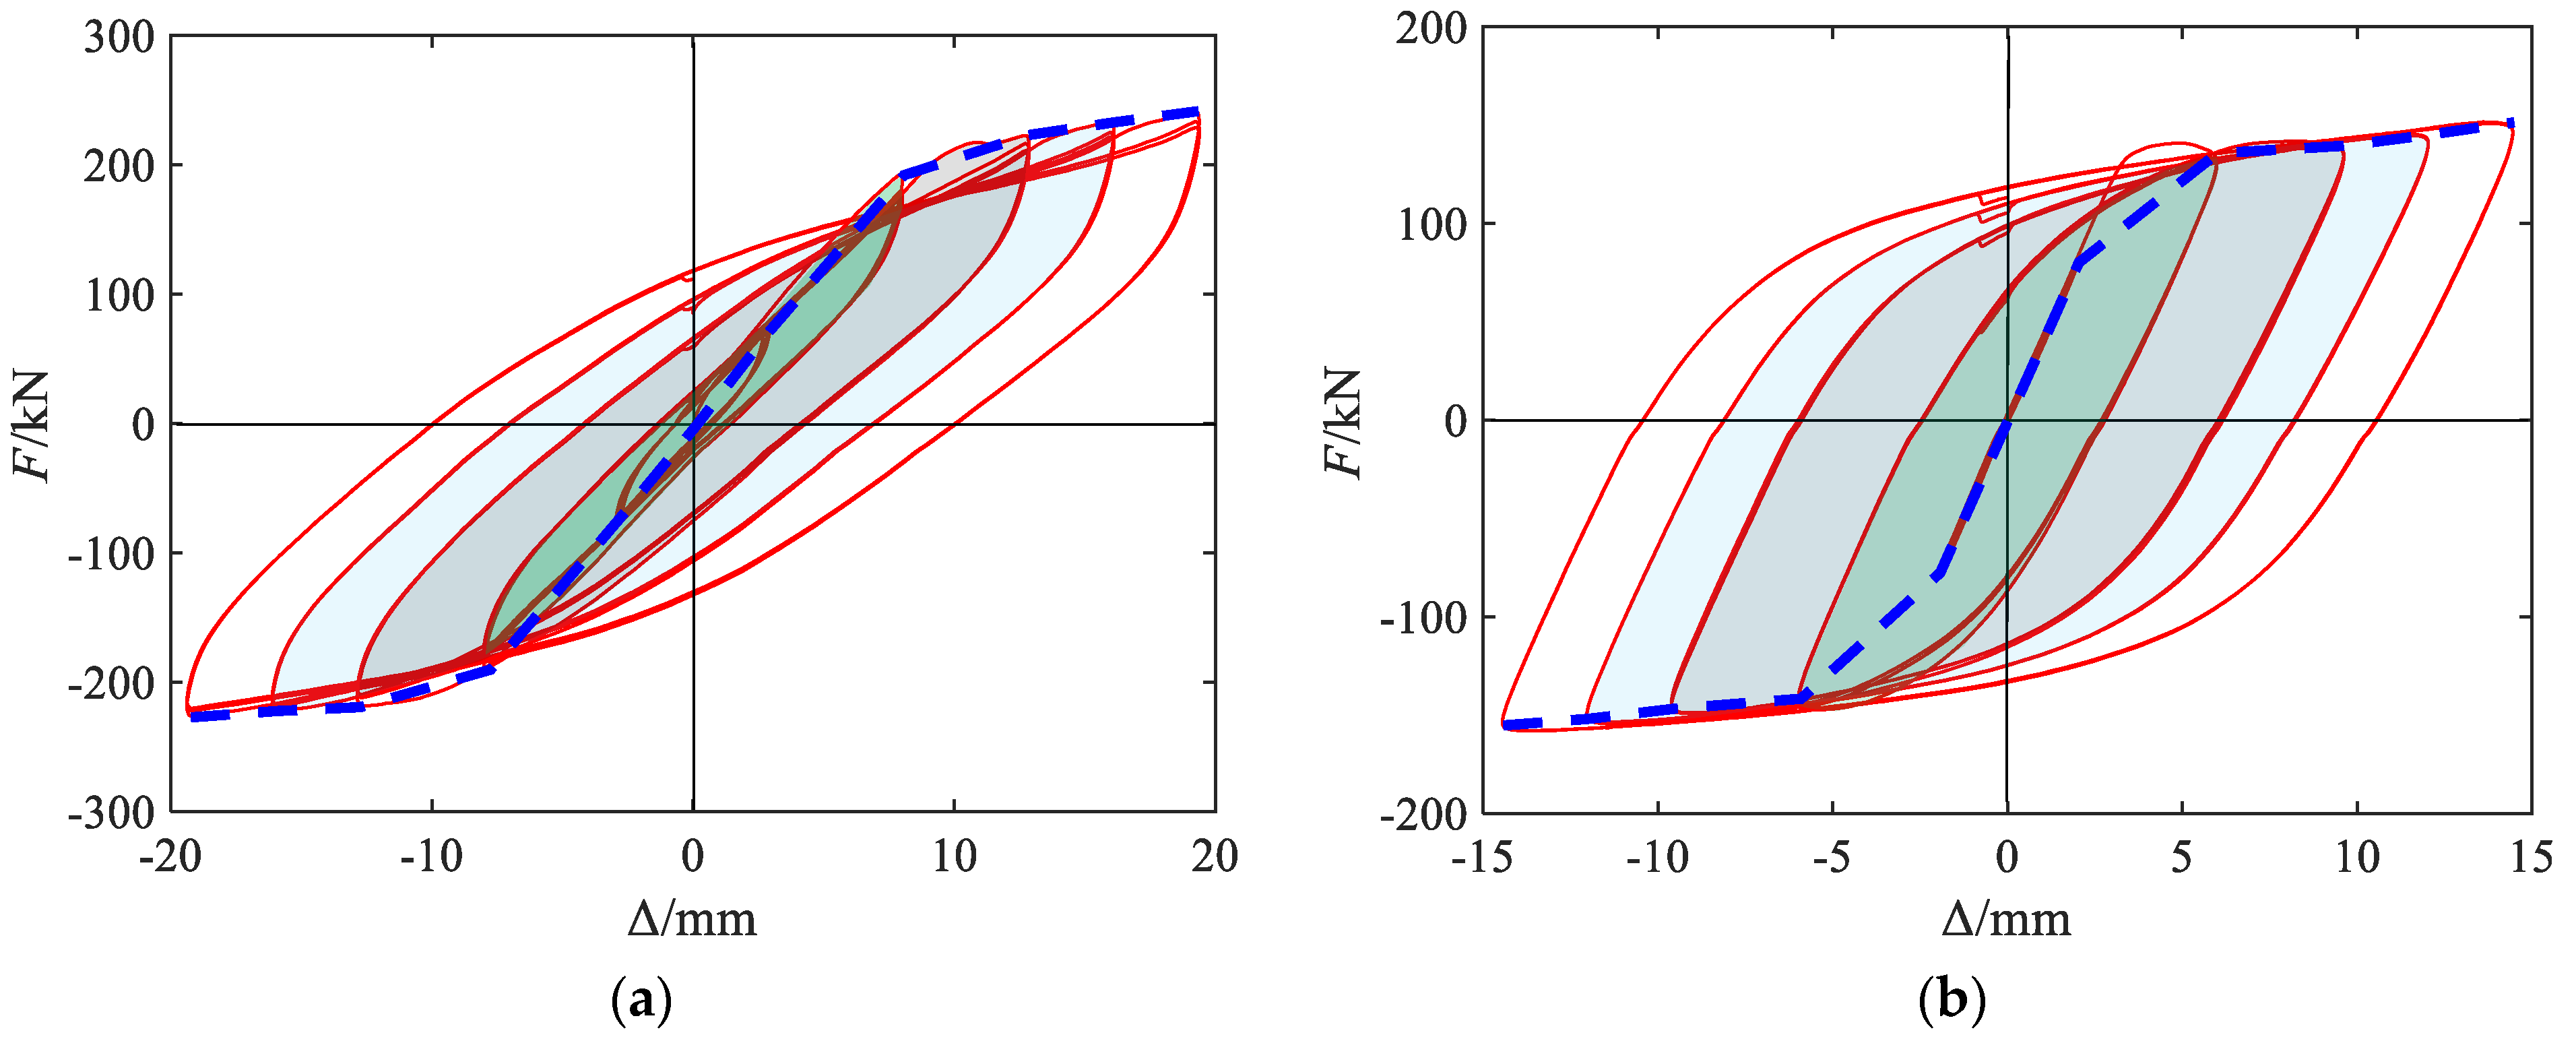
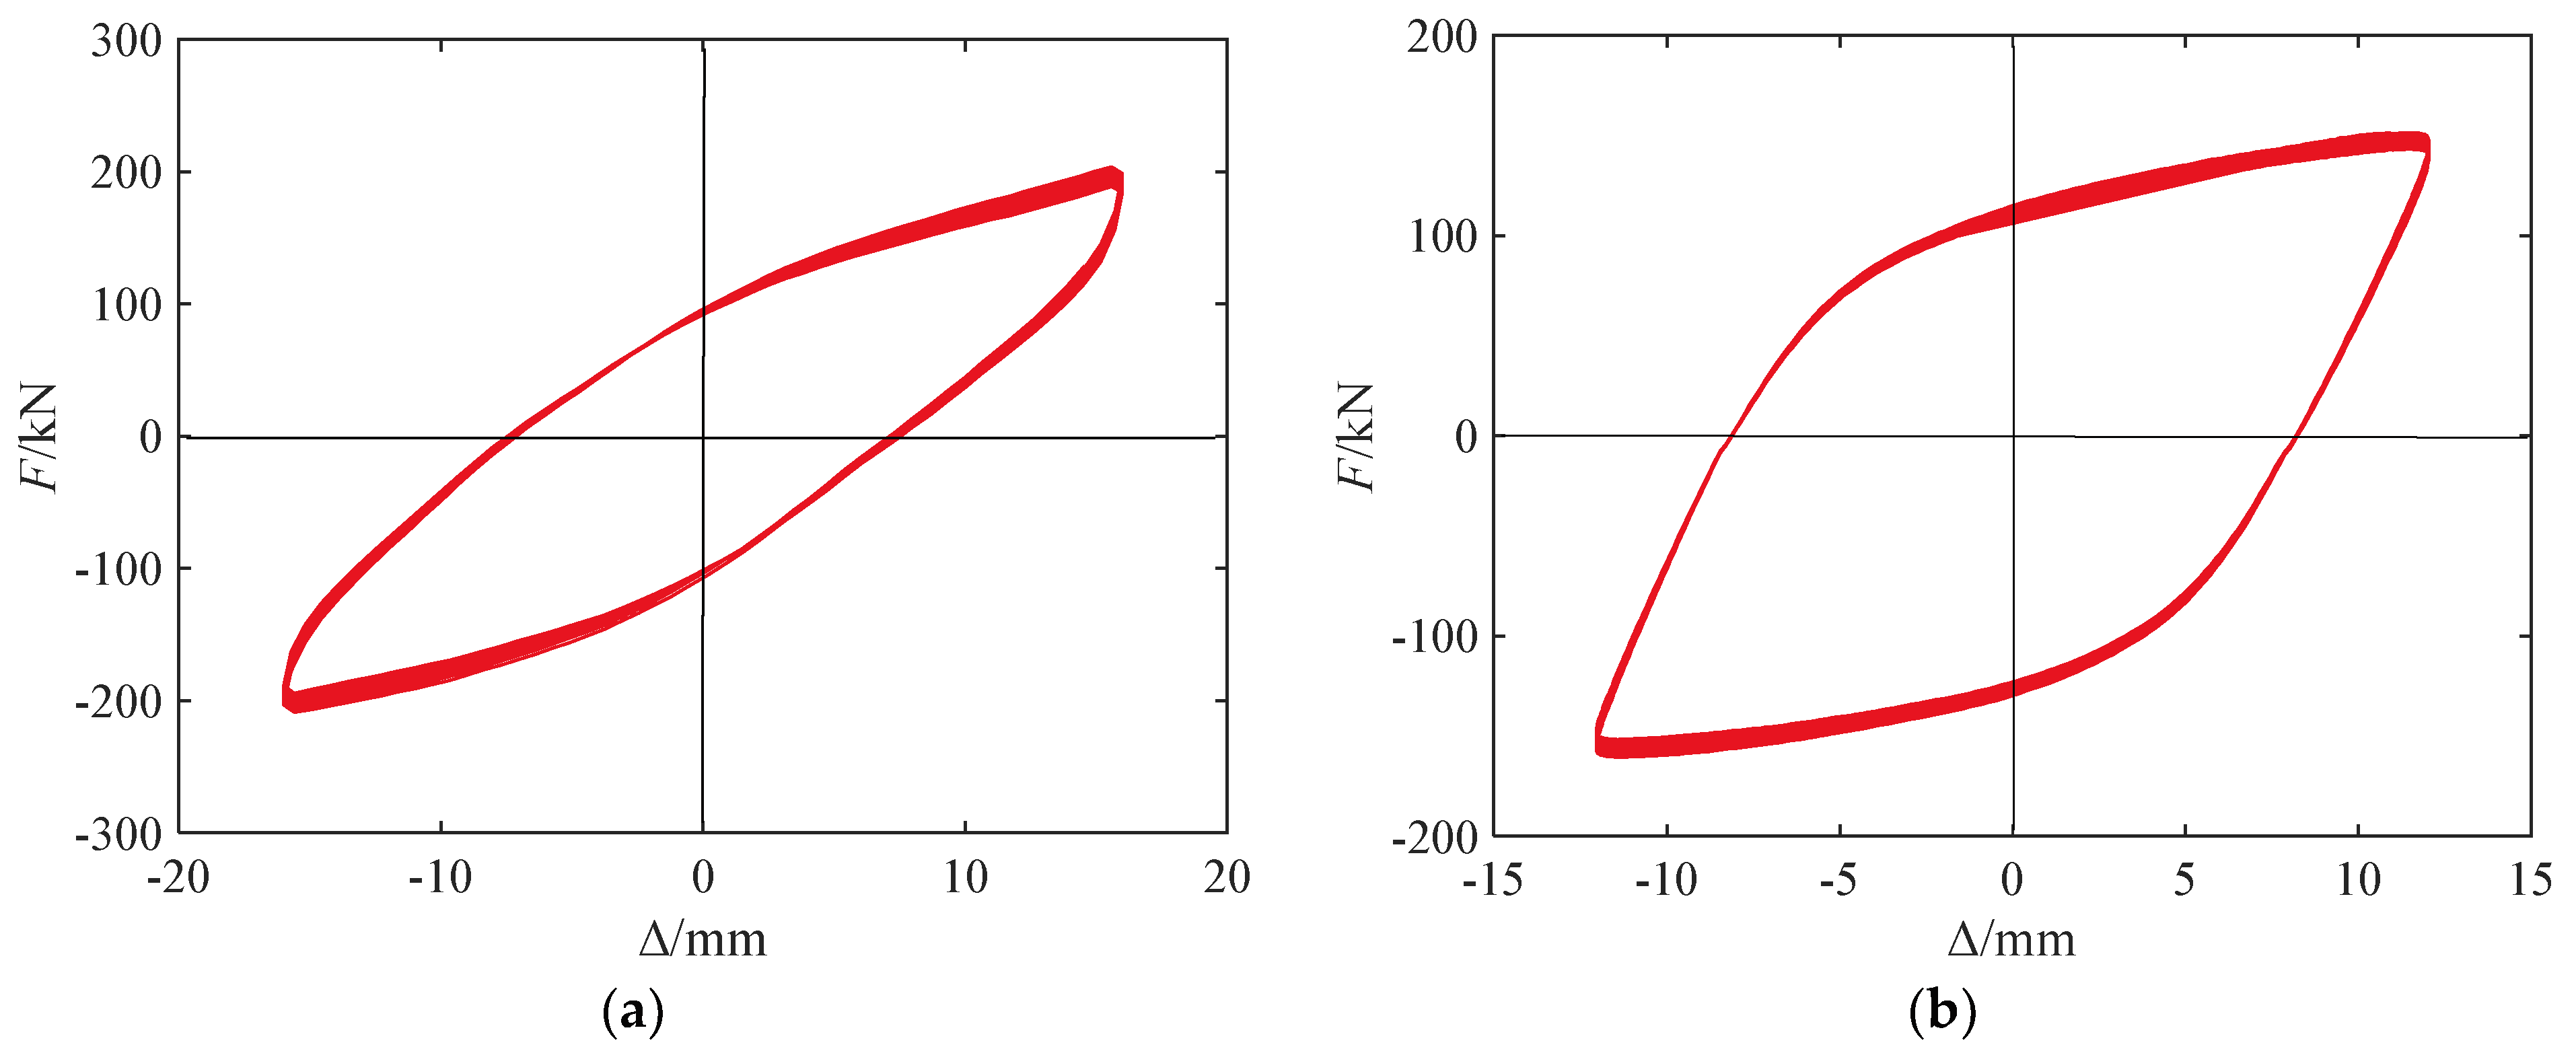
3.1. Hysteresis Curves and Characteristic Analysis
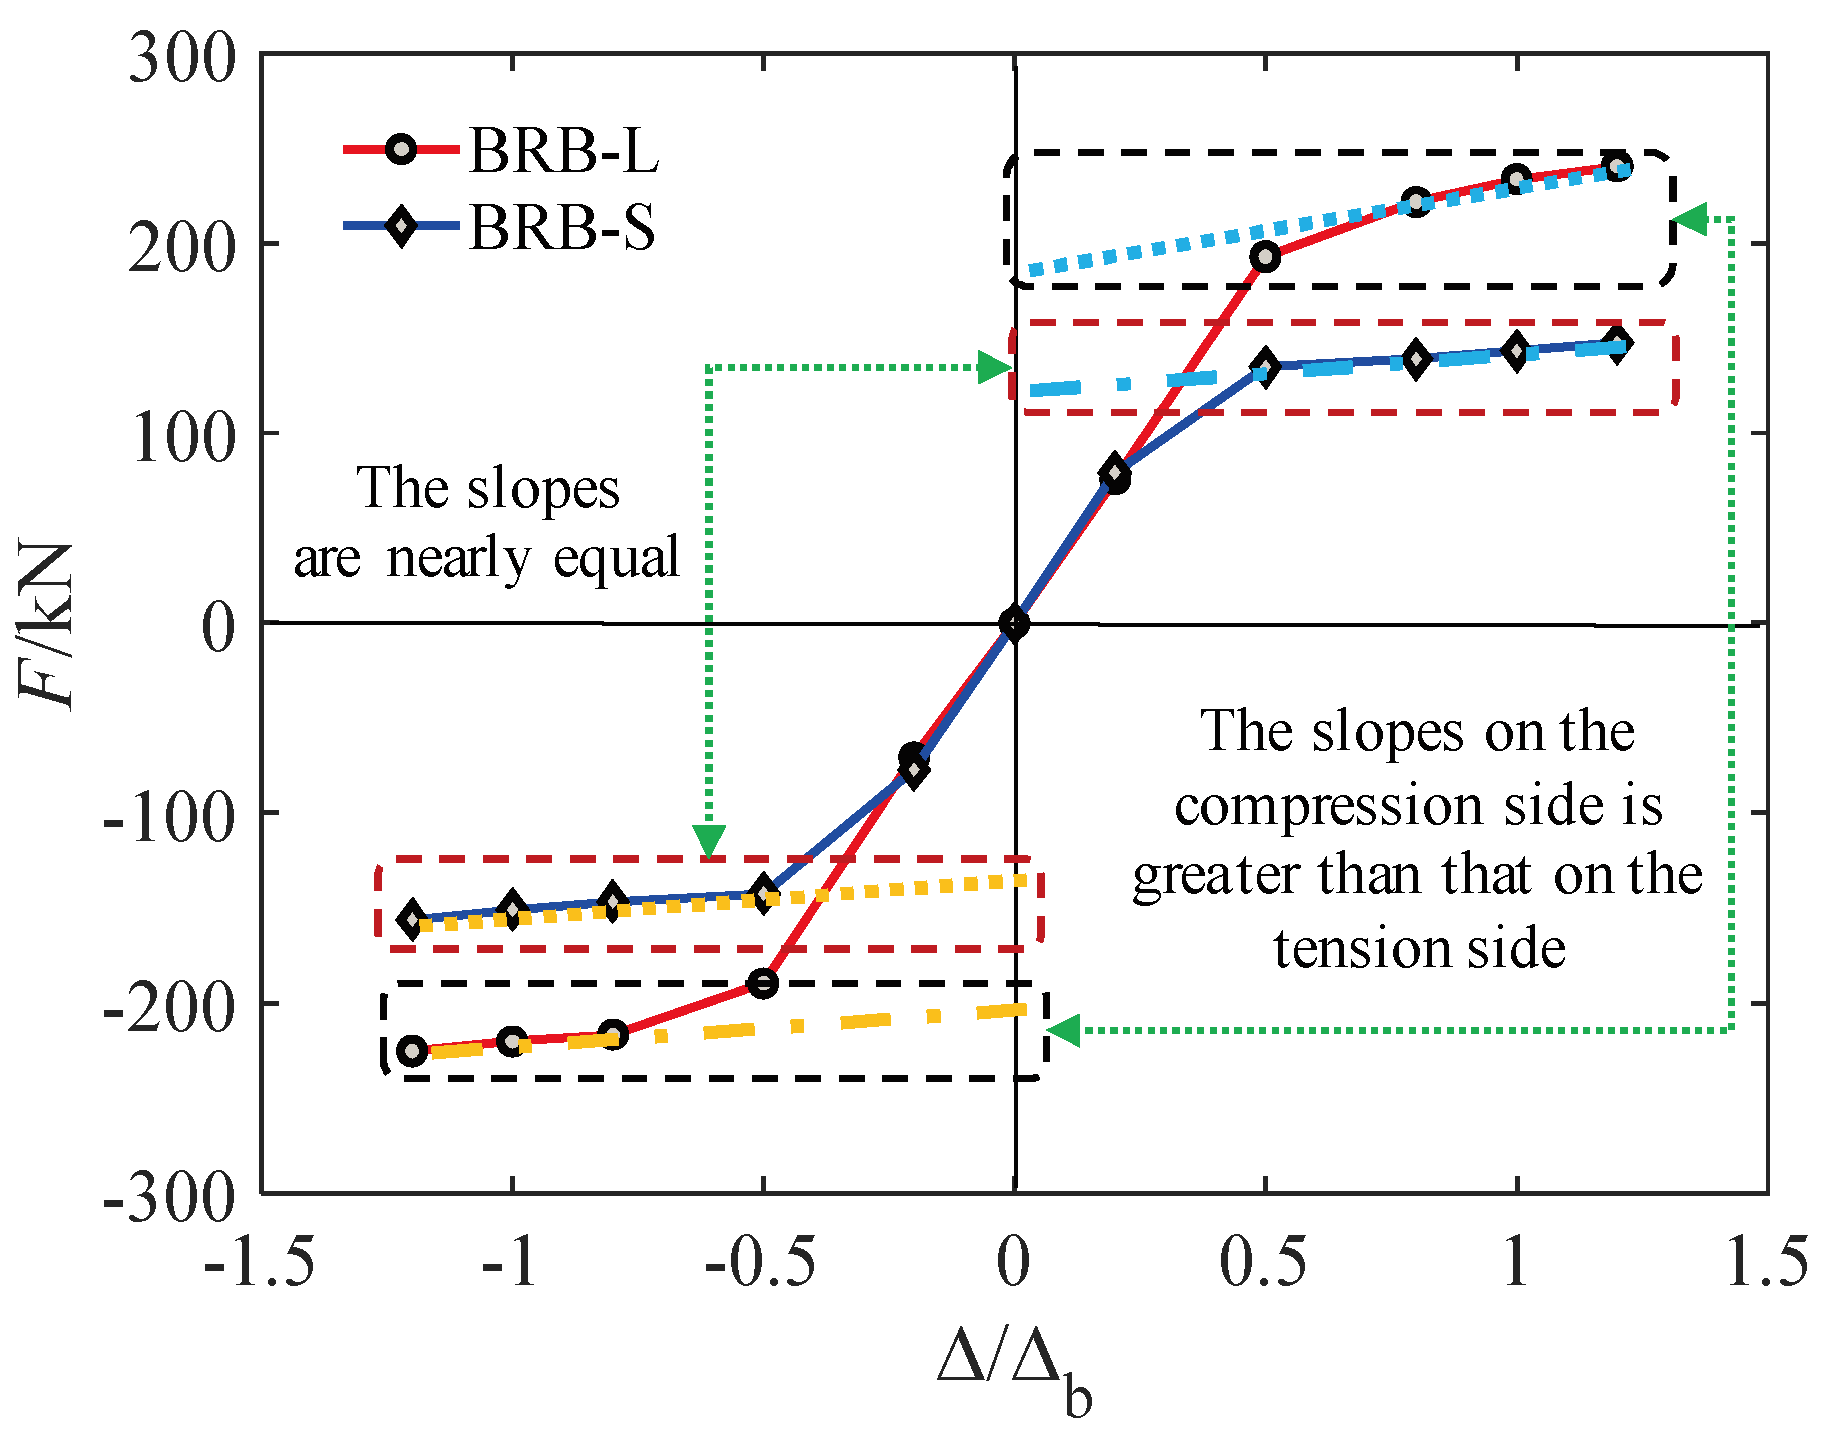
3.2. Skeleton Curves and Characteristic Analysis
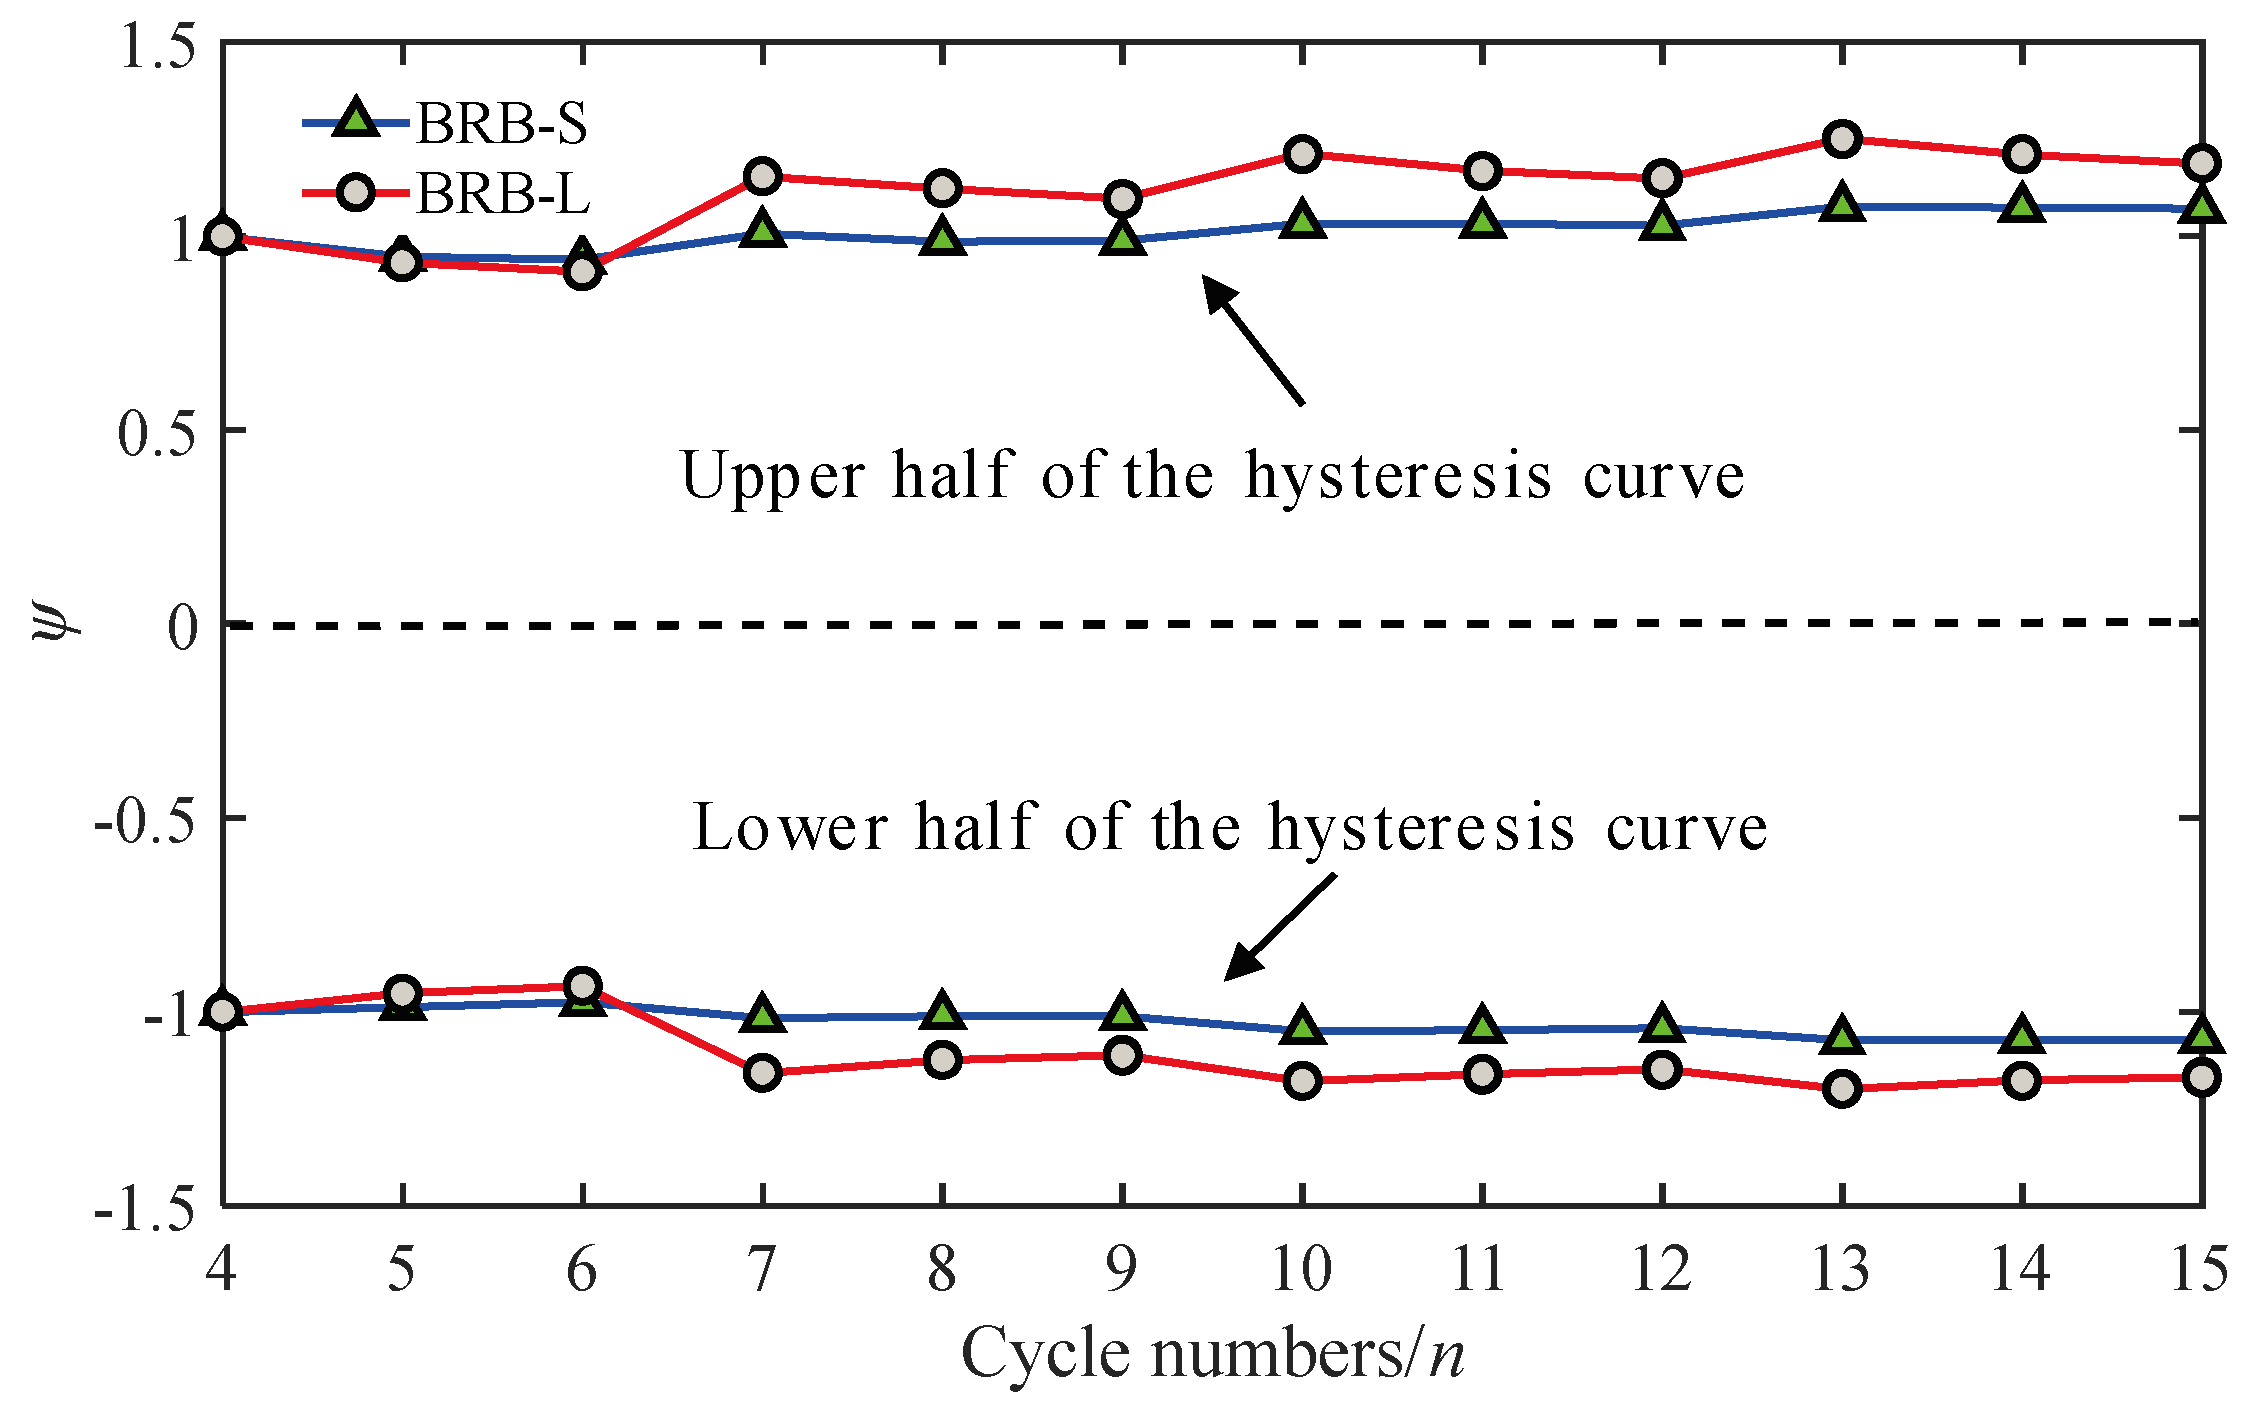
3.3. Tension–Compression Capacity Imbalance Coefficient
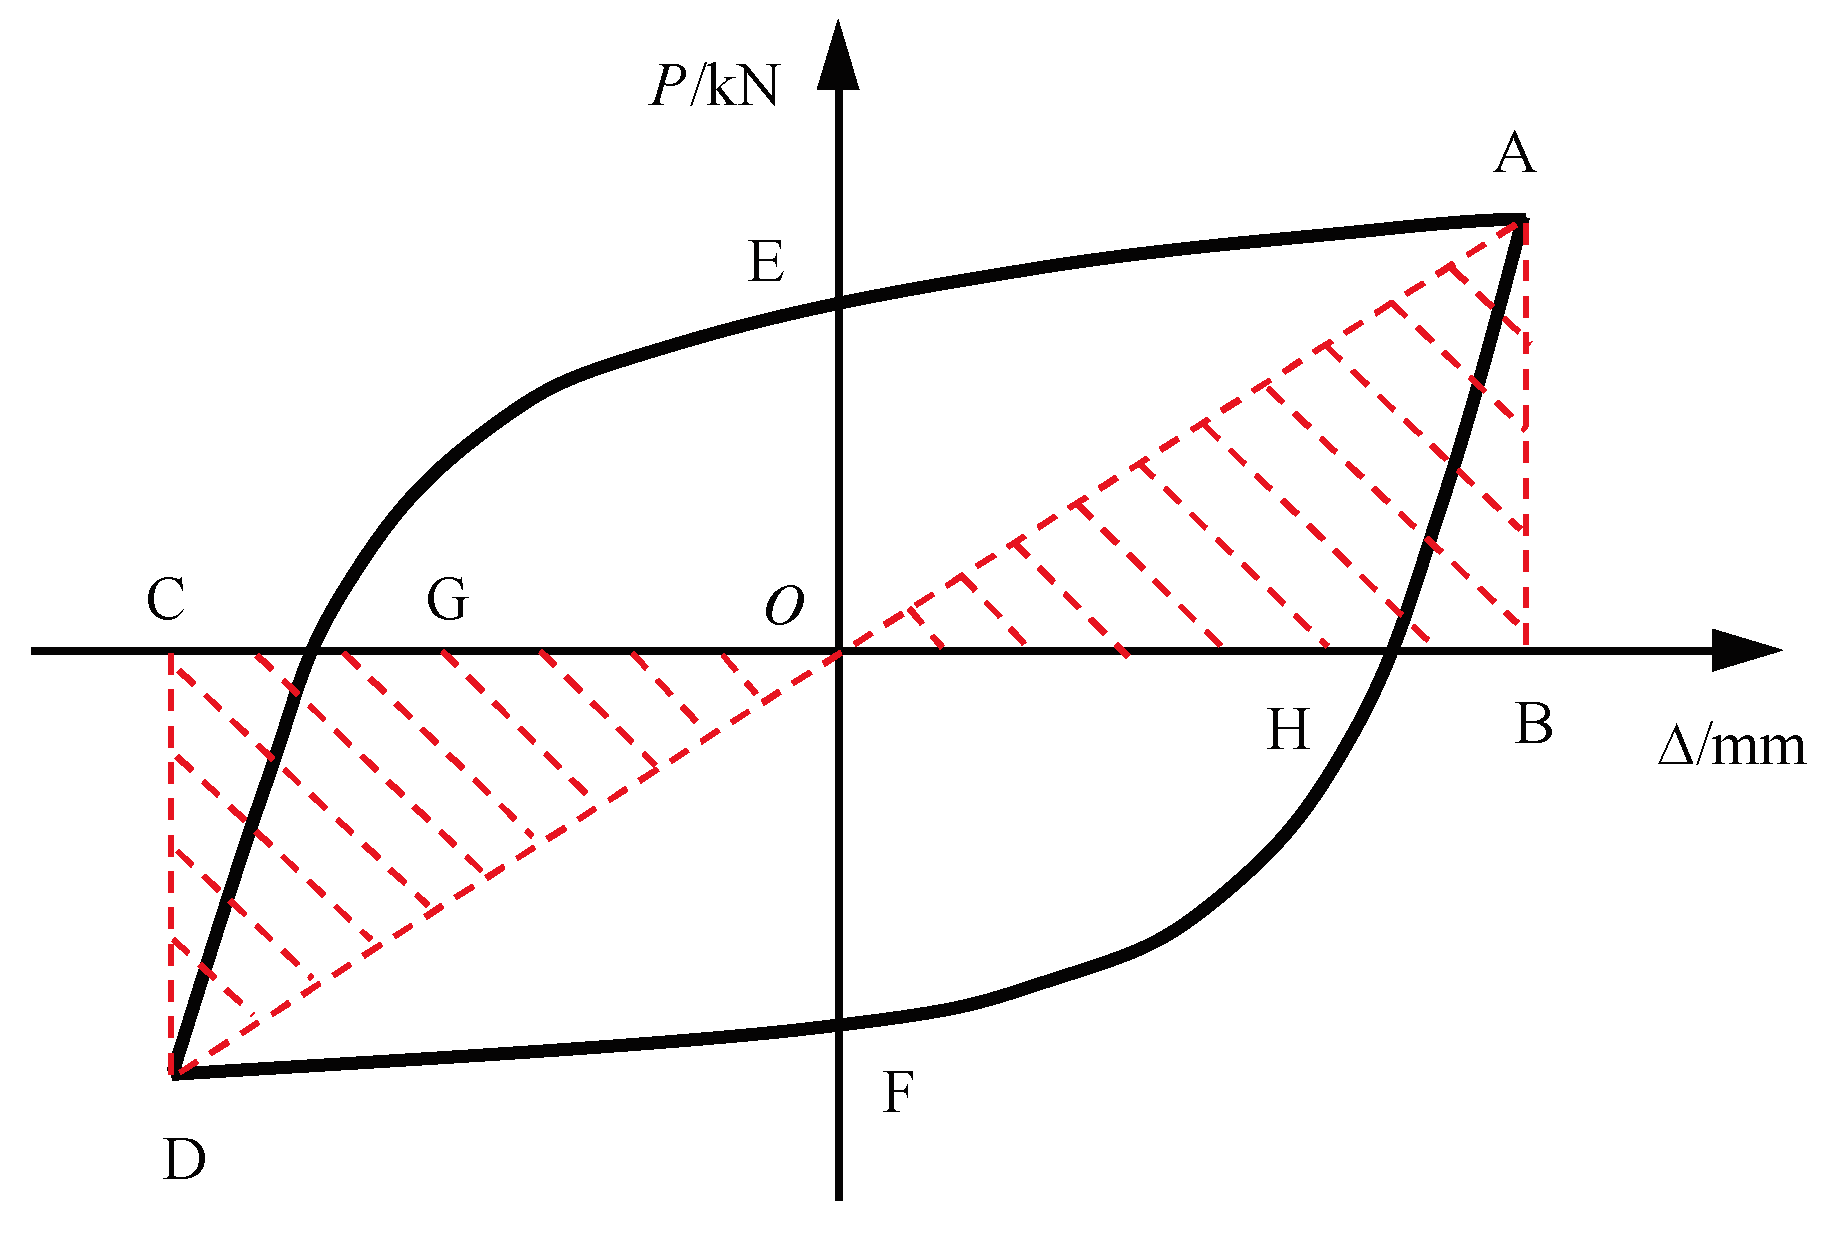
3.4. Equivalent Viscous Damping Ratio
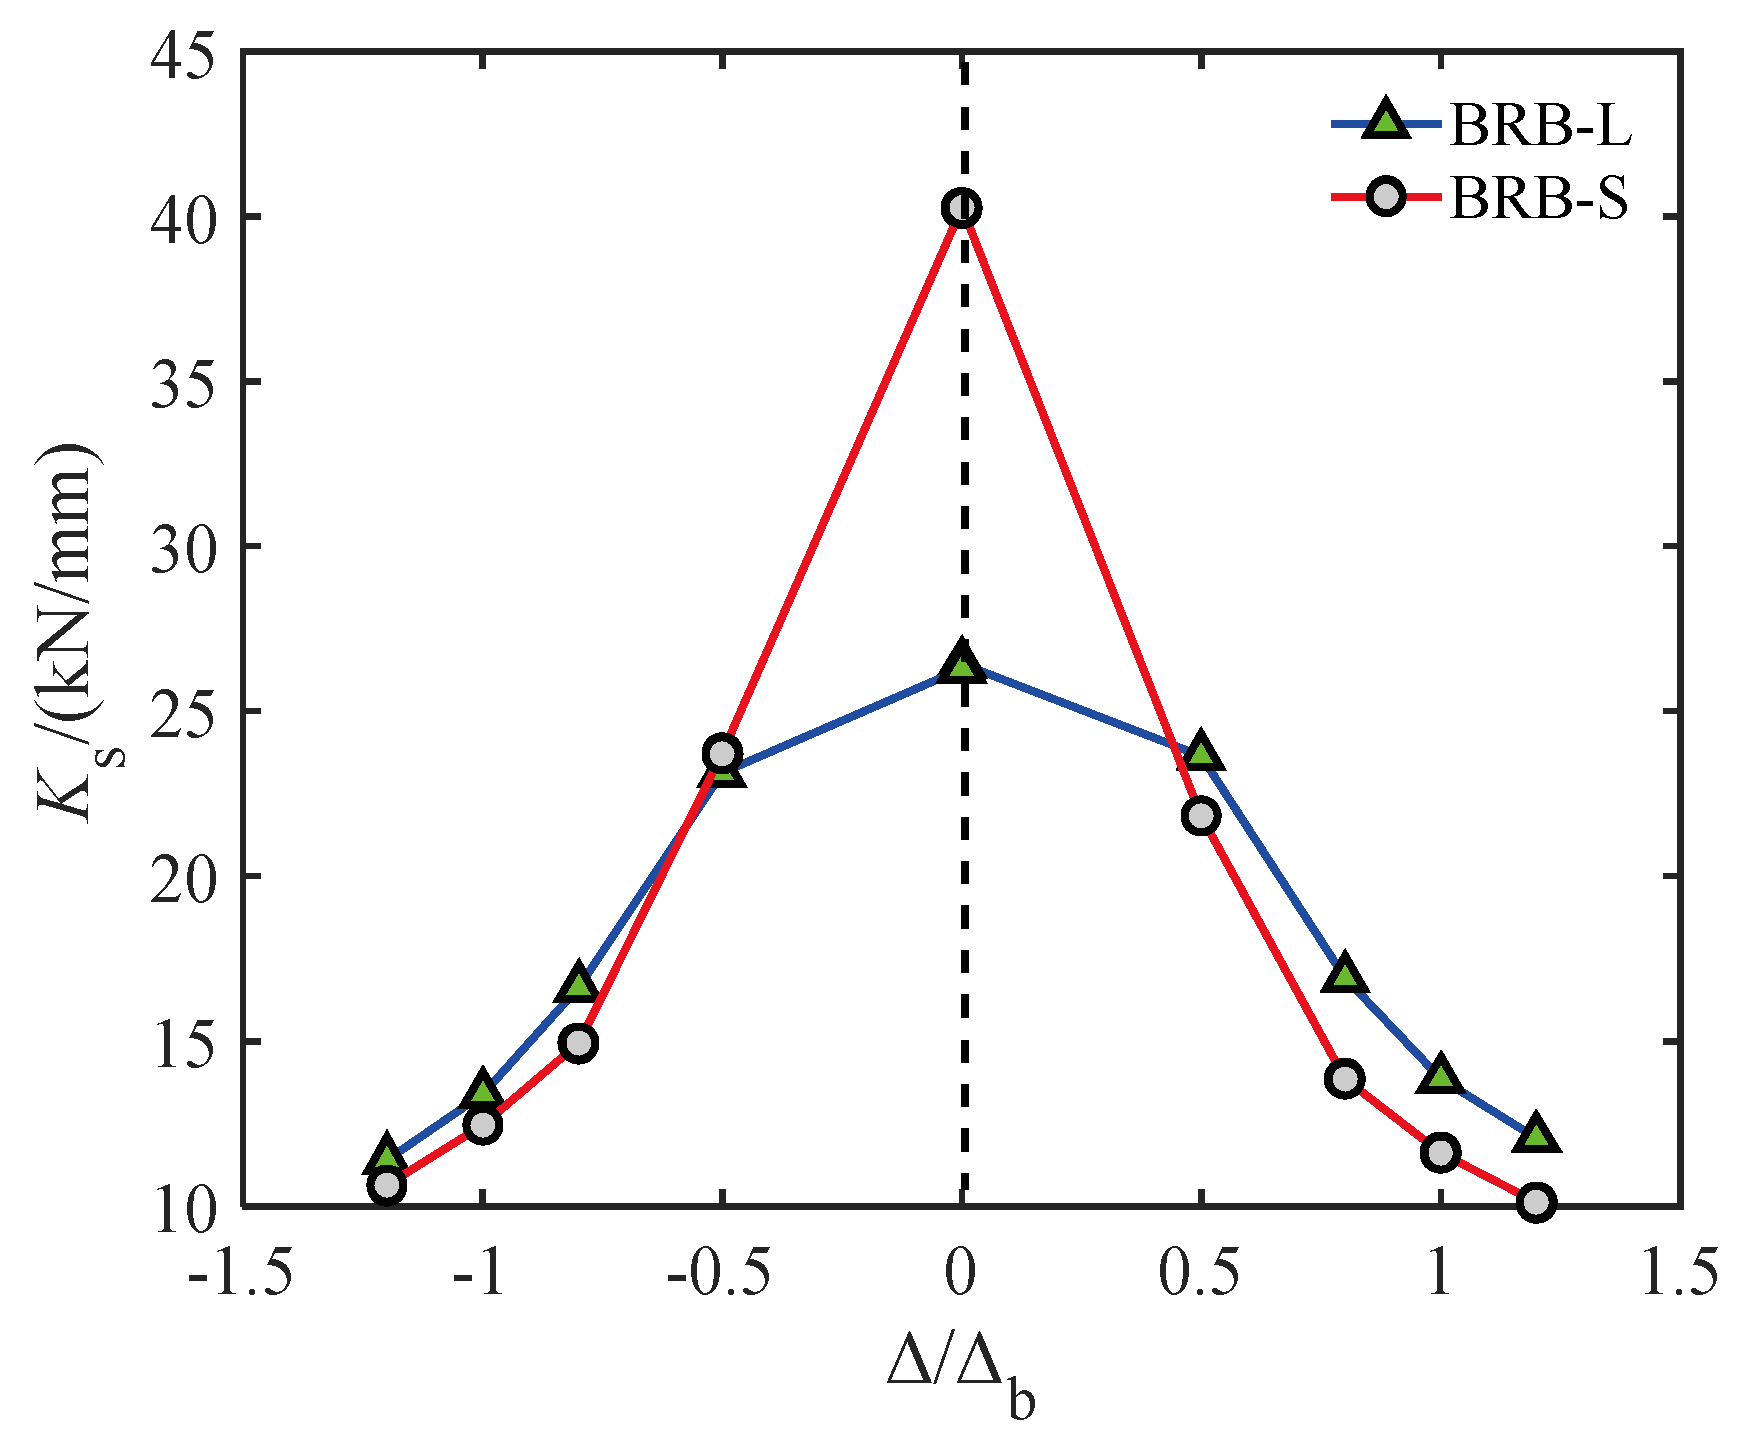
3.5. Equivalent Stiffness
3.6. Cyclic Strengthening Coefficient
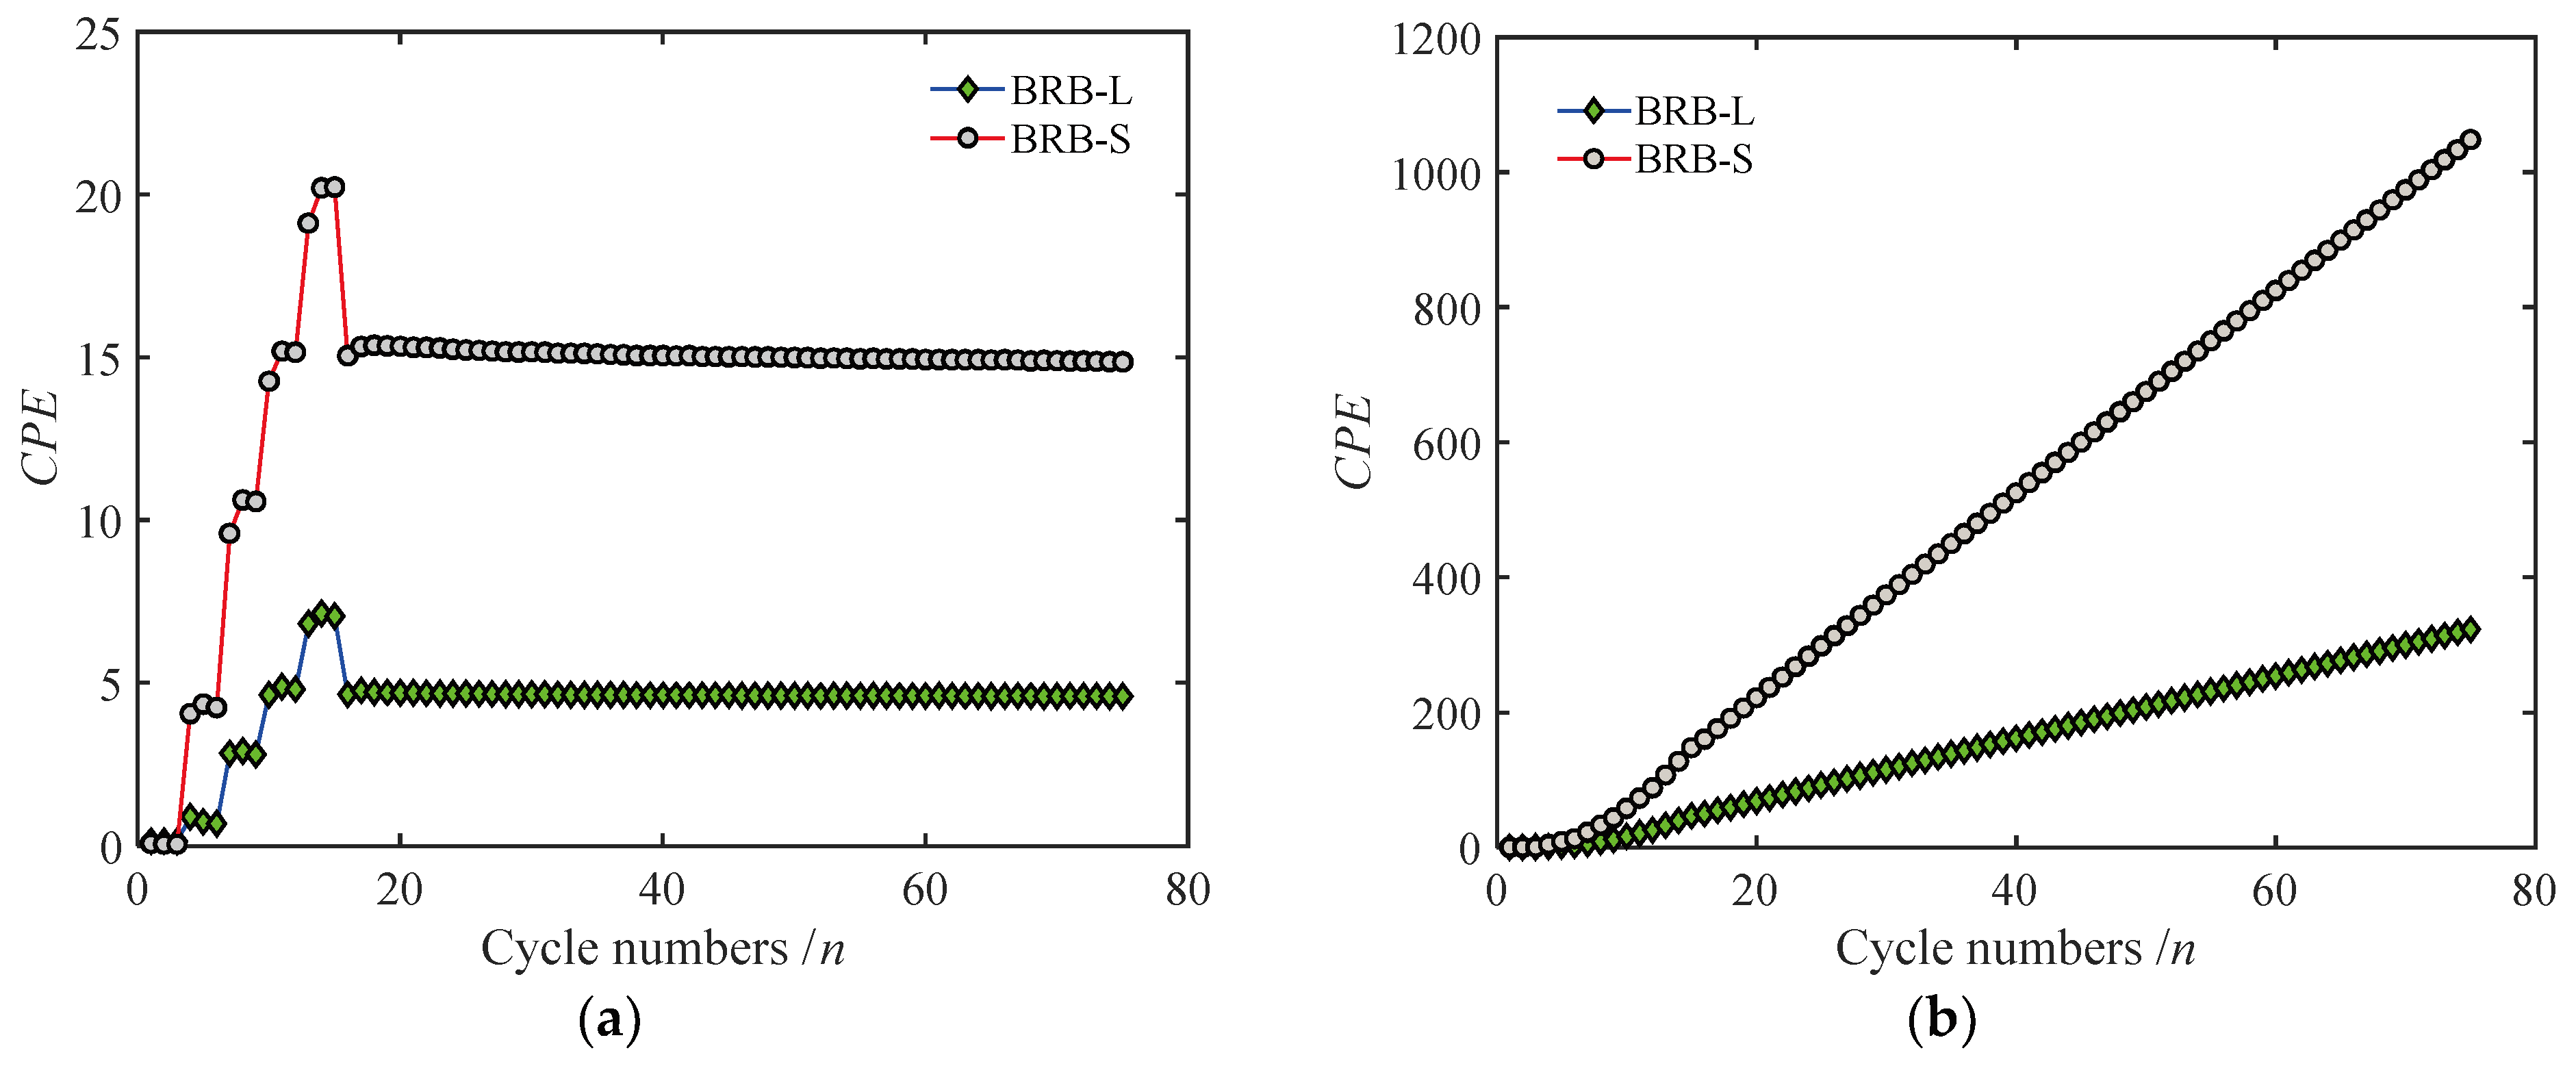
3.7. Cumulative Plastic Deformation Coefficient and Cumulative Hysteretic Energy Dissipation Coefficient
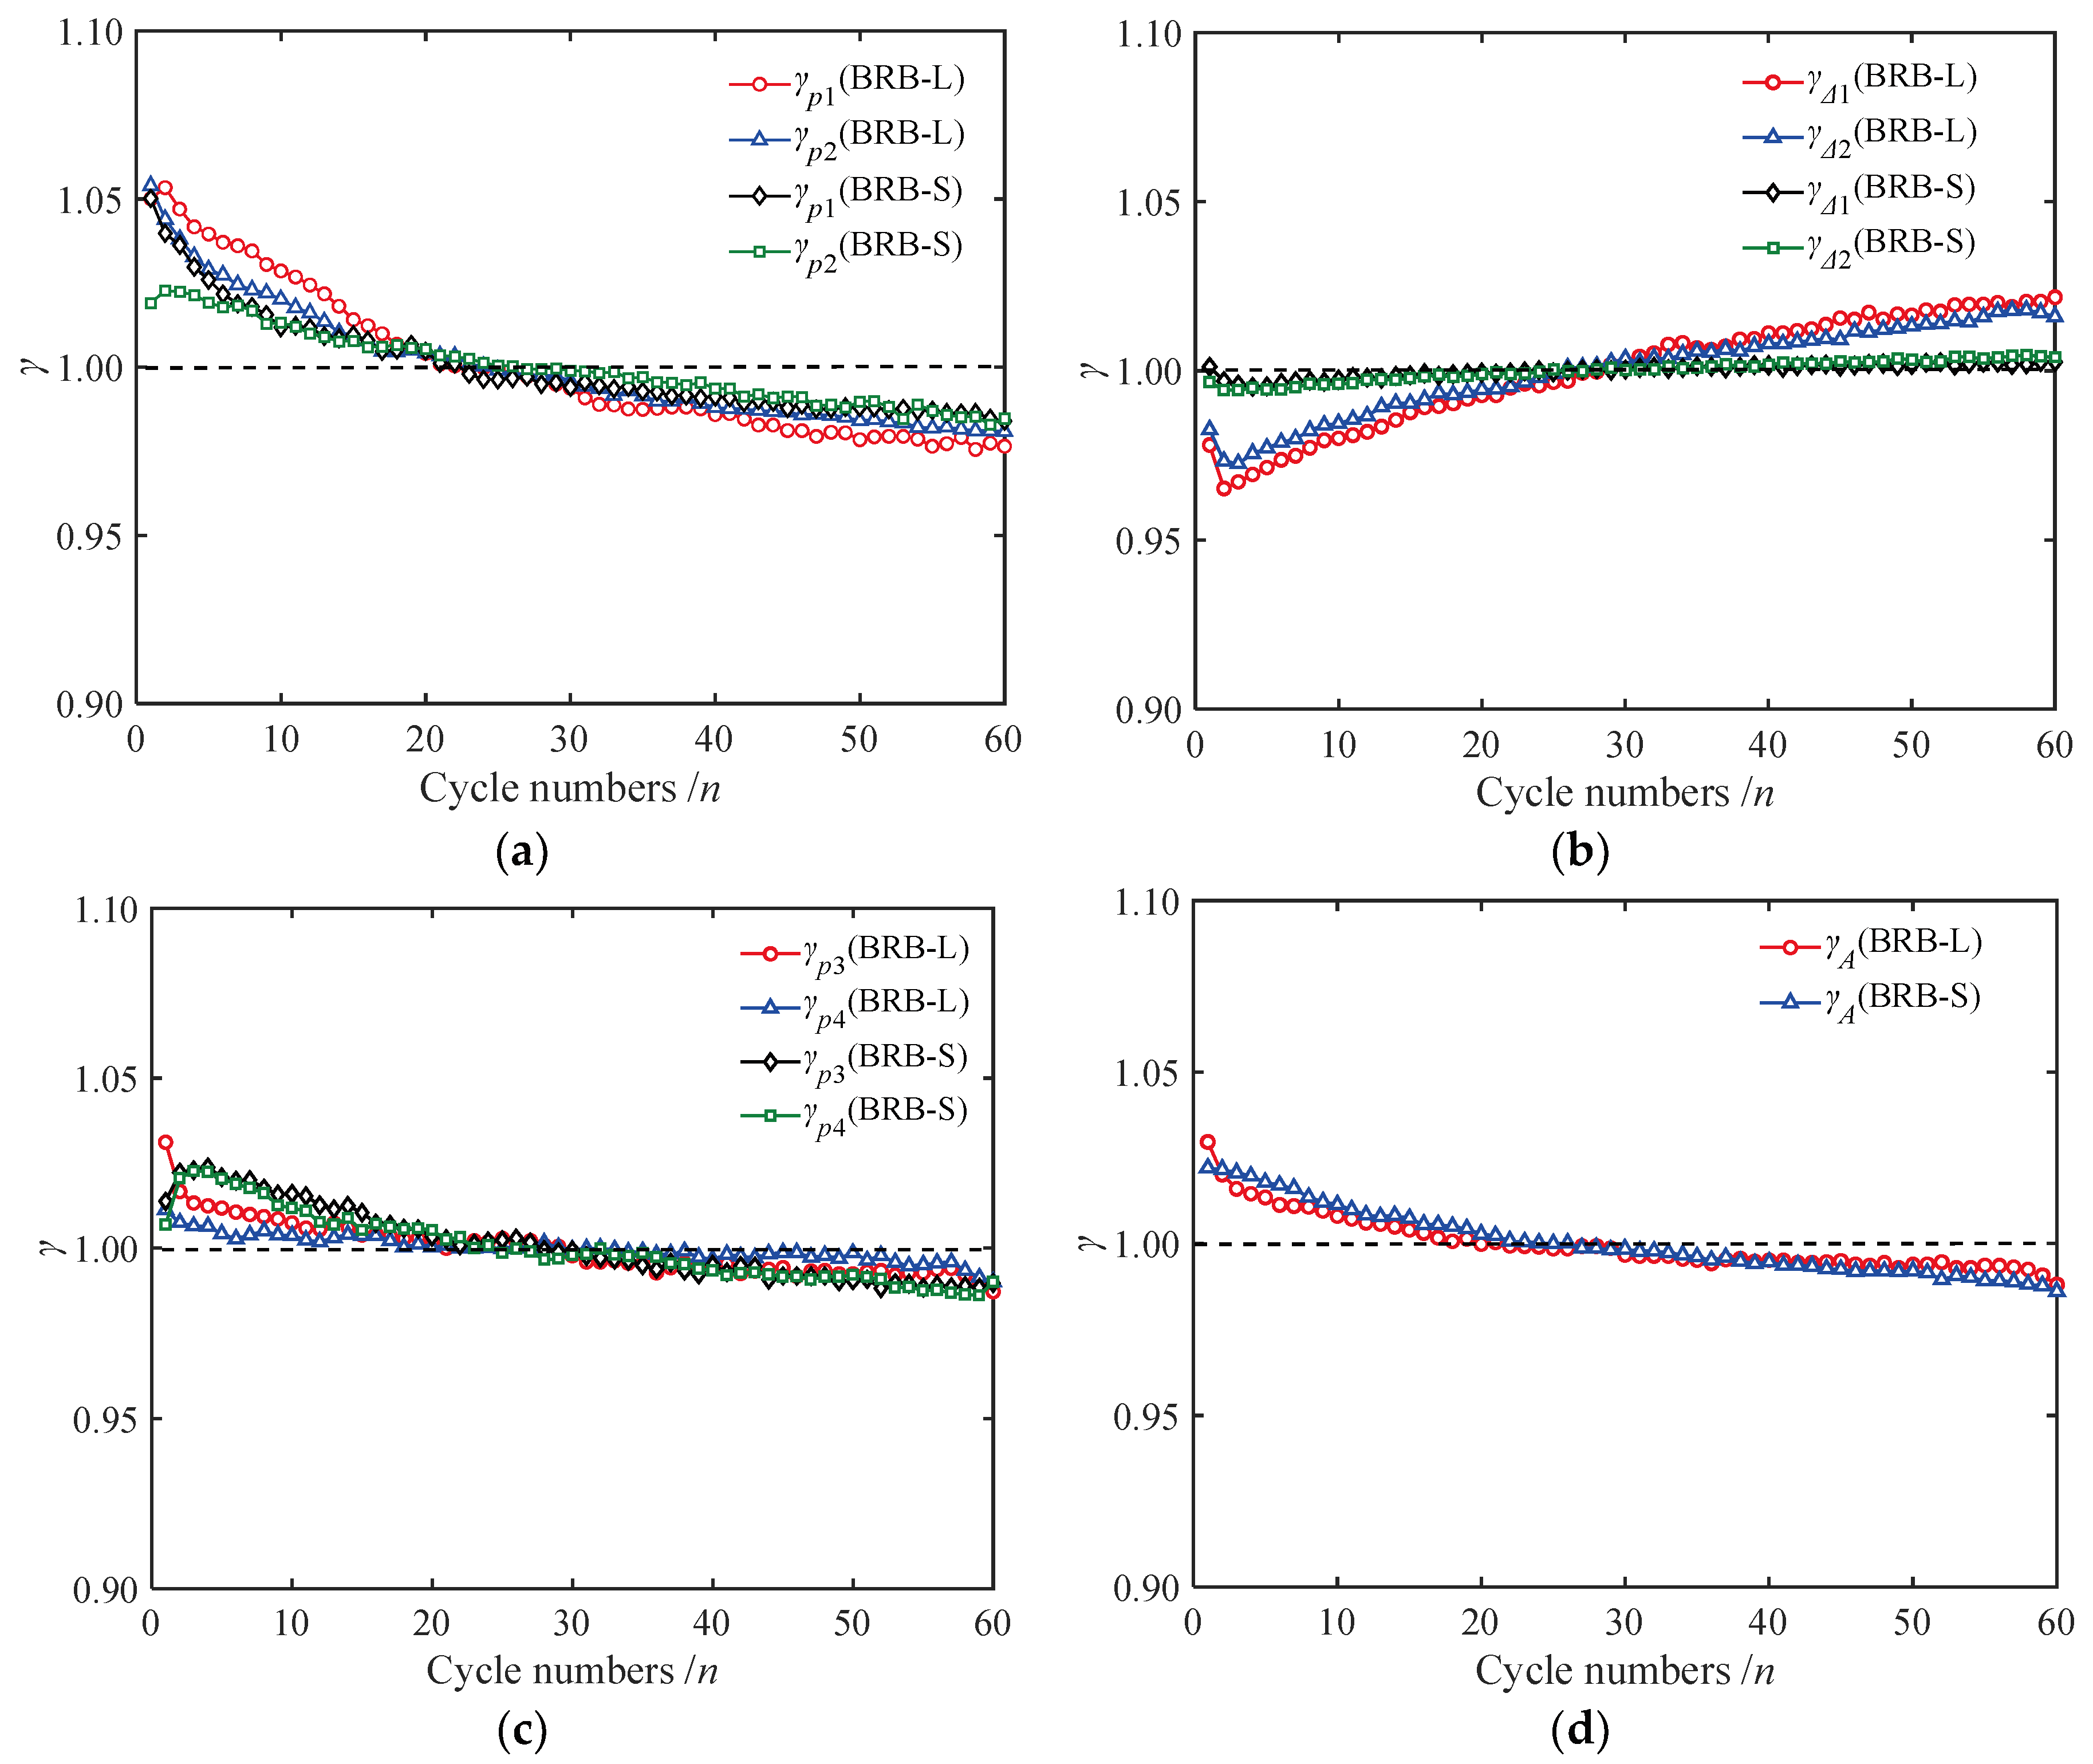
3.8. Low-Cycle Fatigue Performance
4. Conclusions
- (1)
- Both specimens BRB-L and BRB-S exhibited excellent hysteretic energy dissipation capabilities, with the skeleton curves displaying distinct bilinear characteristics. No fracture failure was observed during 60 cycles of fatigue loading. Under cyclic loading based on the design displacement, the equivalent viscous damping ratios, cumulative hysteretic energy dissipation coefficients, and cumulative plastic deformation coefficients for BRB-L and BRB-S were 26% and 39.3%, 323 and 1049, 1891 and 2146, respectively, indicating that BRB-S has a more efficient energy dissipation and damping effect.
- (2)
- The maximum imbalance coefficients of tensile and compressive bearing capacity for BRB-L and BRB-S were 1.068 and 1.003, respectively, with the former being greater than the latter. This suggests that the length of the brace is a significant factor affecting the imbalance coefficient of BRB’s tensile and compressive bearing capacity, and the longer the brace length, the larger this coefficient becomes.
- (3)
- All fatigue performance indicators of specimens BRB-L and BRB-S met the requirements of standard JGJ 297-2013. Under fatigue loading, the maximum and minimum values of parameters γp1, γp2, γp3, γp4, γΔ1, γΔ2, and γA for BRB-L were 1.053 and 0.976, 1.054 and 0.981, 1.031 and 0.987, 1.011 and 0.99, 1.022 and 0.965, 1.018 and 0.973, 1.029 and 0.988, respectively. For BRB-S, the maximum and minimum values were 1.051 and 0.984, 1.023 and 0.983, 1.024 and 0.988, 1.023 and 0.986, 1.003 and 0.995, 1.005 and 0.994, 1.022 and 0.986, respectively. The parameters of BRB-S deviated less from the average values, indicating more stable low-cycle fatigue performance.
- (4)
- Within the same structure, shorter BRB lengths and larger design displacements result in higher energy dissipation efficiency and more effective utilization of energy dissipation capacity.
Author Contributions
Funding
Data Availability Statement
Conflicts of Interest
References
- Iwata, M. Applications-design of Buckling Restrained Braces in Japan. In Proceedings of the 13th World Conference on Earthquake Engineering, Vancouver, BC, Canada, 1–6 August 2004. [Google Scholar]
- Huang, H.; Chen, Z.; Zhao, M.; Wang, B.; Ye, Y. Seismic Performance of Frame with Middle Partially Encased Composite Brace and Steel-Hollow Core Partially Encased Composite Spliced Frame Beam. J. Build. Eng. 2024, 95, 110226. [Google Scholar] [CrossRef]
- Ali, A.; Zhang, C.; Bibi, T.; Sun, L. Experimental Investigation of Sliding-Based Isolation System with Re-Centering Functions for Seismic Protection of Masonry Structures. Structures 2024, 60, 105871. [Google Scholar] [CrossRef]
- Li, W.; Dong, J.; Qu, H.; Wang, L.; Zhao, K. Local Buckling Development of H-Section Steel Core of Buckling-Restrained Brace. Buildings 2022, 12, 227. [Google Scholar] [CrossRef]
- JGJ 297-2013; Chinese Standard, Technical Specification for Seismic Energy Dissipation of Buildings. China Architecture & Building Press: Beijing, China, 2013.
- Zhou, Y.; Shao, H.; Cao, Y.; Lui, E.M. Application of Buckling-Restrained Braces to Earthquake-Resistant Design of Buildings: A Review. Eng. Struct. 2021, 246, 112991. [Google Scholar] [CrossRef]
- Ullah, R.; Vafaei, M.; Alih, S.C.; Waheed, A. A Review of Buckling-Restrained Braced Frames for Seismic Protection of Structures. Phys. Chem. Earth 2022, 128, 103203. [Google Scholar] [CrossRef]
- Pandikkadavath, M.S.; Sahoo, D.R. Analytical Investigation on Cyclic Response of Buckling-restrained Braces with Short Yielding Core Segments. Int. J. Steel Struct. 2016, 16, 1273–1285. [Google Scholar] [CrossRef]
- Pandikkadavath, M.S.; Sahoo, D.R. Cyclic Testing of Short-Length Buckling-Restrained Braces with Detachable Casings. Earthq. Struct. 2016, 10, 699–716. [Google Scholar] [CrossRef]
- Gao, C.; Chen, X.; Wang, X.; Li, G. Analysis of Hysteresis Behavior of Short-Yielding-Section Buckling-Restrained Brace. J. Xi’an Univ. Arch. Technol. Nat. Sci. Ed. 2023, 55, 819–826. [Google Scholar]
- Sitler, B.; Takeuchi, T. Higher-Mode Buckling and Friction in Long and Large Scale Buckling Restrained Braces. Struct. Des. Tall Spec. Build. 2020, 30, e1812. [Google Scholar] [CrossRef]
- Mirtaheri, M.; Gheidi, A.; Zandi, A.P.; Alanjari, P.; Samani, H.R. Experimental Optimization Studies on Steel Core Lengths in Buckling Restrained Braces. J. Constr. Steel Res. 2011, 67, 1244–1253. [Google Scholar] [CrossRef]
- Kazemi, F.; Asgarkhani, N.; Lasowicz, N.; Jankowski, R. Development and Experimental Validation of a Novel Double-Stage Yield Steel Slit Damper-Buckling Restrained Brace. Eng. Struct. 2024, 315, 118427. [Google Scholar] [CrossRef]
- Xiong, C.; Cao, Y.; Wang, T.; Xie, L.; Wu, D. Experimental and Numerical Studies of a Core Plate Repairable Double-Stage Yield Buckling-Restrained Brace. J. Constr. Steel Res. 2024, 223, 109006. [Google Scholar] [CrossRef]
- Sun, J.; Pan, P.; Wang, H. Development and Experimental Validation of an Assembled Steel Double-Stage Yield Buckling Restrained Brace. J. Constr. Steel Res. 2018, 145, 330–340. [Google Scholar] [CrossRef]
- Wu, C.; Zhang, Q.; Gong, C.; Li, D.; Zhang, Y.; Chen, Z. A Double-Stage Buckling Restrained Brace with Progressive Failure Pattern: Experimental Verification and Numerical Calibration. Structures 2024, 62, 106242. [Google Scholar] [CrossRef]
- Guo, Y.L.; Liu, J.B.; Cai, Y.Y.; Deng, K. Energy Dissipation and Buckling-Restrained Braces of Structures. Build. Struct. 2005, 35, 18–23. (In Chinese) [Google Scholar]
- Zhou, Y.; Zhong, G.Q.; Chen, Q.X.; Gong, C. Experimental Study on the Performance of Assembled Buckling-Restrained Braces with Different Steel Plate Structures. China Civ. Eng. J. 2017, 50, 9–17. (In Chinese) [Google Scholar]
- Jia, M.M.; Li, F.H.; Lu, B.B. Experimental Study on Assembled Buckling-Restrained Braces with Carbon Fiber Wrapping Constraint. J. Harbin Inst. Technol. 2016, 48, 98–104. (In Chinese) [Google Scholar]
- Lu, J.K.; Li, Y.Y.; Ding, Y. Experimental Study on Buckling-Restrained Braces with Variable Thickness Steel Plate Inner Core. World Earthq. Eng. 2020, 36, 90–95. (In Chinese) [Google Scholar]
- Wu, A.C.; Lin, P.C.; Tsai, K.C. High-Mode Buckling Responses of Buckling-Restrained Brace Core Plates. Earthq. Eng. Struct. Dyn. 2014, 43, 375–393. [Google Scholar] [CrossRef]
- Fujita, M.; Nakamura, M.; Awazu, K.; Iwata, M. Effects of the Clearance between the Core Plate and Restraining Part on the Structural Performance of the Buckling-Restrained Brace Using Steel Mortar Planks. Steel Constr. 2022, 15, 1–12. [Google Scholar] [CrossRef]
- GB/T 228.1-2010. Chinese Standard, Metallic Materials—Tensile Testing—Part 1: Method of Test at Room Temperature. General Administration of Quality Supervision: Beijing, China, 2010.
- DBJ 53/T-125-2021; Chinese Standard, Technical Specification for Application of Seismic Energy Dissipation in Buildings. Department of Housing and Urban-Rural Development of Yunnan Province: Kunming, China, 2021.
- Dehghani, M.; Tremblay, R. Design and Full-Scale Experimental Evaluation of a Seismically Endurant Steel Buckling-Restrained Brace System. Earthq. Eng. Struct. Dyn. 2018, 47, 105–129. [Google Scholar] [CrossRef]
- Wang, C.L.; Usami, T.; Funayama, J. Improving Low-Cycle Fatigue Performance of High-Performance Buckling-Restrained Braces by Toe-Finished Method. J. Earthq. Eng. 2012, 16, 1248–1268. [Google Scholar] [CrossRef]
- Wu, K.; Tao, Z.; Pan, W.; Bai, Y. A Local Buckling Design Method of All-Steel Buckling-Restrained Brace Considering the Effect of Friction. J. Vib. Shock. 2020, 39, 240–252. [Google Scholar]
- ANSI/AISC 341-16; Seismic Provisions for Structural Steel Buildings. American Institute of Steel Construction (AISC): Chicago, IL, USA, 2016.
- JGJ 99-2015; Chinese Standard, Technical Specification for Steel Structure of Tall Building. China Architecture & Building Press: Beijing, China, 2015.
- Genna, F.; Gelfi, P. Analysis of the Lateral Thrust in Bolted Steel Buckling-Restrained Braces. I Exp. Numer. Results. J. Struct. Eng. 2012, 138, 1231–1243. [Google Scholar]
- Chen, L.; Wang, D.S.; Sun, Z.G.; Qian, H. Experimental Study on the Seismic Performance of Assembled Perforated Stainless Steel Buckling-Restrained Braces. Eng. Mech. 2024, 41, 226–238. (In Chinese) [Google Scholar]
- Lin, P.C.; Tsai, K.C.; Chang, C.A.; Hsiao, Y.; Wu, A. Seismic Design and Testing of Buckling-Restrained Braces with a Thin Profile. Earthq. Eng. Struct. Dyn. 2016, 45, 339–358. [Google Scholar] [CrossRef]
- JGJ/T 101-2015; Chinese Standard, Technical Specification for Seismic Energy Dissipation of Buildings. China Architecture & Building Press: Beijing, China, 2015.
- Yang, Z.; Liu, D.; Zhou, J.; Zhang, L.; Liao, W. Seismic Vulnerability Assessment of the Cliff-Attached Buildings Equipped with Energy Dissipation Devices Under Obliquely Incident Seismic Waves. Buildings. 2024, 14, 3488. [Google Scholar] [CrossRef]
- Yang, L.; Wei, X.; Shi, G.; Xiao, S.Y. Experimental Study on the Energy Dissipation Performance of LY315 Steel Buckling-Restrained Braces. Eng. Mech. 2019, 36, 200–206. (In Chinese) [Google Scholar]
- Wang, M.; Tong, Y. Experimental study on seismic performance of assembled buckling-restrained brace with low yield point steel. Thin-Walled Struct. 2024, 205, 112474. [Google Scholar] [CrossRef]


| Specimen Number | Total Length of Brace lb/mm | Internal Structural Composition | Gap c/mm | Peripheral Constraint Segment | ||||||||
|---|---|---|---|---|---|---|---|---|---|---|---|---|
| Energy Dissipation Segment | Transition Segment | Connection Segment | Steel Casing | Concrete | ||||||||
| lc/mm | bc/mm | tc/mm | Ac/mm2 | lt/mm | ll/mm | Al/mm2 | tr/mm | lr/mm | fc/MPa | |||
| BRB-L | 8500 | 6110 | 55 | 10 | 550 | 425 | 770 | 1660 | 1.5 | 6 | 8200 | 11.9 |
| BRB-S | 3000 | 1648 | 55 | 10 | 550 | 150 | 526 | 1660 | 1.5 | 2 | 2700 | 11.9 |
| Material | Yield Strength fy/MPa | Tensile Strength fu/MPa | Elastic Modulus Es/GPa | Elongation Rate A/% |
|---|---|---|---|---|
| Q235 | 269 | 371 | 209.45 | 31.52 |
| Load Control Mode | Loading Level | Load Amplitude F/Fy | The Number of Cycles/n |
|---|---|---|---|
| Force control | 1 | 0.5 | 3 |
| Displacement control | Loading level | Displacement amplitudeΔ/Δb | The number of cycles/n |
| 2 | 0.5 | 3 | |
| 3 | 0.8 | 3 | |
| 4 | 1.0 | 3 | |
| 5 | 1.2 | 3 | |
| 6 | 1.0 | 60 |
| Sample Number | Amplitude of Load Displacement | |||||||||||
|---|---|---|---|---|---|---|---|---|---|---|---|---|
| 0.5Δb | 0.8Δb | 1.0Δb | 1.2Δb | |||||||||
| First Cycle | Second Cycle | Third Cycle | First Cycle | Second Cycle | Third Cycle | First Cycle | Second Cycle | Third Cycle | First Cycle | Second Cycle | Third Cycle | |
| BRB-L | 855 | 694 | 642 | 2819 | 2758 | 2657 | 4628 | 4642 | 4566 | 6798 | 6787 | 6710 |
| BRB-S | 1160 | 1152 | 1125 | 2837 | 2823 | 2807 | 4124 | 4043 | 4029 | 5448 | 5385 | 5384 |
Disclaimer/Publisher’s Note: The statements, opinions and data contained in all publications are solely those of the individual author(s) and contributor(s) and not of MDPI and/or the editor(s). MDPI and/or the editor(s) disclaim responsibility for any injury to people or property resulting from any ideas, methods, instructions or products referred to in the content. |
© 2025 by the authors. Licensee MDPI, Basel, Switzerland. This article is an open access article distributed under the terms and conditions of the Creative Commons Attribution (CC BY) license (https://creativecommons.org/licenses/by/4.0/).
Share and Cite
Wu, K.; Wei, G.; Lin, C.; Zhang, L.; Yu, W.; Lan, X. Experimental Study on the Seismic Performance of Buckling-Restrained Braces with Different Lengths. Buildings 2025, 15, 154. https://doi.org/10.3390/buildings15020154
Wu K, Wei G, Lin C, Zhang L, Yu W, Lan X. Experimental Study on the Seismic Performance of Buckling-Restrained Braces with Different Lengths. Buildings. 2025; 15(2):154. https://doi.org/10.3390/buildings15020154
Chicago/Turabian StyleWu, Kechuan, Guanglan Wei, Chi Lin, Longfei Zhang, Wenzheng Yu, and Xiang Lan. 2025. "Experimental Study on the Seismic Performance of Buckling-Restrained Braces with Different Lengths" Buildings 15, no. 2: 154. https://doi.org/10.3390/buildings15020154
APA StyleWu, K., Wei, G., Lin, C., Zhang, L., Yu, W., & Lan, X. (2025). Experimental Study on the Seismic Performance of Buckling-Restrained Braces with Different Lengths. Buildings, 15(2), 154. https://doi.org/10.3390/buildings15020154