Article

Research on the Optimization Design of Natural Ventilation in University Dormitories Based on the Healthy Building Concept: A Case Study of Xuzhou Region

School of Architecture and Design, China University of Mining and Technology, Xuzhou 221116, China
*
Author to whom correspondence should be addressed.
Buildings 2025, 15(19), 3630; https://doi.org/10.3390/buildings15193630
Submission received: 6 September 2025 / Revised: 30 September 2025 / Accepted: 4 October 2025 / Published: 9 October 2025
(This article belongs to the Section Building Energy, Physics, Environment, and Systems)

Abstract

As the core space for students’ daily living and learning, the quality of the indoor wind environment and air quality in dormitory buildings is particularly critical. However, existing studies often neglect natural ventilation optimization under local climatic conditions and the multidimensional evaluation of health benefits, leaving notable gaps in dormitory design. Under the Healthy China Initiative, the indoor wind environment in university dormitories directly impacts students’ health and learning efficiency. This study selects dormitory buildings in Xuzhou as the research object and employs ANSYS FLUENT 2020 software for computational fluid dynamics (CFD) simulations, combined with orthogonal experimental design methods, to systematically investigate and optimize the indoor wind environment with a focus on healthy ventilation standards. The evaluation focused on three key metrics—comfortable wind speed ratio, air age, and CO2 concentration—considering the effects of building orientation, corridor width, and window geometry, and identifying the optimal parameter combination. After optimization based on the orthogonal experimental design, the proportion of comfortable wind speed zones increased to 44.6%, the mean air age decreased to 258 s, and CO2 concentration stabilized at 613 ppm. These results demonstrate that the proposed optimization framework can effectively enhance indoor air renewal and pollutant removal, thereby improving both air quality and the health-related performance of dormitory spaces. The novelty of this study lies in integrating regional climate conditions with a coordinated CFD–orthogonal design approach. This enables precise optimization of dormitory ventilation performance and provides locally tailored, actionable evidence for advancing healthy campus design.

1. Introduction

Health is essential to individual development and socio-economic progress. Since people now spend 80–90% of their time indoors [1], indoor environmental quality exerts a profound influence on human health [2]. Against this backdrop, the concept of healthy buildings has emerged. Specifically, research on healthy buildings mainly focuses on four environmental elements: wind environment, light environment, acoustic environment, and thermal environment [3,4]. Together, these elements form a critical indicator system that affects the health performance of buildings.
With the continuous expansion of university enrollment, dormitory capacity has been correspondingly increased [5], and the quality of the indoor wind environment directly affects students’ comfort, health, and learning efficiency [6]. Numerous studies have shown that inadequate indoor ventilation is the root cause of many health risks [7]. In this context, current research on indoor wind environments mainly revolves around three aspects: natural ventilation simulation, CO2 concentration monitoring, and air pollution control strategies [8,9,10]. However, research on dormitories in Chinese universities—characterized by high residential density, extended usage periods, and distinctive patterns of occupant activities—remains limited. Previous applications of orthogonal design in building studies have primarily focused on energy consumption and thermal comfort [11,12,13,14,15], with insufficient attention to the synergistic optimization of wind environment and indoor air quality, making it difficult to simultaneously meet the dual requirements of “ventilation efficiency” and “health protection”.
This study examines university dormitories in Xuzhou using software simulation, field measurements, and orthogonal experimental design to evaluate how building orientation, window operation modes, and planar layouts affect the indoor wind environment, and proposes targeted retrofit strategies. By introducing a health performance evaluation perspective and coupling wind speed, air age, and CO2 concentration, the study fills the gap in coordinated optimization from micro-scale airflow to indoor air quality, providing an important basis for dormitory design that balances ventilation efficiency with health and comfort.

Literature Review

Numerous studies have examined the effects of building layout, window types, and dimensions on the indoor wind environment, thereby providing theoretical support for architectural design (Table 1).
Regarding building layout, Cheng et al. investigated the influence of room planar location on ventilation efficiency from a macro-morphological perspective [16]. Similarly, Shi et al. examined the optimization of hospital outpatient building layouts by adjusting the relative position of ventilation openings and the roughness of public space interfaces, and found that appropriate natural ventilation strategies could reduce infection risk by about 5% [17]. Aflaki et al. reported that under single-sided ventilation, although building orientation and floor height significantly affected indoor temperature, humidity, and airflow, a reasonable interior spatial layout could partly offset the disadvantages of orientation and thereby improve indoor thermal conditions [18]. This indicates that interior spatial layout plays an important role in influencing natural ventilation. However, dormitory buildings are mostly designed with corridor-type layouts, resulting in relatively uniform and fixed spatial configurations. In unrenovated buildings, the corridor typically serves as both a communal area and a pathway for air recirculation. Such planar constraints make the optimization of natural ventilation more dependent on the coordination of local geometries and openings.
As for window types and dimensions, Fallahpour et al. found that the ventilation type and specific dimensions of windows have a fundamental impact on the indoor wind environment [19]. Many other studies have similarly confirmed that window type and size are critical design parameters influencing indoor wind environments. The type of window determines its opening mode and ventilation characteristics, while the size of the window is directly related to the ventilation area and airflow volume [19,20,21,22]. However, most existing research has focused on the influence of external windows on ventilation, with insufficient attention given to dormitory buildings limited to single-sided ventilation. For such buildings, this study considers both internal windows (high windows set in corridor walls) and external windows as an integrated ventilation system, and explores their synergistic effects on the indoor wind environment. Natural ventilation, which operates without mechanical assistance, represents the predominant ventilation strategy in university dormitories due to its energy efficiency and low cost. From the perspective of airflow organization, two modes can be distinguished: single-sided and cross ventilation. Single-sided ventilation is restricted by building layout, relying on openings on one façade, which often results in short airflow paths, stagnant zones, and localized CO2 accumulation. In contrast, cross ventilation exploits the pressure differential across two façades, leading to markedly higher efficiency. Studies have shown that single-sided ventilation achieves only about 1/18 of the efficiency of cross ventilation [23] and performs poorly in providing thermal comfort [24]. Omrani et al. reported that cross ventilation maintained indoor comfort for over 70% of the time in a high-rise case, compared with only about 1% for single-sided ventilation [25]. Park et al. further demonstrated that cross ventilation more effectively diluted indoor pollutants and reduced infection risks to very low levels when window opening exceeded 15%, while single-sided ventilation showed a sharp increase in risk with prolonged exposure [26]. In summary, cross ventilation proves markedly superior in airflow efficiency, pollutant dilution, and health protection, making it the preferred natural ventilation strategy for dormitories.
The building wind environment directly affects key indoor indicators such as the number of air changes per hour and pollutant concentrations. Khatoon and Shah used ANSYS FLUENT to evaluate ventilation performance and CO distribution in underground car parks. Their simulations under different garage heights and occupancy levels showed that the required ventilation rate to maintain CO concentrations within 25 ppm and 35 ppm increased significantly with garage height and vehicle numbers [27]. Kalua et al. analyzing sandstorm events in Saudi Arabia, applied ANSYS FLUENT to compare four ventilation strategies for PM dispersion and recommended ceiling-mounted ducts and outlets, which minimized particle trajectories in the breathing zone [13]. Tikul et al. investigated natural ventilation and PM2.5 control in classrooms, using ANSYS FLUENT to assess PM2.5 concentration, airflow velocity, and turbulence intensity under different outdoor-to-air ratios and furniture layouts. Results revealed that an outdoor-to-air ratio of 0.25 with U-shaped furniture reduced PM2.5 by 32% and improved airflow uniformity by 28% compared with a ratio of 1.0 and conventional layouts [28]. Poshtiri and Mohabbati examined window aperture, wind speed, and wind catchers using ANSYS FLUENT 6.3 and MATLAB. They found that ventilation rate increased with window aperture size until 0.32, beyond which it stabilized, while window aperture and wind speed jointly affected thermal comfort and cooling demand [29].
Table 1. Summary of influencing factors and research methods on indoor wind environment.
Design ParametersWind Environment IndicatorsResearch MethodsReferences
Window-to-wall ratio (WWR) and window wind catcher (WWC)Ventilation efficiency, airflow organization and patterns, CO2 concentrationCFD simulation[30]
Orientation and number of floorsIndoor-outdoor pressure difference, turbulence effects and pollutant concentrationWind tunnel experiment and CFD simulation[31]
Building geometry, window geometry, and wind angleVentilation efficiency and indoor air velocityWind tunnel experiment[32]
Room geometry, window geometry, occupant positionIndoor air velocity, SF6 concentration and air changes per hourCFD simulation[19]
Building form and layout, window type and opening control, wind direction and wind angleVentilation efficiency, Air age and indoor air velocityCFD simulation[16]
Building form and layout, orientation, window opening stateIndoor air velocityCFD simulation[33]
Window position, orientation, window opening size and typeIndoor air velocityCFD simulation[21]
Window opening behavior, orientation, window position and building envelopeAir changes per hour, Ventilation rate per person and CO2 concentrationField measurement[34]
Building type, window opening behavior and orientationVentilation efficiency, Air changes per hour and CO2 concentrationField measurement[35]
Window opening area and per capita spaceVentilation efficiency and CO2 concentrationField measurement and mathematical model[22]
Window type and window orientationAir changes per hourField measurement and CFD simulation[36]

2. Materials and Methods

2.1. Research Methodology

In order to explore the optimization strategies for the wind environment of university dormitories in the Xuzhou region, this study first conducted a systematic review of local climatic characteristics and relevant academic research through the literature review method. Subsequently, on-site investigations and questionnaire surveys were conducted to comprehensively examine the spatial form and layout of dormitories in the region. On this basis, field measurements were carried out in typical dormitories using PM2.5 and CO2 recorders, anemometers, and other instruments to reveal the current situation and causes of the wind environment and indoor air quality.
A numerical model was developed in FLUENT to simulate the indoor wind environment and air quality, providing an efficient means to evaluate the feasibility of different retrofit schemes. Finally, the orthogonal experimental design method was applied to analyze multi-factor interactions, identify key design parameters, and determine the optimal ventilation design combination.

2.2. Case Overview

The “Dormitory Building No. 4” at the Wenchang Campus of China University of Mining and Technology was identified, based on a survey of university dormitories in the Xuzhou region, as a typical case and was therefore selected as the field measurement object for this study. The dormitory building is a six-story reinforced concrete frame structure with a total height of 21.6 m. The building is free of external obstructions, and each dormitory room is equipped with an air conditioner. Each room has dimensions of 3600 mm (width) × 8400 mm (depth). The specific location of the dormitories within the building is shown in Figure 1.

2.3. Field Measurement Scheme

Two opposite dormitory rooms (316 north-facing and 317 south-facing) on the third floor of Dormitory Building No. 4 at the Wenchang Campus of China University of Mining and Technology were selected, each accommodating four students. All measuring instruments in this field test were set to record data every five minutes to ensure data continuity and accuracy. When arranging indoor and outdoor measurement points, open and ventilated locations were selected to minimize potential interference from obstacles and direct solar radiation. Meanwhile, to avoid disturbing students’ daily routines, the instruments were placed as close as possible to the center of the room at a height of 1.2 m above the floor. The detailed layout of the measurement points is illustrated in Figure 2. The field measurements were conducted continuously for seven days, from 00:00 on 23 June 2023, to 00:00 on 30 June 2023. During the testing period, students carried out normal daily activities, while the opening conditions of doors, windows, and curtains were determined by their living habits. Photographs of the measurement process are provided in Figure 3.
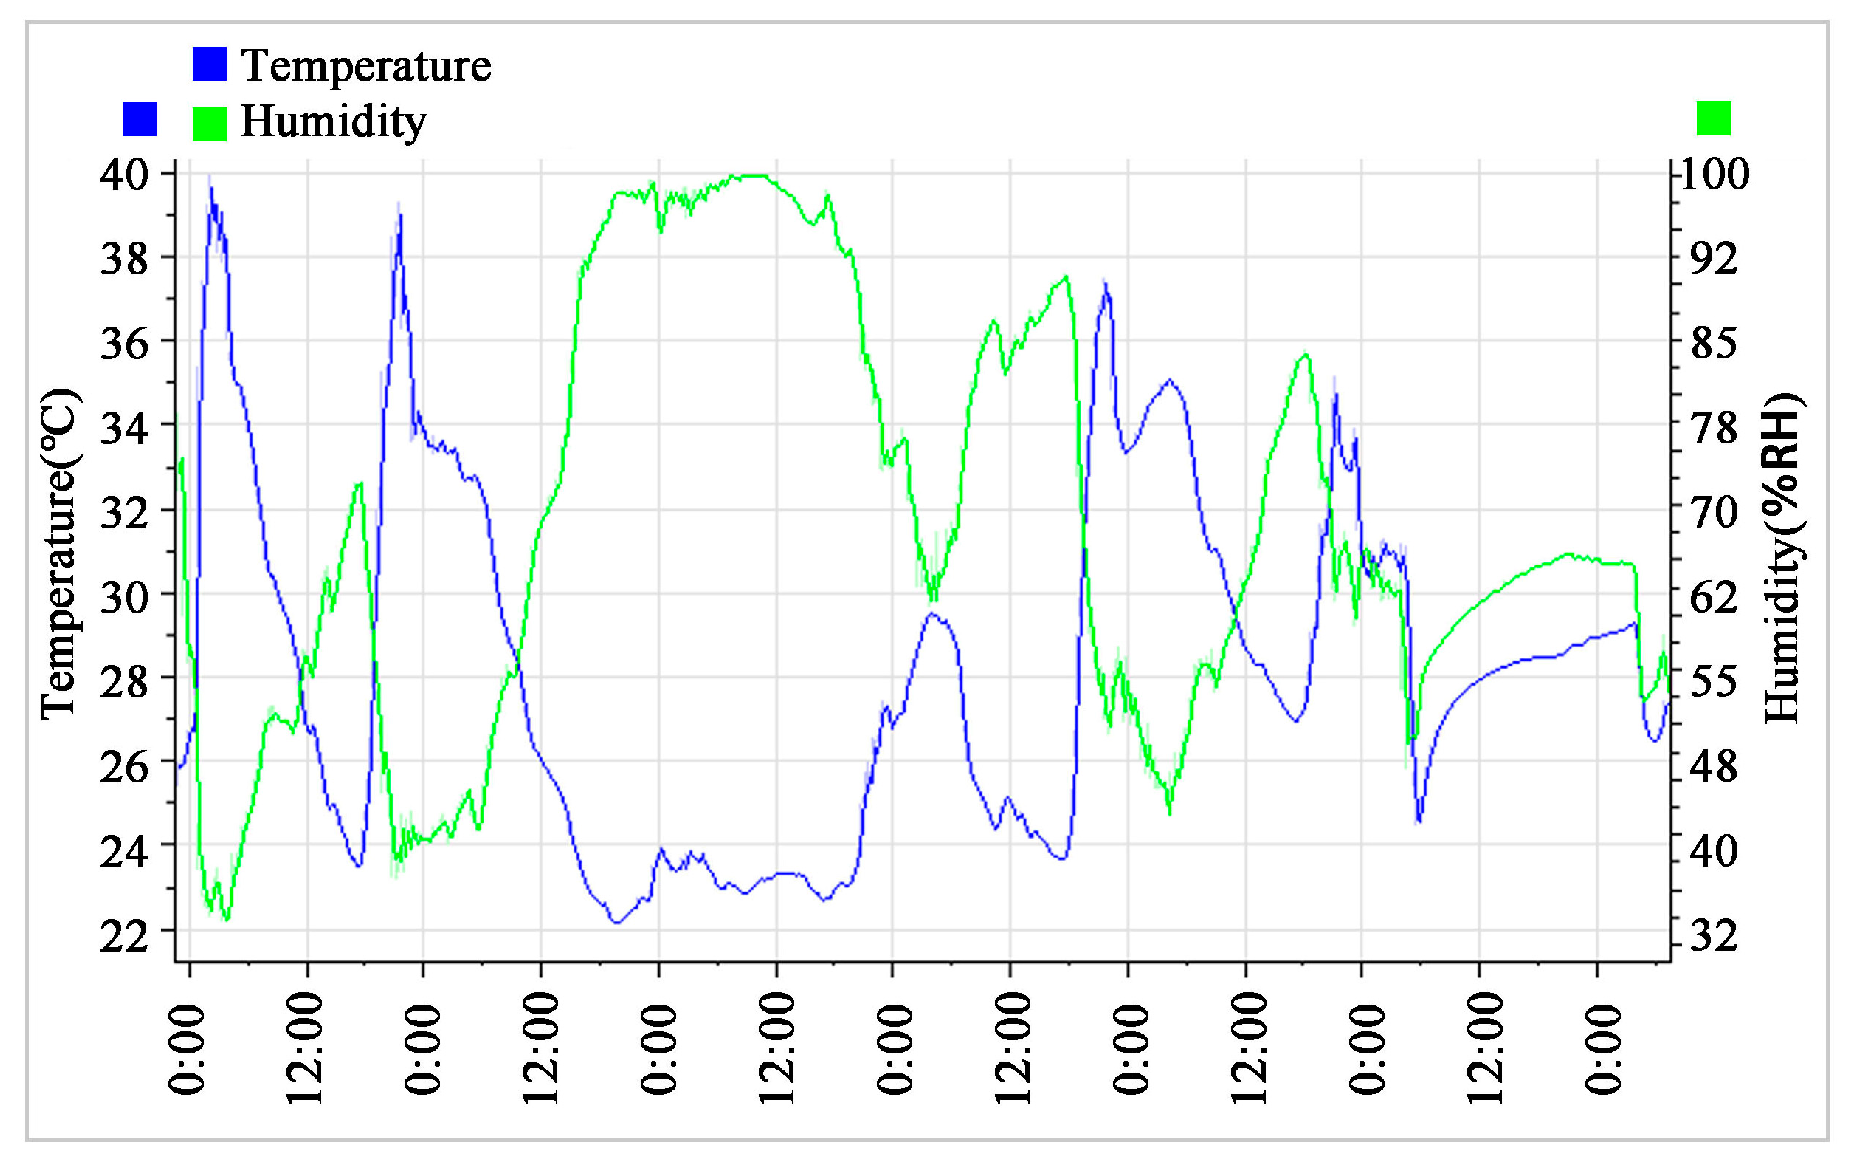
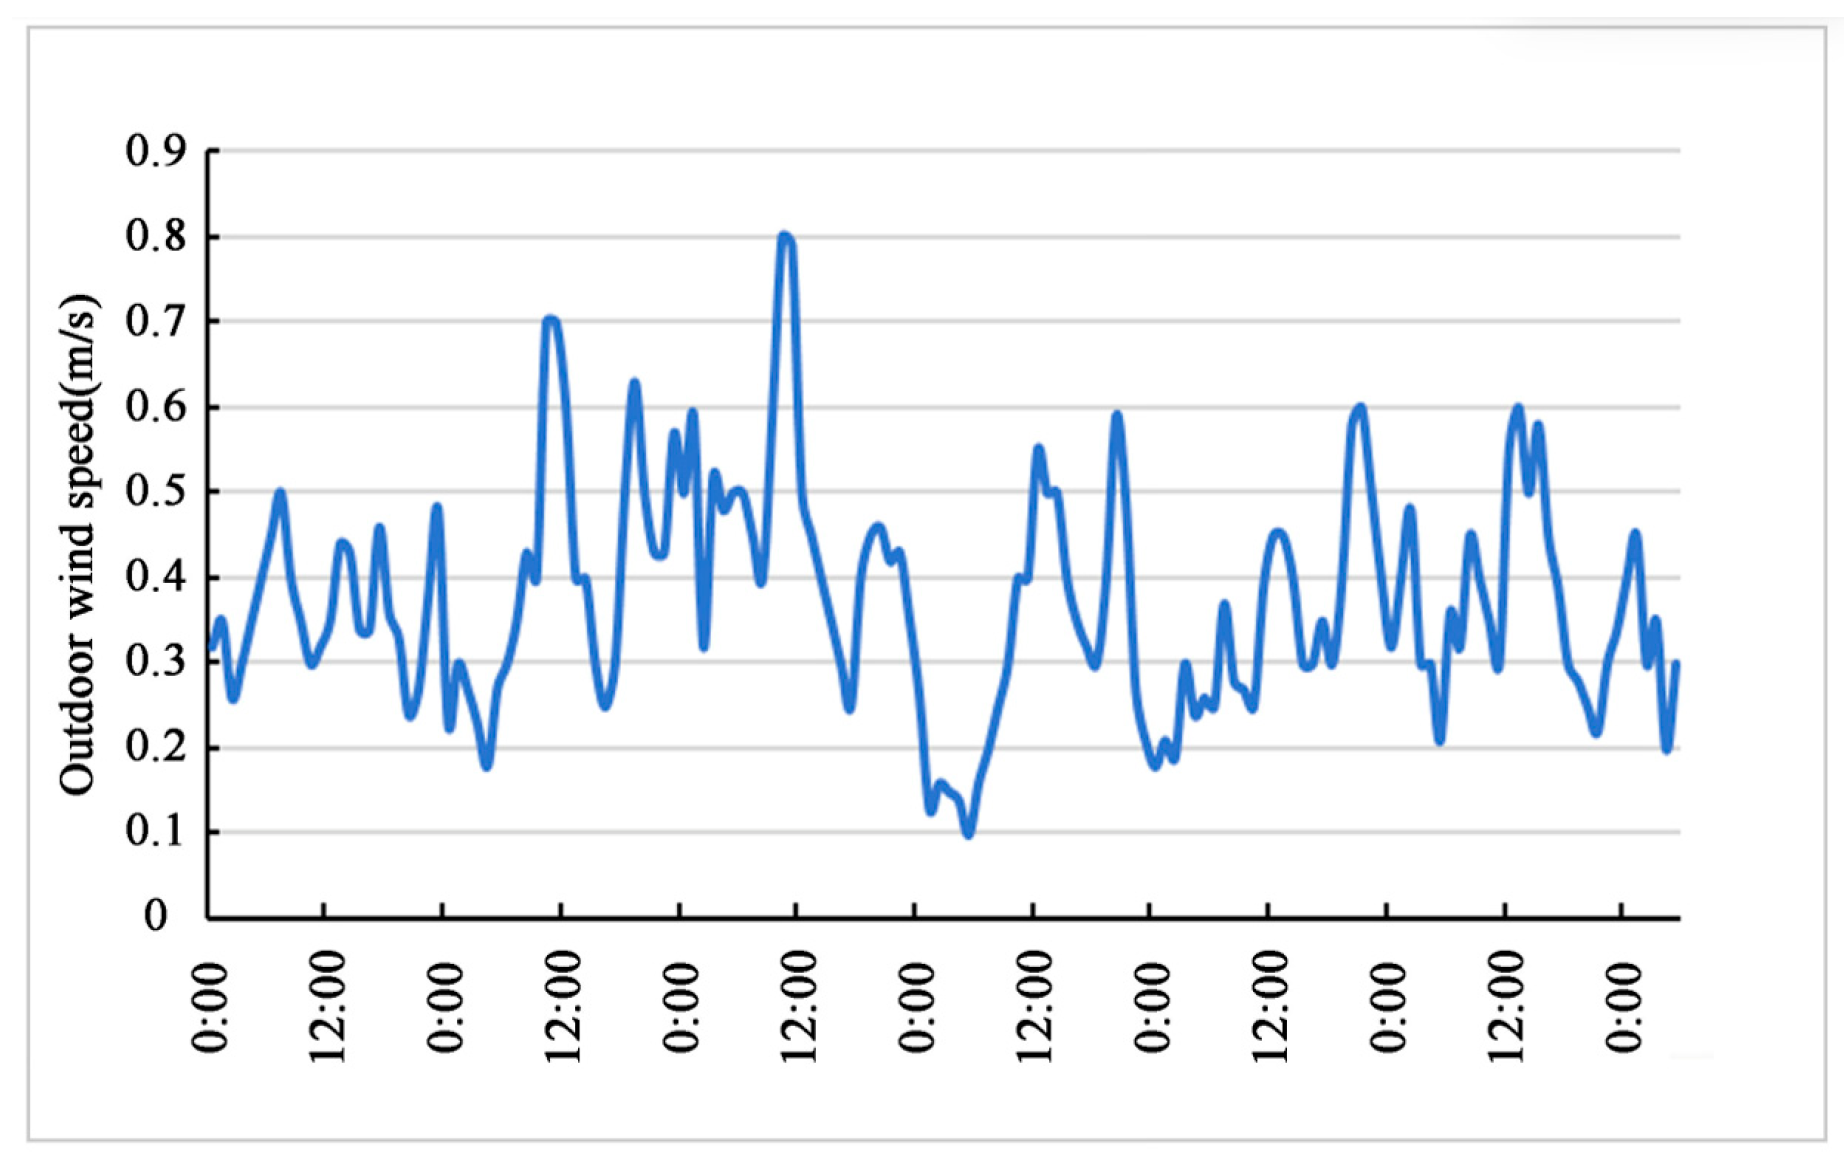
The results of outdoor temperature, humidity, and wind speed are shown in Figure 4 and Figure 5. The measured daily average temperature was 33.7 °C, with a maximum of 40 °C, and the average relative humidity was 64.5%. Temperature rose from midnight, peaked at noon, and then declined. Outdoor wind speed was higher in the morning, providing better natural ventilation; however, overall remained below 1 m/s, indicating limited ventilation potential and the need for optimized design strategies to improve indoor air quality.
The field measurements revealed that the wind speed in the dormitory building ranged from 0.07 m/s to 0.2 m/s. The CO2 concentration was influenced by changes in occupancy and student activities, showing an increase after 5:00 p.m. and a lower level during daytime class hours. The CO2 concentration in the north-facing dormitories was higher than that in the south-facing ones, with both exceeding 1000 ppm. Long-term exposure to such elevated levels may have adverse effects on students’ health. In contrast, the concentrations of PM2.5 and formaldehyde were found to meet the evaluation standards. As this study focuses on the indoor wind environment and air quality in dormitories, indoor temperature and humidity were not included as measurement parameters; their influence on airflow distribution and pollutant dilution is limited and more relevant to thermal comfort evaluation.

2.4. Evaluation Criteria for Wind Environment

Based on the above-mentioned evaluation indicators and the seasonal climatic characteristics of Xuzhou, this study evaluates the indoor wind environment of university dormitories in summer. The ventilation demand was evaluated with a focus on three key indicators: wind speed, air age, and CO2 concentration.
Table 2 presents the effects of wind speed on human activities. The ratio of the indoor comfort wind speed area is defined as the proportion of the dormitory floor area where wind speed falls within the comfort range of 0.25–0.8 m/s. Unlike the conventional comfort range of 0.25–0.5 m/s, the present study extends the upper limit to 0.8 m/s in order to better capture the increased demand for airflow under hot summer conditions, thereby more accurately reflecting actual thermal comfort requirements. A higher ratio indicates a better indoor wind environment in terms of comfort. Predicted Mean Vote (PMV) is an indicator widely used for evaluating indoor thermal comfort, which can be divided into seven levels, as shown in Table 3. Air age, as a critical parameter for assessing room ventilation effectiveness, directly reflects the improvement of ventilation conditions when its value decreases, as summarized in Table 4.

2.5. Simulation of University Dormitory Buildings in Xuzhou

2.5.1. Establishment and Simplification of the Physical Model

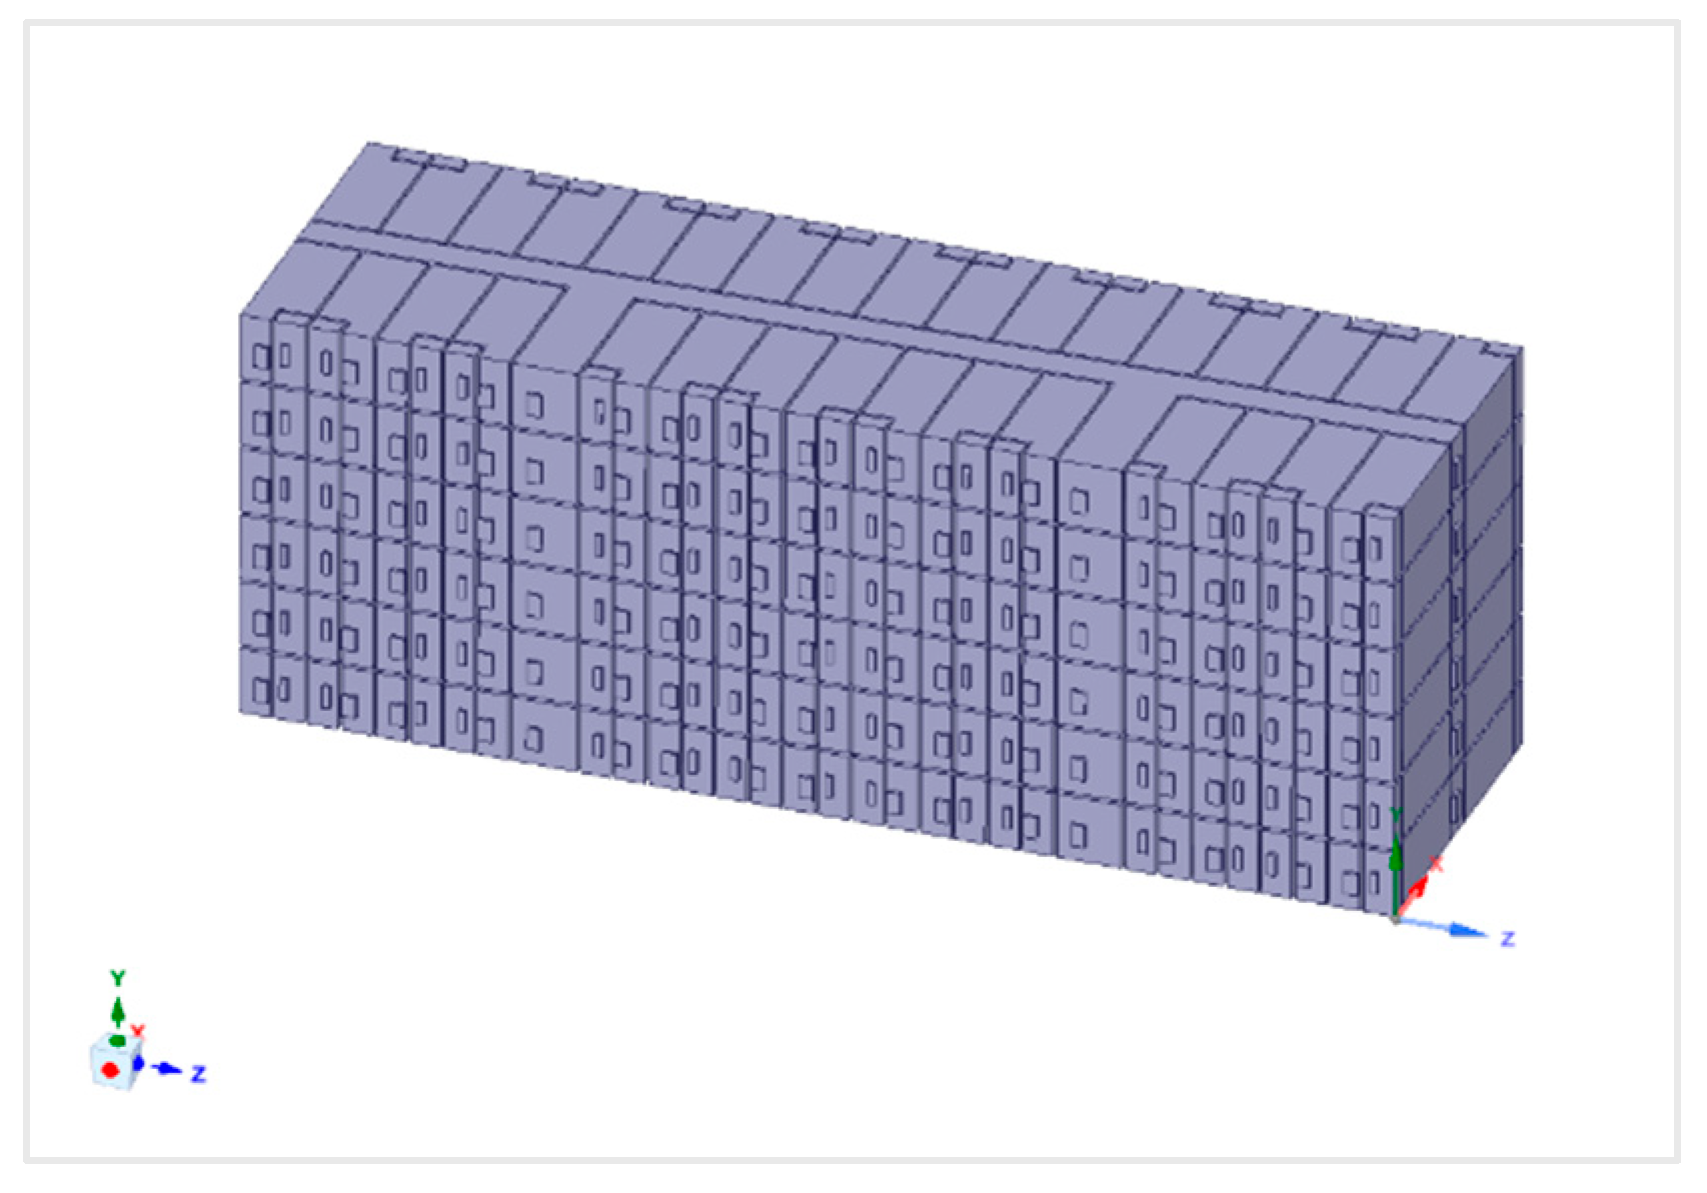
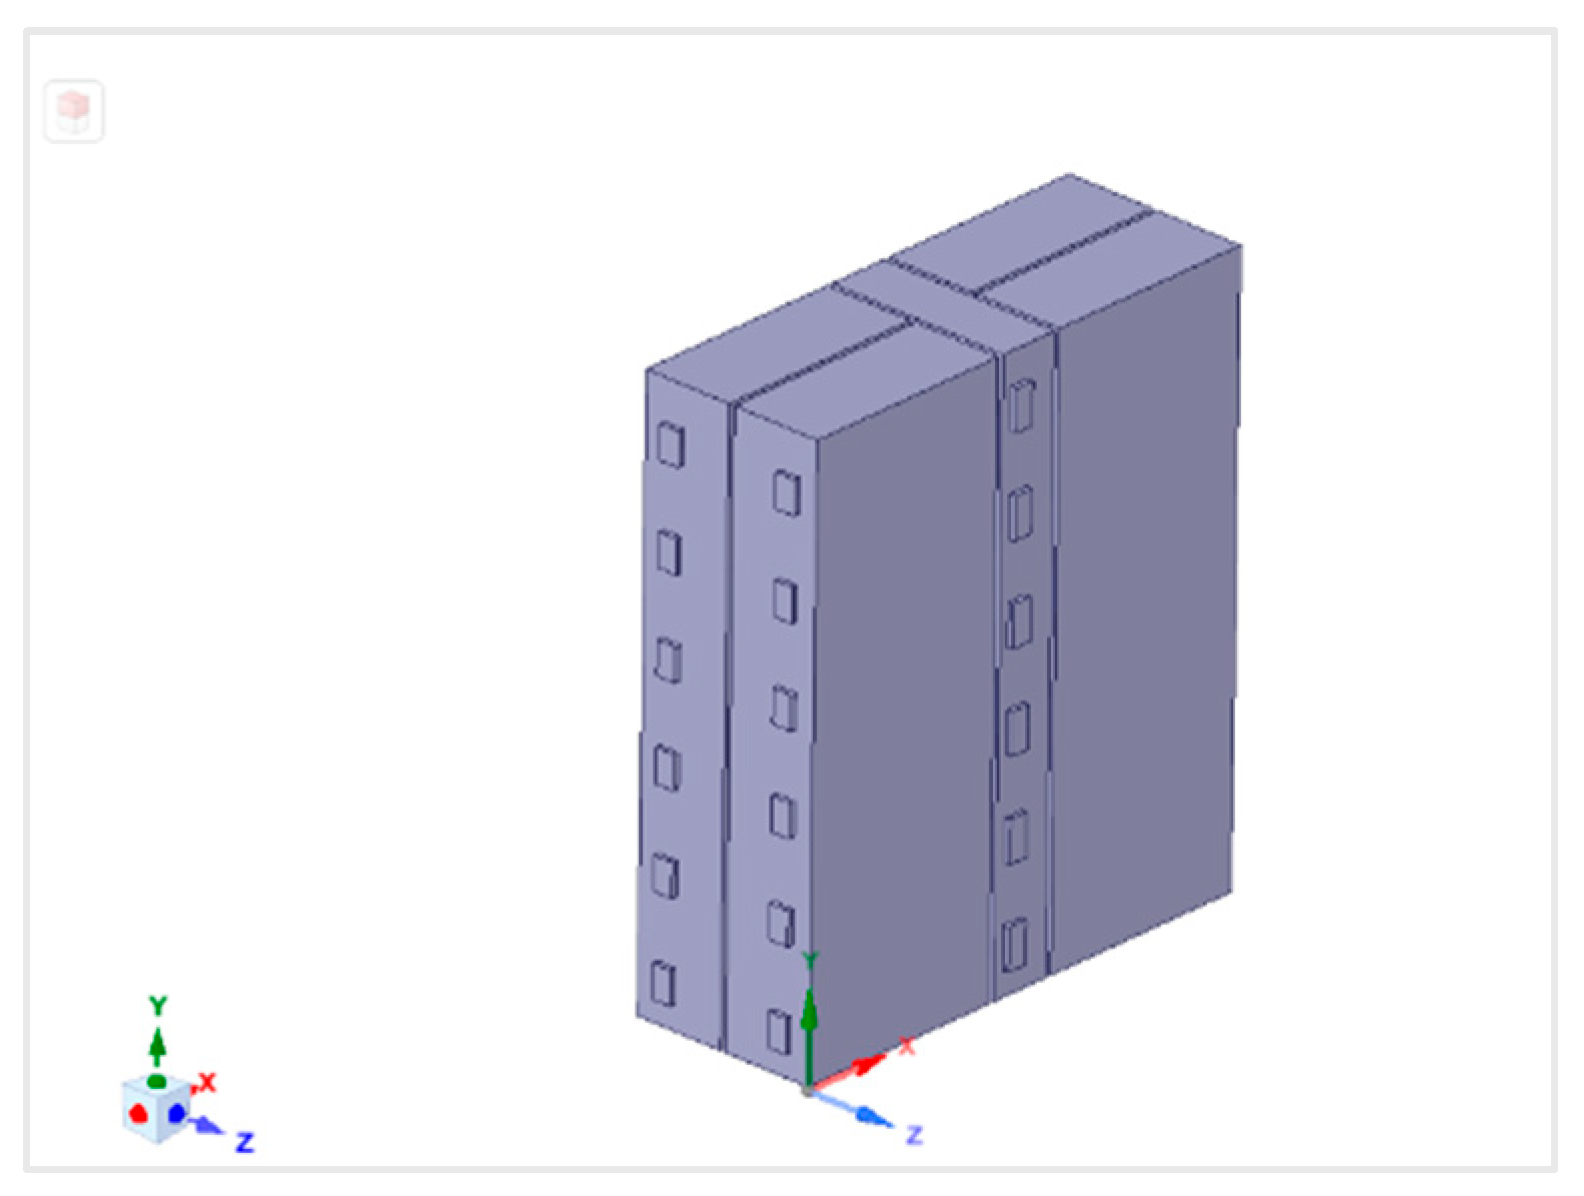
First, an outdoor wind field was established to simulate the impact of overall planning and layout factors. Subsequently, based on field measurement data, a physical model of Dormitory Building No. 4 was constructed in SpaceClaim, as shown in Figure 6, and the simulation results were validated against the measured data. A typical dormitory unit was then extracted as the baseline model (Figure 7) for subsequent simulations analyzing the influence of various factors.

2.5.2. Mesh Generation

In this study, the meshing process was conducted using the Meshing module in Ansys Workbench. Since the floor plan of Dormitory Building No. 4 is relatively regular, a hexahedral mesh was adopted. To better capture the details of dormitory ventilation and indoor air pollutants, finer grids were applied to critical parts such as walls, doors, and window openings [37]. The grid size settings for the simulation were as follows: the maximum cell size was 0.3 m, the grid size near window openings was 0.085 m, and the minimum cell size was 0.003 m. The mesh quality was 0.796. For boundary conditions, the prevailing summer wind direction in Xuzhou, southeast wind, was applied with an inlet velocity of 2.6 m/s, decomposed into x = 1 m/s and z = 2.4 m/s.

2.5.3. Boundary Condition Settings

This study adopted CFD numerical simulation methods with the following main boundary condition settings: during the validation stage, the wind speed was set to 1.2 m/s based on field measurement data. For the simulation stage, summer southeast wind was set at 2.6 m/s (decomposed into x = 1 m/s, z = –2.4 m/s), and winter northeast wind was set at 2.2 m/s. The building openings were defined as velocity inlets, with the southeast side as the air inlet and the northwest side as the outlet. The airflow was assumed to be steady-state and incompressible. The turbulence model adopted was the standard k–ε two-equation model, which is widely used in engineering applications. Pressure–velocity coupling was solved using the SIMPLE algorithm, and the convergence criterion was set to 1000 iterations to ensure result stability.

2.5.4. Validation of Software Accuracy

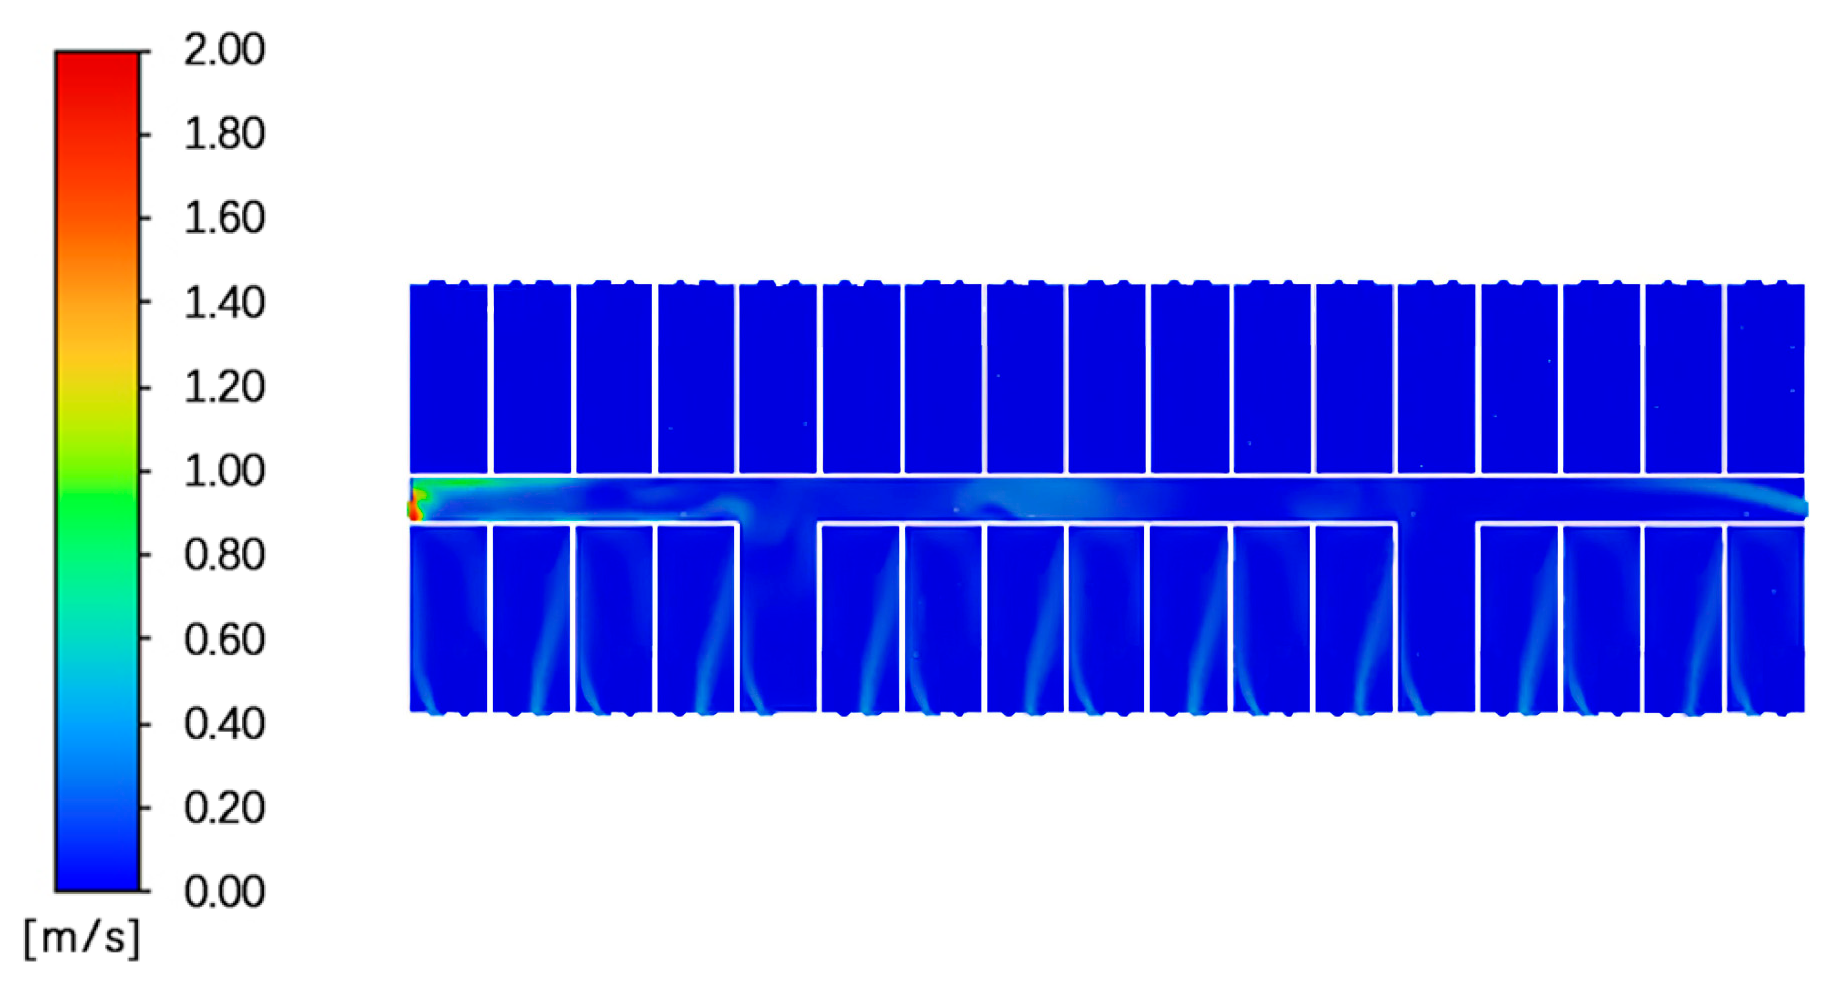
The Dormitory Building No. 4 is a typical dormitory building. In this study, the measured data on June 23 was selected for simulation. The simulation results indicate that, since the windows at both ends of the internal corridor were open, the wind speed inside the corridor was higher than in other areas. As the staircases were located on the south side of the dormitory area, the indoor ventilation near the south-facing dormitory windows was relatively better; however, ventilation inside the dormitory rooms was generally poor.
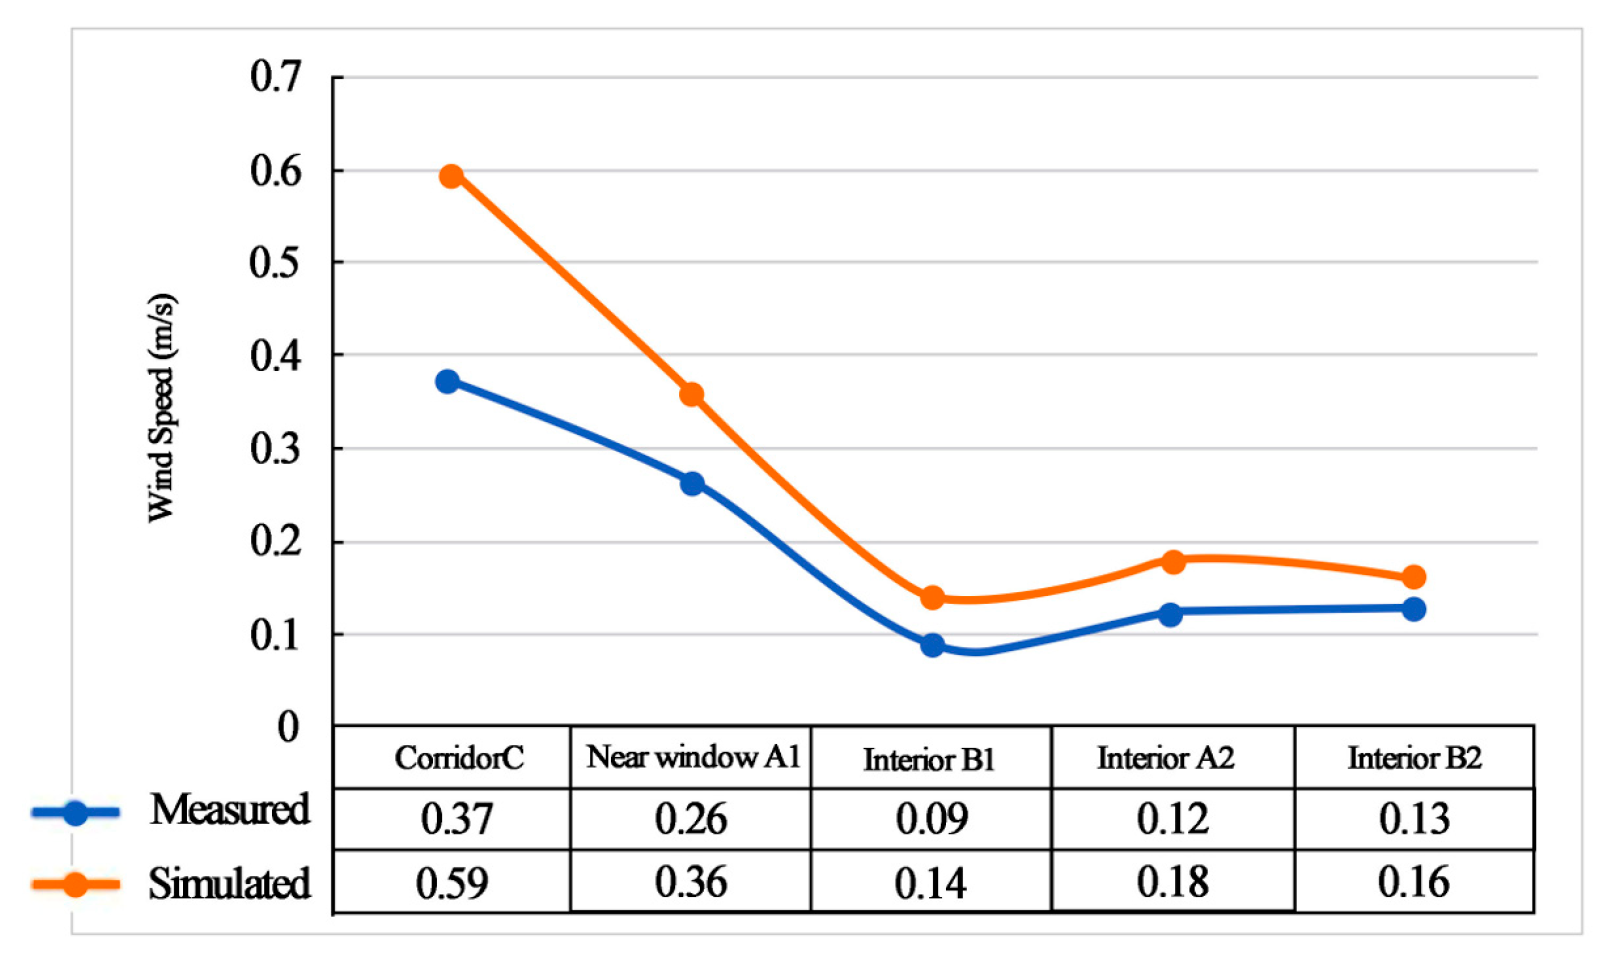
Overall, the indoor ventilation performance of Dormitory Building No. 4 was unsatisfactory. As shown in the simulation results (Figure 8), the wind speeds at the selected monitoring points followed the order: C > A1 > A2 > B2 > B1. In comparison with the field measurements, as shown in Figure 9, point B2 exhibited a higher wind speed than point A2. This discrepancy was likely due to the doors being closed during the simulation, which reduced the airflow in the north-facing dormitory at point B2. Nevertheless, both simulation and measurement results showed a consistent trend in wind speed variations. The simulated results were generally higher than the measured data, which can be attributed to the idealized conditions in the simulation. Specifically, internal partitions and furniture were not considered, nor were external obstructions such as surrounding buildings and vegetation. Consequently, the simulated values exceeded the measured ones, but the consistent trends between the two indicate that the FLUENT software used in this study provides reliable accuracy. Therefore, FLUENT will be employed in subsequent analyses.

2.6. Introduction to the Orthogonal Simulation Method

Orthogonal experimental design is an efficient multi-factor optimization method. By employing orthogonal arrays, it enables scientific arrangement of experimental combinations, ensuring representativeness while significantly reducing the number of experiments required. The method involves first identifying key factors and their levels, then assigning experimental conditions evenly using an orthogonal array, and finally applying analysis of variance (ANOVA) to identify the most significant influencing factors. Compared with a full factorial design, OED can substantially reduce the number of simulation runs, which is particularly important given the high computational cost of CFD analyses. Moreover, although response surface methodology (RSM) is commonly used for regression modeling, OED enables balanced and representative comparisons across multiple factors and levels, making it more appropriate for this study. Owing to these advantages, OED has been widely applied in process optimization, product development, and related fields, and is employed here to optimize the natural ventilation performance of dormitory buildings.
The conventional notation of an orthogonal array is Ln(Tc), where the symbols are defined as follows:
L denotes orthogonal experiment, highlighting that the array is designed specifically for orthogonal design.
n represents the total number of experiments, i.e., the number of different experimental combinations arranged in the orthogonal array.
c indicates the number of influencing factors, namely the different variables or parameters considered in the experiment.
T refers to the levels of influencing factors, i.e., the different values or states a factor can take.
Based on the preliminary literature review and the core mechanisms of dormitory ventilation, five categories of key optimization factors were identified—building orientation, corridor width, sash opening width, internal window height, and window type. In the next stage, single-factor CFD simulations will be conducted to further verify and refine the effective ranges of these factors. Each factor was set at three levels, allowing the direct use of the standardized L27(35) orthogonal array, which facilitates subsequent experimental design.
This notation provides a clear understanding of the structure and parameters of orthogonal arrays, allowing researchers to select the most appropriate design according to their specific research needs. The orthogonal design ensures that, with a limited number of experimental runs, a wide range of factor-level combinations can be effectively covered, thereby producing relatively comprehensive and accurate experimental results.

3. Results

3.1. Analysis of Factors Influencing the Wind Environment

3.1.1. Effect of Building Orientation on Natural Ventilation in Dormitories

In this simulation, seven wind direction angles θ were set: 0°, 15°, 30°, 45°, 60°, 75°, and 90°. The simulation results indicate that the area of the wind shadow zone decreased with an increase in wind direction angle. Overall, when the wind direction angle was between 45° and 60°, the wind environment was relatively favorable. Considering the prevailing wind direction in Xuzhou, the building orientation should be controlled within the range of 8° to 23° east of south.

3.1.2. Effect of Corridor Width on Natural Ventilation in Dormitories

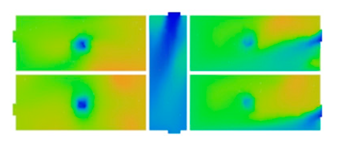
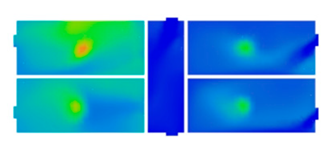
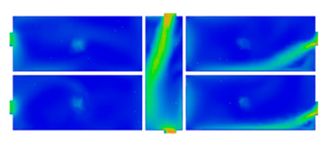
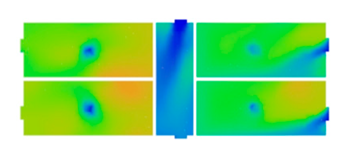
Based on in-depth investigations of dormitory buildings in universities in Xuzhou, four representative corridor widths were selected for simulation: 2100 mm, 2400 mm, 2700 mm, and 3000 mm. The simulation results are presented in Table 5.
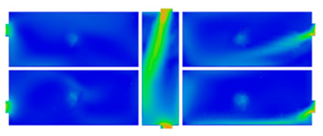
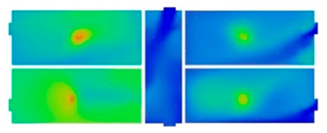
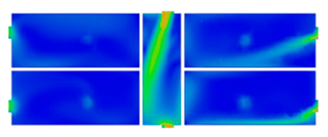
The increase in dormitory corridor width has a significant impact on the indoor wind environment and air quality. As the corridor width increased progressively from 2100 mm to 3000 mm, the average wind speed within the corridor showed a decreasing trend, with the highest wind speed (exceeding 1.3 m/s) observed at 2100 mm. Although wind speeds were lower in wider corridors, the probability of cross-ventilation increased, which helped improve airflow inside the dormitories. The proportion of the indoor area within the comfort wind speed range increased gradually from 24% to 33%. Meanwhile, the air age decreased from 382 s (2100 mm) to 341 s (3000 mm), indicating enhanced air renewal capacity. CO2 concentration also decreased from 875 ppm (2100 mm) to 784 ppm (3000 mm), with relatively higher concentrations observed in the north-facing dormitories due to their leeward position. These results demonstrate that greater corridor width enhances overall ventilation performance and facilitates pollutant dilution. From the perspective of both ventilation effectiveness and spatial utilization, corridor widths between 2700 mm and 3000 mm not only optimize indoor ventilation efficiency and air quality but also provide a more spacious and comfortable public interaction space. Such spaces can be enhanced with greenery, seating, and decorations to increase vibrancy and comfort, thereby promoting student communication and relaxation.

3.1.3. Effect of Window Width on Natural Ventilation in Dormitories

Previous studies suggest that natural ventilation is optimized when window openings occupy one-third to two-thirds of the wall width and the window-to-floor area ratio ranges from 15% to 20% [38]. Accordingly, four different sash widths were selected for simulation in this study, while maintaining a constant window height of 1200 mm. The window type was a typical sliding window, and the operable sash widths were set at 650 mm, 750 mm, 850 mm, and 950 mm. The simulation results are presented in Table 6. The simulation results indicate that corridor wind speed remains nearly constant at about 1.5 m/s regardless of window sash width. As the sash width increases from 650 mm to 950 mm, the proportion of the comfortable wind speed zone rises from 22.5% to 34.1%. The air age distribution revealed that the north-facing dormitories generally had higher air ages than the south-facing ones, with stagnant air zones also observed in the corners of the south-facing walls. At a sash width of 650 mm, the maximum air age occurred, with over 40% of the north-facing dormitory area exceeding 400 s. With increasing sash width, the air age significantly decreased. CO2 concentration also showed a downward trend, decreasing from 897 ppm at 650 mm to 776 ppm at 950 mm. In summary, to improve indoor ventilation and air quality, the recommended order of priority for sash widths is 950 mm > 850 mm > 750 mm > 650 mm. In practical engineering design, sash dimensions should be reasonably determined within the allowable limits of window-to-wall and window-to-floor ratios, ensuring coordination between ventilation performance and architectural design.

3.1.4. Effect of Internal Window Height on Natural Ventilation in Dormitories

The position of window openings significantly affects indoor airflow distribution (Table 7). The configuration of lower-level air inlets and upper-level outlets is most effective for heat dissipation and air circulation, whereas top inlets perform less favorably. Lower inlets improve air quality in occupied zones, while higher outlets facilitate the removal of warm air and enhance ventilation. Therefore, a “bottom-inlet and top-outlet” strategy is recommended.
Field investigations revealed that in dormitories with internal corridors, room doors are usually kept closed, making it difficult for airflow to enter the interior, which results in obstructed ventilation and uneven wind speed distribution. To address this issue, installing transom windows above the doors can facilitate effective air exchange even when the doors remain closed.
Based on the survey and measurement data, it was also found that the heights of internal windows varied. Simulations were conducted for five interior window heights: 1800 mm, 1900 mm, 2000 mm, 2100 mm, and 2200 mm, using a standard sliding window type, with all other conditions kept consistent to ensure result comparability. As shown in Table 8, when the interior corridor window height was 1800 mm, the wind speed in the north-facing dormitory was relatively low, indicating that the airflow did not flow smoothly into the northern rooms. At window heights of 1900 mm, 2000 mm, and 2100 mm, the wind speeds in both south- and north-facing dormitories were higher than at 1800 mm, with improved airflow into the north-facing dormitories. Particularly at 2000 mm and 2100 mm, both south- and north-facing dormitories exhibited higher wind speeds than under other conditions, and airflow distribution was relatively uniform. At a window height of 2200 mm, the ventilation in the north-facing dormitory was poorer than at 1900–2100 mm, but still better than at 1800 mm. According to the CO2 concentration distribution, the average value was approximately 897 ppm when the interior window height was 1800 mm, while it decreased to the lowest level of 776 ppm at 2100 mm, representing an improvement of 13.5%. Air age simulations further revealed that at 2100 mm, the proportion of areas exceeding 400 s was the lowest. Overall, given the dormitory floor height of 3600 mm, an internal corridor window height of 2100 mm proved most effective in improving indoor wind environment and air quality. Since dormitory floor heights vary, the installation of corridor transom windows should be adjusted according to actual conditions. Following the “low-in, high-out” ventilation principle, the corridor windows should be set higher than the external operable windows to more effectively expel indoor warm air.

3.1.5. Effect of Window Types on Natural Ventilation in Dormitories

Indoor airflow is significantly influenced by the orientation, position, and opening type of windows. To optimize ventilation, windows should ideally be set at an angle to the prevailing wind direction; if they must directly face the wind, the relative positions of opposing windows can be adjusted to improve airflow. Different window opening modes exhibit varying effects: double-sided casement windows provide the best ventilation, while single-sided casements reduce the inflow by approximately half; bottom-hung windows are effective at blocking wind but weak in drawing airflow; mid-hung windows are the most effective in directing airflow upwards toward the ceiling, avoiding direct drafts and thereby enhancing comfort; top-hung windows perform between bottom- and mid-hung types; pivot windows provide excellent airflow guidance when aligned with the wind, but when off-axis, they block wind more effectively while weakening the inflow; sliding windows generally perform poorly in both ventilation effectiveness and flexibility. Window type selection should therefore balance both inflow capacity and airflow direction to enhance natural ventilation.
In this study, five common window opening forms were investigated. During simulation, the external wall window area was kept constant. The five cases were: sliding window; bottom-hung window opened inward at 30°; top-hung window opened outward at 30°; casement windows opened outward at 45° and 60°; and mid-hung window opened at 90°. The simulation results are presented in Table 9. The mid-hung window with a 90° opening showed the best ventilation performance, with the lowest air age (approximately 320 s) and a comfort wind speed area ratio of 35%, representing an 11% improvement compared to the typical sliding window. The casement window at 60° ranked second, while the casement window at 45° performed slightly worse than at 60° but still outperformed the sliding window. In contrast, the top-hung 30° and bottom-hung 30° configurations provided only limited improvement. Overall, the ventilation performance ranking was as follows: mid-hung 90° > casement 60° > casement 45° > sliding window > top-hung 30° > bottom-hung 30°.
In terms of improving overall wind speed distribution, corridor width adjustment showed the most significant effect. When the width increased from 2100 mm to 3000 mm, the proportion of comfortable wind zones rose by about 9%, and air age was reduced by approximately 41 s. By contrast, window type optimization mainly influenced local comfort and airflow organization, with improvements in comfortable wind zones limited to only 3–5%, indicating a relatively modest overall effect. Internal window height proved to be more sensitive to air age and CO2 concentration: when the height increased from 0.9 m to 1.5 m, air age was reduced by around 41 s and CO2 concentration decreased by about 40 ppm, significantly enhancing air replacement efficiency and pollutant dilution. External window width primarily determined instantaneous airflow volume. When increased from 0.6 m to 1.2 m, the proportion of comfortable wind zones improved by about 10% and wind speed levels rose markedly, but the reductions in air age and CO2 concentration were limited, suggesting that its effect is more oriented toward short-term ventilation efficiency. Overall, different factors played distinct roles in ventilation optimization, reflecting not only variability in performance improvements but also trade-offs between efficiency and comfort, which provides a rationale for employing the orthogonal experiment to determine the optimal combination.

3.2. Analysis of Orthogonal Simulation Results

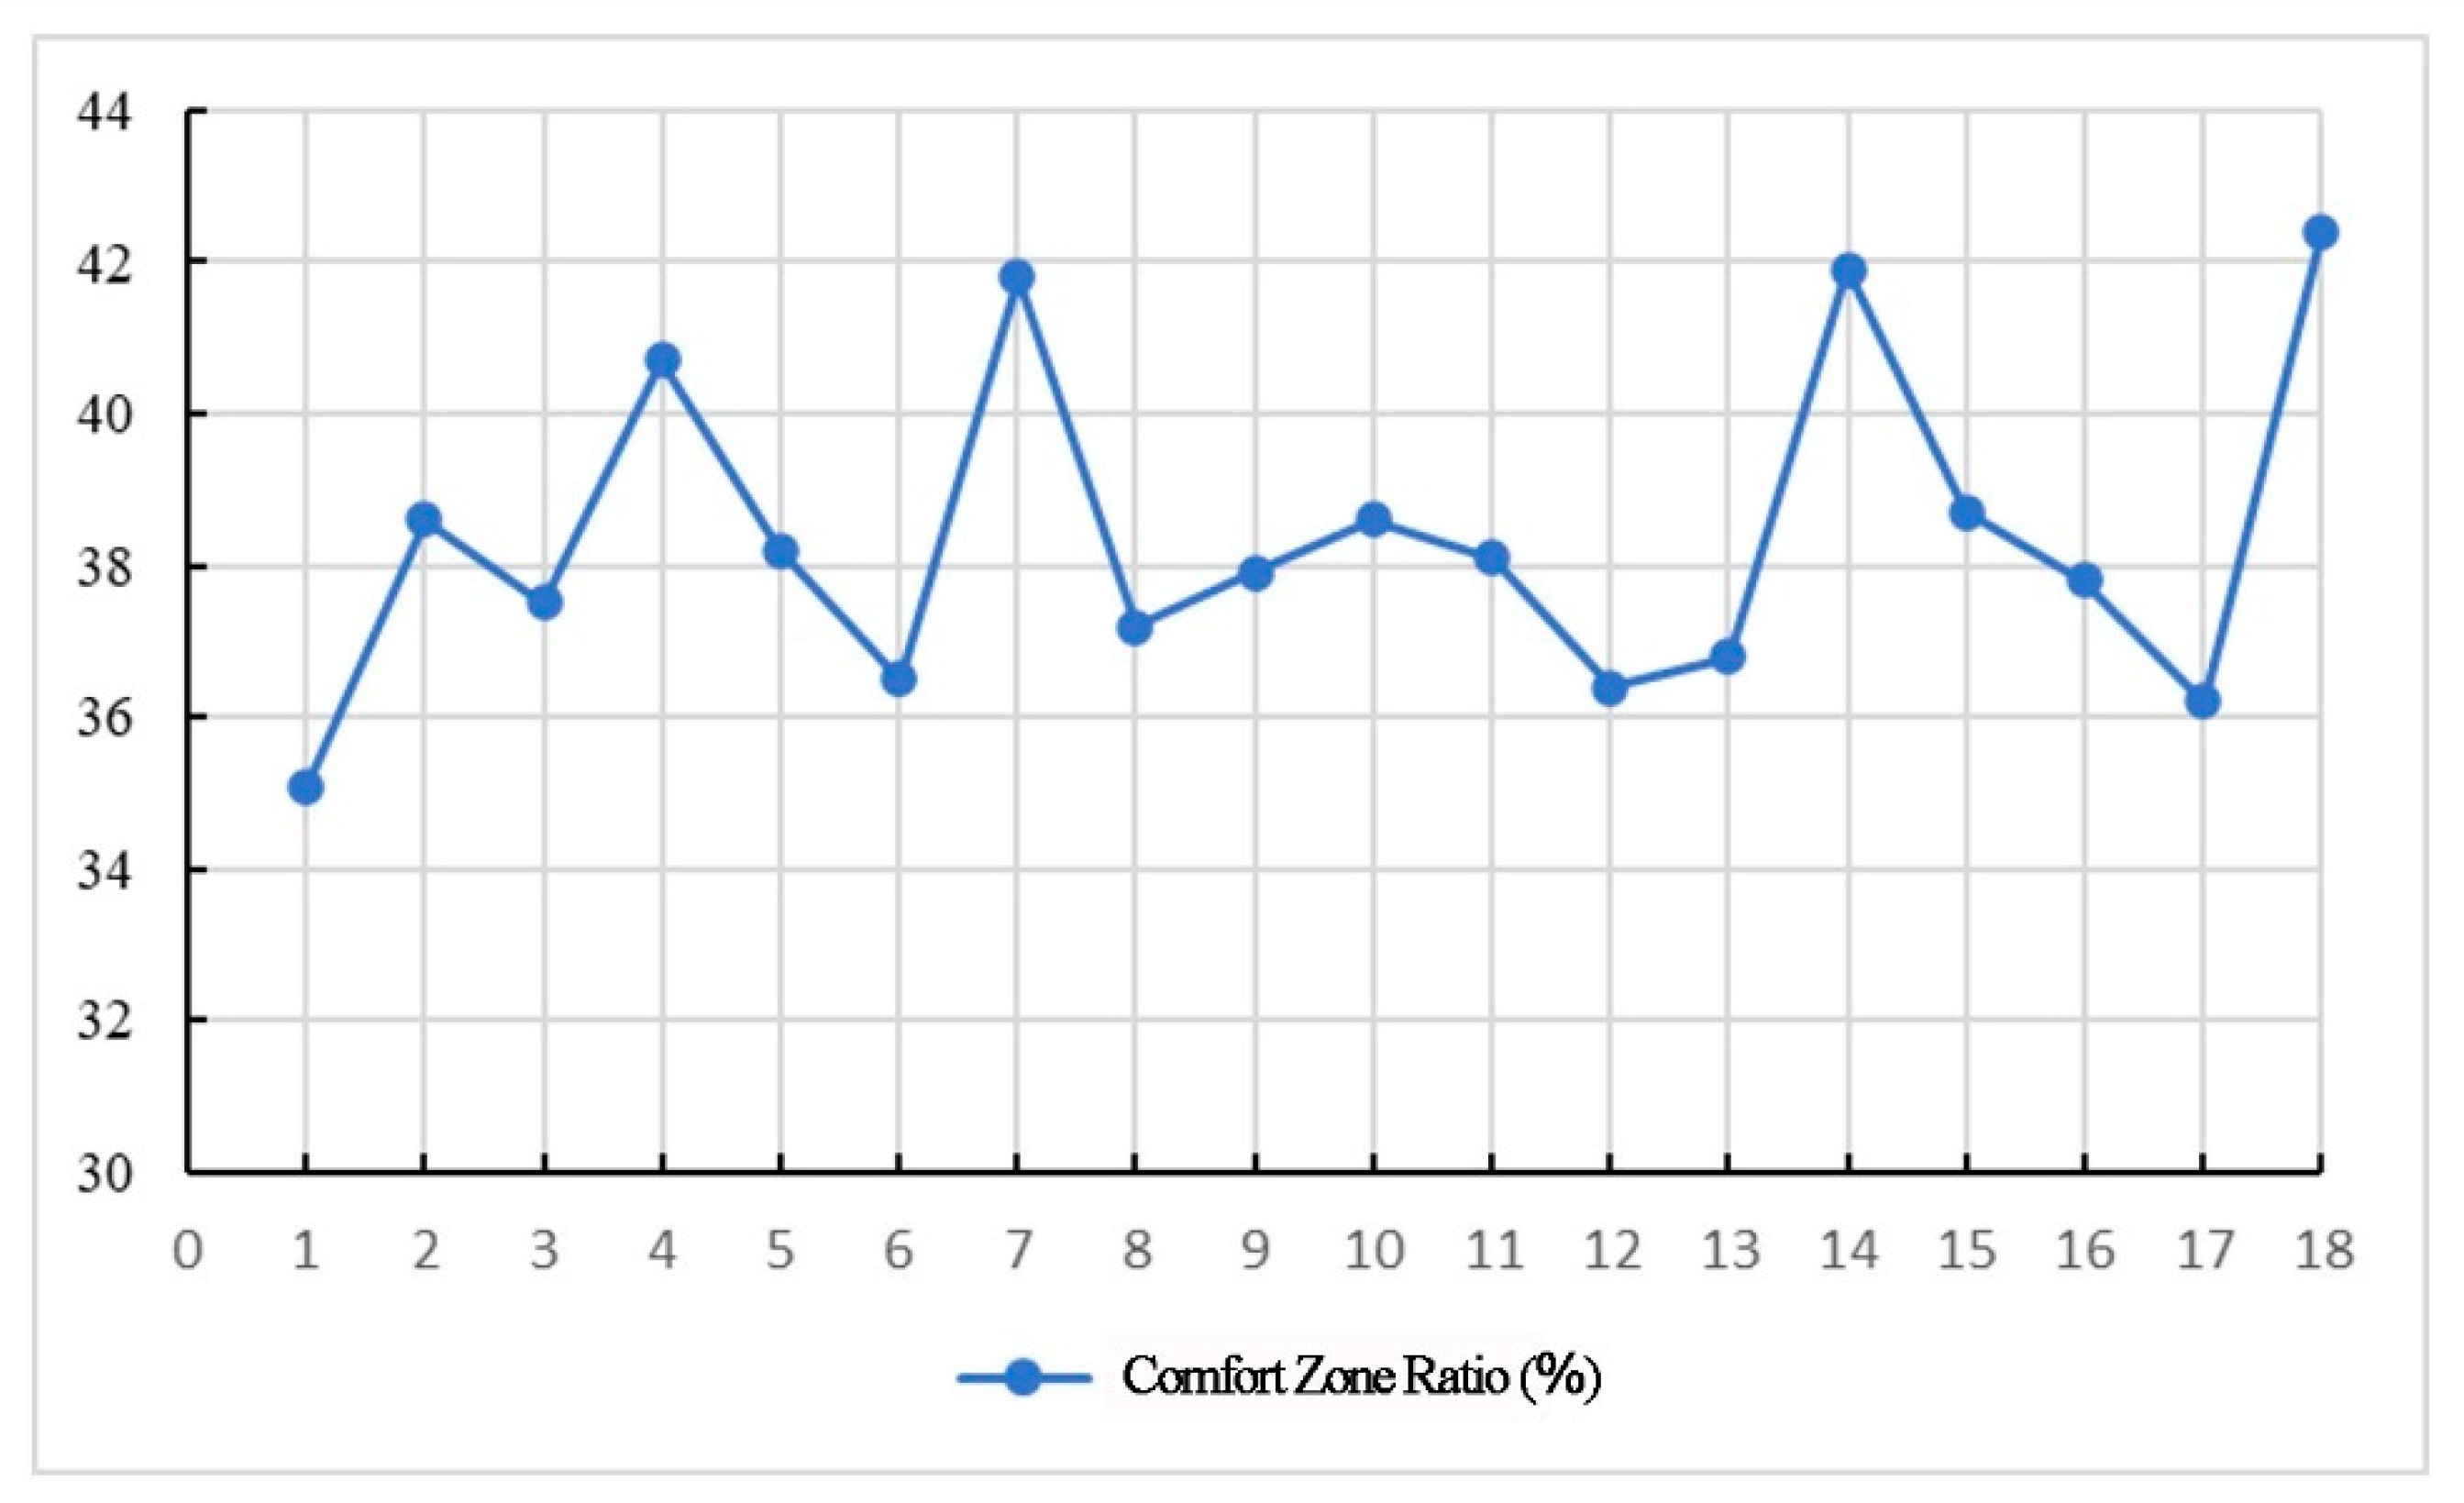
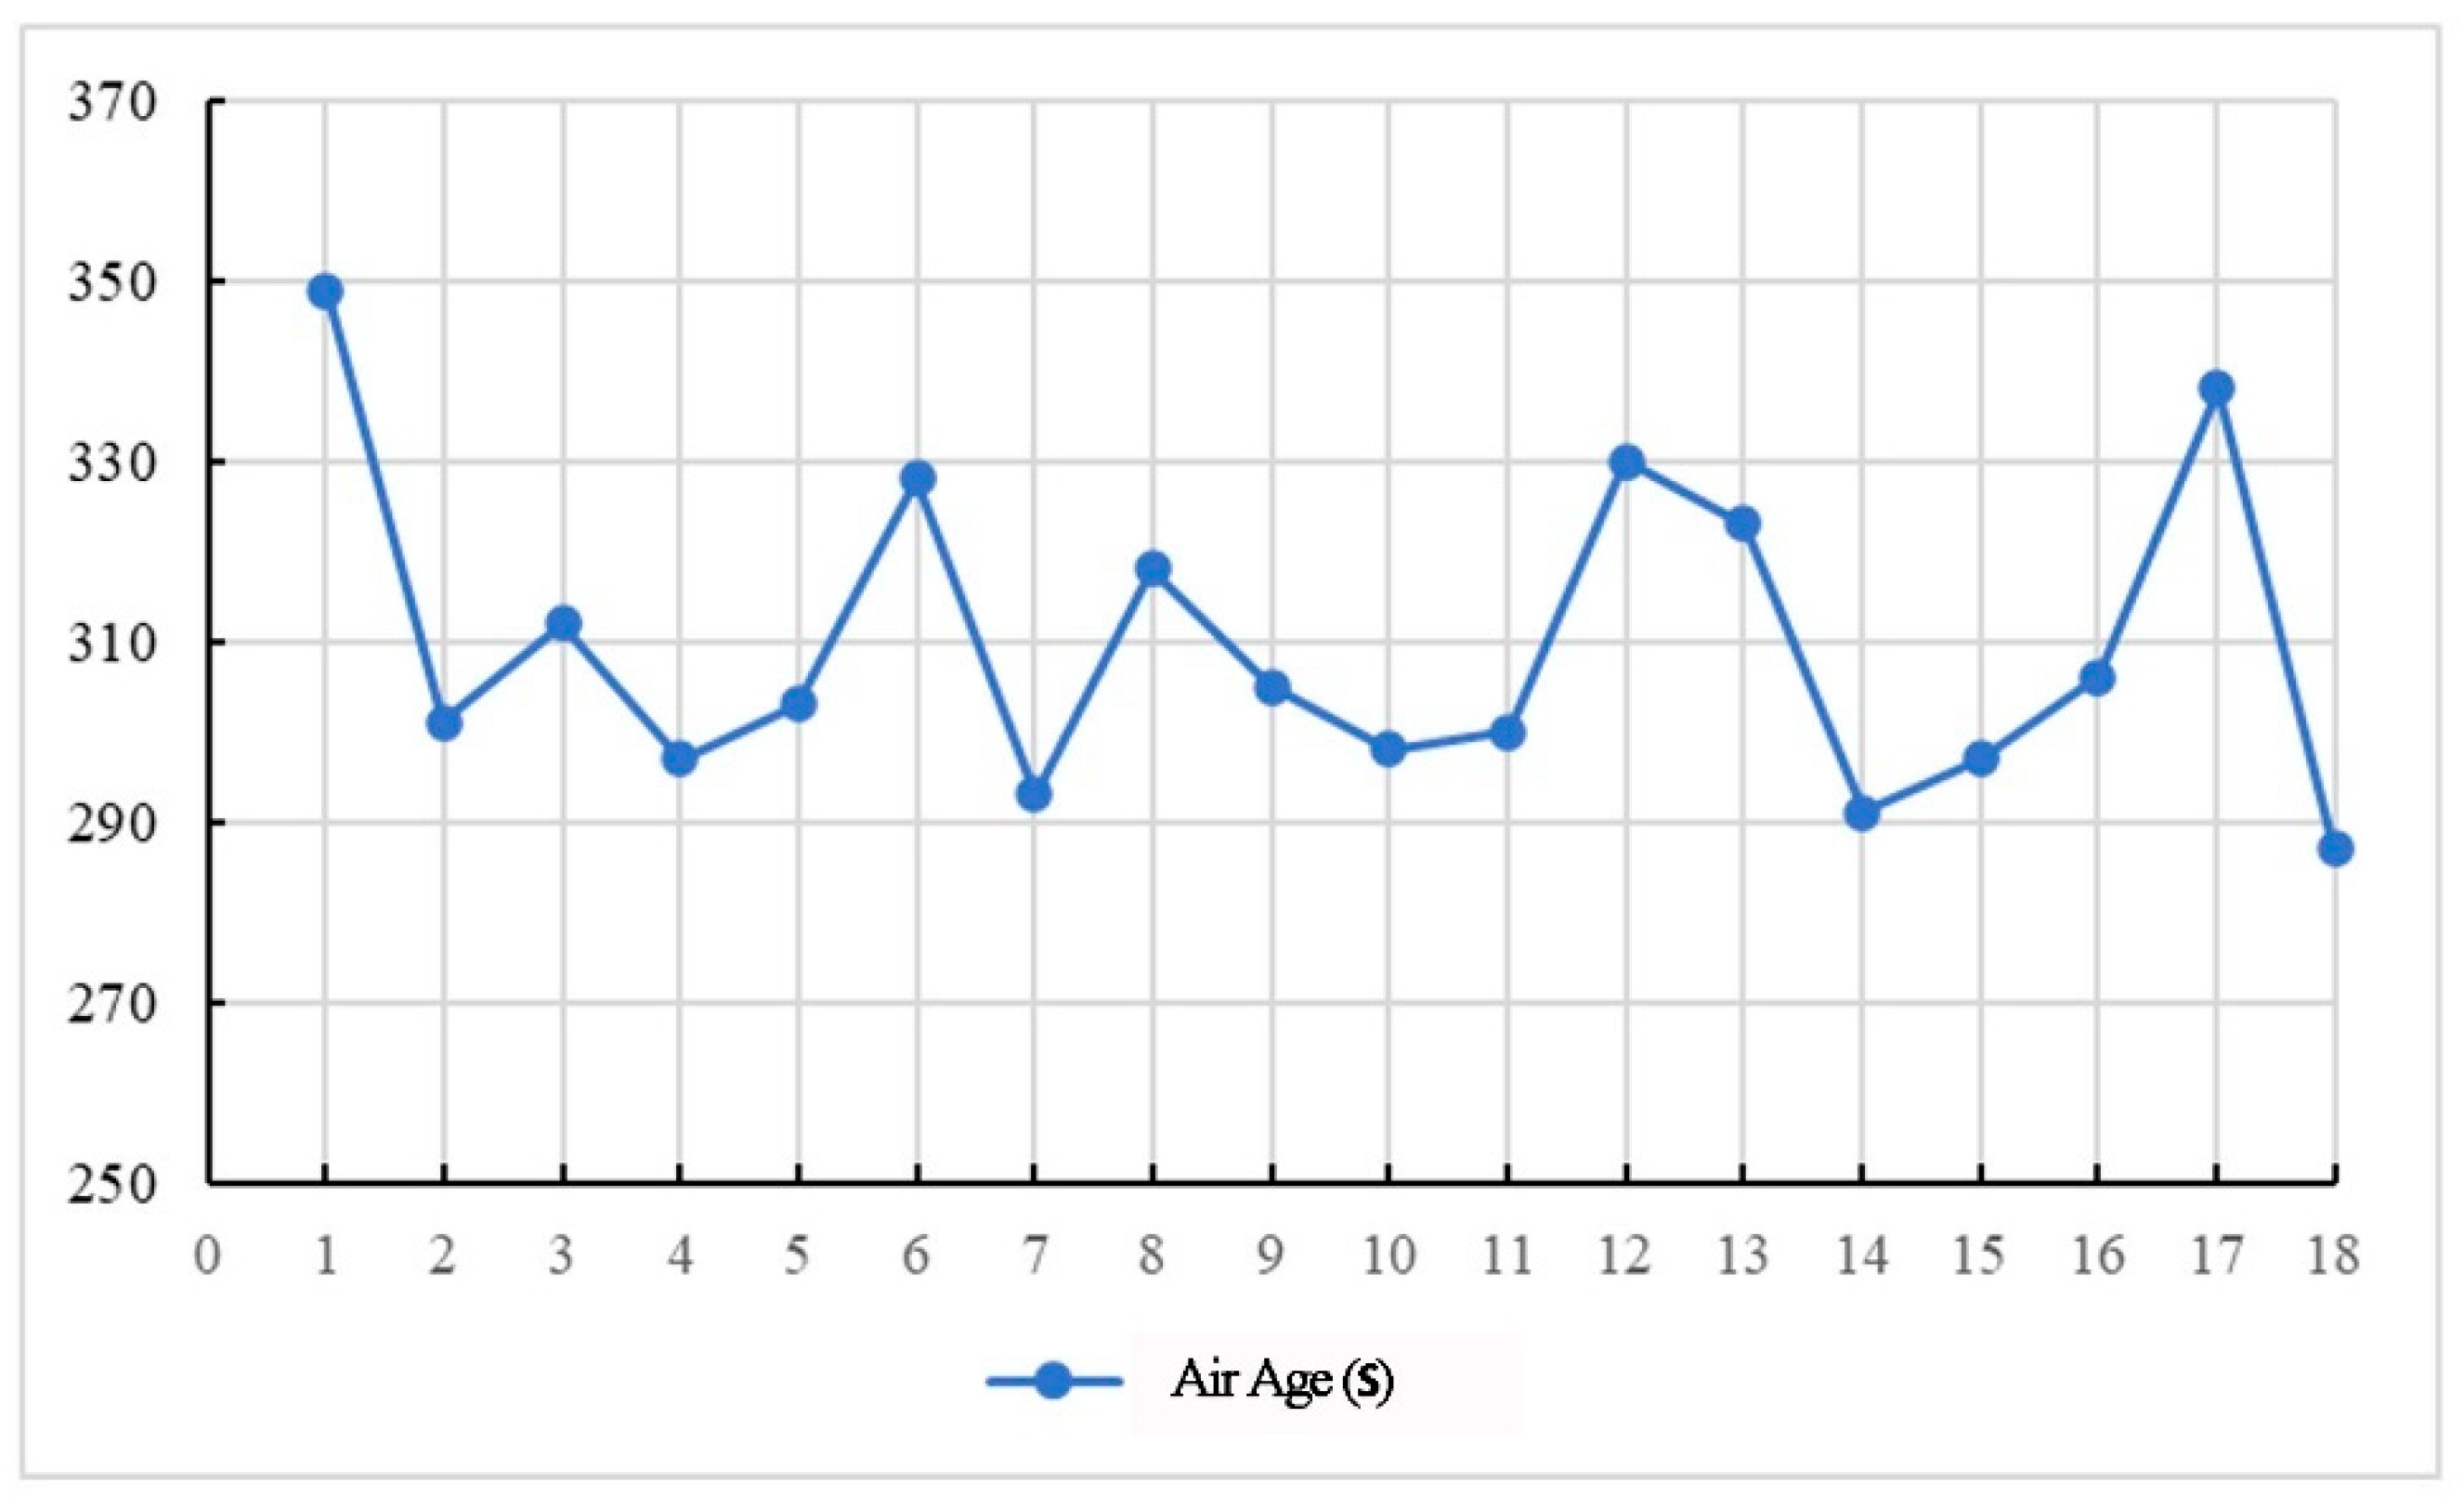
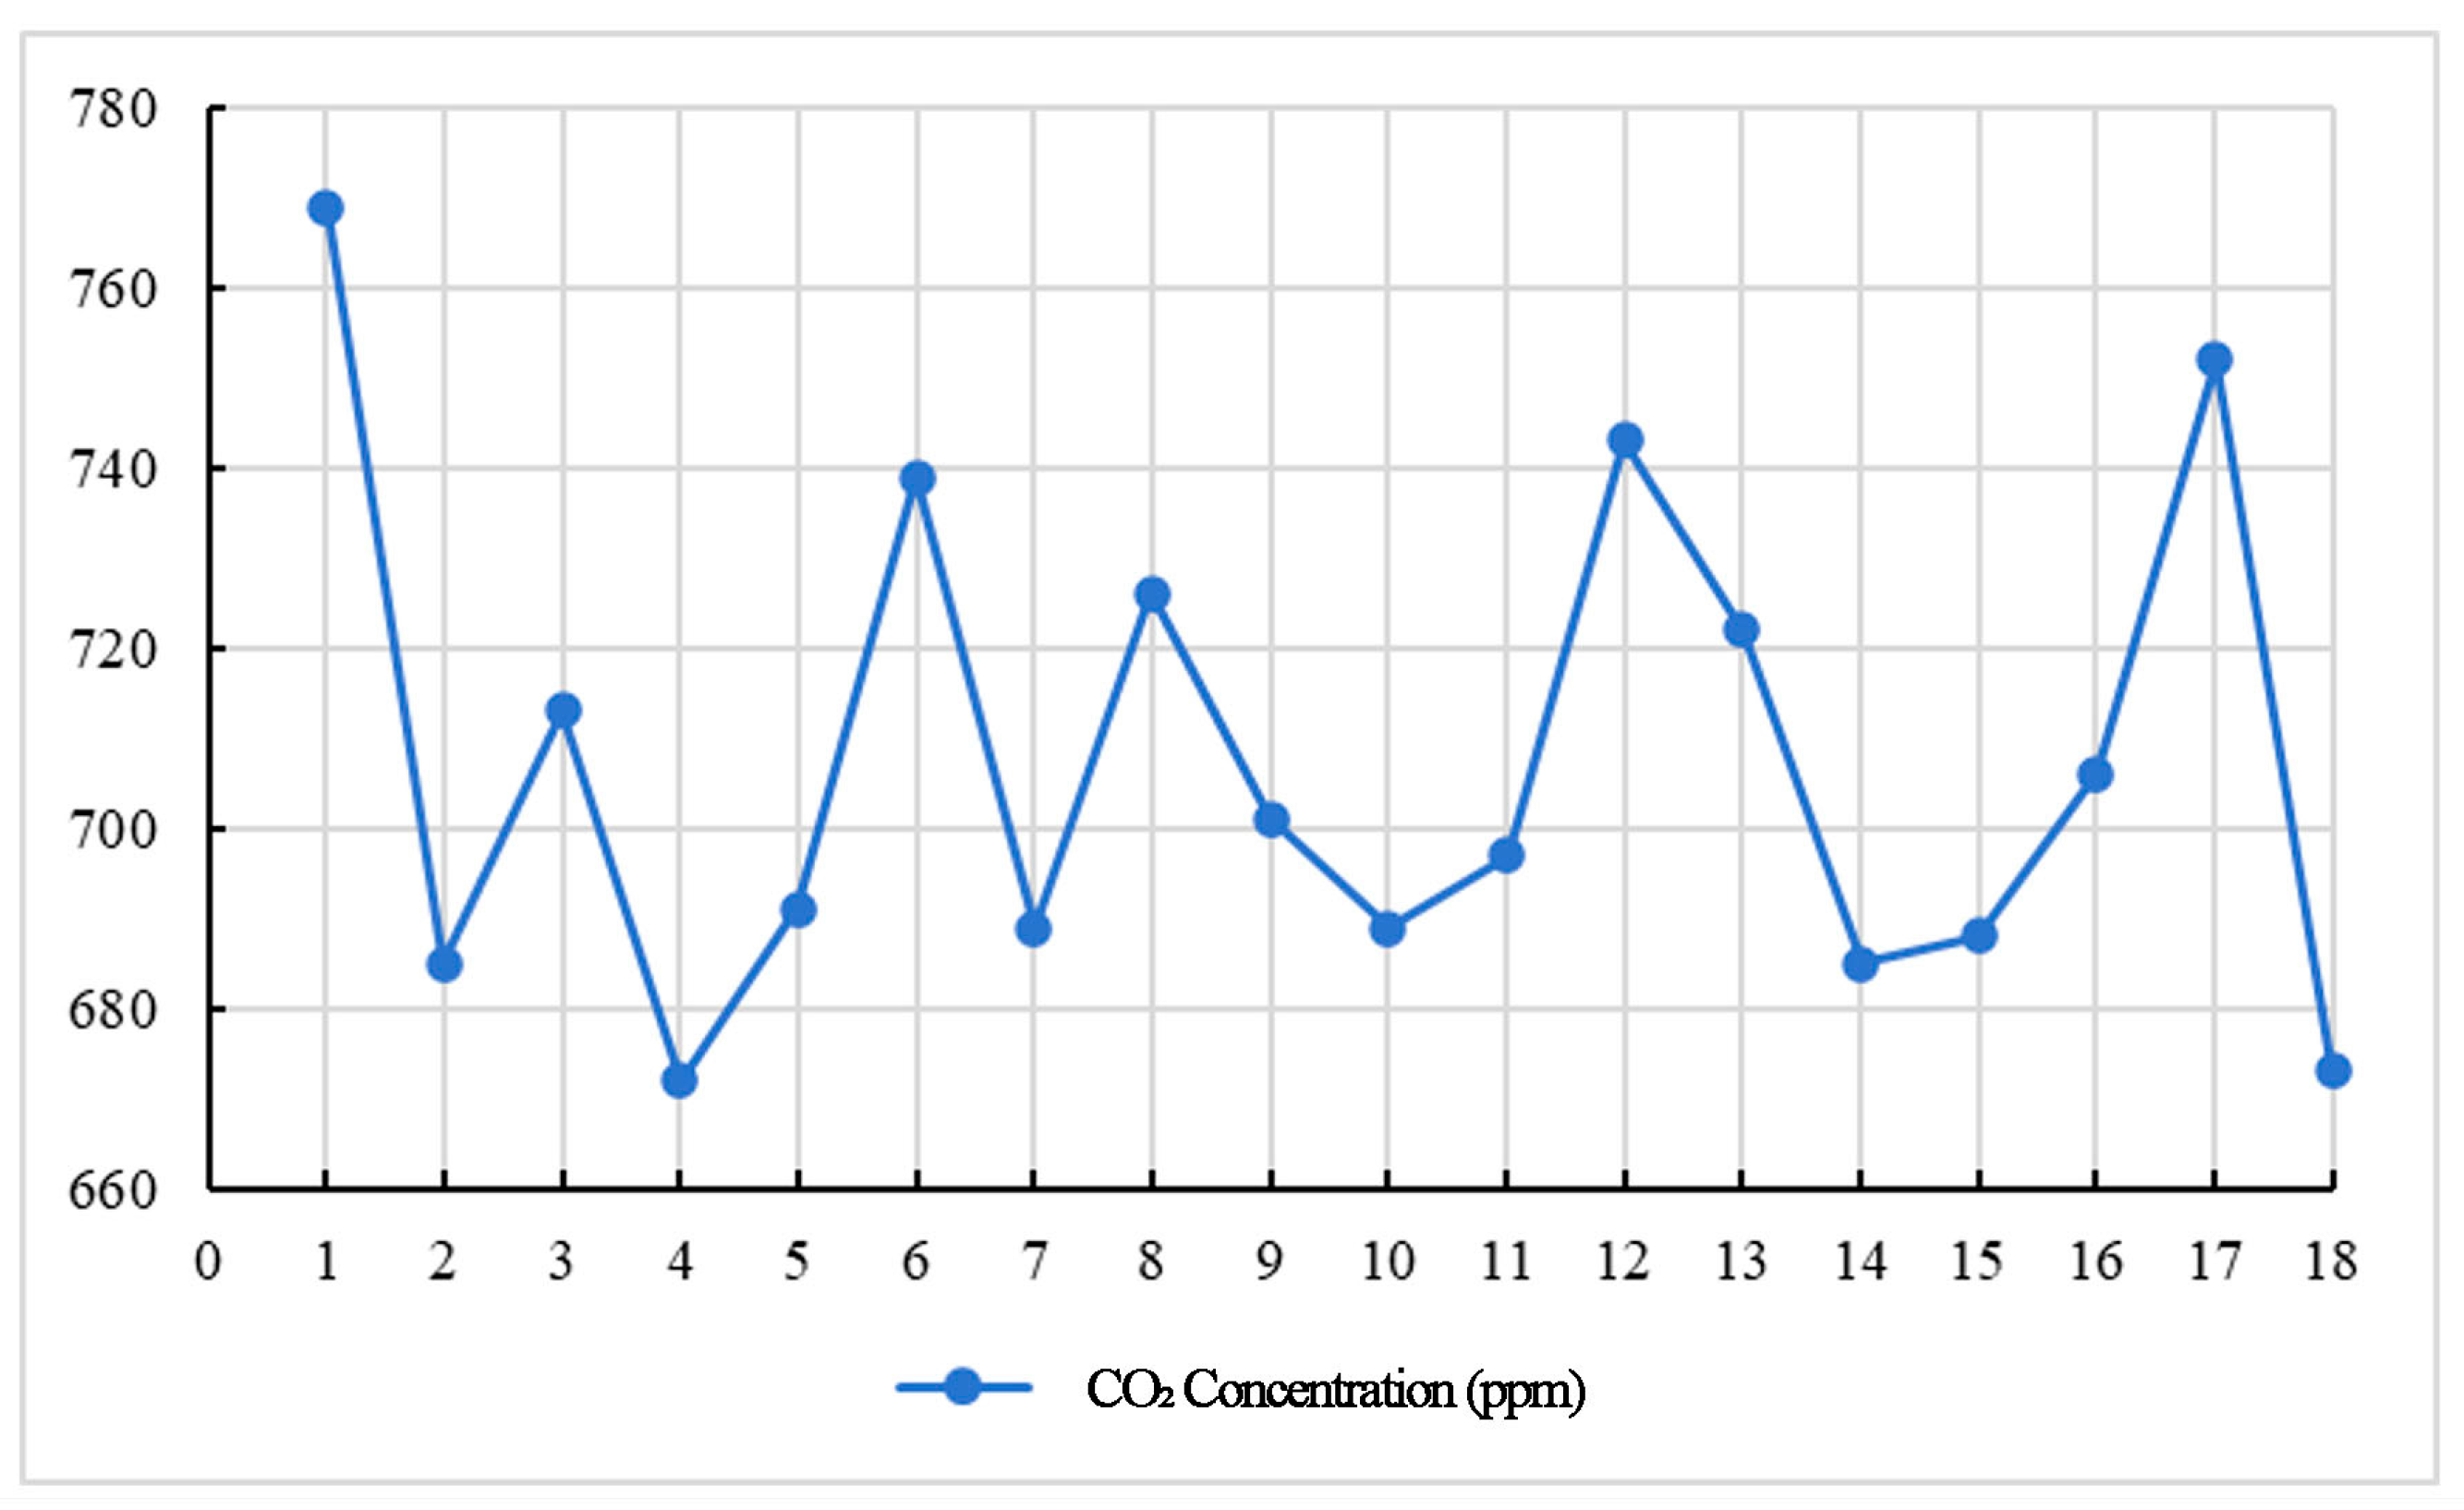
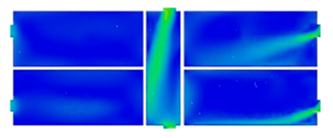
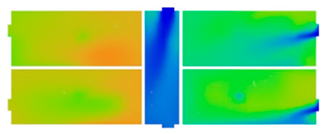
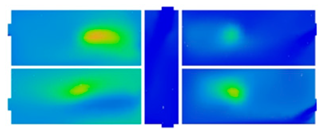
In the orthogonal experiment, five key factors were selected: building orientation (A), corridor width (B), sash width (C), internal window height (D), and window type (E). Each factor was assigned three levels (1, 2, and 3). Based on CFD simulation analysis, the optimal building orientation for the Xuzhou region was found to be between 8° and 23° east of south; therefore, the orientations were set at 8°, 15.5°, and 23°. According to the previous simulations, corridor widths were set at 2700 mm, 2850 mm, and 3000 mm. The sash widths were set at 750 mm, 850 mm, and 950 mm. Internal window heights were set at 1900 mm, 2000 mm, and 2100 mm. Window types were set as casement window 45°, casement window 60°, and mid-hung window 90°. The simulation results are presented in Table 10. Among all groups, Group 18 demonstrated the best performance, with a comfort wind speed area ratio of 42.4%, an air age of approximately 287 s, and a CO2 concentration of about 673 ppm. The corresponding parameter combination was A3 + B3 + C2 + D3 + E2, i.e., building orientation at 23°, corridor width of 3000 mm, sash width of 850 mm, internal window height of 2100 mm, and window type as casement window 60°.

3.3. Comparative Analysis of Orthogonal Simulation Results

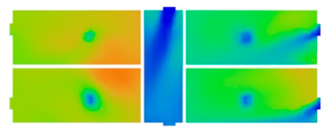
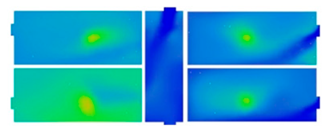
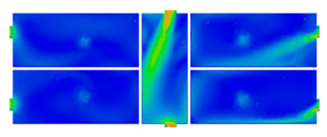
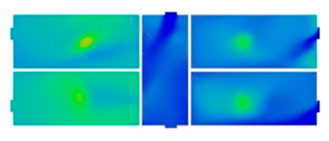
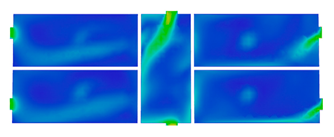
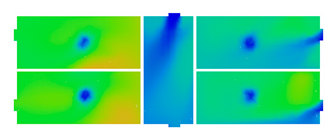
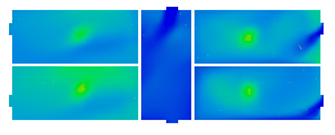
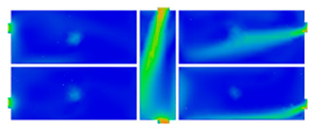
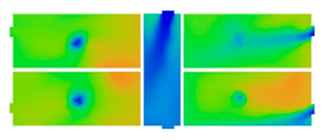
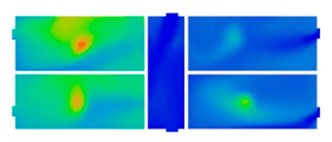
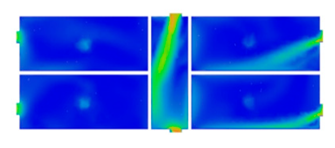
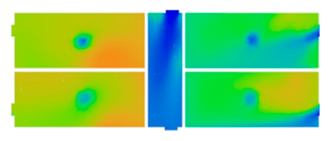
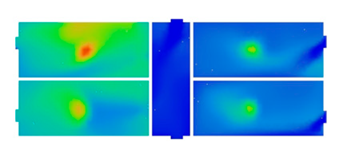
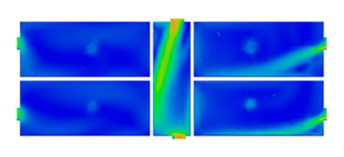
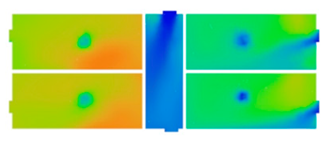
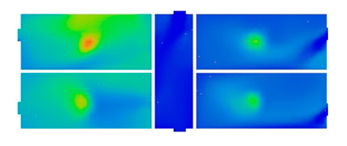
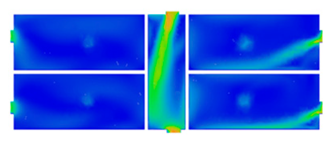
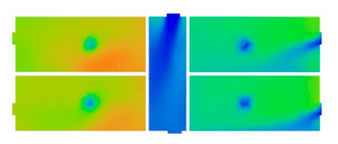
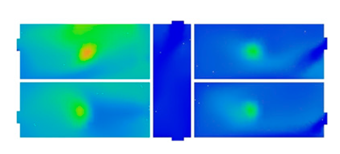
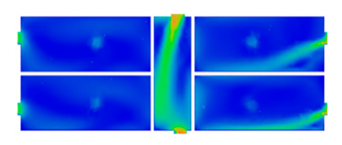
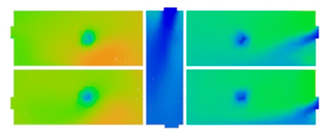
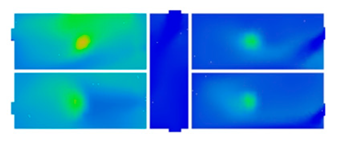
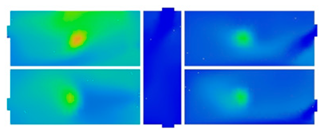
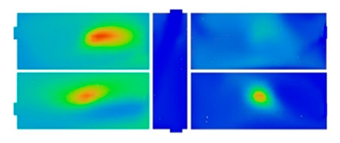
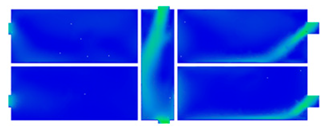
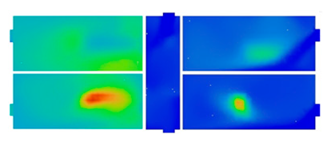
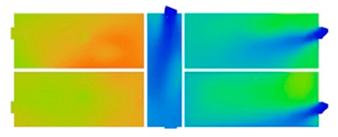
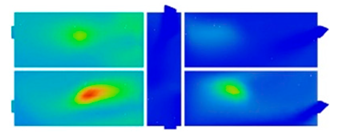
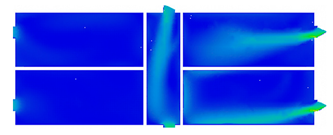
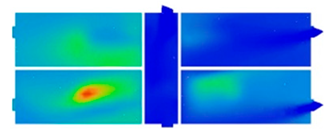
The orthogonal simulation analysis revealed that Group 18 outperformed all other groups, with comparative results shown in Figure 10, Figure 11 and Figure 12 In this case, the proportion of the comfort wind speed area reached 42.4%, the air age was approximately 287 s, and the CO2 concentration was about 673 ppm. The optimal parameter combination was A3 + B3 + C2 + D3 + E2, corresponding to a building orientation of 23°, a corridor width of 3000 mm, a sash width of 850 mm, an internal window height of 2100 mm, and a window type of casement window at 60°.

3.4. Analysis of Influencing Factors

In the integrated retrofit of the dormitory unit model, each factor exerted varying degrees of influence on the simulation results. To further explore the effects of each factor on the proportion of comfort wind speed area, air age, and CO2 concentration, mean value and range analyses were conducted for the 18 simulation groups. Here, K ¯ j   denotes the mean value of the sum of results, and the range value is defined as: R = K ¯ j max K ¯ j min   where K ¯ j max and K ¯ j min represent the maximum and minimum mean values of the results at the same factor level, respectively. The analysis results are summarized in Table 11, Table 12 and Table 13. From the perspective of the comfort wind speed area ratio, the order of factor importance was: window type > internal window height > building orientation > sash width > corridor width. For air age, the order was: window type > sash width > building orientation > internal window height > corridor width. For CO2 concentration, the order was: window type > building orientation > sash width > internal window height > corridor width.

3.5. Simulation of Optimal Combination Schemes

As discussed earlier, mean value and range analyses were conducted to evaluate the influence of each factor on the simulation results. Based on this analysis, the theoretically optimal combinations were identified separately for the three evaluation objectives: indoor comfort wind speed area ratio, air age, and CO2 concentration. These three schemes were designated as Groups 19, 20, and 21. The corresponding simulation results are presented in Table 14.

3.6. Comparative Analysis of Optimal Retrofit Strategies

A comparative analysis was conducted for the four optimal combinations, namely Groups 18, 19, 20, and 21. The comparative results are shown in Figure 13. All four combinations were found to improve the indoor wind environment and air quality to varying degrees. Among them, Group 21 exhibited the highest proportion of comfort wind speed area, while its air age and CO2 concentration were lower compared to the other three combinations. Therefore, Group 21 was identified as the optimal scheme, corresponding to the combination A2 + B2 + C2 + D2 + E2, building orientation of 15.5°, corridor width of 2850 mm, sash width of 850 mm, internal window height of 2000 mm, and window type of casement window at 60°.

4. Discussion

This study employs multi-scale simulation analysis to elucidate the underlying mechanisms through which architectural layout and form influence wind environments, providing concrete evidence for the design of healthy indoor wind environments in university dormitories. Nevertheless, the implications of these findings must be interpreted and examined within a broader research context.
At the master planning level, results indicate that a building orientation angled between 8° and 23° relative to the prevailing wind direction yields the optimal wind environment. This appears to contradict several classical studies recommending that “buildings should be perpendicular to the prevailing wind to maximize ventilation” [39]. The discrepancy may stem from the present study’s focus on balancing overall outdoor wind comfort and safety at the cluster level, rather than on maximizing indoor ventilation of individual buildings. A slight angular deviation effectively reduces strong wind vortices at street corners, mitigating localized high wind speeds that could cause pedestrian discomfort, while still maintaining adequate ventilation potential during summer. This suggests that orientation optimization for summer ventilation is a complex decision-making process that must balance ventilation efficiency and outdoor comfort.
At the building layout level, this study identified an optimal corridor width range of 2700–3000 mm. A wider corridor functions as an internal “breathing channel,” enhancing ventilation efficiency while also reducing the sense of spatial confinement. This finding highlights the trade-off between circulation and living space allocation under limited floor area. While the study provides a physics-based rationale for prioritizing ventilation, practical applications must also consider cost and functional requirements.
At the unit dormitory level, this study found that center-hung windows perform best in ventilation, as they guide airflow both upward and downward, enhancing air mixing and avoiding the “short-circuiting” seen in sliding or casement windows. In addition, the optimal corridor-side window height was identified as 2000–2100 mm, which leverages stack effect and pressure differences to draw air from the corridor through the living space and out the external windows, creating an efficient ventilation pathway.
The optimal configuration obtained through the orthogonal experiment increased the proportion of the comfort wind speed zone to 44.6% and reduced the mean air age to 258 s. This indicates that nearly half of the dormitory area can remain within the comfort wind speed range. Meanwhile, as a comparative indicator of ventilation efficiency, a reduction in air age indicates that the indoor air can be renewed within a shorter period of time, thereby effectively reducing the retention of pollutants and the risk of cross-infection. The CO2 concentration was also significantly lower than the 1000 ppm threshold recommended by ASHRAE 62.1, further confirming the overall effectiveness of the optimal configuration in improving the dormitory wind environment and indoor air quality.

Limitations and Future Directions

This study developed ventilation optimization strategies for university dormitories in Xuzhou, yet several limitations remain. First, the results are based on local climatic conditions; parameters such as a 15.5° building orientation or 90° casement openings may not be universally applicable, and their validity in other climates requires further testing. Second, while five key morphological factors were examined—including orientation and corridor width—environmental variables such as building density and vegetation were not fully considered, which may affect applicability in diverse settings. This study ignored the influence of indoor furniture in the CFD simulations, as previous studies have indicated that such factors have no significant effect on natural ventilation efficiency at the macro scale [38,40], although they may still affect local airflow patterns and pollutant dispersion. Moreover, since the investigated dormitory building is not surrounded by tall adjacent structures or dense vegetation, external obstructions were also simplified in the simulations.
Future research should focus on the following directions:
(1)
Building group planning and layout: Moving beyond single buildings, studies should explore how group layouts—especially in large campuses or residential complexes—affect overall ventilation efficiency and reduce wind interference.
(2)
Robustness and uncertainty analysis: The results of this study are based on a limited number of CFD simulation scenarios and an orthogonal experimental design, without statistical significance testing or uncertainty analysis. This to some extent restricts the systematic quantification of result robustness. Future research may incorporate sensitivity analysis and related methods to more comprehensively assess the influence and uncertainty of different parameters on ventilation performance, thereby enhancing the credibility and generalizability of the conclusions.
(3)
Integration of standard floors with communal spaces: Research should address how the design of standard floors, social areas, and public activity zones collectively shape airflow patterns and influence comfort and health.
(4)
Multi-climate validation: Key design parameters such as orientation and window angle should be tested across different climate zones to improve generalizability and adaptability.
(5)
Furniture and external obstructions: The omission of furniture arrangements and surrounding obstructions in the CFD simulations may introduce certain deviations in airflow predictions. Therefore, future studies could incorporate these factors into CFD models to enable a more precise evaluation of local comfort conditions and pollutant dilution.

5. Conclusions

Through on-site measurements, this study identified the current characteristics of a typical university dormitory building, such as indoor wind speed and CO2 concentration, and summarized the existing problems. A set of wind environment evaluation criteria was then selected under the framework of healthy building principles. Using numerical simulation, five influencing factors of the wind environment were analyzed.
(1)
Through simulation analysis of how building orientation affects the outdoor wind environment—considering Xuzhou’s prevailing wind direction—it was found that orienting the building between 8° and 23° yields superior wind conditions.
(2)
For linear-form dormitories, a corridor width of 2700–3000 mm improves indoor ventilation and air quality.
(3)
In unit dormitory layouts, under standard window-to-wall and window-to-floor ratios, wider windows result in better ventilation, ranked in descending order: 950 mm > 850 mm > 750 mm > 650 mm. Optimal ventilation was observed with interior corridor wall windows at a height of 2000–2100 mm. Horizontal center-hung windows offered the best ventilation performance, with 39% of the indoor area falling within comfortable wind speed ranges. Performance by window type ranked as follows: center-hung at 90° > side-hung at 60° > side-hung at 45° > typical sliding window > top-hung outward at 30° > bottom-hung inward at 30°.
(4)
Subsequently, orthogonal simulation was applied to combine these factors, and the optimal retrofit scheme was derived under the premise of healthy building orientation. The study yields the following conclusion: the optimal scheme obtained from the orthogonal simulation was the combination A2 + B2 + C2 + D2 + E2, corresponding to a building orientation of 15.5°, a corridor width of 2850 mm, a sash width of 850 mm, an internal window height of 2000 mm, and a casement window opening angle of 60°. Compared with other combinations, this scheme provided the highest proportion of indoor comfort wind speed area, while achieving lower air age and CO2 concentration.
By integrating wind environment simulations with architectural design principles, this study provides practical guidance for the design of future new dormitory buildings in the Xuzhou region and further contributes to the development of sustainable campus environments that comply with healthy building standards.

Author Contributions

Conceptualization, Z.D. and Y.Z.; methodology, Z.D. and Y.Z.; software, Y.Z.; validation, Y.Z. and L.W.; formal analysis, S.D.; investigation, Z.D. and Y.Z. All authors have read and agreed to the published version of the manuscript.

Funding

This research received no external funding.

Data Availability Statement

The data presented in this study are available on request from the corresponding author. The data are not publicly available due to institutional policy.

Conflicts of Interest

The authors declare no conflicts of interest.

References

  1. Klepeis, N.E.; Nelson, W.C.; Ott, W.R.; Robinson, J.P.; Tsang, A.M.; Switzer, P.; Behar, J.V.; Hern, S.C.; Engelmann, W.H. The National Human Activity Pattern Survey (NHAPS): A Resource for Assessing Exposure to Environmental Pollutants. J. Expo. Sci. Environ. Epidemiol. 2001, 11, 231–252. [Google Scholar] [CrossRef] [PubMed]
  2. Šujanová, P.; Rychtáriková, M.; Sotto Mayor, T.; Hyder, A. A Healthy, Energy-Efficient and Comfortable Indoor Environment, a Review. Energies 2019, 12, 1414. [Google Scholar] [CrossRef]
  3. Song, J.; Huang, X.; Shi, D.; Lin, W.E.; Fan, S.; Linden, P.F. Natural Ventilation in London: Towards Energy-Efficient and Healthy Buildings. Build. Environ. 2021, 195, 107722. [Google Scholar] [CrossRef]
  4. Shrestha, M.; Rijal, H.B. Investigation on Summer Thermal Comfort and Passive Thermal Improvements in Naturally Ventilated Nepalese School Buildings. Energies 2023, 16, 1251. [Google Scholar] [CrossRef]
  5. Chi, F.; Xu, Y. Building Performance Optimization for University Dormitory through Integration of Digital Gene Map into Multi-Objective Genetic Algorithm. Appl. Energy 2022, 307, 118211. [Google Scholar] [CrossRef]
  6. Li, H.; Li, X.; Qi, M. Field Testing of Natural Ventilation in College Student Dormitories (Beijing, China). Build. Environ. 2014, 78, 36–43. [Google Scholar] [CrossRef]
  7. Liu, Q.; Zhang, Y.; Ma, W.; Ren, J. Application of an Architect-Friendly Digital Design Approach to the Wind Environment of Campus Dormitory Buildings. Sustainability 2023, 15, 9168. [Google Scholar] [CrossRef]
  8. Leng, S.; Li, S.-W.; Hu, Z.-Z.; Wu, H.-Y.; Li, B.-B. Development of a Micro-in-Meso-Scale Framework for Simulating Pollutant Dispersion and Wind Environment in Building Groups. J. Clean. Prod. 2022, 364, 132661. [Google Scholar] [CrossRef]
  9. Zhang, H.; Zhao, Q.; Yi, M.; Liu, H.; Cao, K. Numerical Simulation Study on the Influence of Building Layout on Pollutant Dispersion in Industrial Parks Under Different Degrees of Stability. Int. J. Comput. Fluid. Dyn. 2024, 38, 596–609. [Google Scholar] [CrossRef]
  10. Peng, Z.; Jiang, M.; Liu, M.; He, T.; Jiang, N.; Huan, X. An Investigation into the Effects of Primary School Building Forms on Campus Wind Environment and Classroom Ventilation Performance. Appl. Sci. 2024, 14, 7174. [Google Scholar] [CrossRef]
  11. Tewari, P.; Mathur, S.; Mathur, J. Thermal Performance Prediction of Office Buildings Using Direct Evaporative Cooling Systems in the Composite Climate of India. Build. Environ. 2019, 157, 64–78. [Google Scholar] [CrossRef]
  12. Alsharif, R.; Arashpour, M.; Golafshani, E.M.; Hosseini, M.R.; Chang, V.; Zhou, J. Machine Learning-Based Analysis of Occupant-Centric Aspects: Critical Elements in the Energy Consumption of Residential Buildings. J. Build. Eng. 2022, 46, 103846. [Google Scholar] [CrossRef]
  13. Kalua, A.; Jo, S.J.; Fateminasab, S.; Al-Rciaibat, S.; Opitz, C. Impact of Ventilation Method on Residential Indoor PM Dispersion during Dust Storm Events in Saudi Arabia. Archit. Eng. Des. Manag. 2020, 16, 191–208. [Google Scholar] [CrossRef]
  14. Chen, H.; An, Y. Green Residential Building Design Scheme Optimization Based on the Orthogonal Experiment EWM-TOPSIS. Buildings 2024, 14, 452. [Google Scholar] [CrossRef]
  15. Wang, P.; Zhang, S. Retrofitting Strategies Based on Orthogonal Array Testing to Develop Nearly Zero Energy Buildings. Sustainability 2022, 14, 4451. [Google Scholar] [CrossRef]
  16. Cheng, Y.; Xie, S.; Yang, M.; Ma, Y.; He, Y.; Zheng, S. A Study on Natural Ventilation of Dormitories for College Students in Northeast China during Spring: A Case of Linear-Shaped Dormitory Buildings. J. Build. Eng. 2024, 90, 109402. [Google Scholar] [CrossRef]
  17. Shi, Y.; Li, Y.; Wang, R.; Li, X. A Framework for Optimizing the Indoor Spatial Layout of Outpatient Building Focusing on Respiratory Infection Control by Improving Natural Ventilation. J. Build. Eng. 2025, 104, 112352. [Google Scholar] [CrossRef]
  18. Aflaki, A.; Mahyuddin, N.; Baharum, M.R. The Influence of Single-Sided Ventilation towards the Indoor Thermal Performance of High-Rise Residential Building: A Field Study. Energy Build. 2016, 126, 146–158. [Google Scholar] [CrossRef]
  19. Fallahpour, M.; Naeini, H.G.; Mirzaei, P.A. Generic Geometrical Parametric Study of Wind-Driven Natural Ventilation to Improve Indoor Air Quality and Air Exchange in Offices. J. Build. Eng. 2024, 84, 108528. [Google Scholar] [CrossRef]
  20. Liu, L.; Wang, L.; Zhang, Y.; Dong, B.; Song, B. Study on Ventilation Rates at University Dormitories in Winter. In Proceedings of the 9th International Symposium on Heating, Ventilation And Air Conditioning (Ishvac) Joint with the 3rd International Conference on Building Energy and Environment (Cobee); Sun, Y., Pei, J., Eds.; Elsevier Science Bv: Amsterdam, The Netherlands, 2015; Volume 121, pp. 743–748. [Google Scholar]
  21. Bramiana, C.N.; Aminuddin, A.M.R.; Ismail, M.A.; Widiastuti, R.; Pramesti, P.U. The Effect of Window Placement on Natural Ventilation Capability in a Jakarta High-Rise Building Unit. Buildings 2023, 13, 1141. [Google Scholar] [CrossRef]
  22. Lei, Z.; Liu, C.; Wang, L.; Li, N. Effect of Natural Ventilation on Indoor Air Quality and Thermal Comfort in Dormitory during Winter. Build. Environ. 2017, 125, 240–247. [Google Scholar] [CrossRef]
  23. Jiang, Y.; Alexander, D.; Jenkins, H.; Arthur, R.; Chen, Q.Y. Natural Ventilation in Buildings: Measurement in a Wind Tunnel and Numerical Simulation with Large-Eddy Simulation. J. Wind. Eng. Ind. Aerodyn. 2003, 91, 331–353. [Google Scholar] [CrossRef]
  24. Ahmed, T.; Kumar, P.; Mottet, L. Natural Ventilation in Warm Climates: The Challenges of Thermal Comfort, Heatwave Resilience and Indoor Air Quality. Renew. Sust. Energ. Rev. 2021, 138, 110669. [Google Scholar] [CrossRef]
  25. Omrani, S.; Garcia-Hansen, V.; Capra, B.R.; Drogemuller, R. Effect of Natural Ventilation Mode on Thermal Comfort and Ventilation Performance: Full-Scale Measurement. Energy Build. 2017, 156, 1–16. [Google Scholar] [CrossRef]
  26. Park, S.; Choi, Y.; Song, D.; Kim, E.K. Natural Ventilation Strategy and Related Issues to Prevent Coronavirus Disease 2019 (COVID-19) Airborne Transmission in a School Building. Sci. Total Environ. 2021, 789, 147764. [Google Scholar] [CrossRef]
  27. Khatoon, S.; Shah, A.N. Prediction of Comfort Parameters for Naturally Ventilated Underground Car Parks. Nucleus 2016, 53, 214–220. [Google Scholar] [CrossRef]
  28. Tikul, N.; Hokpunna, A.; Chawana, P. Improving Indoor Air Quality in Primary School Buildings through Optimized Apertures and Classroom Furniture Layouts. J. Build. Eng. 2022, 62, 105324. [Google Scholar] [CrossRef]
  29. Poshtiri, A.H.; Mohabbati, S.M. Performance Analysis of Wind Catcher Integrated with Shower Cooling System to Meet Thermal Comfort Conditions in Buildings. J. Clean. Prod. 2017, 148, 452–466. [Google Scholar] [CrossRef]
  30. Ma’bdeh, S.N.; Hamasha, A.A.; Al-Shawabkeh, M.; Alali, R.O.; Almomani, R.M.; Obeidat, L.M.; Alrebei, O.F. Enhancing Office Air Quality: The Role of Window to Wall Ratio with Window-Wind Catchers Using CFD Analysis. Energy Rep. 2025, 13, 1508–1524. [Google Scholar] [CrossRef]
  31. Sun, H.; Owen, J.S.; Almazmumi, S.; Liu, C.; Mohammadi, M.; Dik, A.; Jimenez-Bescos, C.; Calautit, J.K. Pollutant Cross-Transmission in Courtyard Buildings: Wind Tunnel Experiments and Computational Fluid Dynamics (CFD) Evaluation. Build. Environ. 2024, 264, 111919. [Google Scholar] [CrossRef]
  32. Stenech, M.; Decitre, G.; Brenn, G.; Irrenfried, C. Experimental Investigation of the Ventilation Efficiency for Single-Sided Ventilation in Suburban Areas. Build. Environ. 2025, 283, 113280. [Google Scholar] [CrossRef]
  33. Deng, J.-Y.; Xia, Y.; Lao, H.; Ye, Y.; Wang, Z.; Jiang, H. Natural Ventilation Potential of Teaching Building Complexes with Different Block Shapes and Layout Patterns. J. Build. Eng. 2024, 96, 110420. [Google Scholar] [CrossRef]
  34. Turanjanin, V.; Vutiaevic, B.; Jovanovic, M.; La Mirkov, N.; Lazovic, I. Indoor CO2 Measurements in Serbian Schools and Ventilation Rate Calculation. Energy 2014, 77, 290–296. [Google Scholar] [CrossRef]
  35. Zhang, W.; Wang, L.; Ji, Z.; Ma, L.; Hui, Y. Test on Ventilation Rates of Dormitories and Offices in University by the CO2 Tracer Gas Method. Procedia Eng. 2015, 121, 662–666. [Google Scholar] [CrossRef]
  36. Liu, T.; Lee, W.L. Influence of Window Opening Degree on Natural Ventilation Performance of Residential Buildings in Hong Kong. Sci. Technol. Built Environ. 2020, 26, 28–41. [Google Scholar] [CrossRef]
  37. Li, Y.; Li, L.; Cui, X.; Shen, P. Coupled Building Simulation and CFD for Real-Time Window and HVAC Control in Sports Space. J. Build. Eng. 2024, 97, 110731. [Google Scholar] [CrossRef]
  38. Zhao, Y.; Zhang, X.; Ling, H.; Jia, S.; Yang, X.; Zhang, Y.; Zhao, B.; Hua, J. Utilizing Periodic Boundary Conditions to Save Computational Resources for Assessing Building Natural Ventilation in Urban Areas. Urban. Clim. 2024, 55, 101925. [Google Scholar] [CrossRef]
  39. Hong, B.; Qin, H.; Lin, B. Prediction of Wind Environment and Indoor/Outdoor Relationships for PM2.5 in Different Building-Tree Grouping Patterns. Atmosphere 2018, 9, 39. [Google Scholar] [CrossRef]
  40. Hormigos-Jimenez, S.; Angel Padilla-Marcos, M.; Meiss, A.; Alonso Gonzalez-Lezcano, R.; Feijo-Munoz, J. Computational Fluid Dynamics Evaluation of the Furniture Arrangement for Ventilation Efficiency. Build. Serv. Eng. Res. Technol. 2018, 39, 557–571. [Google Scholar] [CrossRef]
Figure 1. Floor plan of Dormitory Building No. 4.
Buildings 15 03630 g001
Figure 2. Layout of measurement points in Dormitory Building No. 4.
Buildings 15 03630 g002
Figure 3. Field measurement photographs of Dormitory Building No. 4.
Buildings 15 03630 g003
Figure 4. Outdoor temperature and humidity variations.
Buildings 15 03630 g004
Figure 5. Outdoor wind speed.
Buildings 15 03630 g005
Figure 6. Physical model of Dormitory Building No. 4.
Buildings 15 03630 g006
Figure 7. Baseline unit model extracted from the dormitory building.
Buildings 15 03630 g007
Figure 8. Simulation results of three floors of four dormitory buildings.
Buildings 15 03630 g008
Figure 9. Comparative analysis of measured data and simulation results.
Buildings 15 03630 g009
Figure 10. Comparison of comfort wind speed area ratios in orthogonal simulation experiments.
Buildings 15 03630 g010
Figure 11. Comparison of air age values in orthogonal simulation experiments.
Buildings 15 03630 g011
Figure 12. Comparison of CO2 concentrations in orthogonal simulation experiments.
Buildings 15 03630 g012
Figure 13. Comparison of orthogonal experiments 18, 19, 20, and 21.
Buildings 15 03630 g013
Table 2. Relationship between wind speed and human comfort.
Wind Speed (m/s)Effect
0–0.25Hardly perceptible
0.25–0.5Pleasant, does not interfere with work
0.5–1.0Relatively comfortable, but may cause paper displacement
1.0–1.5Slightly disturbing airflow, unpleasant draught, paper easily blown off
>1.5To maintain work efficiency and a healthy environment, ventilation volume should be adjusted and airflow paths effectively managed when significant draught occurs
Table 3. Seven-level PMV thermal comfort scale.
Thermal SensationColdCoolSlightly CoolNeutralSlightly WarmWarmHot
PMV Index−3−2−10123
Table 4. Evaluation criteria of air age in indoor air quality.
Air Age T (s)T < 225225 ≤ T < 400T ≥ 400
FreshnessFreshRelatively FreshNot Fresh
Table 5. Simulation results for different corridor widths.
Corridor Width (mm)Wind Speed (m/s) Air Age (s) CO2 Concentration (ppm)
2100 mmBuildings 15 03630 i001Buildings 15 03630 i002Buildings 15 03630 i003Buildings 15 03630 i004Buildings 15 03630 i005Buildings 15 03630 i006
2400 mmBuildings 15 03630 i007Buildings 15 03630 i008Buildings 15 03630 i009Buildings 15 03630 i010Buildings 15 03630 i011Buildings 15 03630 i012
2700 mmBuildings 15 03630 i013Buildings 15 03630 i014Buildings 15 03630 i015Buildings 15 03630 i016Buildings 15 03630 i017Buildings 15 03630 i018
3000 mmBuildings 15 03630 i019Buildings 15 03630 i020Buildings 15 03630 i021Buildings 15 03630 i022Buildings 15 03630 i023Buildings 15 03630 i024
Table 6. Simulation results for different window sash widths.
Window Sash Width (mm)Wind Speed (m/s) Air Age (s) CO2 Concentration (ppm)
650 mmBuildings 15 03630 i025Buildings 15 03630 i026Buildings 15 03630 i027Buildings 15 03630 i028Buildings 15 03630 i029Buildings 15 03630 i030
750 mmBuildings 15 03630 i031Buildings 15 03630 i032Buildings 15 03630 i033Buildings 15 03630 i034Buildings 15 03630 i035Buildings 15 03630 i036
850 mmBuildings 15 03630 i037Buildings 15 03630 i038Buildings 15 03630 i039Buildings 15 03630 i040Buildings 15 03630 i041Buildings 15 03630 i042
950 mmBuildings 15 03630 i043Buildings 15 03630 i044Buildings 15 03630 i045Buildings 15 03630 i046Buildings 15 03630 i047Buildings 15 03630 i048
Table 7. Relationship between window layout and ventilation performance. Arrows indicate airflow direction.
TypeExampleCharacteristics
LateralBuildings 15 03630 i049Poor performance in introducing outdoor wind, resulting in unsatisfactory indoor ventilation
SequentialBuildings 15 03630 i050Small pressure difference between windows; even if wind enters through openings, effective ventilation is difficult to achieve
ReverseBuildings 15 03630 i051Side openings on the leeward side hinder indoor air circulation; only limited airflow exits, leading to poor ventilation
VerticalBuildings 15 03630 i052Indoor ventilation is obstructed; airflow is turbulent in corner zones, forming vortices
StaggeredBuildings 15 03630 i053Large ventilation area ensures smooth airflow into the interior, effectively reducing vortices
Single-sided crossBuildings 15 03630 i054Openings on the same side allow overall airflow, but uneven wind speeds cause vortex formation
Through-corridorBuildings 15 03630 i055Strong cross-ventilation effect with reduced vortices, achieving excellent ventilation performance
Table 8. Simulation results for different internal window heights.
Internal Window Height (mm)Wind Speed (m/s) Air Age (s) CO2 Concentration (ppm)
1800 mmBuildings 15 03630 i056Buildings 15 03630 i057Buildings 15 03630 i058Buildings 15 03630 i059Buildings 15 03630 i060Buildings 15 03630 i061
1900 mmBuildings 15 03630 i062Buildings 15 03630 i063Buildings 15 03630 i064Buildings 15 03630 i065Buildings 15 03630 i066Buildings 15 03630 i067
2000 mmBuildings 15 03630 i068Buildings 15 03630 i069Buildings 15 03630 i070Buildings 15 03630 i071Buildings 15 03630 i072Buildings 15 03630 i073
2100 mmBuildings 15 03630 i074Buildings 15 03630 i075Buildings 15 03630 i076Buildings 15 03630 i077Buildings 15 03630 i078Buildings 15 03630 i079
2200 mmBuildings 15 03630 i080Buildings 15 03630 i081Buildings 15 03630 i082Buildings 15 03630 i083Buildings 15 03630 i084Buildings 15 03630 i085
Table 9. Simulation results for different window types.
Window TypeWind Speed (m/s) Air Age (s) CO2 Concentration (ppm)
Sliding windowBuildings 15 03630 i086Buildings 15 03630 i087Buildings 15 03630 i088Buildings 15 03630 i089Buildings 15 03630 i090Buildings 15 03630 i091
Bottom-hung window 30°Buildings 15 03630 i092Buildings 15 03630 i093Buildings 15 03630 i094Buildings 15 03630 i095Buildings 15 03630 i096Buildings 15 03630 i097
Top-hung window 30°Buildings 15 03630 i098Buildings 15 03630 i099Buildings 15 03630 i100Buildings 15 03630 i101Buildings 15 03630 i102Buildings 15 03630 i103
Casement window 45°Buildings 15 03630 i104Buildings 15 03630 i105Buildings 15 03630 i106Buildings 15 03630 i107Buildings 15 03630 i108Buildings 15 03630 i109
Casement window 60°Buildings 15 03630 i110Buildings 15 03630 i111Buildings 15 03630 i112Buildings 15 03630 i113Buildings 15 03630 i114Buildings 15 03630 i115
Mid-hung window 90°Buildings 15 03630 i116Buildings 15 03630 i117Buildings 15 03630 i118Buildings 15 03630 i119Buildings 15 03630 i120Buildings 15 03630 i121
Table 10. Results of orthogonal simulation experiments.
GroupABCDEComfort Wind Speed Area (%)Air Age (s)CO2 Concentration (ppm)
11113335.1349769
21222238.6301685
31331137.5312713
42112240.7297672
52221138.2303691
62333336.5328739
73123241.8293689
83232337.2318726
93311137.9305701
101132238.6298689
111213138.1300697
121321336.4330743
132121336.8323722
142233241.9291685
152312138.7297688
163132137.8306706
173211336.2338752
183323242.4287673
Table 11. Mean value and range analysis of indoor comfort wind speed area ratio.
GroupABCDE
K ¯ 138.20039.00037.38339.26736.367
K ¯ 238.36737.78338.85038.23339.983
K ¯ 338.46738.25038.80037.53338.683
R0.2671.2171.4671.7343.616
Factor ranking of influenceE > D > C > B > A
Theoretical optimal combinationA3 + B1 + C2 + D1 + E2
Table 12. Mean value and range analysis of air age.
GroupABCDE
K ¯ 1311.000313.167314.333307.833331.000
K ¯ 2308.500308.167306.167306.500296.500
K ¯ 3309.833308.000308.833315.000301.833
R2.5005.1678.1668.50034.500
Factor ranking of influenceE > C > D > B > A
Theoretical optimal combinationA1 + B1 + C1 + D3 + E1
Table 13. Mean value and range analysis of CO2 concentration.
GroupABCDE
K ¯ 1707.833708.667713.167699.500741.833
K ¯ 2709.500711.333700.500716.000684.167
K ¯ 3706.000703.333709.667707.833697.333
R3.5008.00012.66716.50057.666
Factor ranking of influenceE > C > D > B > A
Theoretical optimal combinationA2 + B2 + C2 + D2 + E2
Table 14. Simulation results of Experiments 18, 19, 20, and 21.
GroupABCDEComfort Wind Speed Area (%)Air Age (s)CO2 Concentration (ppm)
183323242.4287673
193121238.5317689
201113137.1341738
212222244.6258613
Disclaimer/Publisher’s Note: The statements, opinions and data contained in all publications are solely those of the individual author(s) and contributor(s) and not of MDPI and/or the editor(s). MDPI and/or the editor(s) disclaim responsibility for any injury to people or property resulting from any ideas, methods, instructions or products referred to in the content.