Article

Research on the Mechanical Properties of Mechanically Connected Splices of Prestressing Screw Bars Under Monotonic and Cyclic Loads

1
School of Architectural and Civil Engineering, Yan’an University, Yan’an 716000, China
2
Powerchina Northwest Engineering Corporation Limited, Xi’an 710065, China
*
Author to whom correspondence should be addressed.
Buildings 2025, 15(19), 3614; https://doi.org/10.3390/buildings15193614
Submission received: 12 September 2025 / Revised: 30 September 2025 / Accepted: 4 October 2025 / Published: 9 October 2025
(This article belongs to the Section Building Structures)

Abstract

The mechanical properties of screw-thread steel bars used for prestressing concrete and their threaded ribs’ bearing mechanism have not been quantitatively studied, in contrast to the extensive qualitative research on ordinary steel mechanical connection splices. A quantitative investigation was conducted under various design parameters and working conditions to examine the mechanical connection splices of screw-thread steel bars used for prestressing concrete. The splices’ connection performance and their threaded ribs’ bearing mechanism were also examined. Analyzing the force on the threads of the splices under monotonic tensile loading allowed for the theoretical computation of the axial force coefficients for threaded ribs. The validated revised three-dimensional numerical model of splices is based on the findings of the theoretical calculations. Afterwards, rigorous numerical simulations of monotonic tensile loading, repeated tensile and compressive loading with high stress, and repeated tensile and compressive loading with large strain were performed on 45 splices with varying nominal rebar diameters, coupler outer diameters and lengths, and thread rib spacings. The results show that rebar pullout and rebar fracture are the two main ways in which splices might fail. After cyclic loading, the splices’ ultimate bearing capacity changed by 0.83% to 2.81%, and their ductility changed by 2.13% to 4.75% compared to after monotonic tensile loading. Although the splice load-carrying capacity and plastic deformation capacity were reduced by 2.11%~7.48% and 3.98%~25.78%, respectively, when the thread rib spacing was increased from the specified value to 0.6~0.8 times the nominal diameter of the rebar, the splice connection performance was still able to meet the requirements for class I splices. Approximately half of the splices’ load-bearing capability is provided by the 1–2 turns of threads close to the coupler ends; after cyclic loading, their stress rises by between 4.52% and 12.63% relative to monotonic tension. Stresses in all threaded ribs of the splices are increased by 5.49% to 27.76% as the distance between the threaded ribs increases to 1.0 and 1.2 times the nominal diameter of the rebar, which reduces the splice’s load-bearing capacity.

1. Introduction

PSBs, or prestressing screw-thread steel bars, are mechanically connected to concrete and have a very high tensile strength, making them ideal for usage in a wide range of reinforced concrete constructions [1,2,3]. Whether or not this is a physically necessary feature, rebar mechanical connection splices can transfer force flow using couplers with internal threads. Using yield strengths ranging from 506 MPa to 549 MPa for steel reinforcement, Bompa et al. [4] investigated mechanical property variations caused by the presence or absence of various mechanical connection splices embedded in concrete. When tested under identical high-strain-rate settings, Rowell et al. [5] found that straight-threaded mechanical splices fared the best among the commonly used splices. According to research by Ruangrassamee et al. [6], mechanically connected splices have better ductility than disconnected reinforcement when it comes to dissipating energy during seismic action. For precast concrete buildings, Li et al. [7] tested a variety of loading scenarios to determine the mechanical characteristics of a slab-type rebar mechanical connection splice. After conducting stress testing on concrete beams with mechanically linked splices, Jeong et al. [8] came to the conclusion that these connections can produce reinforcing connections of equivalent strength. The results of the experimental studies carried out by Li et al. [9] and Zhang et al. [10] on mechanically connected spliced shear wall structures and assembled frame columns, respectively, demonstrated that the mechanical connection is capable of efficiently transferring the tension and pressure of reinforcement bars within the assembled structure.
In conclusion, ordinary hot-rolled steel bars and concrete components using ordinary hot-rolled steel bar connection splices are the primary focus of current research on mechanical connection splices for rebars. Although there are more studies on the strength and ductility of regular steel splices, they are all qualitative evaluations of the splices’ mechanical characteristics. The mechanical characteristics of PSB mechanical connection splices with various design parameters during loading, particularly under repeated tensile and compressive cycle loading, have not been quantitatively examined in many studies. However, it is unclear how the threaded ribs of PSB mechanical connection splices are loaded under various operating circumstances. The mechanical properties of PSB830 mechanical connection splices with different configurations under monotonous and cyclic loading, as well as the load-bearing mechanism between their threaded ribs, are thus investigated in this paper based on theoretical calculations and refined numerical simulations. The findings can offer some references for the application of PSB830 mechanical connections in real-world engineering structures.

2. Three-Dimensional Refined Numerical Modeling

2.1. Splices’ Geometric Parameters

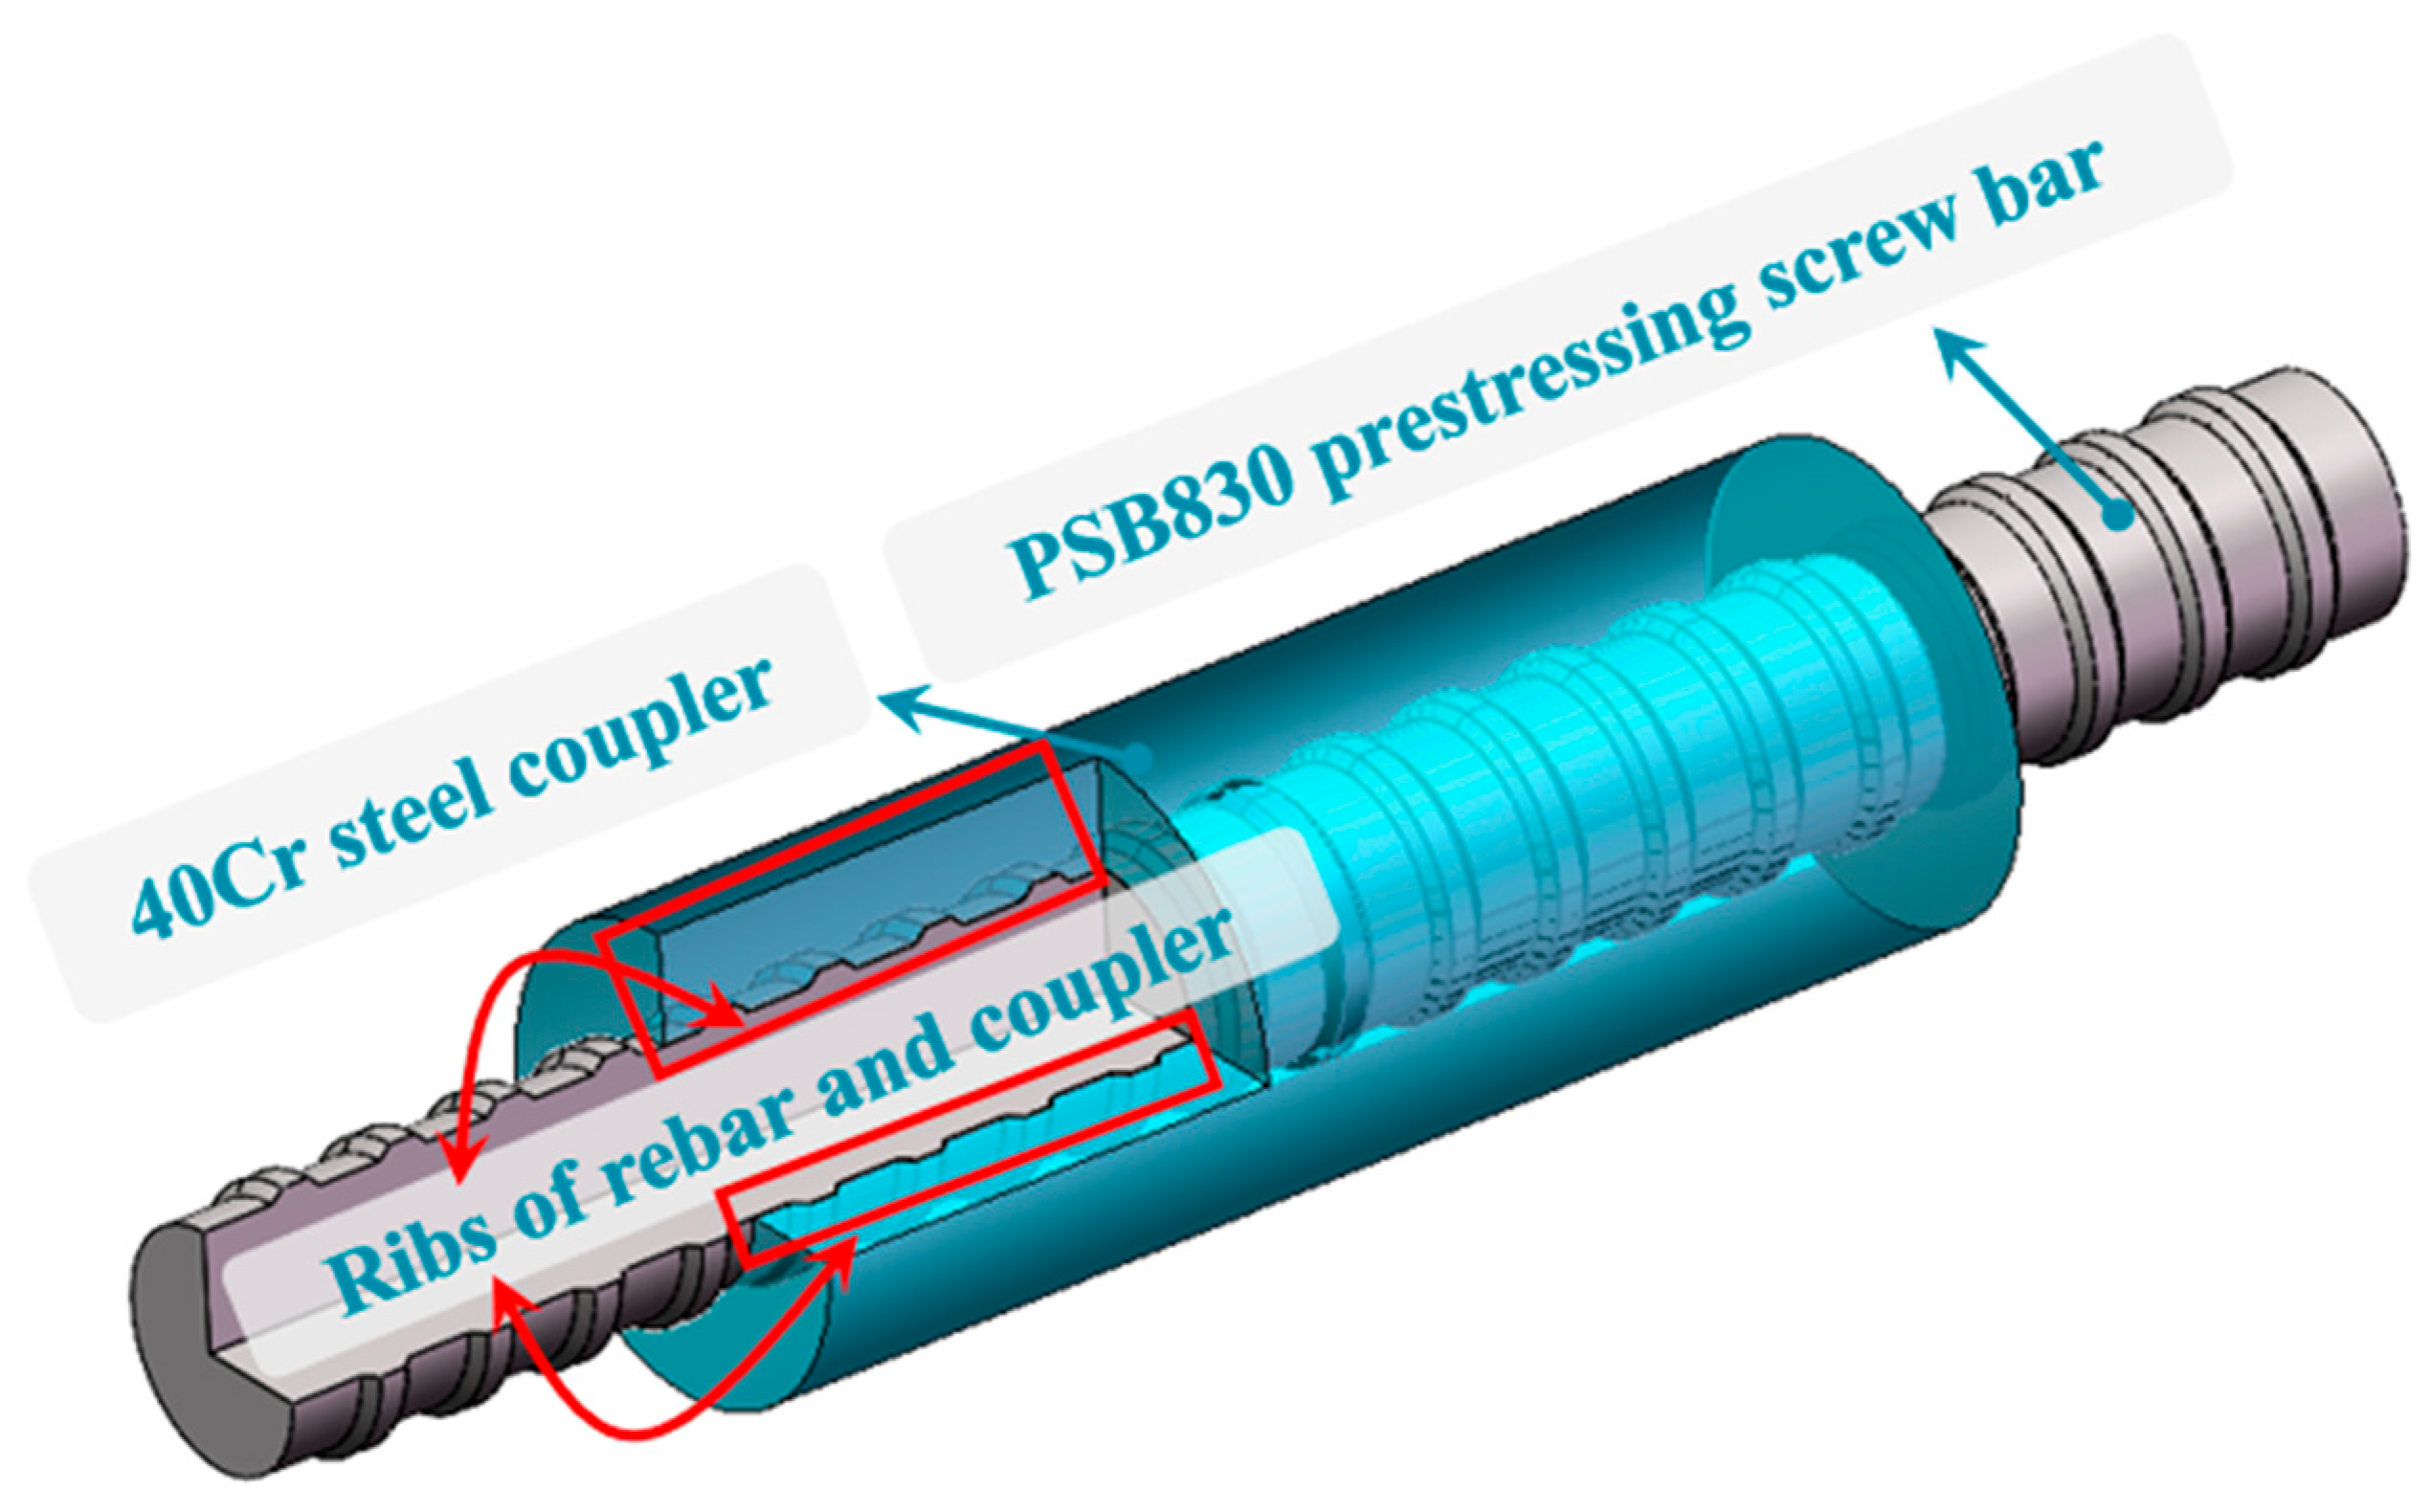
Figure 1 is a schematic representation of the geometric configuration of the PSB mechanical connection splices, which include a coupler with matching threads that splices the two ends of the rebars.
The mechanical connection splices of PSB830 were studied for their mechanical connection properties under 45 different loading conditions. The splices were categorized into three types: I, II, and III. This classification was based on the variations in the nominal diameter of the PSB, the spacing of the PSB thread ribs, and the loading regimes. Each type of splice consisted of 5 splices, labeled A to E. High-stress and large-strain repeated tensile and compressive loadings are the two categories into which splices were placed in the cyclic loading regime [11,12]. Table 1 displays the designations of each splice under each loading condition. By measuring the outside diameter and length of the standard connections for PSB830 rebars in a steel factory, the geometrical characteristics of the couplers used in each splice were determined. Under mechanical occlusion, the threaded ribs of the rebars and couplers must have their solid geometry taken into account in order to conduct an accurate analysis of their force and deformation properties [13]. Since the angle of thread rise has little effect on the connection performance of threaded structures [14,15], according to domestic and international standards [16,17], the threaded ribs of the splices can be converted into parallel ring ribs with a trapezoidal cross-section [18]. For each splice at various threaded rib spacings, Table 2 shows the particular geometrical dimensions of the rebar and coupler. The table shows that the thread rib spacing of the steel bars for each type of A splice was determined according to “Screw-thread steel bars for the prestressing of concrete” (GB/T 20065-2016) [16]. The spacings of the steel bars for each type of B, C, D, and E splices were determined to be 0.6 times, 0.8 times, 1.0 times, and 1.2 times the nominal diameter of the PSB830 rebars, respectively, according to Chinese and European standards [19,20].

2.2. Testing Procedure for Loads and Loading Schedule

For both monotonic and cyclic loading, the electrohydraulic servo loading system must be configured with displacement gauges for the splices. These gauges, arranged at the standard distance of the splices, measure deformation. Figure 2 shows both the loading test system and the configuration of the displacement gauges.
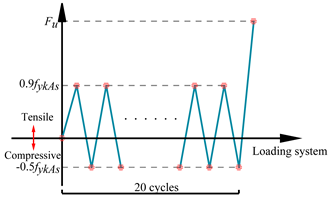
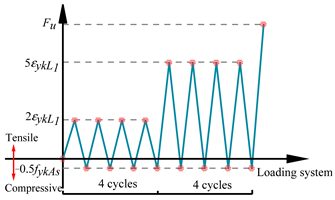
The loading regime was divided into monotonic and cyclic loading according to the loading test method for mechanical connection splices in ISO 15835-2 [21]. Extending the splices to their breaking point (rebar fracture, rebar pullout from the couplers with coupler destruction) is all that is needed in the monotonic loading regime [22]. Table 3 shows the several loading methods used in the cyclic loading regime, which are further classified as either high-stress repeated tension and compression loading (HSL) or large-strain repeated tension and compressive loading (LSL).

2.3. Element Selection and Grid Division

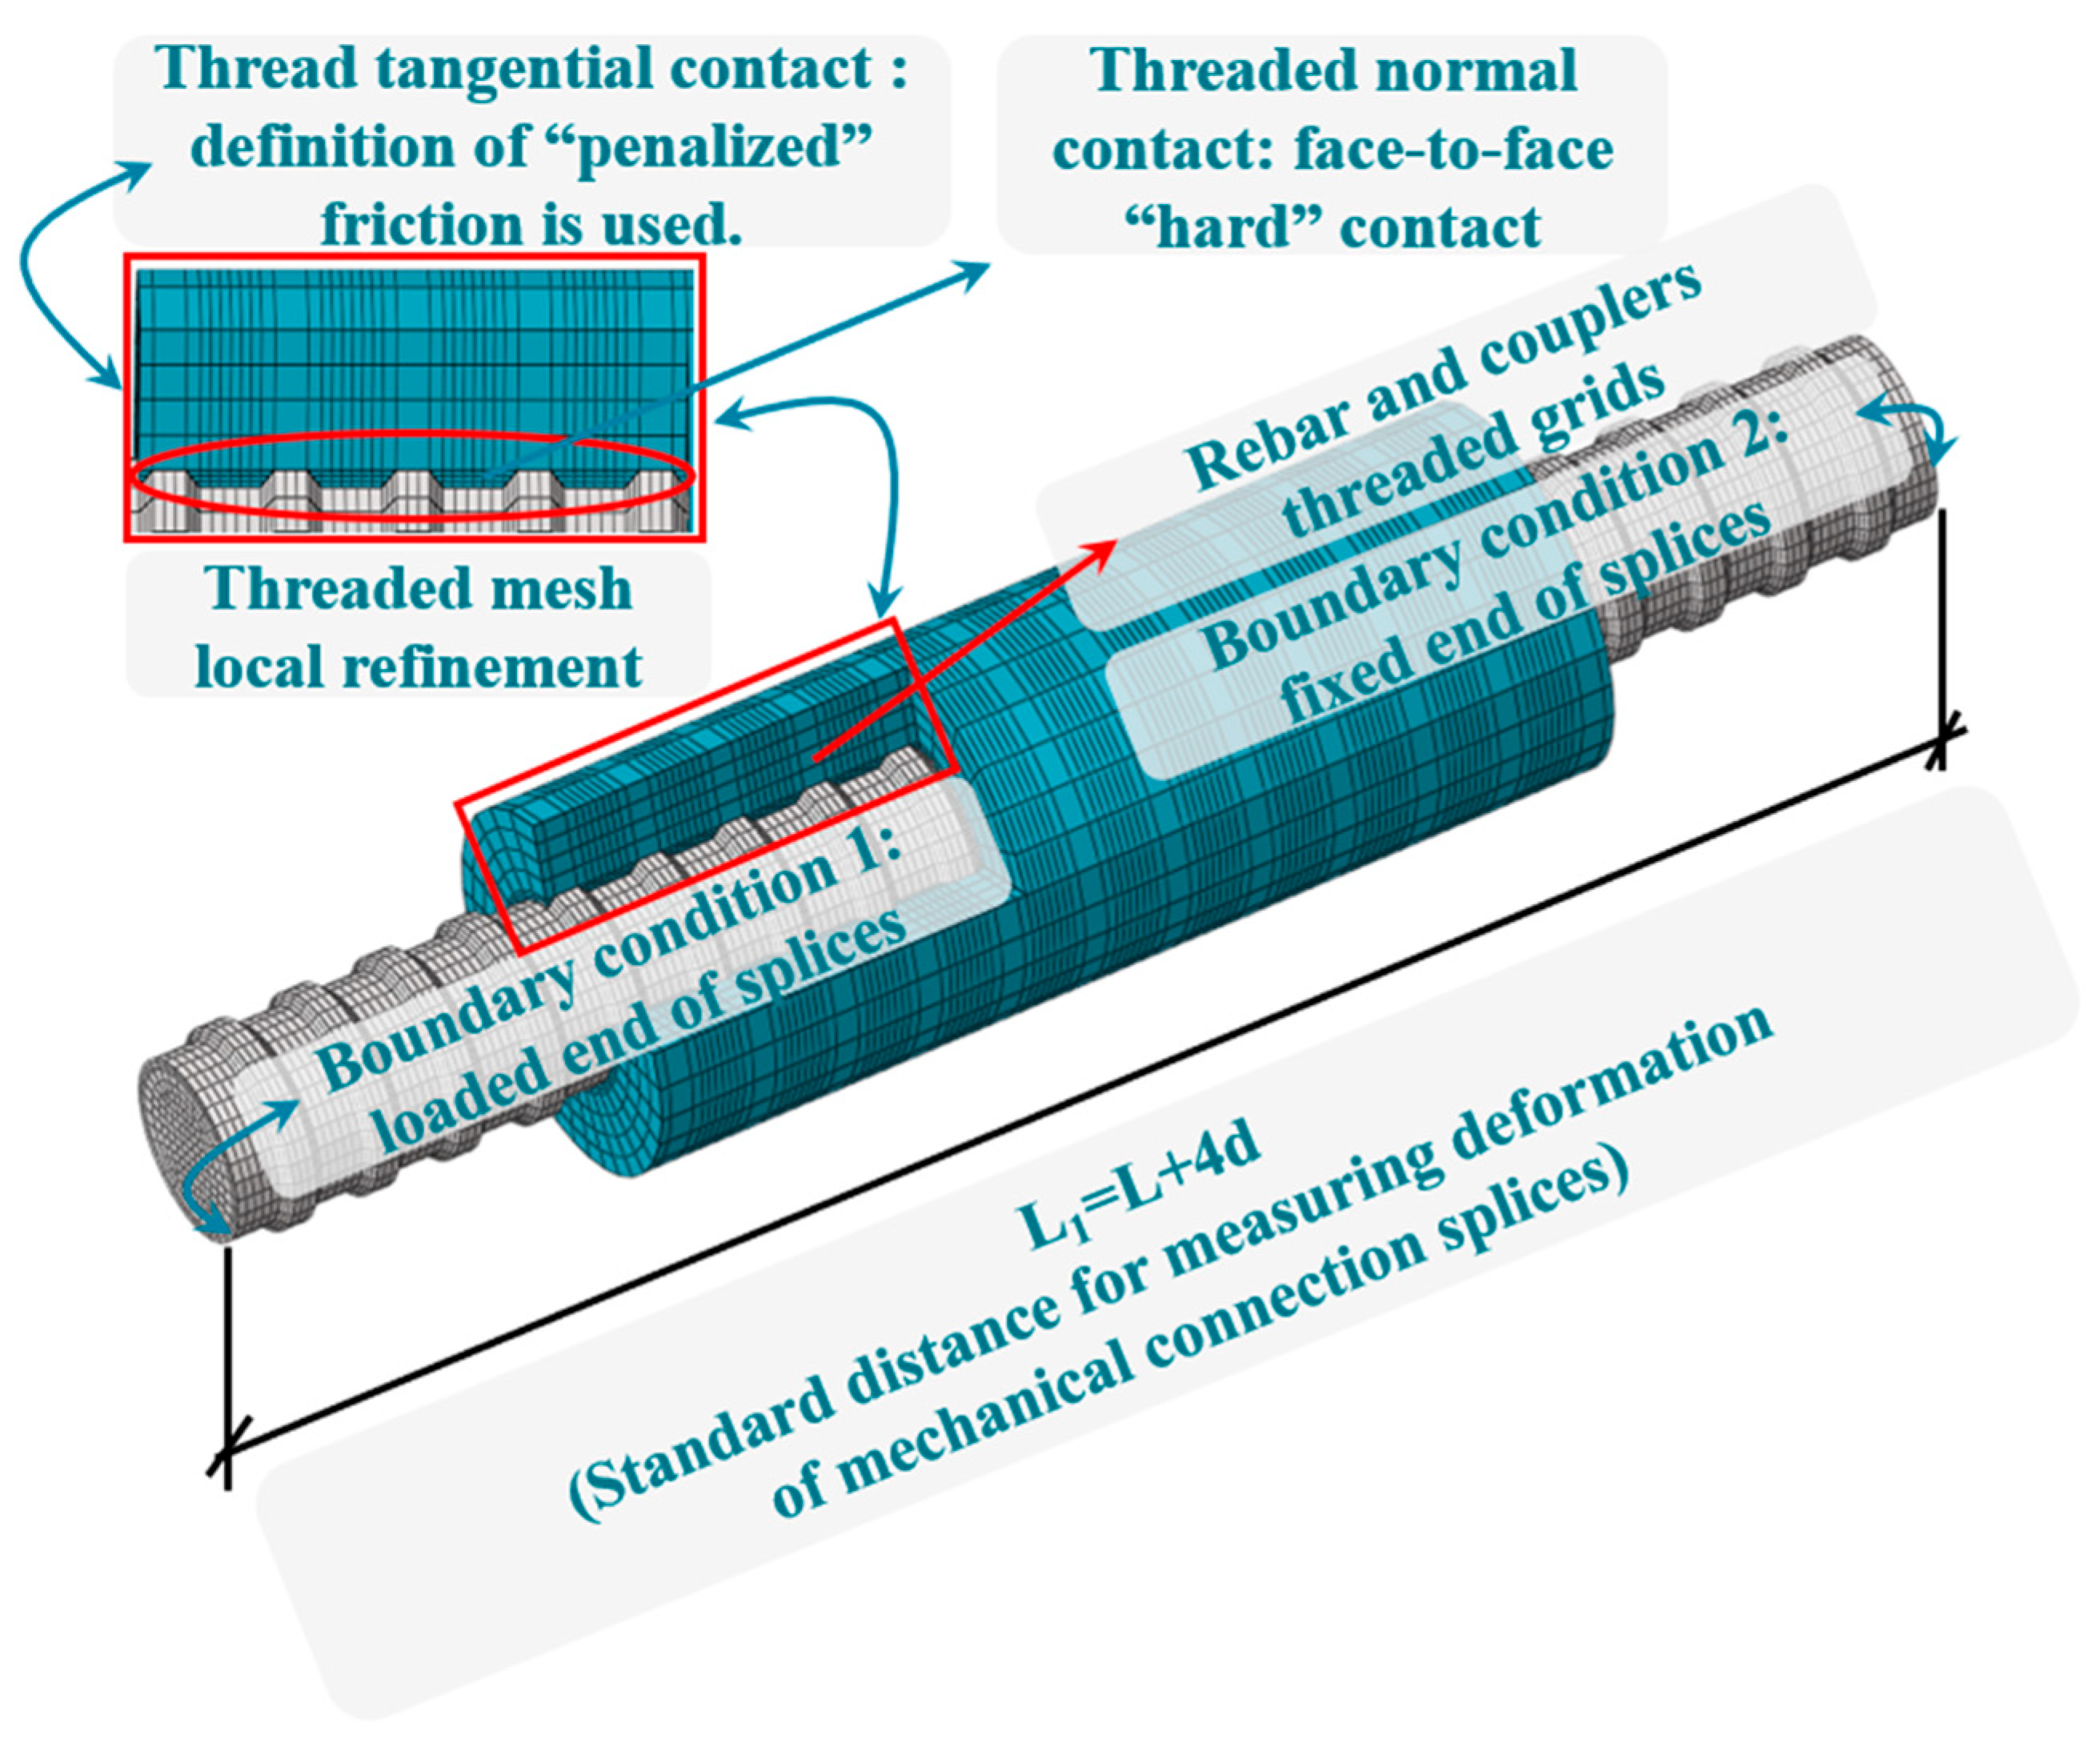
Figure 3 displays the results of creating an improved three-dimensional numerical model of PSB830 rebar mechanical connection splices and meshing it according to the splices’ geometric properties. The meshing results are shown in Figure 4.
C3D8R elements were utilized for the rebars and couplers. The mesh was locally encrypted with the ribs of the rebars and couplers so that the influence of the threaded ribs on the performance of the splice connection could be carefully studied. The threaded ribs of the splices are in contact with each other in a “face-to-face contact” orientation, which is defined as “penalized friction” with a friction coefficient of 0.15 [23,24] for normal contact and “hard” contact for tangential contact. “Hard” contact is the term used to describe the tangential touch. The coupler’s more rigid surface is taken as the master surface, and the rebar’s less rigid surface is designated the slave surface.

2.4. Constitutive Model of Splices

2.4.1. Constitutive Model of PSB

The main GMP hysteresis model was selected in order to simulate and analyze the PSB830 rebar [25,26]. An important factor affecting the splices’ performance is the Bauschinger effect, which this model faithfully replicates when subjected to cyclic loading on high-strength steel. With the parameters Q and ε c h determined using Equation (2) [27], the computational formula of the GMP model is shown in Equation (1).
σ = E ε Q + 1 Q [ 1 + ( ε / ε ch ) C ] 1 / C
Q = 0.1 ( ε s t k ) 2.5 ε c h = σ s t k Q E ε s t k E ( 1 Q )
where σ and ε : the stress and strain of PSB830 rebar, respectively; E: the elastic modulus of the bar; ε c h : the strain value of the characteristic parameter; Q: the ratio of tangential stiffness at the point of ultimate tensile strength of the bar to the initial tangential stiffness; and C: the curvature coefficient of the elastic–plastic curve for the transition from the elastic to plastic section of the bar, which is taken as 3.0 [28]. The various material parameters of PSB830 rebar are given in Table 4.

2.4.2. Constitutive Model of Coupler

The connectors of PSB rebar splices are steel couplers, and the bifurcated follower reinforcement model is selected as the intrinsic model of steel connectors [13,30], which is shown in Equation (3).
σ = E ε ε ε y k σ 0 + ( ε ε y k ) × ( σ s t k σ y k ) ε s t k × ε y k ε y k < ε ε s t k 0 ε s t k < ε
where E: the modulus of elasticity of the couplers; σ : stress; ε : strain; σ y k : yield stress; ε y k : yield strain; σ s t k : ultimate stress; and ε s t k : ultimate strain. The various material parameters of the steel couplers are given in Table 4.

2.5. Verification of the Validity of the Refinement Model

Figure 5 shows the force analysis of the splice under monotonic tensile load. In this case, F is the load on the end face of the PSB830 rebar and is the normal force on the contact surface of the threaded ribs. The thread bearing capacity is the key to the performance of the mechanical connection splices of threaded rebar. By modeling the threads as a cantilever beam, YAMATOTO was able to theoretically calculate the load-carrying capacity between them [31]. It then went on to refine and classify the different thread deformations in the connection (Figure 6), where a is the width of the threaded root, b is the height of the threaded knuckle, c is the height of the threaded knuckle, and α is the angle of the threaded tooth pattern.
Equation (4) provides the formula for determining a threaded connection’s load-bearing capacity:
F ( x ) F = sinh ( λ x ) sinh ( λ L )
where λ is the characteristic parameter of thread axial load distribution, and the solution needs to be solved by Equations (5)–(8).
δ 1 = ( 1 υ 3 ) 3 ω cos α 4 E 1 ( 2 b a ) 2 + 2 log e ( a b ) cot 3 α 4 ( c a ) 2 tan α δ 2 = ( 1 + υ ) 6 ω cos α 5 E cot α log e ( a b ) δ 3 = ( 1 υ 2 ) 12 c π E a 2 ω cos α ( c b 2 tan α ) δ 4 = ( 1 υ 2 ) 2 ω cos α π E P a log e P + a 2 P a 2 + 1 2 log e ( 4 P 2 a 2 1 ) δ 5 = u tan α
where υ : Poisson’s ratio of the material; E: modulus of elasticity of the material; P: pitch; and u : deformation of the thread due to the radial force.
u r = ( 1 ν r ) ω 2 E r d p P sin α u c = ( d t 2 + d p 2 d t 2 + d p 2 + υ c ) ω 2 E c d p P sin α
where u r : radial deformation of rebar threads; u c : radial deformation of connector threads; ν r : Poisson’s ratio of rebar material; ν c : Poisson’s ratio of connector material; d t : outer diameter of couplers; and d p : effective diameter of rebar.
δ r = i = 1 5 δ i r = k r E r ω cos α δ c = i = 1 5 δ i c = k c E c ω cos α
where k r : integrated coefficient of elastic deformation of rebar threads; k c : integrated coefficient of elastic deformation of couplers threads.
λ = 1 E r A r + 1 E c A c ( k r E r + k c E c ) tan β
where β : thread rise angle.
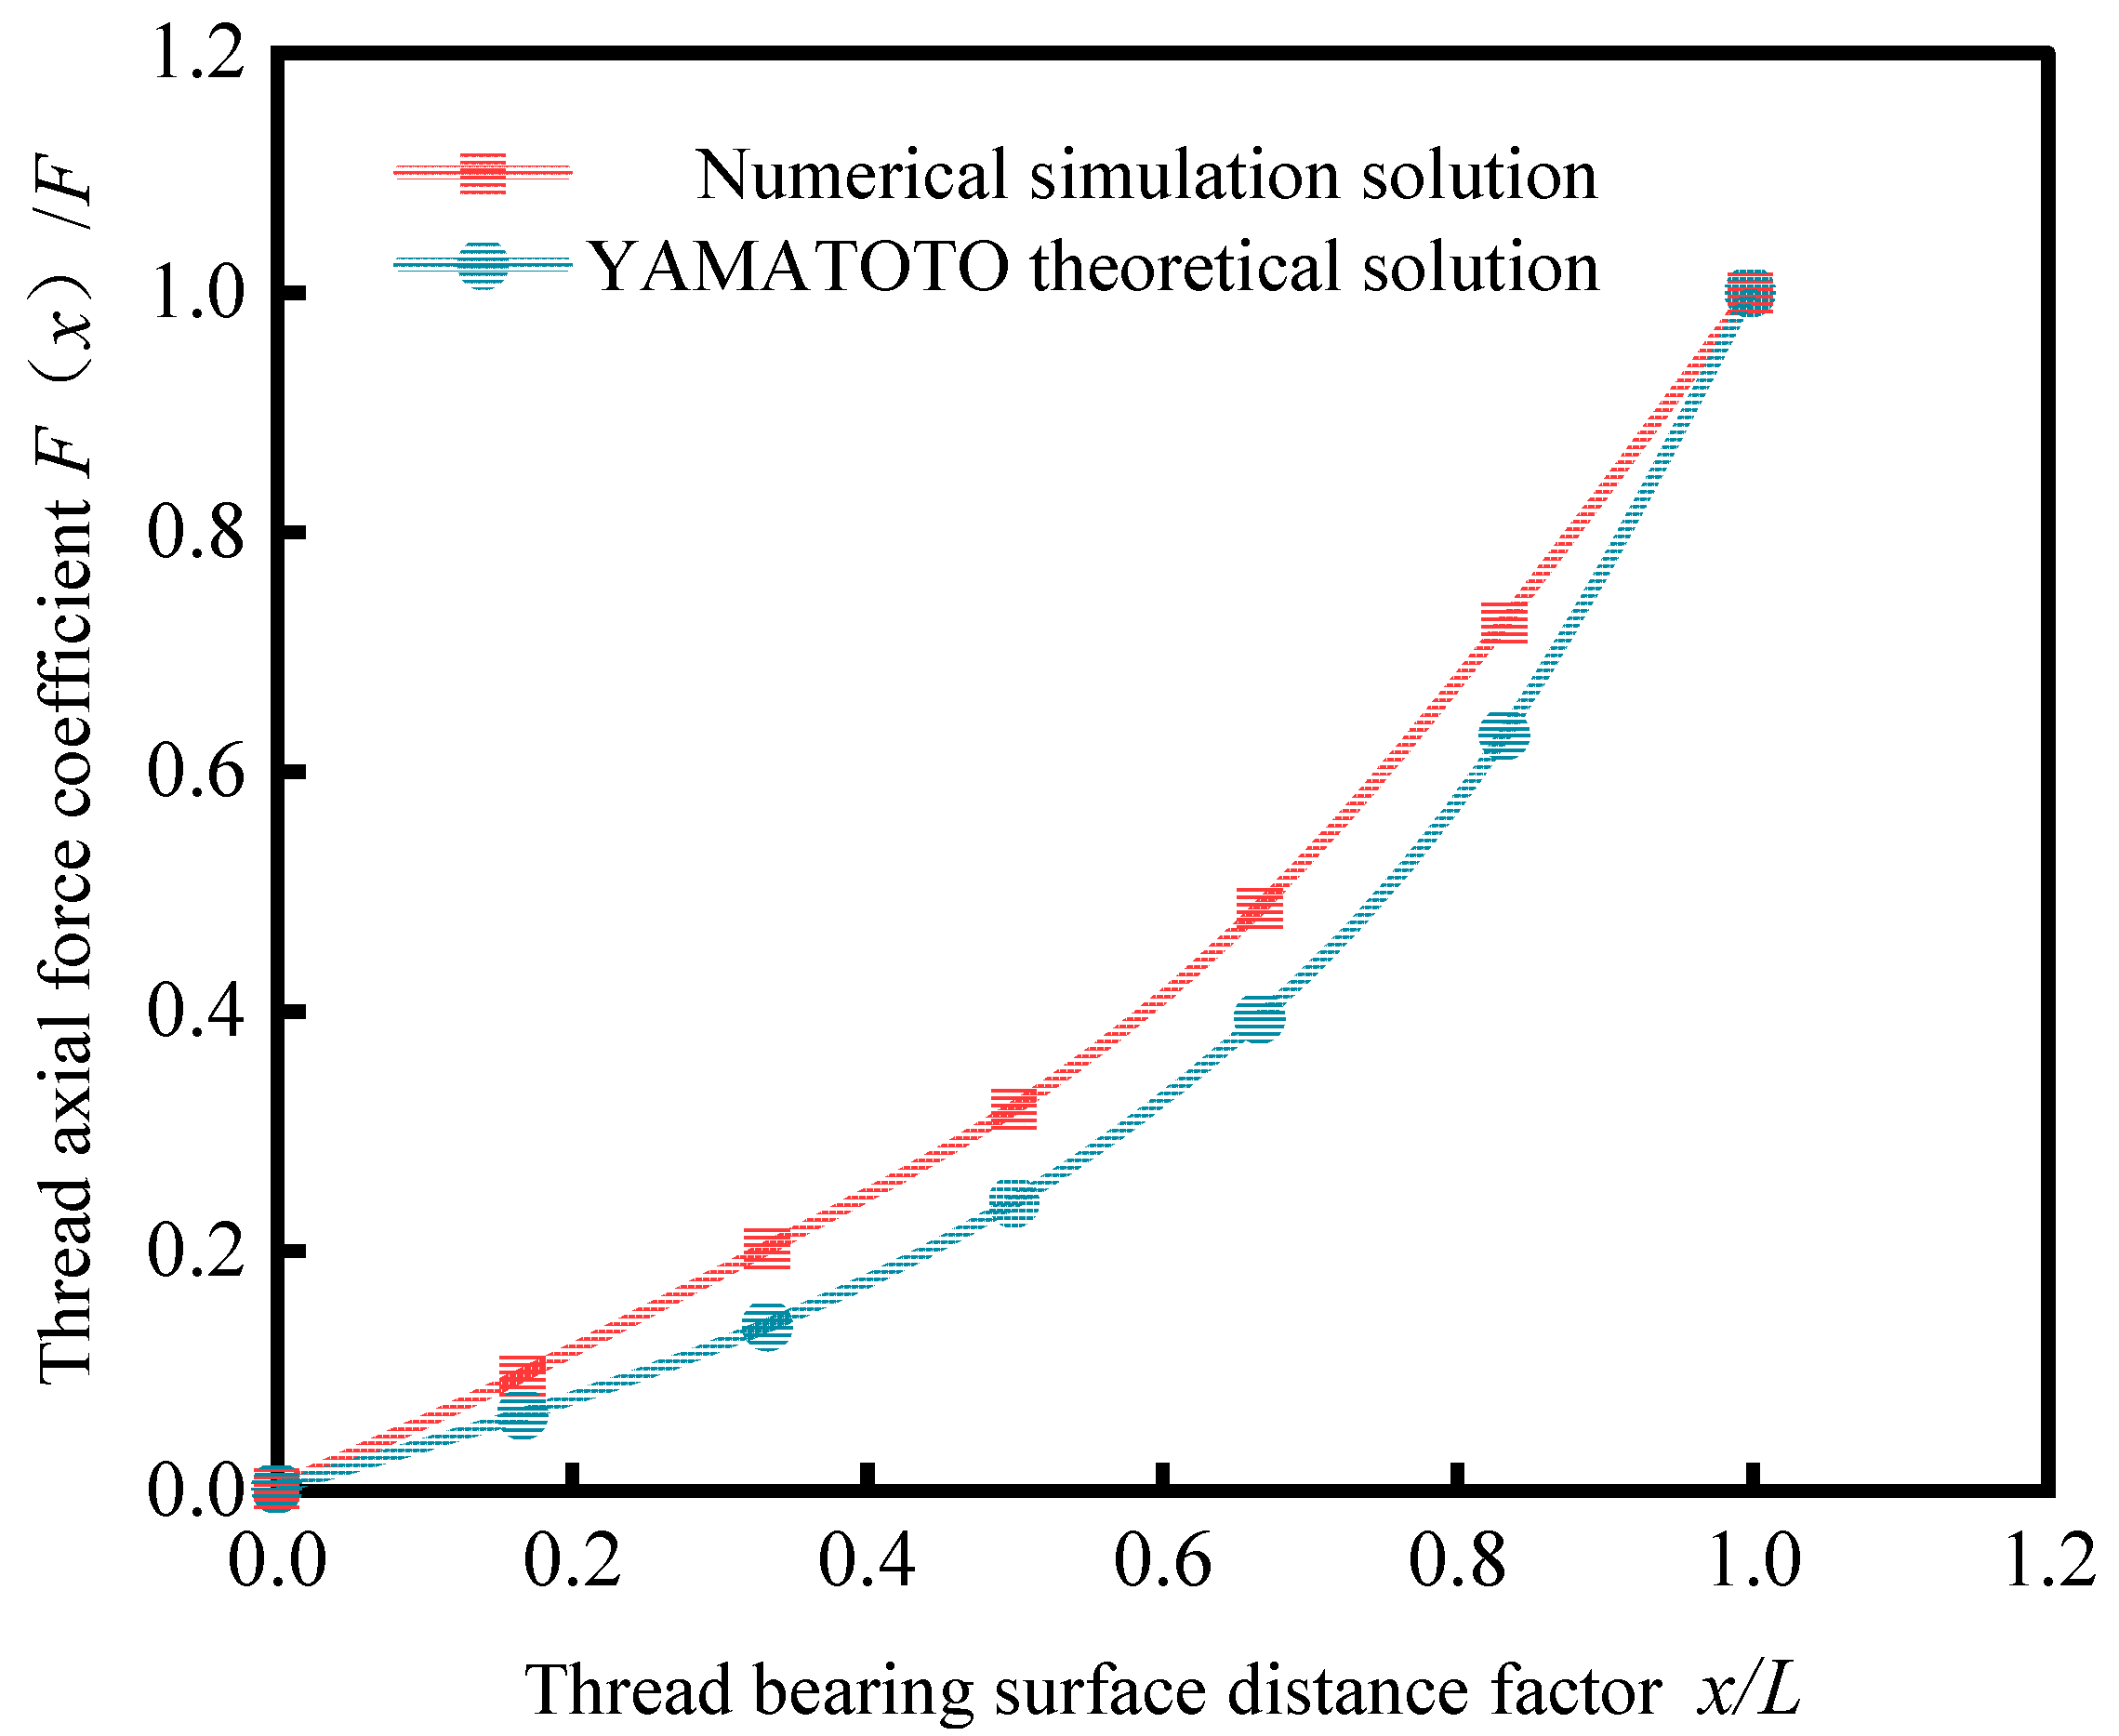
A comparison was made between the theoretical value of the thread bearing capacity of MTL-I-A splices, as determined by Equations (4)–(8), and the simulated value from the refined three-dimensional numerical model. The results of this comparison can be seen in Figure 7. By comparing and verifying the solutions based on the axial force coefficient, we can ensure that the thread bearing capacity is appropriately represented [32].
Thread bearing capacity and axial force coefficient distribution laws are found to be essentially identical when comparing numerical simulation results with theoretically computed values. This paper shows that the well-established refined numerical model in three dimensions can accurately model and solve the connection performance problems of mechanical connection splices.

3. Splice Connection Performance Analysis

3.1. Load–Displacement Curves of Splices

Figure 8 shows the load–displacement curves of several splices under monotonic loading. Figure 8 shows that during loading, all splices go through different stages. At the beginning, the splices are in the linear stage, where their displacement increases and their growth is rapid. As loading continues, the slope of the curve decreases, and the rebar splice enters the yielding stage. As the rebar continues to be loaded, the splice displacement increases significantly, but the load grows slowly. The rebar splice then moves into the strengthening stage, where it remains until the rebar reaches its ultimate load capacity. Finally, when loading the splice causes rebar “necking,” the splices are destroyed, and the load–displacement curve of the splice appears to decrease. Under monotonic loading, all of the splices experienced rebar fracture damage, and the splices’ yield loads were very stable throughout all of the tested operating situations. Figure 8a shows that for a 25 mm PSB rebar diameter, the ultimate load-carrying capacity and ductility of splices drop as the thread rib spacing drops. Class B splices, in comparison to class A splices, drop by 2.11% and 3.98%, respectively. This suggests that the thread rib spacing should increase from the normative value to 0.6 times the nominal rebar diameter, and there should be no significant change to the load–displacement curve of the splices. The performance standards for class I splices are met by both types A and B, as stated in JGJ 107-2016. Types A and B splices both conform to the standards for class I splice connecting performance outlined in JGJ 107-2016. Additionally, when the thread rib spacing is increased from the specified value to 0.6 times the nominal diameter of the rebar, the load–displacement curve of the splices stays relatively constant. In comparison to class A splices, the ductility decreased by 26.25%, thread rib pitch decreased by 31.07%, and ultimate load-carrying capacity decreased by 18.82% for C, D, and E splices, respectively, as shown in Figure 8a. It may be inferred that, specifically for class E splices, the performance of the splice connection degrades as the thread rib pitch exceeds the specified value and grows to 0.8, 1.0, and 1.2 times the nominal diameter of the rebars. Class E splices in particular fail to provide the performance expected of class I splices. Figure 8b shows that class D and E splices fail to achieve the standards for class I splice connection performance when the rebar’s nominal diameter is 32 mm. Figure 8c shows that all splice types achieve class I splice connection performance standards when the rebar’s nominal diameter is 40 mm.
In Figure 9, the load–displacement curves of various splices subjected to high-stress repeated tensile and compressive loading can be seen. These curves closely resemble the ones seen for splices subjected to monotonic tensile loading. As the threaded rib pitch increases, the connecting performance of the splices decreases, and after 20 cycles of loading, different splice types exhibit varying degrees of residual deformation. Initially, when subjected to high-stress repeated tensile and compressive loading, the couplers’ threads were tightly packed together owing to the preload (Figure 5b). However, as loading continued, the threads developed localized plastic deformation, most noticeably at the couplers’ connector ends, and the resulting gaps between the threads became apparent. Repeatedly subjecting the splices to high-stress tensile and compressive loads causes them to distort. Class A, B, and C splices satisfy the criteria for class I splices in terms of ultimate load-carrying capacity and ductility, as shown in Figure 9a. However, class D splices showed some slippage during loading because, as the threaded rib spacing was increased to 1.2 times the rebar’s nominal diameter, the number of threaded ribs in the splices decreased. As the load on each threaded rib of the splices increased, the thread entered the plastic phase, creating a larger thread gap and splice slip. This happens because there are fewer threaded ribs in the splices when the spacing between them increases to 1.2 times the rebar’s nominal diameter. As a result, the load on each threaded rib of the splices increases, which causes the threads to enter the plastic phase and create a larger thread gap, which causes the splices to shift. Figure 9b shows that all four types of splices, A, B, C, and D, are visually identical and behave according to the standards set for class I splices. Figure 9c shows that all splice types operate adequately in terms of class I splice requirements, with no noticeable slippage.
The load–displacement curves of splices subjected to repeated tensile and compressive loads under large strain are displayed in Figure 10. All types of splices result in residual deformations and slips, and the splice connection performance under eight large-strain repeated tensile and compressive loads is essentially identical to that under monotonous and high-stress repeated tensile and compressive loads. Class E splices slipped at 1–4 and 5–8 cycles of cyclic loading, as shown in Figure 10a. This suggests that threads with spacing 1.2 times the nominal diameter of the rebars experienced significant plastic deformation due to high-strain repeated tensile and compressive loading, significantly reducing the splices’ bearing capacity. Two types of splices, D and E, displayed varying degrees of slippage under 1–4 and 5–8 cycles of cyclic loading, as shown in Figure 10b,c. The LSL-II-E splices were found to be damaged by rebar pullout under large strain and repeated tensile and compressive loading, indicating that their bearing capacity was reduced compared to high-stress repeated tensile and compressive loading.

3.2. The Strength Ratio

The strength ratio, Rs, which is determined as stated in Equation (9), can be used for a more thorough examination of the splice’s load-bearing capacity. This ratio is defined as the ratio of the splices’ ultimate tensile strength to the rebar’s yield strength [33].
R s = f u f y
The strength ratios of the splices under different working circumstances are shown in Figure 11. Under varying loading conditions, we find a decreasing tendency as the threaded rib spacing rises. There was little change in the strength ratios of the threaded rib splices when using rebars with rib spacing that was 0.6 times the nominal diameter compared to the specification. The variations of 1.36% for class A splices, 2.71% for class B splices, and 2.03% for class B splices across the three loading regimes demonstrated this. The strength ratios of the splices in categories A, B, C, D, and E decrease in a specific order under monotonic tensile loading (Figure 11a). Different codes require different strength ratios for mechanical connection splices. For mechanical connection splices, the thresholds in the European and American standards are usually used to define the criteria. The British standard BS-8110 recommends Rs ≥ 1.40 [34], while the American standard ACI-318 proposes Rs ≥ 1.25 [35]. Eurocodes require more stringent strength ratios for splices than the American standard. Selecting splices using Eurocodes will ensure higher splice performance. Splices in categories A and B meet the British code requirement for mechanical connection splices: Rs ≥ 1.40 [34]; splices in categories A, B, C, and D meet the U.S. code requirement for MTL-I splices: Rs ≥ 1.25 [35], but the strength ratios of category E splices do not satisfy the code requirement. Class E splices fail to meet code standards with respect to their strength ratios. The strength ratios of splices A, B, C, and D satisfy the specification requirements for HSL-I and HSL-III splices, as well as for HSL-II splices, as can be observed in Figure 11b when subjected to high-stress repeated tensile and compressive loads. Figure 11c demonstrates that, even when subjected to large-strain repeated tensile and compressive loads, the type of LSL splices that satisfy the code requirements for a strength ratio is the same as the type of HSL splices.

3.3. The Ductility Ratio

A higher splice ductility ratio indicates a stronger plastic deformation capacity of the splice; this ratio is defined as the ratio of the displacement corresponding to the splice’s ultimate load-carrying capacity to the yield displacement of the rebar splice, and it can be calculated using Equation (10). Research suggests a ductility ratio of at least 4.0 for splices [36,37].
R d = Δ u Δ y
Figure 12 displays the ductility of splices under various working conditions. Under different loading regimes, all types of splices have ductility ratios that satisfy Rd ≥ 4.0. There is a large redundancy, which aligns with the changes in the splices’ strength ratio. As the spacing of the threaded ribs increases, the ductility ratios of all types of splices decrease. It appears that cyclic loading has no major impact on the plastic deformation capacity of the splices, as the splice ductility ratios under cyclic loading were somewhat lower than those under monotonic tensile loading (Figure 12a compared to Figure 12b,c).

3.4. Residual Deformation

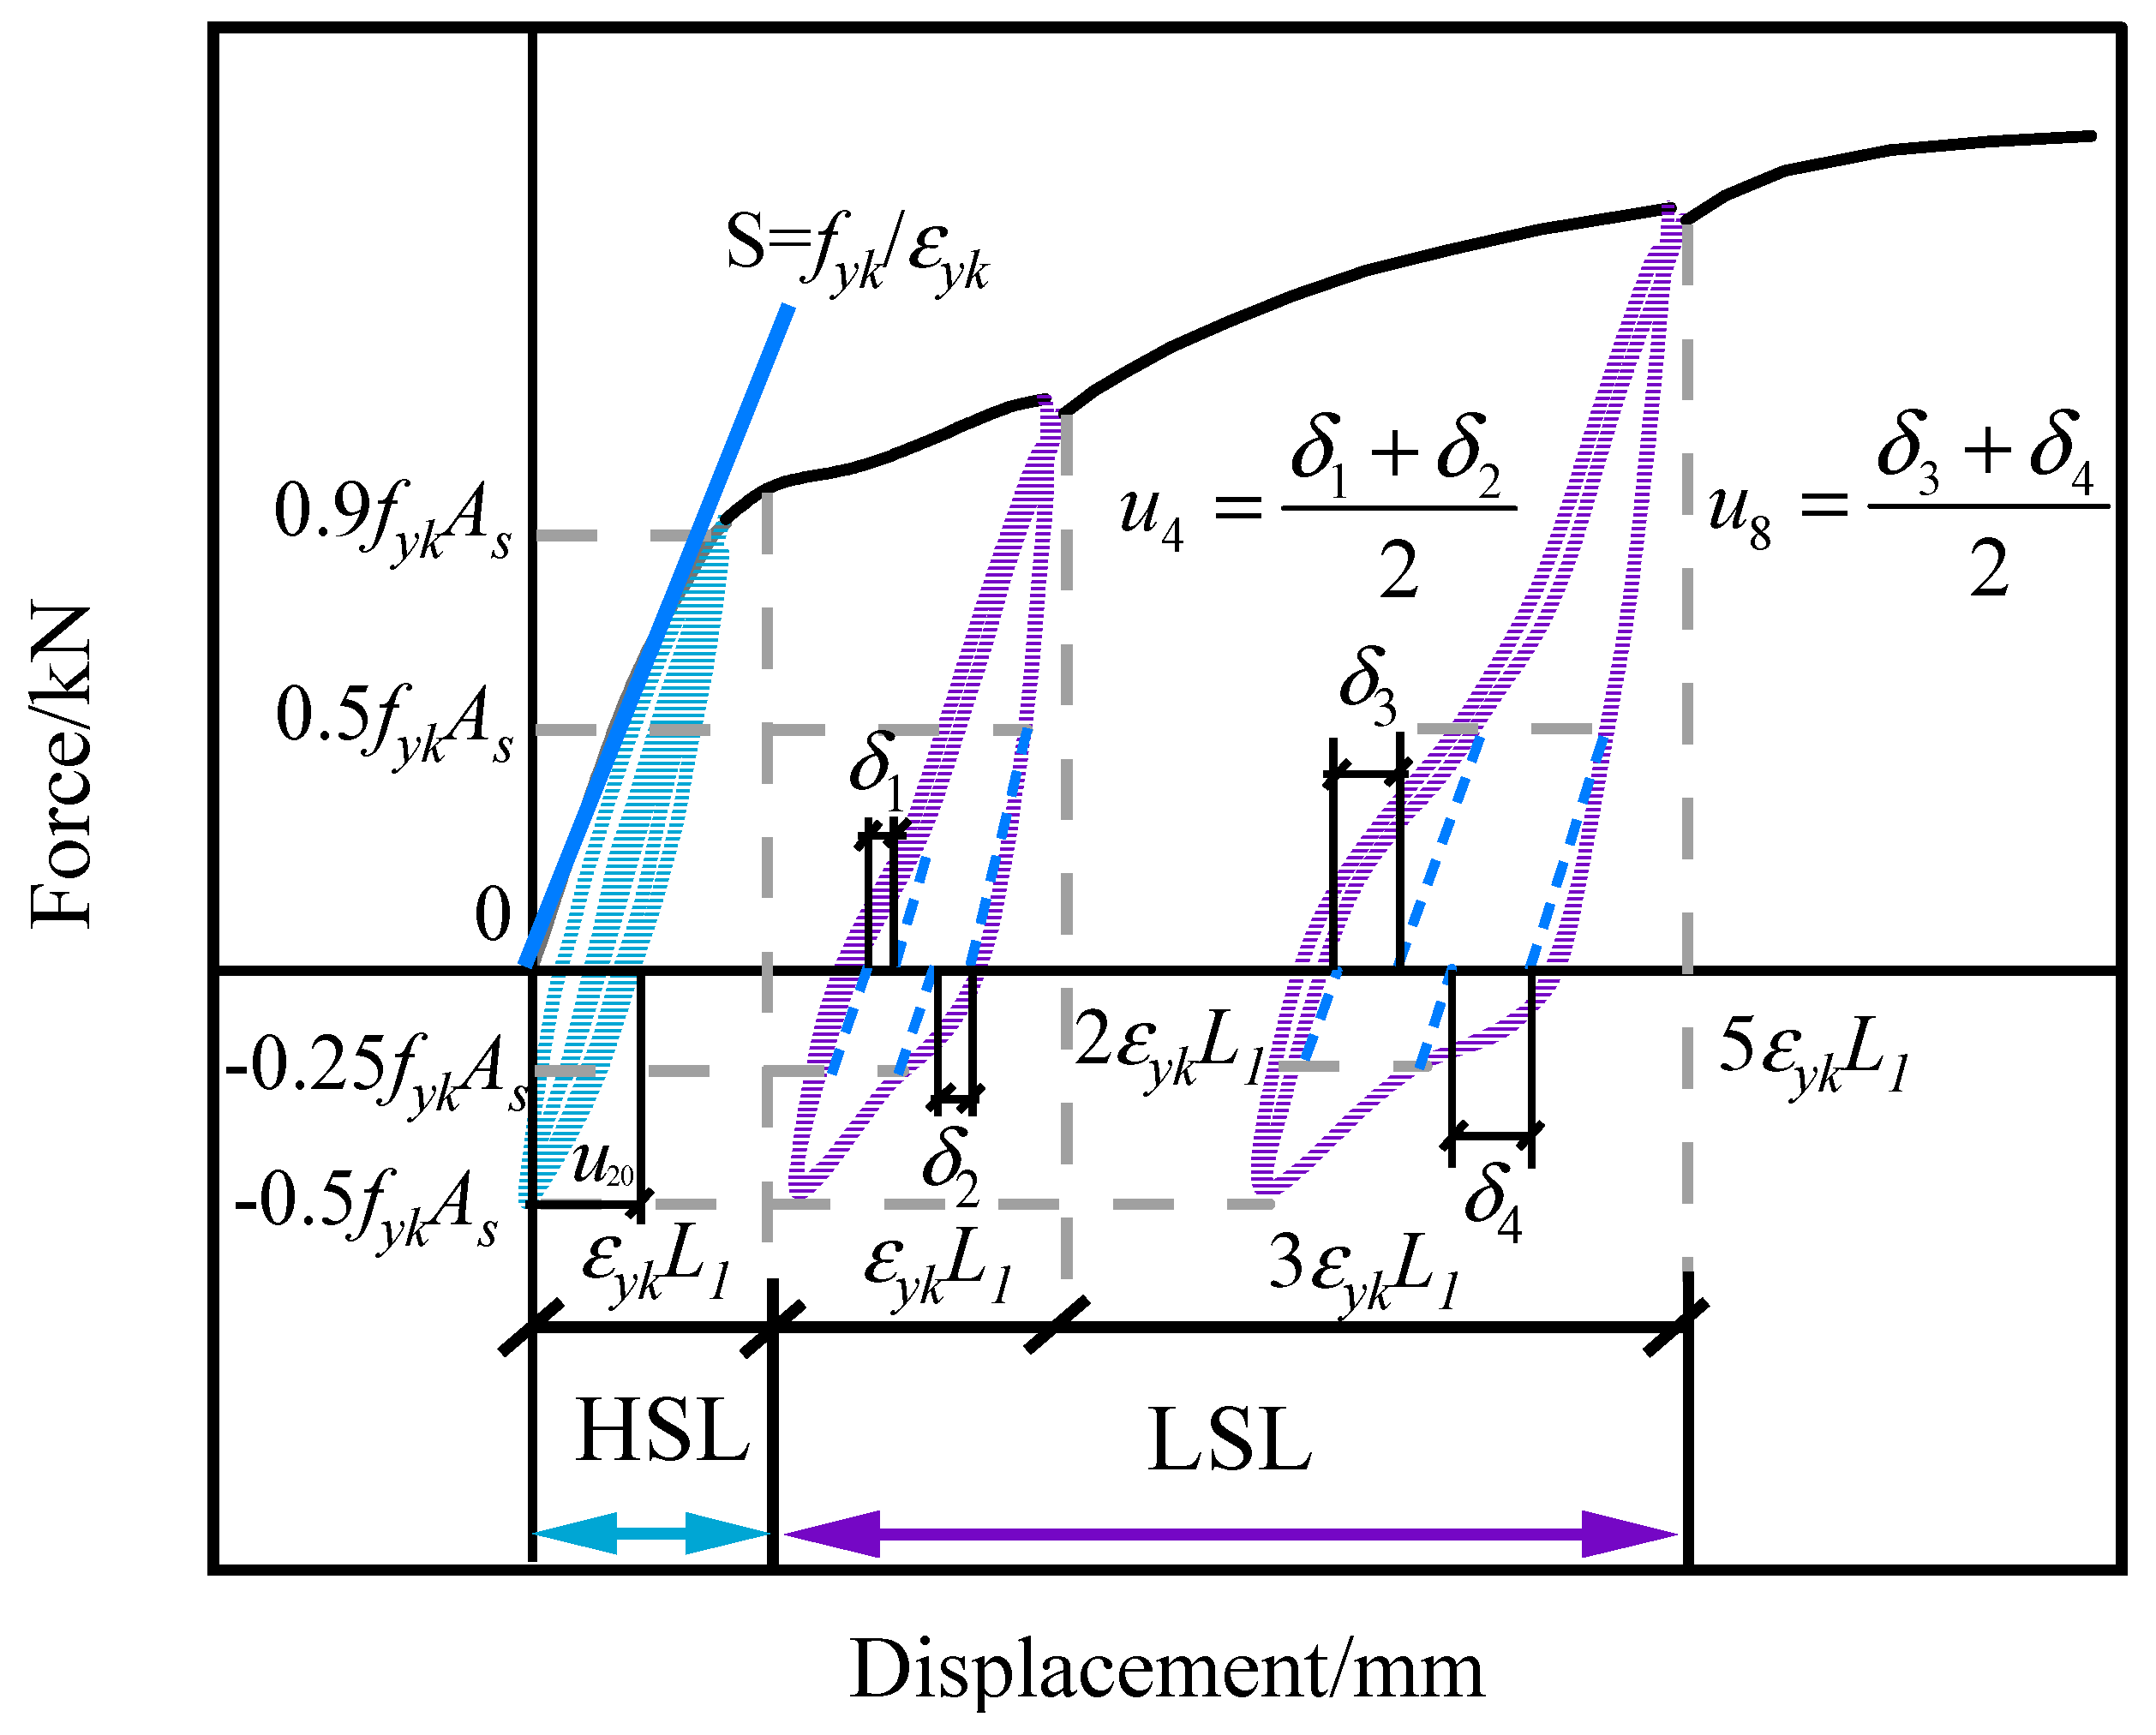
An essential metric for evaluating splice performance under cyclic loading is residual deformation. When this parameter increases, a decrease in splice resistance to deformation is observed [38]. The schematic representation of the characteristics of the splices’ residual deformation is presented in Figure 13. The S line represents the splices’ tensile and compressive stiffness and is the ratio of the yield strength and yield strain of the parent material of the rebar in the splices. As stands for the theoretical cross-sectional area of the rebars. The blue hysteresis curve in the figure shows the schematic diagram of high-stress loading and its residual deformation, and both tensile and compressive loading are applied to the splices in high-stress loading. The tensile load values are 0.9 f y k A s . The compression load values are − 0.5 f y k A s . Residual deformation of splices after high-stress cyclic loading u 20 is the value of the deformation of the joint after the 20th loading. The purple hysteresis curve in the figure shows the large-strain loading and its residual deformation schematically. The tensile action of large-strain loading is displacement loading, and the displacement values for the first four loadings are 2 ε y k L 1 . The last four loaded displacement values are 5 ε y k L 1 . The compression loads acted with the same values as the high-stress loading. δ 1 denotes the distance between the intersection of the parallel S lines and the horizontal coordinates of the splices at a loading force of 0.5 f y k A s and a reverse unloading force of − 0.5 f y k A s under the first four loads of large-strain loading. δ 2 denotes the distance between the intersection of the parallel S lines and the horizontal coordinates of the splices at a loading force of 0.5 f y k A s and a reverse loading force of − 0.5 f y k A s under the first four loads of large-strain loading. The average of δ 1 and δ 2 is the value of residual deformation u 4 after four loadings before large-strain loading. δ 3 and δ 4 denote the distance deflection values of splices loaded four times after large-strain loading according to the same method used for δ 1 and δ 2 . The average value of δ 3 and δ 4 is the residual deformation value u 8 after four loadings before large-strain loading.
For class I splices, the residual deformation u 20 after repeated high-stress tensile and compressive loading should not exceed 0.3 mm. Similarly, for class I splices, the residual deformation u 4 after four cycles of loading should not exceed 0.6 mm, and u 8 after eight cycles of loading should not exceed 0.3 mm [22].
Figure 14 shows the splices’ residual deformation after cyclic loading. Figure 14a shows that after they were subjected to high-stress tensile and compressive loading multiple times, the splices’ residual deformation ( u 20 ) satisfies the class I splices’ specifications. The residual deformation of the splices grows with the threaded rib spacing; for HSL-III splices in particular, this rises by 48.94% and 50.77%, respectively. With respect to the various kinds of HSL splices, in HSL-III, the B splices only increased by 4.26% and the C splices by 6.25% when contrasted with the A splices, respectively. As the spacing between the threaded ribs increased from the specification value to 0.6 and 0.8 times the nominal diameter of the steel bars, there was no significant change in the residual deformation of the A, B, or C splices. This suggests that the splices’ residual deformation was unaffected. When subjected to large-strain repeated tensile and compressive loads, various splice types show residual deformation values that are in agreement with class I splices (Figure 14b,c). For 5–8 repeated tensile and compressive loads with substantial strains, the residual deformation value is higher than that after 1–4 cyclic loads combined. This indicates that the plastic deformation of the splices increases as the number of cycles of both stressors increases. The residual deformation values of the D and E categories of LSL splices are greater than those of the first three categories after cyclic loading, but they nevertheless satisfy the code criteria, just as HSL splices do.
Important performance indicators of splices for all operating circumstances are listed and evaluated in Table 5, Table 6 and Table 7.
All of the splices experience rebar fracture damage when subjected to monotonic tensile loading, as shown in Table 5. Although their ductility ratios are highly redundant, the load-carrying capacity of MTL-I-E, MTL-II-D/E, and MTL-III-E splices does not meet the code requirements.
Table 6 shows that under high-stress repeated tensile and compressive loads, the ductility ratio and residual deformation u 20 of all splices satisfy the specification requirements, indicating that the plastic deformation capacity of the splices is good and the splices are all subject to rebar tensile and compressive damage, but the load-bearing capacity of the HSL-I-E, HSL-II-D/E, and HSL-III-E splices does not satisfy the specification requirements.
There is no deviation from the specified values for the splices’ ductility ratio or residual deformation ( u 4 , u 8 ) when subjected to large-strain repeated tensile and compressive stresses (Table 7). Couplings that do not fulfill the specification requirements are identical to MTL and HSL splices, with the exception of LSL-II-E, which undergoes rebar pullout connector damage. All other couplings are rebar fracture damage.
In terms of mechanical connection splices for the prestressing of concrete screw-thread steel bars for the prestressing of concrete, the Chinese standard “Anchors, Grip and Coupler for Prestressing Tendons” (GB/T 14370-2015) [39] is more conservative with regard to the values of the outer diameter and length of the splice connector. On the other hand, the material of the couplers is tempered 40Cr, whose ultra-high yield strength (785 MPa) and ultimate tensile strength (980 MPa) determine the damage mode of the couplers in the process of force application, which is failure due to the fracture of the rebar.

4. Load-Bearing Mechanism of Threaded Ribs of Splices

4.1. Stress Distribution in Threaded Ribs of Splices

The load-bearing capacity of a splice can be affected by changes in the spacing between its thread ribs, which in turn alter the stress distribution in those ribs. Figure 15 displays the stress distribution of class III rebar splices under various loading conditions. Observed stress patterns include high stress at the connector ends and low stress inside the couplers. Following monotonic tensile loading is high-stress repeated tensile and compressive loading, and finally large-strain repeated tensile and compressive loading, all of which increase the stresses in the splices in a sequential pattern. Also, the couplers’ internal mesh threads are increasingly stressed as the rebar rib’s high-stress area expands.
With the ribs numbered 1–10 from the loading end of the rebar according to the threads engaged with the coupler ends, Figure 16 depicts the stress distribution of the rebar ribs in different coupler types under different working situations. Figure 16 shows that threads engaged with the interior of the couplers were subject to more uniformly distributed stresses, whereas threads engaged with the end of the couplers experienced much higher stresses under monotonic and cyclic loading regimes. In comparison to monotonic tensile loading, the stresses on the rebar ribs subjected to repetitive compression loading with high stress and large strain rose by 2.32% and 4.14%, respectively, for the first turn of threads of class A splices. This suggests that the rebar rib stresses are increased under these loading conditions. Using MTL splices as an example, the stresses of rebar ribs in class A and B splices become lower and closer to average as the thread rib spacing increases (Figure 16a). This is because class C, D, and E splices have small thread spacings and a limited number of threads that can be loaded. Class D and E splices have stresses that do not vary much with the number of No. 4 threads, and class E splices only see a 1.02% increase in rebar rib stresses compared to class D. Class A splice stresses were 15.92%, 20.43%, and 24.58% lower than class C splice stresses, suggesting that reinforcing threads with diameters 1.0 and 1.2 times the nominal diameter are harmful to splice stresses. There were stress reductions of 15.92%, 20.43%, and 24.58% for class C to class A splices compared to class A splices, indicating that spacings of 1.0 and 1.2 times the nominal diameter of threads negatively impact the load-bearing capabilities of rebar ribs.

4.2. Stress Distribution in Couplers’ Ribs

The distribution of rib stress on the couplers is illustrated in Figure 17. Figure 17 shows that the couplers’ rib stress is less than the rebars’ rib stress, which means that the couplers are not damaged and can safely withstand the loading process. Similarly to the rib stress distribution law of the steel bar, the couplers’ maximum thread rib stress is located in the threads of the connector ends. The rib stress distributions of the couplers with a loaded end and a fixed end are essentially identical, with both showing high end stress and small internal stress.
Figure 18 shows the stress distribution of couplers’ connector ribs under various working conditions. The ribs that hold the coupler together are identical to the ribs that reinforce it. When the coupler is loaded, there is a high proportion of connector end threads and a low proportion of internal threads. Consider MTL-III-A and MTL-III-B as an example. Under monotonic tensile loading, the No. 1 thread carries 46.84% of the load, while the No. 2 thread carries 46.99% of the load. This means that the first two turns of the thread at the end bear nearly half of the load. The stress in the No. 1 thread of LSL-III-A increased by 1.65% and 2.99% under different loading regimes compared to the No. 1 threads of HSL-III-A and MTL-III-A, respectively. This suggests that the threaded ribs at the coupler ends withstand elevated stress under repeated tensile and compressive loading. C, D, and E splices had substantially higher thread rib stresses than A and B splices, with the difference being most pronounced for D and E splices. This suggests that coupler threads cannot withstand loads that are 1.0 and 1.2 times the nominal diameter of the rebar thread rib spacing, respectively.

5. Conclusions

  • According to “Screw-threaded steel bars for the prestressing of concrete” (GB/T 20065-2016), class I splices can satisfy the requirements of “Technical specification for mechanical splicing of steel reinforcing bars” (JGJ 107-2016) if the thread rib spacing of the steel bars is 0.6~0.8 times the nominal diameter of the steel bars under the action of monotonic and cyclic loads. When it comes to PSB thread rib spacing, the specification is conservative. Splices fail to meet code requirements for load bearing when the threaded rib spacing exceeds 1.0 times the nominal diameter of the rebar. The PSB830 splices’ bearing capacity and plastic deformation capacity can be guaranteed by increasing the specification of threaded intercostal ribs to 0.6~0.8 times the nominal diameter of rebar. This will also effectively reduce the actual project’s PSB steel consumption.
  • Under various operating situations, the load-carrying capacity of PSB splices is mostly influenced by the 1–2 turns of threaded ribs near the couplers’ ends, and its load-carrying ratio is approximately 50%. Cyclic loading, in contrast to monotonic loading, caused an increase in rib stresses close to the coupler ends. When the spacing between the threaded ribs was between 0.6 and 0.8 times the rebar’s nominal diameter, the stresses were low and average. The number of threaded ribs reduced as the space between them grew to 1.0 to 1.2 times the nominal diameter of the rebar. As a result, the threaded rib stresses increased from monotonic tension splices by 5.49% to 27.76%. Disadvantageously compared to normative rib spacing splices, those with threaded rib spacing have an enhanced ultimate load-carrying capacity of 1.0 to 1.2 times the nominal diameter of the rebar, a loss of 11.95% to 22.73%.
  • Under monotonic tensile load, high-stress repeated tensile and compressive loads, and large-strain repeated tensile and compressive loads, PSB830 mechanical connection splices can experience two types of damage: rebar fracture and rebar pullout from the couplers. Under high-stress and large-strain repeated tensile and compressive loads, the couplings’ load–displacement curve and the couplings’ damage form are essentially the same as those under monotonic tensile load. Cyclic loading does not affect the couplers’ ductility or overload limits. Neither the ultimate load capacity nor the splice ductility was significantly reduced by cyclic loading.

Author Contributions

Conceptualization, Y.M.; methodology, Y.M. and L.L.; software, L.L. and J.B.; validation, L.L.; investigation, L.L.; resources, Y.M.; data curation, L.L.; writing—original draft preparation, L.L.; writing—review and editing, Y.M. and L.L.; visualization, M.H. and Z.G.; funding acquisition, B.X. All authors have read and agreed to the published version of the manuscript.

Funding

This research was funded by National Natural Science Foundation of China [No. 52468029] and the Scientific Research Program Funded by the Education Department of Shaanxi Provincial Government [No. 22JE020].

Data Availability Statement

The original contributions presented in this study are included in the article. Further inquiries can be directed to the corresponding author.

Acknowledgments

This research is financially supported by the National Natural Science Foundation of China (Program No. 52468029) and the Scientific Research Program Funded by the Education Department of Shaanxi Provincial Government (Program No. 22JE020). This support is gratefully acknowledged.

Conflicts of Interest

Author Bo Xie was employed by the company Powerchina Northwest Engineering Corporation Limited. The remaining authors declare that the research was conducted in the absence of any commercial or financial relationships that could be construed as a potential conflict of interest.

References

  1. Zhong, X.G.; Zhang, T.Y.; Zhao, C.; Shu, X.J.; Shen, M.Y.; Chen, Y.F. New non-destructive dynamic tensile testing of prestressing fine-rolled screw-threaded steel bars. Eng. Struct. 2019, 182, 153–163. [Google Scholar] [CrossRef]
  2. Liu, B.Q.; Huang, J.; Xing, G.H. Crack behavior of concrete beam in flexure strengthened with NSM prestressing screw-thread steel bars. Mater. Struct. 2020, 53, 80. [Google Scholar] [CrossRef]
  3. Ren, D.X.; Peng, T.; Yang, Z.Y.; Xue, P.; Fu, W.X.; Zhao, X.Y.; Li, J.L.; Peng, J.C. Application on underreamed anti-floating anchors of prestressing screw-thread steel bars in pebble stratum of Chengdu. Build. Struct. 2025, 55, 1–10. [Google Scholar] [CrossRef]
  4. Bompa, D.; Elghazouli, A. Monotonic and cyclic performance of threaded reinforcement splices. Structures 2018, 16, 358–372. [Google Scholar] [CrossRef]
  5. Rowell, S.P.; Haer, K.P. Investigation of the dynamic performance of large reinforcement bar mechanical couplers In Proceedings of the 2010 Structures Congress—ASCE. Orlando, FL, USA, 12–15 May 2010; pp. 2059–2075. [Google Scholar]
  6. Ruangrassamee, A.; Mounnarath, P. Monotonic and cyclic behaviors of energy-dissipating threaded mechanical splices. In Proceedings of the 14th World Conference on Earthquake Engineering, Beijing, China, 12–17 October 2008; Seismological Press: Beijing, China, 2008. [Google Scholar]
  7. Li, C.; Zhu, H.; Liu, X.Y.; Xia, C.X.; Wang, P.J.; Liu, F.Z.; Fang, Z.Z.; Wei, D. Mechanical properties of plate type steel bar connectors for prefabricated concrete structures. Adv. Struct. Eng. 2022, 25, 1027–1041. [Google Scholar] [CrossRef]
  8. Jeong, J.H.; Kim, I.T.; Kim, T.J.; Lee, M.J.; Ahn, J.H. Mechanical performance evaluation of rolling thread steel rebar connection with taper type coupler. J. Korea Inst. Struct. Maint. Insp. 2015, 19, 40–51. [Google Scholar] [CrossRef]
  9. Li, N.B.; Qian, J.R.; Ye, L.P.; Liu, S.W. Tests on seismic behavior of precast RC shear walls with vertical rebar splicing by pressed sleeve. J. Build. Struct. 2016, 37, 31–40. [Google Scholar]
  10. Zhang, W.J.; Guo, Y.Y.; Liu, S.W. Experimental research on seismic behavior of precast RC columns with steel bars spliced by compressive sleeves. Eng. Mech. 2016, 33, 119–127. [Google Scholar]
  11. Bompa, D.; Elghazouli, A. Inelastic cyclic behaviour of RC members incorporating threaded reinforcement couplers. Eng. Struct. 2019, 180, 468–483. [Google Scholar] [CrossRef]
  12. Liu, Q.Z.; Lin, Y.H.; Li, J.Z.; Yang, C.J.; Chen, J.Y.; Zhang, M.; Liu, B. Bond strength prediction model of defective grout materials in half-grouted sleeve connections under uniaxial and cyclic loadings. Constr. Build. Mater. 2022, 352, 128981. [Google Scholar] [CrossRef]
  13. Bao, J.W.; Gao, Q.; Tang, L.; Zhao, W.J. Refined finite element analysis of tensile property of grout sleeve splicing of rebars. J. Zhejiang Univ. (Eng. Sci.) 2023, 57, 814–823. [Google Scholar]
  14. Fukuoka, T.; Nomura, M. Proposition of helical thread modeling with accurate geometry and finite element analysis. J. Press. Vessel. Technol. 2008, 130, 011204. [Google Scholar] [CrossRef]
  15. Chen, J.J.; Shih, Y.S. A study of the helical effect on the thread connection by three dimensional finite element analysis. Nucl. Eng. Des. 1999, 191, 109–116. [Google Scholar] [CrossRef]
  16. GB/T 20065-2016; Screw-Thread Steel Bars for the Prestressing of Concrete. Standards Press of China: Beijing, China, 2016.
  17. ISO 6934-5; Steel for the Prestressing of Concrete Part 5: Hot-Rolled Steel Bars with or Without Subsequent Processing. International Organization for Standardization: Geneva, Switzerland, 2024.
  18. Bao, J.W.; Zhao, W.J.; Gao, Q.; Tao, Y.C. Refined finite element analysis of grouted-sleeve connection on the bond-slip relationship. J. Harbin Inst. Technol. 2024, 56, 68–76. [Google Scholar]
  19. GB 1499.2−2024; Steel for Reinforcement of Concrete: Part 2: Hot Rolled Ribbed Bars. Standards Press of China: Beijing, China, 2024.
  20. BS EN 10080; Steel for the Reinforcement of Concrete—Weldable Reinforcing Steel-General. The European Standard: London, UK, 2005.
  21. ISO 15835-2; Steels for the Reinforcement of Concrete—Reinforcement Couplers for Mechanical Splices of Bars Part 2: Test Methods. International Organization for Standardization: Geneva, Switzerland, 2009.
  22. JGJ 107-2016; Technical Specification for Mechanical Splicing of Steel Reinforcing Bars. China Architecture Building Press: Beijing, China, 2016.
  23. Housari, B.A.; Nassar, S.A. Effect of thread and bearing friction coefficients on the vibration-induced loosening of threaded fasteners. J. Vib. Acoust. 2007, 129, 484–494. [Google Scholar] [CrossRef]
  24. He, L.G.; Zhang, B.; Zheng, J.J.; Zhou, L.; Su, J.Q.; Shi, W.J. Axial Load Distribution Law of High Temperature Thread Pair Considering Material Creep. J. Southwest Jiaotong Univ. 2022, 57, 1024–1031. [Google Scholar]
  25. Lei, Y.Y.; Xie, X. Improved method of Giuffre-Menegotto-Pinto hysteretic constitutive model. J. Zhejiang Univ. (Eng. Sci.) 2018, 52, 1926–1934. [Google Scholar]
  26. Nguyen, V.T.; Nguyen, X.D. Optimal procedure for determining constitutive parameters of Giuffre-Menegotto-Pinto model for steel based on experimental results. Int. J. Steel Struct. 2022, 22, 851–863. [Google Scholar] [CrossRef]
  27. Zhang, X.C.; Zhao, J.B.; Wang, Z.D.; Liu, Z.Y.; Zhao, J. Theoretical and Numerical Simulation of Seismic Behavior of Concrete Columns Reinforced with Prestressing-screw Bars. Sci. Technol. Eng. 2023, 23, 12638–12647. [Google Scholar]
  28. Fukuhara, T.; Sun, Y.P. Evaluation method of seismic performanceof high-strength RC members and frames. In Proceedings of the AlJ Annual Conventional, Tokyo, Japan, 14 November 2005; Architectural Institute of Japan: Tokyo, Japan, 2005; pp. 193–198. [Google Scholar]
  29. GB/T 3077-2015; Alloy Structures Steels. Standards Press of China: Beijing, China, 2015.
  30. Wang, J.Y. Research on Lean Prefabricated Structure System and the Connecting of Bar. Master’s Thesis, Huazhong University of Science and Technology, Wuhan, China, 2018. [Google Scholar]
  31. Yamatoto, A. The Theory and Computation of Threads Connection; Yokendo: Tokyo, Japan, 1980; pp. 58–61. [Google Scholar]
  32. Huang, H.; Wang, Y.H.; Wei, T.; Xue, W.H.; Yao, J.J. Sensitivity Analysis of Friction and Room Temperature Creep on Preload Relaxation of Wind Turbine Bolt. Acta Energiae Solaris Sin. 2023, 44, 289–296. [Google Scholar]
  33. Ling, J.H.; Rahman, A.B.A.; Ibrahim, I.S.; Hamid, Z.A. Behaviour of grouted pipe splice under incremental tensile load. Constr. Build. Mater. 2012, 33, 90–98. [Google Scholar] [CrossRef]
  34. BS 8110-1:1997; Structural Use of Concrete—Part 1: Code of Practice for Design and Construction. The British Standard: London, UK, 1997.
  35. ACI 318-11; Building Code Requirements for Structural Concrete and Commentary. American Concrete Institute: Farmington Hills, MI, USA, 2011.
  36. Soudki, K.A.; Rizkalla, S.H.; Leblanc, B. Horizontal connections for precast concrete shear walls subjected to cyclic deformations part 1: Mild steel con-nections. PCI J. 1995, 40, 78–96. [Google Scholar] [CrossRef]
  37. Duan, L.S.; Zhang, H.B.; Ding, T.T.; Zhou, Y.L.; Wu, N.; Pan, H.; Xia, M.G.; Li, H. Experimental study on rebar mechanical connection performance of steel plate composite blind bolts under high stress repeated tension compression load. J. Archit. Civ. Eng. 2023, 40, 108–118. [Google Scholar]
  38. Liu, Q.Z.; Li, J.Z.; Li, M.F.; Wu, X.K.; Li, Y.C.; Zhang, L. Bond performance prediction model of defective grout in post-fire sleeve connections under cyclic loading. Constr. Build. Mater. 2023, 400, 132442. [Google Scholar] [CrossRef]
  39. GB/T 14370-2015; Anchorage, Grip and Coupler for Prestressing Tendons. Standards Press of China: Beijing, China, 2015.
Figure 1. Mechanical connection splices for PSBs, shown schematically: (a) Geometric construction of splices; (b) PSB cross-section; (c) Threaded rib profile.
Buildings 15 03614 g001
Figure 2. Testing system for splice loading.
Buildings 15 03614 g002
Figure 3. Refined three-dimensional numerical model of splices.
Buildings 15 03614 g003
Figure 4. Grid division of the model.
Buildings 15 03614 g004
Figure 5. Graph showing splice force analysis: (a) analysis of splicing forces as a whole; (b) force analysis diagram of splice threads.
Buildings 15 03614 g005
Figure 6. Flowchart depicting yarn distortion: (a) deformation caused by bending moment or shear force; (b) deformation caused by tilting of threaded roots; (c) deformation caused by thread shear; (d) deformation caused by radial component force.
Buildings 15 03614 g006
Figure 7. Validation of the effectiveness of the refined three-dimensional numerical model.
Buildings 15 03614 g007
Figure 8. Load–displacement curves of splices subjected to monotonic tensile loads (red baseline data from JGJ 107-2016 [22]): (a) MTL-I-A/B/C/D/E splices; (b) MTL-II-A/B/C/D/E splices; (c) MTL-III-A/B/C/D/E splices.
Buildings 15 03614 g008
Figure 9. Load–displacement curves of splices subjected to high-stress repeated tensile and compressive loads (red baseline data from JGJ 107-2016 [22]): (a) HSL-I-A/B/C/D/E splices; (b) HSL-II-A/B/C/D/E splices; (c) HSL-III-A/B/C/D/E splices.
Buildings 15 03614 g009
Figure 10. Load–displacement curves of splices subjected to large-strain repeated tensile and compressive loads (red baseline data from JGJ 107-2016 [22]): (a) LSL-I-A/B/C/D/E splices; (b) LSL-II-A/B/C/D/E splices; (c) LSL-III-A/B/C/D/E splices.
Buildings 15 03614 g010
Figure 11. The strength ratio of splices under different loading conditions (blue baseline data from BS-8110 [34]; red baseline data from ACI-318 [35]): (a) MTL splices; (b) HSL splices; (c) LSL splices.
Buildings 15 03614 g011
Figure 12. The ductility ratio of splices under different loading conditions (red baseline data from Soudki, K.A et al. 1995 [36]): (a) MTL splices; (b) HSL splices; (c) LSL splices.
Buildings 15 03614 g012
Figure 13. Schematic diagram of residual deformation of splices.
Buildings 15 03614 g013
Figure 14. Residual deformation values of splices after cyclic loading: (a) residual deformation after high stress cycles ( u 20 ); (b) residual deformation under the first 4 large strain cycles ( u 4 ); (c) residual deformation under the last 4 large strain cycles ( u 8 ).
Buildings 15 03614 g014
Figure 15. Mises stresses of rebar ribs: (a) MTL-III-A; (b) HSL-III-A; (c) LSL-III-A.
Buildings 15 03614 g015
Figure 16. Mises stress distribution of rebar ribs under different loading conditions: (a) MTL-III-A/B/C/D/E; (b) HSL-III-A/B/C/D/E; (c) LSL-III-A/B/C/D/E.
Buildings 15 03614 g016
Figure 17. Mises stresses of coupler ribs: (a) MTL-III-A; (b) HSL-III-A; (c) LSL-III-A.
Buildings 15 03614 g017
Figure 18. Mises stress distribution on the ribs of couplers under different loading conditions: (a) MTL-III-A/B/C/D/E; (b) HSL-III-A/B/C/D/E; (c) LSL-III-A/B/C/D/E.
Buildings 15 03614 g018
Table 1. Splice identification under varying loads.
Splice VarietiesSpecimens Under
Monotonic Loading
Various Specimens Under
High Stress in Both Tensile
and Compressive Modes
Various Specimens Under
Large Strain in Both Tensile
and Compressive Modes
IMTL-I-A/B/C/D/EHSL-I-A/B/C/D/ELSL-I-A/B/C/D/E
IIMTL-II-A/B/C/D/EHSL-II-A/B/C/D/ELSL-II-A/B/C/D/E
IIIMTL-III-A/B/C/D/EHSL-III-A/B/C/D/ELSL-III-A/B/C/D/E
Table 2. Measurements of splice geometry subjected to varying loads.
Splices DesignatorNominal DiametersHeights of RibsTop Widths of RibsBottom Widths of RibsPitches of RibsOuter Diameters of CouplersLengths of CouplersLengths of Splices
d/mmh/mma/mmb/mml/mmdt/mmL/mmL1/mm
MTL-I-A251.373.2661250132232
MTL-I-B251.373.2661550132232
MTL-I-C251.373.2662050132232
MTL-I-D251.373.2662550132232
MTL-I-E251.373.2663050132232
MTL-II-A321.713.5871660168296
MTL-II-B321.713.58719.260168296
MTL-II-C321.713.58725.660168296
MTL-II-D321.713.5873260168296
MTL-II-E321.713.58738.460168296
MTL-III-A402.143.7282075220380
MTL-III-B402.143.7282475220380
MTL-III-C402.143.7283275220380
MTL-III-D402.143.7284075220380
MTL-III-E402.143.7284875220380
HSL-I-A251.373.2661250132232
HSL-I-B251.373.2661550132232
HSL-I-C251.373.2662050132232
HSL-I-D251.373.2662550132232
HSL-I-E251.373.2663050132232
HSL-II-A321.713.5871660168296
HSL-II-B321.713.58719.260168296
HSL-II-C321.713.58725.660168296
HSL-II-D321.713.5873260168296
HSL-II-E321.713.58738.460168296
HSL-III-A402.143.7282075220380
HSL-III-B402.143.7282475220380
HSL-III-C402.143.7283275220380
HSL-III-D402.143.7284075220380
HSL-III-E402.143.7284875220380
LSL-I-A251.373.2661250132232
LSL-I-B251.373.2661550132232
LSL-I-C251.373.2662050132232
LSL-I-D251.373.2662550132232
LSL-I-E251.373.2663050132232
LSL-II-A321.713.5871660168296
LSL-II-B321.713.58719.260168296
LSL-II-C321.713.58725.660168296
LSL-II-D321.713.5873260168296
LSL-II-E321.713.58738.460168296
LSL-III-A402.143.7282075220380
LSL-III-B402.143.7282475220380
LSL-III-C402.143.7283275220380
LSL-III-D402.143.7284075220380
LSL-III-E402.143.7284875220380
Table 3. Cyclic loading systems for splices.
Cyclic Loading Systems for Splices
High-
stress
repeated
tensile
and
compressive cycle
loading
(HSL)
0→(0.9fykAs→−0.5fykAs)…(0.9fykAs→−0.5fykAs)→Ultimate load capacity of splices (Fu)
Buildings 15 03614 i001
Large-
strain
repeated
tensile
and
compressive cycle
loading
(LSL)
0→(2εykL1→−0.5fykAs)…(5εyk L1→−0.5fykAs)→Ultimate load capacity of splices (Fu)
Buildings 15 03614 i002
Table 4. Splices’ material parameters.
Material
Name
ρ/(kg/m3)νE/MPa f y k /MPa ε y k f s t k /MPa ε s t k
PSB830 [16]78500.3201,0008300.004110300.07
40Cr [29]78500.3210,0007850.00379800.09
Table 5. Evaluation of splice connection performance under monotonic tensile loads.
Names of SplicesRsRdModes of Damage
MTL-IA1.4735.11Rebar fracture
B1.4533.71Rebar fracture
C1.3727.54Rebar fracture
D1.3024.20Rebar fracture
E1.2020.83Rebar fracture
MTL-IIA1.4434.22Rebar fracture
B1.4228.21Rebar fracture
C1.3420.87Rebar fracture
D1.2317.51Rebar fracture
E1.1711.59Rebar fracture
MTL-IIIA1.4336.52Rebar fracture
B1.4230.92Rebar fracture
C1.3621.96Rebar fracture
D1.2523.66Rebar fracture
E1.2417.11Rebar fracture
Table 6. Evaluation of splice connection performance under high-stress repeated tensile and compressive loads.
Names of SplicesRsRd u 20 Modes of Damage
HSL-IA1.4835.770.090Rebar fracture
B1.4432.000.098Rebar fracture
C1.3726.580.114Rebar fracture
D1.3024.400.130Rebar fracture
E1.2020.130.177Rebar fracture
HSL-IIA1.4334.960.068Rebar fracture
B1.4127.160.069Rebar fracture
C1.3419.610.072Rebar fracture
D1.2318.290.105Rebar fracture
E1.1711.600.118Rebar fracture
HSL-IIIA1.4434.600.090Rebar fracture
B1.4230.500.094Rebar fracture
C1.3621.230.096Rebar fracture
D1.2523.010.188Rebar fracture
E1.2416.830.195Rebar fracture
Table 7. Evaluation of splice connection performance under large-strain repeated tensile and compressive loads.
Names of SplicesRsRd u 4 u 8 Modes of Damage
LSL-IA1.4835.140.0700.101Rebar fracture
B1.4533.780.0920.121Rebar fracture
C1.3830.500.0960.137Rebar fracture
D1.2517.390.1050.180Rebar fracture
E1.1513.200.2120.306Rebar fracture
LSL-IIA1.4433.140.1270.150Rebar fracture
B1.4228.490.1320.156Rebar fracture
C1.3419.400.1370.163Rebar fracture
D1.2318.010.1540.241Rebar fracture
E1.118.040.1870.299Rebar pullout
LSL-IIIA1.4434.800.0330.096Rebar fracture
B1.4229.650.0810.106Rebar fracture
C1.3419.860.1120.124Rebar fracture
D1.2522.680.1570.248Rebar fracture
E1.2417.140.1850.365Rebar fracture
Notes: Buildings 15 03614 i003: The connection performs as expected, and the damage type is rebar fracture damage. Buildings 15 03614 i004: The connection performance falls short of the specified standards, and the damage mode is rebar fracture damage. Buildings 15 03614 i005: The splice connection performance falls short of the specifications, and the damage mode is rebar pullout. Buildings 15 03614 i006: The connecting performance of the splices does not match the requirements of the specification.
Disclaimer/Publisher’s Note: The statements, opinions and data contained in all publications are solely those of the individual author(s) and contributor(s) and not of MDPI and/or the editor(s). MDPI and/or the editor(s) disclaim responsibility for any injury to people or property resulting from any ideas, methods, instructions or products referred to in the content.