Abstract
This study investigates the shear behavior of concrete elements reinforced with both traditional steel reinforcement and macro-synthetic fibers, with an emphasis on evaluating the predictive capabilities of current shear design provisions. A review of available experimental data, involving 52 beams and 8 panel specimens, revealed limitations in both quantity and consistency, hindering the formulation of robust design recommendations. To address this, an extensive parametric numerical study was conducted using the VecTor2 nonlinear finite element program, incorporating a recently developed modeling approach for PFRC shear response. A total of 288 simulations were carried out to explore the influence of fiber content, transverse reinforcement ratio, and concrete compressive strength, particularly in ranges not previously captured by experimental programs. The performance of existing design codes, including ACI, CSA, EC2, AASHTO, and the Fib Model Code, was assessed against both experimental data and the enriched parametric dataset. The Fib Model Code demonstrated the most reliable and consistent predictions, maintaining close alignment with reference strengths across all fiber contents, reinforcement ratios, and concrete strengths. AASHTO provisions performed moderately well, showing generally conservative and stable predictions, though some underestimation occurred for beams with higher shear reinforcement. In contrast, ACI and CSA models were consistently conservative, especially at higher concrete strengths, potentially leading to uneconomical designs. EC2 models exhibited the highest variability and least reliability, particularly in the presence of fibers, indicating limited applicability without modification. The results highlight that most conventional codes do not fully account for the synergistic action between fibers and transverse steel reinforcement, and that their reliability deteriorates for high-strength PFRC. These findings have practical implications for the design of PFRC elements, suggesting that the Fib Model Code may be the most suitable for current applications, whereas other provisions may require recalibration or modification. Future research should focus on expanding experimental datasets and developing unified design models that explicitly consider fiber–steel interactions, concrete strength, and fiber distribution.
1. Introduction
Macro-synthetic fibers are frequently incorporated into concrete mixes to serve as secondary reinforcement. Their main purpose is to help manage cracks caused by shrinkage and temperature variations, while also enhancing the long-term performance of structural components such as bridge superstructures. By improving the tensile properties of concrete, these fibers contribute to greater ductility and more effective crack mitigation. Furthermore, their inherent tensile strength can enhance the overall load-carrying capacity of concrete members [1,2,3,4].
The integration of macro-synthetic fibers presents several advantages for modern construction practices. When used in both precast and cast-in-place elements, they can reduce the need for traditional steel reinforcement, which helps minimize reinforcement congestion. This can lead to lighter structural elements, finer crack patterns, improved stress distribution, and better confinement at member ends, all of which contribute to improved structural performance.
However, while recognized at a qualitative level, the beneficial contribution of synthetic fibers to the properties of macro-synthetic fiber-reinforced concrete (PFRC) is poorly understood and generally neglected in design.
The lack of generalized provisions regarding the use of macro-synthetic fibers as supplemental reinforcement is primarily due to the limited experimental evidence. Particularly scarce is the available experimental evidence pertaining to the shear response of PFRC elements, with even fewer tests focused on investigating the shear behavior of elements reinforced with both macro-synthetic fibers and deformed steel bars (see Figure 1).
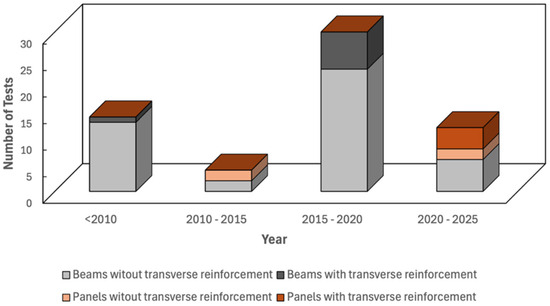
Figure 1.
Available PFRC beams and panels from experimental studies in the literature.
Notably, experimental findings on the combined use of deformed steel bars and fiber reinforcement for shear resistance indicate that incorporating fibers into reinforced concrete beams enhances their shear capacity. This enhancement often promotes a shift in failure mode from brittle to more ductile behavior [5,6,7,8,9,10,11,12]. Despite these promising results, the limited availability of experimental data has prevented the inclusion of specific design provisions for fiber-reinforced concrete with conventional stirrups in current structural design standards.
The primary challenge to advancing design methodologies lies in the difficulty of producing enough experimental data to support the development of robust and widely applicable design equations. Experimental investigations are resource-intensive and often constrained in terms of the number of variables they can evaluate.
To address this limitation, ref. [13] introduced a nonlinear numerical modeling strategy tailored for synthetic fiber-reinforced concrete elements subjected to shear. Their approach, implemented using the VecTor2 finite element platform [14], was calibrated using experimental data provided by [15] and validated against a comprehensive collection of panel and beam test results reported in the literature. The study demonstrated a strong alignment between model predictions and observed behavior, with an average predicted-to-measured shear strength ratio of 0.99 and a coefficient of variation of 5.5%.
This modeling framework offers a powerful alternative to physical testing, allowing for extensive simulations across a broad range of parameters and conditions. It helps bridge the data gap and supports the development of rational shear design methodologies by generating reliable insights where physical testing is limited.
This paper contributes to filling that knowledge gap by first reviewing relevant experimental data to evaluate the accuracy of five international design codes. Subsequently, 288 panel specimens are designed and analyzed in VecTor2, covering variables such as concrete compressive strength, fiber dosage, and transverse reinforcement ratio. The resulting database is used to highlight key behavioral trends and to assess the performance of the selected design provisions, offering critical support for refining design recommendations.
2. Available Experimental Evidence
The shear response of PFRC elements has predominantly been investigated experimentally considering two types of structural components, namely beam tests and panel tests (examples in Figure 2). Beam tests have typically involved simply supported beams subject to three or four-point bending, while the few PFRC panel tests reported in the literature have been conducted using special panel element testers, only available at a few institutions (e.g., University of Toronto, University of Washington).
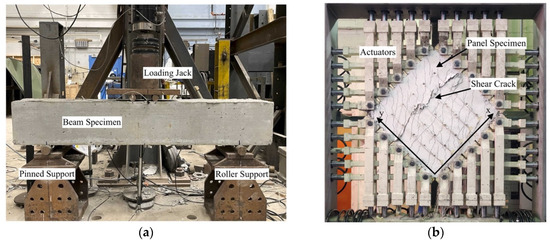
Figure 2.
Typical experimental setups for PFRC testing. (a) Shear resistance of beam (adapted from [16]), (b) Panel Element Tester.
A number of experimental investigations have explored the shear behavior of polymer fiber-reinforced concrete (PFRC) beams, with a total of 52 beam tests identified in the literature (details provided in Table A1, Appendix A). Noteworthy contributions include studies by [17,18,19,20,21,22,23,24,25].
These works collectively examined the effects of key parameters such as beam depth, shear span-to-depth ratio (), reinforcement ratios (both longitudinal and transverse ), compressive strength (), fiber volume fraction (), and fiber length (lf), as outlined in Table 1. Overall, these studies highlight that macro-synthetic fibers can bridge shear cracks, delay failure, and improve post-cracking ductility and energy absorption, with effectiveness strongly dependent on fiber content and matrix properties.

Table 1.
Summary of variables tested in PFRC beam experimental programs.
While PFRC beam testing is relatively well represented, only a limited number of studies have evaluated the combined contribution of macro-synthetic fibers and traditional shear reinforcement. Just 14 such tests (spanning both beam and panel elements) could be identified in the literature (e.g., [26,27,28]). These investigations suggest that combining macro-synthetic fibers with transverse steel reinforcement can significantly improve shear performance, with reported strength increases ranging from 11% to 47% relative to conventional reinforced concrete (RC) counterparts. In some cases, synergistic behavior has been observed, where the enhancement in shear strength exceeds the sum of the contributions from fibers and stirrups used in isolation. For instance, ref. [12] documented a 10% synergistic gain in shear strength in PFRC beams containing 0.5% fiber volume and a transverse reinforcement ratio of 0.28%. Overall, the data indicate that the fiber contribution is more pronounced for beams with lower , and that improvements in post-cracking behavior and crack control are consistently observed. These trends provide a context for the subsequent evaluation of design code predictions.
In addition to beams, a smaller subset of studies has examined PFRC panels subjected to shear. Refs. [29,30] reported that macro-synthetic fibers can effectively limit crack widths by bridging cracks, thereby enhancing shear response. However, these studies also found that achieving shear capacity comparable to that of steel fibers required significantly higher fiber volumes. For example, ref. [29] observed that 2.0% macro-synthetic fibers were needed to match the performance of panels reinforced with just 0.5% hooked-end steel fibers. The use of high fiber volumes, however, was also associated with workability challenges.
To contribute to the limited dataset on PFRC elements incorporating both macro-synthetic fibers and conventional shear reinforcement, ref. [15] conducted a focused experimental program. Nine panel specimens, six PFRC and three RC, were tested under monotonic pure shear using the Panel Element Tester at the University of Washington. The main variables examined were macro-synthetic fiber volume and transverse reinforcement ratio (), which varied between 0% and 0.91%. The fiber content ranged from 0% to 0.52%, while the longitudinal reinforcement ratio was held constant at 2.28% for all specimens. This ratio was selected to exceed twice the highest transverse reinforcement level to promote shear-dominated failure while minimizing the risk of premature biaxial yielding. With this study, a total of 8 PFRC panels were available in the literature, with their key properties summarized in Table 2.
Table 2.
Summary of variables tested in PFRC panel experimental programs.
Findings from Gaston’s study revealed that shear strength was primarily governed by , while fibers provided measurable benefits in terms of crack width reduction and post-cracking ductility. Modest improvements in shear strength were observed at the tested fiber dosages, with more pronounced gains at lower transverse reinforcement ratios. For example, increasing fiber content from 0.26% to 0.52% resulted in a 15% improvement in shear strength when was 0.34%, whereas the same increase produced negligible gains for = 0.91%. This trend aligns with the findings of [27], where fiber contribution diminished as increased. Collectively, these experimental results confirm that macro-synthetic fibers enhance crack control and post-cracking performance, with their effect on shear strength strongly modulated by the amount of transverse steel reinforcement. The observed variability and limited data in hybrid fiber–stirrup elements underscore the need for numerical simulation and code evaluation to assess predictive accuracy and reliability across a broader parameter space.
3. Current Code-Based Approaches to Estimate Shear Strength
Five major international codes, namely the AASHTO LRFD specifications [31,32,33,34,35], were considered in this work. This section provides an overview of the shear provisions contained in these design standards.
3.1. AASHTO LRFD Bridge Design Specifications
The basis for the current shear provisions in the AASHTO LRFD Bridge Design Specifications is the Modified Compression Field Theory (MCFT) [36]. According to the MCFT, the shear strength of a concrete member can be estimated if two parameters, and , are known. These two factors depend on the longitudinal strain in the element and the crack spacing, and values for and can be computed using closed-form equations, for members with and without transverse reinforcement [37]. The AASHTO LRFD Bridge Design Specifications do not consider the contribution of fibers to a member’s shear strength, rather the nominal shear resistance is determined as the sum of contributions from the concrete, transverse steel, and prestressing:
where is the area of transverse reinforcement within a distance , is the specified concrete cylinder compressive strength in MPa, is the yield stress of the transverse reinforcement in MPa, is the effective web width, is a parameter that accounts for the concrete’s ability to transmit tensile stresses, is the angle of inclination of compressive stress, and α is the angle of inclination of transverse reinforcement. The parameters and are calculated as:
where is the crack spacing parameter as influenced by aggregate size (300 mm ≤ ≤ 2000 mm), is the maximum aggregate size for the concrete in millimeters, and the crack spacing, , is taken as the effective member depth, , or the maximum distance between layers of longitudinal crack control reinforcement, whichever is less. The net longitudinal strain in the section at the centroid of the tensile reinforcement, , is computed as:
where is the factored moment at the section, is the factored axial force at the section, is the factored shear force at the section, is the component of prestressing force in the direction of the shear force, is the effective prestress in the prestressed reinforcement (often taken as 0.7 ), and , , , and are the elastic modulus and area of the non-prestressed and prestressed tension reinforcement on the flexural tension side of the member, respectively.
3.2. ACI 318
Although ACI-318 permits the use of SFRC beams without stirrups if certain criteria are met, it does not quantify the contribution of fiber-reinforcement to the strength of structural elements. The shear strength of FRC for non-prestressed members is conservatively assumed equal to that of conventional concrete, like the AASHTO LRFD Bridge Design Specifications.
where is the acting axial force, is the gross area of the cross section, is the web longitudinal reinforcement ratio, is the 28-day cylinder strength in MPa, is a factor to account for lightweight concrete, and is the size effect factor, computed as
The minimum transverse reinforcement ratio is determined by:
where d is the depth of the cross section, is the width of the web of the section, is the transverse reinforcement spacing and is the yield stress of the transverse reinforcement in MPa. The contribution of the transverse reinforcement is computed similarly to the AASHTO and fib codes, but ACI 318 assumes an inclination, 45°, which simplifies the calculation. ACI 318 imposes an upper limit for the transverse reinforcement strength contribution of . The nominal shear strength is thus:
3.3. CEB-fib Model Code 2010
The fib Model Code 2010 considers the benefit of fibers to the shear strength of concrete, specifying the shear strength contribution of FRC as:
where is the partial safety factor for concrete (taken as 1.0 for comparison to experimental strengths), is the compressive stress in the element caused by external loads or prestressing, is the 28-day compressive cylinder strength in MPa, is the longitudinal reinforcement ratio, is a size effect factor that depends on the member depth (in mm), is the characteristic value of the ultimate residual tensile strength, and is the characteristic tensile strength. For a crack width at ultimate, = 1.5 mm:
where and are the residual strengths from an FRC flexural test at = 0.5 mm and = 2.5 mm, respectively. The residual strengths can be estimated by
The characteristic tensile strength is taken as according to:
where = 8 MPa. If the transverse reinforcement ratio, , the shear resistance of the member is taken as the sum of concrete and transverse steel contributions:
The contribution from the transverse reinforcement and the strength limit are computed by:
where , , and
The longitudinal strain, , is determined by:
where , , and are the design moment, shear, and axial load at the section under consideration; is the distance from the section geometric centroid to mid-depth of the effective shear depth; is the effective shear depth that can be assumed equal to 0.9 d; and and are the elastic modulus and area of the non-prestressed tension reinforcement.
3.4. CSA A23.3 (2019)
The CSA A23.3 is based on the MCFT and is very comparable to AASHTO, with some minor differences. The shear strength is computed from Equation (1), but the concrete contribution is computed from Equation (25).
where and for normal weight concrete. The steel contribution aligns with AASHTO and is computed according to Equation (3), but coefficients and are determined using the general method as:
where and are the design shear and moment, respectively, and is the effective shear depth. The equivalent crack spacing parameter is for sections with minimum transverse reinforcement that satisfy Equation (29):
But:
for sections without minimum transverse reinforcement, whichever is less. Additionally, for compressive strengths , should be used in Equation (30). As goes from 60 MPa to 70 MPa, ag shall be linearly reduced to zero.
3.5. Eurocode 2 (EC2)
The EC2 provides two approaches to compute the shear resistance of members with and without transverse reinforcement, respectively.
For members without transverse reinforcement, the shear resistance is computed as
where
( is the area of tensile reinforcement)
where is the axial force on the cross section and is the area of the concrete cross section. The minimum shear strength is computed as:
And the recommended values for and are and 0.15, respectively.
The strength of members containing shear reinforcement is computed as the minimum of two contributions, namely and . The term represents the strength of the transverse reinforcement, while the term represents the crushing strength of the concrete struts:
And for non-prestressed members, and
In the equations above, the partial safety factor for concrete was taken as . The angle was constrained within the range permitted by EC2, namely (corresponding to ). Accordingly, in this study the EC2 shear predictions were bounded by evaluating two cases: one with and the other with , representing the lower and upper limits of the permissible range.
4. Available Design Methods Reliability Assessment
To evaluate the precision and reliability of the shear design methods described in Section 3, predicted-to-experimental strength ratios were compared for four categories of PFRC specimens sourced from the literature: beams without shear reinforcement, beams with shear reinforcement, panels without shear reinforcement, and panels with reinforcement. The spread of these predicted-to-experimental strength ratios is illustrated in Figure 3, while Table 3 provides a summary of the average, median, and coefficient of variation (COV) values for each design model within each category. A ratio of 1.0 indicates perfect agreement between predicted and experimental values; deviations reflect underestimation (<1.0) or overestimation (>1.0). The circle markers in the graph represent outliers, highlighting data points that deviate significantly from the main distribution.
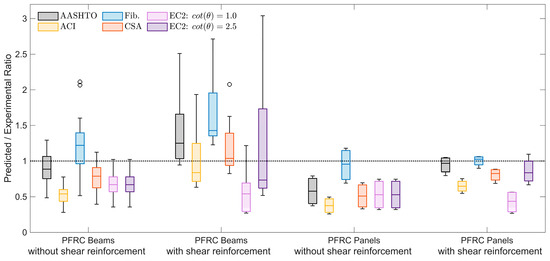
Figure 3.
Performance assessment of shear design codes against available experimental evidence.
Table 3.
Performance of shear design codes against experimental evidence (predicted/experimental).
In the following section, each model’s performance is evaluated based on its proximity to the 1.0 benchmark and the variability of the data, reflecting both accuracy and reliability. A separate discussion is provided for the individual groups of specimens.
For PFRC beams without shear reinforcement, the AASHTO model yielded the most accurate predictions with a mean and median average strength ratio of 0.90 and 0.89, respectively, and relatively low scatter (COV = 22.0%), suggesting consistent performance.
The Fib Model Code also exhibited reasonable performance, with an average ratio of 1.20 and median of 1.22, indicating overprediction but good alignment with experimental values. Its coefficient of variation is 28.8%.
ACI and CSA models underpredicted shear strength more markedly (mean = 0.52 and 0.77, respectively), while maintaining reasonable consistency (COV ≈ 22–23%). Both EC2 variants also underpredicted strength with similar averages (0.68), and consistency (COV = 22.5%).
With the introduction of shear reinforcement in beams, variability increased across most models. The Fib model again produced the highest mean (1.68) and median (1.43) values. The AASHTO model also overpredicted (mean = 1.42), though with a relatively large spread (COV = 38.7%), suggesting reduced consistency compared to unreinforced cases.
In contrast, ACI and CSA models delivered moderate predictions (mean = 1.02 and 1.20), but their medians (0.84 and 1.04) and high coefficients of variation (COV = 44.5% and 35.6%) reveal considerable dispersion in results. Notably, EC2 with cot(θ) = 1.0 significantly underestimated shear capacity (mean = 0.57), with the highest variability among all models (COV = 56.3%). The cot(θ) = 2.5 variant achieved an average of 1.22 but suffered from extremely high scatter (COV = 74.0%), indicating unreliable predictions.
The performance of all models deteriorated when applied to PFRC panels without shear reinforcement. The Fib Model Code performed best (mean = 0.95, median = 0.95, COV = 25.4%), demonstrating high accuracy and relatively low dispersion. However, AASHTO, ACI, and CSA were all notably conservative, with average ratios of 0.58, 0.38, and 0.51, respectively. The ACI model showed the lowest mean of all (0.38), though with moderate variability (COV = 30.2%).
Both EC2 models produced identical averages (0.53) and medians, accompanied by high variability (COV = 41.0%).
Finally, for PFRC Panels with shear reinforcement, the AASHTO and Fib models again provided the most satisfactory predictions, with average ratios of 0.95 and 1.00, and coefficients of variation under 15%, indicating good alignment and reliability. CSA and ACI remained conservative (mean = 0.81 and 0.65, respectively), with a similar consistency compared to other groups.
The EC2 model with continued to underpredict (mean = 0.43), while EC2 yielded an average closer to unity (0.86).
The results outlined above show that, overall, the Fib Model Code tends to yield the most balanced and reliable strength predictions across all specimen types, followed by the AASHTO model which also performs well compared to the other codes tested. ACI and CSA models are generally overly conservative.
While the EC2 model with offers safe lower-bound estimates, its applicability appears limited by persistent underprediction. The variant suffers from high dispersion, especially for beams with shear reinforcement.
Crucially, no single model emerged as consistently reliable across both beams and panels with shear reinforcement (which represent the focus of this work). The Fib Model Code, despite offering accurate predictions in reinforced panels (mean = 1.00, COV = 7.6%), tended to overestimate shear strength in reinforced beams (mean = 1.68). Similarly, the AASHTO model, though generally reasonable, displayed notable variability in reinforced beams (COV = 38.7%). Models such as ACI, CSA, and the EC2 variants showed either persistent underprediction or unacceptable scatter, particularly in the case of EC2 with , which had the highest coefficient of variation (COV = 74.0%) among all.
These findings underscore that the model reliability decreases in the presence of shear reinforcement. The interaction between macro-synthetic fibers and traditional transverse steel is more complex and not well understood in current design formulations.
Importantly, this assessment is based on a limited dataset extracted from the available experimental literature. While trends can be observed, the statistical robustness of the conclusions is constrained by the small sample sizes and variability in test configurations, materials, and loading protocols. As such, additional data are essential to develop a more statistically representative evaluation of model performance. This would enable not only a more refined calibration of existing models but also the potential development of new approaches better suited to the hybrid behavior of fiber-reinforced concrete with shear reinforcement. This identified gap provides the motivation for the work conducted herein and presented in the remainder of this paper.
5. Generation of a Comprehensive Database of Shear Results via Numerical Analyses
The results presented in the previous sections have shown that limited experimental evidence pertaining to the response of PFRC structural components exists in the literature, complicating the identification/development of definitive shear design recommendations. The limited results analysed in Section 4 suggest that the Fib Model Code may be best suited to be adopted or adapted for use in this context, but limitations were identified, and it was discussed how definitive recommendations can only be made considering more conclusive evidence. It was noted that there are only a handful of specimens tested in the literature that contain both synthetic fibers and traditional steel reinforcement.
Evidently, it is difficult to generate an amount of experimental data that is statistically meaningful to support the adoption of a given design methodology or the implementation of a new approach, and each experimental program can only focus on a limited number of variables. In contrast, large shear databases can be generated via numerical analysis, provided that reliable modeling strategies are available to simulate the response of selected specimens.
To this end, a numerical modeling approach for PFRC elements subjected to shear was recently proposed by [13] and implemented in the finite element software VecTor2 version 4.3 [14]. This was used herein to conduct an extensive parametric study to extend the results of the available experimental testing programs, exploring additional combinations of parameters, and to generate results that are used in later sections to further assess the reliability of the design provisions summarized in Section 3.
The case study structures considered in the parametric study consisted of PFRC panels with baseline properties (e.g., geometry and loading conditions) identical to the specimens tested experimentally by [38], encompassing a wide range of PFRC specimens varying in concrete compressive strength (20 MPa to 95 MPa), fiber volume fraction, and shear span-to-depth ratios. Panel specimens were selected at this stage to set some limits to the number of variables at play, and to narrow the scope to studying elements in pure shear. Additionally, while the model proposed by Farag et al. is believed to be reliable to simulate the response of beam elements, it was formulated and calibrated specifically to deal with panel/membrane-type structural components. Hence, there is a higher degree of confidence placed on the ability of the simulator to accurately replicate the behavior of panel-type specimens, which further motivated the decision to generate a numerical database of panel test results.
Details pertaining to the parametric study conducted are provided in the following subsections, including a discussion of the key outcomes and main trends observed as a function of the different variables considered.
5.1. Case Study Structures Definition and Numerical Modeling
The recently developed modeling strategy by [13] enables the generation of extensive numerical datasets that can be utilized to critically evaluate the performance of existing shear design provisions. Thus, a total of 288 PFRC panel configurations were simulated, systematically varying key design variables including concrete compressive strength (ranging from 20 MPa to 95 MPa), transverse reinforcement ratio (ρt from 0% to 1.5%), and macro-synthetic fiber content ( from 0% to 2%). The complete list of varying parameters considered in the parametric study is summarized below:
- f′c = 20 MPa, 45 MPa, 70 MPa and 95 Mpa
- Vf = 0% to 2.00%, in 0.25% increments
- ρt = 0%, 0.10% and 0.25% to 1.50% in 0.25% increments
These parameters were chosen to encompass both typical and boundary-case values that may arise in practical applications, allowing the influence of individual and combined effects to be fully explored. In particular, the combination of these variables allowed identification of design regimes where fiber addition may be most effective.
All specimens analyzed in this parametric study share a consistent geometry of 1000 mm × 1000 mm × 70 mm, matching common panel sizes in experimental programs (e.g., [29,38,39]). The longitudinal reinforcement ratio () was fixed at 2.28%, a value exceeding the maximum considered ρt by approximately 50%, ensuring shear-dominated behavior and avoiding the development of biaxial yielding. Uniform shear loads were applied incrementally to simulate monotonic loading up to failure.
The numerical simulations were performed using VecTor2 [14], a nonlinear finite element platform based on the Modified Compression Field Theory [40] and the Disturbed Stress Field Model [41]. Following the framework of [9], each specimen was represented as a single four-node membrane element with smeared reinforcement in both orthogonal directions. This modeling approach, referred to as the “single membrane element” method, has been adopted in prior studies [29,42,43] and allows efficient yet accurate simulation of shear response in thin panels. Shear forces were introduced through corner-applied nodal loads, and the element was supported at its lower corners with pin and roller constraints, closely replicating experimental boundary conditions as established in prior work (e.g., [15]).
Steel reinforcement was modeled with fixed mechanical properties across all simulations: yield strength () of 420 MPa, ultimate strength () of 520 MPa, Young’s modulus () of 200,000 MPa, a strain-hardening threshold () of 0.010, and an ultimate strain () of 0.15. The bond between steel bars and the surrounding PFRC matrix was modeled using the default perfect bond assumption in VecTor2, though more detailed approaches are available [40].
Fibers were modeled using a smeared reinforcement formulation as well, with assigned properties as follows: length = 40 mm, aspect ratio = 90, modulus of elasticity = 9577 MPa, tensile strength = 620 MPa, and an equivalent diameter of 0.43 mm. These properties were chosen based on the work of [38], who adopted GCP Strux 90/40. To capture crack development, the maximum crack spacing was set to 70 mm in both directions, based on prior experimental findings [38], which have shown that this parameter is largely insensitive to changes in fiber content [9]. All constitutive material models were defined as recommended by [9] to maximize predictive accuracy.
5.2. Numerical Analysis Key Results and Observed Trends
Key trends and insights derived from the numerical parametric study are presented in this section. Figure 4 illustrates representative shear stress–strain curves for selected panel configurations. These results correspond to panels with two levels of concrete compressive strength (45 MPa and 70 MPa), subjected to four transverse reinforcement ratios (0%, 0.1%, 0.5%, and 1.0%) and fiber contents ranging from 0% to 2% in 0.5% increments. In general, an increase in either transverse reinforcement or fiber content led to higher peak shear stresses, while the ultimate shear strain decreased. Fiber additions up to 0.5% by volume contributed modestly to peak strength but provided noticeable enhancements in ductility. These outcomes are in line with previous experimental findings [27,38]. An exception to this behavior was observed in panels without shear reinforcement, where even small volumes of fiber improved both shear resistance and post-peak deformation capacity.
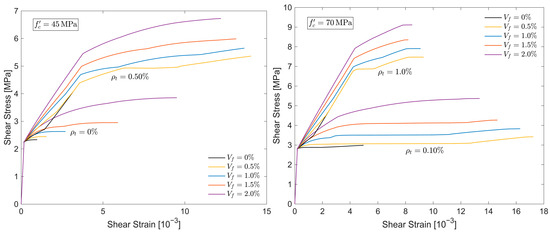
Figure 4.
Typical shear Stress–Strain response as a function of transverse reinforcement and fiber content.
The strength gains achieved through fiber inclusion are further quantified in Figure 5, which plots the relative increase in shear capacity for various levels of fiber dosage, concrete strength, and shear reinforcement. Shear enhancement was defined as the ratio of the fiber-reinforced panel strength to that of an otherwise identical specimen lacking fibers. The analysis revealed that panels with higher concrete compressive strength () exhibited more substantial relative strength gains from fiber inclusion than panels with lower strength (). Additionally, the marginal benefit of fiber reinforcement diminished in specimens with dense shear reinforcement (), whereas panels with light or no shear reinforcement () showed the most pronounced improvement. Within the experimental bounds explored by [38], where did not exceed 0.52%, shear capacity gains remained under 10%, which aligns with the lack of a clear strength trend in that study. Notably, the greatest percentage increases were observed in lightly reinforced panels (e.g., = 0.1% and 0.25%), even exceeding those with no reinforcement at all. This suggests a potential synergistic effect between minimal bar reinforcement and fiber addition. Overall, fiber effectiveness declined as the transverse reinforcement increased, regardless of concrete grade.
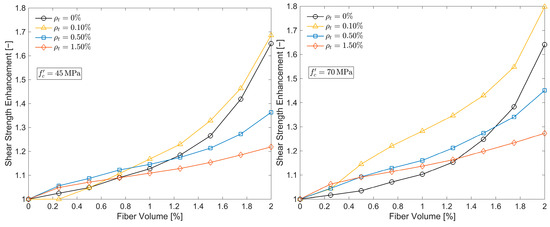
Figure 5.
Typical shear strength increment for varying concrete strength and reinforcement ratio.
Figure 6 presents contour plots of computed shear strength (in MPa) as a function of transverse reinforcement ratio () and fiber content () for concrete strengths of 45 MPa and 70 MPa. While the overall trends are consistent across all concrete grades, the magnitude of shear capacity naturally increases with higher compressive strength. The plots clearly show that both parameters positively influence shear strength, although the rate of increase varies. A mild interaction between and is observable, though it has limited impact on the overall contour shapes. For instance, to achieve a target shear strength of approximately 5 MPa, the introduction of fibers at Vf ≈ 1.5% allowed a significant reduction (nearly 50%) in required transverse bar reinforcement.
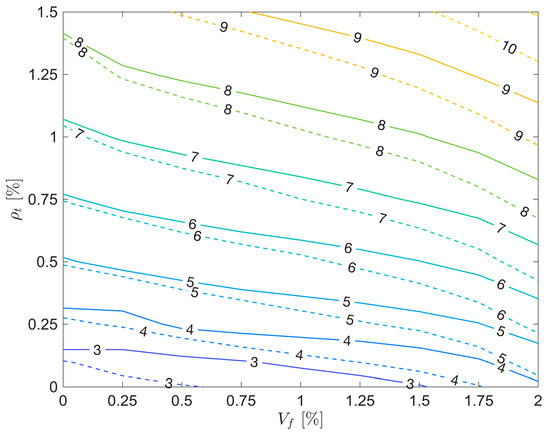
Figure 6.
Influence of reinforcement ratio and fiber content on shear strength for varying concrete strength ( MPa—solid line; MPa—dashed line).
Maximum crack widths corresponding to a normalized shear stress level of 0.4 (MPa) are shown in Figure 7, plotted against both and . This stress level was chosen to display post-cracking crack widths as the cracking stress was [9]. Some models, particularly those without reinforcement and those with = 0.125%, did not reach this stress level and are omitted from the plot. Overall, as observed in experimental studies (e.g., [38]), increasing either the fiber content or the shear reinforcement ratio led to narrower cracks at the reference stress level. However, the impact of fiber inclusion on limiting crack widths became less significant as the amount of bar reinforcement increased, suggesting a complementary relationship between the two mechanisms of crack control.
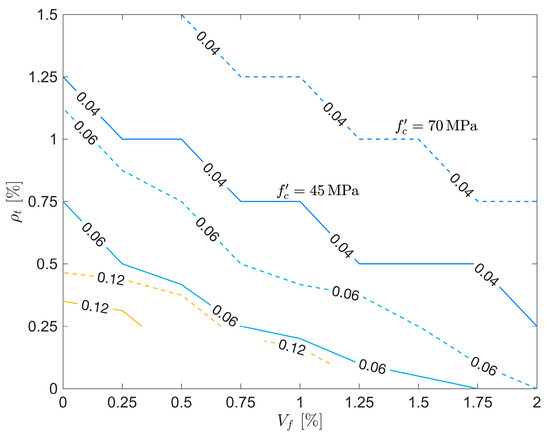
Figure 7.
Crack widths at for MPa (solid) and MPa (dashed).
6. Comparison of Available Design Methods with Parametric Study Results
The evaluation of the design codes presented in Section 3 was conducted mainly through the analysis of predicted-to-numerical strength ratios. A summary of these ratios, including their mean, median, and coefficient of variation (COV) values, for the entire parametric study is provided in Table 4. More detailed results can be found in [13].
Table 4.
Predicted-to-numerical strength ratios for the parametric study.
The Fib Model Code exhibited the best overall performance, with an average prediction close to unity (mean = 0.94), low scatter (COV = 15.2%), and a narrow range of predicted-to-reference ratios (0.50 to 1.25).
The AASHTO model was moderately conservative overall (mean = 0.84), while having a greater scatter (COV = 24.3%), and a maximum prediction of 1.21. It consistently underpredicted shear strength for high-strength concretes and at higher fiber contents but remained within acceptable bounds, making it a cautiously safe option.
In contrast, ACI and CSA models were consistently conservative across all specimen groups, with average predictions of 0.60 and 0.72, respectively. However, their scatter was substantial (COV ~26–27%), and the lower bounds of predictions were as low as 0.20–0.22, suggesting that they may be overly penalizing the influence of fibers, especially at lower concrete strengths.
The EC2 models, particularly with , provided the most conservative predictions (mean = 0.44), often significantly underpredicting shear capacity, especially for specimens with higher fiber volumes. Although consistent in trend, this version yielded the lowest minimum prediction (0.12) and high variability (COV = 35.8%). The EC2 with was more balanced in average prediction (mean = 0.79) but showed the highest coefficient of variation (COV = 43.7%), indicating high sensitivity to specimen parameters and significant inconsistency across the dataset.
The results summarized in Table 4 are also shown, somewhat more comprehensively, in Figure 8, which shows the design codes-to- predicted strength ratios. The predicted panel strength from the code equations considered versus the peak shear strength of the finite element models is outlined, grouping the results as a function of concrete strength. The dashed line indicates a 1:1 relationship.
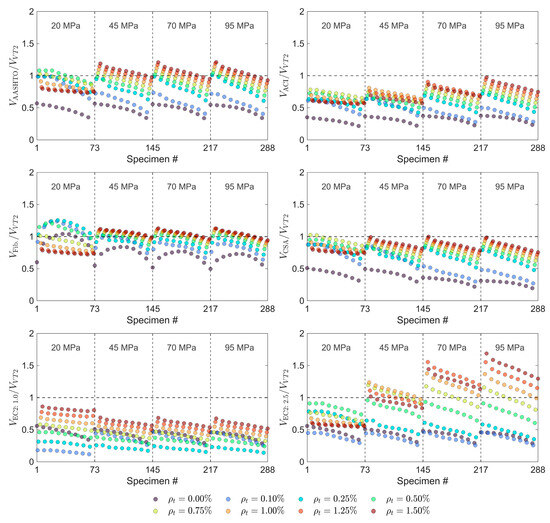
Figure 8.
Code equation performance assessment against results from numerical parametric study.
As shown in the figure, model accuracy was affected by changes in concrete compressive strength, particularly when moving from lower-strength concretes (20–45 MPa) to high-strength concretes (70–95 MPa).
At lower concrete strengths (20–45 MPa), most models (including ACI, CSA, and EC2) tend to perform more consistently, albeit conservatively. However, at higher concrete strengths (70–95 MPa), the performance of most models deteriorates. This is particularly apparent in the ACI and CSA models, whose predictions increasingly diverge from the reference values, resulting in more pronounced underestimations. The reduced reliability of code predictions for high-strength concrete can be partly attributed to the fact that most design equations were originally calibrated for concrete compressive strengths below 70 MPa, and therefore may not adequately capture the distinct mechanical behavior of high-strength concrete.
The EC2 models, although conservative across the board, also show growing scatter and prediction bias at higher strengths. For example, the EC2 with underpredicts shear strength significantly for higher-strength specimens.
In contrast, the Fib Model Code and AASHTO exhibit more favorable trends. The Fib model maintains consistent alignment with the reference predictions across all strength levels. Its underlying formulation accounts for a broader range of influencing parameters, including size effects and fiber contributions, which appear to provide better generalization across different strength classes. AASHTO, while generally underpredicting at higher strengths, shows a consistent slope in its response, suggesting that it could be recalibrated more easily than models with erratic performance.
This sensitivity to strength is critical because high-strength PFRC is increasingly used in structural applications where weight reduction and durability are prioritized. The results clearly indicate that most conventional models may not be reliably extrapolated to high-strength PFRC without adjustments.
The relative performance ranking of the models remains consistent with that discussed in Section 4, where the design models were assessed against the experimental results from the literature. This consistency strengthens confidence in the overarching conclusions regarding the inherent merits, limitations and tendencies of these models when applied to PFRC.
However, some differences arose in the degree of variability and sensitivity to parameters. For instance, in the experimental dataset, both AASHTO and Fib were observed to significantly overpredict the shear strength of PFRC beams with shear reinforcement, whereas in the parametric (numerical) study, their predictions were generally conservative and more stable. This contrast likely stems from the greater uniformity and control of variables in the numerical simulations, which reduces the scatter caused by complexities such as fiber distribution, detailing variations, and testing protocols inherent in experimental setups.
Perhaps most importantly, both the experimental and parametric analyses converge on the finding that model reliability deteriorates in the presence of shear reinforcement, where the combined action of fibers and transverse steel is not adequately addressed in most current formulations.
Overall, while the parametric study offered broader statistical confidence and consistency due to its controlled conditions, the outcome of the analyses reinforced the need for more targeted experimental research and model refinement to better capture the true behavior of PFRC elements, especially those incorporating both synthetic fibers and conventional reinforcement.
7. Conclusions and Recommendations for Future Work
This paper investigated the shear response of concrete elements reinforced by a combination of traditional steel reinforcement and synthetic fibers, focusing on assessing the reliability of available shear design methodology amongst existing code approaches. The experimental evidence currently available in the literature was first analyzed, but the limited amount of experimental data prevented the identification/development of design recommendations. Hence, an extensive parametric study was conducted in VecTor2, leveraging a recently developed numerical modeling approach for simulating the response of PFRC elements in shear. The parametric study extended the experimental results and explored the shear strength of PFRC panels with over 250 combinations of fiber contents, transverse reinforcement ratios, and concrete compressive strengths. Parameters of interest that were not tested in previous experimental programs were considered.
The ability of existing design code provisions to predict the shear strength of PFRC structural elements was then evaluated using the experimental data available, augmented by the numerical results from the parametric study.
The following key conclusions can be drawn:
- The Fib Model Code emerged as the most reliable overall, showing the best balance between prediction accuracy and low variability in both the experimental and parametric datasets. Its formulation appears to generalize better across different geometries, strengths, and fiber contents.
- The AASHTO model performed reasonably well in both the parametric study and the experimental cases, but displayed some criticalities, especially for beams with shear reinforcement. This highlights potential calibration issues under combined fiber–steel action.
- ACI and CSA models were consistently conservative, with underestimations that became more pronounced at higher concrete strengths. While this may offer safety margins, it could lead to uneconomical designs in PFRC applications.
- The EC2 models with fixed cotangent angles, exhibited the highest variability and least reliability, especially in the presence of fibers. These models may not be suitable for FRC without significant modifications.
- The influence of concrete compressive strength was found to be significant. Many models underperformed at higher strengths (≥70 MPa), underscoring the need for strength-sensitive formulations.
While the parametric analysis offered broader statistical insight, the conclusions drawn from experimental data remain constrained by the limited number and heterogeneity of available tests. As such, the results of this study should be interpreted as indicative rather than definitive.
Future research should focus on expanding experimental datasets, particularly for PFRC elements with shear reinforcement, to better characterize fiber–steel interactions and validate existing models under realistic conditions. There also remains a need for the development of unified models that explicitly capture the synergistic effects of fibers and conventional reinforcement, while incorporating the influence of concrete strength and fiber distribution. Such models could be calibrated using data obtained from advanced experimental techniques, including 3D CT scanning.
Author Contributions
Conceptualization, P.M.C. and T.T.; methodology, P.M.C. and T.T.; software, B.F.; validation, B.F.; formal analysis, B.F.; investigation, B.F.; resources, P.M.C. and T.T.; data curation, B.F.; writing—original draft preparation, P.M.C. and B.F.; writing—review and editing, P.M.C. and T.T.; visualization, B.F.; supervision, P.M.C. and T.T.; project administration, P.M.C. and T.T.; funding acquisition, P.M.C. and T.T. All authors have read and agreed to the published version of the manuscript.
Funding
This research was funded by the Accelerated Bridge Construction University Transportation Center Florida International University grant number 69A3551747121.
Data Availability Statement
The raw data supporting the conclusions of this article will be made available by the authors on request.
Acknowledgments
The authors would like to extend special appreciation to the ABC-UTC and the U.S. Department of Transportation Office of the Assistant Secretary for Research and Technology for funding this project.
Conflicts of Interest
The authors declare no conflict of interest.
Appendix A
Table A1.
PFRC specimen assembled database.
Table A1.
PFRC specimen assembled database.
| Specimen ID | AR | ||||||||
| (mm) | (%) | (%) | (MPa) | (%) | (mm) | (MPa) | |||
| B3 | 120 | 3.0 | 2.62 | 0.28 | 37.8 | 0.50 | 50 | 85 | 3.78 |
| B6 | 120 | 3.0 | 2.62 | - | 43.9 | 0.50 | 50 | 85 | 2.39 |
| B7 | 120 | 3.0 | 2.62 | - | 44.2 | 1.00 | 50 | 85 | 3.14 |
| B8 | 120 | 3.0 | 2.62 | - | 43.1 | 1.50 | 50 | 85 | 2.89 |
| P-WV-50-0.5 | 265 | 3.0 | 1.78 | - | 41.9 | 0.50 | 50 | 63 | 1.47 |
| P-WV-50-0.75 | 265 | 3.0 | 1.78 | - | 39.0 | 0.75 | 50 | 63 | 1.79 |
| P-WV-50-1.0 | 265 | 3.0 | 1.78 | - | 37.9 | 1.00 | 50 | 63 | 1.68 |
| L1-0.50 | 400 | 3.5 | 2.15 | - | 41.9 | 0.50 | 40 | 90 | 1.72 |
| L1-0.75 | 400 | 3.5 | 2.15 | - | 41.9 | 0.75 | 40 | 90 | 1.93 |
| L2-0.50 | 330 | 3.5 | 3.18 | - | 41.9 | 0.50 | 40 | 90 | 1.75 |
| L2-0.75 | 330 | 3.5 | 3.18 | - | 41.9 | 0.75 | 40 | 90 | 1.84 |
| L2-1.0 | 330 | 3.5 | 3.18 | - | 35.6 | 1.00 | 40 | 90 | 2.00 |
| Sh2-0.50 | 330 | 2.3 | 3.18 | - | 41.9 | 0.50 | 40 | 90 | 2.09 |
| Sh2-0.75 | 330 | 2.3 | 3.18 | - | 41.9 | 0.75 | 40 | 90 | 2.23 |
| Sy4.5-1 | 270 | 1.5 | 1.16 | - | 46.3 | 0.49 | 50 | 71 | 3.55 |
| Sy4.5-2 | 270 | 2.5 | 1.16 | - | 46.3 | 0.49 | 50 | 71 | 2.03 |
| PFRC | 172 | 5.2 | 2.34 | - | 37.6 | 1.00 | 12.5 | 25 | 1.49 |
| W510PFRC | 255 | 2.5 | 1.24 | - | 26.0 | 1.45 | 40 | 53.3 | 2.24 |
| W650PFRC | 215 | 3.0 | 1.15 | - | 26.0 | 1.45 | 40 | 53.3 | 2.17 |
| W770PFRC | 255 | 2.5 | 1.23 | - | 26.0 | 1.45 | 40 | 53.3 | 2.29 |
| W890PFRC | 295 | 2.2 | 1.23 | - | 26.0 | 1.45 | 40 | 53.3 | 2.23 |
| B2.5P1.0 | 210 | 2.5 | 1.28 | - | 27.0 | 1.00 | 39 | 51 | 1.52 |
| B2.5P2.0 | 210 | 2.5 | 1.28 | - | 13.9 | 2.00 | 39 | 51 | 1.36 |
| B2.5P3.0 | 210 | 2.5 | 1.28 | - | 18.5 | 3.00 | 39 | 51 | 1.78 |
| B3.5P1.0 | 210 | 3.5 | 1.28 | - | 27.0 | 1.00 | 39 | 51 | 1.48 |
| B3.5P2.0 | 210 | 3.5 | 1.28 | - | 13.9 | 2.00 | 39 | 51 | 1.35 |
| B3.5P3.0 | 210 | 3.5 | 1.28 | - | 18.5 | 3.00 | 39 | 51 | 1.61 |
| B4.5P1.0 | 210 | 4.5 | 1.28 | - | 27.0 | 1.00 | 39 | 51 | 1.24 |
| B4.5P2.0 | 210 | 4.5 | 1.28 | - | 13.9 | 2.00 | 39 | 51 | 0.99 |
| B4.5P3.0 | 210 | 4.5 | 1.28 | - | 18.5 | 3.00 | 39 | 51 | 1.10 |
| B1V3S0 | 125 | 2.4 | 3.22 | - | 44.4 | 0.33 | 40 | 90 | 2.56 |
| B1V5S0 | 125 | 2.4 | 3.22 | - | 45.1 | 0.55 | 40 | 90 | 2.80 |
| B1V7S0 | 125 | 2.4 | 3.22 | - | 45.9 | 0.77 | 40 | 90 | 3.08 |
| OAP1 | 473 | 3.9 | 1.67 | - | 43.1 | 1.10 | 48 | 56 | 1.55 |
| OAP2 | 473 | 4.8 | 2.23 | - | 44.9 | 1.10 | 48 | 56 | 1.69 |
| OBP1 | 471 | 3.9 | 2.24 | - | 42.7 | 1.10 | 48 | 56 | 1.68 |
| OBP2 | 469 | 4.9 | 2.25 | - | 42.0 | 1.10 | 48 | 56 | 1.38 |
| AP1 | 475 | 3.9 | 1.67 | 0.10 | 44.0 | 1.10 | 48 | 56 | 2.40 |
| AP2 | 474 | 4.8 | 2.23 | 0.10 | 44.6 | 1.10 | 48 | 56 | 2.34 |
| BP1 | 481 | 3.8 | 2.19 | 0.15 | 45.0 | 1.10 | 48 | 56 | 2.52 |
| BP2 | 475 | 4.8 | 2.22 | 0.15 | 44.2 | 1.10 | 48 | 56 | 2.24 |
| HSC-0.75%S1-15M-0 | 201 | 3.7 | 1.41 | - | 71.4 | 0.75 | 50 | 74 | 2.23 |
| HSC-0.75%S1-15M-S | 201 | 3.7 | 1.41 | 0.50 | 57.0 | 0.75 | 50 | 74 | 2.06 |
| HSC-0.75%S1-20M-0 | 199 | 3.7 | 2.53 | - | 78.3 | 0.75 | 50 | 74 | 3.42 |
| HSC-0.75%S1-20M-S | 199 | 3.7 | 2.53 | 0.50 | 89.2 | 0.75 | 50 | 74 | 3.14 |
| HSC-0.75%S1-No.5(HS)-S | 199 | 3.7 | 1.60 | - | 91.6 | 0.75 | 50 | 74 | 4.28 |
| P2 | 225 | 1.7 | 1.19 | - | 45.3 | 0.22 | 54 | 68 | 2.19 |
| P4 | 225 | 1.7 | 1.19 | - | 40.8 | 0.44 | 54 | 68 | 1.71 |
| P8 | 225 | 1.7 | 1.19 | - | 37.7 | 0.88 | 54 | 68 | 2.07 |
| RC 2.5 | 225 | 3.1 | 0.47 | - | 56.3 | 0.27 | 48 | 56 | 1.81 |
| RC 4.0 | 225 | 3.1 | 0.47 | - | 55.3 | 0.44 | 48 | 56 | 1.84 |
| RC 5.5 | 225 | 3.1 | 0.47 | - | 54.8 | 0.60 | 48 | 56 | 1.96 |
References
- Karthik, M.P.; Maruthachalam, D. Experimental study on shear behaviour of hybrid Fibre Reinforced Concrete beams. KSCE J. Civ. Eng. 2015, 19, 259–264. [Google Scholar] [CrossRef]
- AbdelAleem, B.H.; Ismail, M.K.; Hassan, A.A. The combined effect of crumb rubber and synthetic fibers on impact resistance of self-consolidating concrete. Constr. Build. Mater. 2018, 162, 816–829. [Google Scholar] [CrossRef]
- Joshi, S.S.; Thammishetti, N.; Prakash, S.S. Efficiency of steel and macro-synthetic structural fibers on the flexure-shear behaviour of prestressed concrete beams. Eng. Struct. 2018, 171, 47–55. [Google Scholar] [CrossRef]
- Hossain, F.Z.; Pal, A.; Ahmed, K.S.; Bediwy, A.; Alam, M.S. Shear behavior of polypropylene fiber-reinforced concrete beams containing recycled aggregate and crumb rubber. J. Clean. Prod. 2023, 412, 137370. [Google Scholar] [CrossRef]
- Swamy, R.N.; Bahia, H.M. The Effectiveness of Steel Fibers as Shear Reinforcement; Concrete International: Farmington Hills, MI, USA, 1985. [Google Scholar]
- Amin, A.; Foster, S.J. Shear strength of steel fibre reinforced concrete beams with stirrups. Eng. Struct. 2016, 111, 323–332. [Google Scholar] [CrossRef]
- Cucchiara, C.; La Mendola, L.; Papia, M. Effectiveness of stirrups and steel fibres as shear reinforcement. Cem. Concr. Compos. 2004, 26, 777–786. [Google Scholar] [CrossRef]
- Aoude, H.; Belghiti, M.; Cook, W.D.; Mitchell, D. Response of steel fiber-reinforced concrete beams with and without stirrups. ACI Struct. J. 2012, 109, 359–368. [Google Scholar] [CrossRef]
- Farag, B.F.; Thonstad, T.; Calvi, P.M. Numerical modeling of distributed macro-synthetic fiber and deformed bar reinforcement to resist shear. Buildings 2024, 14, 3247. [Google Scholar] [CrossRef]
- Al-Rousan, R.; Alnemrawi, B.R. NLFEA of the Behavior of Polypropylene-Fiber-Reinforced Concrete Slabs with Square Opening. Buildings 2024, 14, 480. [Google Scholar] [CrossRef]
- Huang, Y.; Yao, G. Shear Strength of Ultra-High-Performance Concrete Beams without Stirrups—A Review Based on a Database. Buildings 2024, 14, 1212. [Google Scholar] [CrossRef]
- Li, Z.; Dong, H.; Zhao, X.; Wang, K.; Gao, X. Utilisation of Bayer red mud for high-performance geopolymer: Competitive roles of different activators. Case Stud. Constr. Mater. 2025, 23, e05047. [Google Scholar] [CrossRef]
- Farag, B.F. Predicting The Shear Strength of Macro-Synthetic Fiber-Reinforced Concrete. Master’s Thesis, University of Washington, Washington, DC, USA, 2024. Available online: https://hdl.handle.net/1773/52452 (accessed on 15 June 2025).
- Wong, P.S.; Vecchio, F.J.; Trommels, H. Vector2 & Formworks User’s Manual, 2nd ed.; University of Toronto: Toronto, ON, Canada, 2013. [Google Scholar]
- Galik, W.D.; Calvi, P.M. Shear strength of steel-concrete composite “NPS® Basic” truss beams. Eng. Struct. 2023, 290, 116362. [Google Scholar] [CrossRef]
- Ismail, M.K.; AbdelAleem, B.H.; Hassan, A.A.; El-Dakhakhni, W. Shear behavior of lightweight engineered cementitious composite RC beams. Structures 2025, 73, 108403. [Google Scholar] [CrossRef]
- Greenough, T.; Nehdi, M. Shear behavior of fiber-reinforced self-consolidating concrete slender beams. ACI Mater. J. 2008, 105, 468–477. [Google Scholar]
- Altoubat, S.; Yazdanbakhsh, A.; Rieder, K.-A. Shear behavior of macro-synthetic fiber-reinforced concrete beams without stirrups. ACI Mater. J. 2009, 106, 381–389. [Google Scholar] [CrossRef]
- Parmentier, B.; Cauberg, N.; Vandewalle, L. Shear resistance of macro-synthetic and steel fibre reinforced concrete beams without stirrups. In Proceedings of the 8th RILEM International Symposium on Fibre Reinforced Concrete, Guimarães, Portugal, 19–21 September 2012; pp. 19–21. [Google Scholar]
- Conforti, A.; Minelli, F.; Tinini, A.; Plizzari, G.A. Influence of polypropylene fibre reinforcement and width-to-effective depth ratio in wide-shallow beams. Eng. Struct. 2015, 88, 12–21. [Google Scholar] [CrossRef]
- Sahoo, D.R.; Maran, K.; Kumar, A. Effect of steel and synthetic fibers on shear strength of RC beams without shear stirrups. Constr. Build. Mater. 2015, 83, 150–155. [Google Scholar] [CrossRef]
- Ababneh, A.; Al-Rousan, R.; Alhassan, M.; Alqadami, M. Influence of synthetic fibers on the shear behavior of lightweight concrete beams. Adv. Struct. Eng. 2017, 20, 1671–1683. [Google Scholar] [CrossRef]
- Arslan, G.; Keskin, R.S.O.; Ozturk, M. Shear behaviour of polypropylene fibre-reinforced-concrete beams without stirrups. Proc. Inst. Civ. Eng. Struct. Build. 2017, 170, 190–198. [Google Scholar] [CrossRef]
- Murad, Y.; Abdel-Jabbar, H. Shear behavior of RC beams prepared with basalt and polypropylene fibers. Case Stud. Constr. Mater. 2022, 16, e00835. [Google Scholar] [CrossRef]
- Koura, M.M.; Tahwia, A.M.; Matthana, M.H. Influence of macro-synthetic fibers on the flexural behavior of high strength concrete beams reinforced with GFRP bars. MEJ. Mansoura Eng. J. 2024, 49, 4. [Google Scholar] [CrossRef]
- Majdzadeh, F.; Soleimani, S.M.; Banthia, N. Shear strength of reinforced concrete beams with a fiber concrete matrix. Can. J. Civ. Eng. 2006, 33, 726–734. [Google Scholar] [CrossRef]
- Navas, F.O.; Navarro-Gregori, J.; Herdocia, G.L.; Serna, P.; Cuenca, E. An experimental study on the shear behaviour of reinforced concrete beams with macro-synthetic fibres. Constr. Build. Mater. 2018, 169, 888–899. [Google Scholar] [CrossRef]
- Bastami, R. Structural Performance of High-Strength Reinforced Concrete Beams Built with Synthetic Fibers. Doctoral Dissertation, University of Ottawa, Ottawa, ON, Canada, 2019. [Google Scholar]
- Carnovale, D.J. Behaviour and Analysis of Steel and Macro-Synthetic Fibre Reinforced Concrete Subjected to Reversed Cyclic Loading: A Pilot Investigation. Master’s Thesis, University of Toronto, Toronto, ON, Canada, 2013. [Google Scholar]
- Carnovale, D.; Vecchio, F.J. Effect of fiber material and loading history on shear behavior of fiber-reinforced concrete. ACI Struct. J. 2014, 111, 1235–1244. [Google Scholar] [CrossRef]
- AASHTO. AASHTO LRFD Bridge Design Specifications, 4th ed.; American Association of State Highway and Transportation Officials: Washington, DC, USA, 2020. [Google Scholar]
- ACI Committee 318. Building Code Requirements for Structural Concrete (ACI 318-19) and Commentary; American Concrete Institute: Farmington Hills, MI, USA, 2019. [Google Scholar]
- CSA (Canadian Standards Association). Design of Concrete Structures (CSA A23.3); CSA: Mississauga, ON, Canada, 2019. [Google Scholar]
- FIB (Fédération Internationale du Béton). Model Code for Concrete Structures 2010; FIB: Lausanne, Switzerland, 2010. [Google Scholar]
- European Committee for Standardization (CEN). EN 1992-1-1:2013/A1:2015–Eurocode 2: Design of Concrete Structures–Part 1-1: General Rules and Rules for Buildings; CEN: Brussels, Belgium, 2015. [Google Scholar]
- Vecchio, F.J.; Collins, M.P. The modified compression-field theory for reinforced concrete elements subjected to shear. J. Am. Concr. Inst. J. 1986, 83, 219–231. [Google Scholar] [CrossRef]
- Bentz, E.C.; Vecchio, F.J.; Collins, M.P. Simplified modified compression field theory for calculating shear strength of reinforced concrete elements. ACI Struct. J. 2006, 103, 614–624. [Google Scholar] [CrossRef] [PubMed]
- Gaston, J.P. Shear Behavior of Macro-Synthetic Fiber-Reinforced Concrete Panels. Master’s Thesis, University of Washington, Seattle, WA, USA, 2023. [Google Scholar]
- Zhang, H.; Calvi, P.M.; Lehman, D.; Kuder, K.; Roeder, C. Response of recycled coarse aggregate concrete subjected to pure shear. J. Struct. Eng. 2020, 146, 04020059. [Google Scholar] [CrossRef]
- Zhang, Z.; Gu, G.X. Finite-element-based deep-learning model for deformation behavior of digital materials. Adv. Theory Simul. 2020, 3, 2000031. [Google Scholar] [CrossRef]
- Vecchio, F.J. Disturbed stress field model for reinforced concrete: Formulation. J. Struct. Eng. 2000, 126, 1070–1077. [Google Scholar] [CrossRef]
- Susetyo, J.; Gauvreau, P.; Vecchio, F.J. Steel Fiber-Reinforced Concrete Panels in Shear: Analysis and Modeling. ACI Struct. J. 2013, 110, 285–296. [Google Scholar] [CrossRef]
- Chasioti, S. Hybrid Steel Fibre Reinforced Concrete in Shear: From the Material to the Structural Level. Doctoral Dissertation, University of Toronto, Toronto, ON, Canada, 2017. [Google Scholar]
Disclaimer/Publisher’s Note: The statements, opinions and data contained in all publications are solely those of the individual author(s) and contributor(s) and not of MDPI and/or the editor(s). MDPI and/or the editor(s) disclaim responsibility for any injury to people or property resulting from any ideas, methods, instructions or products referred to in the content. |
© 2025 by the authors. Licensee MDPI, Basel, Switzerland. This article is an open access article distributed under the terms and conditions of the Creative Commons Attribution (CC BY) license (https://creativecommons.org/licenses/by/4.0/).