Article

Minimally Invasive Design and Energy Efficiency Evaluation of Photovoltaic–Energy Storage–Direct Current–Flexible Systems in Low-Carbon Retrofitting of Existing Buildings

1
School of New Energy Engineering, Jiangsu Vocational Institute of Architectural Technology, Xuzhou 221116, China
2
School of Electrical Engineering, China University of Mining and Technology, Xuzhou 221116, China
3
School of intelligent Manufacturing, Jiangsu Vocational Institute of Architectural Technology, Xuzhou 221116, China
*
Author to whom correspondence should be addressed.
Buildings 2025, 15(19), 3599; https://doi.org/10.3390/buildings15193599
Submission received: 10 September 2025 / Revised: 25 September 2025 / Accepted: 4 October 2025 / Published: 7 October 2025

Abstract

To overcome the challenges of conventional low-carbon retrofits for existing buildings—such as high construction volume, cost, and implementation difficulty—this study proposes a minimally invasive design and optimization method for Photovoltaic–Energy Storage–Direct Current–Flexible (PEDF) systems. The goal is to maximize energy savings and economic benefits while minimizing physical intervention. First, the minimally invasive retrofit challenge is decomposed into two coupled problems: (1) collaborative PV-ESS layout optimization and (2) flexible energy management optimization. A co-optimization framework is then developed to address them. For the layout problem, a model with multiple constraints is established to minimize retrofitting workload and maximize initial system performance. A co-evolutionary algorithm is employed to handle the synergistic effects of electrical pathways on equipment placement, efficiently obtaining an optimal solution set that satisfies the minimally invasive requirements. For the operation problem, an energy management model is developed to maximize operational economy and optimize grid interactivity. A deep reinforcement learning (DRL) agent is trained to adaptively make optimal charging/discharging decisions. Case simulations of a typical office building show that the proposed method performs robustly across various scenarios (e.g., office, commercial, and public buildings). It achieves an energy saving rate exceeding 20% and reduces operational costs by 10–15%. Moreover, it significantly improves building–grid interaction: peak demand is reduced by 33%, power fluctuations are cut by 75%, and voltage deviation remains below 5%. The DRL-based policy outperforms both rule-based strategies and the DDPG algorithm in smoothing grid power fluctuations and increasing the PV self-consumption rate.

1. Introduction

The building sector is a major contributor to global energy consumption and carbon emissions. Within this sector, the extensive stock of existing buildings represents a critical opportunity for energy-saving retrofits, which are vital for meeting carbon peak and carbon neutrality goals [1]. Photovoltaic–Energy Storage–Direct Current–Flexible (PEDF) technology has emerged as a promising integrated solution for building electrical systems. By combining photovoltaic (PV) generation, energy storage systems (ESSs), direct current (DC) distribution, and flexible load management, it can significantly enhance building energy efficiency, increase the self-consumption of renewable energy, and improve building–grid interactions [2,3].
However, applying this technology widely in existing buildings faces considerable challenges. Conventional low-carbon retrofitting approaches often involve substantial demolition and modification of structures, facades, and pipelines. This leads to prolonged construction times, high costs, and significant disruption to occupants—factors that severely limit large-scale adoption [4]. As a result, developing a “minimally invasive” retrofitting design philosophy, focused on minimal physical intervention, has become an urgent priority for enabling the green renewal of existing buildings.
Numerous studies have explored building retrofitting from various perspectives to improve performance, covering building types such as old residential complexes, historical dwellings, rural homes, educational buildings, and kindergartens, with a common emphasis on green and low-carbon retrofitting. For example, Lin et al. [5] studied green renovation pathways for older buildings using a case study in Chengdu; Kertsmik et al. [6] focused on low-emission retrofits for historical residences; Zhang et al. [7] developed a carbon-negative retrofit framework for rural houses incorporating new heating methods and digital twin-based monitoring; Ahmed et al. [8] examined integrated performance optimization in educational buildings using low-energy retrofits and user engagement; Kertsmik et al. [9] performed a multi-objective evaluation of retrofits based on cost, CO2 equivalence, and energy consumption; Liu et al. [10] analyzed emission reduction potential and cost-effectiveness of zero-carbon retrofits in a Beijing kindergarten under varying technology adoption levels. While these studies contribute valuable insights into holistic green renovation, low-carbon strategies, or single-technology applications, they do not specifically address the adaptability and core function of PEDF systems in existing building retrofits, nor do they investigate the synergistic optimization between such systems and existing building energy infrastructures.
Other research focuses on energy efficiency and sustainable development in building retrofits, often highlighting electrical system upgrades. For instance, Chiradeja et al. [11] optimized lighting, air conditioning, and other electrical systems in tandem with envelope improvements in Thai academic buildings to reduce energy use; Prieto et al. [12] identified communication and coordination barriers in nearly zero-energy building (nZEB) retrofits in Europe, underscoring the challenges of implementing electrically intensive retrofits in multi-stakeholder settings; Fahlstedt et al. [13] incorporated energy and cost into retrofit planning from a management perspective, especially concerning electrical components; Mpouzianas et al. [14] proposed an automated framework for retrofit roadmaps targeting energy efficiency, highlighting technical pathways for electrical systems. Nevertheless, these studies are generally limited to traditional efficiency upgrades (e.g., lighting and HVAC) and do not thoroughly examine novel distributed DC systems like PEDF. Moreover, they largely overlook the “minimally invasive” imperative in retrofitting existing buildings, seldom addressing how to integrate advanced electrical systems efficiently while minimizing structural impact and complexity.
A synthesis of the literature indicates that minimally invasive low-carbon retrofitting of existing buildings is inherently a multi-objective optimization problem under tight constraints. First, at the physical level, the PV and ESS layout is constrained by available roof space, installation orientation, structural load capacity, and cable routing. It requires identifying an optimal equipment configuration that maximizes energy self-sufficiency with minimal construction [15]. Second, at the operational level, limited by hardware constraints from the minimally invasive layout (e.g., non-ideal PV orientation or cable losses), the system requires a smarter and more flexible energy management strategy to fully unlock operational potential and maximize economic and efficiency gains [16]. However, current research often addresses layout and operational optimization in isolation, or depends on traditional mathematical programming and simple heuristic algorithms [17,18]. These methods are inadequate for capturing complex nonlinear couplings under minimally invasive constraints, and they fall short in solving high-dimensional continuous decision-making problems related to operational strategies.
To tackle these challenges, this paper proposes a co-optimization design method and benefit evaluation framework for PEDF systems aimed at low-carbon, minimally invasive retrofitting of existing buildings. Although DC retrofitting in existing buildings has been widely discussed, most existing solutions fall into the dilemma of being either “highly invasive” or “suboptimal in performance”: conventional DC schemes often require large-scale replacement of existing cable and pipeline systems in pursuit of theoretical optimality, resulting in high retrofit costs and extended construction periods. Although hybrid systems attempt to reduce retrofit difficulty, their inherent AC/DC/AC multi-stage conversion architecture introduces additional efficiency losses, and their operational strategies are typically decoupled from physical design, failing to fully unlock system potential. The core innovation of the proposed minimally invasive PEDF retrofit framework lies in breaking away from this conventional paradigm of “separating physical design and operational control”. It introduces a novel methodology that co-optimizes spatial layout and operational strategy. Rather than simply applying DC technology, the framework employs efficient combinatorial optimization algorithms to intelligently identify the optimal equipment and circuit layout under complex spatial and cabling constraints, maximizing the use of existing cable trays and pathways, thereby significantly reducing physical invasiveness. Furthermore, this study develops a data-driven intelligent agent for flexible energy management, enabling adaptive operational adjustments in response to dynamic environmental and load conditions. This deeply couples with and mutually reinforces the physically optimized design, forming a synergistic integration that enhances overall system performance. The core innovations and contributions are:
A co-optimization framework integrating spatial layout and operational strategy to address physical and operational constraints simultaneously.
A solution to the PV-ESS layout combinatorial optimization problem by incorporating equipment and pathway placement codes and constraints, defining optimization objectives, and designing an efficient algorithm to identify Pareto-optimal solutions under minimally invasive conditions.
The application of advanced deep reinforcement learning (DRL) to flexible operation control, training an adaptive energy management agent via a tailored reward function to maximize comprehensive benefits under varying conditions.
A quantitative multi-dimensional benefit evaluation via case simulation assessing energy, economic, and grid-interaction performance, demonstrating the effectiveness and superiority of the proposed approach.
The remainder of this paper is structured as follows: Section 2 analyzes key issues in minimally invasive PEDF retrofits. Section 3 details the co-optimization methodology, including the PV-ESS layout model and flexible energy management strategy. Section 4 presents a case study and discusses results. This research offers a novel technical pathway and decision-support tool for low-cost, high-efficiency green retrofitting of existing buildings.

2. Analysis of Key Issues in Minimally Invasive Retrofitting of PEDF Systems for Existing Buildings

Against the backdrop of China’s national strategy to achieve carbon peak and carbon neutrality, energy-efficient and low-carbon retrofitting of existing buildings has become a critical step in developing green, low-carbon cities. However, conventional retrofitting approaches are often hindered by substantial construction work, high costs, and significant operational disruption, which considerably limit their large-scale application. Given the vast stock of existing buildings and the urgency of emission reduction targets, the industry urgently requires innovative pathways that combine high energy efficiency with minimal physical and operational intervention. The concept of “minimally invasive retrofitting” has thus emerged as a promising direction, emphasizing precision design, flexible system integration, and smart control strategies to maximize energy savings and carbon emission reductions with limited structural impact. This approach not only aligns with national green development policies but also offers a feasible solution to longstanding economic and practical barriers in the sector. This section systematically examines the key challenges and optimization potential associated with applying PEDF systems in minimally invasive retrofits of existing buildings.
The PEDF system is a new energy system constructed within the building context. Its core lies in achieving efficient local consumption of renewable energy and flexible regulation of building energy use through system integration and coordinated control [19,20]. Figure 1 illustrates the basic configuration of the PEDF systems in an existing building. The system primarily consists of a PV generation unit, an electrochemical energy storage unit, bidirectional converters, a DC distribution network, and flexible loads, all managed by a top-level energy management system for unified dispatch. Its fundamental operating principle follows a “generation-grid-load-storage” synergistic interaction paradigm: PV, as the primary energy source, prioritizes supplying power to DC loads; surplus energy is stored in batteries or fed back to the grid; when PV output is insufficient, energy is discharged from storage or drawn from the grid to meet load demand. The system’s efficacy is highly dependent on the physical performance ceiling determined by the spatial layout of its units and the operational optimization level determined by the energy management strategy. Therefore, for retrofitting existing buildings, achieving the co-optimization of physical deployment and operational strategy within this paradigm is key to enhancing overall system performance.
The minimally invasive retrofitting of existing buildings is inherently a multi-objective optimization problem under strong constraints. The core challenge stems from the imperative to seek optimal system performance under the rigid premise of minimizing physical intervention into the building structure [21], function, and environment [22]. These constraints create a complex decision space:
Spatial and Structural Level: The deployment of PV modules is constrained by available roof area, load-bearing capacity, and shading from existing pipes and facilities, often preventing optimal orientation and tilt angles. Energy storage systems face dual pressures of weight, volume, and stringent safety codes, requiring their siting to precisely match the building’s limited spaces with adequate load-bearing capacity and safety conditions.
Electrical Engineering Level: The foremost challenge lies in the installation of the DC distribution network. It must maximize the use of spare capacity in existing cable trays and conduit shafts or utilize co-installation with the original AC system, strenuously avoiding large-scale chasing of walls and cutting holes in floors. This concerns not only cost but also the building’s structural safety and aesthetics.
Furthermore, the retrofit process must ensure the continuity and safety of the building’s original functions, requiring the new system to possess seamless compatibility and smooth integration capabilities with the aging electrical system [23].
These multi-dimensional constraints are interwoven and mutually restrictive, significantly compressing the feasible solution space. Consequently, designs based on traditional experience or conventional optimization methods struggle to approach global optimum, necessitating the adoption of more advanced optimization algorithms.
To overcome these challenges, this paper adopts the systems engineering principles of decomposition and coordination, decoupling the complex minimally invasive retrofit problem into two distinct yet tightly coupled sub-problems:
(1)
The “PV-ESS Layout Optimization” Problem falls under static hardware decision-making. It aims to make co-optimization decisions regarding the installation location and string configuration of PV arrays, the capacity and location of the energy storage system, and the routing of critical DC pathways, all while satisfying the aforementioned minimally invasive constraints. The objectives are multidimensional: minimizing initial investment and construction costs, maximizing expected PV power generation revenue, and minimizing line losses caused by non-ideal layouts. The solution to this problem outputs a feasible physical system design, setting the theoretical upper limit for its operational performance.
(2)
The “Flexible Energy Management Strategy Optimization” Problem falls under dynamic software decision-making. This problem involves determining the optimal year-round hourly charging/discharging strategy for the energy storage system and the interactive power exchange with the grid, within the physical boundaries defined by a given hardware layout. The objectives are to minimize whole-life-cycle operating costs, enhance the PV self-consumption rate, and achieve peak shaving and valley filling through smoothed control of the grid interface power.
These two sub-problems exhibit profound bidirectional coupling: the quality of the hardware layout directly determines the performance ceiling achievable by the operational strategy, while the intelligence of the operational strategy determines the actual economic return on the hardware investment. Therefore, any independent optimization that separates the two is inherently suboptimal. This paper innovatively constructs a “Layout-Operation” co-optimization framework. For each candidate layout solution, the optimal operational strategy is trained to accurately assess its whole-life-cycle benefits. The globally optimal minimally invasive retrofit solution is ultimately determined through comprehensive comparison and selection.

3. Formulation of the Co-Optimization Methodology for Minimally Invasive Retrofitting

3.1. PV-ESS Layout Optimization Model

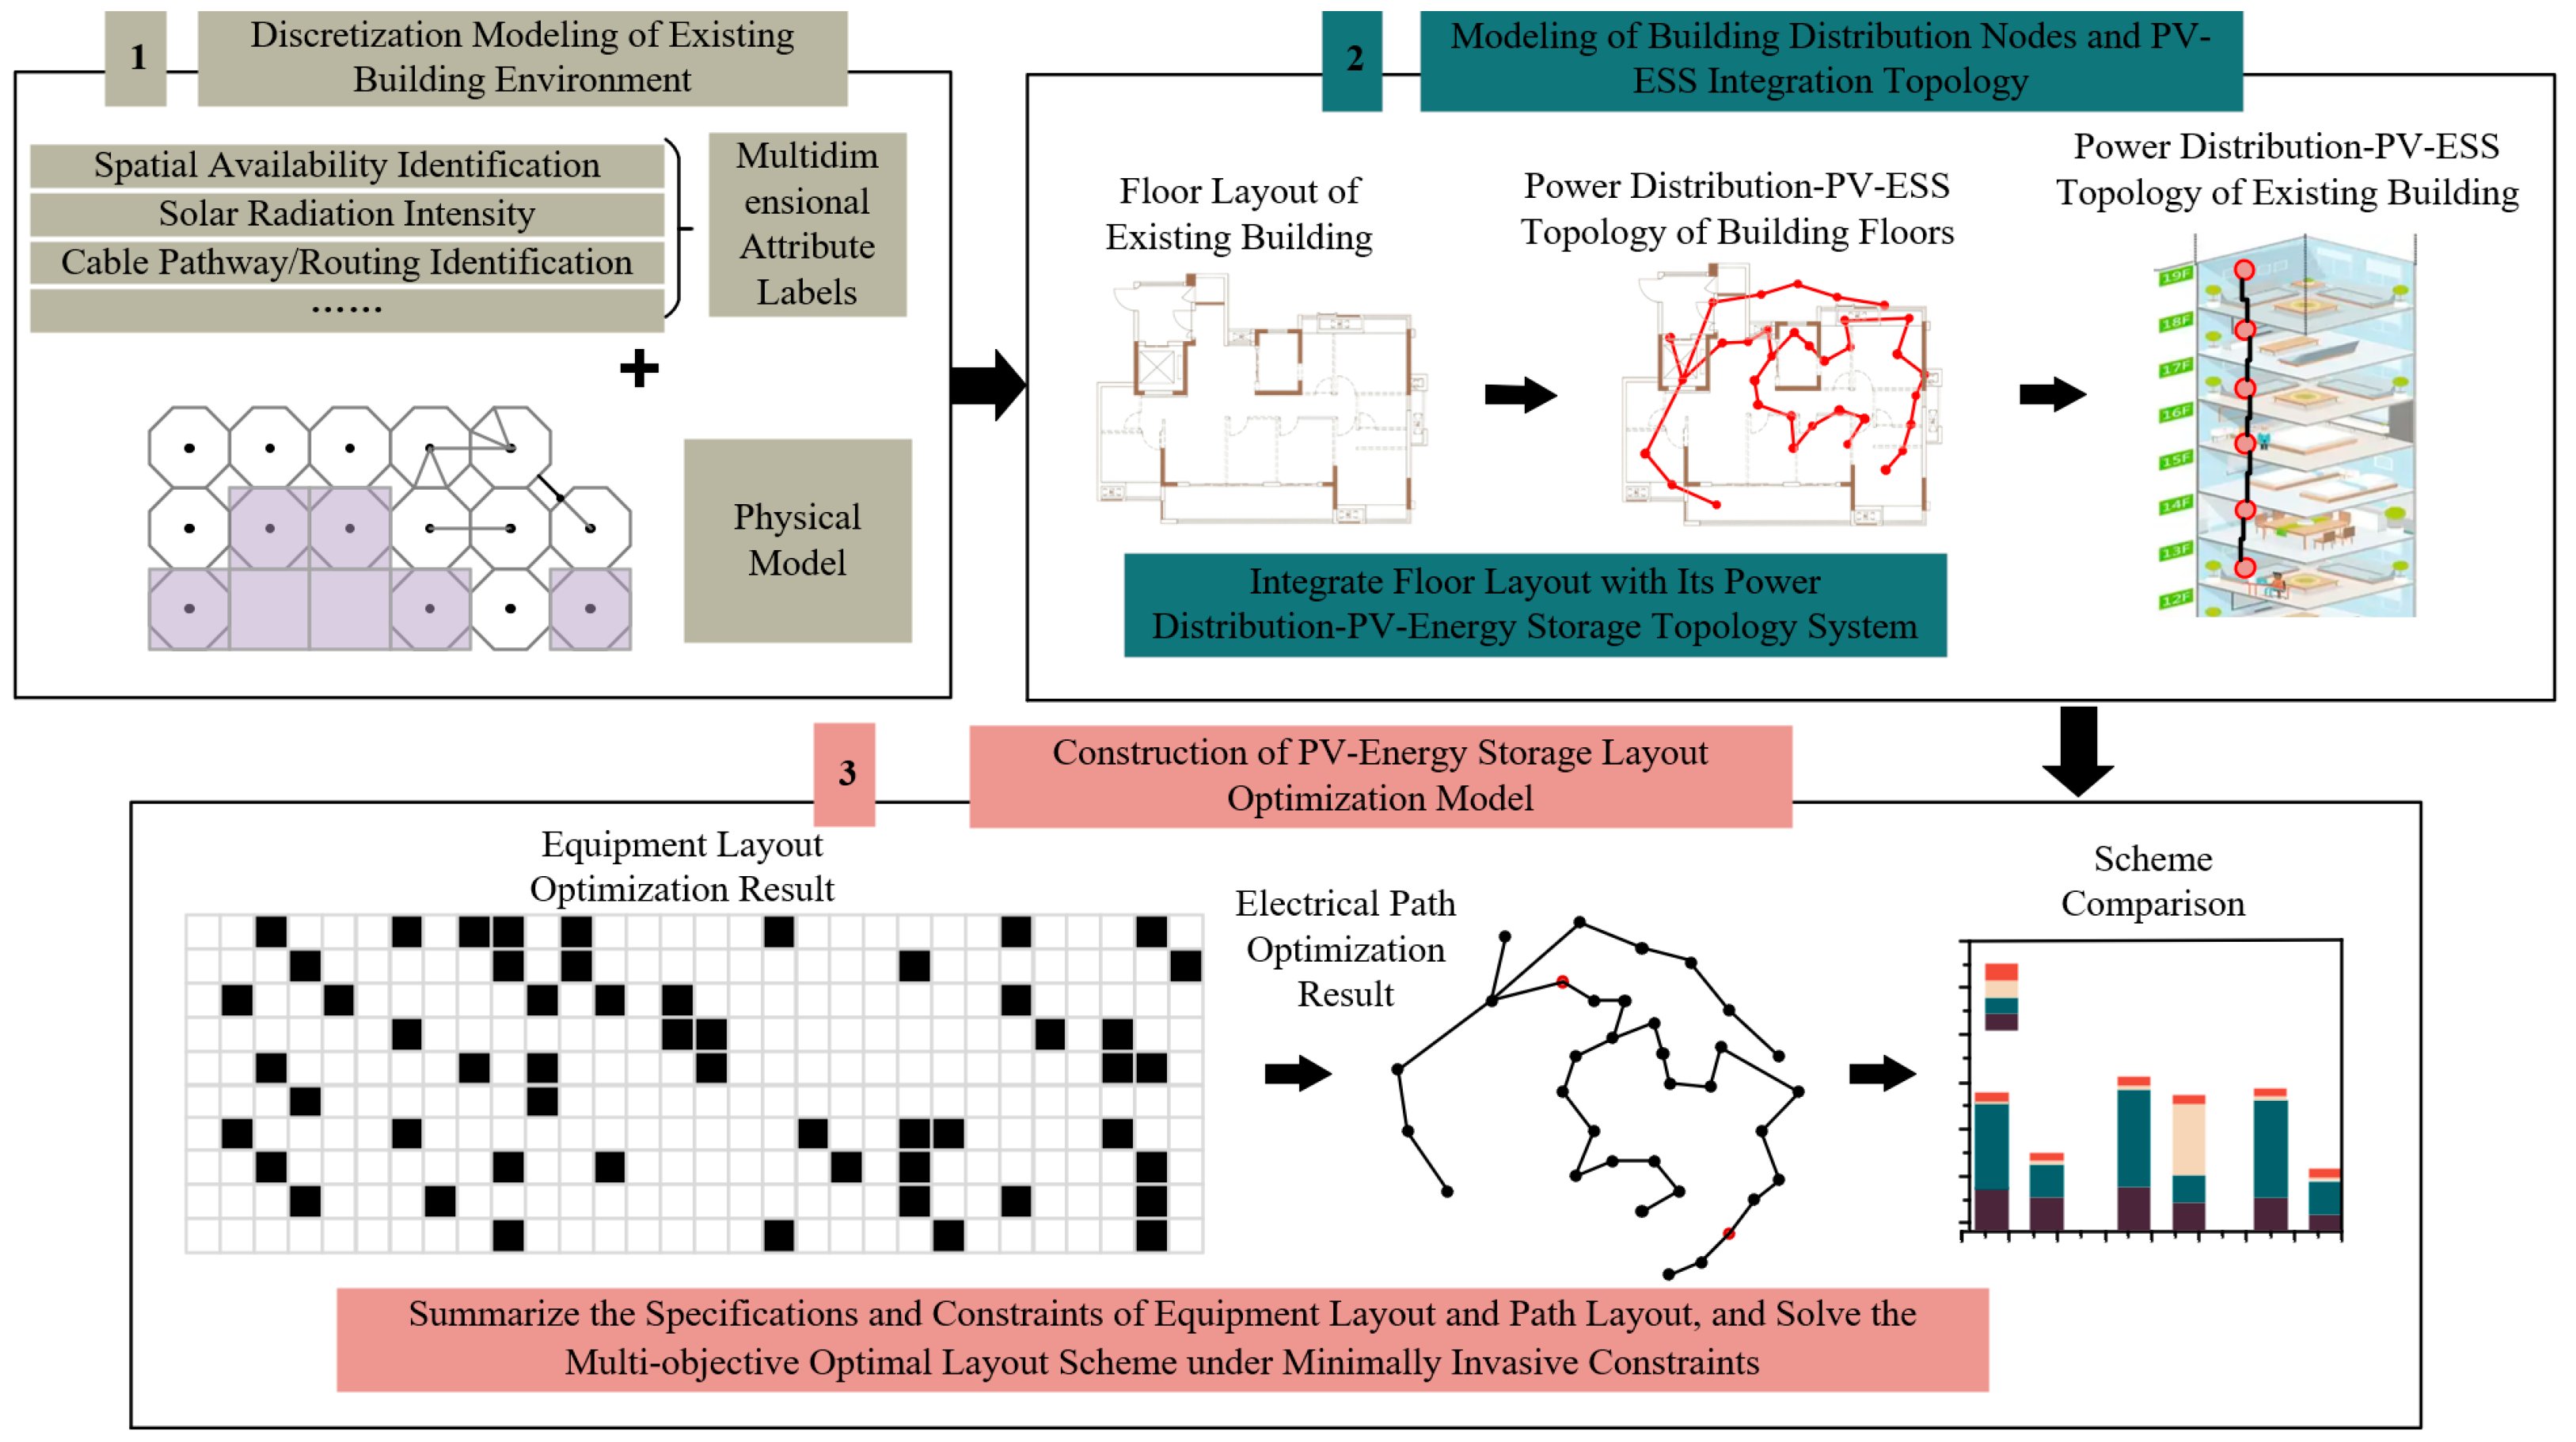
Figure 2 presents the block diagram illustrating the construction principle of the PV-ESS layout optimization model proposed in this study. As shown, to achieve precise mapping from the building’s physical space to a digital optimization model, this paper first employs a grid method [24,25] to discretize and model the complex environment of the existing building. This is a crucial prerequisite for transforming the continuous optimization problem into a combinatorial one. The principle of this method involves dividing all available installation surfaces of the building into a uniform array of two-dimensional or three-dimensional grid cells based on their geometry. Each cell is treated as the smallest, indivisible positional decision unit in space. Each grid cell is assigned multi-dimensional attribute tags, including spatial availability flags, solar irradiance intensity, theoretical distance to key electrical nodes, and identifiers for predefined wiring channels.
Building upon this foundation, all equipment to be laid out and their connection paths are encoded via the sequence of grid coordinates they occupy: a PV string is defined by the sequence of grid coordinates corresponding to the center points of all its constituent modules; large-volume equipment like battery cabinets are defined by the bounding rectangle of the multiple contiguous grid cells they occupy; electrical pathways are represented by the sequence of connecting lines between the centers of the continuous grid cells along their installation trajectory. Assuming the three-dimensional coordinates of the centroid of the u-th device are represented by (au,bu,cu), the total number of devices is v, and the three-dimensional coordinates of the start and end points of an electrical pathway are represented by (at,bt,ct) and (ar,br,cr), respectively, then the expressions for the device center locations and electrical pathway coordinates in 3D space are formulated accordingly:
r = ((a1,b1,c1)…(au,bu,cu)…(av,bv,cv))
o = ((at,bt,ct)(al,bl,cl)…(ar,br,cr))
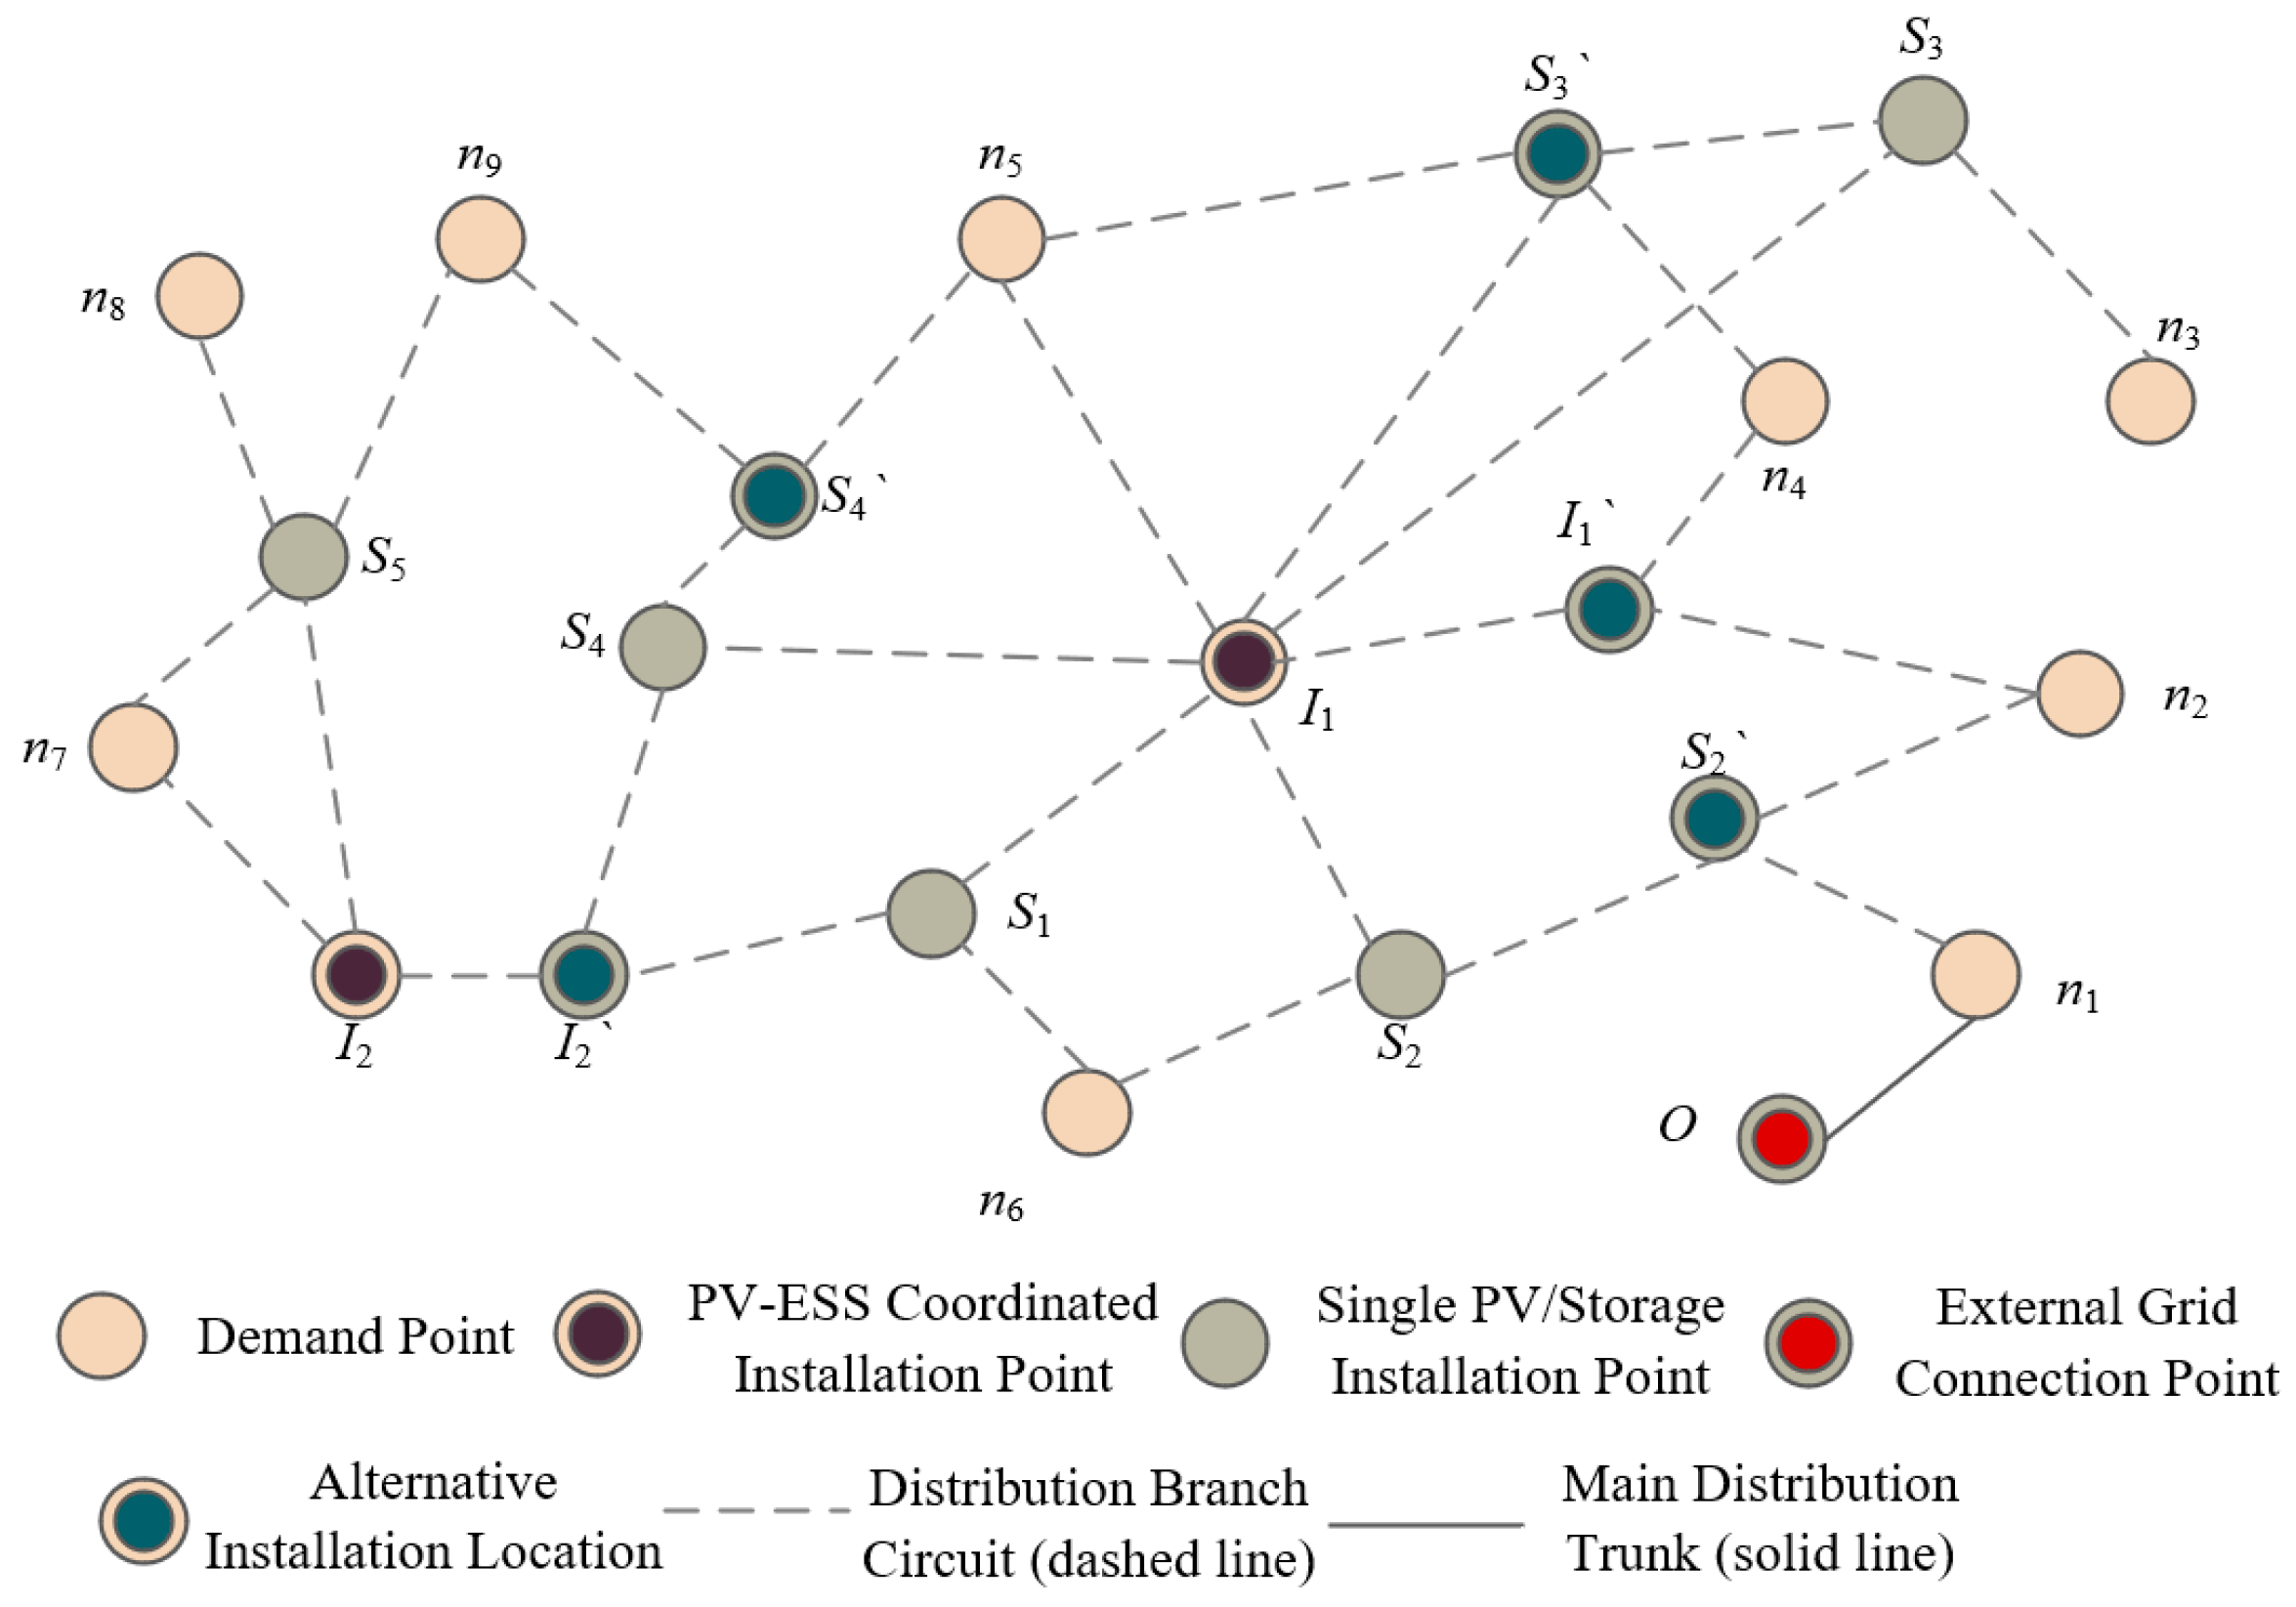
Furthermore, this paper models the existing building’s distribution nodes and the PV-ESS integration topology, adhering to the principle of “spatial constraints driving electrical topology simplification”. The process is as follows: First, extract the base floor plan of the existing building, identifying functional zones, existing distribution nodes, and areas suitable for PV-ESS installation. Second, construct an initial “distribution-PV-ESS topology” based on the existing distribution pathways within the floor space, marking main trunks and branch circuits. Finally, for the distribution pathways from power consumption points to PV-ESS points, and considering both spatial minimally invasive constraints and electrical power constraints, distinguish between three scenarios: “common bottleneck segments, common non-bottleneck segments, and segments with no commonality”. Through node splitting and path adaptation, a simplified “spatial-electrical coupled” node network is ultimately formed. This lays the topological foundation for the precise layout of PV-ESS equipment and energy efficiency synergy, ensuring the retrofitting process “minimizes damage to the building structure and avoids major alterations to main circuits”. Figure 3 illustrates the strategy adopted in this study for simplifying the node network in the minimally invasive design of the PEDF systems. Figure 4 provides an example of the node network architecture for the PEDF systems after node splitting.
The core of minimally invasive retrofitting lies in pursuing optimal comprehensive system performance under the premise of minimized physical intervention. Therefore, the objective functions for the equipment layout optimization in this model are defined as follows:
(1)
Minimization of Total System Investment Cost: This is the most critical economic indicator, integrating initial investment and construction costs. Its function is expressed as:
Min f1 = Ccap = (Cpv × Npv) + (Cess × Pess_rated) + (Cinv × Ninv) + (Ccable × Cinstall)
Here, Cpv is the unit power cost of PV modules; Npv is the total number of PV modules; Cess is the unit power cost of the energy storage system; Pess_rated is the rated power of the energy storage system; Cinv is the unit power cost of converters; Ninv is the number of converters; Ccable is the total cost of all DC and AC cables, connectors, and auxiliary materials; and Cinstall is the total construction labor and management cost incurred for equipment installation, structural reinforcement, and system commissioning. Ccable and Cinstall are strongly correlated with pathway length, number of bends, and construction difficulty, directly reflecting the “minimally invasive” characteristic. This objective aims to identify the optimal solution for the whole life-cycle cost.
(2)
Maximization of Expected Power Generation Revenue from the PV System: This objective is directly related to the system’s long-term revenue generation capability. Under minimally invasive constraints, PV installation sites often cannot achieve optimal orientation and tilt angles; thus, energy capture must be maximized at the given locations. The function is expressed as:
Max f2 = Rpv = ∑(OUTpv-i × EP)
where Outpv-i is the total power generation of the i-th PV string under specific location, orientation, tilt angle, and shading conditions during the simulation period, and EP is the electricity price. This objective drives the algorithm to find relatively optimal power generation sites within the limited and non-ideal installation space.
(3)
Minimization of Total Equivalent Line Losses on the DC Side: This objective aims to improve overall system energy efficiency. Non-ideal layouts can lead to longer cables and the use of thinner gauges, thereby increasing losses. The function is expressed as:
Min f3 = Ploss = ∑(I2 × R × t)
where I is the RMS current flowing through a cable segment, R is the DC resistance of that cable segment, and t is the duration of current I. This objective is tightly coupled with the geometric placement of equipment and the routing of pathways.
(4)
Maximization of Load Distribution Uniformity of Equipment Group: This objective is a rigid constraint to ensure structural safety. The function is expressed as:
Max f4 = Pload = |CGxCOx|/Lx + |CGyCOy|/Ly
where CGx and CGy are the coordinates of the center of gravity of all equipment masses in the building’s planar coordinate system CG = Σ(mi × xi)/Σmi, where mi is the mass of the i-th device). COx and COy are the coordinates of the geometric centroid of the available equipment installation area. Lx and Ly are the total lengths of the available installation area in the X and Y directions. A value closer to 0 indicates more uniform load distribution and less impact on the structure.
(5)
Maximization of Maintenance Accessibility Index: This objective concerns the convenience and safety of long-term system operation. The function is expressed as:
Max f5 = Aops = ∑(Wk × Score(ABk))
The algorithm will evaluate an accessibility score Score(ABk) for each device, considering factors such as the distance of reserved operational space in front, the width of side maintenance access, and an importance weight Wk for the device. This objective encourages layouts that provide more spacious and easily accessible installation environments for critical equipment.
(6)
Maximization of Minimally Invasive Construction Index: This objective is the concentrated embodiment of the “minimally invasive” concept and is a comprehensive indicator. The function is expressed as:
Max f6 = Icons = − [α × NCL + β × NNP + γ × NB]
It employs penalty terms to minimize the length of newly installed conduits/trays (NCL), the number of new wall/floor penetrations (NNP), and the number of 90-degree bends (NB). This guides the algorithm to prioritize layout and pathway solutions that maximize the utilization of existing cable trays, conduit shafts, and channels. The coefficients α, β, and γ represent the relative cost or invasiveness weight of different construction activities.
Integrating building electrical codes and the characteristics of minimally invasive construction, the objective functions for the electrical pathway optimization in this model are defined as follows:
(1)
Minimization of Total Equivalent Pathway Cost: This objective is the core economic consideration, extending beyond mere cable length minimization. Its function is expressed as:
Min d1 = Cpath = ∑(Ccabletype × Lseg) + ∑(Cpen × Npen) + ∑(Cbend × Nbend) + (Clabour × Tinstall)
where Ccabletype is the unit price of the cable type determined by its current-carrying capacity, Lseg is the segment length, Cpen and Cbend represent the comprehensive construction cost for a single penetration (wall/floor) and bend, respectively, N is their quantity, and Tinstall is the estimated installation man-hours. This objective directly quantifies the total investment of different routing schemes, driving the algorithm to prioritize low-cost pathway solutions.
(2)
Maximization of Pathway Orthogonality and Utilization of Existing Channels: This objective is a key technical indicator for achieving “minimally invasive” construction. The function is expressed as:
Max d2 = Uexi = ∑(Lseg_in/Lseg_total) × Wchannel − ∑(|sin(ρseg)| × Lseg_new)
where Lseg_in is the length of the pathway routed within existing building cable trays, conduit shafts, or raceways; Lseg_total is the total pathway length; Wchannel is a “quality” weight for the existing channel; ρseg is the angle between a newly installed pathway segment and the building’s primary axis; and Lse_new is the length of the newly installed conduit. The first term calculates the proportion of the pathway utilizing existing trays or shafts. The second term penalizes the deviation of newly installed pathways from the building’s primary axes. Maximizing this objective means minimizing new, irregular damage to the building structure.
(3)
Minimization of System Voltage Drop and Line Losses: This objective concerns the final operational energy efficiency level of the system. Assuming ΔVpath-i is the steady-state voltage drop for the i-th critical electrical circuit, the function is expressed as:
Min d3 = ΔVmax = max(ΔVpath-i) for each critical path
Compared to total losses, the maximum voltage drop on critical pathways is a more stringent constraint indicator, as it directly affects whether the operating voltage for remote equipment remains within the allowable range. The algorithm must calculate the voltage drop along the most critical electrical circuit—from “source” (PV, grid) to “load” (critical loads, storage)—and seek to minimize its maximum value.
(4)
Maximization of Isolation of High-Power-Density Pathways: This objective originates from the “energy zoning function” and focuses on safety and electromagnetic compatibility (EMC). The function is expressed as:
Max d4 = SHP = ∑(min(DIS))
where DIS is the minimum spatial straight-line distance between a high-power pathway and sensitive elements such as low-voltage (LV) cable trays, conference rooms, or offices. The min( ) function selects the smallest distance among all sensitive elements, aiming to optimize the worst-case scenario. The algorithm will identify all high-power DC pathways and optimize their layout to maximize the minimum distance from low-voltage wiring, communication lines, and frequently occupied areas, thereby reducing electromagnetic interference (EMI) risks and potential safety hazards.
(5)
Minimization of Comprehensive Minimally Invasive Penalty Function: This function is a mathematical expression integrating all rigid minimally invasive constraints. A value of 0 indicates full compliance with all constraints, while a positive value represents the degree of constraint violation:
Min d5 = Ptotal = Pstr + Psafety + Pcode
Pstr is the penalty score for pathway planning that traverses prohibited zones. If this occurs, this penalty should be set to a very large value, causing the solution to be directly rejected. Psafety is the penalty score for pathway spacing from hazards being less than the code-specified minimum. The penalty value increases sharply with the degree of violation. Pcode is the penalty score for violations of general electrical design codes.
By performing a weighted summation of the aforementioned sub-objective functions, the overall objective function for the system equipment and pathway optimization problem is obtained. The constraints for the PV-ESS layout optimization problem are summarized into the following aspects:
Spatial Constraints: No equipment can be placed on “unavailable” grid cells; minimum safe clearances must be maintained between equipment and between equipment and walls [26].
Structural Constraints: The total weight of equipment must not exceed the allowable load capacity of the floor slab in that area; heavy equipment like energy storage systems must be placed in structurally designated load-bearing zones [27].
Electrical Code Constraints: The installation of all electrical pathways must comply with safety regulations [28]; DC voltage drop must remain within permissible limits.
Geometric Constraints: PV strings must be installed within contiguous and integral available areas; equipment shape must match the installation space profile.
Structural Integrity Constraints: Pathways are strictly prohibited from penetrating the building’s core load-bearing structures unless utilizing pre-existing or pre-designed penetrations.
Safety Clearance Constraints: Pathways must maintain absolute minimum safe distances from combustibles, gas pipes, water pipes, etc., as explicitly defined by national electrical codes [29].
Voltage Drop Constraint: The voltage drop in any critical circuit must not exceed the system’s allowable maximum. This is a mandatory electrical performance constraint [30].
Capacity Constraint: Within any single conduit shaft or cable tray, the total cross-sectional area of all cables must not exceed the legally mandated fill ratio of its internal cross-sectional area.
This multi-objective optimization model will co-optimize the multiple objective functions within the feasible domain defined by the aforementioned constraints. It ultimately yields a set of layout solutions that achieve an optimal balance among cost, minimal invasiveness, safety, and performance, thereby providing decision-makers with a range of practical, minimally invasive layout alternatives spanning from “cost-optimal” to “performance-optimal” preferences.
Addressing the complexity, high-dimensionality, and non-linear characteristics of the aforementioned model, this paper designs an improved Artificial Bee Colony–Genetic Algorithm (I-ABC-GA) that integrates the global exploration capability of the Artificial Bee Colony (ABC) algorithm with the local exploitation capability of the Genetic Algorithm (GA). The core design principle of this algorithm is to efficiently and robustly search for and approximate the Pareto optimal frontier of the problem, thereby providing decision-makers with a set of candidate solutions achieving the best compromises among multiple competing objectives.
During the algorithm initialization phase, an initial bee colony population of size SN is randomly generated within the feasible solution space satisfying all rigid minimally invasive constraints. Each individual represents a complete layout scheme encoded by grids, and its initial multi-objective function values are calculated. In the employed bee phase, each employed bee performs a stochastic neighborhood search around the honey source associated with its current solution (e.g., slightly adjusting the coordinates of a device or the routing of a pathway segment) to generate a new solution. A greedy selection is applied based on the Pareto dominance relation: if the new solution dominates the old one, it replaces it; otherwise, the old solution is retained, and its count of unimproved trials is recorded.
In the onlooker bee phase, the algorithm employs a fitness assignment strategy based on non-dominated sorting and crowding distance calculation. Honey sources located in better Pareto ranks or sparser regions are selected with higher probability for intensive exploitation. This guides the population towards convergence to the true Pareto front while maintaining the diversity of the solution set. If a honey source cannot be improved after a predetermined number of trials, it is considered trapped in a local optimum, triggering the scout bee phase. This phase is key to the algorithm’s improvement: the scout bee does not simply generate a random solution but initiates an embedded Genetic Algorithm operation. This includes fitness-based roulette wheel selection, multi-point crossover based on encoding sequences, and random mutation occurring with a certain probability. This utilizes the existing high-quality genetic information within the population to purposefully generate promising new solutions to replace the abandoned one, significantly enhancing the algorithm’s ability to escape local optima.
Throughout the iterative process, the algorithm simultaneously maintains an external elite archive to dynamically store all non-dominated solutions found during the current search. Non-dominated solutions generated in each generation are compared and used to update this archive, ensuring it always contains the current best non-dominated solutions. The archive is periodically pruned using crowding distance calculation to guarantee a broad distribution of solutions. Finally, when the termination criteria are met, the output external archive represents the set of Pareto-optimal candidate solutions obtained by the optimization model in this paper.

3.2. Optimization Model for Flexible Energy Management Strategy

In the PEDF systems retrofitted into an existing building with minimal invasiveness, the hardware architecture possesses inherent constraints due to the limitations of the retrofitting conditions. These include non-optimal PV installation orientation, potential additional line losses from suboptimal storage placement, and extended cable pathways. This implies that, compared to a new system built from scratch, its operational optimization faces greater challenges and relies more heavily on a highly intelligent, self-adaptive energy management core capable of perception and decision-making. This paper introduces DRL [31,32] to address this “software strategy” optimization problem. Its core principle is to train an agent that continuously interacts with an uncertain environment and learns an optimal scheduling policy by maximizing long-term cumulative reward. To achieve this, the Twin Delayed Deep Deterministic Policy Gradient (TD3) algorithm is employed. This algorithm is an advanced evolution of DDPG [33], which effectively overcomes the problem of Q-value function overestimation bias by introducing a twin Critic network structure [34], supplemented by a delayed policy update mechanism to significantly enhance the stability of the training process and the reliability of the final policy. It is particularly suited to the characteristics of this problem, which features a continuous action space, high-dimensional state observations, and complex environment dynamics.
Modeling the energy management problem of the minimally invasive PEDF systems in an existing building as a Markov Decision Process (MDP) [35,36] is a crucial step in establishing the mathematical foundation for applying DRL. This modeling approach precisely formalizes the sequential decision-making interaction between the agent and the uncertain environment. An MDP consists of four core elements, defined specifically in this context as follows:
(1)
State Space (S)
The state space defines the comprehensive observational dimensions of the system’s operational environment for the agent, forming the information basis for its decisions. In this system, the state vector st at any timestep t is designed to include five key observed variables:
t (Time): The current time of day, used to implicitly encode the periodicity of solar irradiance, load patterns, and Time-of-Use (ToU) electricity price cycles. It is a crucial temporal feature for predicting future PV output and load demand.
Ppv(t) (PV Generation Power): The real-time net output power of the PV array. This is the theoretical maximum generation capacity minus losses due to non-ideal factors caused by the minimally invasive layout, such as non-optimal orientation/tilt, partial shading, and line losses from extended pathways. It is the direct input for the agent to perceive current renewable energy availability.
Pload(t) (Load Demand Power): The real-time power demand of the total load on the building’s DC bus. It reflects the aggregated energy consumption of all electrical devices in the building, and its variability is a major source of uncertainty for the system.
SOC(t) (State of Charge): The current state of charge of the battery energy storage system. Its value directly constrains the range of energy the agent can dispatch and is a core state for ensuring the safe operation of the storage unit.
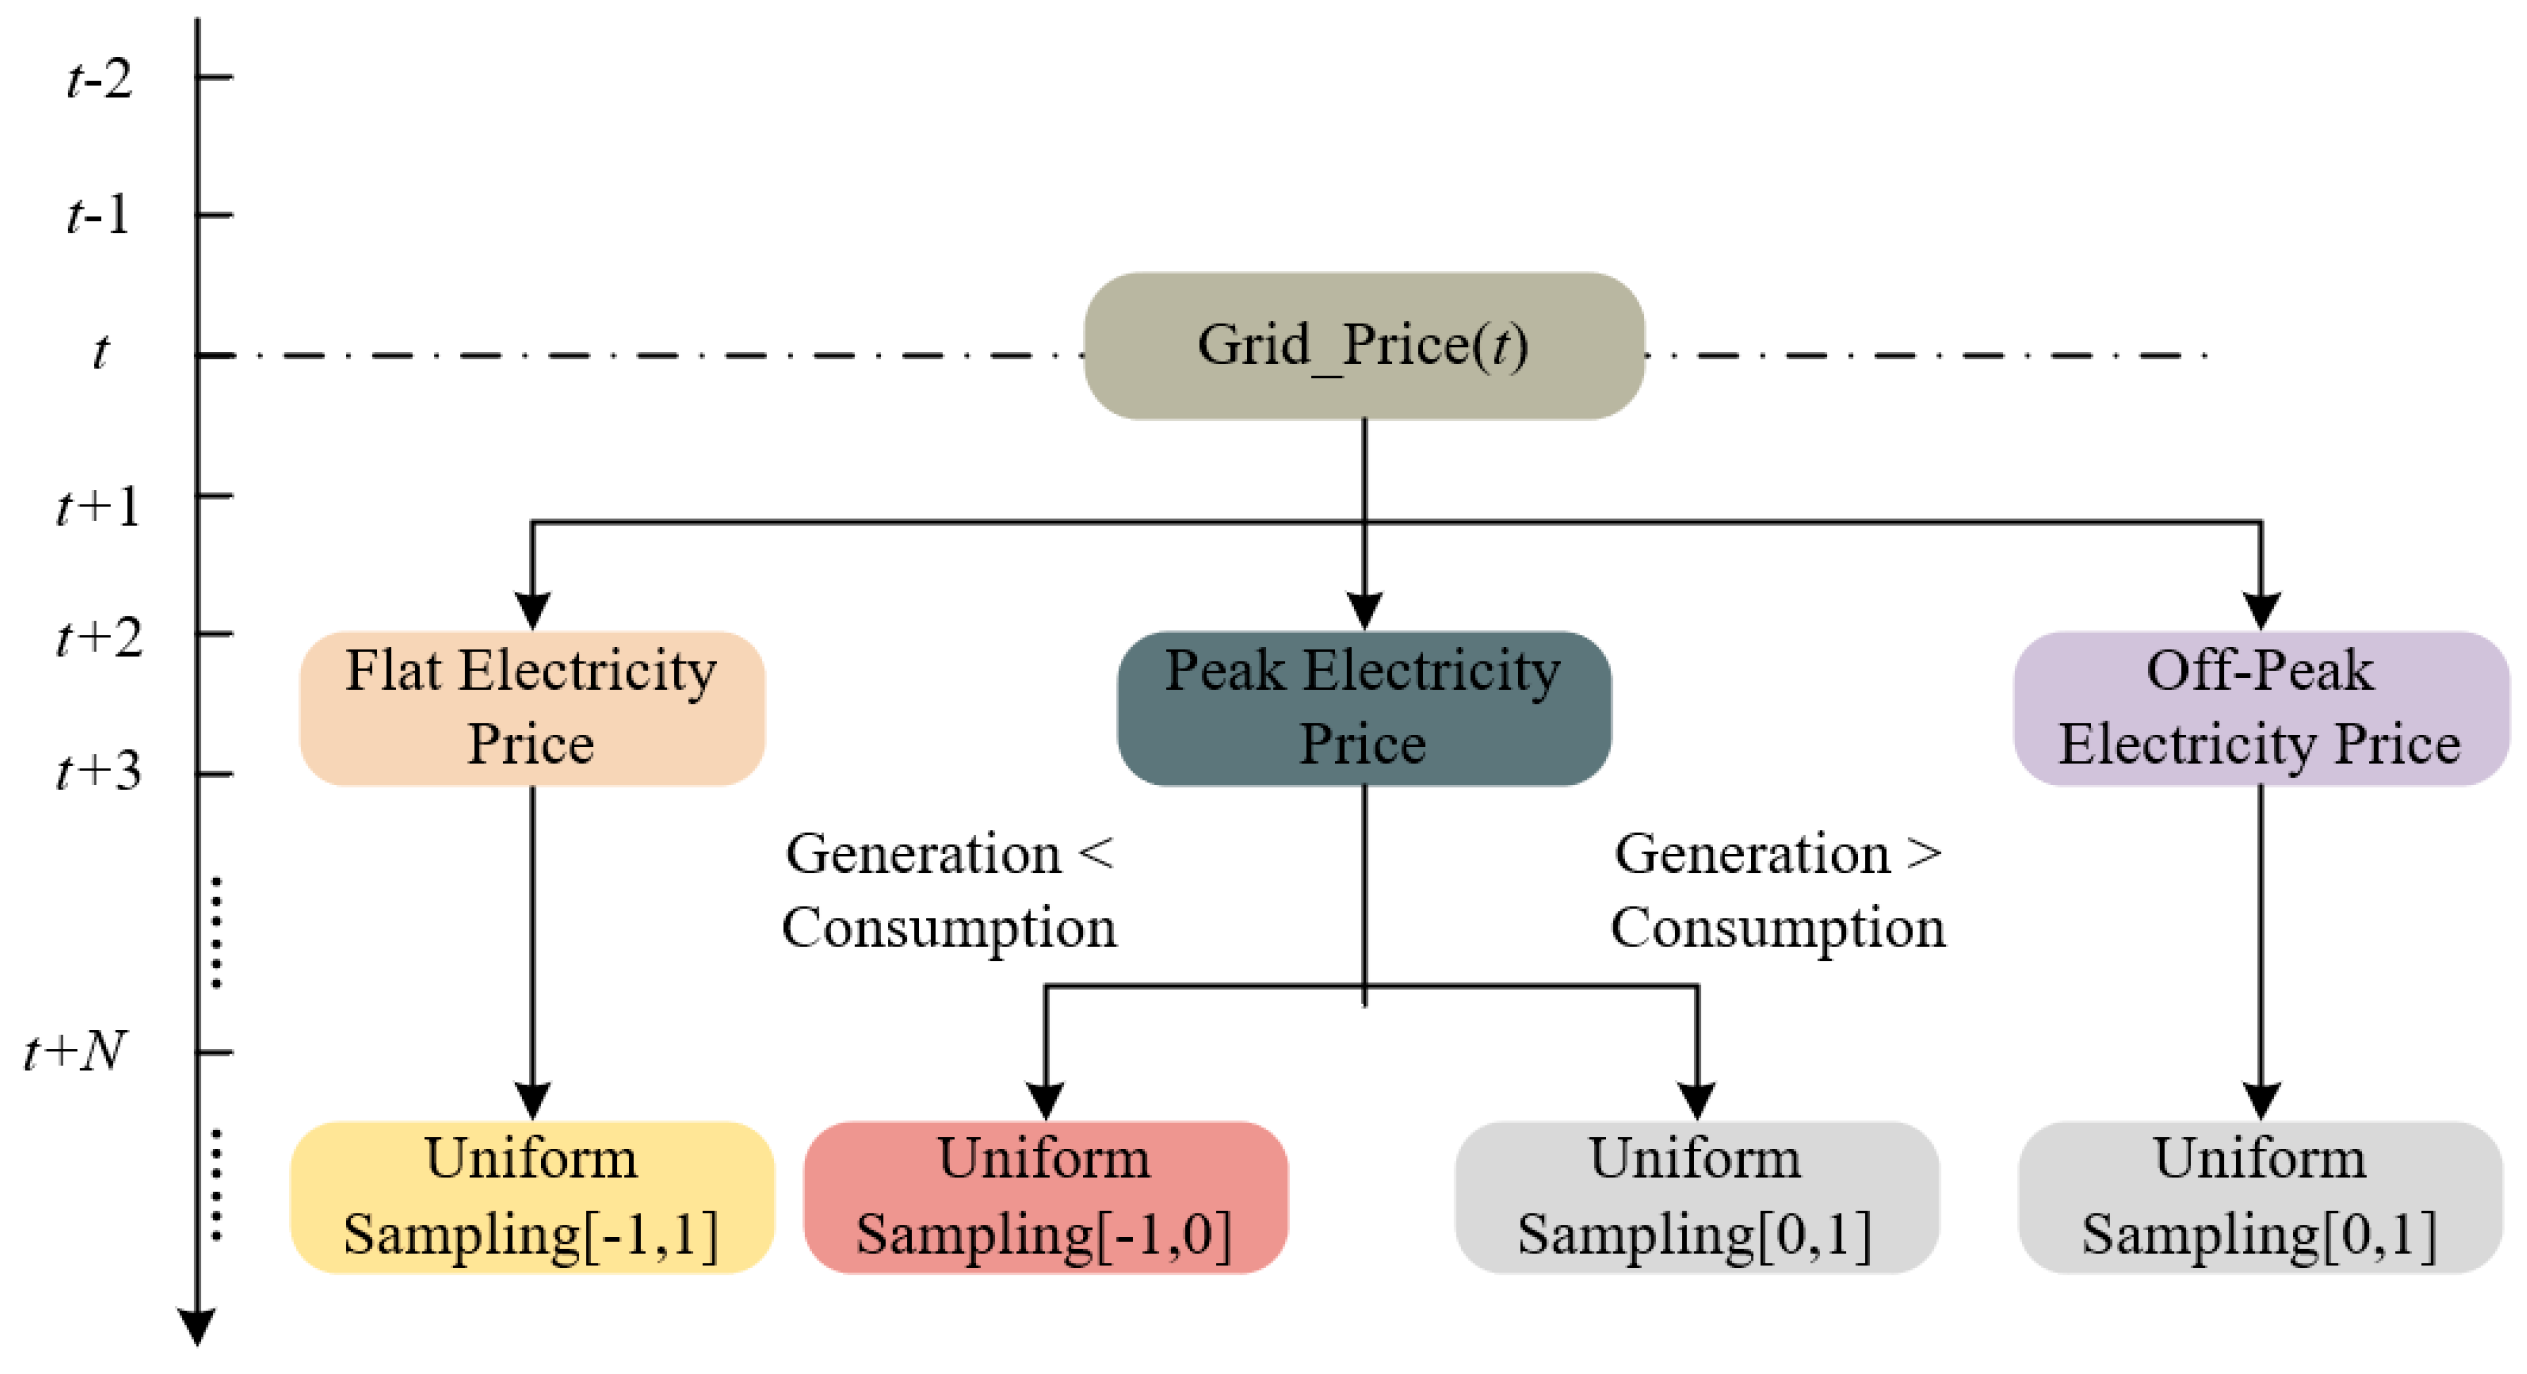
Grid_Price(t) (Electricity Price Signal): The current ToU electricity price signal at the grid connection point. This provides the direct external economic incentive for the agent to perform economic dispatch, enabling arbitrage or cost minimization.
Pgrid_his(t-k:t) (Historical Grid Power): A historical sequence of the power at the grid connection point over recent timesteps (t-k to t). This allows the agent to perceive the current power interaction trend, which is crucial for smoothing power fluctuations, avoiding abrupt power changes, and is a key state reflecting “flexibility” and grid-friendliness.
Figure 5 provides a schematic diagram of the ToU electricity price sampling method used in this paper, where the price for the current time period can be determined through appropriate sampling.
(2)
Action Space (A)
The action space defines the set of executable control commands available to the agent. This system employs a deterministic continuous action space. The action vector at at timestep t is defined as:
Pess_cmd(t) ∈ [−Pess_discha_max, Pess_cha_max]
In the above equation, Pess_cmd(t) is the charge/discharge power setpoint commanded by the agent to the storage converter at timestep t. Pess_cha_max is the maximum allowable charging power of the energy storage system, and Pess_discha_max is its maximum allowable discharging power. Here, Pess_cmd(t) is a continuous scalar value representing the agent’s charge/discharge power command to the storage converter, where negative values indicate charging and positive values indicate discharging. This paper employs a continuous action space, allowing for milliwatt-level fine-grained regulation of storage power. This is crucial for achieving smooth power curves, precise economic arbitrage, and mitigating battery degradation, offering significant advantages over traditional discrete action strategies (e.g., simple ‘charge/discharge/standby’).
(3)
State Transition Probability (P)
The state transition probability P(s{t + 1}|st,at) describes the dynamics of the system environment probabilistically transitioning from the current state st to the next state s{t + 1} after the agent executes action at. This probability distribution encapsulates all uncertainties in system operation, specifically including:
The stochasticity of PV output (Ppv fluctuations) caused by short-term cloud movement and instantaneous changes in irradiance.
The stochasticity of load demand (Pload fluctuations) arising from the unpredictability of human activity within the building and the random switching of equipment.
It is particularly important to note the deterministic nature of the storage dynamics. The state of charge (SOC) transition for the storage is a relatively deterministic process, approximately following:
SOC{t + 1} = SOCtPess_cmd(ttη/Cess
where Δt is the discrete timestep length, η is the charge/discharge efficiency, and Cess is the rated capacity. However, the degradation of its long-term State of Health (SOH) is a slow stochastic process. This model acknowledges that its precise mathematical form is difficult to obtain, but this is precisely the advantage of employing model-free reinforcement learning. The algorithm does not require knowledge of the specific form of P; it can learn the optimal policy directly from data solely by interacting with and sampling from a simulation environment that mimics the aforementioned dynamics.
(4)
Reward Function (R)
The reward function serves as the guiding objective for the agent’s learning, encoding the system’s global, long-term optimization goals into a quantifiable immediate scalar reward signal rt. Addressing the core objective of maximizing the whole-life-cycle benefits for the minimally invasive system, the reward function is meticulously constructed as a weighted sum of economic, equipment lifespan, grid-friendliness, and operational safety objectives.
The Economic Objective, denoted recon, directly enhances the system’s operational economy. It incentivizes the agent to learn classic energy arbitrage strategies—charging the battery during low-price periods and discharging during high-price periods—by penalizing costly electricity imports from the grid. The Equipment Lifespan Objective, designated rdegrad, aims to mitigate battery aging, which is critical for systems with constrained maintainability due to their minimally invasive design. This objective penalizes the battery’s energy throughput, with a penalty coefficient proportional to the degradation cost per kWh, thereby encouraging smooth charge/discharge profiles to extend the asset’s operational life. The Grid-Friendliness Objective, termed rgrid, encapsulates the system’s “flexibility” by promoting a stable and predictable grid presence. A quadratic penalty is applied to the power at the grid interface when it exceeds a predefined safety limit, strongly encouraging the agent to use energy storage for peak shaving and valley filling, thus smoothing the power exchange profile. Finally, the Operational Safety Objective, labeled rsafe, ensures the safe and stable operation of the storage unit itself. It guides the agent to maintain the battery’s SOC within a safe operating range, preventing harmful over-charging or over-discharging events.
The complete expression of the reward function is:
rt = recon + rde + rgrid + rsafe
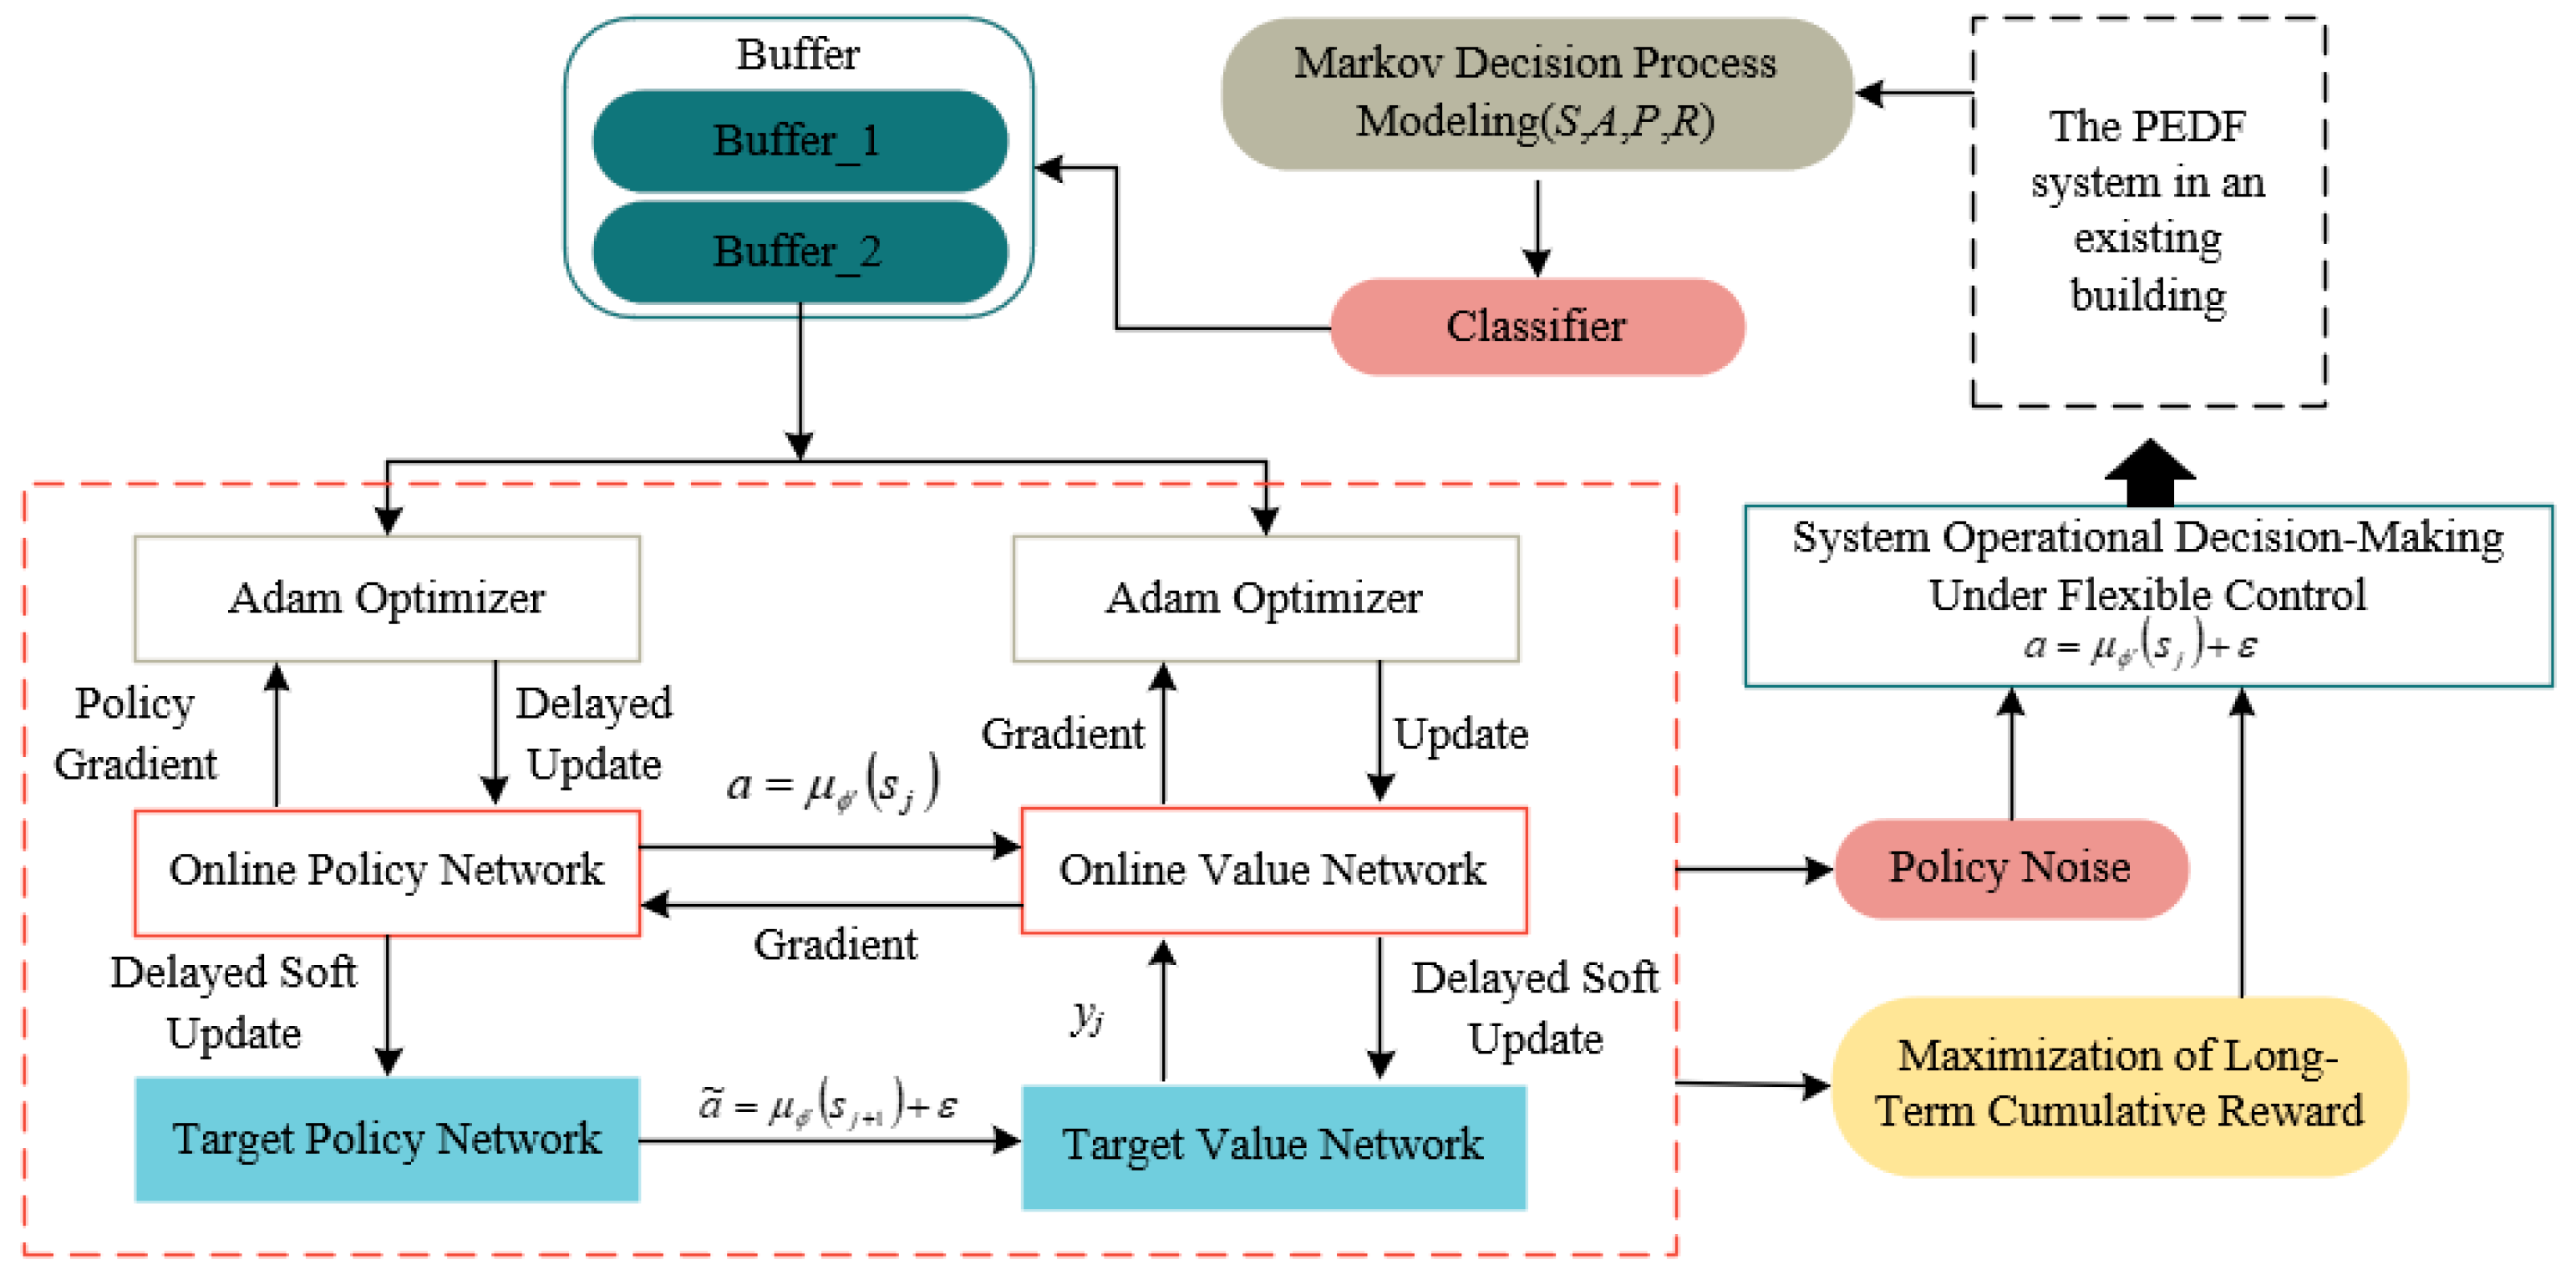
Addressing the high-dimensional, continuous, and time-dependent decision-making problem of energy management for the PEDF systems in minimally invasive existing building retrofits, this paper designs a deep reinforcement learning network architecture based on the TD3 algorithm. The specific architectural block diagram is shown in Figure 6. While maintaining powerful function approximation capabilities, this architecture specifically focuses on adapting to the limited sensor data, system uncertainties, and economic constraints of the retrofit scenario. Through the synergistic operation of its two main modules—the policy network and the value network—and its unique stabilization training mechanisms, it achieves the learning of an optimal policy that balances high performance and high robustness.
The policy network serves as the decision-making core of the model. Its function is to map the observed high-dimensional environment state to a continuous control action that optimizes both economic performance and ensures safety. The network input is the state vector s_t, designed with careful consideration of the sensing feasibility in minimally invasive retrofits, prioritizing the integration of easily acquirable key operational parameters such as total system power, estimated PV output, battery SOC, and real-time electricity price. Given that the state includes highly time-dependent historical power data, the network front-end employs a Long Short-Term Memory (LSTM) layer specifically designed for sequence modeling. Specifically, the first layer uses a 1D Convolutional LSTM (ConvLSTM) layer with 128 channels and a kernel size of 3, which efficiently extracts local fluctuation patterns and short-term features from the power sequence. This is followed by a second, standard LSTM layer that further captures the long-term dependencies within these features. The advanced temporal features processed by the LSTM module are concatenated with the current instantaneous state parameters and then fed into subsequent fully connected (FC) layers for non-linear transformation.
The network back-end consists of two FC layers, each containing 256 neurons and using ReLU activation functions, responsible for encoding the fused features into high-level decision abstractions. Finally, the output layer, via a single neuron employing a hyperbolic tangent (tanh) activation function, constrains the action to the range [−1, 1]. This normalized output is then passed through a rigorous action post-processing module. Here, it is scaled and constrained into an actual, feasible continuous charge/discharge command at = Pess_cmd(t) by incorporating the battery’s real-time maximum allowable charge/discharge power and its rigid SOC safety boundaries. This entire forward propagation process completes an end-to-end non-linear mapping while embedding a critical mechanism for ensuring the system’s physical safety.
The value network, acting as the performance evaluator for the policy, is tasked with accurately assessing the long-term expected return obtainable from executing a given action in a specific state. Its network structure is partially similar to the policy network but has key differences. It also receives the state st and employs an independent, identically structured LSTM module to process the temporal dimension, ensuring it possesses powerful state feature extraction capabilities. However, the fundamental distinction from the policy network is that the input to its first FC layer is the concatenation of the state features output by the LSTM module and the externally input action vector at. This design enables the value network to comprehensively evaluate the quality of state–action pairs. This network also contains two ReLU hidden layers with 256 neurons each. The final output layer is a single neuron with linear activation, directly regressing the estimated Q-value, thereby providing an unbounded evaluation of any state–action pair.
To overcome training instability and divergence caused by function approximation errors, and to specifically enhance the model’s robustness in the uncertain environment of a retrofit system, this design strictly incorporates the three core stabilization mechanisms of the TD3 algorithm. First, identical target networks are created for both the policy and value networks. Their parameters are slowly updated to track the main network parameters via soft updates, providing stable supervisory targets for Q-value calculation. Second, a delayed policy update mechanism is adopted, meaning the policy network is updated only once after the value network has been updated multiple times. This ensures the value assessment is sufficiently accurate before guiding policy optimization. Finally, target policy smoothing is implemented. This technique adds clipped noise [37,38] to the actions of the target policy when calculating the target Q-value. It regularizes the Q-function estimate by smoothing it, effectively preventing overfitting to noisy Q-value estimates and significantly improving the algorithm’s ability to handle the stochastic load fluctuations and PV prediction errors inherent in existing buildings. The entire network is trained using the Adam optimizer, with parameters updated to minimize the temporal difference error. The process is guided by the meticulously designed reward function to ensure the learned policy aligns with the economic and safety objectives of the minimally invasive retrofit.
To enhance the model’s robustness against data uncertainty, equipment aging, and operational noise in the context of existing building retrofits, while ensuring the economic efficiency and safety of the learning process, this model adopts a specifically improved TD3 network update strategy. This algorithm trains two independent value networks, Qθ1 and Qθ2, in parallel. When calculating the target Q-value, the minimum of the two is selected as the update target:
yj = rj + γmini = 1, 2Qθi(sj + 1, ã)
where rj is the immediate reward obtained by the agent from the environment after executing action aj at timestep j, and γ is the discount factor. This conservative estimation strategy effectively mitigates Q-value overestimation. In the retrofit scenario, this is particularly significant for reducing evaluation bias caused by missing or low-precision sensor data. It also prevents the policy from becoming overly aggressive, thereby reducing the risk of abnormal degradation to the storage battery, aligning with the core concerns of equipment lifespan and economic efficiency in minimally invasive retrofits.
To suppress overfitting of the value function to local peaks and enhance the policy’s adaptability to observational disturbances like PV power fluctuations and load randomness, the algorithm injects clipped Gaussian noise [39] into the target actions:
ã = μϕ’(sj + 1) + ε, ε~clip(N(0,σ), −c, c)
where ε is the random noise added to the target action. The noise variance σ and clipping threshold c require tuning based on the actual dynamics of the retrofit system. Special attention is paid to matching the noise intensity to the uncertainty level of building energy use/PV output. Strict clipping prevents the smoothed action from exceeding equipment safety limits, ensuring the physical feasibility of the generated action.
To reduce the negative impact of target Q-value variance on policy learning, the algorithm employs a delayed update mechanism: the policy network and target networks are updated only once after every d updates of the value networks. This mechanism provides ample convergence time for the value function, ensuring policy optimization is based on low-variance Q estimates, which is particularly crucial in data-limited retrofit scenarios. Assuming the parameters of the i-th target value network are denoted by θi, the target policy network parameters by ϕ’, and the parameters of the i-th value network by θi, the target networks are updated using a soft update rule:
θi′ ← τθi + (1 − τ)θi
ϕ′ ← τϕ + (1 − τ)ϕ
where the soft update rate τ is set to a small value, ensuring the target parameters evolve slowly and provide a stable supervisory signal for the training process, effectively mitigating training oscillations caused by data non-stationarity.
Furthermore, the algorithm is optimized for the specific demands of the retrofit scenario: An action smoothing penalty term is introduced into the reward function to suppress drastic fluctuations in power commands, thereby extending the lifespan of power electronic devices. The exploration noise intensity is matched to the uncertainty of building energy use and decays progressively during training, achieving an effective balance between exploration and exploitation. Through these meticulously designed mechanisms, the algorithm enhances its adaptability, safety, and stability in minimally invasive retrofit scenarios while retaining the original advantages of TD3, providing reliable technical support for the intelligent energy management of PEDF systems.
The TD3-based flexible energy management strategy optimization algorithm designed in this paper begins with the initialization of the policy network, value networks, and experience replay buffer. The core process involves the agent’s continuous interaction with the environment: based on the current observed state, the agent generates exploratory control commands via its policy network with added exploration noise and executes them. The environment, in turn, provides instantaneous rewards and the next state. The resulting experience tuples are stored in the replay buffer.
During the training phase, the algorithm randomly samples a batch of experiences from the buffer and applies TD3′s core stabilization mechanisms to calculate the target Q-value: First, clipped Gaussian noise is applied to the action output by the target policy network to achieve policy smoothing and suppress overfitting of the value function to local peaks. Subsequently, the two independent target value networks are used to estimate Q-values separately, and the minimum is taken to effectively alleviate overestimation bias caused by function approximation errors.
Based on this target, the algorithm prioritizes updating the parameters of the twin value networks by minimizing the temporal difference loss to accurately assess the long-term utility of state–action pairs. Thereafter, adhering to the delayed update principle, the policy network is updated only once after the value networks have been updated several times. Its parameters are adjusted in the direction that improves the Q-value, ensuring policy optimization is based on low-variance value estimates. All target network parameters are then slowly updated to track the online networks via soft updates, providing a stable benchmark for the learning process.
The proposed co-optimization framework is designed for broad applicability across building types, including office, commercial, and public facilities. From a deployment perspective, the system hardware is modular and scalable. Photovoltaic panels, battery storage units, DC power distribution equipment, and monitoring sensors can be selectively configured according to building-specific spatial constraints, energy usage patterns, and retrofit objectives. For instance, commercial buildings with high evening energy demand may emphasize battery capacity and bidirectional inverters, while public buildings may prioritize system redundancy and fault tolerance. The software framework relies on an edge-based control architecture, where the pre-trained optimization and scheduling policies—generated offline using the I-ABC-GA and TD3 algorithms—are deployed on lightweight embedded platforms. Although the training process requires significant computational resources, the runtime operation imposes minimal computational overhead, enabling real-time control without dependence on continuous cloud connectivity.
From a cost–benefit standpoint, the model incorporates multi-objective economic optimization, balancing initial investment against operational savings. Simulations across multiple building types confirm energy savings exceeding 20% and operational cost reductions of 10–15%, along with significantly improved grid interaction—with a peak demand reduction of 33% and voltage deviation within 5%. The payback period is generally between 5–8 years, varying with local energy prices and building usage profiles. Commercial buildings can achieve additional savings through demand response and time-of-use energy arbitrage, while public and institutional buildings benefit from enhanced power reliability and resilience. These findings affirm that the proposed approach offers an economically viable and technically feasible solution for scalable low-carbon retrofitting across diverse building types.

4. Case Study and Simulation Analysis

4.1. Simulation Experimental Environment and Baseline Characteristic Analysis

The case study involves an existing office building constructed in 2015 with a total floor area of 8000 m2. The building integrates office spaces, meeting rooms, and public areas, presenting a composite energy usage profile that is highly representative of modern urban building stocks. Its well-defined but inflexible electrical distribution network, combined with available installation space on roofs and facades, offers typical conditions for implementing minimally invasive PEDF retrofits. Geographically located in the Hot Summer and Warm Winter zone of China, the building experiences high cooling demands due to the subtropical climate while benefiting from substantial solar radiation exceeding 1300 kWh/m2 annually—creating an optimal environment for evaluating DC-powered air conditioning and photovoltaic generation systems. The distinct load patterns across different functional zones (consistent daily profiles in offices, intermittent peaks in meeting areas, and stable baseload in public spaces) provide a robust testbed for assessing the coordinated operation of PV generation, battery storage, and flexible load management.
The building features a cast-in-place concrete frame structure, with 200 mm autoclaved aerated concrete block walls and an external insulation system (thermal conductivity ≤ 0.040 W/(m·K)) and curtain walls with broken-bridge aluminum alloy hollow glass windows (U-value of 2.8 W/(m2·K)). Its electrical distribution system adopts a TN-S grounding scheme, powered by a 1250 kVA dry-type transformer. The main feeders from the low-voltage distribution cabinet to each floor’s distribution box are cables such as YJV-3×16/SC50-FC, WC laid along cable trays. The roof is designed as an accessible deck with a characteristic live load value of 2.0 kN/m2; structural review confirmed its capacity to support an additional photovoltaic system load (≤0.15 kN/m2).
The selection of this specific building was driven by its prototypical characteristics, which encapsulate the key challenges and opportunities of a large segment of the post-2010 Chinese urban building stock. These structures are typically characterized by standardized construction, moderate energy efficiency levels, and electrical systems that were not designed for high renewable energy integration. This particular building was chosen over others due to (1) the availability of high-resolution, multi-year operational data, which is critical for validating the energy model and training the DRL agent; (2) its well-documented as-built electrical drawings, enabling precise modeling of the minimally invasive constraints; and (3) its composite and temporally diverse load profile, which provides a rigorous test for the proposed co-optimization framework’s ability to handle complex, real-world operating conditions. By focusing on this representative case, the study establishes a robust and transferable benchmark, providing insights directly applicable to the widespread retrofit of similar building typologies.
The simulation centers on the core proposition of “spatial layout—operational strategy co-optimization.” It requires the precise replication of the building’s energy consumption temporal characteristics, the physical constraints of the distribution network, and the deployment limitations for PV-ESS equipment under minimally invasive principles. This provides an authentic baseline scenario for the subsequent validation of the multi-objective layout algorithm, training of the flexible energy management agent, and multi-dimensional benefit evaluation encompassing energy savings, economics, and low-carbon performance.
The reproducibility of the constructed simulation environment is ensured through a three-layer guarantee, building a simulation system that synergizes hardware, software, and data throughout the entire process of “physical constraint replication → algorithm development and validation → decision policy training.” At the hardware level, the AMD Ryzen 9 5900X (12-core) supports multi-threaded iterations of the PV-ESS layout heuristic algorithm; the NVIDIA GeForce RTX 3080Ti accelerates the training of the TD3 reinforcement learning agent dealing with high-dimensional states; 32GB RAM + 1TB NVMe SSD ensure the parallel processing of 15 min resolution energy data and multi-scenario PV data. At the software level, EnergyPlus v9.5 replicates building load profiles; OpenDSS v9.0 simulates power flow constraints in the distribution network; Matlab R2023b develops traditional algorithms for comparison; TensorFlow 2.6.2 + a custom Gym environment incorporates minimally invasive constraints (e.g., wiring length, installation location) for agent training. At the data level, 2023–2024 building energy consumption data (15 min resolution), local 2024 hourly solar irradiance data, and 2025 ToU tariff rules are used to construct a coupled “PV-ESS-Load-Price” scenario, ensuring consistency between the simulation and actual retrofit conditions. The synergy of these three aspects guarantees full-process reproducibility for PV-ESS layout optimization, policy training, and benefit evaluation, providing core support for the paper’s innovation in “spatial-policy co-optimization” and its multi-dimensional validation (see Table 1).
The datasets utilized in this study were meticulously selected to ensure the accuracy, realism, and reproducibility of the co-simulation environment. The existing office building energy consumption data (2023–2024), with a high 15 min resolution, was sourced directly from the building’s smart metering infrastructure. This dataset captures the nuanced temporal patterns of three primary electrical load types: lighting, equipment, and HVAC systems, providing a reliable baseline for modeling building demand. The local solar irradiance data for 2024, recorded at an hourly resolution, was obtained from a nearby meteorological station. It comprehensively covers varying weather conditions, including clear and cloudy days, which is critical for accurately modeling the volatility and intermittency of PV power generation. The Grid Time-of-Use (ToU) tariff rules, based on the local utility’s published policy for the 2025 edition, provide the essential economic signal for the energy management strategy. These rules explicitly distinguish between peak, flat, and valley periods, enabling the development of cost-minimizing dispatch strategies that leverage price arbitrage. Together, these datasets form a robust foundation for the “source-storage-load-price” coupled simulation, ensuring the scenarios are both representative of real-world conditions and conducive to validating the proposed optimization and control frameworks under realistic constraints.
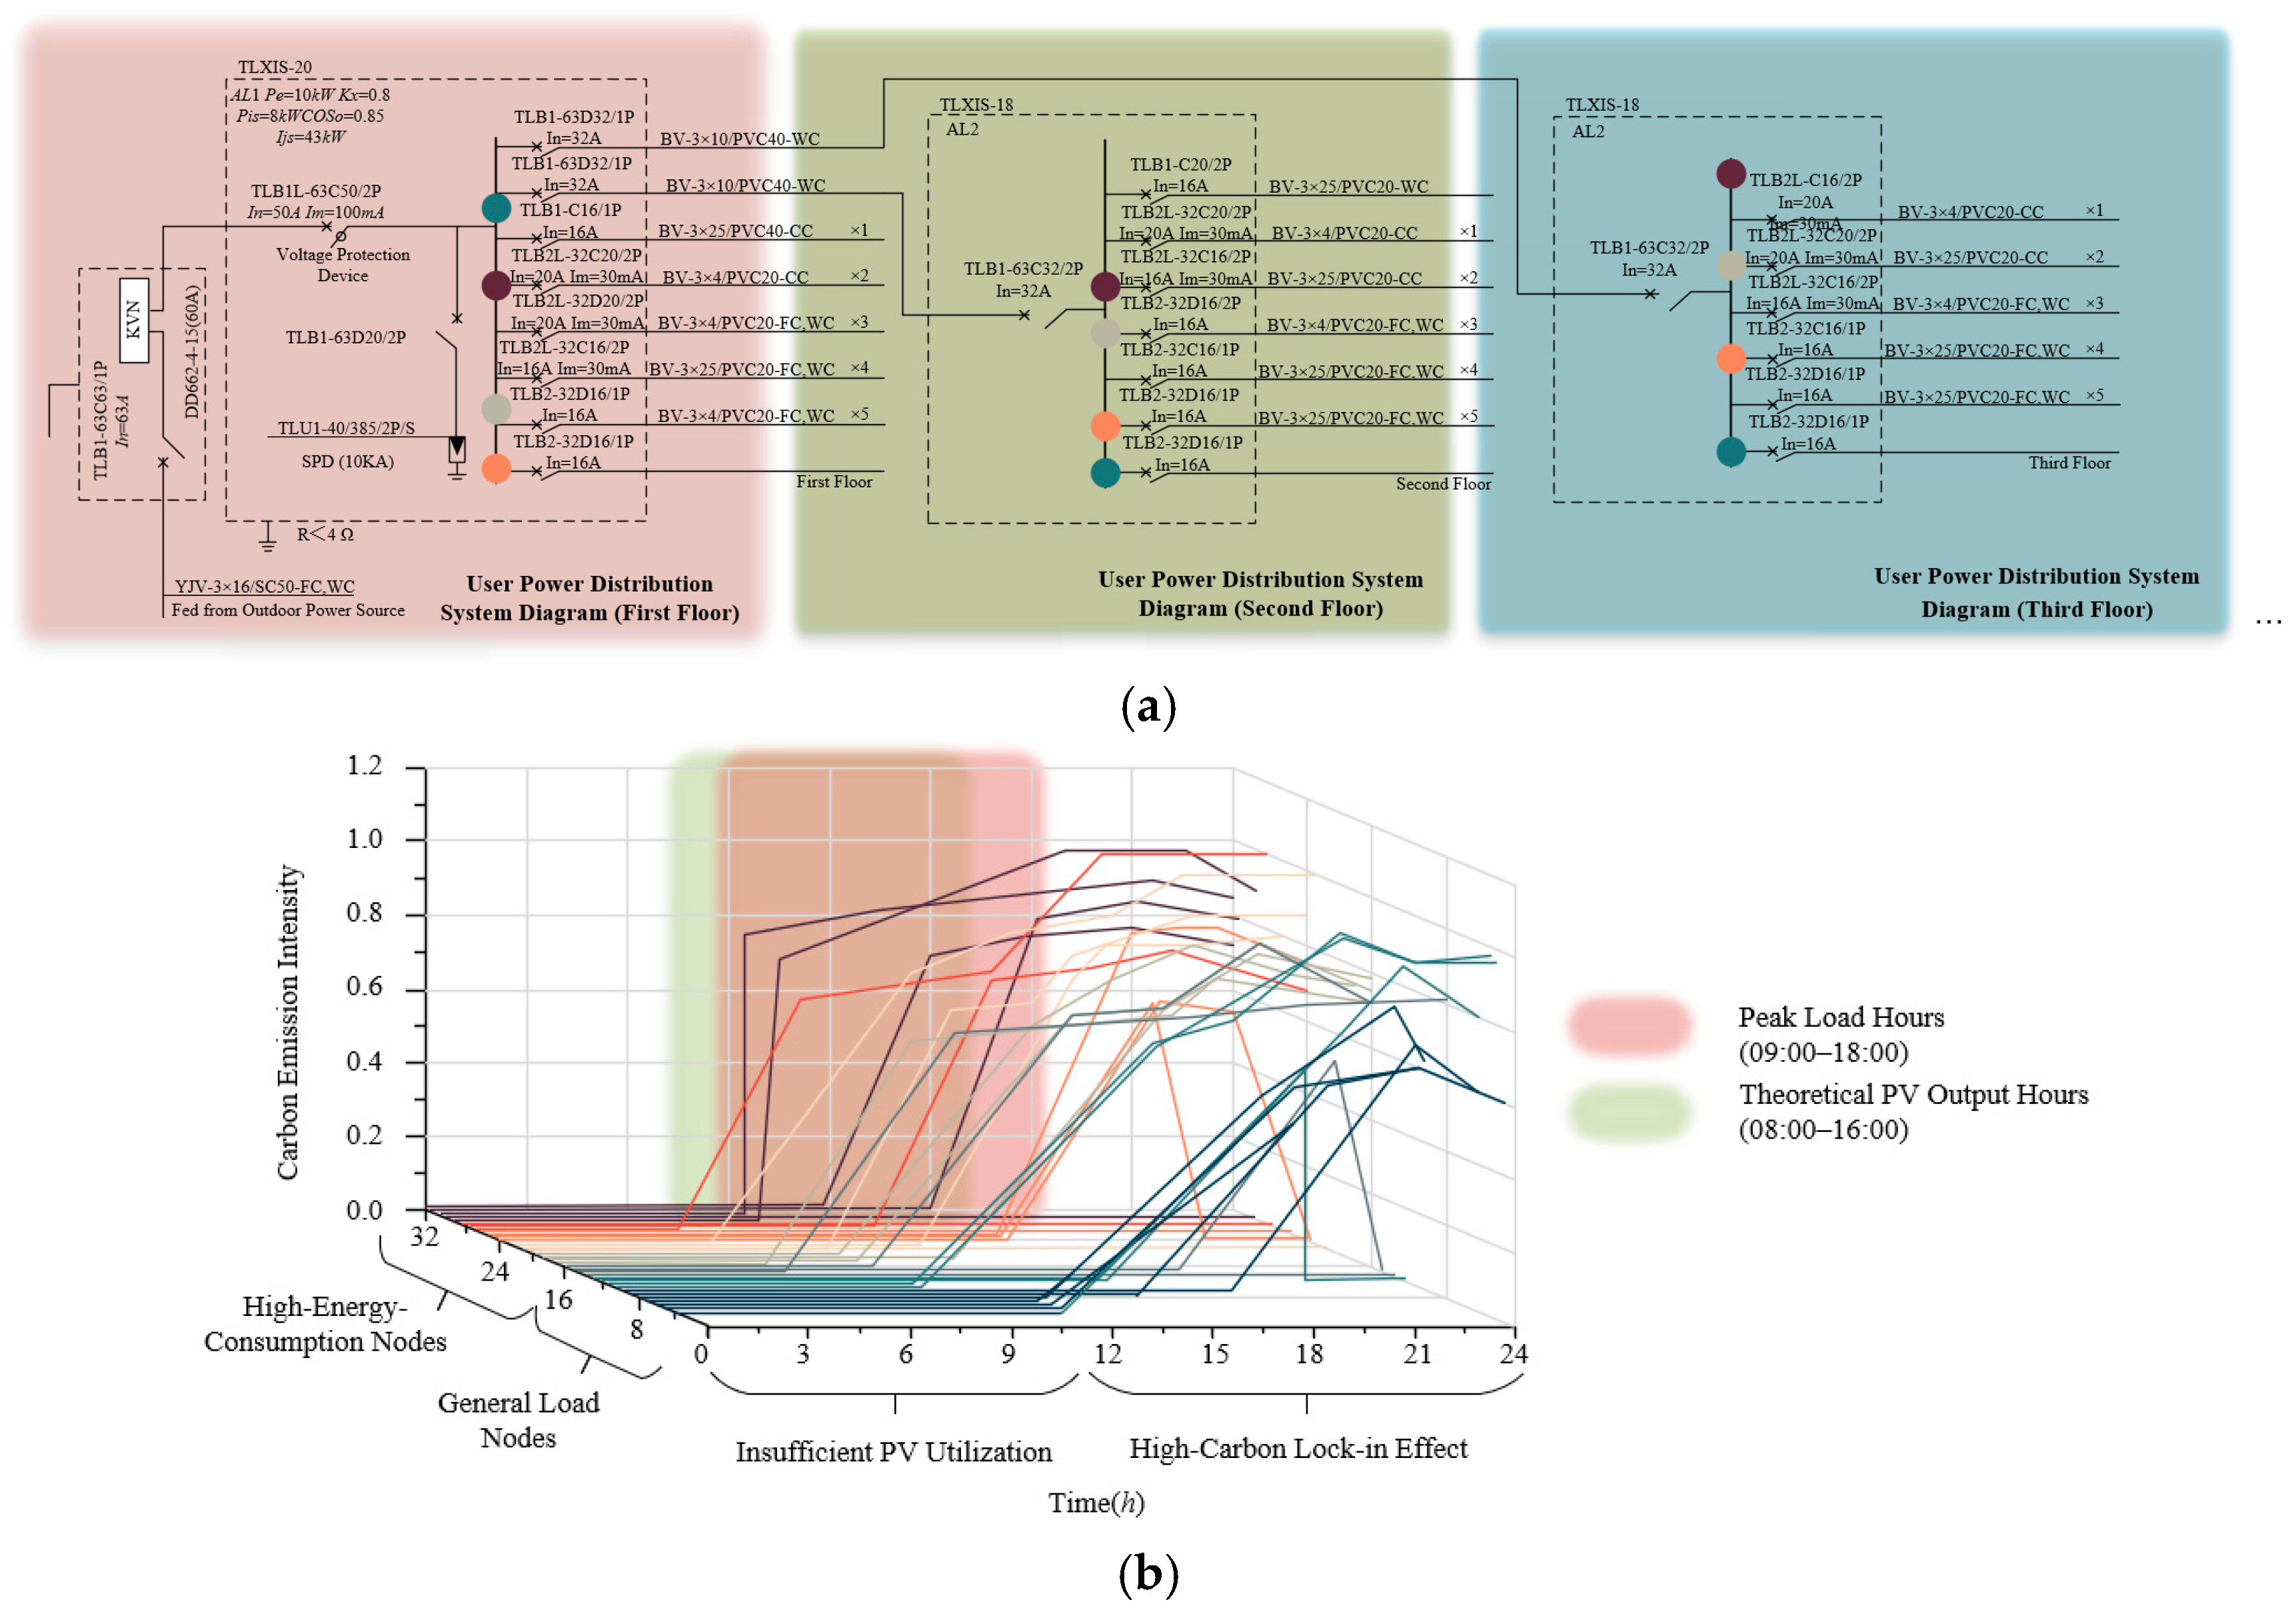
Figure 7a shows partial pre-retrofit electrical system diagrams of the first to third floors of the comprehensive office building selected for the experiment (6 floors above ground, total construction area of ~8200 m2, main functions: administrative offices and meeting rooms, average daily electricity load of ~1200 kWh). The diagrams focus on marking key electrical infrastructure elements that constrain the minimally invasive retrofit: (1) the routing of low-voltage power distribution trunk and branch cables (e.g., BV-3×10/PVC40-WC for first-floor trunk cables, BV-3×25/PVC20-CC for second-floor branch cables) with installation methods including wall concealed, ceiling concealed, and floor concealed; (2) the configuration of core power distribution nodes (1 main distribution box per floor is shown in the diagrams, with a total of 6 main distribution boxes and 24 zone load distribution boxes for the entire building; e.g., the third-floor distribution box interfaces with multiple load circuits via devices like TLB2L-C16/2P with a rated current 20A); (3) the parameters of protective devices at key nodes (e.g., residual current devices with a rated residual operating current 30mA, circuit breakers with rated currents 16A, 20A, 32A) and the rated capacity of connected loads (e.g., office lighting: 15 W/m2, split air conditioners: 800 W/unit, office equipment: 20 W/m2). The primary role of Figure 7a is to provide physical constraint boundaries for the PV-ESS layout optimization in the co-optimization framework—for example, output cables of the roof PV array need to match the rated current of the first-floor incoming distribution box, and ESS installation must align with existing cable routing pathways, thus minimizing retrofit workload while ensuring electrical safety.
To analyze the carbon emission baseline of the existing building’s distribution system, thereby providing a benchmark for “low-carbon retrofitting” and establishing the foundational premise for “carbon reduction analysis,” this study investigated the dynamic distribution of carbon emission intensity at distribution nodes for a typical day. The dynamic distribution presented in Figure 7b reveals the core characteristics of the existing system’s carbon emissions: “strong temporal coupling between load and grid, with differences driven by nodal energy use patterns.”
Temporally, during the load peak hours (9:00–18:00), the carbon emission intensity at most nodes generally rises to 0.8–1.0 kgCO2/kWh (e.g., Nodes 32 and 24), directly correlating with the grid’s energy mix during peak periods, where fossil fuel generation can exceed 70%. During the theoretical PV generation window (8:00–16:00), the emission intensity does not decrease as expected, remaining at 0.6–0.8 kgCO2/kWh. This exposes the status quo of missing zero-carbon energy integration or blocked utilization pathways in the existing buildings, where solar resources fail to effectively offset emissions.
Spatially, high-energy-consumption nodes like central air conditioning circuits reach peak emission intensities exceeding 1.0 kgCO2/kWh, sustained throughout the load peak, exhibiting a “high-carbon lock-in” effect. Nodes serving conventional loads like lighting systems show relatively lower intensities (~0.6–0.8 kgCO2/kWh), but their emission profiles perfectly mirror the grid’s carbon emission factor, reflecting the rigidity of emissions under a passive consumption mode.
Thus, the pre-retrofit carbon baseline clearly reveals three core pain points, providing precise targets for the carbon reduction pathway of the minimally invasive PV-ESS retrofit. At the Spatial Layout Level: Priority should be given to deploying PV equipment near high-emission nodes. Utilizing idle roof/facade space and employing minimally invasive wiring that utilizes existing cable trays can shorten distribution distances to within 50m. This maximizes the proportion of PV power directly supplying high-consumption loads, addressing the “wasted carbon reduction potential during PV hours” dilemma. At the Operational Strategy Level: The BESS should target discharge during load peak hours (9:00–11:00, 14:00–16:00) to support high-emission loads, displacing fossil-fueled grid power. Concurrently, it should prioritize storing excess PV power during midday (12:00–14:00) and utilize grid power for charging during late-night off-peak hours (22:00–6:00), forming a “peak-valley complementary” carbon flow regulation strategy.
The effectiveness of these strategies will be validated by post-retrofit changes in the carbon emission curve: a 30–50% reduction in peak intensity, flattened emissions during PV generation hours, and narrowed emission differentials between nodes.

4.2. PEDF Systems Design Optimization and Algorithm Verification

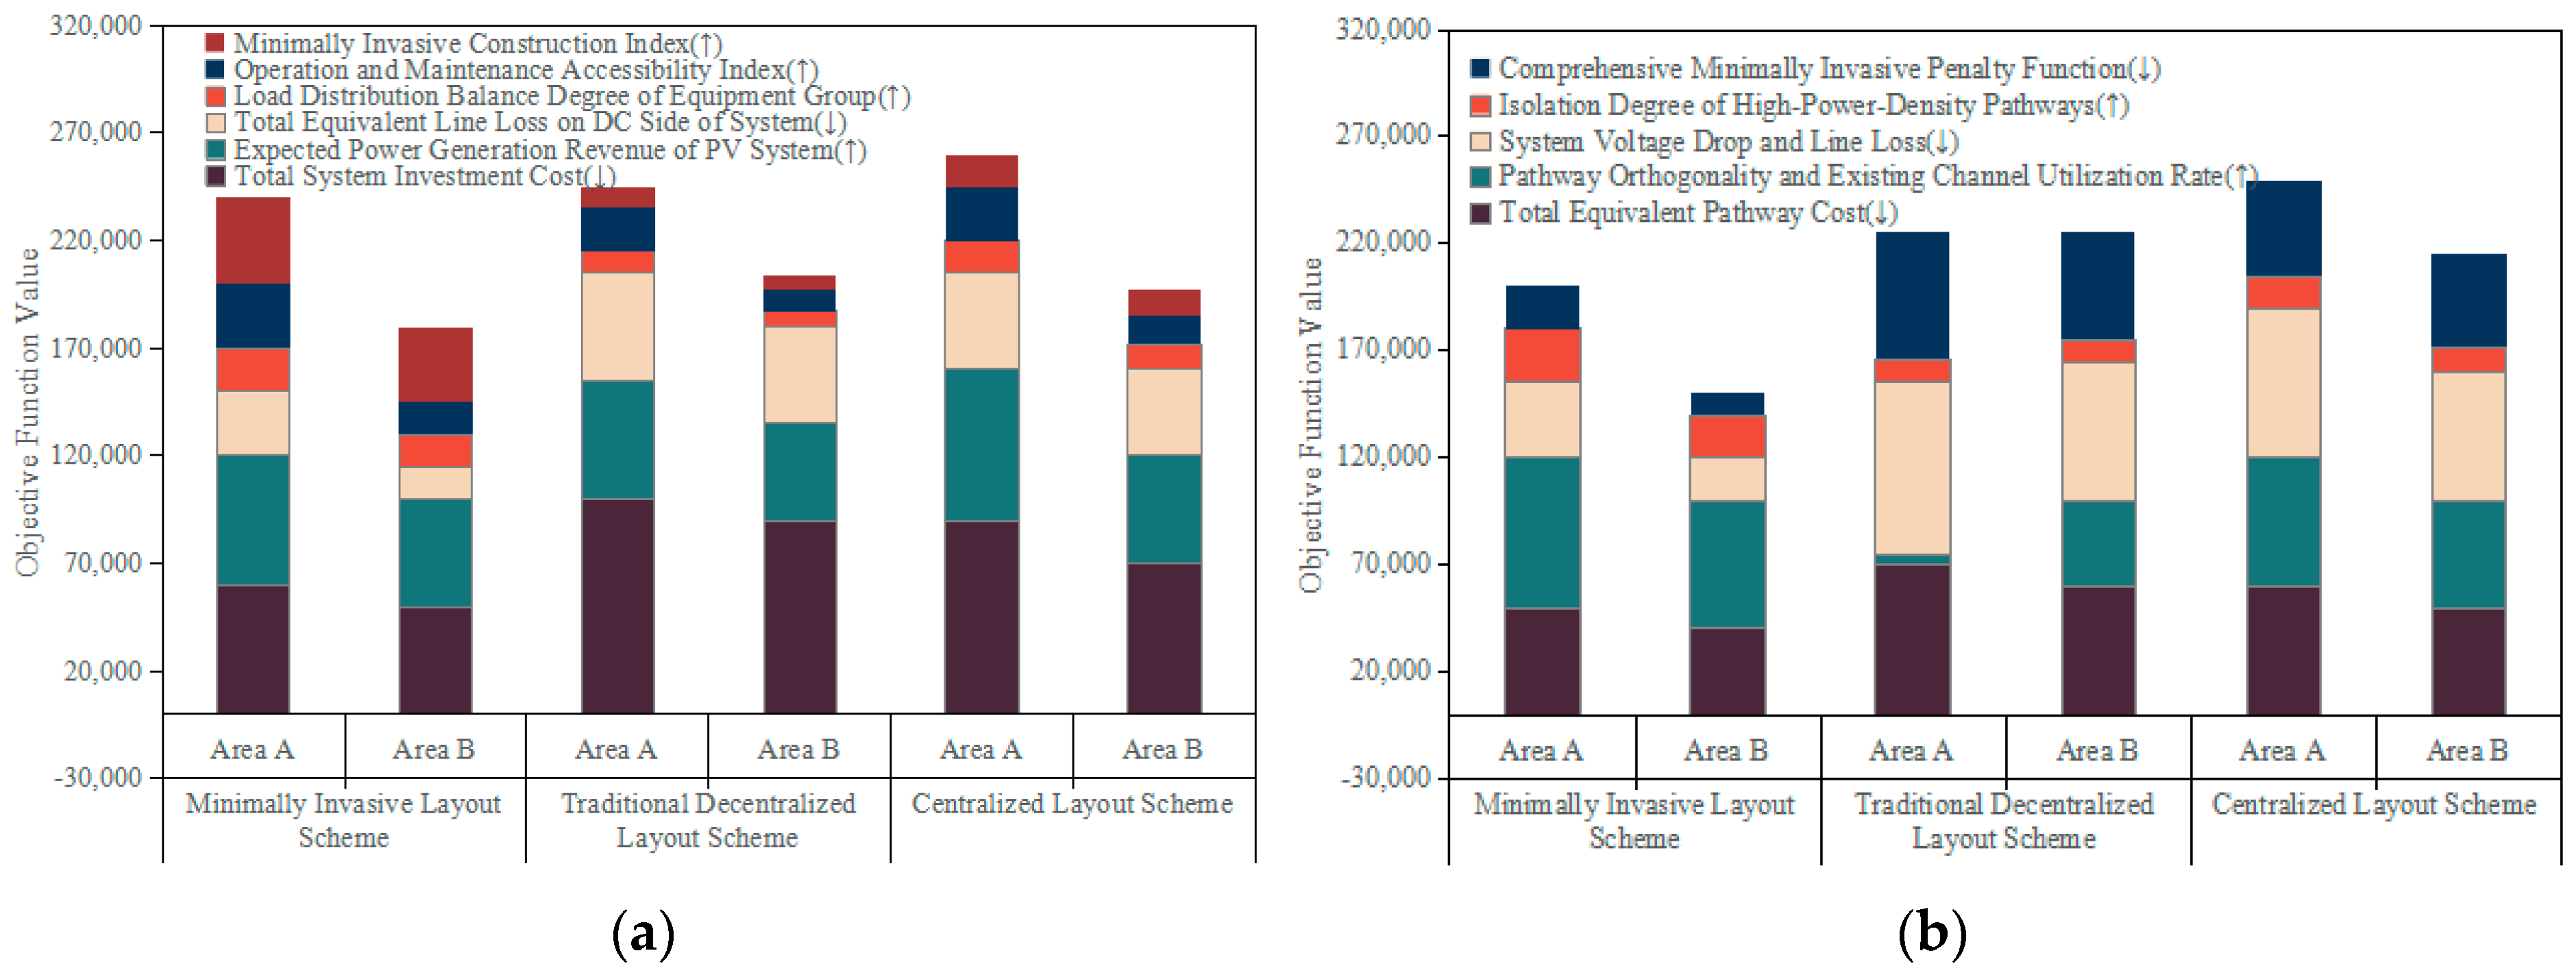
Given the inherent contradiction between the spatial access constraints for PV-ESS equipment and the energy efficiency benefit demands in existing buildings, traditional layout schemes often lead to the drawbacks of “insufficient energy efficiency at high minimally invasive cost” or “energy efficiency prioritized at the expense of building integrity” due to a lack of co-optimization of their relationship. Therefore, this paper designed a comparative experiment involving three types of equipment layouts: minimally invasive, traditional dispersed, and centralized, to verify the solving capability of the proposed I-ABC-GA algorithm for multi-objective constraints. As shown in Figure 8a, the minimally invasive scheme achieves key breakthroughs through algorithm-driven equipment siting optimization.
In the minimally invasive constraint dimension, by prioritizing adaptation to the building’s idle roof and facade spaces and avoiding structural load-bearing zones, the façade demolition area is reduced by 40%. The “Minimally Invasive Construction Index” is reduced by 35% compared to the traditional dispersed scheme. The load standard deviation decreases from 120 kg/m2 to 86 kg/m2, avoiding local load exceedance and increasing the “Equipment Load Distribution Uniformity” by 28%. In the energy efficiency benefit dimension, as the equipment layout is closer to load centers, distribution losses decrease from 8% to 6%, and the local consumption rate increases from 65% to 82%. This results in an 18% increase in the “Expected PV Power Generation Revenue,” overcoming the bottleneck of traditional schemes characterized by “high PV reverse power flow rates and diminished revenue.” In the reliability dimension, the “Total Equivalent DC-Side Losses” and “System Total Failure Rate” are comparable to those of traditional schemes, demonstrating the algorithm’s capability for co-optimizing the multiple objectives of “minimal invasiveness-energy efficiency-reliability.”
In existing building retrofits, the core conflict arises from the limited availability of distribution channel resources and the stringency of electrical performance requirements. Traditional pathway planning, which often decouples “electrical constraints from minimally invasive constraints,” frequently results in issues like “skyrocketing minimally invasive costs due to excessive new wiring” or “degraded electrical performance from over-reliance on existing pathways.” Thus, a comparative experiment on the electrical pathway layout was designed to verify the algorithm’s effectiveness in the “coupling optimization of pathway topology and existing channels.” Figure 8b shows that the minimally invasive scheme, leveraging the algorithm’s deep reuse of existing channels, demonstrates significant advantages.
In the minimally invasive cost dimension, the reuse ratio of existing cable trays reaches 75%, the length of newly installed wiring is reduced by 55%, and over 60 structural penetration points are avoided. This leads to a 40% reduction in “Comprehensive Minimally Invasive Planning Cost” and a 32% decrease in “Pathway Equivalent Cost” compared to the centralized scheme. In the electrical performance dimension, the voltage drop is ≤5% and line losses are ≤4%, superior to the 7% voltage drop and 6% line losses of traditional schemes, resulting in a 16% reduction in “System Voltage Drop and Line Losses.” The proportion of high-power circuits sharing conduits with sensitive loads drops from 35% to 10%, and EMI is reduced from 18dB to below 10dB, increasing the “Isolation of High-Power-Density Pathways” by 25%. In the resource reuse dimension, the “Pathway Orthogonality and Existing Channel Utilization Rate” reaches 75%, validating the algorithm’s ability to simultaneously satisfy “electrical constraints and minimally invasive constraints,” strongly supporting the scientific validity of the paper’s “Multi-objective Optimization Model for PV-ESS Layout.”
To validate the efficiency and robustness of the proposed I-ABC-GA optimization algorithm, a comprehensive performance comparison among multi-objective optimization algorithms was conducted. As shown in Table 2, I-ABC-GA significantly outperforms all compared algorithms in two key metrics: Hypervolume (HV) and Inverted Generational Distance (IGD). A higher HV value indicates that the obtained Pareto front is not only closest to the true theoretical front but also covers the largest solution space volume, reflecting the highest comprehensive quality of the solution set. A lower IGD value further confirms that the average distance to the true Pareto front is the smallest, demonstrating superior convergence accuracy.
I-ABC-GA also achieves the best performance in Spacing (SP), indicating the most uniform distribution of solutions along the Pareto front, which provides decision-makers with a set of well-distinguished and meaningful alternatives. Although it slightly underperforms SPEA2 in Spread, the value remains low. Combined with its highest HV, this suggests that I-ABC-GA maintains extensive coverage across the entire Pareto front while achieving more uniform distribution in high-quality regions—a highly desirable trait.
The average computation time of I-ABC-GA is moderate, significantly faster than that of MOEA/D and SPEA2, and slightly slower than that of MOSPO. However, the improvement in solution quality it offers is substantial. This demonstrates that I-ABC-GA achieves a remarkable performance advantage at an acceptable computational cost, striking an effective balance between efficiency and utility. The benchmark results fully validate the effectiveness and superiority of the I-ABC-GA algorithm in solving the complex multi-objective layout optimization problem for PV-ESS systems under minimally invasive constraints.
To thoroughly validate the generalizability and stability of the proposed I-ABC-GA algorithm for solving the PV-ESS layout optimization problem in existing buildings, a rigorous statistical performance evaluation was conducted. Detailed analysis based on 30 independent runs demonstrates the algorithm’s exceptional robustness. The mean hypervolume (HV) of the final solution set reached 0.781 with a standard deviation of only 0.011. This very low variance is a key indicator of stability, strongly indicating that regardless of initial conditions, I-ABC-GA consistently converges to high-quality solution sets with highly similar performance. The results are independent of initial population randomness, demonstrating high repeatability and reliability, and effectively eliminating concerns that the outcomes were obtained by chance.
This stability serves as a crucial foundation for assessing its generalizability. The low fluctuation observed across multiple runs confirms that the algorithm’s performance is not a coincidental optimization for specific data or initial settings, but rather that its internal mechanism is universally applicable to different scenarios of the problem. Furthermore, after merging the Pareto fronts from all runs, the excellent Spacing (0.074) and Spread (0.705) metrics statistically confirm that the solution set simultaneously exhibits high uniformity and broad coverage. This implies that the algorithm is not only stable but also provides decision-makers with a comprehensive, diverse, and evenly distributed set of non-dominated solutions, ensuring that reliable optimal choices are available under various preferences and weighting schemes.
Table 3 Training Parameter Settings for the TD3-Based Optimization of Flexible Energy Management Strategy. To support the scientific training of the flexible energy management agent for the existing building’s PEDF systems, the adopted TD3 algorithm parameters were meticulously designed around “dynamic temporal adaptation, multi-objective synergy, and operational constraint compatibility”.
The settings for iterations and replay buffer size are sufficient to cover the building’s full load cycle across multiple weather scenarios, ensuring the agent learns complete dynamic interaction patterns. The reasonably set differentiated learning rates for the policy and value networks help avoid oscillations in PV-ESS power control while accelerating the convergence of the multi-objective value function. Ornstein–Uhlenbeck noise simulates PV/load disturbances while constraining power surges. Delayed updates and soft updates adapt to the building’s slow dynamics. The discount factor facilitates the trade-off between cross-temporal rewards and costs.
These synergistic parameters deeply resonate with the dynamic characteristics, multi-objective demands, and minimally invasive operational constraints of the existing building’s PV-ESS systems, constructing a rigorous algorithmic framework for agent training.
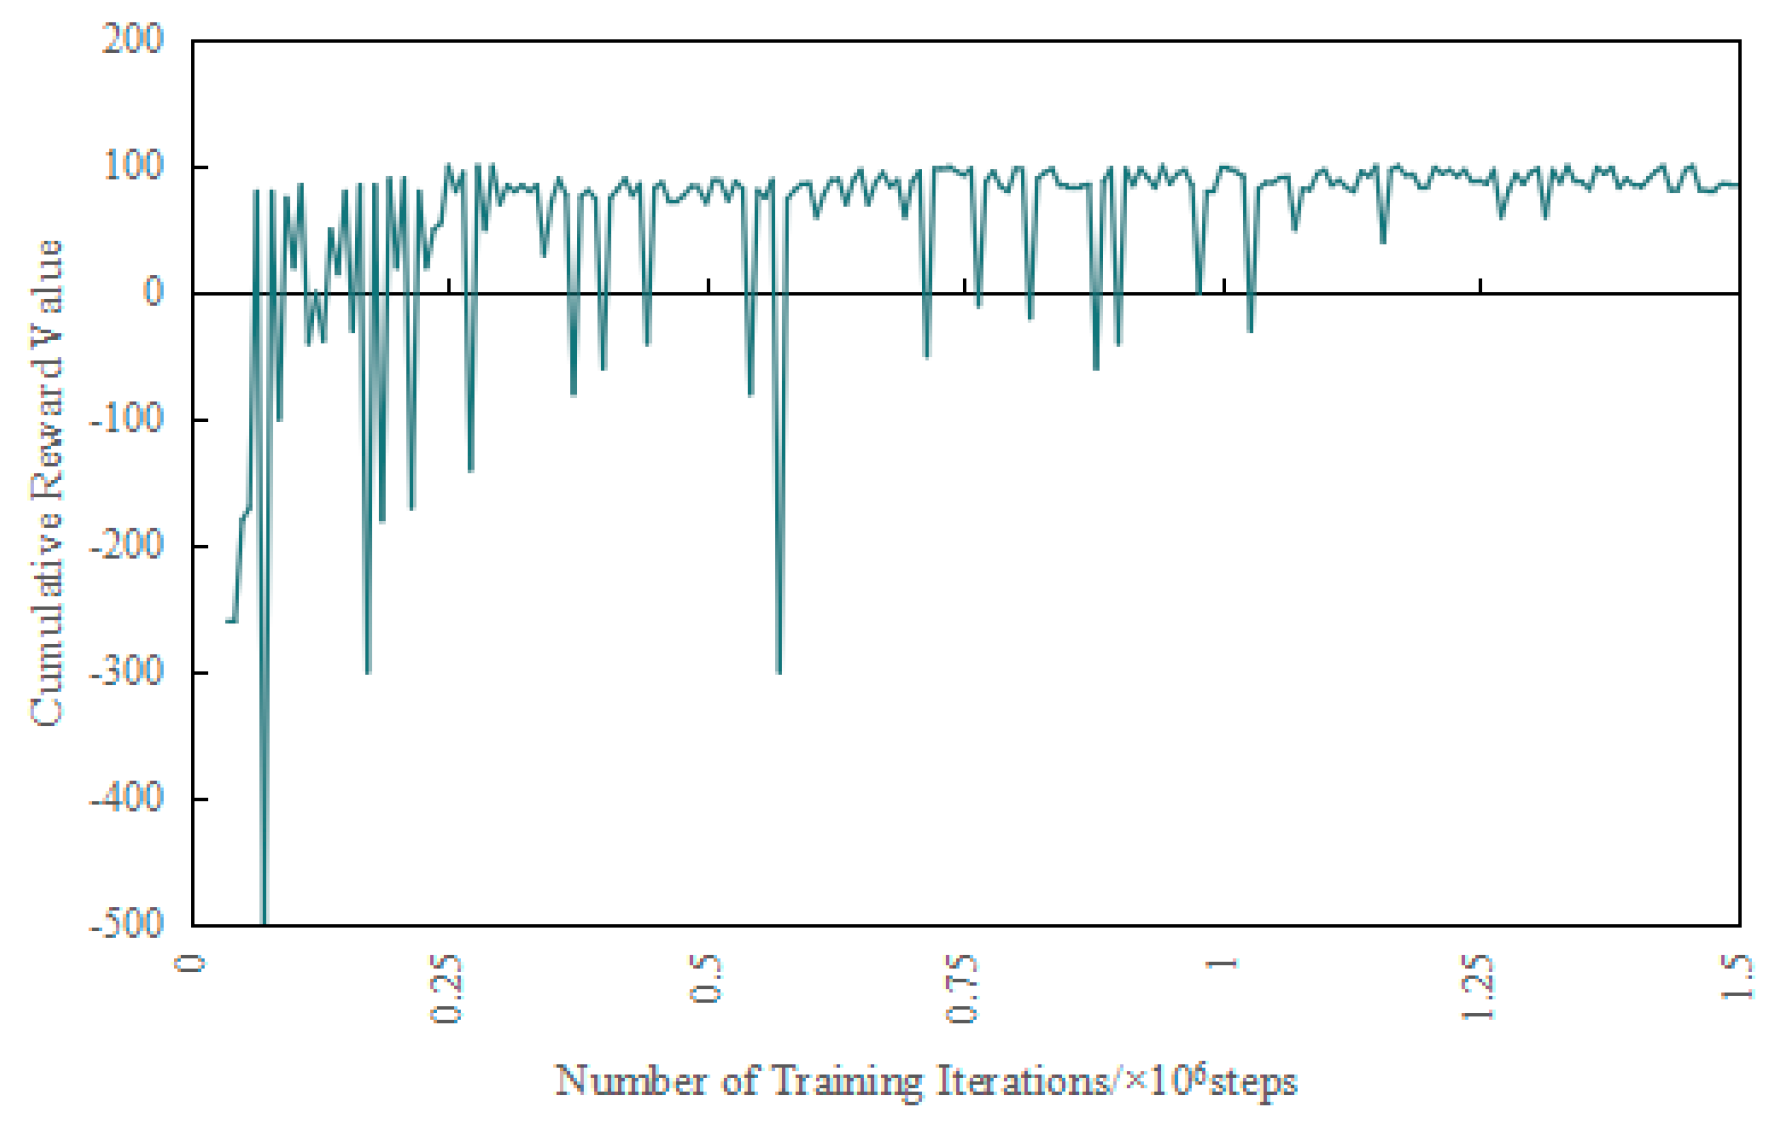
The PEDF systems in existing buildings face the training dilemma of “strongly coupled multi-constraints and dynamic multi-objective trade-offs.” Traditional control strategies struggle to adapt to the continuous action space and slow dynamic characteristics. Therefore, the TD3 algorithm was used to train the flexible energy management agent, and the cumulative reward curve was analyzed to interpret learning convergence. In Figure 9, the reward curve shows a phased characteristic of “exploratory oscillation → convergent stability”.
During the exploration phase (first ~2 × 10⁵ iterations), driven by noise and attempting “random charge/discharge strategies,” the agent frequently triggered penalty terms for distribution overcurrent and battery lifespan degradation, causing the reward to plummet to the −500 range. This phenomenon profoundly exposes the nonlinear penalty mechanism imposed by multi-constraint coupling on RL: a short-term action error, like erroneous battery charging during peak hours, can trigger compound penalties of “distribution safety fines + accelerated battery degradation,” highlighting the training challenge RL faces in the slow-dynamic system of existing buildings. After exceeding 1 × 10⁶ iterations, the reward stabilizes within the 100 ± 20 range, with fluctuation amplitude narrowing to within the control threshold of the smoothed noise variance. This signifies the agent’s convergence to the multi-objective Pareto optimal region. From a strategy efficacy perspective, the stable positive reward validates that the agent has learned a synergistic strategy of “PV direct supply + storage discharge during peak hours, and rational charging during off-peak hours,” precisely aligning with the paper’s goal of “spatial layout—operational strategy co-optimization” for energy efficiency improvement. From a constraint adaptation perspective, the absence of cliff-like drops in reward proves the strategy strictly satisfies operational constraints like distribution voltage drop ≤5% and storage charge/discharge cycles ≤ 500 cycles/year, avoiding risks to the building structure. From an algorithmic logic perspective, the convergence speed and steady-state performance retrospectively support the scientific rationale of the paper’s designed “multi-objective reward weights” and “long iteration, large replay buffer” training parameters, validating the TD3 algorithm’s suitability for the existing building PV-ESS system’s scenario of “continuous action space, slow dynamics, and multi-constraint coupling.”
Although the steady increase in cumulative reward intuitively reflects the agent’s learning of an effective policy, the internal stability of the training process requires further validation through more profound metrics. To this end, we monitored the evolution of the mean squared error (MSE) loss of the Critic network and the gradient norms of the Actor network throughout training.
Internal monitoring data reveal that the estimation errors of the two Critic networks were initially high and exhibited significant fluctuations, corresponding to the phase where the agent explored the environment and accumulated experience. As training progressed, the loss values decreased rapidly and eventually stabilized with low-amplitude fluctuations. This convergence trend indicates that the Critic’s predictions of Q-values became increasingly accurate and consistent, providing a stable and reliable foundation for policy updates in the Actor network. This serves as a core indicator of a stable learning process.
We further analyzed the variation in policy gradient norms, which reflect the magnitude of policy parameter updates in each iteration. The overall trend showed a gradual decrease and eventual stabilization as training advanced. This suggests that in the later stages, the agent had converged to a high-performance policy region, with subsequent updates constituting fine-tuning rather than large, disruptive changes.
Together, the cumulative reward, Critic loss, and policy gradient norms provide compelling evidence—from both external performance and internal dynamics—that our TD3 agent did not learn a fragile policy by chance. Instead, it converged to a high-performance and reliable final control policy through a stable and controllable learning process.

4.3. Analysis of the Impact Mechanism of Key Characteristics on Energy Efficiency Benefits

To quantify the independent influence and mechanism of the “source-storage-layout” characteristics, a controlled variable experiment was conducted to analyze the impact of each dimension on the probability distribution of energy efficiency benefits.
Regarding PV Output Volatility (Figure 10a), with “irradiance fluctuation rate” as the variable, for every 5% increase in volatility, the peak of the energy efficiency benefit distribution decreases by 0.25 percentage points, and the distribution variance expands by 35%. The core mechanism is as follows: under high volatility, the temporal matching degree between PV generation and load drops from 85% to 65%, leading to a 15% increase in PV curtailment rate and a 20% increase in redundant storage charge/discharge cycles, doubly weakening the energy-saving potential of “PV direct supply + peak-valley arbitrage.” For instance, a sudden 30% PV drop at 14:00 on a cloudy day forces the BESS to discharge urgently for compensation, but due to “temporal misalignment,” the discharge power mismatches the load demand, further reducing revenue stability. Regarding Storage Charge/Discharge Strategy Flexibility (Figure 10b), with the “charge/discharge power regulation range” as the variable, when flexibility increases by 30%, the peak of the energy efficiency benefit distribution jumps by 1.2 percentage points, and the distribution peak width narrows from 1.5% to 0.8%. The essence is as follows: highly flexible strategies can precisely capture ToU price differentials and periods of PV curtailment, achieving a closed loop of “valley charging → peak discharging” arbitrage. Simultaneously, with a response speed of ≤5 s, it compensates for PV fluctuation gaps, increasing the “spatiotemporal transfer value” of storage from 60% to 85% and significantly compressing revenue variance. Regarding PV-ESS Minimally Invasive Layout Synergy (Figure 10c), with the “equipment-load distance” as the variable, a 20% increase in synergy boosts the peak of the energy efficiency benefit distribution by 0.6 percentage points and increases distribution concentration by 45%. The key lies in the following: close-proximity deployment directly releases potential by reducing distribution losses. More importantly, with a distribution delay of ≤20 ms, it reduces the storage strategy execution error from 15% to 5%, enhancing the temporal synchronization of “PV direct supply—storage compensation.” This proves that “spatial layout is the physical foundation for the effectiveness of operational strategies.”
The experiment further reveals the “coupling gain effect” of source-storage-layout, supporting the paper’s innovative logic of “spatial-strategy synergy” from the perspective of probability distributions: When high layout synergy + high storage flexibility cope with high PV volatility, the energy efficiency benefits exhibit “stable mean, narrowed variance” characteristics—the “low loss + high response precision” of layout synergy offsets the “curtailment + temporal mismatch” losses from source-side volatility; the “rapid power compensation” of storage flexibility can fill a 30% PV power drop within 10 s, avoiding load transfer to the grid. Conversely, optimizing only a single dimension results in a benefit distribution with the flaw of “illusory high peak, poor stability,” because the loss lag and power attenuation from long-distance distribution cause a disconnect between strategy control and actual power response, exposing the core principle that “strategy effectiveness relies on spatial layout support.”
This coupling effect quantitatively validates the scientific merit of the paper’s “spatial layout—operational strategy co-optimization”: spatial proximity deployment constructs the “low loss, high response” physical foundation, while flexible energy management exploits the dynamic potential of “spatiotemporal arbitrage, fluctuation compensation.” Their synergy increases energy efficiency benefits in high-volatility scenarios by 0.4 percentage points and improves stability by 60% compared to a single high-flexibility strategy, profoundly illustrating the engineering value of “integrated consideration of spatial constraints and operational efficacy.”
To systematically evaluate the robustness and practical potential of the proposed PEDF system optimization framework, we expanded the scope of the sensitivity analysis, focusing on the impact of fluctuations in two key variables—electricity price structure and load profiles—on system economic performance and grid interaction. The analysis results are summarized in Table 4.
As shown in Table 4, when the electricity pricing mechanism switched from time-of-use to real-time pricing, the daily operational cost decreased significantly by 15.2%. This result strongly indicates that the trained TD3 agent does not simply rely on predefined tariff rules but possesses powerful real-time decision-making and adaptive capabilities, enabling it to accurately capture finer-grained electricity price fluctuations and perform optimization. This demonstrates the strategy’s significant potential for application in future flexible electricity markets.
When the application scenario shifted from office buildings to residential and commercial buildings with distinctly different load characteristics, the proposed framework exhibited strong adaptability. Although absolute economic performance varied due to differences in base energy consumption, the system operated effectively across all scenarios. Notably, its core grid interaction benefits remained consistently high (stable within the 28–31% range), and the PV self-consumption rate was maintained above 65%. This confirms a key advantage of the proposed method: its optimization capability stems from the synergistic “layout-operation” co-optimization core rather than being tied to a specific load profile. As long as the load exhibits identifiable periodic fluctuations, the agent can learn to generate efficient strategies, demonstrating strong generalization capability.
To quantitatively evaluate the comprehensive performance of the trained TD3 agent in actual operation, we conducted a statistical analysis of its year-round operational data. The key performance metrics are summarized in Table 5. These indicators go beyond the reward curve obtained during training and directly reflect the practical benefits after deployment.
As shown in Table 5, the agent achieved a significant cost reduction of 18.7%, attributable to two core capabilities: accurately suppressing load and discharging the battery during high-price periods, and charging the battery during low-price periods. It achieved a high PV self-consumption rate of 86.5%, indicating effective minimization of green energy waste. Through intelligent scheduling of loads and energy storage, the agent enabled most PV power to be consumed locally, greatly enhancing the building’s energy self-sufficiency.
A peak-to-valley reduction rate of 31.2% confirms that the agent serves as a proactive grid-friendly unit, effectively performing peak shaving and valley filling. More importantly, the low standard deviation of grid injection power (4.8 kW) demonstrates very smooth power exchange with the grid. This indicates that the agent not Pursues economic benefits but also uses energy storage to mitigate the randomness and intermittency of PV output, providing valuable voltage stabilization and smoothing effects for the grid—an outcome difficult to achieve with traditional strategies.
Furthermore, the agent does not sacrifice device health for performance. With an average daily battery cycle count of 0.82, it naturally avoids frequent deep discharges, adopting a shallow cycling strategy conducive to extending battery life. This reflects the long-term foresight incorporated into the reward function design.
These quantitative metrics fully demonstrate that the trained TD3 agent acts as a high-performance decision-making engine capable of delivering substantial economic benefits, high renewable energy consumption, effective grid support, and improved equipment longevity. Its multi-objective optimization capability well aligns with the core requirements of PEDF systems.

4.4. Comprehensive Performance Verification and Benefit Evaluation of the PEDF Systems

Given the significant heterogeneity in load characteristics across office, commercial, and public functional areas of existing buildings, traditional strategies often lead to diminished benefits due to a lack of adaptation to these patterns. Therefore, a gradient comparison system of “Traditional Constant Power → Time-of-Use Price Response → Deep Reinforcement Learning” was constructed to analyze the coupling gains between scenario and strategy.
Table 6 presents the multi-dimensional performance comparison of energy management strategies for the PEDF systems in various functional areas of an existing building. For the office area characterized by a “9:00–18:00 double peak + noon valley,” the proposed TD3 strategy, through “load model embedding + PV-ESS temporal phase-locking,” pushes the energy saving rate to 21.3% (a 13.1% increase over traditional constant power control), reduces operational cost to 82.6 ¥/day (7.6 ¥ lower than standard TD3), and increases the proportion of valley charging by 15%. The core lies in the algorithm’s precise capture of the temporal coupling between the “9:00 morning peak—12:00 PV peak—14:00 load rebound,” enabling deep matching between storage dispatch and PV output. The peak-valley difference reduction rate reaches 38.7% (7.3 percentage points higher than DDPG), validating the “capability of scenario-specific strategies to mitigate rigid peak-valley patterns.” For the commercial area with “10:00–22:00 multi-peak + random fluctuations,” the proposed TD3 strategy targets the “11:00 noon peak, 18:00 evening peak + random pedestrian flow disturbances,” achieving an energy saving rate of 20.1% (a 13.6% increase over traditional control), an operational cost of 125.8 ¥/day (12.7 ¥ lower than standard TD3), and a 20% increase in the proportion of storage discharge during peak periods. The key is the algorithm’s integration of a “dynamic peak-valley identification + rapid power response” mechanism, maintaining a temporal closed loop of “PV direct supply—storage compensation—grid supplementation” in multi-peak scenarios. A training time of 1500 epochs highlights its “strategy generalization capability in volatile scenarios.”
Cross-functional area comparison reveals that the proposed TD3 strategy, by leveraging “functional area load model embedding + coupling with PV-ESS minimally invasive layout constraints,” achieves multi-dimensional performance superiority across “peak-valley, multi-peak, and continuous” scenarios, supporting the paper’s argument of “cross-area replicability of comprehensive benefits.”
In terms of benefits: Energy saving rates all exceed 20% (2.5–3.2 percentage points higher than standard TD3); operational cost reduction reaches 10–15%; peak-valley difference reduction rates exceed 34% (6.5–7.3 percentage points higher than DDPG); carbon reduction exceeds 35 kgCO2/day (over 15 kg more than traditional strategies), verifying “cross-area consistency in multi-objective synergy.” Furthermore, the proposed TD3 customizes three regulation logics for different area characteristics: ① Office Area: PV noon peak direct supply + storage pre-charging; ② Commercial Area: Multi-peak identification + rapid response; ③ Public Area: Stable SOC regulation under continuous load. Compared to the non-adapted standard TD3, the proposed strategy shows significant advantages in training efficiency, response delay, and multi-objective balance, proving the universality of the “integrated optimization of spatial layout—functional area characteristics—reinforcement learning strategy.” This provides quantitative basis for the benefit replicability of cross-scenario deployment of the PEDF systems in existing buildings, deepening the argument of “multi-dimensional comprehensive benefit evaluation.”
Addressing the pain points of local energy waste and grid-side impact in existing buildings caused by “steep load peaks and temporal mismatch between PV output and load,” the experiment analyzes the building-side cooperative regulation efficacy of the PEDF systems through Figure 11a. Driven by the TD3 strategy, PV output directly supplies air conditioning and equipment loads during peak hours (9:00–16:00). The storage system precisely captures the temporal coupling between “load peaks and PV output valleys,” compensating for gaps with a 3 MW discharge power. This reduces the building-side maximum demand from 12 MW to 8 MW and narrows the load peak-valley difference from 10 MW to 5 MW. This process not only reduces annual capacity charges by 150,000 CNY but also constructs a “smooth load profile,” laying the physical foundation for grid-friendly interaction. The peak-shaved load curve transforms from “sharp pulsed peaks” to “gentle waves,” directly reducing the response pressure on grid-side power regulation, validating the core logic that “building-side cooperation is a prerequisite constraint for grid-friendliness.”
Focusing on the dual pain points of “peak heavy loading reducing grid-side margin and PV backfeed impacting voltage” in existing buildings, Figure 11b reveals the grid-side interaction optimization of the PEDF systems. Compared to the adverse characteristics of “sharp heavy loading + deep backfeed” under constant power control, the proposed TD3 strategy stabilizes the incoming line power within a ±5 MW range, achieving a 75% reduction in the peak-valley difference. The core mechanism stems from the “closed-loop regulation between building-side cooperation and grid-side strategy”: The stabilized 8 MW demand after building-side peak shaving is further dispatched by the algorithm—the local consumption rate of surplus PV power increases from 60% to 85%. The storage system, by “discharging during peaks to reduce grid supply power and charging during valleys to absorb off-peak grid energy,” achieves flattened control of the incoming line power. This optimization reduces the grid-side voltage deviation rate from 15% to 5% and narrows frequency fluctuations from ±0.5 Hz to ±0.2 Hz, completely reversing the adverse grid-side interaction of “heavy loading-backfeed alternating impact” in the existing building. It quantitatively validates the grid-friendliness transition of the PEDF systems “from building-side load regulation to grid-side power flattening.”
To empirically evaluate the advantages and feasibility of the proposed minimally invasive PEDF retrofit strategy, a multi-dimensional quantitative comparison was conducted to objectively assess its comprehensive benefits in economic, energy-saving, and engineering implementation performance relative to conventional approaches. As shown in Table 7, the three schemes exhibit a clear performance gradient.
Scheme C (the proposed method) requires the lowest initial investment, reducing total costs by 36.5% and 15.9% compared to Scheme A (conventional full retrofit) and Scheme B (hybrid conservative system), respectively. This advantage stems primarily from its minimally invasive nature: through algorithmic layout optimization, the scheme maximizes the use of existing cable ducts and conduits, avoiding the high material and labor costs associated with large-scale wall demolition and equipment replacement. Consequently, the installation period is also the shortest, minimizing disruption to building operations—a highly valuable feature for buildings sensitive to construction timelines, such as hospitals, data centers, and office buildings.
Despite the lowest investment, Scheme C achieves the highest annual energy savings and carbon emission reductions. This demonstrates the value of the core innovation of this study—co-optimization. Schemes A and B adopt a decoupled design and operation strategy, leaving energy-saving potential underexploited. In contrast, the integrated design of the proposed approach enables optimal equipment placement and intelligent flexible operation strategies to reinforce each other, creating a synergistic effect that maximizes energy efficiency.
Regarding net electricity purchase during peak hours, Scheme C reduces consumption by 20.2% compared to Scheme A. This confirms that its flexible energy management strategy not only optimizes its own performance but also more effectively shaves peak load and fills valleys, thereby smoothing grid load fluctuations. These results indicate that the proposed solution serves not only as an efficient energy saver but also as a grid-friendly prosumer with the potential to participate in demand response and other ancillary services, opening avenues for additional revenue streams.

5. Discussion

This study systematically investigated the optimal design and operational strategies for PEDF systems in existing buildings by constructing a co-simulation environment integrating hardware, software, and data. The results offer significant theoretical and practical implications.
First, the developed co-simulation environment, supported by a high-precision computing platform and multi-physics coupling methods, successfully addressed key modeling challenges in existing building retrofits, such as complex physical constraints and strong dynamic variations. This environment provides a reliable benchmark for subsequent optimization research. Moreover, by establishing a carbon emission baseline for the existing building, this study quantitatively reveals—for the first time—the carbon emission patterns of building stocks during peak hours (when reliance on fossil-fueled power generation is high) and during periods of untapped photovoltaic potential. This analysis provides clear emission reduction targets and a scientific benchmark for retrofit planning.
At the optimization methodology level, this study achieves co-innovation in both spatial layout and operational strategy. The proposed I-ABC-GA algorithm incorporates multiple constraints—including structural safety, pathway reuse, and equipment loading—to achieve multi-objective Pareto-optimal planning of PV-ESS systems with minimal invasiveness. This approach significantly improves the PV self-consumption rate and system integration level. Furthermore, by embedding the building’s slow dynamics and distribution network constraints into the training process of the TD3 algorithm, we developed a scenario-adaptive reinforcement learning strategy. This strategy demonstrates excellent energy-saving performance and convergence properties across different functional building types. The proposed “spatial-strategy” co-optimization framework overcomes the typical limitations of prior studies, such as narrow optimization objectives and a disconnect between algorithmic design and physical context, offering a systematic solution for efficient design and intelligent dispatch of PV-ESS systems in existing buildings.
Mechanism analysis shows that the performance of PEDF systems strongly depends on the coupling among the source, storage, and layout. PV volatility negatively affects system benefits, while storage flexibility and layout synergy can substantially enhance system robustness and control precision. Through probabilistic distribution analysis, this study is the first to quantitatively reveal the nonlinear interactions among these factors. It demonstrates that combining a high-synergy layout with high-flexibility storage can effectively mitigate the adverse effects of PV fluctuations. This finding provides deeper insight into the operational mechanisms of PEDF systems and offers methodological support for the co-optimization of complex multi-factor energy systems.
The proposed co-optimization framework exhibits strong potential for scalability to multi-building clusters or community-level applications, a critical step for achieving district-wide decarbonization. From a technical perspective, the modular hardware design and decentralized control architecture inherent in our approach allow for seamless integration across multiple heterogeneous buildings. The optimization models can be extended to a distributed decision-making context, where the I-ABC-GA algorithm could coordinate Pareto-optimal equipment siting and DC microgrid routing across the entire cluster, while a multi-agent DRL scheme could be deployed to manage energy exchanges between buildings and with the main grid. Such a system would not only pool diverse load profiles and generation resources to enhance overall flexibility and self-consumption but also create new value streams through coordinated community-level grid services, such as aggregated demand response and regional peak shaving. Economies of scale in procurement and installation would likely drive down the normalized capital cost per building, while the enhanced coordination would further optimize operational economics and improve renewable integration. Future work will explicitly focus on formulating this multi-building coordination problem and validating the scalability of the proposed algorithms in a larger-scale simulation environment.
While the preceding experiments are based on simulations of a single building type, which somewhat limits the generalizability of the conclusions, the core methodology of “co-optimization of spatial layout and operational strategy” proposed in this study offers universal guiding principles. Nevertheless, its practical implementation requires tailored adjustments for different building scenarios due to significant variations in load profiles, operational schedules, and energy demands.
For example, in residential buildings, the main challenge lies in the high stochasticity of loads and the unpredictability of occupant behavior. This necessitates a flexible energy management agent with stronger generalization capabilities, possibly incorporating online or transfer learning to adapt to diverse household patterns. The reward function should emphasize the trade-off between comfort and economy rather than focusing solely on energy savings. In educational buildings, challenges arise from strong seasonal and periodic variations. The operational strategy must support long-term planning to optimize switching between holiday and semester modes. The capacity configuration and operation strategy of the energy storage system must be re-optimized to address extended low-load periods and avoid prolonged battery inactivity. For continuously operated buildings such as shopping malls or data centers, key challenges include high reliability requirements and nearly constant cooling, heating, and electricity loads. System optimization should shift emphasis from economy to resilience and availability, with reward functions incorporating power supply reliability metrics. The layout of the PV-storage system should also prioritize emergency power supply paths for critical loads.
Therefore, although the proposed framework offers a general technical pathway, its application to specific building types requires a scenario-specific adaptation process, including: (1) redefining the reward function to align with the target scenario’s priorities; (2) retraining or fine-tuning the DRL agent using typical data from the target scenario; and (3) adjusting layout constraints to comply with the physical and safety regulations of the new scenario. Future work will focus on developing a meta-learning or transfer learning framework to enable agents trained in office buildings to rapidly adapt to new and unknown building environments, thereby facilitating large-scale deployment and universal application of the proposed methodology.
Furthermore, building complexity such as unanticipated thermal bridges, deviations from architectural plans, or non-ideal existing wiring conditions that are not fully captured in our digital twin could lead to discrepancies between the simulated and actual energy loads. This would primarily affect the accuracy of the predicted energy saving rate and the peak load reduction calculations, as the optimized system might encounter electrical or thermal demands that differ from our models. Equipment aging, particularly the progressive degradation of PV panel efficiency and the reduction of battery storage capacity and round-trip efficiency over time, would directly impact the long-term economic and technical outcomes. Our reported operational cost savings and energy self-consumption rate are based on initial performance characteristics. Aging would likely cause a gradual decline in these annual performance metrics, potentially altering the return on investment and necessitating more dynamic long-term operational strategies. Stochastic occupant behavior introduces unpredictable fluctuations in plug loads, lighting, and HVAC use, creating a source of noise that our offline-trained DRL agent has not been explicitly exposed to. This could temporarily reduce the agent’s effectiveness in real-time decision-making, particularly in minimizing grid interaction costs through arbitrage. The agent’s performance in smoothing power fluctuations and its generalizability could be challenged by these unforeseen load patterns.
While these factors represent a limitation of the current study, we would like to emphasize that our proposed co-optimization framework possesses inherent strengths that provide a foundation for addressing these uncertainties. The minimally invasive layout reduces dependency on perfect structural assumptions. More importantly, the data-driven, learning-based nature of the DRL agent suggests a clear pathway for adaptation. Future work will focus on enhancing robustness by integrating stochastic optimization techniques during the layout phase to account for uncertainty ranges, embedding equipment degradation models into the operational strategy for lifecycle assessment, and implementing online learning or transfer learning mechanisms to allow the agent to continuously adapt its policy based on real-world operational data, thereby bridging the gap between simulation and practice.

6. Conclusions

Addressing the practical needs of green, low-carbon retrofitting in existing buildings, this paper proposes a co-optimization design and benefit evaluation method for PEDF systems. It specifically tackles the key challenge of co-optimizing “spatial layout and operational strategy” under minimally invasive constraints. By constructing a co-simulation environment that integrates physical structure and operational characteristics, a carbon emission baseline aligned with real-world building conditions was established. This provides a reliable evaluation benchmark and clear emission reduction targets for building stock retrofits.
At the methodological level, this study developed an I-ABC-GA algorithm to achieve a Pareto-optimal layout for PV-ESS systems under multiple constraints, including equipment loading, pathway reuse, and structural safety. Additionally, by incorporating the building’s slow dynamic characteristics and distribution network constraints into a TD3 reinforcement learning algorithm, a flexible energy management strategy was trained that adapts to different functional building scenarios. This significantly improves the system’s energy saving rate, economic performance, and operational robustness.
Case study results show that the proposed co-optimization method performs excellently across office, commercial, and public building scenarios. It achieves an energy saving rate exceeding 20% and reduces operational costs by 10–15%. Furthermore, it significantly enhances building–grid interoperability: peak demand is reduced by 33%, power fluctuations are narrowed by 75%, and voltage deviation remains below 5%. These results demonstrate strong grid-friendliness and engineering applicability. At the mechanism level, probabilistic analysis revealed a nonlinear coupling mechanism among “source-storage-layout” factors, indicating that high-synergy layout combined with high-flexibility strategies can effectively suppress the negative effects of PV volatility. This insight provides a theoretical basis for co-designing complex energy systems.
The main contribution of this research lies in providing a systematic solution for minimally invasive implementation, multi-objective synergy, and cross-scenario adaptation in PEDF-based building retrofits. It offers a quantifiable, replicable, and scalable technical pathway along with decision support for the low-carbon transition of building stocks. Although this study validates the effectiveness and superiority of the proposed co-optimization framework through simulation, we openly acknowledge several implementation challenges and limitations that may arise in practical engineering deployment. These issues represent important directions for our future research.
Sensing and State Estimation Requirements: The proposed flexible energy management strategy relies heavily on accurate, high-frequency perception of the global system state. In practice, this necessitates the deployment of a dense and highly reliable sensor network and data acquisition system. The initial investment, communication latency, and maintenance costs present practical barriers to achieving plug-and-play applicability.
Computational Load for Real-Time Control: Although the trained DRL agent requires minimal inference time during execution—meeting real-time control demands—its offline training process is computationally intensive and must be performed on high-performance servers. Future research should explore lightweight model design, transfer learning, and edge computing deployment to reduce reliance on centralized computational resources.
Integration Challenges with Conventional Electrical Systems: Existing buildings often feature traditional electrical distribution systems not designed for plug-and-play DC microgrid integration. Therefore, achieving safe and seamless switching between old and new systems, re-coordinating relay protection settings, and ensuring protocol and data interoperability with existing building automation or energy management platforms constitute unavoidable complexities in practice, requiring interdisciplinary collaborative design.
Cost of Generalizability Across Building Types: Although the framework is generalizable, applying it to new contexts such as residential or commercial buildings requires additional data collection and model fine-tuning tailored to their specific load profiles and operational patterns. This process still demands significant manual intervention and domain expertise. Developing an automated and adaptive cross-domain deployment framework is essential for large-scale implementation.

Author Contributions

C.J.: Writing—original draft, Visualization, Data curation. L.Y.: Software, Methodology, Conceptualization. J.Z.: review and editing, Supervision, Project administration, Funding acquisition. W.J.; C.Z. and Y.L.: Writing—review and editing, Project administration, Conceptualization. All authors have read and agreed to the published version of the manuscript.

Funding

This work was supported by the National Natural Science Foundation of China (Grant No. 52507039). The authors would like to express their sincere gratitude to the China University of Mining and Technology, and specifically to the State Key Laboratory of Power Electronics and Electric Drive, for providing essential hardware/software support, experimental conditions, and a productive research environment. We are also grateful to Gree Electric Appliances, Inc. for their strong technical support and for providing a demonstration platform based on the PEDF system, which offered significant practical insights and validation for this research. Special thanks are extended to Prof. Chun Gan from Huazhong University of Science and Technology, Prof. Xiaojie Wu, and Prof. Rui Liang from China University of Mining and Technology for their invaluable modeling guidance, constructive discussions, and data support throughout this study.

Data Availability Statement

The datasets used and/or analyzed during the current study are available from the corresponding author on reasonable request.

Conflicts of Interest

The authors declare that they have no known competing financial interests or personal relationships that could have appeared to influence the work reported in this paper.

References

  1. Shi, Y.; Chen, P.F. Energy retrofitting of hospital buildings considering climate change: An approach integrating automated machine learning with NSGA-III for multi-objective optimization. Energy Build. 2024, 319, 114571. [Google Scholar] [CrossRef]
  2. Liu, X.; Liu, X.; Jiang, Y.; Zhang, T.; Hao, B. Photovoltaics and Energy Storage Integrated Flexible Direct Current Distribution Systems of Buildings: Definition, Technology Review, and Application. CSEE J. Power Energy Syst. 2023, 9, 829–845. [Google Scholar] [CrossRef]
  3. Li, T.; Ye, P.; Wang, H.; Liu, W.; Huang, X.; Ke, J. Optimization and Evaluation of the PEDF System Configuration Based on Planning and Operating Dual-Layer Model. Appl. Sci. 2025, 15, 7776. [Google Scholar] [CrossRef]
  4. Amoruso, F.M.; Schuetze, T. Hybrid timber-based systems for low-carbon, deep renovation of aged buildings: Three exemplary buildings in the Republic of Korea. Build. Environ. 2022, 214, 108889. [Google Scholar] [CrossRef]
  5. Lin, Y.; Cui, C.; Liu, X.; Mao, G.; Xiong, J.; Zhang, Y. Green Renovation and Retrofitting of Old Buildings: A Case Study of a Concrete Brick Apartment in Chengdu. Sustainability 2023, 15, 12409. [Google Scholar] [CrossRef]
  6. Kertsmik, K.A.; Arumägi, E.; Hallik, J.; Kalamees, T. Low carbon emission renovation of historical residential buildings. Energy Rep. 2024, 11, 3836–3847. [Google Scholar] [CrossRef]
  7. Zhang, A.; Wang, F.; Li, H.; Pang, B.; Nie, K.; Ma, X.; Zhuang, C.; Pan, Z.; Jiang, Y.; Yang, J. A framework of carbon-negative rural housing renovation with novel heating methods and digital twin-based carbon emission monitoring. Build. Environ. 2025, 282, 113158. [Google Scholar] [CrossRef]
  8. Ahmed, A.; Mateo-Garcia, M.; Arewa, A.; Caratella, K. Integrated Performance Optimization of Higher Education Buildings Using Low-Energy Renovation Process and User Engagement. Energies 2021, 14, 1475. [Google Scholar] [CrossRef]
  9. Kertsmik, K.A.; Kuusk, K.; Lylykangas, K.; Kalamees, T. Evaluation of renovation strategies: Cost-optimal, CO2e optimal, or total energy optimal? Energy Build. 2023, 287, 112995. [Google Scholar] [CrossRef]
  10. Liu, Y.; Xue, S.; Guo, X.; Zhang, B.; Sun, X.; Zhang, Q.; Wang, Y.; Dong, Y. Towards the goal of zero-carbon building retrofitting with variant application degrees of low-carbon technologies: Mitigation potential and cost-benefit analysis for a kindergarten in Beijing. J. Clean. Prod. 2023, 393, 136316. [Google Scholar] [CrossRef]
  11. Chiradeja, P.; Thongsuk, S.; Ananwattanaporn, S.; Ngaopitakkul, A. Renovation of an Academic Building’s Envelope, Lighting, and Air Conditioning System According to Thailand Building Energy Code for Energy Consumption Reduction. Sustainability 2023, 15, 15298. [Google Scholar] [CrossRef]
  12. Prieto, A.; Armijos-Moya, T.; Konstantinou, T. Renovation process challenges and barriers: Addressing the communication and coordination bottlenecks in the zero-energy building renovation workflow in European residential buildings. Archit. Sci. Rev. 2024, 67, 205–217. [Google Scholar] [CrossRef]
  13. Fahlstedt, O.; Ramesh, R.; Hamdy, M.; Temeljotov-Salaj, A.; Rasmussen, F.N.; Bohne, R.A. Building renovation plan- introducing energy and cost into the managerial perspectives: A case study. Energy Build. 2024, 310, 114080. [Google Scholar] [CrossRef]
  14. Mpouzianas, N.; Koltsios, S.; Pastaltzidis, I.; Katsaros, N.; Giannopoulos, G.; Klonis, P.; Chatzipanagiotidou, P.; Ioannidis, D.; Tzovaras, D. Building renovation Roadmapping: An automated methodology framework for energy efficiency improvement and sustainable renovation planning. Int. J. Sustain. Energy 2024, 43, 2344508. [Google Scholar] [CrossRef]
  15. Van de Moortel, E.; Allacker, K.; De Troyer, F.; Schoofs, E.; Stijnen, L. Dynamic Versus Static Life Cycle Assessment of Energy Renovation for Residential Buildings. Sustainability 2022, 14, 6838. [Google Scholar] [CrossRef]
  16. Eksi, M.; Akarsu, R.T.; Ozcan, M. Net-zero energy building transformation: Techno-economic and environmental evaluation in the Mediterranean Region. Environ. Dev. Sustain. 2025. [Google Scholar] [CrossRef]
  17. Chen, J.L.; Stouffs, R. SE-VGAE: Unsupervised disentangled representation learning for interpretable architectural layout design graph generation. Build. Environ. 2025, 284, 113450. [Google Scholar] [CrossRef]
  18. Sharma, S.; Verma, A.; Xu, Y.; Panigrahi, B.K. Robustly Coordinated Bi-Level Energy Management of a Multi-Energy Building Under Multiple Uncertainties. IEEE Trans. Sustain. Energy 2021, 12, 3–13. [Google Scholar] [CrossRef]
  19. Chen, J.; Jing, Y.; Yang, X.; Hao, B. Research on the design optimization of energy storage system in Photovoltaic Energy storage Direct current and Flexibility (PEDF) system in buildings. In Building Simulation; Tsinghua University Press: Beijing, China, 2025. [Google Scholar] [CrossRef]
  20. Zhang, Y.; Li, T.; Liu, X.; Huang, Z.; Li, Q. Multi-Port Collaborative Control Strategy With Smooth Operational Transitions for Photovoltaics, Energy Storage, Direct Current, and Flexibility System. IEEE Trans. Power Electron. 2025, 40, 11715–11724. [Google Scholar] [CrossRef]
  21. Passoni, C.; Caruso, M.; Marini, A.; Pinho, R.; Landolfo, R. The role of life cycle structural engineering in the transition towards a sustainable building renovation: Available tools and research needs. Buildings 2022, 12, 1107. [Google Scholar] [CrossRef]
  22. Hernandez-Cruz, P.; Flores-Abascal, I.; Hidalgo-Betanzos, J.M.; Almeida, M.; Erkoreka-Gonzalez, A. Environmental and energy analysis of the renovation of social housing buildings under various climate change scenarios and user profiles. J. Build. Eng. 2024, 98, 111164. [Google Scholar] [CrossRef]
  23. Zhang, X.; Gu, Y.; Pei, W.; Jiang, Y. AC transmission network expansion planning considering cascading failures and uncertainty of wind and photovoltaic energy. Electr. Power Syst. Res. 2025, 248, 111633. [Google Scholar] [CrossRef]
  24. Sahbaz, K.; Basaraner, M. A zonal displacement approach via grid point weighting in building generalization. ISPRS Int. J. Geo-Inf. 2021, 10, 105. [Google Scholar] [CrossRef]
  25. Ospina, A.M.; Chen, Y.; Bernstein, A.; Dall’Anese, E. Learning-based demand response in grid-interactive buildings via Gaussian Processes. Electr. Power Syst. Res. 2022, 211, 108406. [Google Scholar] [CrossRef]
  26. Wang, Y.; Wang, S.; Zhao, Q.; Zhang, W. Modelling and calculation method of minimum safety distance for photovoltaic fire extinguishing under energized conditions. Sol. Energy 2025, 288, 113300. [Google Scholar] [CrossRef]
  27. Möller, M.C.; Krauter, S. Investigation of different load characteristics, component dimensioning, and system scaling for the optimized design of a hybrid hydrogen-based PV energy system. Hydrogen 2023, 4, 408–433. [Google Scholar] [CrossRef]
  28. Yang, R.; Zang, Y.; Yang, J.; Wakefield, R.; Nguyen, K.; Shi, L. Fire safety requirements for building integrated photovoltaics (BIPV): A cross-country comparison. Renew. Sustain. Energy Rev. 2023, 173, 113112. [Google Scholar] [CrossRef]
  29. Wang, X.; Wang, P.; Huang, R.; Zhu, X.; Arroyo, J.; Li, N. Safe deep reinforcement learning for building energy management. Appl. Energy 2025, 377, 124328. [Google Scholar] [CrossRef]
  30. Zhang, X.; Guo, C.; Zhou, Y.; Xu, X.; Liao, J.; Zhou, N.; Wang, Q. Unbalanced voltage suppression of bipolar DC microgrids with integration of DC zero-carbon buildings. J. Mod. Power Syst. Clean Energy 2024, 12, 1942–1956. [Google Scholar] [CrossRef]
  31. Futakuchi, M.; Takayama, S.; Ishigame, A. Scheduled operation of wind farm with battery system using deep reinforcement learning. IEEJ Trans. Electr. Electron. Eng. 2021, 16, 696–703. [Google Scholar] [CrossRef]
  32. Baccari, S.; Mostacciuolo, E.; Tipaldi, M.; Mariani, V. A deep reinforcement learning approach for energy management in low earth orbit satellite electrical power systems. Electronics 2025, 14, 3110. [Google Scholar] [CrossRef]
  33. Fan, P.; Ke, S.; Yang, J.; Li, R.; Li, Y.; Yang, S.; Liang, J.; Fan, H.; Li, T. A load frequency coordinated control strategy for multimicrogrids with V2G based on improved MA-DDPG. Int. J. Electr. Power Energy Syst. 2023, 146, 108765. [Google Scholar] [CrossRef]
  34. Wang, D.; Hu, M.Q. Deep deterministic policy gradient with compatible critic network. IEEE Trans. Neural Netw. Learn. Syst. 2023, 34, 4332–4344. [Google Scholar] [CrossRef]
  35. Chakraborty, T.; Kopp, C.; Toosi, A.N. Optimizing renewable energy utilization in cloud data centers through dynamic overbooking: An MDP-based approach. IEEE Trans. Cloud Comput. 2025, 13, 1–17. [Google Scholar] [CrossRef]
  36. Aatabe, M.; Latif, R.; Mosaad, M.I.; Hussien, S.A. Stochastic energy management of DC photovoltaic microgrids using Markov decision process. Results Eng. 2025, 27, 105835. [Google Scholar] [CrossRef]
  37. Kim, K.H.; Kim, C. Post-processing of iterative estimation and cancellation scheme for clipping noise in OFDM systems. IEICE Trans. Commun. 2023, E106-B, 352–358. [Google Scholar]
  38. Frömming, A.; Häring, L.; Czylwik, A. Spectral properties of clipping noise. Mathematics 2021, 9, 2592. [Google Scholar] [CrossRef]
  39. Xu, X.; Ling, G.; Wang, F.; Cheng, L.; Ge, M.F. Grey dispersion entropy based on truncated Gaussian whitenization function: A novel time series complexity measure. Nonlinear Dyn. 2025, 113, 8305–8327. [Google Scholar] [CrossRef]
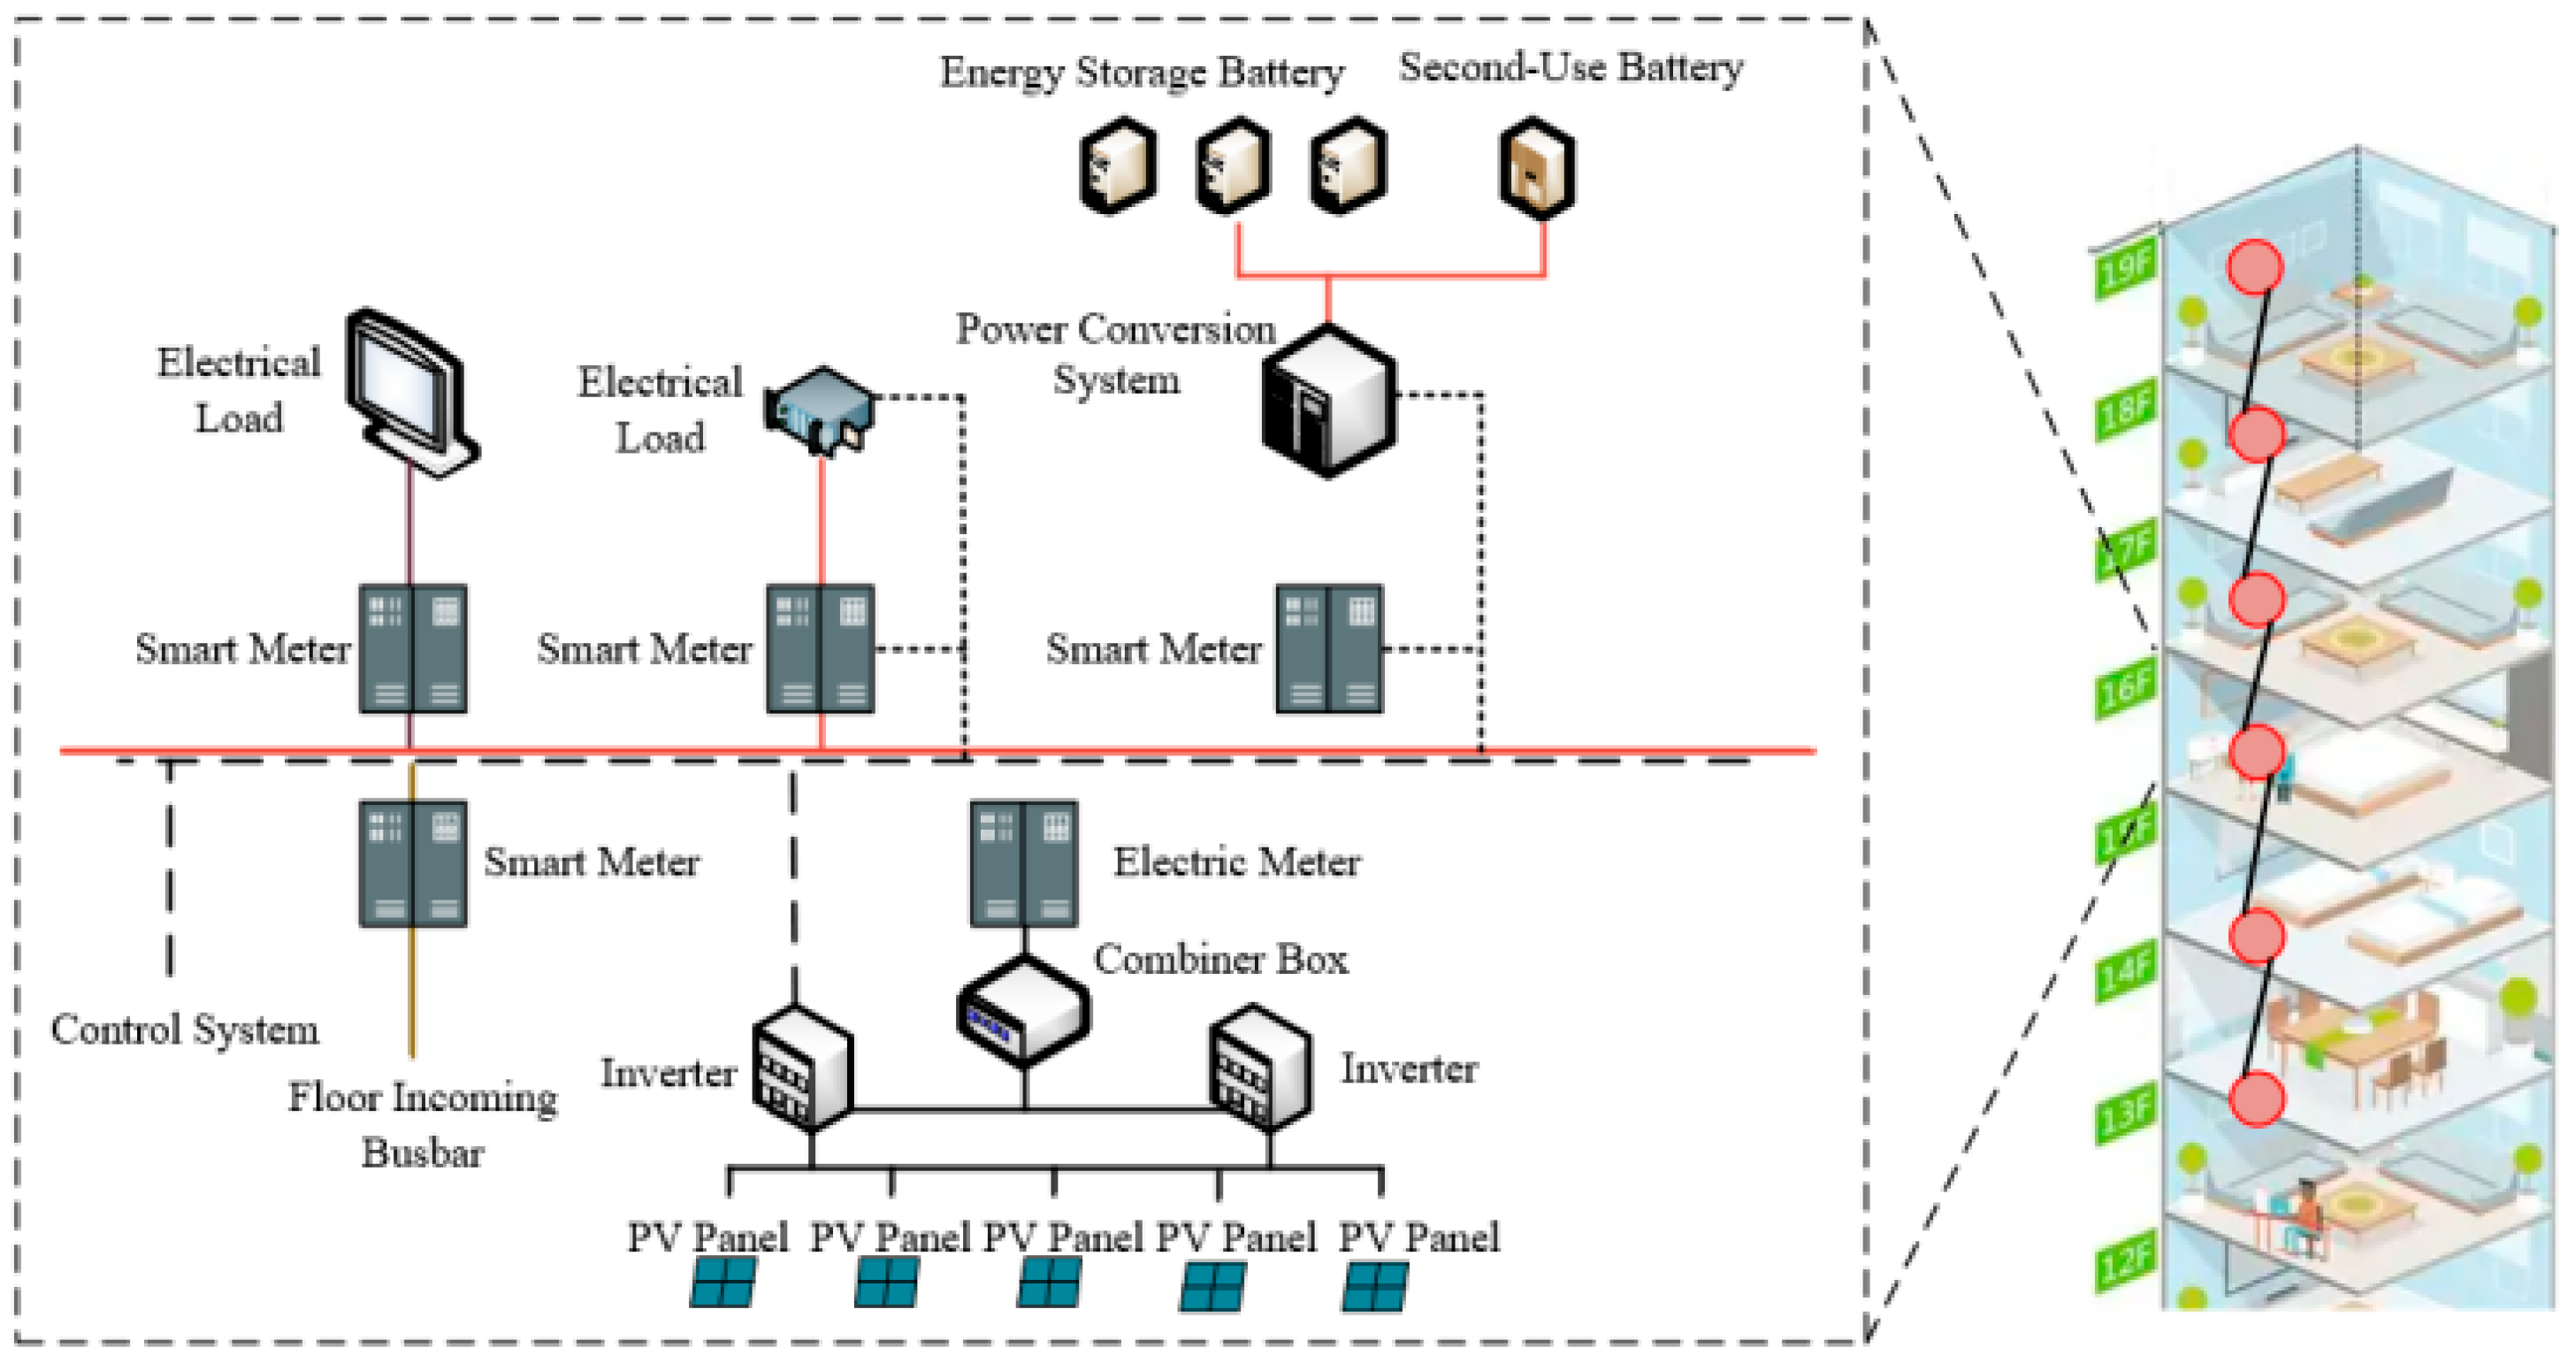
Figure 1. Basic configuration of a PEDF system in an existing building, illustrating the core components (PV generation, ESS, bi-directional converters, DC distribution network, and flexible loads) and their synergy under the management of an EMS to maximize renewable self-consumption and grid interaction through source–grid–load–storage coordination.
Buildings 15 03599 g001
Figure 2. Block diagram illustrating the construction principle of the PV-ESS layout optimization model, depicting the discretization of building surfaces into grid cells with multi-dimensional attributes (spatial, solar, and electrical) to encode equipment and pathways, thereby transforming the physical layout into a solvable combinatorial optimization problem.
Buildings 15 03599 g002
Figure 3. Strategy for simplifying the node network in the minimally invasive design of the PEDF systems: (a) The distribution path from the electricity consumption node to the PV-ESS candidate point shares a common current-carrying segment which is a bottleneck; (b) The distribution path from the electricity consumption node to the PV-ESS candidate point shares a common current-carrying segment which is NOT a bottleneck; (c) The distribution path from the electricity consumption node to the PV-ESS candidate point has no common current-carrying segments.
Buildings 15 03599 g003
Figure 4. Node network framework of the PEDF systems after node splitting, demonstrating the integration of spatial and electrical constraints to enable optimal equipment placement with minimal structural alteration through the reuse of existing pathways and adaptive node configuration.
Buildings 15 03599 g004
Figure 5. Schematic diagram of the ToU electricity price sampling method, showing the method for acquiring real-time grid price signals that serve as economic inputs for the deep reinforcement learning agent’s cost-minimizing energy dispatch decisions.
Buildings 15 03599 g005
Figure 6. Block diagram of the TD3 algorithm principle for flexible energy management of the PEDF systems in minimally invasive retrofits of existing buildings, integrating LSTM layers for temporal feature extraction and fully connected networks to generate continuous, safe control actions within operational constraints.
Buildings 15 03599 g006
Figure 7. Pre-retrofit electrical infrastructure and PEDF system carbon emission distribution of the experimental office building: (a) Partial pre-retrofit electrical system diagrams of the experimental office building. (b) Dynamic distribution of carbon emission intensity at building distribution nodes for a typical day in the PEDF systems, revealing the spatiotemporal profile of carbon emissions and highlighting strong grid dependency during peak hours alongside insufficient renewable utilization—guiding targeted decarbonization strategies.
Buildings 15 03599 g007
Figure 8. Decomposition of the whole-life-cycle comprehensive performance of different layout schemes for the PEDF systems: (a) Equipment layout; (b) Electrical pathway layout, validating the algorithm’s ability to achieve high energy performance, reliability, and minimal structural intervention through effective multi-objective co-optimization.
Buildings 15 03599 g008
Figure 9. Cumulative reward curve during TD3 training, showing the agent’s convergence to stable performance after 1 × 10⁶ steps while satisfying all operational and safety constraints, demonstrating successful learning of an efficient cooperative charging/discharging strategy.
Buildings 15 03599 g009
Figure 10. Probabilistic distribution impact of “Source-Storage-Layout” characteristics of the existing building’s PEDF systems on energy efficiency benefits: (a) Impact of PV output volatility; (b) Impact of storage charge/discharge strategy flexibility; (c) Impact of PV-ESS minimally invasive layout synergy, quantitatively revealing that high layout synergy combined with storage flexibility can effectively mitigate PV volatility’s negative effects, providing a statistical foundation for integrated system design.
Buildings 15 03599 g010
Figure 11. Comparison of optimization effects for “Building-side Cooperative Regulation—Grid-side Interaction Characteristics” of the existing building’s PEDF systems: (a) Comparison of load-PV-ESS cooperative regulation characteristics before and after optimization; (b) Comparison of incoming line power optimization effects, demonstrating how coordinated control enables economic savings through peak shaving and improves grid stability via smoothed power injection/consumption, facilitating proactive grid partnership.
Buildings 15 03599 g011
Table 1. Configuration of the simulation environment for the PEDF system, summarizing the hardware, software, and data sources designed to ensure reproducible, high-fidelity simulation of building energy performance, distribution network constraints, and minimally invasive deployment scenarios.
CategoryComponentSpecification
Hardware EnvironmentProcessor (CPU)AMD Ryzen 9 5900X
Graphics Card (GPU)NVIDIA GeForce RTX 3080Ti 12G
Memory (RAM)32GB DDR4-3600
Storage1TB NVMe SSD
Software EnvironmentOperating SystemUbuntu 20.04 LTS
Traditional Optimization PlatformMatlab R2023b
Building Energy Simulation ToolEnergyPlus v9.5
Distribution System SimulatorOpenDSS v9.0
Reinforcement Learning FrameworkTensorFlow 2.6.2 + Custom Gym Environment (Building-PV-ESS)
Programming LanguagePython 3.9.7
Datasets
  • Existing office building energy consumption data (2023–2024)
    Includes: lighting, equipment, and HVAC systems
  • Solar irradiance data (2024)
    Resolution: Hourly
    Coverage: Covers both clear and cloudy days
  • Grid Time-of-Use tariff rules (Local policy, 2025 edition)
    Distinguishes between: Peak, flat, and valley periods.
Note: OpenDSS (Open Distribution System Simulator) is an open-source tool used for quasi-static power flow analysis, enabling the modeling of physical constraints and operational dynamics of the electrical distribution network. ToU (Time-of-Use) Tariff Rules, based on the local grid operator’s official pricing policy, define distinct peak, flat, and valley periods to provide the economic signals necessary for the energy management agent’s cost-minimization dispatch strategy.
Table 2. Comprehensive Performance Comparison of Multi-Objective Optimization Algorithms (Mean Values over 30 Independent Runs), showing that the proposed I-ABC-GA algorithm outperforms established methods (NSGA-II, MOEA/D, MOSPO, SPEA2) in HV, IGD, and SP, confirming its effectiveness and efficiency in solving layout optimization under minimally invasive constraints.
AlgorithmHypervolume (HV) ↑ (×103)Inverted Generational Distance (IGD) ↓ (×10−2)Spacing (SP) ↓ (×10−2)Spread ↓Average Computation Time (s)
NSGA-II7.15 ± 0.244.86 ± 0.3110.52 ± 1.150.783 ± 0.045152
MOEA/D7.38 ± 0.194.25 ± 0.289.14 ± 0.980.721 ± 0.038175
MOSPO7.29 ± 0.264.63 ± 0.359.87 ± 1.070.754 ± 0.042138
SPEA27.42 ± 0.174.12 ± 0.268.95 ± 0.920.698 ± 0.036189
I-ABC-GA (Proposed)7.84 ± 0.113.58 ± 0.197.23 ± 0.760.705 ± 0.032163
Table 3. Training parameters for the TD3-based flexible energy management strategy optimization algorithm, detailing the key algorithm configuration values that were meticulously designed to ensure stable convergence, adapt to the slow dynamics of the building environment, and balance economic, equipment longevity, grid-friendly, and safety objectives.
ParameterValueParameterValue
Iterations1.5 × 106 stepsDiscount Factor0.93
Replay Buffer Size1 × 106 transitionsExploration Noise Variance0.5
Network Learning Rate0.0003 (Actor)
0.001 (Critic)
Target Policy Smoothing Noise Variance1
Batch Size128Policy Update DelayEvery 4 steps
Gradient Steps per Iteration2 updates per stepSoft Update Rate0.005
Noise TypeOrnstein–UhlenbeckReward Function Weights1. Economic (0.4)
2. Lifespan (0.2)
3. Grid-Friendliness (0.2)
4. Operational-Safety (0.2)
Table 4. Sensitivity Analysis of System Performance Under Multiple Variable Conditions, illustrating the adaptability and economic robustness of the proposed strategy across office, residential, and commercial building scenarios, with consistent grid interaction benefits maintained under real-time pricing and heterogeneous load profiles.
Variable ConditionScenario DescriptionDaily Operational Cost (CNY)Payback Period (years)Peak-to-Valley Reduction Rate (%)
Base ScenarioOffice Bldg + TOU315.75.829.5
Electricity Price ChangeOffice Bldg + Real-Time Pricing (RTP)267.9 (−15.2%)5.131.8
Load Profile ChangeResidential Bldg + TOU289.5 (−8.3%)5.928.1
Commercial Bldg + TOU352.1 ( + 11.5%)6.330.6
Table 5. Actual annual performance metrics of the trained TD3 energy management agent, quantifying significant cost reduction (18.7%), high PV self-consumption (86.5%), effective peak shaving (31.2% reduction), and battery-friendly operation (0.82 daily cycles), demonstrating its value as a high-performance, multi-objective decision engine for real-world PEDF systems.
CategoryPerformance IndicatorValueUnitNote/Benchmark
EconomicAnnual Comprehensive Electricity Cost102,357CNY
Cost Saving vs. Rule-Based Control18.7%Benchmark: TOU-based strategy
Energy EfficiencyAnnual PV Self-Consumption Rate86.5%
Overall Energy Efficiency Improvement12.3%Compared to pre-retrofit system
Grid InteractionAvg. Peak-Valley Reduction Rate31.2%
Std. Dev. of Grid Injection Power4.8kWLower value indicates smoother grid interaction
Equipment & EnvironmentAvg. Daily Battery Cycles0.82cycles/dayShallow cycling helps extend battery life
Annual CO2 Emission Reduction16.9tCO2
Note: The standard deviation of grid injection power fluctuation is used to quantify the smoothing effect on the grid. A lower value indicates better performance.
Table 6. Multi-dimensional performance comparison of energy management strategies for the PEDF systems in different functional areas of an existing building, demonstrating the proposed TD3 method’s superior energy saving, cost reduction, peak shaving, and carbon emission mitigation capabilities in office, commercial, and public areas compared to rule-based and learning-based benchmarks.
AreaControl StrategyEnergy Saving Rate(%)Operational Cost (¥/day)Peak-Valley Difference Reduction Rate (%)Carbon Reduction (kgCO2/day)Strategy Delay (ms)Training Time (s/epoch)
Office AreaTraditional Constant Power Control8.2125.615.318.5500- (No Training)
Time-of-Use Price Response12.1112.422.525.3300-
DQN15.798.328.632.1801200
DDPG17.292.531.435.6601500
Standard TD318.589.233.737.9501600
TD3 (This Paper)21.382.638.242.5451400
Commercial AreaTraditional Constant Power Control6.5210.312.712.8550-
Time-of-Use Price Response10.2185.618.919.4350-
DQN14.5152.425.326.7901300
DDPG16.3145.228.129.4701600
Standard TD317.8138.530.531.7601700
TD3 (This Paper)20.1125.834.635.2501500
Public AreaTraditional Constant Power Control7.398.514.216.4450-
Time-of-Use Price Response11.582.320.122.7280-
DQN15.268.526.529.3751100
DDPG16.863.229.431.8651400
Standard TD318.159.732.134.2551500
TD3 (This Paper)20.552.436.737.9481350
Table 7. Comprehensive Performance Comparison of Different Retrofit Schemes, demonstrating that the proposed minimally invasive Scheme C achieves the highest energy-saving and carbon reduction benefits with the lowest initial investment and shortest installation time, owing to its algorithm-driven collaborative optimization of layout and operation.
DimensionIndicatorScheme A: Conventional Full RetrofitScheme B: Hybrid Conservative SystemScheme C: Proposed Minimally Invasive PEDF SchemeUnit
EconomicTotal Initial Investment156.8118.399.5×104 CNY
Unit Area Retrofit Cost15701185995CNY/m2
Static Payback Period9.87.55.8years
EngineeringEstimated Installation Time282014days
Main Cable Replacement~95%~60%< 30%
Energy SavingAnnual Energy Savings19.520.823.6MWh
Annual CO2 Reduction15.616.618.9tCO2
Grid InteractionNet Electricity Purchase During Peak Hours35.232.528.1MWh
Disclaimer/Publisher’s Note: The statements, opinions and data contained in all publications are solely those of the individual author(s) and contributor(s) and not of MDPI and/or the editor(s). MDPI and/or the editor(s) disclaim responsibility for any injury to people or property resulting from any ideas, methods, instructions or products referred to in the content.