Article

Sound Absorption and Thermal Insulation by Polyurethane Foams Reinforced with Bio-Based Lignocellulosic Fillers: Data and Modeling

1
Department of Occupational Health Engineering, Faculty of Medical Sciences, Tarbiat Modares University, Tehran P.O. Box 14115-111, Iran
2
Social Determinants of Health Research Center, Mashhad University of Medical Sciences, Mashhad 9177948564, Iran
3
Department of Occupational Health Engineering, School of Health, Mashhad University of Medical Sciences, Mashhad 9177948564, Iran
4
School of Engineering and Innovation, The Open University, Walton Hall, Milton Keynes MK7 6AA, UK
*
Authors to whom correspondence should be addressed.
Buildings 2025, 15(19), 3590; https://doi.org/10.3390/buildings15193590
Submission received: 5 September 2025 / Revised: 26 September 2025 / Accepted: 30 September 2025 / Published: 5 October 2025
(This article belongs to the Special Issue Advance in Eco-Friendly Building Materials and Innovative Structures)

Abstract

The acoustic, thermal, and mechanical performances of sawdust-reinforced polyurethane (PU) foam are investigated for different thicknesses and varying mesh sizes. Acoustic properties are explored using a combination of impedance tube testing and mathematical modeling with the Johnson–Champoux–Allard–Lafarge (JCAL) model, a simplified JCAL model and a model of non-uniform cylindrical pores with a log-normal radius distribution (NUPSD). Thermal Insulation and mechanical properties are determined by measuring the effective thermal conductivity (Keff) and by tensile strength tests, respectively. Compared with pure PU foam, the presence of sawdust matches noise reduction coefficients (NRC) and increases sound absorption averages (SAA) by nearly 10%. Increasing thickness and width of backing air gap have the usual effects of improving low- and mid-frequency absorption and shifting resonance peaks toward lower frequencies. As well as superior acoustic performance, samples with Mesh 16 sawdust reinforcement provide both useful insulation (Keff = 0.044 W/mK) and tensile strength (~0.06 MPa), confirming their multifunctionality. Although the JCAL model provides reasonable fits to the sound absorption data, some of the fitted parameter values are unphysical. Predictions of the NUPSD model are relatively poor but improve with sample thickness and after fiber addition.

1. Introduction

Once considered a tolerable by-product of modern life, environmental noise has now emerged as a pervasive and underestimated threat to public health. In recent decades, the accelerating pace of economic growth, industrialization, and urban expansion has amplified noise exposure to unprecedented levels. The World Health Organization (WHO) ranks environmental noise as the second most harmful environmental risk factor after ambient air pollution, with nearly 10% of the global population exposed to levels capable of causing noise-induced hearing loss (NIHL) [1,2,3]. Its impact extends well beyond auditory damage chronic noise disrupts sleep, increases cardiovascular risk, and triggers a cascade of psycho-physiological effects that can significantly reduce quality of life. These far-reaching consequences underscore the urgent need for effective noise-mitigation strategies in both occupational and residential environments.
A proven strategy for controlling indoor noise is the use of sound-absorbing materials. By attenuating reverberation and reducing overall sound pressure levels, such materials enhance acoustic comfort and improve speech intelligibility in enclosed spaces. However, although widely used synthetic and inorganic fibers offer a high acoustic performance, they are rarely recyclable, and incinerating them produces toxic emissions, making their disposal environmentally unsustainable [4,5]. These limitations have prompted growing interest in bio-based and renewable alternatives. Natural fibers, derived from plant or animal sources, are biodegradable, cost-effective, and pose minimal health risks. They can be used directly in raw form or incorporated into polymer matrices, where they contribute to sound absorption and can enhance the mechanical integrity of composites [5,6,7,8]. Nevertheless, their performance is often hindered by inherent drawbacks, including hydrophilicity, thermal sensitivity, low dimensional stability, incompatibility with some polymer matrices, and weak interfacial adhesion [9]. Surface modification treatments such as sodium hydroxide (NaOH) and ammonium persulfate (APS) can address these issues by introducing reactive functional groups to the fiber surface, improving matrix compatibility and, ultimately, both acoustic and mechanical properties [10].
Polyurethane (PU) foams are widely acknowledged as highly effective sound absorbers, with applications spanning the automotive and construction sectors as well as specialized environments such as theaters, offices, and recording studios. In flexible polyurethane foams (FPUFs), a network of interconnected cavities, channels, and voids promotes efficient dissipation of sound energy through viscous and thermal mechanisms [9]. Their flexibility, ease of processing, and compatibility with a broad range of fillers further enhance their appeal as the basis for manufacturing hybrid composite materials. However, the degree of reticulation, that is, the presence or removal of membranes separating adjacent pores, has been shown to exert a strong influence on acoustic behavior. Compared with fully reticulated foams, partially reticulated foams have residual membranes and closed cells, resulting in higher airflow resistivity and tortuosity, and can introduce additional dissipation through membrane vibration [11]. In recent years, natural fibers have been incorporated into PU foams to boost acoustic performance and Table 1 offers a summary of these activities and their findings (Table 1).
Environmental concerns associated with the wood processing industry have intensified calls for sustainable waste management solutions. Among its by-products, sawdust—produced in large volumes through milling, drilling, sanding, and sawing—offers considerable potential as a renewable resource. Biodegradable, lightweight, low-cost, non-toxic, and non-abrasive [17,18], sawdust can be repurposed as a filler in polymer composites, providing an eco-efficient pathway to convert abundant waste into value-added materials with applications in acoustics and other engineering fields. Fast-growing hardwood species such as poplar and eucalyptus are particularly attractive sources due to their high cellulose content (48.05% and 41.6%, respectively) and their extensive use in pulping, plywood, and furniture manufacturing, which ensures a consistent and scalable supply [19,20,21,22]. Despite these advantages, hitherto the reinforcement of flexible polyurethane foams with poplar and eucalyptus sawdust for acoustic, thermal, and other applications has not been studied.
To address this research gap, the present study investigates the acoustic, thermal, and mechanical performance of flexible polyurethane foams reinforced with chemically treated poplar and eucalyptus sawdust. While the effects of thickness and backing air gaps on porous absorbers are well established in the literature, our findings indicate that the manufacturing method causes changes in airflow resistivity across different PU–sawdust composite samples as thickness increases. Thus, thickness and flow resistivity act jointly to shape the absorption spectrum. In contrast, we identify an intermediate mesh size that provides the most favorable balance of acoustic absorption, thermal insulation, and mechanical integrity, suggesting the potential for tailoring multifunctional performance through particle size control, a dimension that has received little attention in prior work.
To improve fiber–matrix compatibility, the sawdust was subjected to sequential sodium hydroxide (NaOH) and ammonium persulfate (APS) treatments. A comparative evaluation was then undertaken, integrating measurements of sound absorption, thermal conductivity, and tensile strength to determine which composites exhibit the most useful range of multifunctional properties. In addition, the sound absorption coefficient spectra of these samples were predicted using the Johnson–Champoux–Allard-Lafarge model (JCAL) together with its porosity-based simplified version and a model for a microstructure of a log-normal size distribution of non-uniform cylindrical pores.
Accordingly, the objectives of this study are threefold: (1) to characterize the acoustic, thermal, and mechanical properties of PU–sawdust composites reinforced with chemically treated eucalyptus and poplar fibers; (2) to quantify the coupled influence of thickness, particle mesh size, and airflow resistivity on acoustic performance; and (3) to evaluate the predictive capacity of established models in capturing the sound absorption behavior of these composites.

2. Materials and Methods

2.1. Materials

Wood sawdust, generated as waste from furniture manufacturing at the Khavaran wood market in Tehran Province, Iran, was used as the lignocellulosic filler. Ammonium persulfate (APS) and sodium hydroxide (NaOH) were procured from Sigma-Aldrich (USA). Flexible polyurethane foam (FPUF) was synthesized using a two-component system supplied by Mokarrar Industrial Group Co. (Iran), comprising Component A, a poly ether polyol (specific gravity = 1.02 g/cm3 at 20 °C, viscosity = 1800–2000 m.Pa.s at 25 °C) with code POLYMOK-HR 331, and Component B, an isocyanate (MDI, specific gravity = 1.23 g/cm3 at 20 °C, viscosity = 180–270 m.Pa.s at 25 °C) with code Isomok-8024.

2.2. Chemical Treatment of Sawdust

To improve interfacial bonding between the sawdust and the polyurethane matrix, a sequential alkali–oxidative surface modification was applied. The sawdust was first immersed in a 7.5% NaOH solution for 1 h and rinsed three times with distilled water. It was then treated with a 5% APS solution for 8 h, following the procedure reported in [23]. After each step, residual chemicals were removed by thorough washing with distilled water. Finally, the treated sawdust was oven-dried at 60 °C for 24 h to ensure uniform moisture content and dimensional stability.

2.3. Sample Preparation and Fabrication of RFPUFs

Reinforced flexible polyurethane foam (RFPUF) composites were prepared using sawdust from poplar and eucalyptus as natural reinforcements and FPUF as the polymer matrix (Figure 1). To obtain controlled particle sizes, the sawdust was sieved into four mesh ranges: No. 8, No. 10, No. 16, and No. 20 (Figure 3). For each batch, Component A (polyol) was mixed with sawdust at a loading of 10 wt% relative to the weight of Component A. The mixture was mechanically stirred at 200 rpm for 20 min to ensure homogeneous dispersion. Component B (isocyanate) was then added at a weight ratio of 60:40 (A:B) and blended at 1500 rpm for 10 s. The foam samples were prepared using a closed-mold polymerization process. Immediately after mixing, the reactive mixture was poured into a mold, sealed, and left undisturbed for 3–4 h to complete foaming and curing. The foams were then demolded and conditioned at room temperature.
To investigate the influence of design parameters on acoustic performance, samples were prepared in three thicknesses (10, 30, and 50 mm) and with three eucalyptus-to-poplar weight ratios (30:70, 50:50, and 70:30). Two sets of composites were fabricated to evaluate the effect of surface modification: one reinforced with sawdust treated with both NaOH and APS, and another with sawdust treated only with NaOH. In addition to acoustic and thermal testing, mechanical characterization was also conducted to capture the broader impact of reinforcement. Tensile experiments were performed to measure not only tensile strength but also elongation at break and Young’s modulus. This approach allowed us to assess whether the addition of poplar and eucalyptus sawdust enhances both the strength and stiffness of the polyurethane foams, thereby providing a more complete picture of their multifunctional performance. All samples for determining apparent density were kept at room temperature until they reached a constant mass. The apparent density of pure foam and RFPUF was calculated as the mass-to-volume ratio of a sample.

2.4. Measurement of Physical Properties

2.4.1. Thickness

In accordance with ASTM D1037, the “Standard Test Methods for Evaluating Properties of Wood-Based Fiber and Particle Panel Materials [24],” cylindrical specimens of varying thicknesses were prepared under controlled temperature and pressure conditions. To measure the thickness, three distinct readings were taken for each sample at different points using a digital thickness gauge. Detailed thickness values for each sample are provided in Table 1.

2.4.2. Areal Density

The fabric mass per unit area was measured following ASTM D3776, “Standard Test Methods for Mass per Unit Area of Fabric [25].” A Shimadzu BX300 precision digital balance was utilized for these measurements. Each sample was measured 10 times to ensure precision and consistency in the results.

2.4.3. Bulk Density

Bulk density was determined by dividing the mass per unit area of each specimen by its corresponding thickness. The bulk density of sawdust was 198.6 kg/m3 for eucalyptus and 82.3 kg/m3 for poplar. The resulting bulk density values are listed in Table 1.

2.4.4. Porosity

Porosity is a critical factor in assessing the acoustic properties and resistance characteristics of porous materials, as it significantly influences their structure. It represents the ratio of the volume of interconnected pores and the external surface to the total volume of the material. The porosity can be calculated using the following formula:
ϕ   =   1     ρ b ρ f  
where ρ m   is the bulk density of the material, and ρ f is the density of the fibers. The porosity values for each sample are shown in Table 2.

2.4.5. Airflow Resistivity (AFR)

Airflow resistivity (σ) is a fundamental parameter describing a porous material’s opposition to steady airflow, directly influencing its acoustic performance. In this study, σ was measured according to the procedure outlined in ISO 9053 [26]. The experimental arrangement (Figure 2) consisted of a custom-fabricated test rig equipped with a calibrated airflow supply and high-precision differential pressure sensors. During testing, each specimen was mounted securely in the holder, and a steady, controlled volumetric airflow ( Q ) was passed through it. The pressure difference between the upstream ( p 1 ) and downstream ( p 2 ) faces was recorded, and σ was calculated using Equation (2):
σ = A p 2 p 1 Q T
where A is the cross-sectional area of the specimen (m2), T is the sample thickness (m), and Q is the volumetric flow rate (m3/s). All measurements were repeated four times, and mean values were reported to minimize random error and ensure reproducibility.
The resulting flow resistivity values and other sample characteristics are listed in Table 2.
The manufacturing process has resulted in homogeneous PU foam samples with flow resistivities that decrease with increasing thickness. In contrast, the addition of sawdust during foaming has influenced bubble growth and collapse, modifying the PU foam pore structure by creating local inhomogeneities and causing the flow resistivity to increase rather than decrease with increasing thickness.

2.4.6. Morphological Analysis

Morphological characteristics of the composites were examined to assess the dispersion of sawdust particles within the polyurethane matrix and to evaluate the cellular structure of the foams. Observations were performed using a field emission scanning electron microscope (FESEM, TESCAN MIRA3, Czech Republic) operated at an accelerating voltage of 15 kV. For each sample, 8 micrographs were captured at various magnifications and viewing angles to provide a comprehensive assessment of surface and internal morphology. Prior to imaging, all specimens were coated with a thin layer of gold using an electrodeposition technique to enhance surface conductivity and minimize electrostatic charging during analysis. The cell size of the samples was calculated using ImageJ software (version 1.54p).

2.4.7. Thermal Conductivity Analysis (Keff)

The effective thermal conductivity (Keff) of circular specimens (diameter: 290 mm) was measured using the guarded hot plate (GHP) method in accordance with ASTM C177 [27]. In polyurethane foams, Keff is strongly influenced by structural parameters such as apparent density, cell morphology, and pore size distribution [28,29,30,31,32]. Prior to testing, all specimens were conditioned at the target temperature and relative humidity for at least 24 h to ensure stabilization of physical properties. The GHP apparatus was enclosed within a thermally insulated cabinet to minimize convective air currents, shield the specimen from external radiant heat sources, and prevent room-air interactions during measurements. For each formulation, a minimum of three independent measurements was performed, and the mean Keff value was reported.

2.4.8. Tensile Properties

While acoustic performance is the primary design target, the long-term reliability of RFPUF composites also depends on their ability to withstand mechanical stresses during handling, installation, and service. To address this, tensile testing was performed on the samples offering good sound absorption. Tests were conducted in accordance with ASTM D3574-17 [33] using a universal testing machine (INSTRON, 5566 series) under standard laboratory conditions (20 ± 2 °C, 45 ± 5% relative humidity). For each formulation, at least three specimens were tested, and mean values were reported to minimize variability. Linking tensile strength to durability ensured that the selected composite not only offers good sound absorption but also retains its integrity and functionality throughout its intended lifespan.

2.5. Normal Sound Absorption Coefficient (SAC)
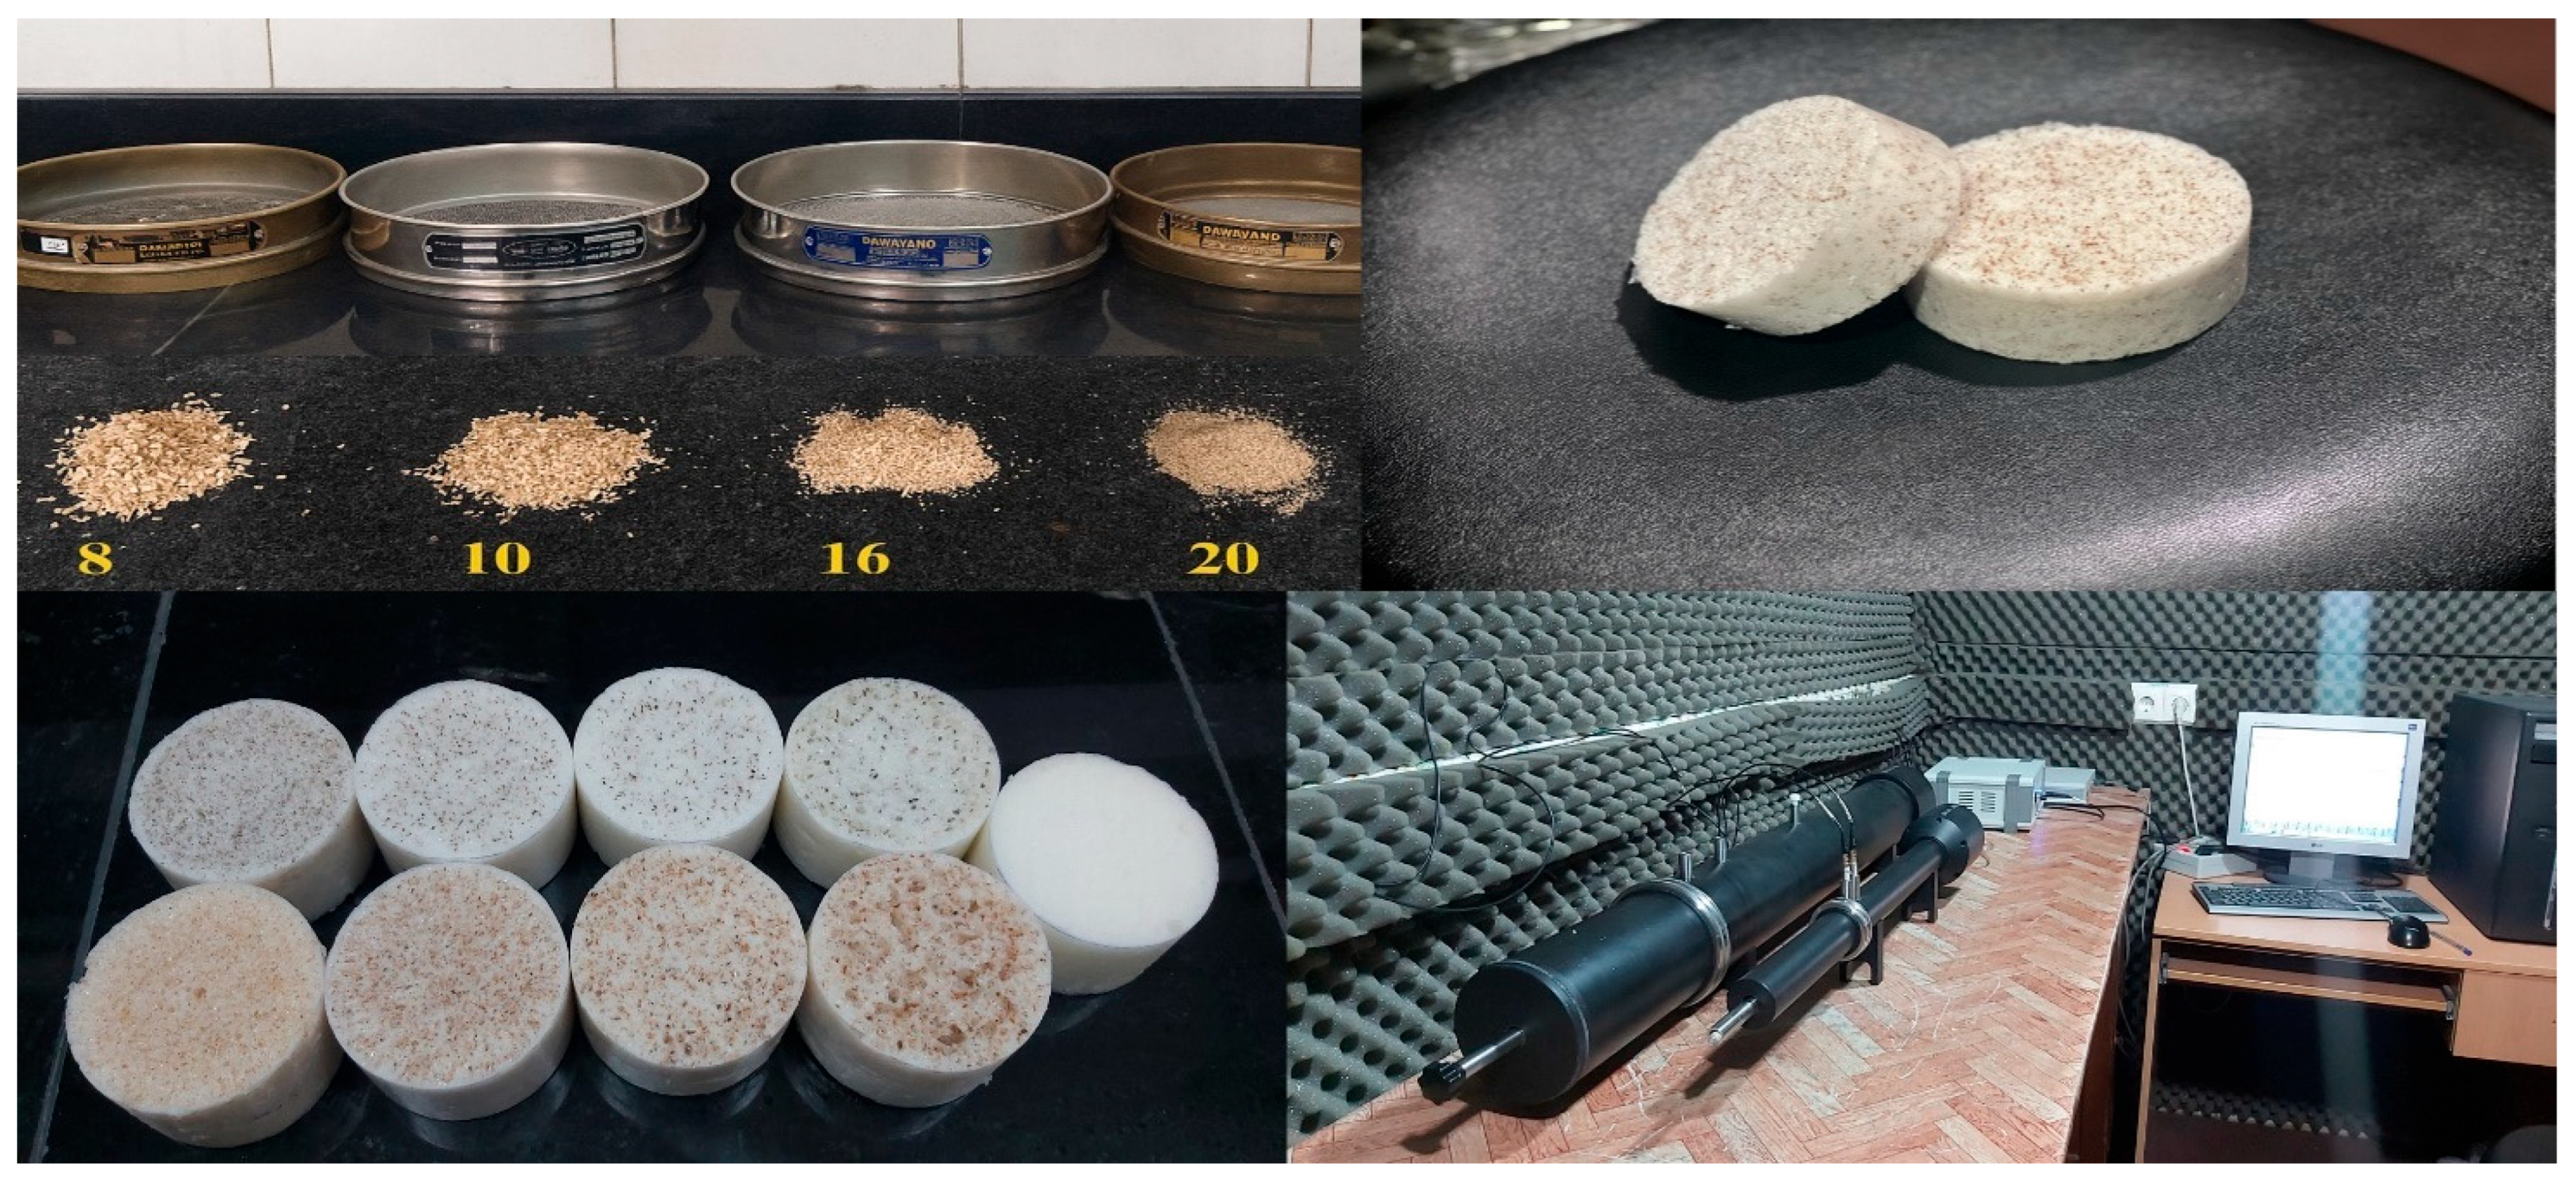
The normal incidence sound absorption coefficient (SAC) of the reinforced flexible polyurethane foams (RFPUFs) was determined using the transfer function method, following ISO 10534-2 [34]. Circular specimens (diameters: 30 mm and 100 mm; Figure 3) were tested in a two-microphone impedance tube system (BSWA Tech Ltd., Beijing China) to cover the frequency range from 63 Hz to 6300 Hz. In this method, a loudspeaker at one end of the tube generates an incident plane wave, while two phase-matched microphones, positioned at x 1 and x 2 upstream of the sample, measure the complex sound pressures. The transfer function between the microphones is computed and used to derive the complex reflection coefficient ( R ), from which SAC is obtained. The sound pressures at the two positions are expressed as follows:
P 1 x 1 , f = P i x 1 , f + P r x 1 , f = A 0 f e j K 0 x 1 + R f . A 0 f e j K 0 x 1
P 2 x 2 , f = P i x 2 , f + P r x 2 , f = A 0 f e j K 0 x 2 + R f . A 0 f e j K 0 x 2
In this context, the indices (i) and (r) refer to the incident and reflected waves, respectively. The terms ( P i x 1 , f ), ( P i x 2 , f ), ( P r x 1 , f ), and P r x 2 , f represent the Fourier Transform of the incident and reflected sound pressure at positions ( x 1 ) and ( x 2 ). The symbol ( A 0 ) indicates the amplitude of the incident wave. The transfer functions corresponding to the incident sound H i f , the reflected sound H r f , and the total acoustic field H 12 f are determined from Equation (5) through Equation (7), assuming time dependence e j ω t , j being 1 :
H i f = P i x 2 , f P i x 1 , f = A 0 f e j K 0 x 2 A 0 f e j K 0 x 1 = e j K 0 x 1 x 2
H r f = P r x 2 , f P r x 1 , f = A 0 f e j K 0 x 2 A 0 f e j K 0 x 1 = e j K 0 x 1 x 2
H 12 f = P 2 x 2 , f P 1 x 1 , f = e j K 0 x 2 + R f . e j K 0 x 2 e j K 0 x 1 + R f . e j K 0 x 1
Therefore, the normal incidence SAC is calculated from Equation (8):
SAC = 1 H 12 f H i f H r f H 12 f 2
Figure 3. Samples prepared for sound absorption test.
Buildings 15 03590 g003
To obtain sound absorption measurements between 63 Hz and 6300 Hz, two impedance tubes with different inner diameters were employed: a small tube (30 mm) for high-frequency measurements in the range of 1600–6300 Hz, and a large tube (100 mm) for low-to-mid frequencies between 63–1600 Hz. Each specimen was tested in at least three independent repetitions to minimize stochastic errors and enhance measurement reliability. All tests were conducted under controlled laboratory conditions (20 ± 2 °C, 45 ± 5% relative humidity, 101,325 Pa). The Sound Absorption Average (SAA) and Noise Reduction Coefficient (NRC) were determined in accordance with ASTM C423 [35] as follows:
SAA = 1 12 i = 200 Hz i = 2500 Hz S A C i
NRC = α 250 + α 500 + α 1000 + α 2000 4
The normal SAC was determined for samples of three different thicknesses (10 mm, 30 mm, and 50 mm), four particle mesh sizes (8, 10, 16, and 20), and two air gap depths (10 mm and 30 mm).

2.6. Prediction of Acoustical Characteristics

Direct measurement of the normal Sound Absorption Coefficient (SAC) is regarded as the most reliable method for evaluating the acoustic efficiency of porous materials. However, suitable resources are not always readily available. The ability to predict acoustical performance provides an efficient and cost-effective alternative, provided that key material parameters, such as airflow resistivity, are known.
In this study, the comparative ability of three models to predict the acoustical properties of the PU foam and sawdust mixtures has been investigated. The models are the six-parameter Johnson–Champoux–Allard-Lafarge (JCAL) model, a single-parameter (porosity) simplification of it, and a three-parameter model for a log normal distribution of non-uniform cylindrical pores (NUPSD). The JCAL model has been used widely to predict the acoustical properties of polymer foams, and the NUPSD model has proven successful in predicting the acoustical performance of granular materials [36]. These models are outlined in the following subsections.

2.6.1. Johnson-Champoux-Allard-Lafarge Model (JCAL)

The JCAL model describes sound propagation in porous media under the assumption that the solid skeleton remains stationary [37]. It incorporates six parameters—porosity ( ϕ ), tortuosity ( α ), airflow resistivity ( σ ), viscous characteristic length (Λ), thermal characteristic length ( Λ ) and thermal permeability k 0 , which has units of m2 and is related to the thermal flow resistivity, σ (Pa s m−2), by σ = μ / k 0 .
The bulk effective density ρ b ω and bulk compressibility C b ω are given as functions of angular frequency ω , by the following formulations:
ρ b ω = α ρ 0 ϕ 1 + j σ ϕ ω ρ 0 α G Λ ,   G Λ = 1 + 4 j α 2 η ω ρ 0 σ ρ Λ ϕ 2
C b ω = ϕ γ P 0 1 γ γ 1 1 + μ ϕ ω ρ 0 k 0 N P R 1 + ω ρ 0 4 k 0 N P R 2 j η Λ 2 ϕ 2 1
where ρ 0 is air density, η is the dynamic coefficient of air viscosity, N P R is the Prandtl number, P 0 is atmospheric pressure, γ is the ratio of specific heats and
σ ρ = 8 μ α ϕ Λ 2
The characteristic impedance and propagation constant in a porous medium are calculated, respectively, from ρ b ω and C b ω by using
Z C = ρ 0 c 0 1 ρ b ω / C b ω
and
k = ω ρ b ω   C b ω
The surface impedance of a hard-backed porous layer of thickness d is as follows:
Z d = Z C coth j k d
The plane wave reflection coefficient, R(d), and normal incidence absorption coefficient, α (d), for a hard-backed porous layer of thickness d are given by the following:
R d = ρ 0 c 0 Z d ρ 0 c 0 + Z d
α d = 1 R d 2

2.6.2. The Simplified JCAL Model

A recent study [38] has used Bayesian inference to determine the non-acoustical parameters of the JCAL model (i.e., tortuosity, airflow resistivity, viscous and thermal characteristic lengths, and static thermal permeability), and a regression method to correlate porosity with these non-acoustical parameters. The resulting model is based on the single parameter of porosity and introduces five adjustable constants that are determined by fitting absorption data. The resulting simplified model has been validated against acoustic data for acrylic and wool fiber materials, but has proven less successful for silk fiber samples due to frame elasticity effects. Nevertheless, this model has been suggested as a way of overcoming the limitations of semi-phenomenological and empirical models when characterizing the acoustical properties of materials made from natural fibers or mixtures of natural and synthetic fibres.
The relationships for flow resistivity, tortuosity, characteristic lengths and thermal permeability as functions of porosity suggested by this simplified JCAL model are, respectively,
σ ϕ = a 1 ϕ 0.64 ln 1 ϕ ϕ + 0.263
α ϕ = 1 b ln ϕ
Λ ϕ = c α ϕ a σ ϕ 1 ϕ ϕ
Λ ϕ = d α ϕ a σ ϕ 1 ϕ ϕ
k 0 ϕ = e ϕ 2 1 ϕ
The values of the constants a   to   e are adjusted to fit acoustical data for any given sample of known porosity through a regression analysis using the forms of Equations (19)–(23).

2.6.3. Non Uniform Cylindrical Pores with a Log-Normal Radius Distribution (NUPSD)

The model for the acoustic properties of media containing non-uniform cylindrical pores with a log normal distribution of radii [39,40] introduces a Padé approximation for bulk complex density:
ρ b ω = α / ϕ 1 + F ρ ε ρ / ε ρ 2
F ρ ε = 1 + a ρ 1 ε ρ + a ρ 2 ε ρ 2 1 + b ρ 1 ε ρ
where ε ρ = j ω ρ 0 α ϕ σ , a ρ 1 = θ ρ 1 / θ ρ 2 , a ρ 2 = θ ρ 1 , b ρ 1 = a ρ 1 , θ 1 = 1 3 , θ ρ 2 = e 1 2 β ln 2 2 , ϕ is the porosity, and β is the standard deviation of the pore size distribution in φ units, such that a pore dimension in mm = 2 φ .
The corresponding Padé approximation for bulk compressibility is as follows:
C b ω = γ P 0 1 γ γ 1 / 1 + F C ε C / ε C 2
F C ε = 1 + a C 1 ε C + a C 2 ε C 2 1 + b C 1 ε C
where ε C = j ω ρ 0 α N P r ϕ σ , a C 1 = θ C 1 / θ C 2 , a C 2 = θ C 1 , b C 1 = a C 1 , θ C 1 = 1 3 , and θ C 2 = e 3 2 β ln 2 2 / 2 .
If the mean pore radius is r ¯ , then
σ = 8 μ ϕ r ¯ 2 e 6 ( β ln 2 ) 2
σ = μ / k 0 = 8 μ ϕ r ¯ 2 e 6 ( β ln 2 ) 2
Also,
α = e 4 ( β ln 2 ) 2
Equations (28) and (29) can be used to deduce that σ = σ e 12 ( β ln 2 ) 2 and ε C = ε ρ e 6 β ln 2 .
If non-acoustical measurements of flow resistivity, porosity, and the standard deviation ( β ) of the pore size distribution are available, the model for a log-normal distribution of non-uniform pores does not require adjustable or fitted parameters. According to Equation (30), the standard deviation of the pore size distribution, β , can be calculated directly from tortuosity α i.e., β = ln α / 2 ln 2 .
If porosity and flow resistivity are known, as is the case with the samples considered in this paper, the NUPSD model can be used to predict the quarter wavelength ( π / 2 Re k ) of the mainly pore-borne wave in a sample material as a function of frequency for any value of tortuosity, α . Hence, the estimated tortuosity value is the value that matches the predicted quarter wavelength to the known sample thickness at the frequency, f p e a k , of the first quarter wavelength resonance, in a measured absorption spectrum.
The NUPSD model gives relationships between the characteristic lengths, mean pore dimension and standard deviation of the pore size distribution [39]. These are,
Λ = r ¯ e 5 / 2 ( β ln 2 ) 2
Λ = r ¯ e 3 / 2 ( β ln 2 ) 2
The value of β deduced from the estimated value of α can be used with Equations (30) and (31) to obtain corresponding predictions of the JCAL model.

3. Results and Discussion

3.1. Thermal, Tensile and Morphological Properties of Optimized Sample

3.1.1. Thermal Properties

The effective thermal conductivity (Keff) is a pivotal parameter for assessing the insulation efficiency of porous materials, as it quantifies the rate at which heat is conducted through a medium under steady-state conditions. In thermal insulation applications, a lower Keff value directly translates to superior insulating capability, enabling the maintenance of thermal comfort with reduced material thickness. In polyurethane (PU) foams, heat transfer is governed primarily by three mechanisms solid-phase conduction, gas-phase conduction, and, to a much lesser extent, thermal radiation and convection. In PU foams, radiative and convective contributions are generally considered negligible [41,42], leaving conduction through the polymer skeleton and the cell gas as the dominant pathways. According to the literature, a decrease in foam density is associated with an increase in thermal conductivity of the gaseous phase and heat transfer by radiation, whilst thermal conductivity of the solid matrix decreases. This phenomenon can be attributed to the decrease in foam density, which results in a concomitant decrease in the proportion of the solid matrix in the total volume, whilst the proportion of the gaseous phase increases. It has been demonstrated that increasing the foam density leads to an increase in effective thermal conductivity [29,30]. In contrast, a reduction in cell size has been shown to decrease all three components. The decrease in gas conduction through the Knudsen effect can be attributed to the reduction in the size of pores, and there is a slight decrease in solid conduction due to increased tortuosity. However, it has been demonstrated that uneven cell-size distributions can result in an enhancement of Keff [28,43].
In the present work, Keff was evaluated for the optimized reinforced flexible polyurethane foam (RFPUF) incorporating mesh-16 chemically treated eucalyptus and poplar sawdust as lignocellulosic reinforcements. The unreinforced PU foam exhibited a Keff of 0.042 W·m−1·K−1, whereas the RFPUF demonstrated a marginally elevated value of 0.044 W·m−1·K−1. The addition of lignocellulosic sawdust increases the solid fraction of the foam and enhances connectivity within the polymer skeleton, thereby increasing solid-phase conduction. On the other hand, the inherently higher thermal conductivity of lignocellulosic fibers compared to the entrapped cell gas further strengthens this contribution. At the same time, incorporation of sawdust reduces the average cell size, suppresses gas-phase conduction and thermal radiation [44,45]. The observed trend of increasing Keff with higher composite density is consistent with established heat transfer theory in porous media, where the augmentation of solid-phase volume fraction intensifies conduction pathways [46]. All measured Keff values remain well below the widely recognized thermal insulation threshold of 0.1 W·m−1·K−1, confirming that the incorporation of natural fibers does not compromise the insulating performance of the foam. When benchmarked against literature values for other bio-based PU foams (Table 3), the RFPUFs developed in this study exhibit competitive or, in some cases, superior thermal performance. For instance, artichoke stem waste–reinforced PU foams demonstrate Keff values in the range of 0.049–0.051 W·m−1·K−1 [47], while wheat husk–reinforced systems show slightly lower conductivities of 0.043–0.049 W·m−1·K−1 [48]. Composites incorporating bamboo fibers, wood fibers, or rice husks typically present higher thermal conductivities (0.045–0.065 W·m−1·K−1) [49], largely due to differences in fiber morphology, aspect ratio, and interfacial compatibility, which influence heat transfer pathways. By contrast, exceptionally low Keff values (0.026–0.031 W·m−1·K−1) have been reported for hemp shive–reinforced foams [50]; however, achieving such performance often relies on specialized cell-structure engineering, optimized blowing agent formulations, and controlled foaming conditions—factors that may increase manufacturing complexity and limit scalability.
The present RFPUFs thus combine low thermal conductivity with a straightforward, scalable fabrication process, highlighting their potential as sustainable, high-performance alternatives for thermal insulation applications.

3.1.2. Tensile Properties

Table 4 presents the effect of different reinforcements on the tensile strength of FPU foams. Tensile strength denotes the highest tensile stress that foam samples can withstand before fracturing, reflecting their resistance to tearing and shredding during end-use applications. Among the tested samples, the eucalyptus-reinforced foam exhibited the highest tensile strength at 0.06330 N/mm2, followed closely by the poplar-reinforced foam at 0.06105 N/mm2. The strength of composite materials is primarily determined by the volume fraction, the inherent strength of the constituents, and the quality of bonding at the filler–matrix interface [51]. Other aspects like density, cellular structure and dimensions, anisotropy, and the thickness of the cell walls played an important role in the mechanical properties of foams [52,53]. The observed increase in tensile strength with reinforcement is consistent with these principles. Since cellulose (the primary component of natural fibers) possesses high tensile strength [54], PU foams reinforced with natural fibers exhibit superior tensile strength compared to unreinforced foams. The hydroxyl (-OH) groups form hydrogen bonds with the PU matrix, which enhances interfacial adhesion and limits the mobility of the polymer chains, ultimately improving tensile strength.
Beyond tensile strength, elongation at break, and Young’s modulus provide further insights into the mechanical performance of reinforced foams. Elongation at break reflects the permanent deformation a sample undergoes after fracture in a tensile test. The eucalyptus-reinforced foam demonstrated the highest elongation at 42.009, indicating greater flexibility, whereas the poplar-reinforced foam showed a lower elongation of 24.341, suggesting reduced ductility. The decrease in elongation with added fiber may result from the fibers’ lower elongation values, as well as the constraints on PU chain stretching caused by these hydrogen bonds. In contrast, stiffness, as measured by Young’s modulus (the ratio of stress to strain or the slope of the stress–strain curve), was greater in the poplar-reinforced sample, which reached 0.164712 MPa, compared with 0.075254 MPa for the eucalyptus-reinforced foam. This inverse relationship between elongation and stiffness highlights the trade-off between flexibility and rigidity: while eucalyptus reinforcement enhances ductility, poplar reinforcement provides greater structural stiffness.

3.1.3. Morphological Properties

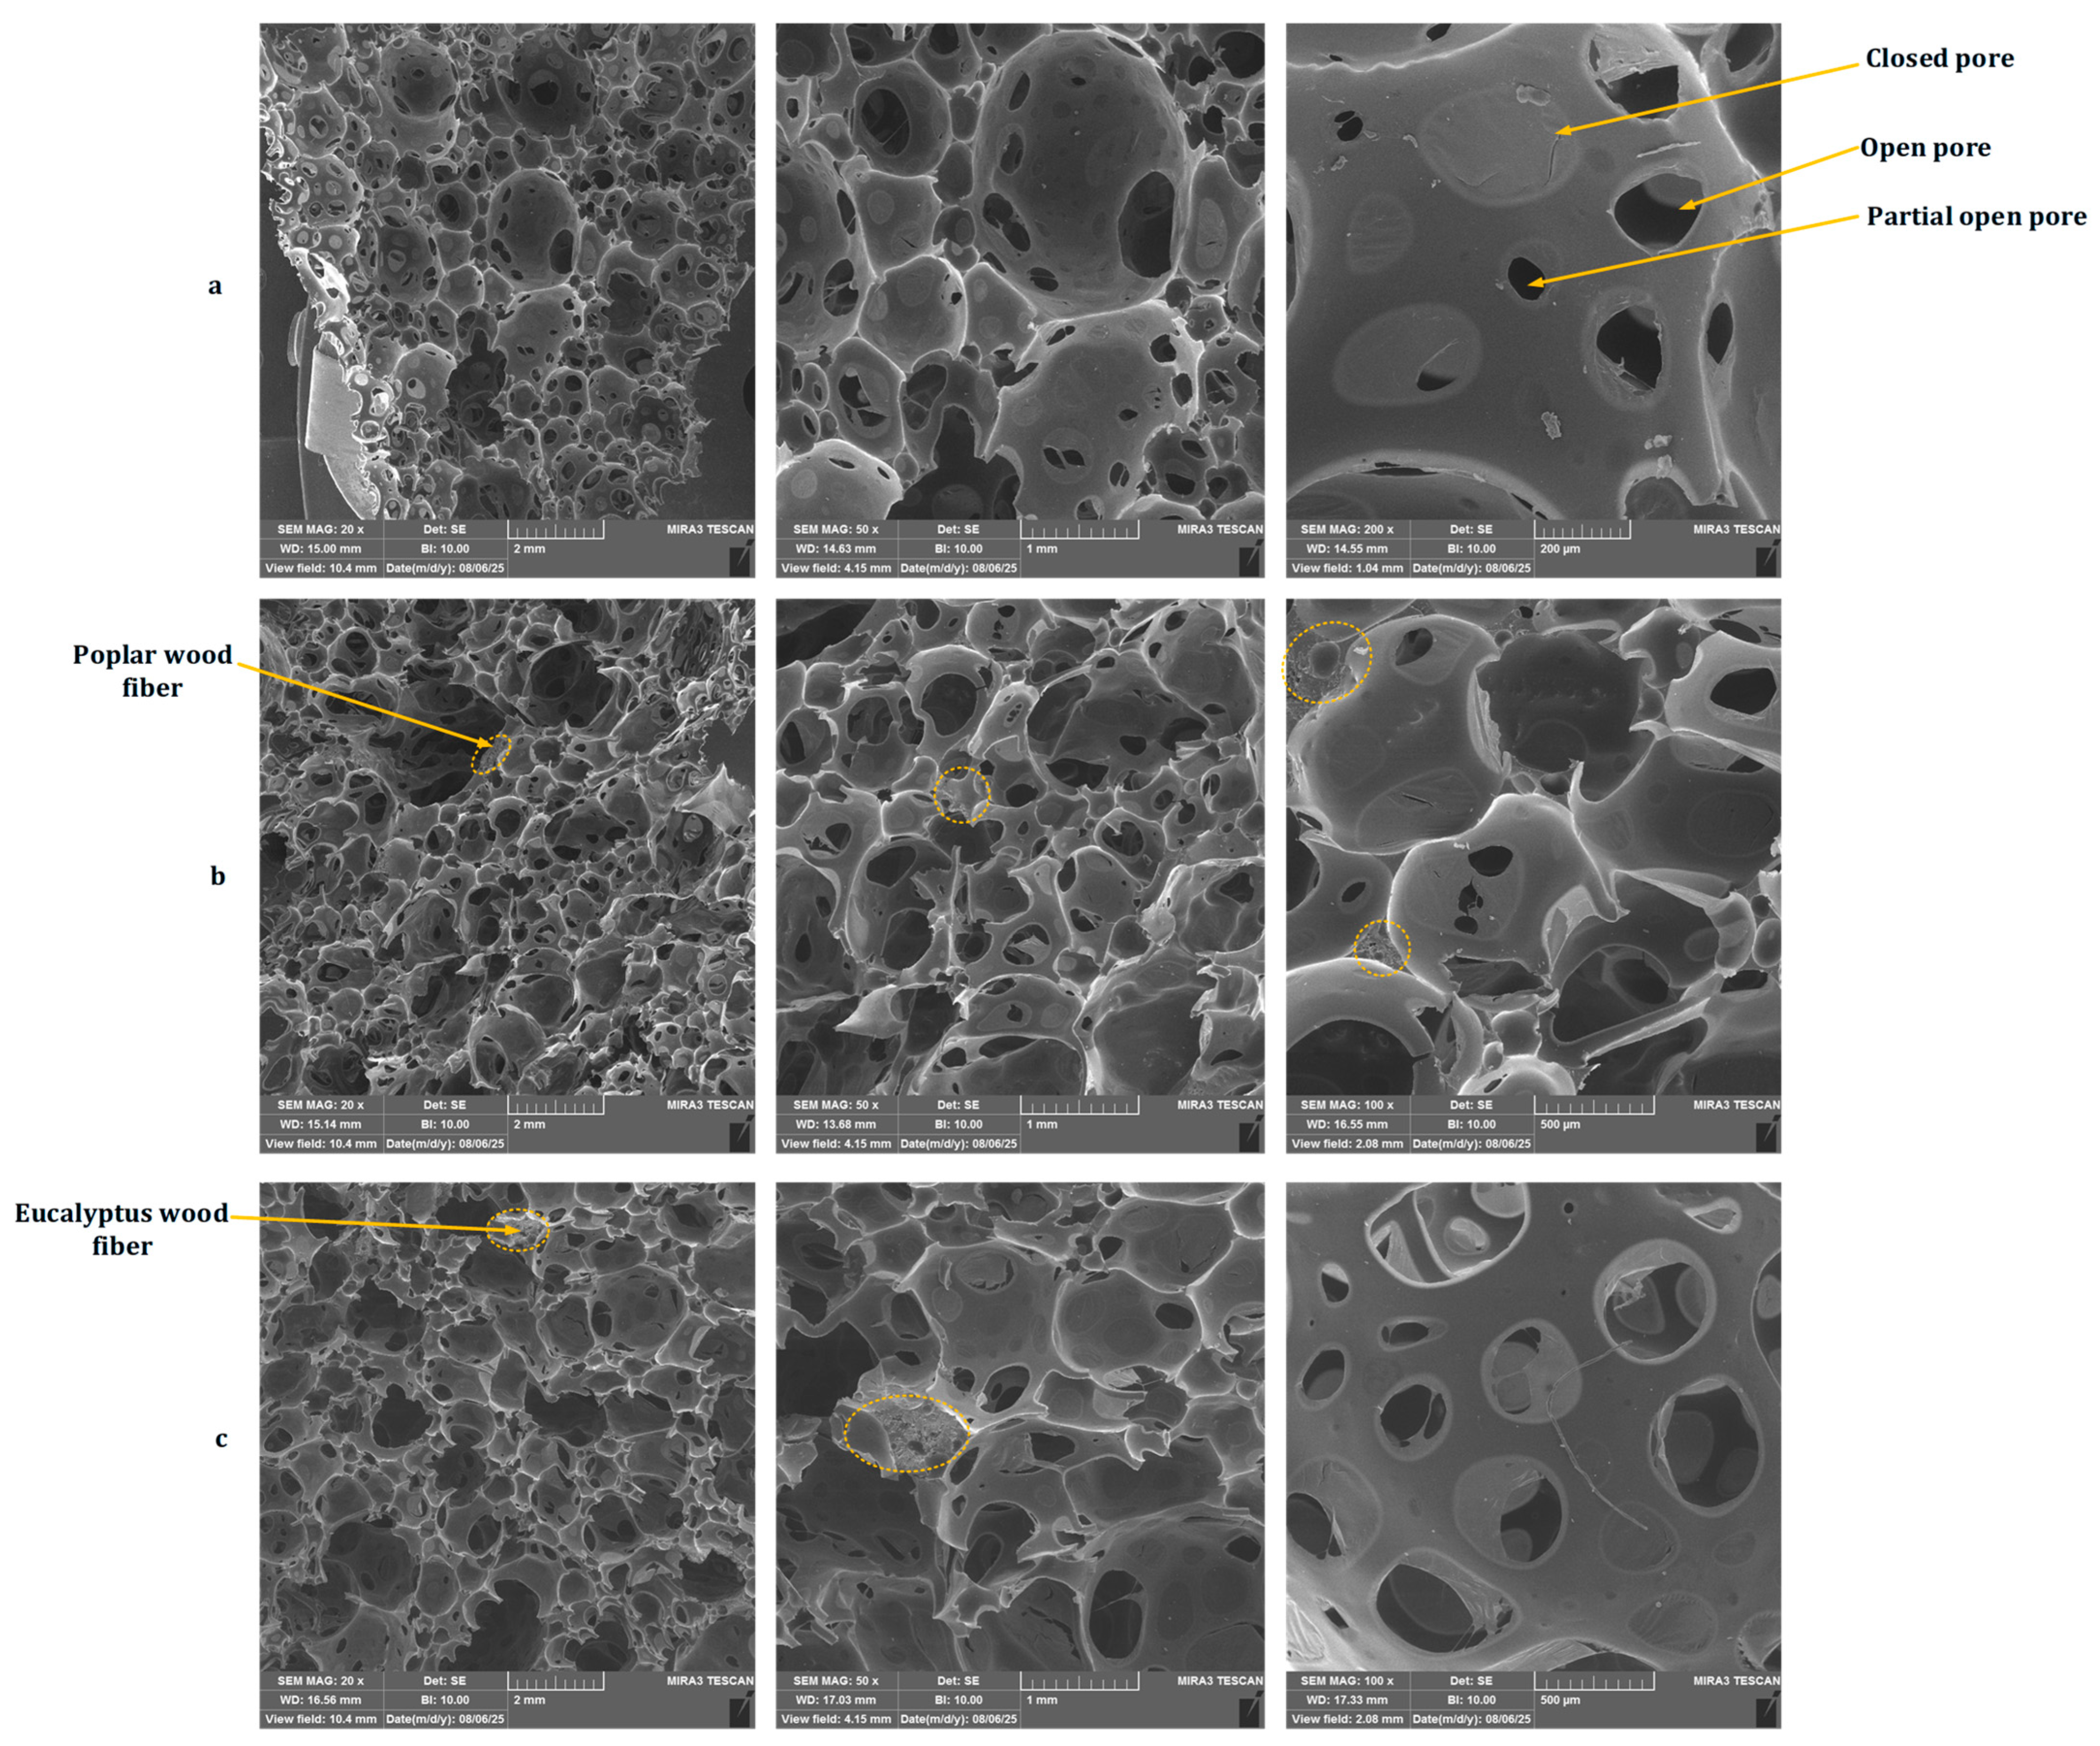
Field-Emission Scanning Electron Microscopy (FESEM) micrographs (Figure 4) reveal distinct morphological differences between the unreinforced polyurethane (PU) foam and the reinforced flexible polyurethane foams (RFPUFs) containing chemically treated poplar and eucalyptus wood fibers. The pristine PU foam (Figure 4a) exhibits a predominantly closed-cell structure with nearly spherical, uniformly distributed pores, indicative of stable foaming kinetics and minimal structural defects. Such a morphology is well-recognized for providing low thermal conductivity, as the closed gas-filled cells restrict both conductive and convective heat transfer. The mean cell size is 20.19 ± 2.94 mm for pure PU foam, 10.94 ± 1.34 mm for PU foam reinforced with poplar sawdust, and 12.75 ± 1.17 mm for Pu foam reinforced with eucalyptus sawdust.
Incorporation of lignocellulosic fibers (Figure 4b,c) significantly alters the cell architecture. On the other hand, a preponderance of closed cells militates against sound absorption. The RFPUFs display a wide distribution of pore sizes, ranging from larger macro voids to irregular micropores. This shift is primarily attributed to fiber–polymer interfacial interactions during the foaming process: fibers act as heterogeneous nucleation sites, disrupt uniform bubble expansion, and locally modify cell wall thickness. Both poplar- and eucalyptus-reinforced foams exhibit fibers well-integrated into the matrix, ensuring strong interfacial adhesion and reducing the likelihood of fiber pull-out. From an acoustic perspective, this hybrid pore network is highly advantageous. Large interconnected pores enhance wave penetration depth, while smaller constricted pores increase viscous drag and thermal boundary layer effects, dissipating incident acoustic energy through visco-thermal coupling mechanisms [55,56].
These FESEM observations are consistent with the increase in measured airflow resistivity upon sawdust addition (Table 2). The finer and more tortuous pore channels created by embedded fibers restrict air passage and thereby elevate σ, a key factor governing sound absorption. Moreover, the embedded fibers contribute to localized cell wall deformation and elevate internal friction, both of which facilitate the conversion of sound energy into heat [44,45,57,58]. This additional microstructural complexity increases airflow resistivity and tortuosity, two key parameters that influence sound absorption performance in porous media. From a thermal standpoint, maintaining a balance between open and closed porosity is critical. Closed pores preserve the low thermal conductivity characteristic of PU foams, while controlled open-cell content minimizes convective heat transfer without sacrificing acoustic efficiency. Excessive openness can lead to diminished mechanical stability and higher Keff values, as observed in other fiber-reinforced foams [46].
Although the measured Keff values for eucalyptus- and poplar-reinforced RFPUFs were essentially identical, the FESEM images indicate that the eucalyptus-based composites achieve a more favorable balance between open and closed cells. This structural nuance likely explains their superior acoustic dissipation, even though both fiber types maintained comparable thermal insulation efficiency.
Linking morphology to functional performance, the FESEM observations align with the measured properties in Section 3.1.1 and Section 3.2. The slight increase in Keff (0.042 → 0.044 W·m−1·K−1) corresponds to the higher solid-phase fraction from fiber addition, as evident from smaller average pore sizes. In parallel, the observed enhancement in normal sound absorption coefficient (SAC), particularly in the mid- and high-frequency ranges, can be attributed to the multi-scale cell size distribution and improved pore connectivity. Such morphology-induced synergy between thermal insulation and acoustic damping has been repeatedly reported for bio-based PU composites [59,60,61].

3.2. Sound Absorption Properties

3.2.1. Acoustical Performance Metrics, Flow Resistivity and Mesh Size

Sound absorption in porous materials arises predominantly from the dissipation of incident acoustic energy via viscous friction and thermal exchange within the interconnected pore network. Among the microstructural parameters that govern this process, airflow resistivity, porosity, and tortuosity have been consistently identified as the most influential [46,62]. Of these, airflow resistivity (σ) is widely regarded as the key predictor of acoustic efficiency, as it quantifies the resistance encountered by oscillating air molecules as they traverse the pore channels. The flow resistivity, σ, increases with decreasing wood fiber mesh size (see Table 2). For example, at a constant thickness of 50 mm, reducing the eucalyptus fiber mesh size from 8 to 20 increased σ from 3840 to 12 530 N·m−4·s, representing a ~227% rise. This is in close agreement with the findings of Franziska et al. [58], who reported that incorporating fine cotton fibers into natural fiber-reinforced composites substantially elevated σ by enhancing microstructural tortuosity. Similarly, statistical modelling by other authors [63] has confirmed that decreasing fiber size systematically increases σ due to a shift in the balance between open and constricted pore pathways.
Table 5 summarizes the acoustic performance metrics Sound Absorption Average (SAA) and Noise Reduction Coefficient (NRC) for all RFPUF samples.
Table 5 shows that samples with higher σ generally exhibited superior absorption in the mid- to high-frequency range, consistent with the visco-thermal coupling mechanisms described in Section 3.1.3. Morphologically, the FESEM observations (Figure 4) provide a clear rationale for this behavior: multi-scale pore size distributions, generated through fiber–polymer interactions during foaming, enable a dual dissipation pathway. Large, interconnected pores permit deep penetration of sound waves, while smaller pores constrict airflow, increasing viscous energy loss and thermal boundary layer effects. This structural synergy elevates both airflow resistivity and tortuosity, thereby broadening the effective absorption bandwidth, a phenomenon widely reported in high-performance bio-based acoustic foams [44,45,55,56].
The frequency-dependent performance of the RFPUFs is highly relevant to potential applications. In most cases, peak absorption occurred below 2500 Hz, overlapping with the 500–2000 Hz band that dominates noise spectra in residential, educational, and office environments [64,65,66]. This includes disturbances from conversation, walking, and mobile phone ringtones, which are often targeted in architectural acoustic design. Notably, several RFPUF formulations (e.g., Samples 15, 18, 24, and 27) achieved NRC values above 0.65, rivaling or exceeding those of commercially available acoustic foams while including bio-based lignocellulosic derived from renewable sources. The NRC values (0.17–0.69) demonstrate that the reinforced foams developed in this study exhibit a wide and practically useful absorption range.

3.2.2. The Impact of Thickness, Flow Resistivity and Mesh Size on Normal Incidence SAC

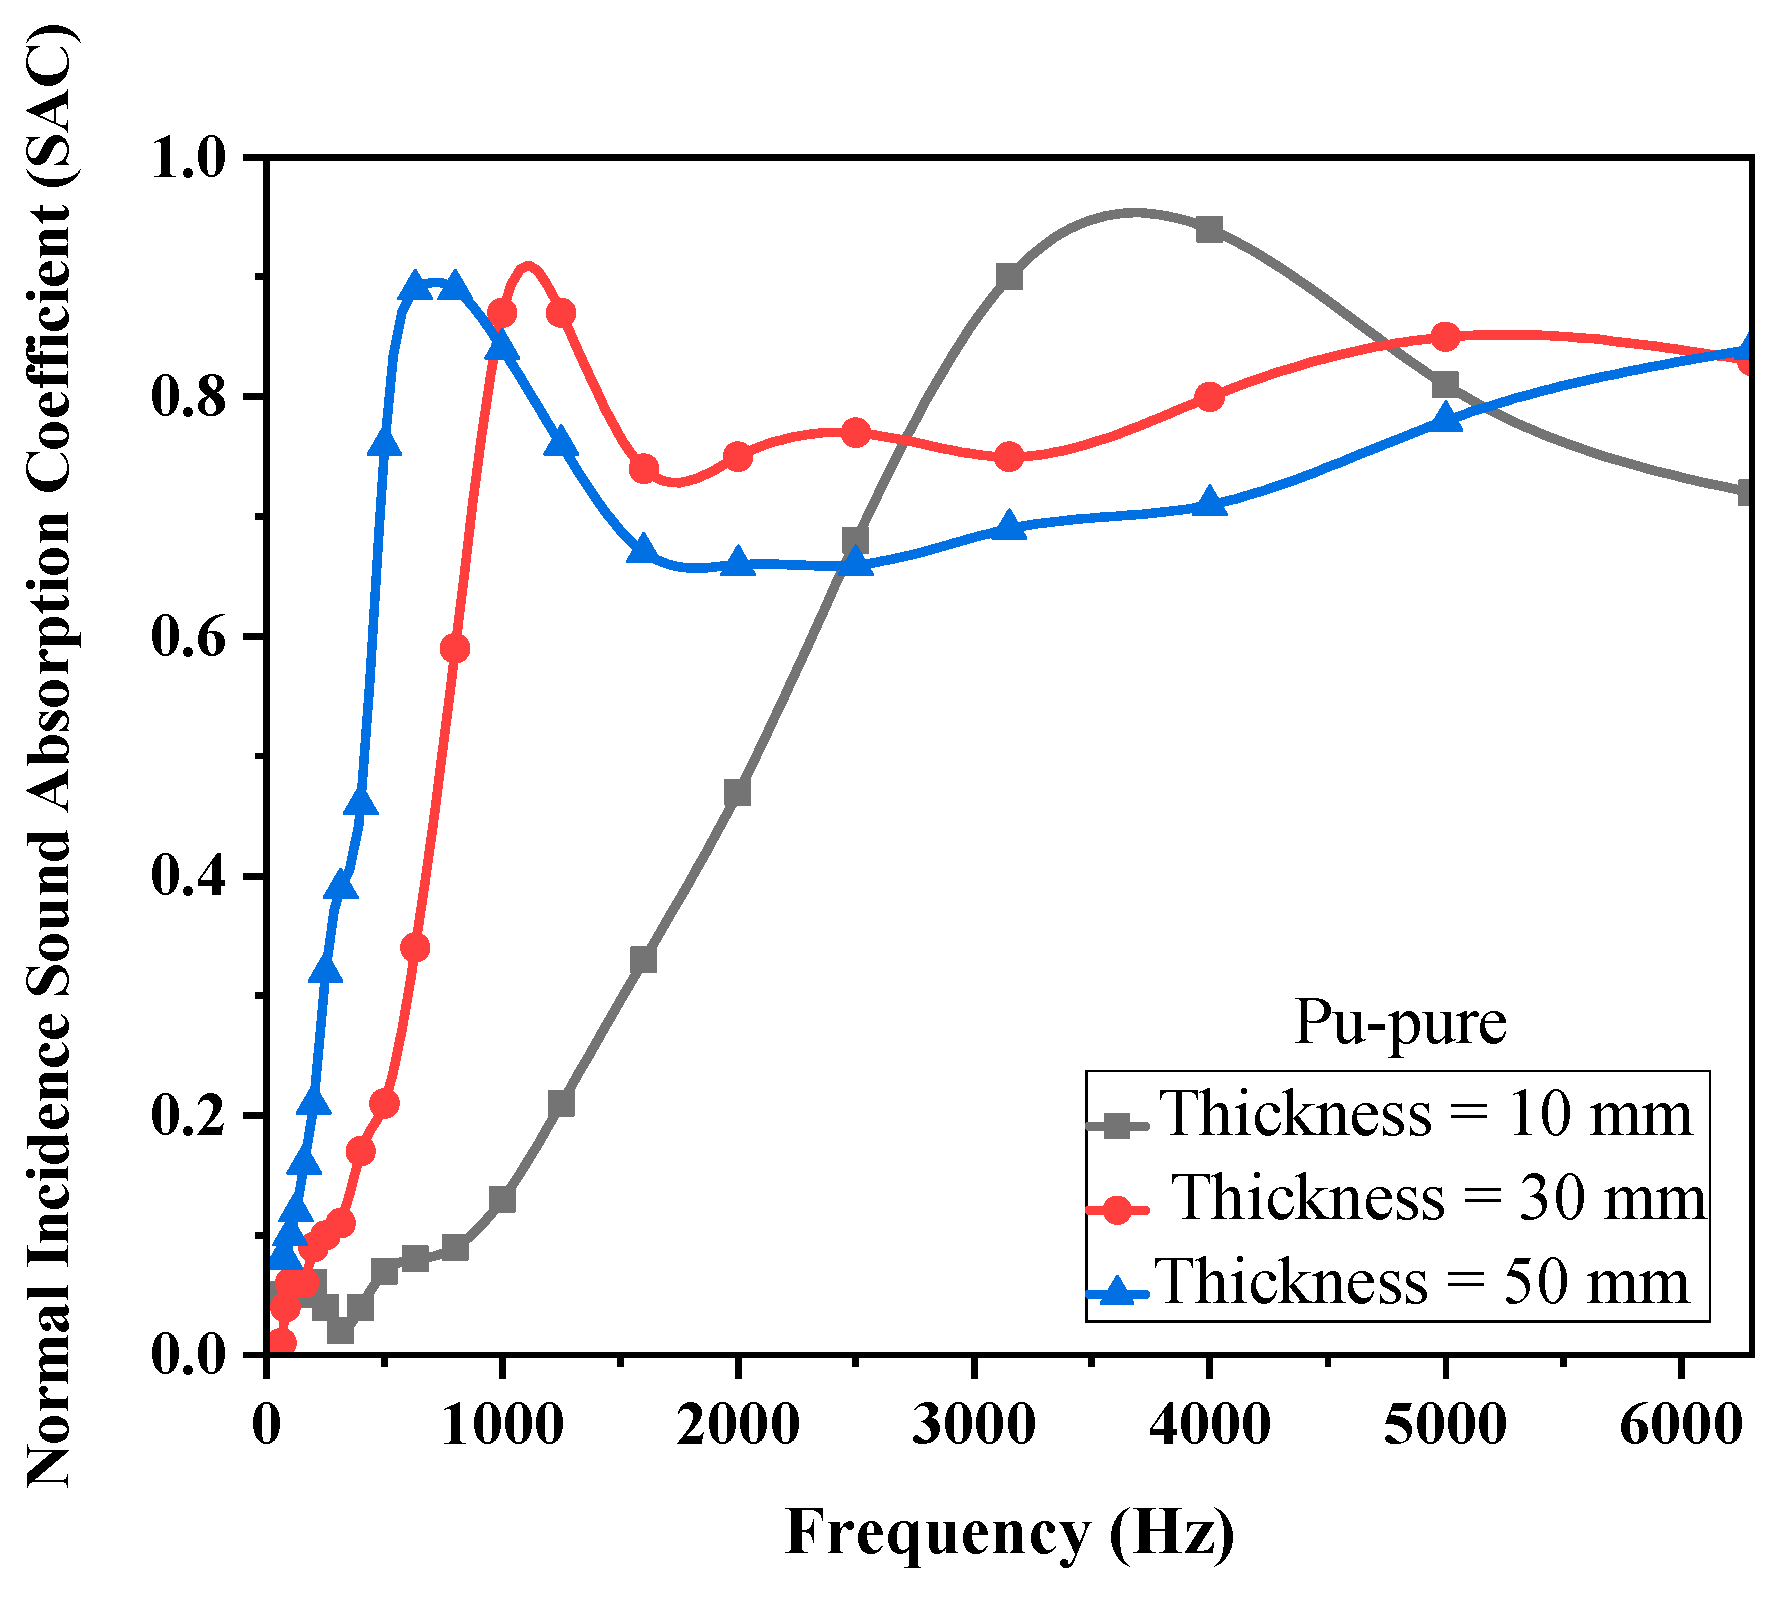
Figure 5 compares the measured absorption spectra for three PU foam samples with thicknesses 10 mm, 30 mm and 50 mm. Since the flow resistivity of the foam samples varies with thickness, these spectra represent the combined effects of flow resistivity and thickness. Increasing the thickness from 10 to 50 mm not only enhances SAC in the low- and mid-frequency ranges but also shifts the first peak in the absorption spectra toward lower frequencies. The first peak in the absorption spectrum of a hard-backed sample occurs when the absorber thickness is approximately one-quarter of the wavelength of the sound travelling in the sample. This means that the quarter wavelength resonance frequency decreases as thickness increases. The resonance frequency depends on flow resistivity as well as thickness, and the fact that the different thicknesses have different flow resistivities means that the change in resonant frequency with thickness is not uniform. Flow resistivity influences the magnitude of the peak, but since the flow resistivities of the foam samples are relatively low, the change in the peak absorption magnitude is small.
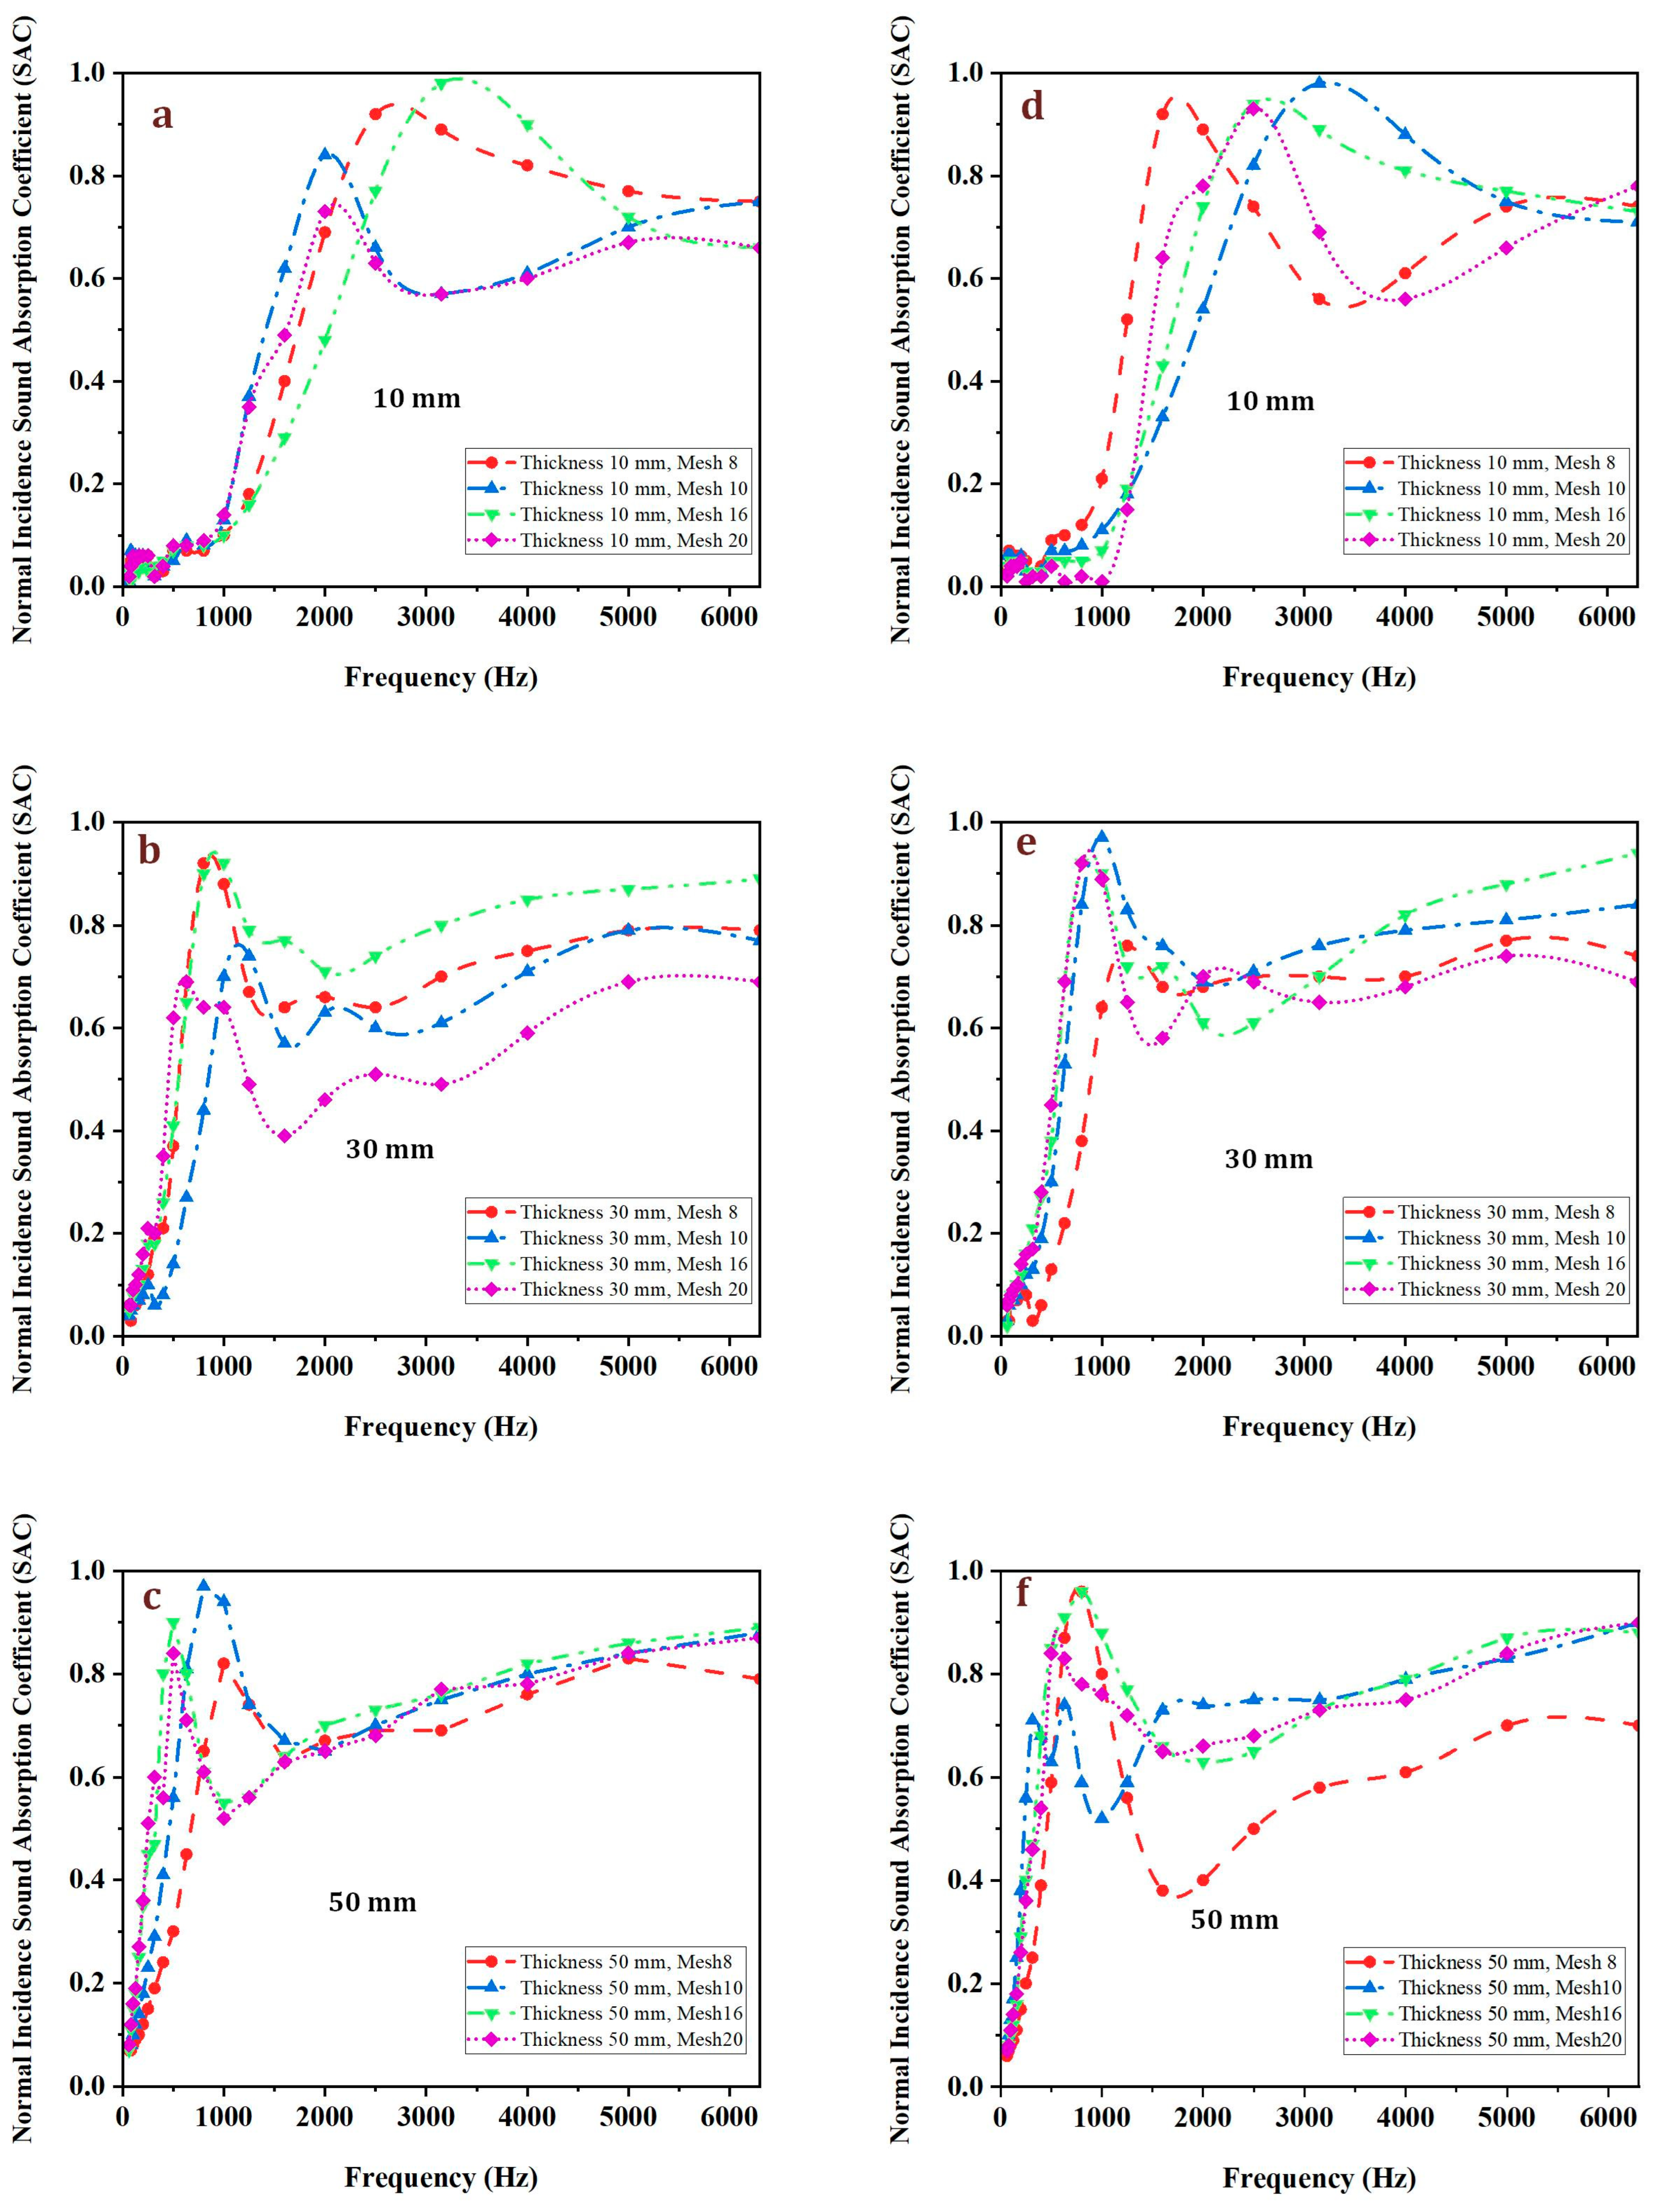
Figure 6 illustrates the influence of sample thickness and associated flow resistivity values on the normal incidence sound absorption coefficient (SAC) of RFPUFs fabricated with each of the types of wood fibers for four mesh sizes of fibers.
The relatively low flow resistivities of the samples mean that the absorption spectra of the thicker samples show multiple resonance modes, in contrast to conventional materials, which have higher flow resistivity and for which absorption is maintained beyond the first quarter wave resonance. The frequency of the first quarter wavelength resonance depends not only on thickness and flow resistivity but also on tortuosity: the higher the tortuosity, the lower the quarter wavelength resonance frequency for a given thickness and flow resistivity. The fact that the decrease in the frequency of the first quarter wavelength resonance with thickness is less uniform than for the ‘pure’ foam suggests that the tortuosity and flow resistivity change with sample thickness in the RFUPF samples. The combined results of the changes in flow resistivity and tortuosity cause the resonant peaks to be at lower frequencies for the PU and sawdust mixtures than for the pure foam samples with the same thickness.
Prior studies on fiber-reinforced polyurethane foams have found that increased thickness not only raises SAC but also shifts the absorption peak to lower frequencies [17,59,67,68,69,70]. For example, Tiuc et al. [17,59] and Azahari et al. [67,68] documented similar trends in various bio-based foam composites, while Hajizadeh et al. [69] and Bhingare et al. [70] confirmed that optimizing thickness is a key parameter for tailoring absorption profiles in architectural and industrial acoustic applications. However, these studies show only the influence of increasing thickness rather than the combined influences of thickness, flow resistivity, tortuosity and mesh size as is the case with the samples studied here.
Also Figure 6 shows that increasing the mesh size (i.e., decreasing particle size) leads to a marked enhancement in the normal incidence sound absorption coefficient (SAC) across a wide frequency range, accompanied by a shift in the absorption peak toward lower frequencies. This shift is typically associated with increased tortuosity, where sound waves follow more complex and elongated pathways, thereby extending their interaction time with the solid frame and maximizing visco-thermal dissipation [71,72].
FESEM micrographs in Section 3.1.3 (Figure 4) provide microstructural evidence supporting this behavior. Finer particles which, themselves, involve micropores or fiber aggregates dispersed within the PU matrix, promote the formation of wider pore size distributions. Smaller particles also exhibit a higher specific surface area, strengthening fiber–matrix interactions during the foaming process. This promotes more uniform cell nucleation, smaller average pore sizes, and higher airflow resistivity (σ). The measurements in Table 2 confirm this trend: for eucalyptus-based RFPUFs at a constant thickness of 50 mm, reducing mesh size from 8 to 20 increases σ from 3840 to 12 530 N·m−4·s—a ~227% increase. A similar pattern is observed for poplar-based composites.
This aligns with previous findings for bio-based acoustic foams [73,74,75], where fine-particle reinforcement was shown to increase both σ and tortuosity, thereby improving acoustic efficiency. From an application perspective, controlling mesh size offers a simple yet effective approach to tuning the frequency response of RFPUFs for specific environments. Materials optimized with finer mesh sizes can provide enhanced performance in the mid-frequency range (500–2000 Hz), a critical band for speech and common indoor noise sources, while maintaining competitive thermal insulation properties as demonstrated in Section 3.1.1. This tunability, combined with the renewable nature of the reinforcements, underscores the potential of mesh size engineering as a scalable design strategy for multifunctional acoustic foams.
Table 5, which compares the NRC and SAA values for samples 13 to 18 with those for samples 19 to 24, supports the interesting conclusion that adding mesh 16 fibers to PU foam provides better overall sound absorption than adding mesh 20 fibers. This observation contrasts with previous findings for naturally sourced materials, where smaller particle sizes generally led to improved sound absorption. For instance, research on oil palm frond-reinforced composites revealed that composites with fine particles (0.2–0.6 mm) exhibited higher sound absorption coefficients compared to those with medium and coarse particles (1–4.76 mm). Similarly [76], a study on the acoustic properties of larch bark composites demonstrated that finer particles (4–11 mm) achieved better sound absorption than coarser particles (10–30 mm) [72]. The superior performance of the samples with mesh 16 fibers added confirms that factors other than particle size are important.

3.2.3. The Effect of Airgaps on Normal Incidence SAC

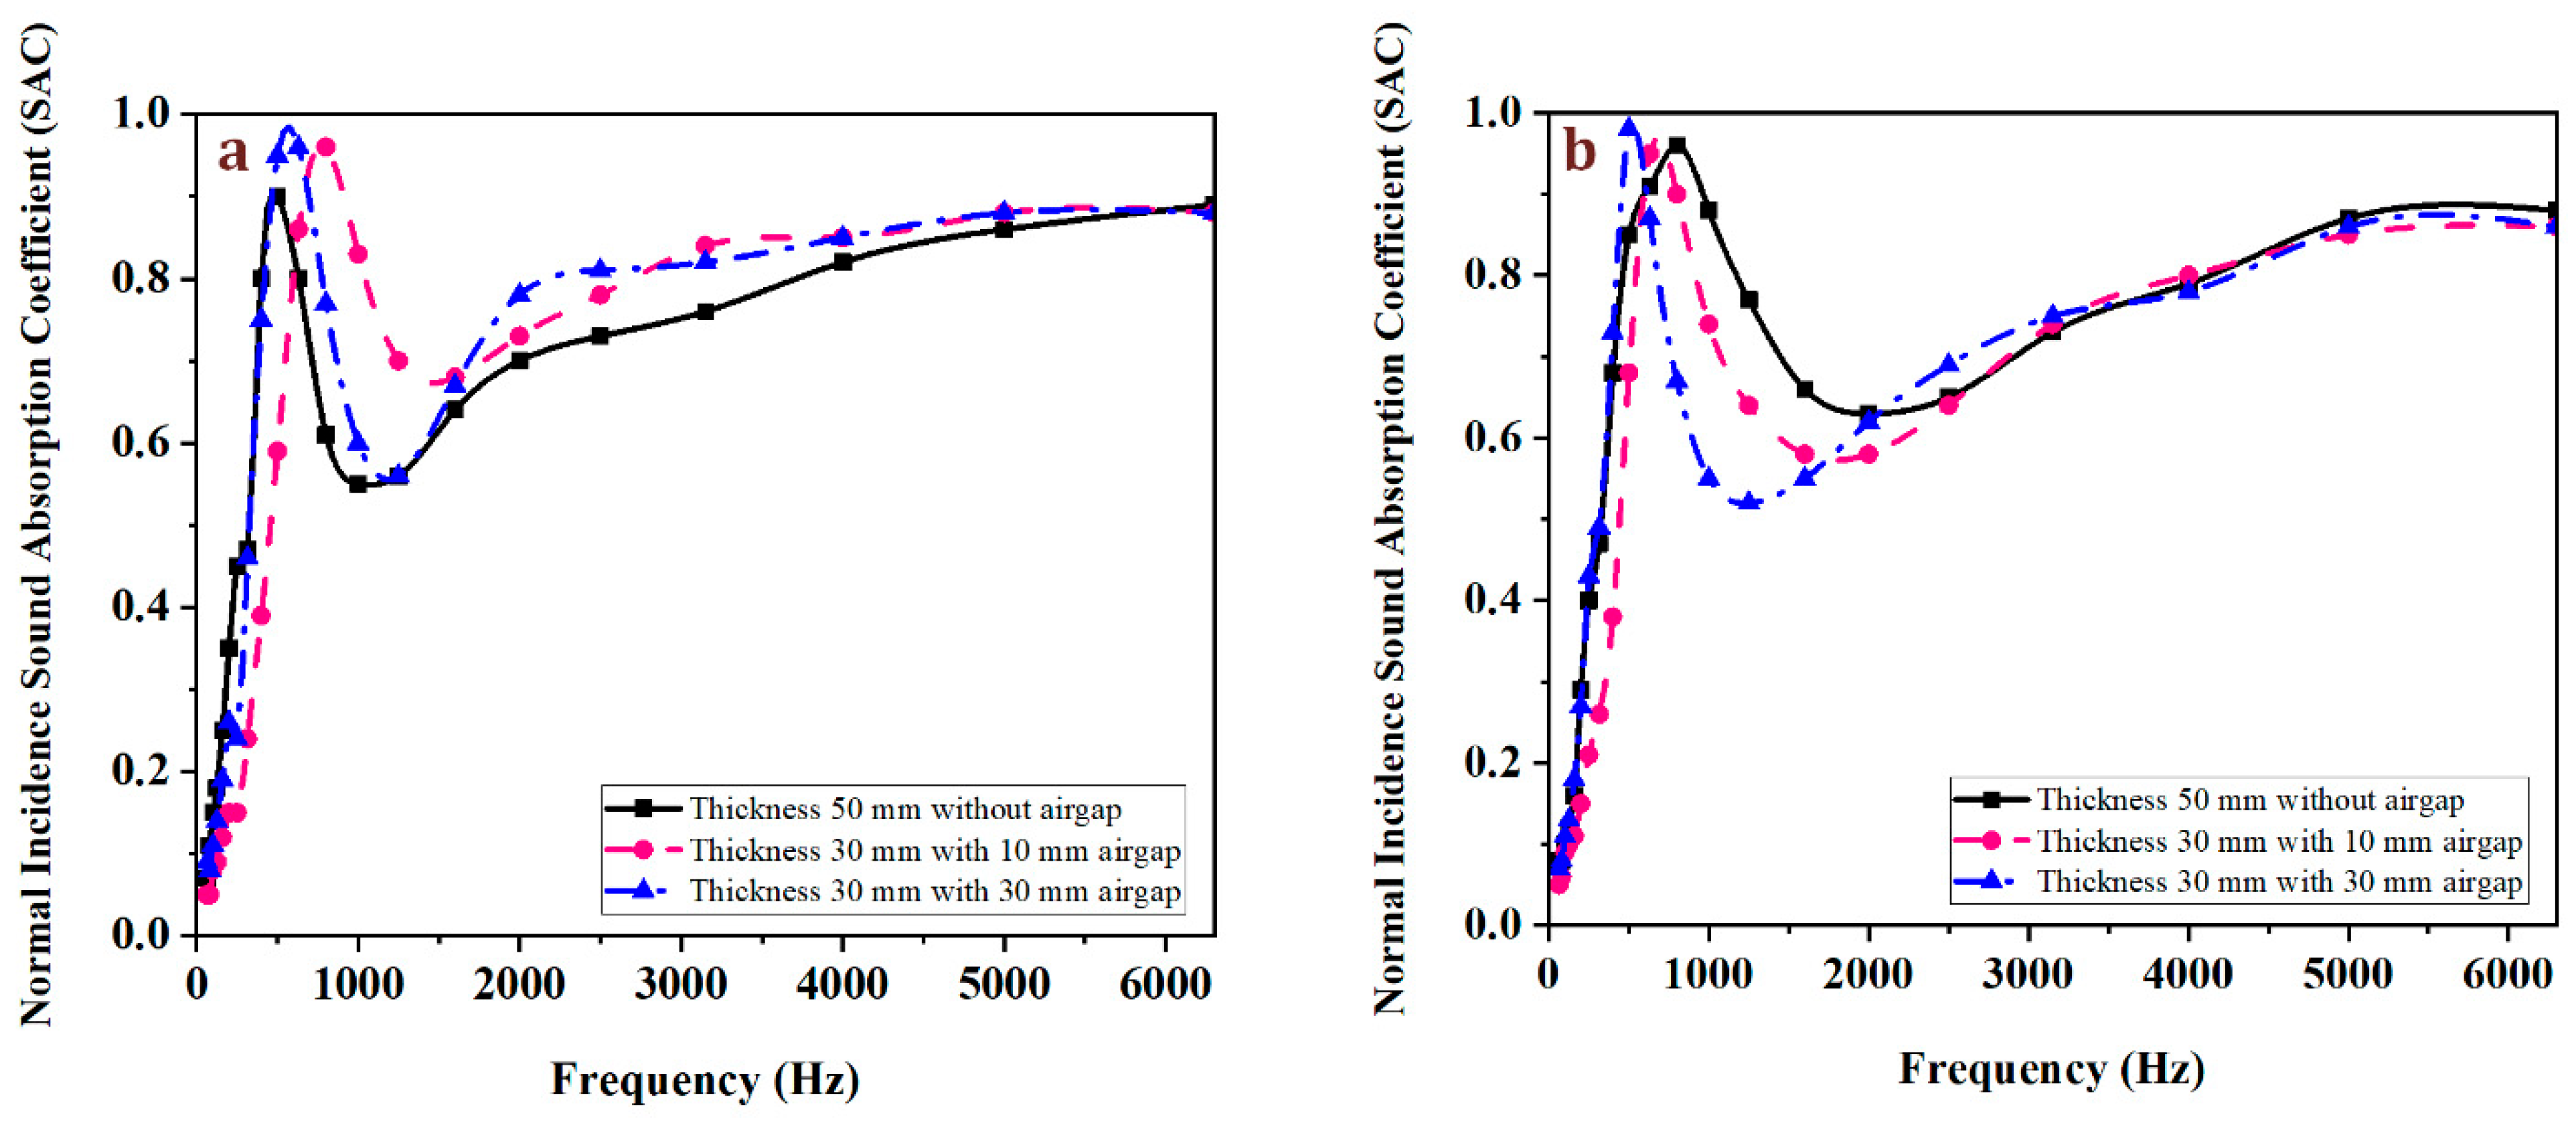
Creating a controlled air cavity between the RFPUF panel and the rigid backing offers an effective means of enhancing low-frequency sound absorption without proportionally increasing material usage. In acoustic theory, such a cavity effectively extends the absorber’s operational depth toward the quarter wavelength (λ/4) condition, where maximum absorption occurs. This not only shifts peak absorption to lower frequencies, which are traditionally a challenge for lightweight porous materials, but also reduces raw material consumption, lowering both manufacturing costs and weight. As shown in Figure 7, the introduction of air gaps of 10 mm and 30 mm behind 30 mm-thick RFPUFs significantly improved the SAC profile. For eucalyptus-based composites, the SAA rose from 0.59 with a 10 mm gap to 0.65 with a 30 mm gap, approaching the performance of the optimized 50 mm-thick specimen (0.63). Poplar-based composites followed a similar trend, reaching 0.61 (10 mm gap) and 0.68 (30 mm gap) compared to 0.68 for the 50 mm-thick reference. These results demonstrate that properly designed air gaps can nearly bridge the performance gap between thinner and thicker specimens in the critical mid-to-low frequency range.
The enhancement mechanism can be attributed to two synergistic effects. First, the air gap increases the effective acoustic path length, enabling incident sound waves to undergo multiple interactions with the porous structure and lose more energy via viscous and thermal processes. Second, the cavity acts as part of a Helmholtz-type mass–spring system: the RFPUF layer behaves as the oscillating mass, while the trapped air column acts as the spring. At resonance, this configuration enhances energy transfer from the sound field into the absorber’s internal damping pathways [77]. However, this benefit is not without trade-offs. As seen in Figure 7b, larger gaps can induce localized SAC reductions at certain higher frequencies. This is linked to the formation of standing waves within the cavity, corresponding to half-wavelength resonances governed by the combined depth of the air gap and the absorber [78]. These dips can be mitigated through careful geometric tuning or by combining gap adjustment with other structural optimizations. From an engineering standpoint, the use of air gaps transforms absorber design into a tunable system, where low-frequency performance, weight, and cost can be balanced without sacrificing the broadband absorption profile. In the context of sustainable materials, this approach is particularly appealing for RFPUF-based panels, as it preserves their competitive thermal insulation properties (Section 3.1.1) while enabling acoustic performance on par with or exceeding that of thicker, resource-intensive alternatives.

3.3. Modeling Results

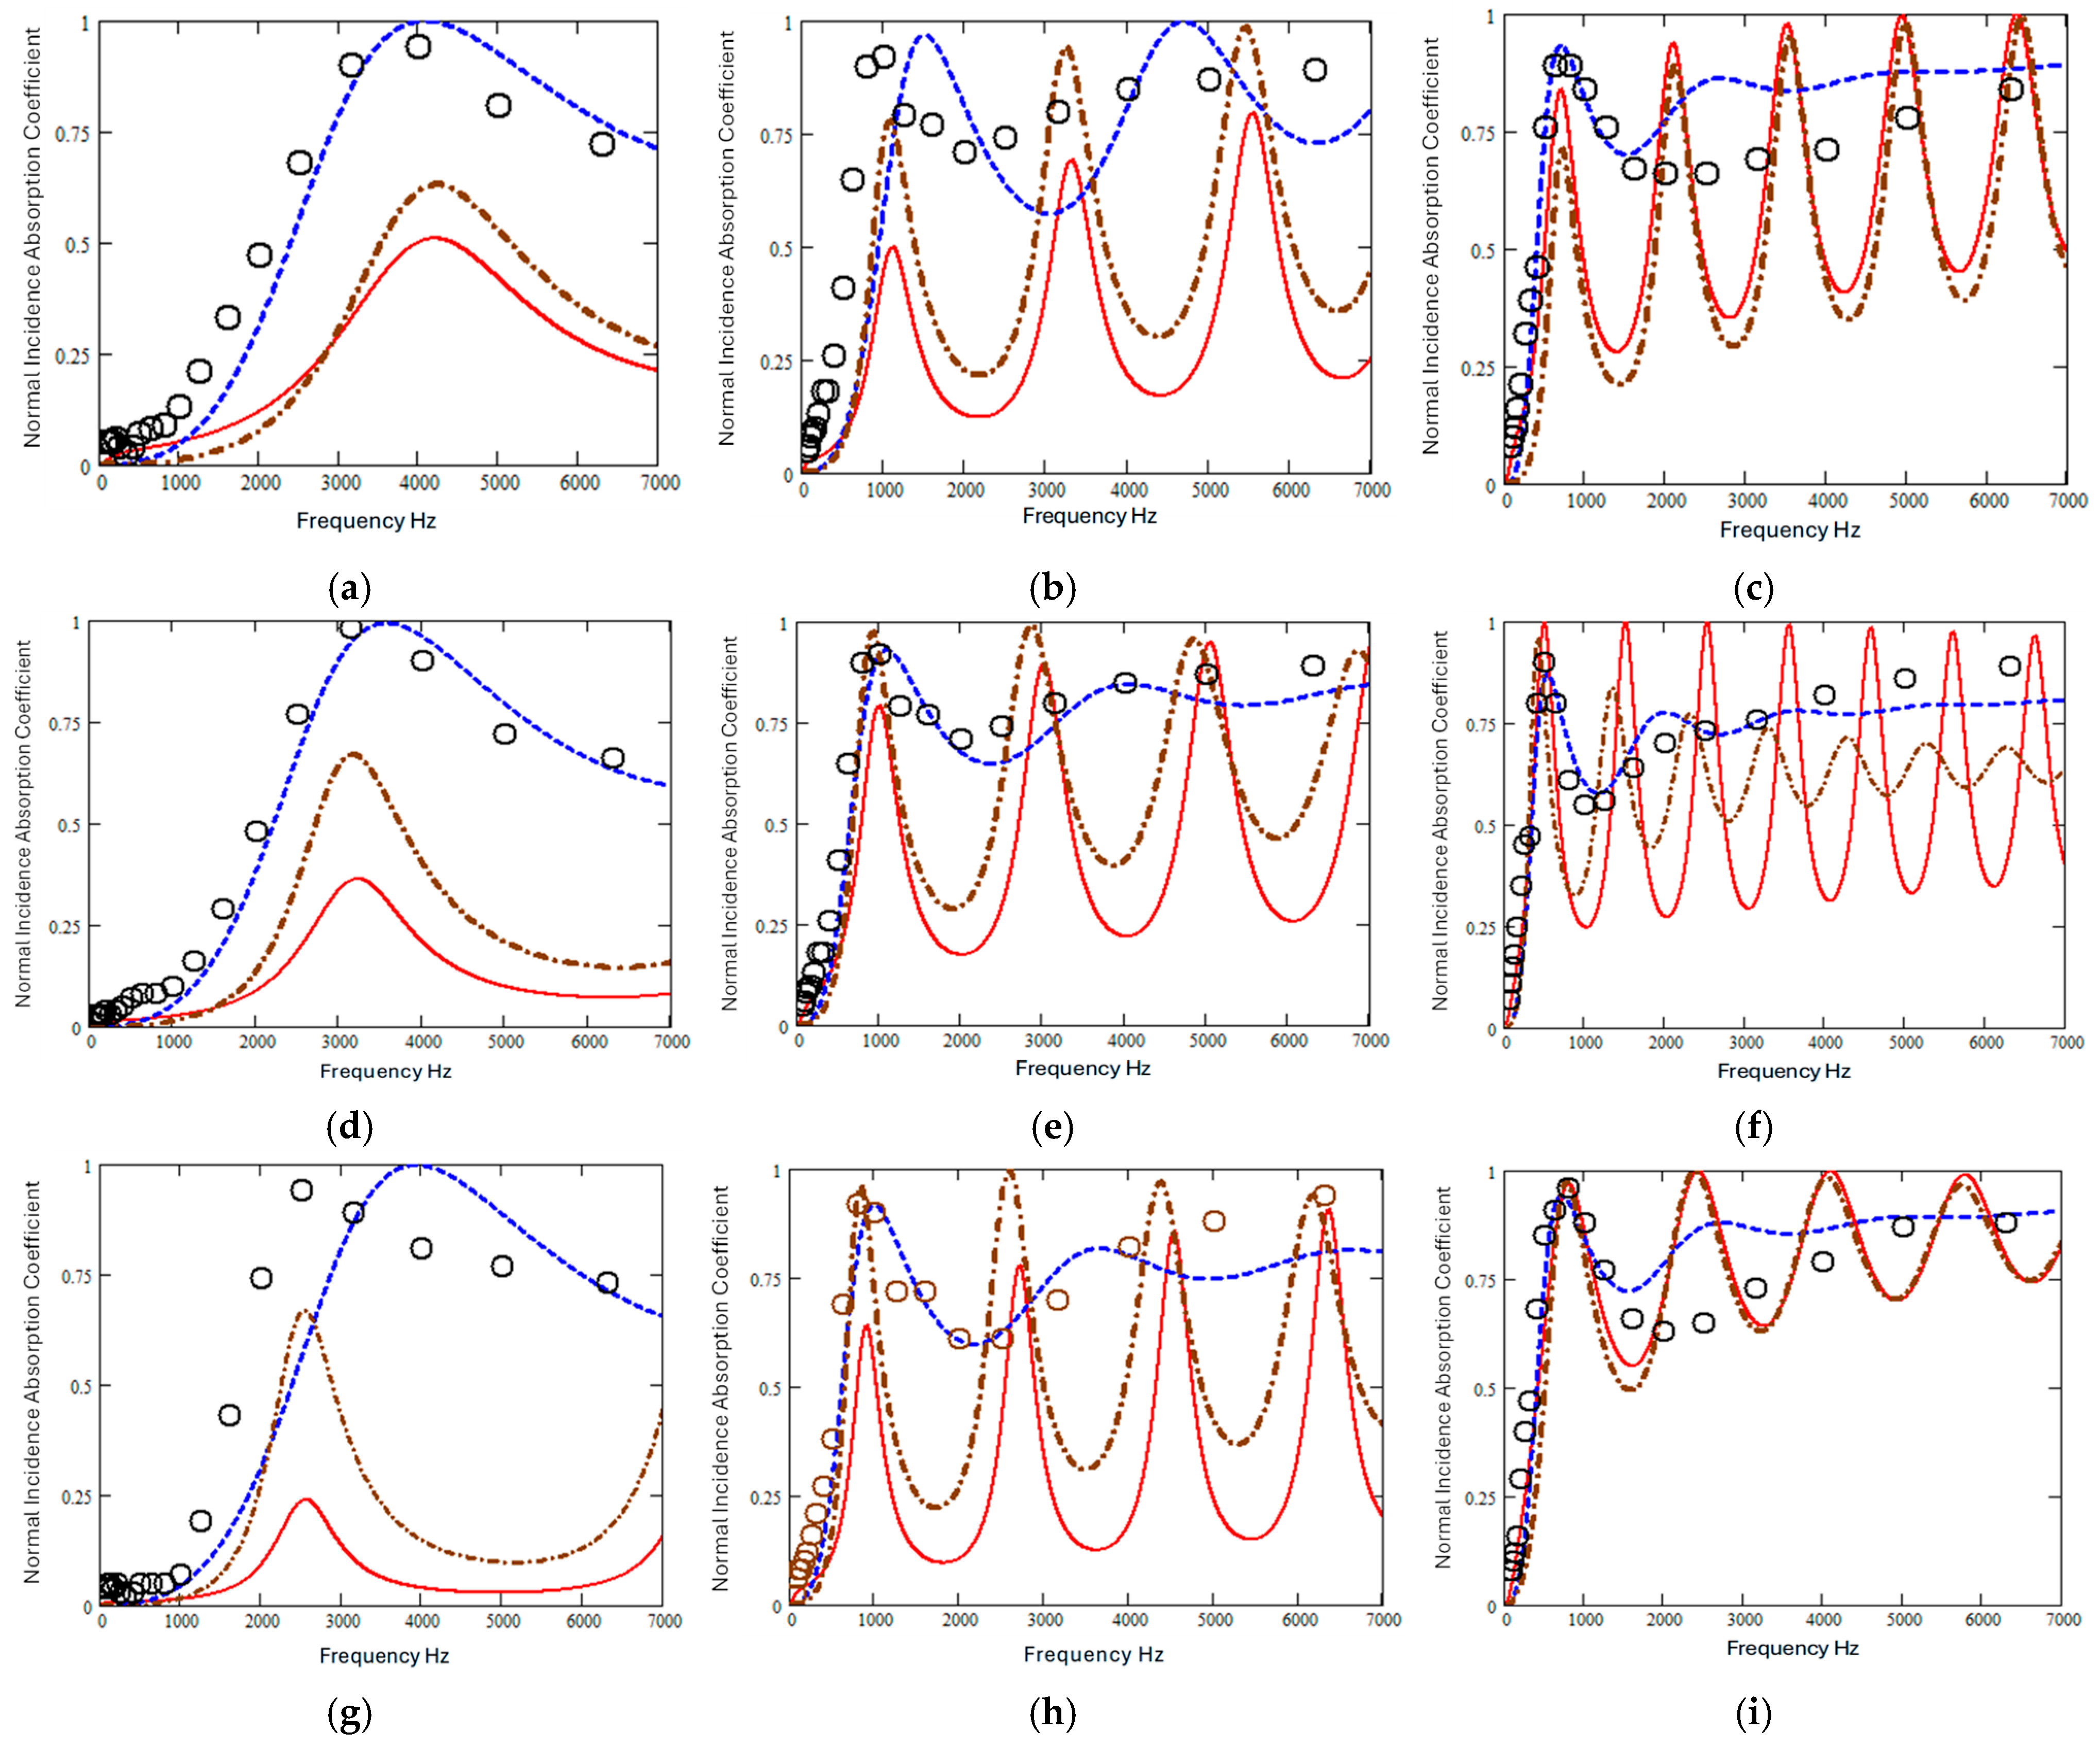
Figure 8 compares normal incidence absorption coefficient data for PU foam samples of three thicknesses without and with the addition of the two types of sawdust (mesh 16), with best fit predictions of the JCAL model and predictions of the NUPSD model based on the frequency of the first quarter wavelength resonance in the absorption spectra. Predictions of both models use the measured porosity and flow resistivity values. The JCAL model fits have been obtained through a Python 3.11 script developed by ChatGPT. The bounds that were applied to the parameter values could result in underestimations. Nevertheless, the JCAL model fits the data for the PU foam samples well. Except for the 10 mm thick PU foam and poplar sawdust mixture, the fits to absorption data for the foam and sawdust mixtures are reasonable.
Table 6 lists the parameter values used in the predictions. The corresponding values of the constants in the simplified JCAL model are shown in Table 7. Since these are based on the published values for wool [34], they are included for comparison. The values of the constants have been deduced from the measured porosity, flow resistivity and fitted values of the other JCAL parameters rather than from regression on the measured absorption coefficients using the forms of Equations (18)–(22).
The predictions of the NUPSD model for the PU foam absorption spectra, obtained by using the measured porosity, flow resistivity and the frequency of the first quarter wavelength resonance to estimate tortuosity, are poor. This is not surprising since synthetic foams are unlikely to have log normal pore size distributions. Moreover, the NUPSD model predicts significantly higher values of tortuosity than result from fitting the JCAL model. While the NUPSD predictions for the absorption spectra of the 50 mm thick samples of foam and sawdust mixtures are better than for thinner samples, they are not as good as the predictions obtained by fitting the JCAL model.
The thermal characteristic length in the JCAL model is associated with the wider pore cross sections, while the viscous characteristic length is associated with narrower pore cross sections. This means that the former should be significantly greater than the latter [35,37,38]. This suggests that the viscous and thermal characteristic lengths resulting from the JCAL model fit to the 30 mm thick PU foam data are unrealistically close. Furthermore, it is physically inadmissible that the fitted thermal characteristic length for the 10 mm thick foam and poplar sawdust mix sample is lower than the fitted viscous characteristic length.
Another difficulty with the JCAL model fit values is that the fitted tortuosity values for 30 mm thick samples of PU foam with added sawdust are less than the fitted values for ‘pure’ PU foam samples with the same thickness. The values of tortuosity predicted by the NUPSD model using the quarter wavelength resonance frequency are unrealistically high, but nevertheless, those predicted for the foam and sawdust mixtures are higher than those predicted for the ‘pure’ foam, which is consistent with the finding elsewhere [71,72,73] that adding fibers increases tortuosity. According to the NUPSD model relationship (30), this means that the fibers create wider pore size distributions.
Also, for relatively low flow resistivities, tortuosity has an important influence on the frequency of the first quarter wavelength resonance, whereas the fitting procedure for the JCA model gives equal weight to all parameters and all frequencies. Even though the procedure finds the global optimum fit, and the agreement of the fits with data is good, the fitting might not result in correct parameter values.

3.4. The Impact of Combining Different Ratios of Eucalyptus and Poplar Sawdust

The acoustic performance of RFPUF composites was strongly influenced by the relative proportions of eucalyptus and poplar sawdust (Figure 9). Five formulations were investigated: pure poplar as reinforcement (100 P), pure eucalyptus as reinforcement (100 E), and mixed ratios of 30/70, 50/50, and 70/30 eucalyptus/poplar by weight. The 100% poplar reinforced sample exhibited the highest low-to-mid frequency absorption, with the SAC increasing sharply to 0.96 at 800 Hz, followed by a slight dip and a secondary rise at higher frequencies. In contrast, the 100% eucalyptus reinforced sample peaked earlier—0.90 at 500 Hz—and displayed noticeably lower absorption in the mid-frequency band. Mixed formulations showed intermediate responses: the 30/70 E/P blend closely resembled the 100 E profile, with a 0.94 peak at 500 Hz; the 50/50 E/P blend demonstrated a broader absorption curve, peaking at 0.92 at 800 Hz and sustaining high SAC (0.89) at 1000 Hz; the 70/30 E/P blend exhibited a high-frequency peak at 5000 Hz (0.91) but considerably lower performance within the speech-dominated 500–2000 Hz range. The SAA values reflected these differences, with 0.68 for 100 P, 0.63 for 100 E, 0.63 for 30/70 E/P, 0.62 for 50/50 E/P, and 0.48 for 70/30 E/P.
These variations can be explained by differences in fiber density and the resulting pore morphology. Poplar sawdust, being lighter and less dense, creates a more open and interconnected pore network within the PU matrix, facilitating deeper penetration of sound waves and increasing the solid–air interfaces. This enhances viscous and thermal energy dissipation, mechanisms particularly effective in the 500–2000 Hz range [79]. In contrast, eucalyptus sawdust, with its higher density and stiffness, forms a more compact microstructure with reduced pore interconnectivity, which limits low-frequency absorption [80]. Among the tested formulations, the 50/50 E/P blend offered the most balanced performance, combining high SAC across a broad frequency range with maintained mechanical integrity. These results suggest that tuning the eucalyptus-to-poplar ratio offers a practical means to customize RFPUFs for specific acoustic applications, prioritizing low-frequency attenuation with higher poplar content or achieving broadband sound absorption with a balanced composition.

3.5. Comparison of Chemical Treatment Effects

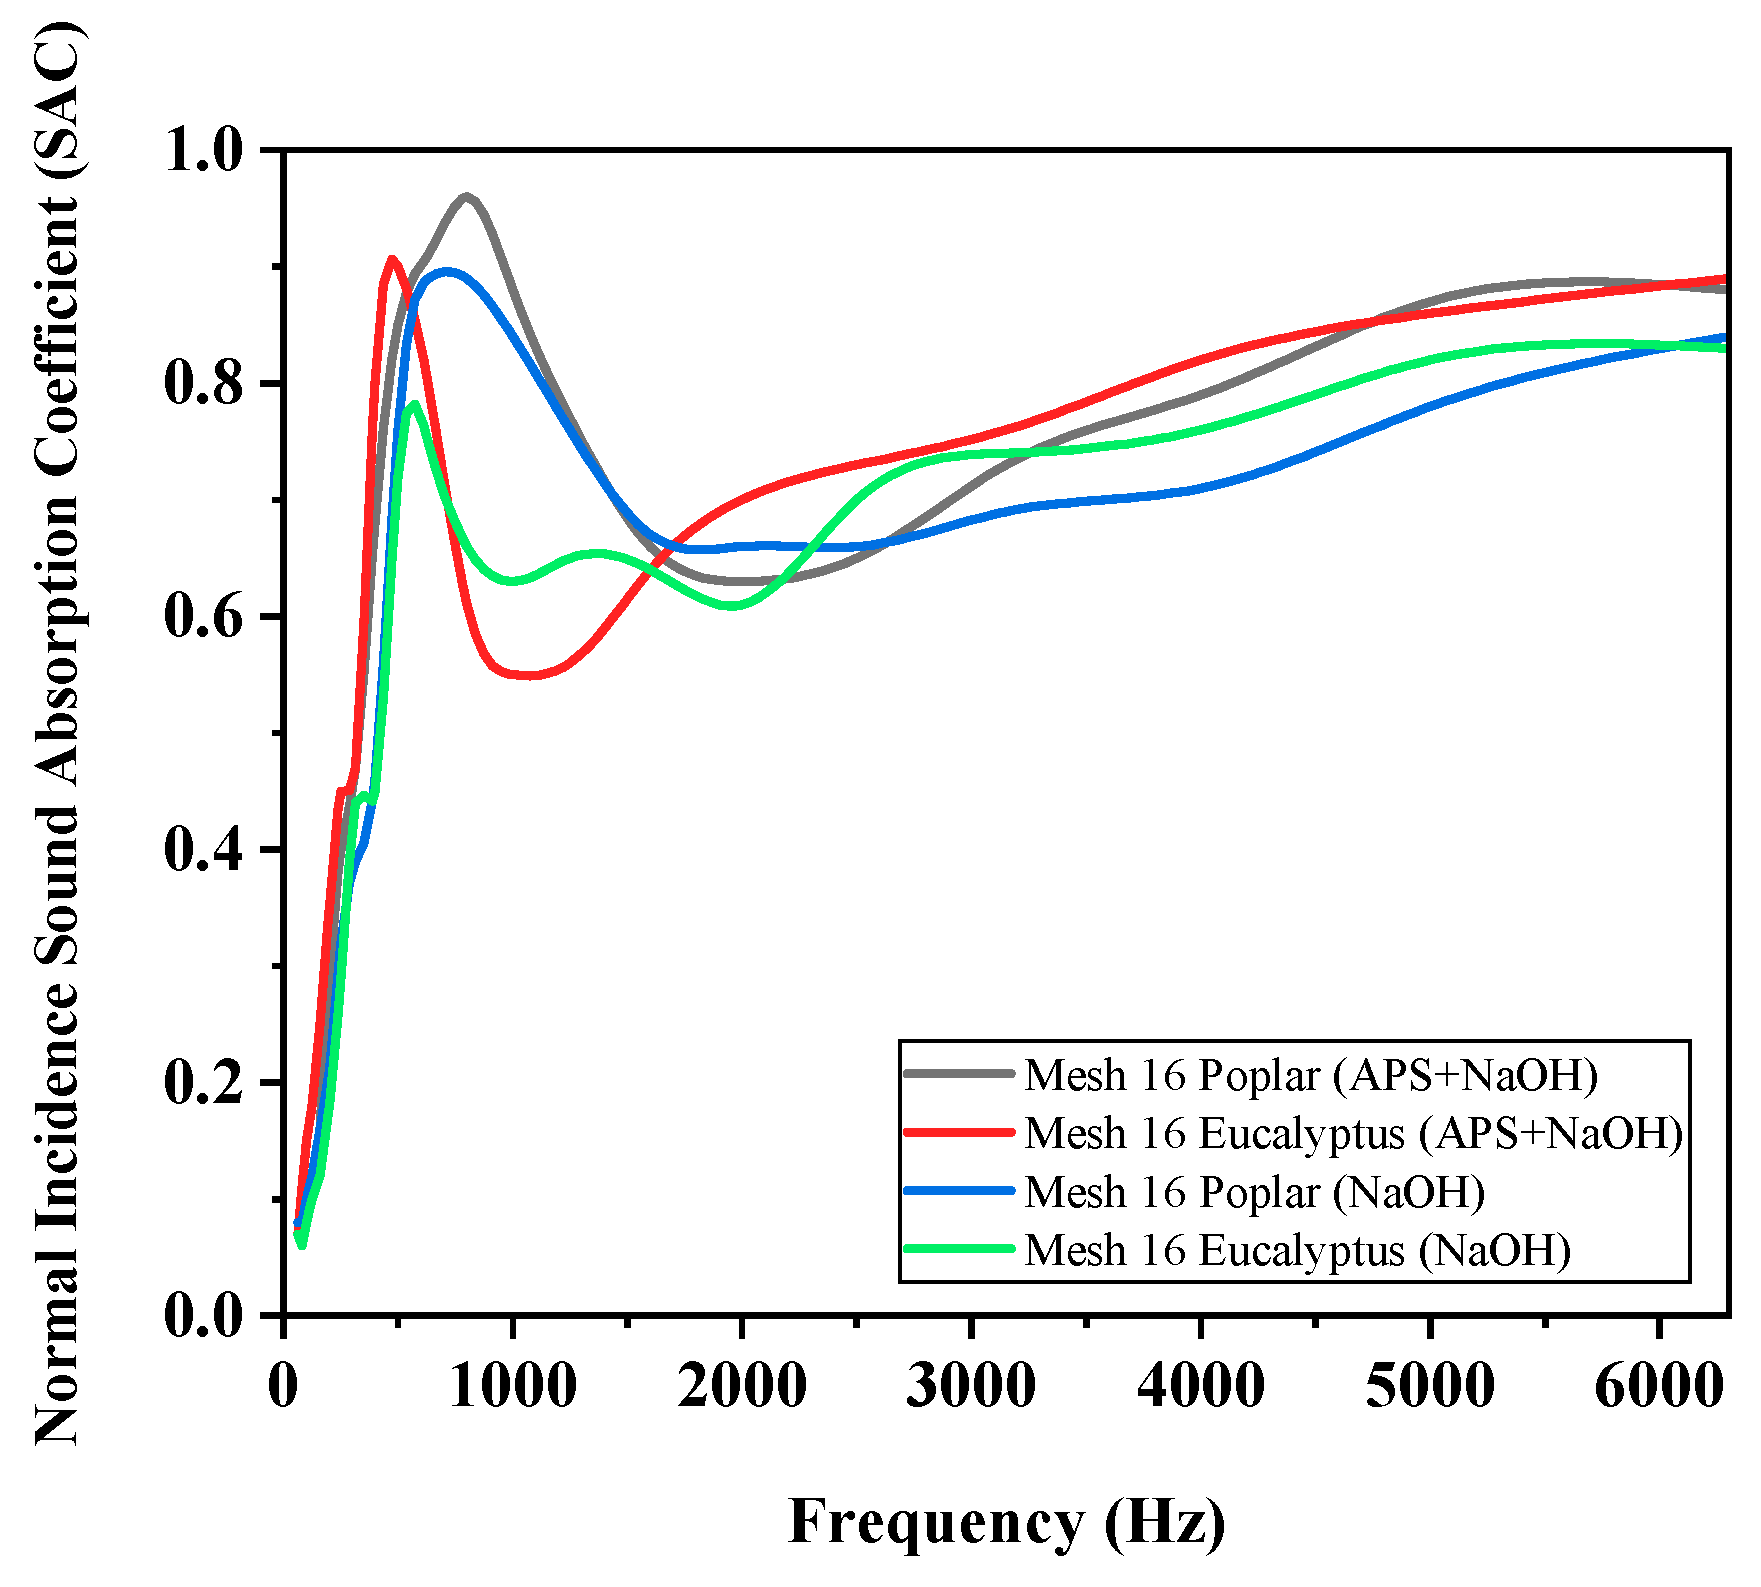
Building upon the morphological findings in Section 3.1.3 and the species-dependent acoustic responses discussed in Section 3.4, Figure 10 compares the normal-incidence SAC of RFPUF composites reinforced with poplar or eucalyptus sawdust subjected to two chemical modification routes: NaOH alone and a sequential ammonium persulfate (APS) + NaOH treatment.
The APS + NaOH-treated poplar composite exhibited the highest broadband absorption, maintaining SAC values close to or above 0.9 across a wide frequency range. The APS + NaOH-treated eucalyptus composite also showed marked improvements, particularly in the low-frequency region (<1000 Hz) and again at higher frequencies (>2000 Hz). These enhancements can be directly linked to the interplay between species-specific microstructure and treatment chemistry. Poplar’s lower density and inherently open cellular structure [36] allow the oxidative APS + NaOH sequence to penetrate more deeply into the cell wall, increasing surface roughness, microporosity, and inter-fiber channel connectivity. APS acts as a potent oxidizing agent, partially degrading lignin and hemicellulose, while NaOH removes extractives and swells cellulose microfibrils, both of which enhance fiber–matrix bonding. The resulting multi-scale pore network facilitates deeper sound wave penetration and promotes strong viscous–thermal dissipation over a broad frequency range. Eucalyptus, by contrast, possesses a denser and more compact anatomy [80]. In this case, APS + NaOH treatment enhances low-frequency performance primarily through improved pore connectivity and high-frequency performance via increased surface texturing, but yields less pronounced gains in the mid-frequency band due to limited tortuosity modification.
NaOH treatment alone produced more moderate morphological changes but was still advantageous for targeted acoustic performance. Notably, NaOH-treated poplar composites displayed high SAC values within the 500–2000 Hz range, critical for speech and everyday environmental noise control. This aligns with observations by Samaei et al. [15], who reported that NaOH-treated kenaf fibers in PU foams exhibited strong low-to-mid frequency absorption due to an optimized, but not overly degraded, pore structure. The APS + NaOH-treated poplar composites offer broadband acoustic insulation, making them suitable for architectural panels, automotive interiors, and industrial noise control. The APS + NaOH-treated eucalyptus and NaOH-treated poplar offer performance advantages in frequency-specific applications such as speech-frequency absorbers or tuned noise barriers. These findings highlight the importance of matching wood species with tailored chemical treatment protocols to engineer bio-based PU composites that combine sustainability, tunable acoustic properties, and competitive thermal insulation.

4. Conclusions

Acoustic, thermal, and mechanical properties of 24 hybrid composites composed of a Polyurethane matrix and poplar and eucalyptus fillers, along with the influences of thickness, particle mesh size, airflow resistivity, and backing airgaps have been investigated. The principal findings of this research are summarized below.
  • The sawdust-reinforced PU samples (Mesh 16) achieved NRC values exceeding 0.65, matching or surpassing the performance of commercially available acoustic foams. Also, the SAA values for samples (12, 15, 18, and 24) are higher than those of PU foam. For example, the SAA of the composite made of PU and poplar sawdust (sample 18) was calculated to be 0.68, which represents an increase of 9.68% over the calculated value of 0.62 for the PU foam
  • Increasing sample thickness from 10 mm to 50 mm enhances the sound absorption coefficient (SAC) in the low- and mid-frequency ranges and shifts the first peak in the absorption spectra to lower frequencies.
  • Increasing the mesh size (i.e., decreasing particle size) significantly enhances the normal incidence SAC across a broad frequency range, while also shifting the absorption peak to lower frequencies. Finer particles lead to increased airflow resistivity (σ), thereby improving acoustic efficiency. Samples with finer mesh sizes offer improved performance in the mid-frequency range of 500 to 2000 Hz, which is crucial for speech and common indoor noise sources.
  • Introducing an air gap behind the sample enhances absorption at lower frequencies. This can produce absorption coefficient spectra comparable to those achieved with thicker materials, potentially reducing manufacturing costs.
  • The effective thermal conductivity (Keff) values for the mesh 16 samples were measured at 0.044 W/mK, indicating a useful insulation performance.
  • The mesh 16 samples demonstrated suitable tensile strengths of 0.06330 MPa for eucalyptus-reinforced foam and 0.06105 MPa for poplar-reinforced foam, respectively. Overall, the addition of Mesh 16 sawdust fibers offers the best balance between thermal insulation, acoustic properties, and structural integrity.
  • The poplar composite treated with APS + NaOH exhibited the best broadband absorption, maintaining SAC values of approximately 0.9 or higher across a broad frequency spectrum. The eucalyptus composite treated with APS + NaOH also showed significant enhancements. NaOH-treated poplar composites exhibited high SAC values in the 500–2000 Hz range, which is crucial for controlling speech and everyday environmental noise.
  • The JCAL model fits the data for both PU foam and PU foam and sawdust mixtures well, albeit some of the fitted parameter values are questionable. The NUPSD model predictions based on measured porosity, flow resistivity and the frequency of the first quarter wavelength resonance in the absorption spectra for hard-backed samples are relatively poor, but the NUPSD model predicts significantly higher values of tortuosity than result from fitting the JCAL model.
Overall, it has been shown that adding natural fibers to PU foam offers several environmental benefits due to their lightweight nature, cost efficiency, and ease of recycling. Moreover, the incorporation of natural fibers has been observed to accelerate the biodegradation rates of polyurethane (PU) foam composites. The novel hybrid composite materials investigated have good multifunctionality, making them widely useful as well as eco-friendly.

Author Contributions

B.M.: Concept, design, writing; E.T.: Supervision, writing, analysis; A.K.: Supervision, final approval; K.A.: analysis, writing, reviewing and editing. All authors have read and agreed to the published version of the manuscript.

Funding

No external funding was used in the preparation of this paper.

Data Availability Statement

The raw data supporting the conclusions of this article will be made available by the authors on request.

Acknowledgments

During the preparation of this manuscript, the authors used ChatGPT to fit absorption coefficient data with the JCAL model. The authors have reviewed the output and take full responsibility for the associated content in this publication.

Conflicts of Interest

The authors declare no confilict of interest.

References

  1. Mohamed, A.-M.O.; Paleologos, E.K.; Howari, F.M. Noise pollution and its impact on human health and the environment. In Pollution Assessment for Sustainable Practices in Applied Sciences and Engineering; Elsevier: Amsterdam, The Netherlands, 2021; pp. 975–1026. [Google Scholar]
  2. He, M.; Perrot, C.; Guilleminot, J.; Leroy, P.; Jacqus, G. Multiscale prediction of acoustic properties for glass wools: Computational study and experimental validation. J. Acoust. Soc. Am. 2018, 143, 3283–3299. [Google Scholar] [CrossRef]
  3. Morales, J.J.P.; Resuello, J.L.S.; Camacho, M.; Estorico, G.C. Noise Pollution in Urban Transport: A Systematic Review of Health Impacts from Buses, Trains, and Motorcycles. Int. J. Innov. Sci. Res. Technol. 2025, 10, 564–576. [Google Scholar] [CrossRef]
  4. Yang, T.; Hu, L.; Xiong, X.; Petrů, M.; Noman, M.T.; Mishra, R.; Militký, J. Sound absorption properties of natural fibers: A review. Sustainability 2020, 12, 8477. [Google Scholar] [CrossRef]
  5. Arenas, J.P.; del Rey, R.; Alba, J.; Oltra, R. Sound-absorption properties of materials made of esparto grass fibers. Sustainability 2020, 12, 5533. [Google Scholar] [CrossRef]
  6. Mylsamy, B.; Shanmugam, S.K.M.; Aruchamy, K.; Palanisamy, S.; Nagarajan, R.; Ayrilmis, N. A review on natural fiber composites: Polymer matrices, fiber surface treatments, fabrication methods, properties, and applications. Polym. Eng. Sci. 2024, 64, 2345–2373. [Google Scholar] [CrossRef]
  7. Haghighat, M.; Samaei, S.E.; Amininasab, S.; Faridan, M.; Mehrzad, S.; Sheikhmozafari, M.J.; Taban, E. The Impact of Fiber Size on the Sound Absorption Behavior of Composites Made from Sugarcane Bagasse Wastes Fibers. J. Nat. Fibers 2023, 20, 2175760. [Google Scholar] [CrossRef]
  8. SheikhMozafari, M.J.; Taban, E.; Soltani, P.; Faridan, M.; Khavanin, A. Sound absorption and thermal insulation performance of sustainable fruit stone panels. Appl. Acoust. 2024, 217, 109836. [Google Scholar] [CrossRef]
  9. Olcay, H.; Kocak, E.D. Rice plant waste reinforced polyurethane composites for use as the acoustic absorption material. Appl. Acoust. 2021, 173, 107733. [Google Scholar] [CrossRef]
  10. Mohammadi, M.; Ishak, M.R.; Sultan, M.T.H. Exploring chemical and physical advancements in surface modification techniques of natural fiber reinforced composite: A comprehensive review. J. Nat. Fibers 2024, 21, 2408633. [Google Scholar] [CrossRef]
  11. Kino, N.; Nakano, G.; Suzuki, Y. Non-acoustical and acoustical properties of reticulated and partially reticulated polyurethane foams. Appl. Acoust. 2012, 73, 95–108. [Google Scholar] [CrossRef]
  12. Yeşilyurt, A.; Parın, F.N.; Uysal, N. Mechanical, Thermal, and Sound Properties of Bamboo-Powder-Filled Polyurethane Composites. ChemistrySelect 2024, 9, e202401976. [Google Scholar] [CrossRef]
  13. MB, S.; GC, M.K.; Pitchaimani, J. Acoustic characterization of natural areca catechu fiber-reinforced flexible polyurethane foam composites. J. Appl. Polym. Sci. 2024, 141, e54866. [Google Scholar]
  14. Roseli, A.I.; Mat Hassan, N.N.; Abdul Mutalib Leman, A.M.L.; Abdul Latif, N.; Yulfian Aminanda, Y.A.; Djoko Setyanto, D.S.; Yuyun Tajunnusa, Y.T.; Yonrapach Areerob, Y.A.; Methawee Nukunudompanich, M.N. The Physical and Sound Absorption Property of Lightweight Rigid Polyurethane Composite Reinforced Bamboo Fiber for Roof Applications. J. Adv. Res. Appl. Sci. Eng. Technol. 2023, 31, 268–280. [Google Scholar] [CrossRef]
  15. Samaei, S.E.; Berardi, U.; Mahabadi, H.A.; Soltani, P.; Taban, E. Optimization and modeling of the sound absorption behavior of polyurethane composite foams reinforced with kenaf fiber. Appl. Acoust. 2023, 202, 109176. [Google Scholar] [CrossRef]
  16. Kocak, E.D.; Olcay, H.; Yildiz, Z. Mechanical and acoustic properties of alkali treated agricultural waste reinforced sustainable polyurethane composites. J. Reinf. Plast. Compos. 2023, 42, 1191–1203. [Google Scholar] [CrossRef]
  17. Tiuc, A.-E.; Borlea, S.I.; Nemeș, O.; Vermeșan, H.; Vasile, O.; Popa, F.; Pințoi, R. New composite materials made from rigid/flexible polyurethane foams with fir sawdust: Acoustic and thermal behavior. Polymers 2022, 14, 3643. [Google Scholar] [CrossRef] [PubMed]
  18. Udokpoh, U.; Nnaji, C. Reuse of sawdust in developing countries in the light of sustainable development goals. Recent Prog. Mater. 2023, 5, 1–33. [Google Scholar] [CrossRef]
  19. Singh, B.K.; Tomar, A. Growth and Biomass Models for Three Fast-growing Tree Species under High-density Plantation. Int. J. Environ. Clim. Change 2024, 14, 562–570. [Google Scholar] [CrossRef]
  20. Zhang, Y.; Chen, J.; Zhang, L.; Zhan, P.; Liu, N.; Wu, Z. Preparation of nanocellulose from steam exploded poplar wood by enzymolysis assisted sonication. Mater. Res. Express 2020, 7, 035010. [Google Scholar] [CrossRef]
  21. Sannigrahi, P.; Ragauskas, A.J.; Tuskan, G.A. Poplar as a feedstock for biofuels: A review of compositional characteristics. Biofuels Bioprod. Biorefining 2010, 4, 209–226. [Google Scholar] [CrossRef]
  22. Chen, X.; Zhang, K.; Xiao, L.-P.; Sun, R.-C.; Song, G. Total utilization of lignin and carbohydrates in Eucalyptus grandis: An integrated biorefinery strategy towards phenolics, levulinic acid, and furfural. Biotechnol. Biofuels 2020, 13, 2. [Google Scholar] [CrossRef]
  23. Masruri, B.; Khavanin, A.; Taban, E.; Amininasab, S. Enhancing the acoustic performance of eucalyptus and poplar wood via ammonium persulfate treatment: Structural and functional insights. Appl. Acoust. 2025, 240, 110983. [Google Scholar] [CrossRef]
  24. Standard Test Methods for Evaluating Properties of Wood-Base Fiber and Particle Panel Materials. ASTM D1037-12(2020); ASTM International: West Conshohocken, PA, USA, 2020.
  25. ASTM D3776/D3776M-20(2025); Standard Test Methods for Mass per Unit Area (Weight) of Fabric. ASTM International: West Conshohocken, PA, USA, 2025.
  26. SRPS, E. 9053-1; Acoustics—Determination of Airflow Resistance—Part 1: Static Airflow Method. Institute for Standardization of Serbia: Belgrade, Serbia, 2019.
  27. ASTM C177-19; Standard Test Method for Steady-State Heat Flux Measurements and Thermal Transmission Properties by Means of the Guarded-Hot-Plate Apparatus. ASTM: West Conshohocken, PA, USA, 2019.
  28. Zhu, J. Impact of Size Distribution of Cell Model on the Effective Thermal Conductivity of Saturated Porous Media. Int. J. Thermophys. 2020, 41, 34. [Google Scholar] [CrossRef]
  29. Rezgar, H.; Taher, A.; Ali, D.; Richard, E.L. Thermal Conductivity of Low Density Polyethylene Foams Part I: Comprehensive Study of Theoretical Models. J. Therm. Sci. 2019, 28, 745–754. [Google Scholar] [CrossRef]
  30. Hasanzadeh, R.; Azdast, T.; Doniavi, A.; Lee, R.E. Multi-objective optimization of heat transfer mechanisms of microcellular polymeric foams from thermal-insulation point of view. Therm. Sci. Eng. Prog. 2019, 9, 21–29. [Google Scholar] [CrossRef]
  31. König, J.; Lopez-Gil, A.; Cimavilla-Roman, P.; Rodriguez-Perez, M.A.; Petersen, R.R.; Østergaard, M.B.; Iversen, N.; Yue, Y.; Spreitzer, M. Synthesis and properties of open-and closed-porous foamed glass with a low density. Constr. Build. Mater. 2020, 247, 118574. [Google Scholar] [CrossRef]
  32. Soloveva, O.V.; Solovev, S.A.; Vankov, Y.V.; Shakurova, R.Z. Experimental studies of the effective thermal conductivity of polyurethane foams with different morphologies. Processes 2022, 10, 2257. [Google Scholar] [CrossRef]
  33. ASTM D3574-17; Standard Test Methods for Flexible Cellular Materials—Slab, Bonded, and Molded Urethane Foams. ASTM: West Conshohocken, PA, USA, 2017.
  34. ISO 10534-2; Acoustics—Determination of acoustic properties in impedance tubes Part 2: Two-Microphone Technique for Normal Sound Absorption Coefficient and Normal Surface Impedance. ISO: Geneva, Switzerland, 2023.
  35. ASTM C423; Standard Test Method for Sound Absorption and Sound Absorption Coefficients by the Reverberation Room Method. ASTM: West Conshohocken, PA, USA, 2023.
  36. Horoshenkov, K.V.; Swift, M.J. The acoustic properties of granular materials with pore size distribution close to log-normal. J. Acoust. Soc. Am. 2001, 110, 2371–2378. [Google Scholar] [CrossRef]
  37. Allard, J.F.; Champoux, Y. New empirical equations for sound propagation in rigid frame fibrous materials. J. Acoust. Soc. Am. 1992, 91, 3346–3353. [Google Scholar] [CrossRef]
  38. Yang, T.; Eser, M.; Xiong, X.; Groby, J.-P.; Schmid, J.M.; Maeder, M.; Chang, Y.-H.; Marburg, S. Experiment-driven simplification of Johnson-Champoux-Allard-Lafarge model for fibrous materials. J. Acoust. Soc. Am. 2025, 157, 3497–3507. [Google Scholar] [CrossRef]
  39. Horoshenkov, K.V.; Hurrell, A.; Groby, J.-P. A three-parameter analytical model for the acoustical properties of porous media. J. Acoust. Soc. Am. 2019, 145, 2512–2517. [Google Scholar] [CrossRef]
  40. Saati, F.; Hoppe, K.-A.; Marburg, S.; Horoshenkov, K.V. The accuracy of some models to predict the acoustical properties of granular media. Appl. Acoust. 2022, 185, 108358. [Google Scholar] [CrossRef]
  41. Tran, V.H.; Kim, J.-D.; Kim, J.-H.; Kim, S.-K.; Lee, J.-M. Influence of cellulose nanocrystal on the cryogenic mechanical behavior and thermal conductivity of polyurethane composite. J. Polym. Environ. 2020, 28, 1169–1179. [Google Scholar] [CrossRef]
  42. Wang, D.; Peng, H.; Yu, B.; Zhou, K.; Pan, H.; Zhang, L.; Li, M.; Liu, M.; Tian, A.; Fu, S. Biomimetic structural cellulose nanofiber aerogels with exceptional mechanical, flame-retardant and thermal-insulating properties. Chem. Eng. J. 2020, 389, 124449. [Google Scholar] [CrossRef]
  43. Hasanzadeh, R.; Fathi, S.; Azdast, T.; Rostami, M. Theoretical Investigation and Optimization of Radiation Thermal Conduction of Thermal-Insulation Polyolefin Foams. Iran. J. Mater. Sci. Eng. 2020, 17, 58–65. [Google Scholar]
  44. Moghaddam, S.T.; Naimi-Jamal, M.R. Reinforced magnetic polyurethane rigid (PUR) foam nanocomposites and investigation of thermal, mechanical, and sound absorption properties. J. Thermoplast. Compos. Mater. 2019, 32, 1224–1241. [Google Scholar] [CrossRef]
  45. Chen, S.; Jiang, Y. The acoustic property study of polyurethane foam with addition of bamboo leaves particles. Polym. Compos. 2018, 39, 1370–1381. [Google Scholar] [CrossRef]
  46. Abdou, A.; Budaiwi, I. The variation of thermal conductivity of fibrous insulation materials under different levels of moisture content. Constr. Build. Mater. 2013, 43, 533–544. [Google Scholar] [CrossRef]
  47. Olcay, H.; Kocak, E.D. The mechanical, thermal and sound absorption properties of flexible polyurethane foam composites reinforced with artichoke stem waste fibers. J. Ind. Text. 2022, 51, 8738S–8763S. [Google Scholar] [CrossRef]
  48. Hýsek, Š.; Neuberger, P.; Sikora, A.; Schönfelder, O.; Ditommaso, G. Waste utilization: Insulation panel from recycled polyurethane particles and wheat husks. Materials 2019, 12, 3075. [Google Scholar] [CrossRef]
  49. Shao, H.; Zhang, Q.; Liu, H.; Guo, W.; Jiang, Y.; Chen, L.; He, L.; Qi, J.; Xiao, H.; Chen, Y. Renewable natural resources reinforced polyurethane foam for use of lightweight thermal insulation. Mater. Res. Express 2020, 7, 055302. [Google Scholar] [CrossRef]
  50. Członka, S.; Strąkowska, A.; Kairytė, A. The impact of hemp shives impregnated with selected plant oils on mechanical, thermal, and insulating properties of polyurethane composite foams. Materials 2020, 13, 4709. [Google Scholar] [CrossRef]
  51. Datta, J.; Kopczyńska, P. Effect of kenaf fibre modification on morphology and mechanical properties of thermoplastic polyurethane materials. Ind. Crops Prod. 2015, 74, 566–576. [Google Scholar] [CrossRef]
  52. Tomin, M.; Kmetty, A. Evaluating the cell structure-impact damping relation of cross-linked polyethylene foams by falling weight impact tests. J. Appl. Polym. Sci. 2021, 138, 49999. [Google Scholar] [CrossRef]
  53. Liu, L.; Liu, F.; Zenkert, D.; Åkermo, M.; Fagerström, M. Mesostructural origins of the anisotropic compressive properties of low-density closed-cell foams: A deeper understanding. arXiv 2025, arXiv:2503.03847. [Google Scholar] [CrossRef]
  54. Sathishkumar, G.; Ibrahim, M.; Mohamed Akheel, M.; Rajkumar, G.; Gopinath, B.; Karpagam, R.; Karthik, P.; Martin Charles, M.; Gautham, G.; Gowri Shankar, G. Synthesis and mechanical properties of natural fiber reinforced epoxy/polyester/polypropylene composites: A review. J. Nat. Fibers 2022, 19, 3718–3741. [Google Scholar] [CrossRef]
  55. Li, X.; Chua, J.W.; Yu, X.; Li, Z.; Zhao, M.; Wang, Z.; Zhai, W. 3D-printed lattice structures for sound absorption: Current progress, mechanisms and models, structural-property relationships, and future outlook. Adv. Sci. 2024, 11, 2305232. [Google Scholar] [CrossRef]
  56. Gwon, J.G.; Kim, S.K.; Kim, J.H. Sound absorption behavior of flexible polyurethane foams with distinct cellular structures. Mater. Des. 2016, 89, 448–454. [Google Scholar] [CrossRef]
  57. Lee, J.; Kim, G.H.; Ha, C.S. Sound absorption properties of polyurethane/nano-silica nanocomposite foams. J. Appl. Polym. Sci. 2012, 123, 2384–2390. [Google Scholar] [CrossRef]
  58. Lazzari, L.K.; Kerche, E.F.; Figueiredo, F.R.; de Albuquerque, R.F.; Bortoli, B.; Polkowski, R.D. Polyurethane Foam Coated with Organic Filers for Sound Absorption: A Briefre View; 0148-7191; SAE Technical Paper: Warrendale, PA, USA, 2024. [Google Scholar]
  59. Tiuc, A.E.; Nemeş, O.; Vermeşan, H.; Toma, A.C. New sound absorbent composite materials based on sawdust and polyurethane foam. Compos. Part B Eng. 2019, 165, 120–130. [Google Scholar] [CrossRef]
  60. Kurańska, M.; Barczewski, R.; Barczewski, M.; Prociak, A.; Polaczek, K. Thermal Insulation and Sound Absorption Properties of Open-Cell Polyurethane Foams Modified with Bio-Polyol Based on Used Cooking Oil. Materials 2020, 13, 5673. [Google Scholar] [CrossRef]
  61. Selvaraj, V.K.; Subramanian, J. Experimentation, simulation, and statistical analysis of nanofillers reinforced bio-based polyurethane foam for acoustical applications. Polym. Eng. Sci. 2023, 63, 1169–1183. [Google Scholar] [CrossRef]
  62. Shravage, P.; Jain, S.; Karanth, N. Effect of intrinsic parameters on sound absorption and transmission loss—A parametric study. In Proceedings of the INTER-NOISE and NOISE-CON Congress and Conference Proceedings, Lisbon, Portugal, 13–16 June 2010; International Institute of Noise Control Engineering: West Lafayette, IN, USA, 2010; pp. 664–673. [Google Scholar]
  63. Yilmaz, N.D.; Banks-Lee, P.; Powell, N.B.; Michielsen, S. Effects of porosity, fiber size, and layering sequence on sound absorption performance of needle-punched nonwovens. J. Appl. Polym. Sci. 2011, 121, 3056–3069. [Google Scholar] [CrossRef]
  64. De Salvio, D.; Fratoni, G.; D’Orazio, D.; Garai, M. Assessing human activity noise in workspaces using machine learning and numerical models. In Proceedings of the INTER-NOISE and NOISE-CON Congress and Conference Proceedings, Tokyo, Japan, 20–23 August 2023; International Institute of Noise Control Engineering: West Lafayette, IN, USA, 2023; pp. 5259–5269. [Google Scholar]
  65. Vardaxis, N.-G.; Bard, D. Review of acoustic comfort evaluation in dwellings: Part II—Impact sound data associated with subjective responses in laboratory tests. Build. Acoust. 2018, 25, 171–192. [Google Scholar] [CrossRef]
  66. Radosz, J. Pilot studies of noise annoyance in relation to time, amplitude and frequency characteristics of sound. In Proceedings of the INTER-NOISE and NOISE-CON Congress and Conference Proceedings, Washington, DC, USA, 1–5 August 2021; International Institute of Noise Control Engineering: West Lafayette, IN, USA, 2021; pp. 981–986. [Google Scholar]
  67. Azahari, M.S.M.; Rus, A.Z.M.; Zaliran, M.T.; Kormin, S. Improving Sound Absorption Property of Polyurethane Foams Doped with Natural Fiber; IOP Conference Series: Materials Science and Engineering; IOP Publishing: Bristol, UK, 2017; p. 012009. [Google Scholar]
  68. Azahari, M.S.M.; Rus, A.Z.M.; Kormin, S.; Zaliran, M.T. Acoustic Properties of Polymer Foam Composites Blended with Different Percentage Loadings of Natural Fiber; IOP Conference Series: Materials Science and Engineering; IOP Publishing: Bristol, UK, 2017; p. 012009. [Google Scholar]
  69. Hajizadeh, R.; Khavanin, A.; Barmar, M.; Jafari, A.J.; Dehghan, S.F. Improving the sound absorption properties of flexible polyurethane (PU) foam using nanofibers and nanoparticles. Sound Vib. 2019, 53, 207–222. [Google Scholar] [CrossRef]
  70. Bhingare, N.H.; Prakash, S. Effect of polyurethane resin addition on acoustic performance of natural coconut coir fiber. J. Nat. Fibers 2022, 19, 2902–2913. [Google Scholar] [CrossRef]
  71. Tsuruha, T.; Yamada, Y.; Otani, M.; Takano, Y. Effect of casing on sound absorption characteristics of fine spherical granular material. J. Acoust. Soc. Am. 2020, 147, 3418–3428. [Google Scholar] [CrossRef]
  72. Huang, C.; Liu, Y.; Yang, S.; Xiang, H.; Jin, Y.; Cao, S.; Chen, K. Fabrication and acoustic absorption properties of electrospun polyacrylonitrile nanofiber membranes. Phys. Scr. 2025, 100, 025902. [Google Scholar] [CrossRef]
  73. Železnik, A.; Čurović, L.; Prezelj, J. Sustainable sound absorption using shredded plastic particles: Adjusting low-frequency acoustic performance with particle size. J. Low Freq. Noise Vib. Act. Control 2025, 44, 1139–1150. [Google Scholar] [CrossRef]
  74. Suo, H.; Xu, J.; Feng, Y.; Liu, D.; Tang, P.; Feng, Y. Experimental Research and Theoretical Analysis of the Coupling Mechanism Between Microstructure and Acoustics in Porous Materials. Appl. Sci. 2025, 15, 3104. [Google Scholar] [CrossRef]
  75. Lashgari, M.; Taban, E.; SheikhMozafari, M.J.; Soltani, P.; Attenborough, K.; Khavanin, A. Wood chip sound absorbers: Measurements and models. Appl. Acoust. 2024, 220, 109963. [Google Scholar] [CrossRef]
  76. Istana, B.; Batan, I.M.; Sutikno; Khem, S.; Ubaidillah, U.; Yahya, I. Influence of Particle Size and Bulk Density on Sound Absorption Performance of Oil Palm Frond-Reinforced Composites Particleboard. Polymers 2023, 15, 510. [Google Scholar] [CrossRef]
  77. Kumar, R.; Saha, A.; Biswas, N.; Singh, G.; Beemkumar, N.; Kumar, A.V.; Bhowmik, A.; Bhattacharjee, B. Sound absorption properties of natural Bari bamboo composite. Proc. Inst. Mech. Eng. Part L J. Mater. Des. Appl. 2025, 14644207251313660. [Google Scholar] [CrossRef]
  78. Taban, E.; Soltani, P.; Berardi, U.; Putra, A.; Mousavi, S.M.; Faridan, M.; Samaei, S.E.; Khavanin, A. Measurement, modeling, and optimization of sound absorption performance of Kenaf fibers for building applications. Build. Environ. 2020, 180, 107087. [Google Scholar] [CrossRef]
  79. Bala, B.C.; Ayatab, Ü. A comparative study on some mechanical properties of black pine and black poplar woods. Turk. J. For. 2020, 21, 461–467. [Google Scholar] [CrossRef]
  80. Balboni, B.M.; Batista, A.S.; Garcia, J.N. Evaluating the potential for timber production of young forests of Eucalyptus spp. clones used for bioenergy: Wood density and mechanical properties. Aust. For. 2021, 84, 122–132. [Google Scholar] [CrossRef]
Figure 1. Schematic of the RFPUF fabrication procedure.
Buildings 15 03590 g001
Figure 2. Airflow resistivity measurement setup.
Buildings 15 03590 g002
Figure 4. The FESEM images of (a) Pure PU foam at magnifications of ×20, ×50 and ×200, (b) Pu foam reinforced with poplar wood fiber at ×20, ×50 and ×100, and (c) Pu foam reinforced with eucalyptus wood fiber at ×20, ×50 and ×100. The wood fibers in (b,c) are outlined in the images with ×20 and ×50 magnifications but they are not visible at the largest magnification.
Buildings 15 03590 g004
Figure 5. Measured SAC spectra for three PU foam samples.
Buildings 15 03590 g005
Figure 6. The impact of Eucalyptus and Poplar mesh size on the normal SAC of RFUPF with the same thickness. (a,b,c) Eucalyptus sawdust. (d,e,f) Poplar sawdust.
Buildings 15 03590 g006
Figure 7. Comparison of the Sound Absorption Coefficient (SAC) for the optimized sample (thickness: 50 mm) and sample with 30 mm thickness (featuring air gaps of 10 mm and 30 mm), (a) Eucalyptus, (b) Poplar.
Buildings 15 03590 g007
Figure 8. Measured normal incidence sound absorption spectra for PU foam samples without and with sawdust (open circles) compared with predictions of the JCAL model using the measured porosity and flow resistivity, with fitted values of α , k 0 , Λ and Λ   (broken (blue) lines), NUPSD model predictions based on tortuosity values deduced from the frequencies of the first quarter wavelength resonances in the absorption spectra (solid red lines) and JCAL model predictions using parameter values obtained from NUPSD model relationships (dash dot (brown) lines) for three thicknesses of PU foam (a) 10 mm (b) 30 mm (c) 50 mm; PU foam with eucalyptus sawdust (d) 10 mm (e) 30 mm (f) 50 mm; and PU foam with poplar sawdust (g) 10 mm (h) 30 mm and (i) 50 mm.
Buildings 15 03590 g008
Figure 9. The impact of different ratios of eucalyptus and poplar sawdust on the sound absorption properties of RFPUF.
Buildings 15 03590 g009
Figure 10. The impact of different chemical treatments of eucalyptus and poplar sawdust on the sound absorption properties of RFPUF.
Buildings 15 03590 g010
Table 1. Recent studies on the acoustic performance of polyurethane composite reinforced with natural fibers.
Hybrid CompositeKey FindingsYearRef
Bamboo powder-filled PU foamPU foams with 2.5% bamboo powder achieved an average SAC of 0.86 at 6300 Hz, outperforming unfilled PU foams.2024[12]
Areca catechu fiber-reinforced FPUFAreca fiber reinforcement improved SAC, peaking at 0.95 at 450 Hz. Performance was influenced by fiber content, graded distribution, thickness, and air-cavity length.2024[13]
Lightweight RPU composite reinforced with bamboo fiberBamboo fiber addition improved low-frequency SAC due to enhanced pore structure and reduced density. RPU 25 composite reached SAC of 0.74 at 1250 Hz.2023[14]
PU composite foams reinforced with kenaf fiber1.2 wt% kenaf fiber (8 mm length) increased SAA to 0.65 from 0.48 (↑35.4%) compared to neat PU.2023[15]
Agricultural waste-reinforced PU compositesCorn silk, rice husk, and artichoke stem fillers (alkali-treated) improved SAC; corn silk achieved the highest (40.5%).2023[16]
Rigid/flexible PU foams with fir sawdust50% sawdust content improved SAC in the 420–1250 Hz range compared to 100% FPUFs.2022[17]
Rice plant waste-reinforced PU composites5% NaOH-treated rice waste improved SAC across 400–3200 Hz compared to neat PU foams.2021[9]
Table 2. Fabricated sample characteristics.
Sample NoMesh NoSawdust TypeThickness (mm)Apparent Density
(kg m−3)
Flow Resistivity σ
(N m−4 s)
Porosity
(%)
18Eucalyptus1090.65103091.20
23070211090.90
35060.93384090.60
4Poplar1010098091.10
53065.14186090.80
65069.92316090.40
710Eucalyptus1078.68237090.70
83067.94406090.50
95058.49689090.10
10Poplar10100121690.30
113067296089.90
125069.39473089.70
1316Eucalyptus1066242089.60
143056.19569090.70
155058.95983090.50
16Poplar1067135789.10
173068.71352088.70
185065.90727089.20
1920Eucalyptus1076.39315089.30
203059.79842989.10
215058.8212,53088.60
22Poplar1078.17208088.90
233068.24686088.50
245067.2010,90288.20
25Pure foam1047.10386094.20
263044.86171094.70
275046.6784494.30
Table 3. The thermal conductivity values of PU foam reinforced with natural fibers.
Natural Fiber-Reinforced PU FoamsKeff (W/mK)Ref
Eucalyptus as reinforcement0.044This study
Poplar as reinforcement0.044This study
artichoke stem waste as reinforcement0.049–0.051[47]
fir sawdust as reinforcement0.043–0.045[17]
wood fibers, bamboo fibers and rice husks as reinforcement0.045–0.065[49]
wheat husks as reinforcement0.043–0.049[48]
Hemp shives as reinforcement0.026–0.031[50]
Table 4. The impact of adding reinforcement on the tensile strength of flexible polyurethane foam.
Sample TypeTensile Strength (MPa)Elongation at Break %Young’s Modulus (MPa)
PU foam0.0192548.1130.016677
PU reinforced with Poplar sawdust0.0610524.3410.164712
PU reinforced with Eucalyptus sawdust0.0633042.0090.075254
Table 5. SAA, NRC, peak absorption frequency and SAC value for RFPUF samples.
SampleNRCSAAPeak Frequency (α)
10.230.222500 (0.92)
20.500.50800 (0.92)
30.480.471000 (0.82)
40.310.311600 (0.92)
50.380.371250 (0.76)
60.490.50800 (0.96)
70.260.252000 (0.84)
80.390.365000 (0.79)
90.590.59800 (0.97)
100.180.193150 (0.98)
110.520.511000 (0.97)
120.610.636300 (0.9)
130.170.183150 (0.98)
140.550.551000 (0.92)
150.650.63500 (0.9)
160.220.222500 (0.94)
170.510.52800 (0.92)
180.690.68800 (0.96)
190.250.232000 (0.73)
200.480.44630 (0.69)
210.630.60500 (0.84)
220.210.222500 (0.93)
230.550.52800 (0.92)
240.650.626300 (0.9)
250.170.184000 (0.94)
260.480.461000 (0.87)
270.640.62800 (0.89)
Table 6. Measured and fitted parameter values.
SampleThickness
(mm)
Flow Resistivity σ Nm−4 sPorosity ϕ (%)ModelTortuosity αThermal Permeability k 0   m 2   × 10 9 Characteristic Lengths
Λ μmΛ′ μm
PU foam10386094.20JCAL2.1487.4428345
JCAL(NUPSD)4.1287.1330.42311
NUPSD4.1---
30171094.70JCAL2.536.8391.292.8
JCAL(NUPSD)6.4295.3378.22422
NUPSD6.4 - - -
5084494.30JCAL1.148.718.3677
JCAL(NUPSD)5.478.942471335
NUPSD5.4 - - -
PU foam + Eucalyptus sawdust10242089.60JCAL2.867.0940.971.3
JCAL(NUPSD)72871330.42311
NUPSD7---
30569090.70JCAL1.7412.1022.4200.3
JCAL(NUPSD)7.61543216.41643
NUPSD7.6---
50983090.50JCAL2.5310.0031.3500
JCAL(NUPSD)10.92653172.51881
NUPSD10.9---
PU foam + Poplar sawdust10135789.10JCAL2.39100.0023.210.00
JCAL(NUPSD)11.2520,750462.85201
NUPSD11.25---
30352088.70JCAL2.3316.0027.6350
JCAL(NUPSD)9.6516.7286.52752
NUPSD9.6---
50727098.92JCAL1.1211.0019.32000
JCAL(NUPSD)3.7513.31167.86287
NUPSD3.75---
Table 7. Values of the constants in the simplified JCAL model deduced from Equations (18)–(22) and the measured and fitted parameter values.
SampleThickness mm a b c d e
wool30534,551.111.0221.7248.721.02
PU foam1016,57028.11.1617.5664.2
3038,49028.12.6312.67734.5
5078,04030.5257.36312.17.25
PU foam plus Eucalyptus fibers1018,71016.942.6554.62911.44
3053,4607.681.65510.210.39
5089,27015.331.91530.58614.2
PU foam plus poplar fibers10962212.051.7560.757174
3024,05011.12.1927.7829.2
5053,4601.062.08821718.8
Disclaimer/Publisher’s Note: The statements, opinions and data contained in all publications are solely those of the individual author(s) and contributor(s) and not of MDPI and/or the editor(s). MDPI and/or the editor(s) disclaim responsibility for any injury to people or property resulting from any ideas, methods, instructions or products referred to in the content.