1. Introduction
Nepal is located in a region where two large tectonic plates, the Indo—Australian and Eurasian plates, meet. Because of this, the country often experiences strong earthquakes. One of the most serious earthquakes in Nepal’s recent history happened on 25 April 2015. This earthquake had a magnitude of 7.8 and struck the Gorkha District, about 80 km northwest of Kathmandu. It caused serious damage in 31 districts and was followed by hundreds of aftershocks, including one with a magnitude of 7.3 on May 12. In total, about 8790 people died, and more than 22,000 were injured. The earthquake also caused economic losses of around 7 billion US dollars, which was more than one-third of Nepal’s gross domestic product (GDP) in 2015.
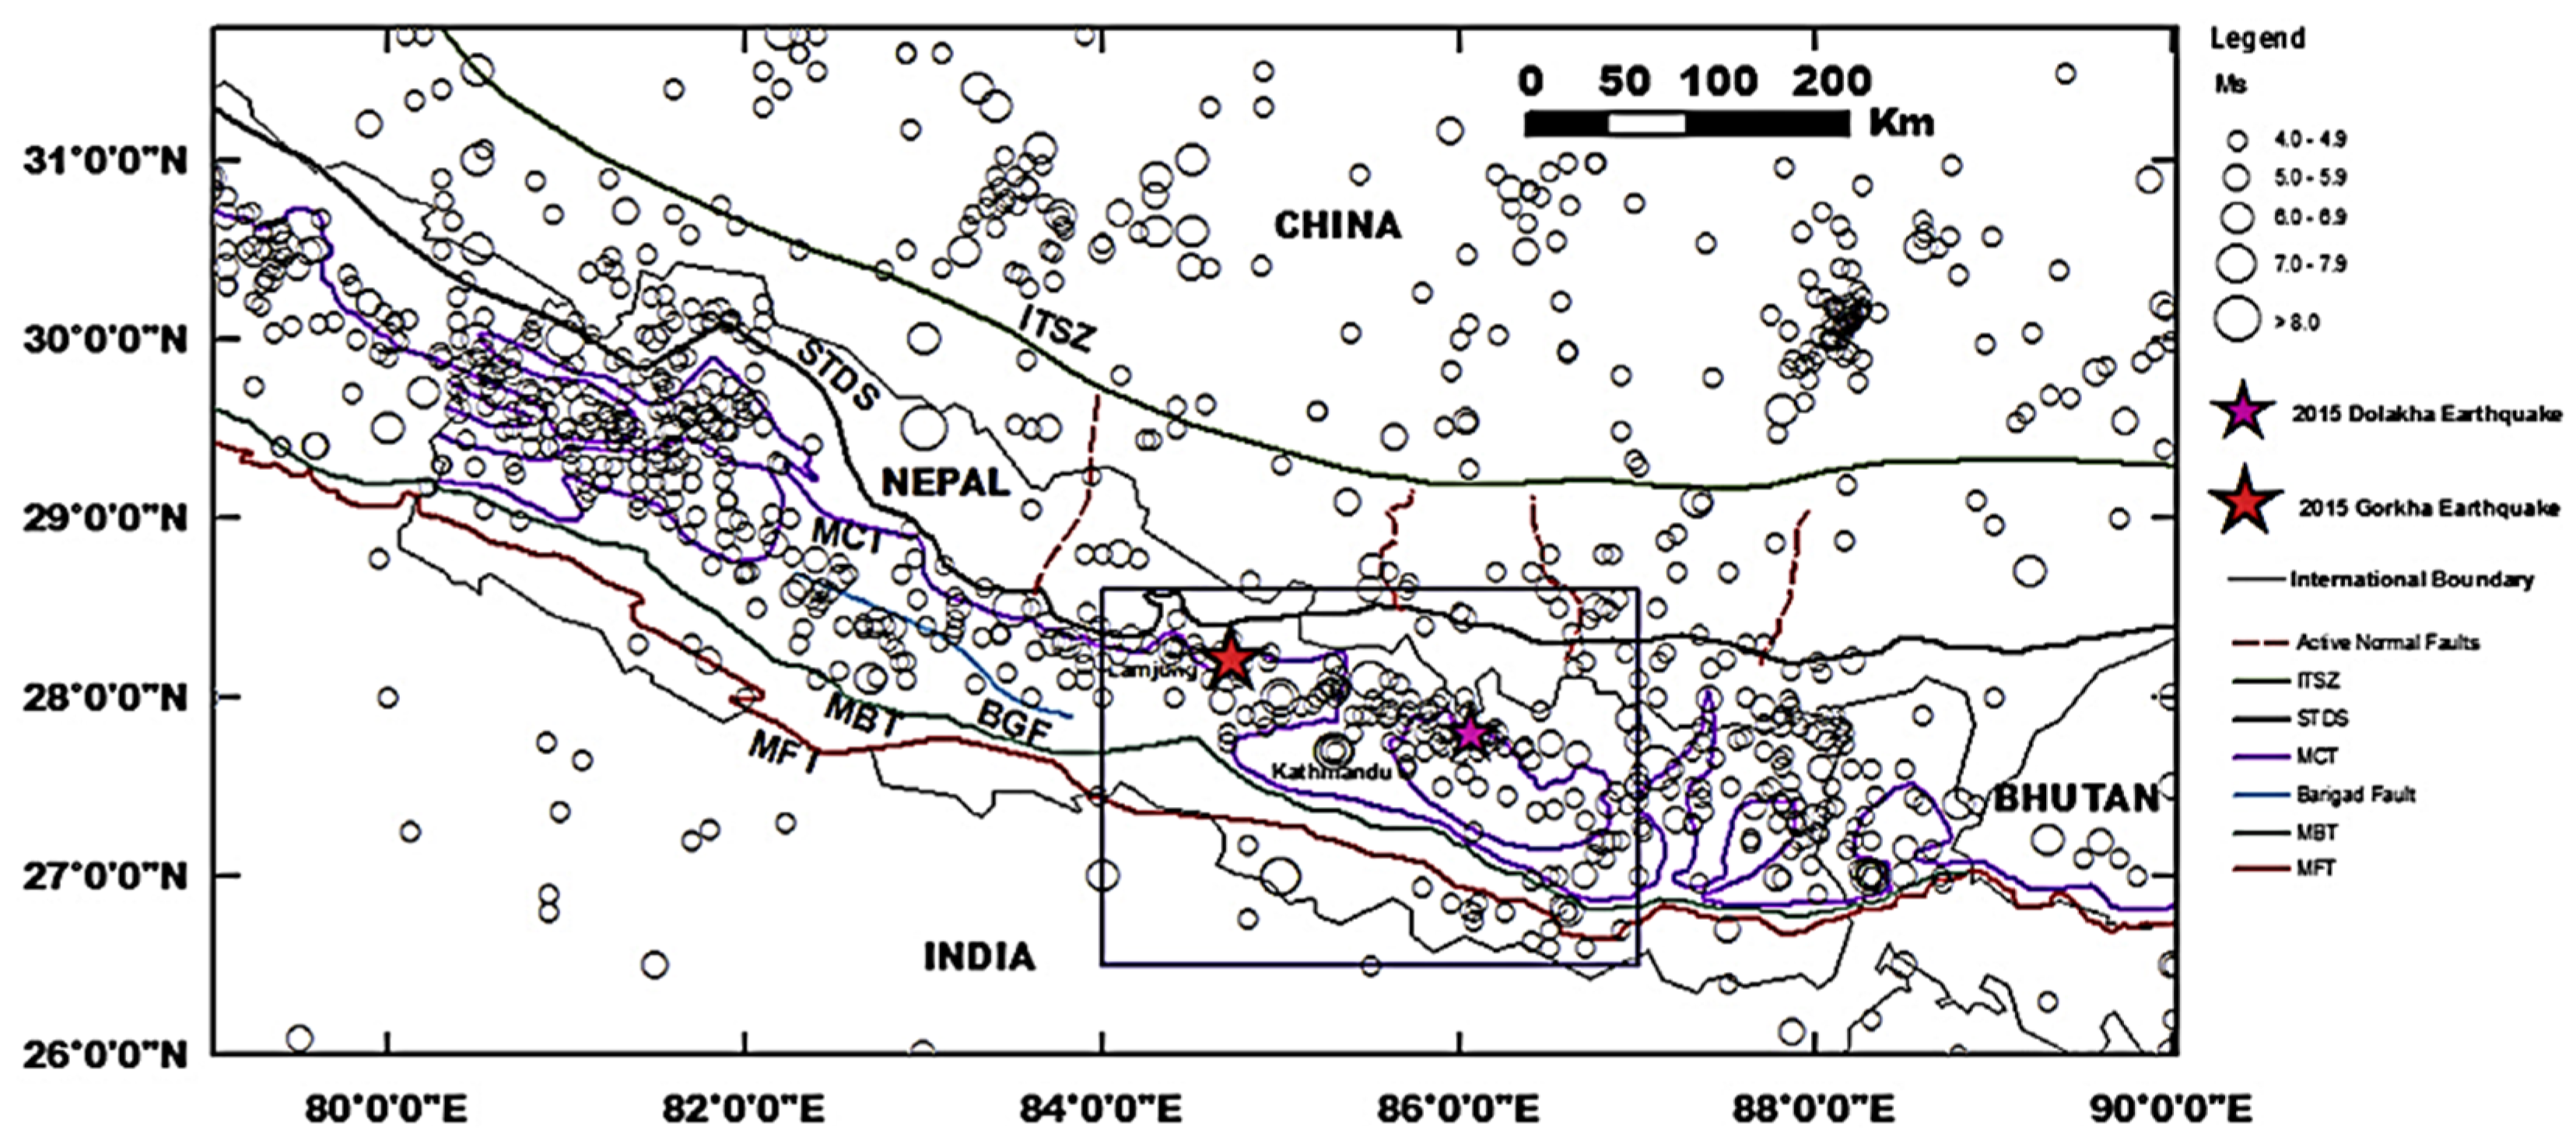
Figure 1 illustrates the major fault systems and the spatial distribution of historical earthquakes in Nepal and the surrounding region.
The earthquake damaged many buildings. In Kathmandu and other cities, there were many reinforced concrete (RC) buildings, brick masonry houses, and historical monuments. In rural areas, most of the buildings were made of stone, adobe, or mud mortar, and they were not designed to resist earthquakes. Many of these buildings collapsed or were badly damaged because they were not built using safe construction methods. In total, over 498,000 houses were destroyed, and more than 256,000 were partly damaged. Government reports and field surveys helped collect data about these buildings, including their structural properties and damage levels.
There are various studies in the literature regarding the seismic damage caused by the Nepal earthquake. Thapa et al. [
1] investigated the spatial and temporal characteristics of the aftershocks and identified geological boundaries that limited their spread. Chen et al. [
2], Pokharel and Goldsworthy [
3], and Varum et al. [
4] have examined the topic thoroughly. Chen et al. [
2] conducted a field investigation 40 days after the 2015 Gorkha earthquake in Nepal, examining building damage along 10 routes in high-risk areas. They classified the damage based on building types and identified key factors such as ground conditions, building height, and design features that influenced the damage level. Pokharel and Goldsworthy [
3] examined the structural damage caused by the 2015 Gorkha earthquake in Nepal, discussed key problems in construction practices (such as poor code compliance and lack of engineering supervision), and suggested improvements for safer building practices. Varum et al. [
4] carried out a post-earthquake field survey following the April 2015 Nepal earthquake and provided a detailed overview of the damage to both modern reinforced concrete buildings and older, non-engineered structures. They documented damage patterns in urban masonry and rural vernacular buildings, offering insights into seismic performance and possible strategies for future retrofitting and risk reduction.
After such a disaster, it is very important to understand how and why buildings were damaged. Rapid damage assessment helps emergency teams know where to send help first and supports recovery planning. One common approach is Rapid Visual Screening (RVS), often conducted as sidewalk surveys [
5]. Different countries have developed their own standardized RVS methods, such as RYTEIE in Türkiye, FEMA P-154 in the United States, and the Canadian RVS protocol, each tailored to local building practices and seismic risks.
In recent years, machine learning (ML) methods have become popular tools for predicting seismic damage after earthquakes. These methods can quickly analyze large amounts of data and detect complex patterns between building characteristics and damage levels, complementing traditional rapid assessment techniques and potentially improving the accuracy and speed of post-earthquake evaluations. Ghimire et al. [
6] evaluated the performance of six machine learning models, including random forest, gradient boosting, and extreme gradient boosting, for seismic damage assessment using the Database of Observed Damage (DaDO) from Italian earthquakes. Afshar et al. [
7] provide a comprehensive review of machine learning (ML), deep learning (DL), and meta-heuristic algorithms applied to structural health monitoring (SHM) for civil engineering structures. Hu et al. [
8] conducted a scientometric review of machine learning applications in seismic engineering. Aloisio et al. [
9] developed a data-driven model to predict seismic vulnerability indices based on the Italian Seismic Code using a dataset of nearly 300 buildings. Bhatta and Dang [
10] applied various machine learning techniques to assess building damage after an earthquake using real-world datasets that include both structural properties and ground motion characteristics. Bektaş and Kegyes-Brassai [
11] developed a new Rapid Visual Screening (RVS) method using Neural Networks and building-specific parameters to assess the seismic vulnerability of various building types, including reinforced concrete, adobe, bamboo, brick, stone, and timber structures. Guettiche and Soltane [
12] compared a traditional field-based method (Risk-UE LM1) and a data-driven approach (Association Rule Learning) to assess seismic vulnerability in Skikda. Bhatta and Dang [
13] proposed a machine learning method that uses data from low-cost IoT devices to estimate ground motion parameters.
The 2015 Gorkha, Nepal, earthquake has also been the subject of several machine learning-based studies. Chen et al. [
14] combined satellite data, ground motion predictions, and building vulnerability factors using a gradient boosting machine learning model to quickly and accurately assess earthquake damage. Ghimire et al. [
15] evaluated the effectiveness of various machine learning techniques for regional-scale seismic damage assessment using post-earthquake data from the 2015 Nepal earthquake. Li et al. [
16] proposed a three-stage machine learning framework for rapid post-earthquake building damage assessment, applied to data from the 2015 Gorkha earthquake. Li et al. [
17] proposed a novel ensemble model for seismic building damage prediction by combining tree-based machine learning algorithms and tabular neural networks. Bektaş and Kegyes-Brassai [
18] developed an improved Rapid Visual Screening (RVS) method by training nine different machine learning algorithms on building inspection data collected after the 2015 Gorkha, Nepal earthquake.
After the major earthquake in Nepal in 2015, many seismic damage prediction studies used large and heterogeneous datasets that included both reinforced concrete (RC) and non-engineered traditional buildings. However, using mixed data of different building types negatively affected the accuracy of machine learning (ML) models. Therefore, in this study, a separate dataset consisting only of RC buildings was created to develop more accurate models for this building type.
In this study, three well-known boosting algorithms, Gradient Boosting Classifier, XGBoost Classifier, and LightGBM Classifier, are used to predict building damage caused by the 2015 Nepal earthquake. Gradient Boosting builds new models on the gradients of previous errors, while XGBoost includes regularization to reduce overfitting and improve efficiency. LightGBM is optimized for large datasets, offering fast training with low memory usage and high accuracy.
Another important advantage of these models is their ability to identify which input features are most important for predictions. This feature importance analysis makes the models more interpretable and supports better understanding of the structural factors influencing earthquake damage. Considering both their predictive power and interpretability, boosting-based classifiers were chosen in this study to enhance the accuracy of damage estimation and contribute to more informed post-earthquake decision-making processes.
2. Dataset and Methodology
In this study, a dataset containing information on both damaged and undamaged buildings from the 2015 Nepal earthquake sequence was used. The dataset is provided in three separate files. The first file includes 79 variables related to the buildings, mostly focusing on the level of damage and general risk factors. The second file contains 17 variables and mainly includes information about the functional use of the buildings. The third file consists of 31 variables that describe the characteristics of buildings both before and after the earthquake. Using the data recorded in these files, this study aims to predict the damage levels of buildings.
Following the earthquake, field teams conducted on-site surveys to inspect both damaged and undamaged buildings. During this process, the structural and contextual characteristics of each building were observed and recorded directly in the field. While merging the three datasets for modeling, one of the most important considerations was the removal of post-earthquake measurement variables. These variables may contain information about the outcome and can lead to data leakage if used in prediction models. Data leakage can cause models to appear highly accurate in theory but fail in real-world applications.
After excluding all variables that could potentially cause data leakage (see
Table A2) and merging the three datasets, the final dataset contained 49 variables. The final dataset contains 762,094 entries.
Appendix A provides the names and descriptions of all variables included in the dataset. In addition to this, the dataset also includes unique identification numbers for each building and its corresponding region.
The dataset includes integer, binary, and categorical variables. For 12 buildings, the damage level is unknown; therefore, these entries were removed from the dataset. The variable damage_overall_collapse, which originally represented building damage in three levels, contained 333,172 missing values and was excluded from the analysis. However, to retain the usable part of this variable, a new target variable called damage_class was created. In this new variable, buildings with damage levels 1 and 2 were grouped as class 0 (low damage), level 3 as class 1 (moderate damage), and levels 4 and 5 as class 2 (high damage).
As mentioned earlier, the data was originally distributed across three separate files. To build a unified dataset for modeling, the three files were merged using the unique building identifier as the key.
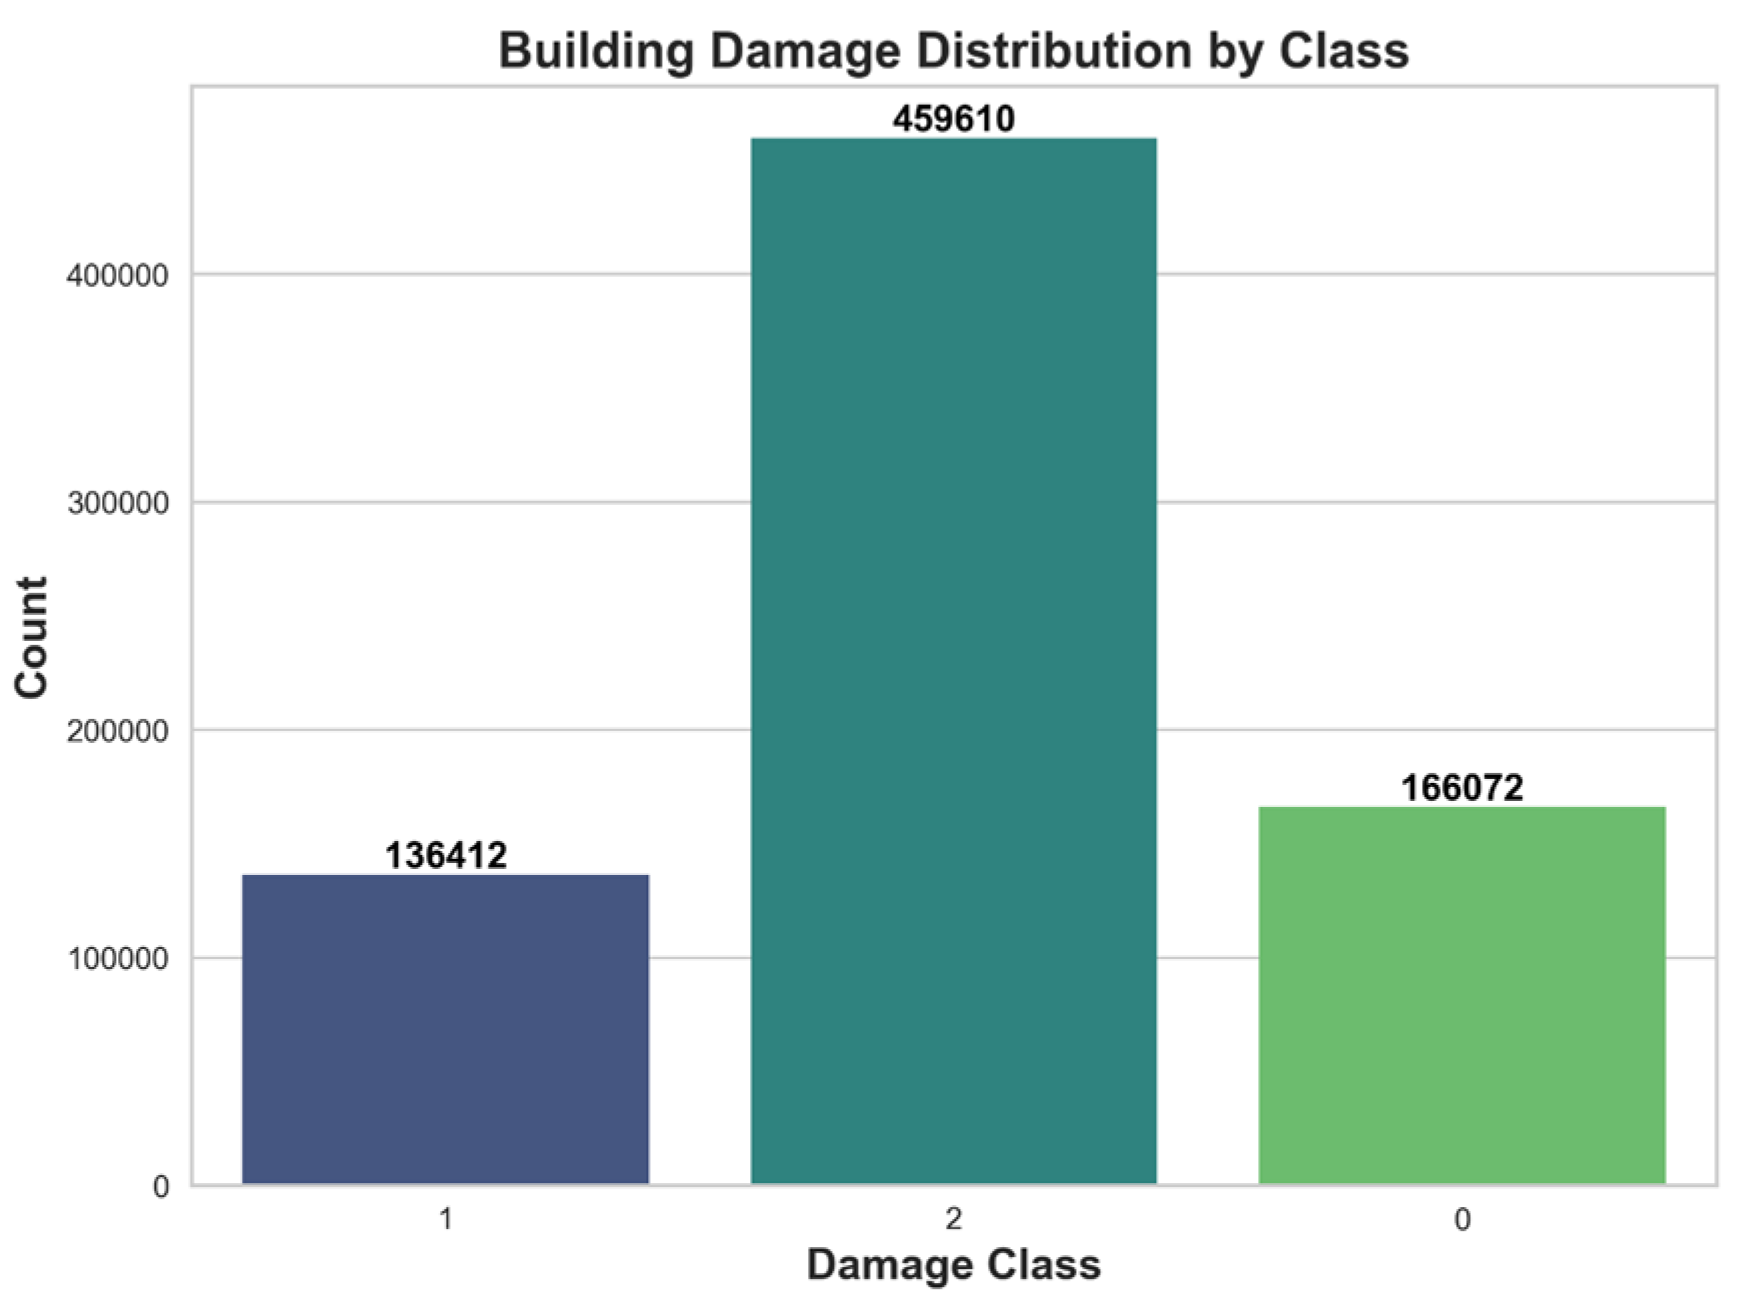
As shown in
Figure 2, the distribution of the target variable damage_class is presented. Class 1, which contains 136,412 observations, represents buildings that experienced moderate damage. Class 2, with 459,610 observations, includes buildings that suffered severe damage and is the largest class in the dataset. Class 0, which has 166,072 observations, represents buildings with low damage.
This distribution indicates that the dataset is imbalanced, with the majority of buildings falling into the moderate and high damage categories. To address this class imbalance and improve model performance, balancing techniques were applied.
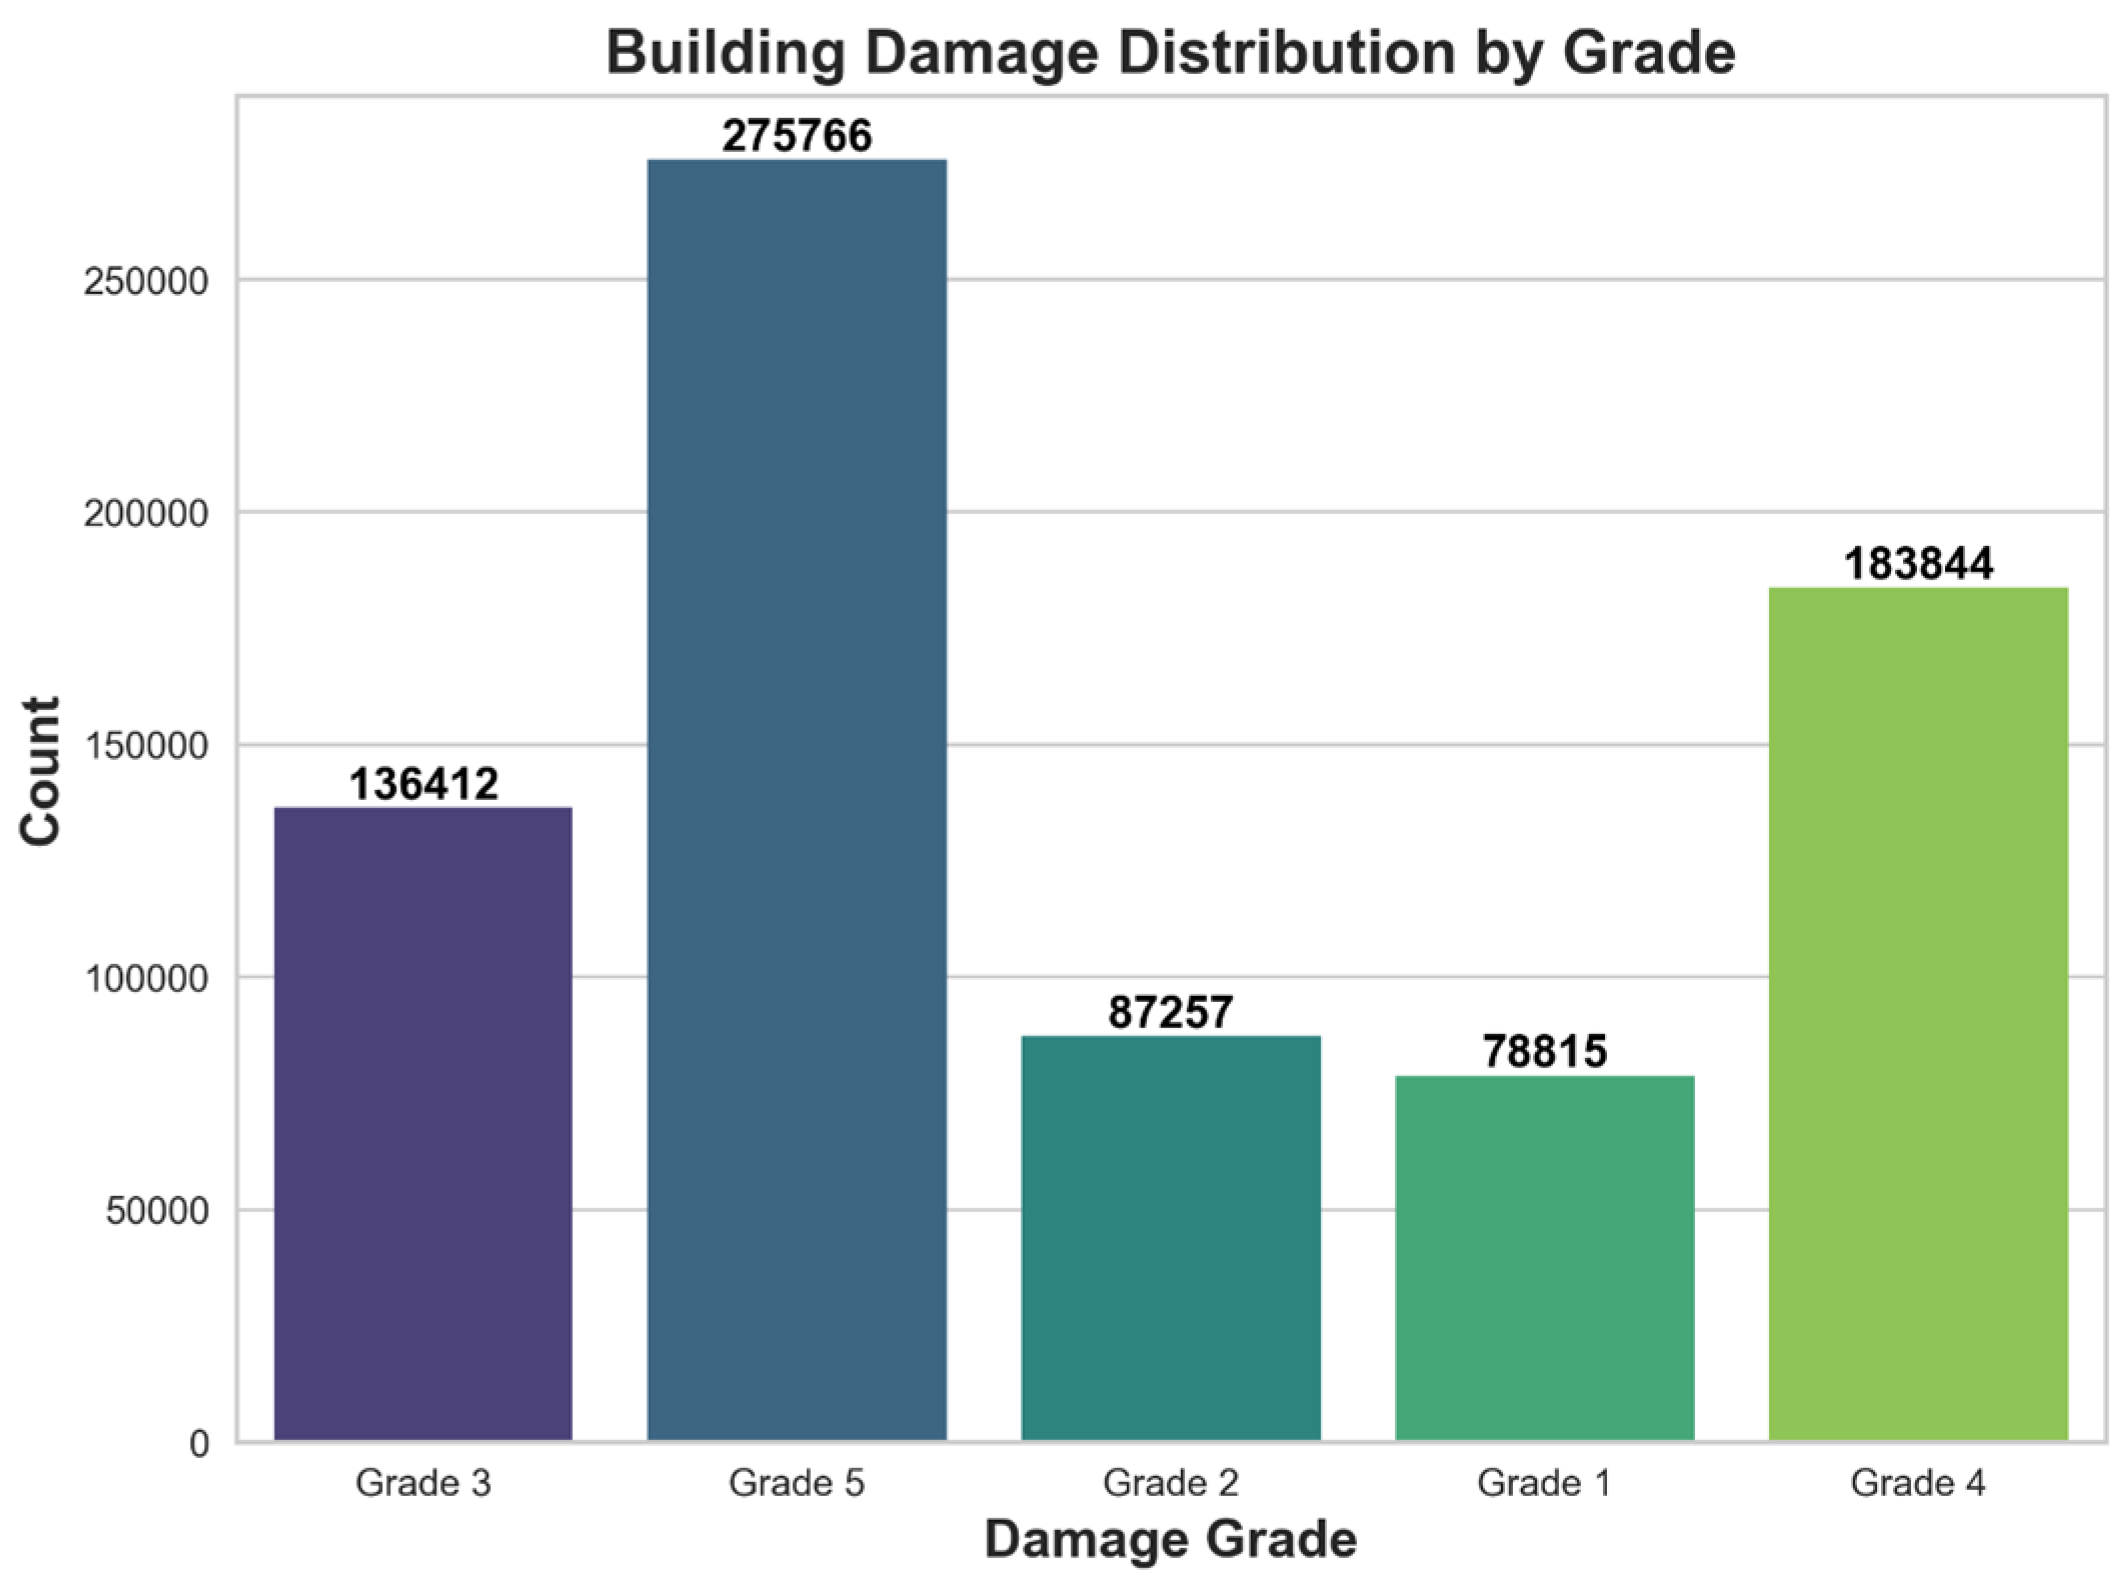
Figure 3 shows the distribution of the damage_grade variable, which includes five different levels of building damage. Grade 3, representing moderate damage, includes 136,412 buildings. Grade 5, indicating very severe damage (collapsed buildings), has the highest number of observations with 275,766 cases. Grade 2, showing low damage, includes 87,257 buildings, while Grade 1, which represents very slight damage, includes 78,815 buildings. Finally, Grade 4 covers 183,844 buildings that experienced high damage and are considered unusable.
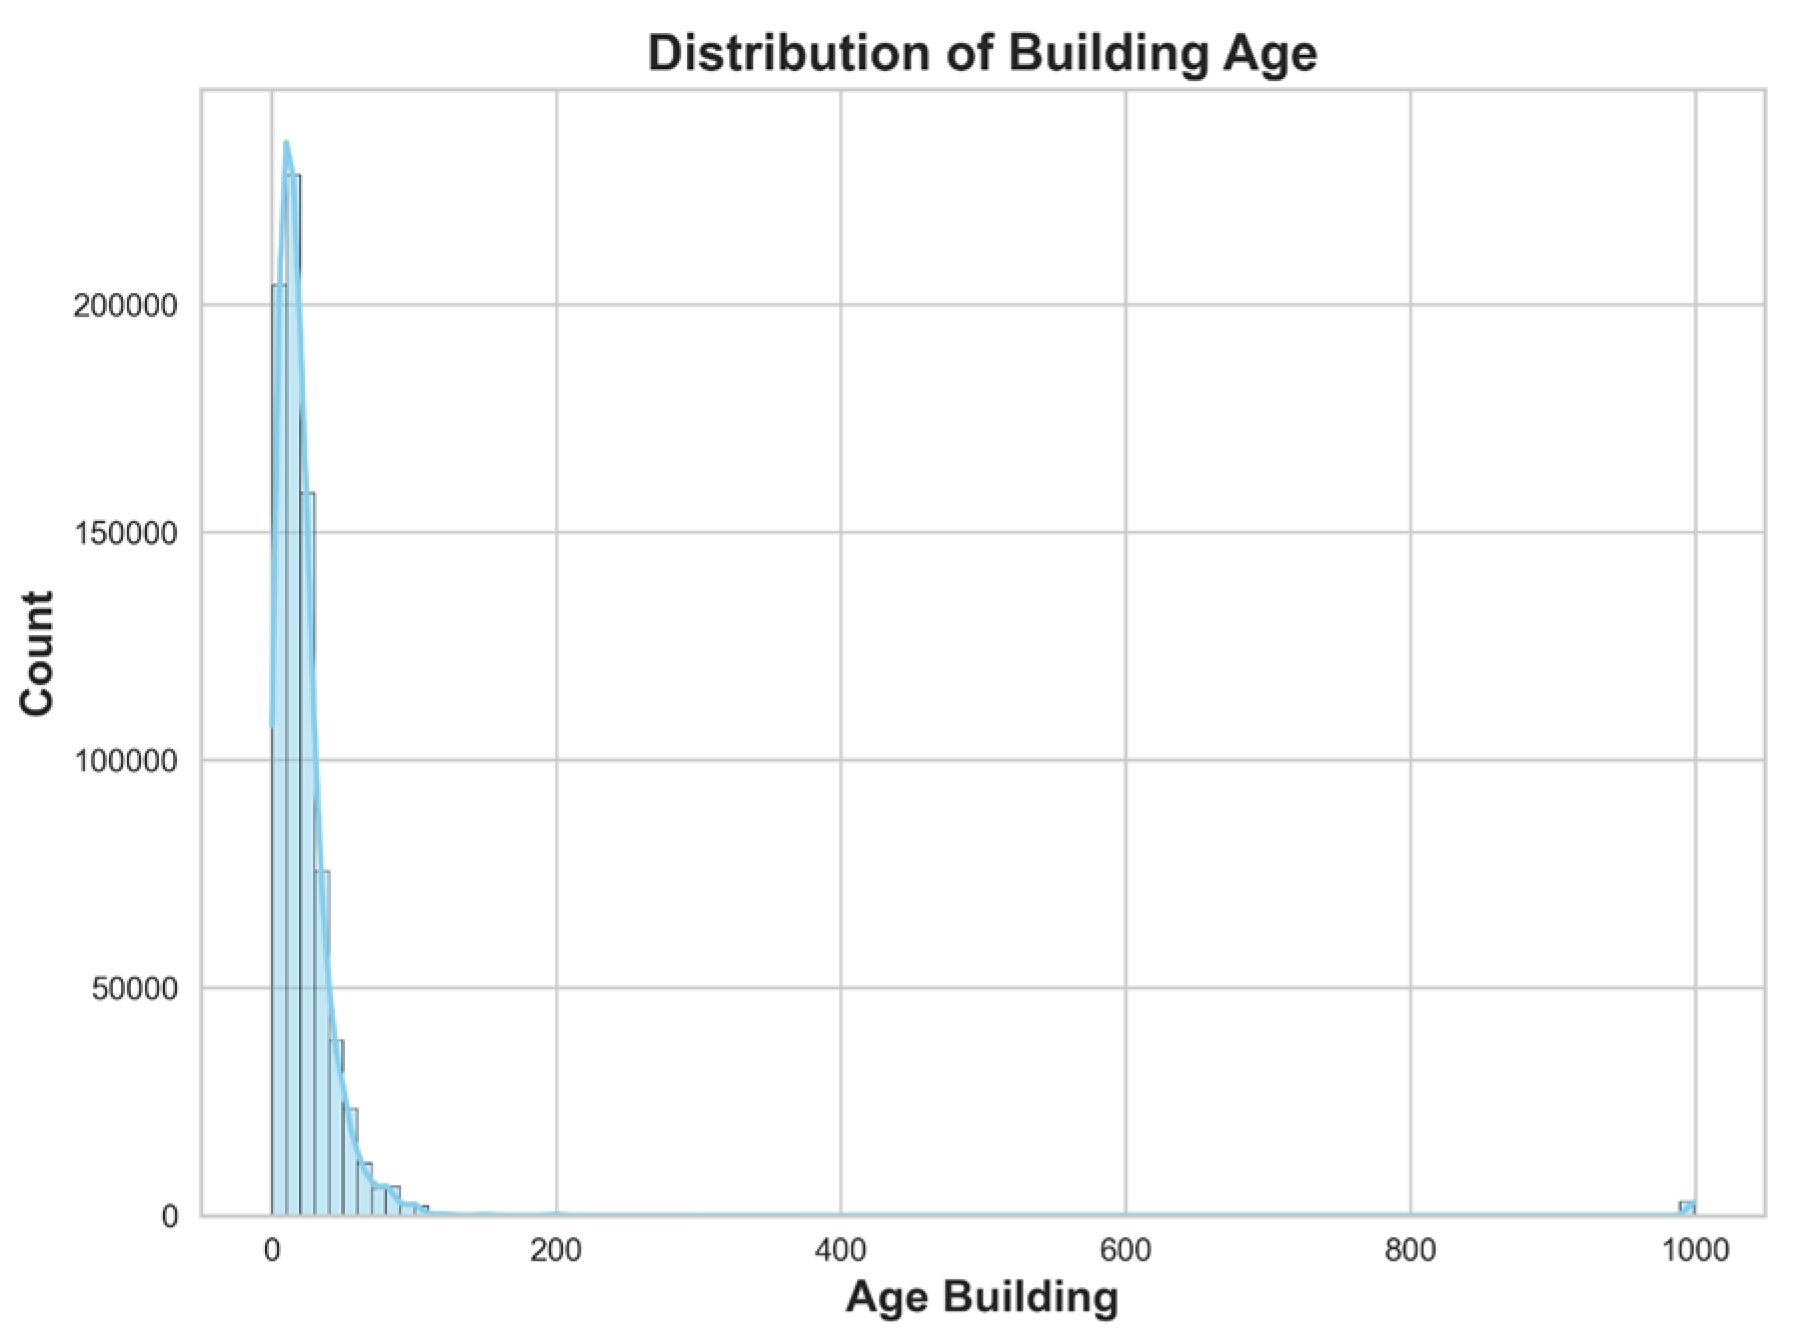
Figure 4 presents the distribution of the age_building variable, which represents the age of each building. While most buildings fall within the range of 0 to 200 years, there are some extreme values, including one as high as 995 years. The distribution is clearly right-skewed, indicating the presence of potential outliers. Such values should be examined carefully, as they may influence the performance and accuracy of machine learning models.
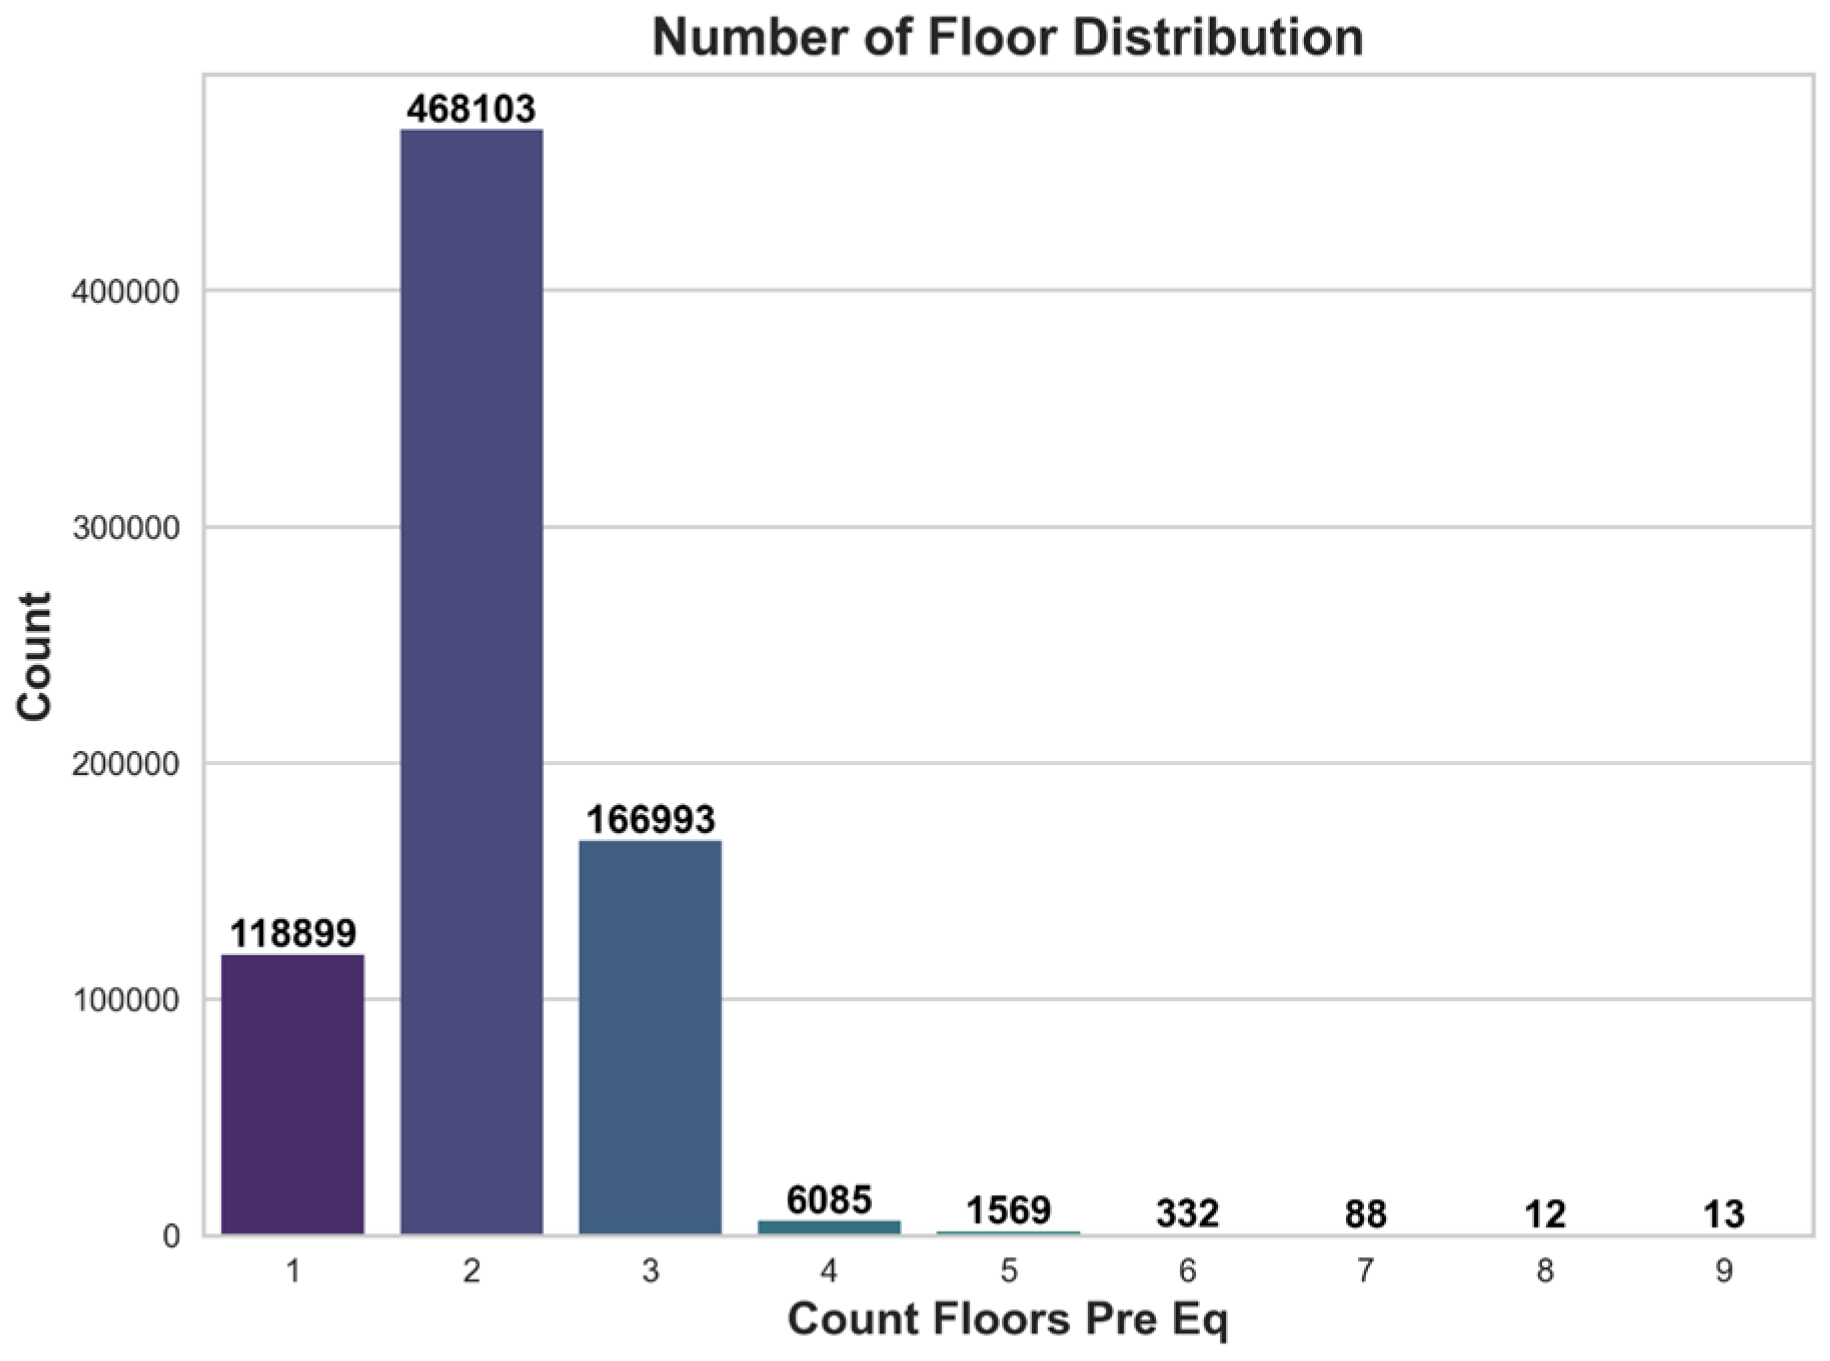
Figure 5 illustrates the distribution of the count_floors_pre_eq variable, representing the number of stories in buildings prior to the earthquake. The buildings in the dataset range from one to nine stories, with two-story buildings being the most common. Notably, the number of buildings significantly decreases beyond five stories, suggesting that taller structures were either not constructed or not preferred in the region.
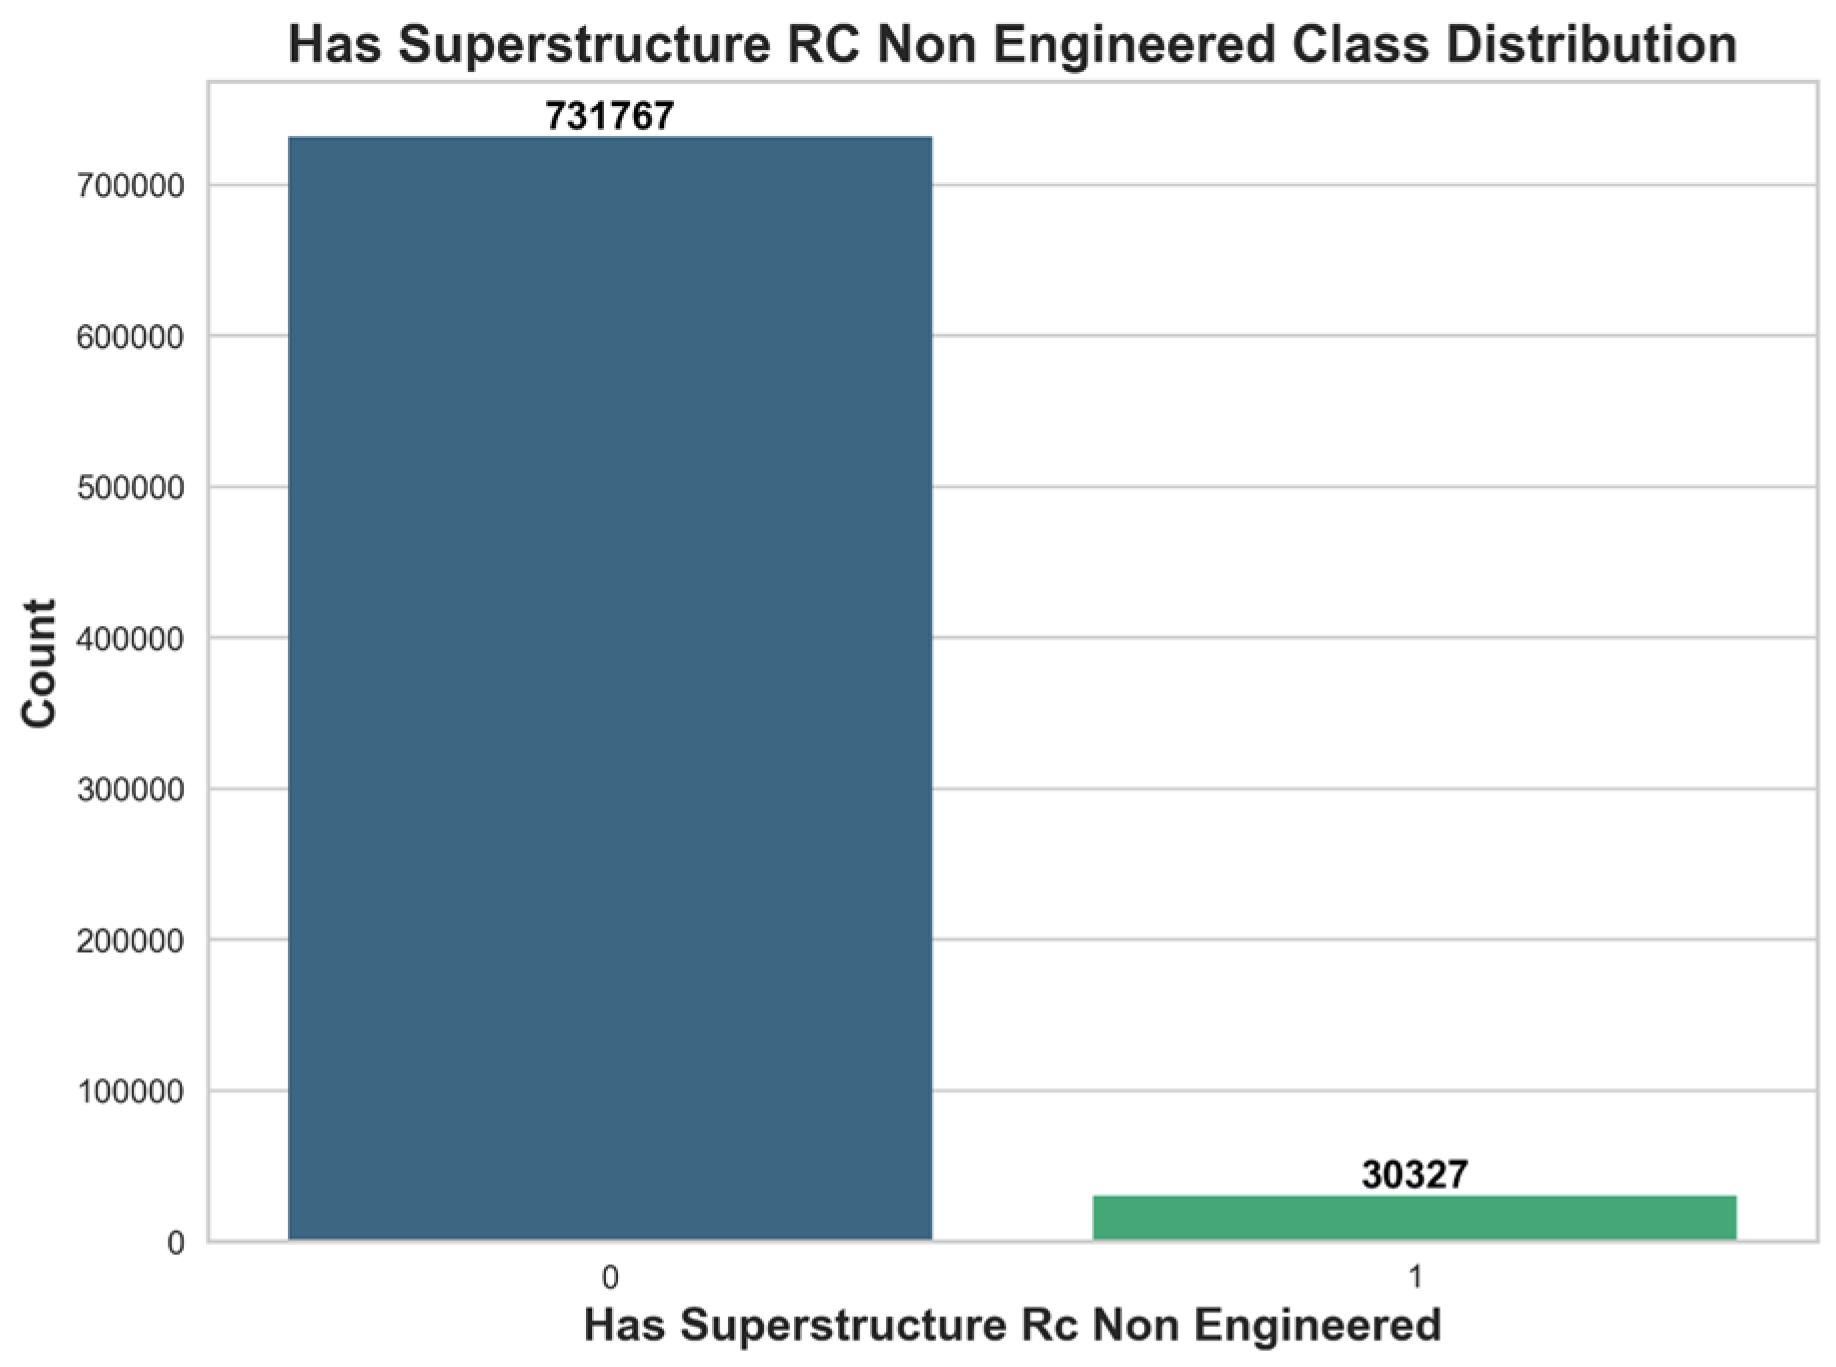
Figure 6 presents the distribution of buildings constructed with reinforced concrete and proper engineering supervision. Observations labeled as class 1 represent reinforced concrete (RC) buildings, totaling only 30,327 structures. In contrast, the remaining 731,767 buildings are non-engineered structures.
In this study, a separate dataset was constructed comprising only reinforced concrete (RC) buildings, due to their generally higher resistance to seismic loads. This subset contains the same variables as the main dataset; however, only records identified as RC structures based on the variables has_superstructure_rc_engineered, has_superstructure_rc_non_engineered, and foundation_type were included. As a result, the total number of observations was reduced to 27,962.
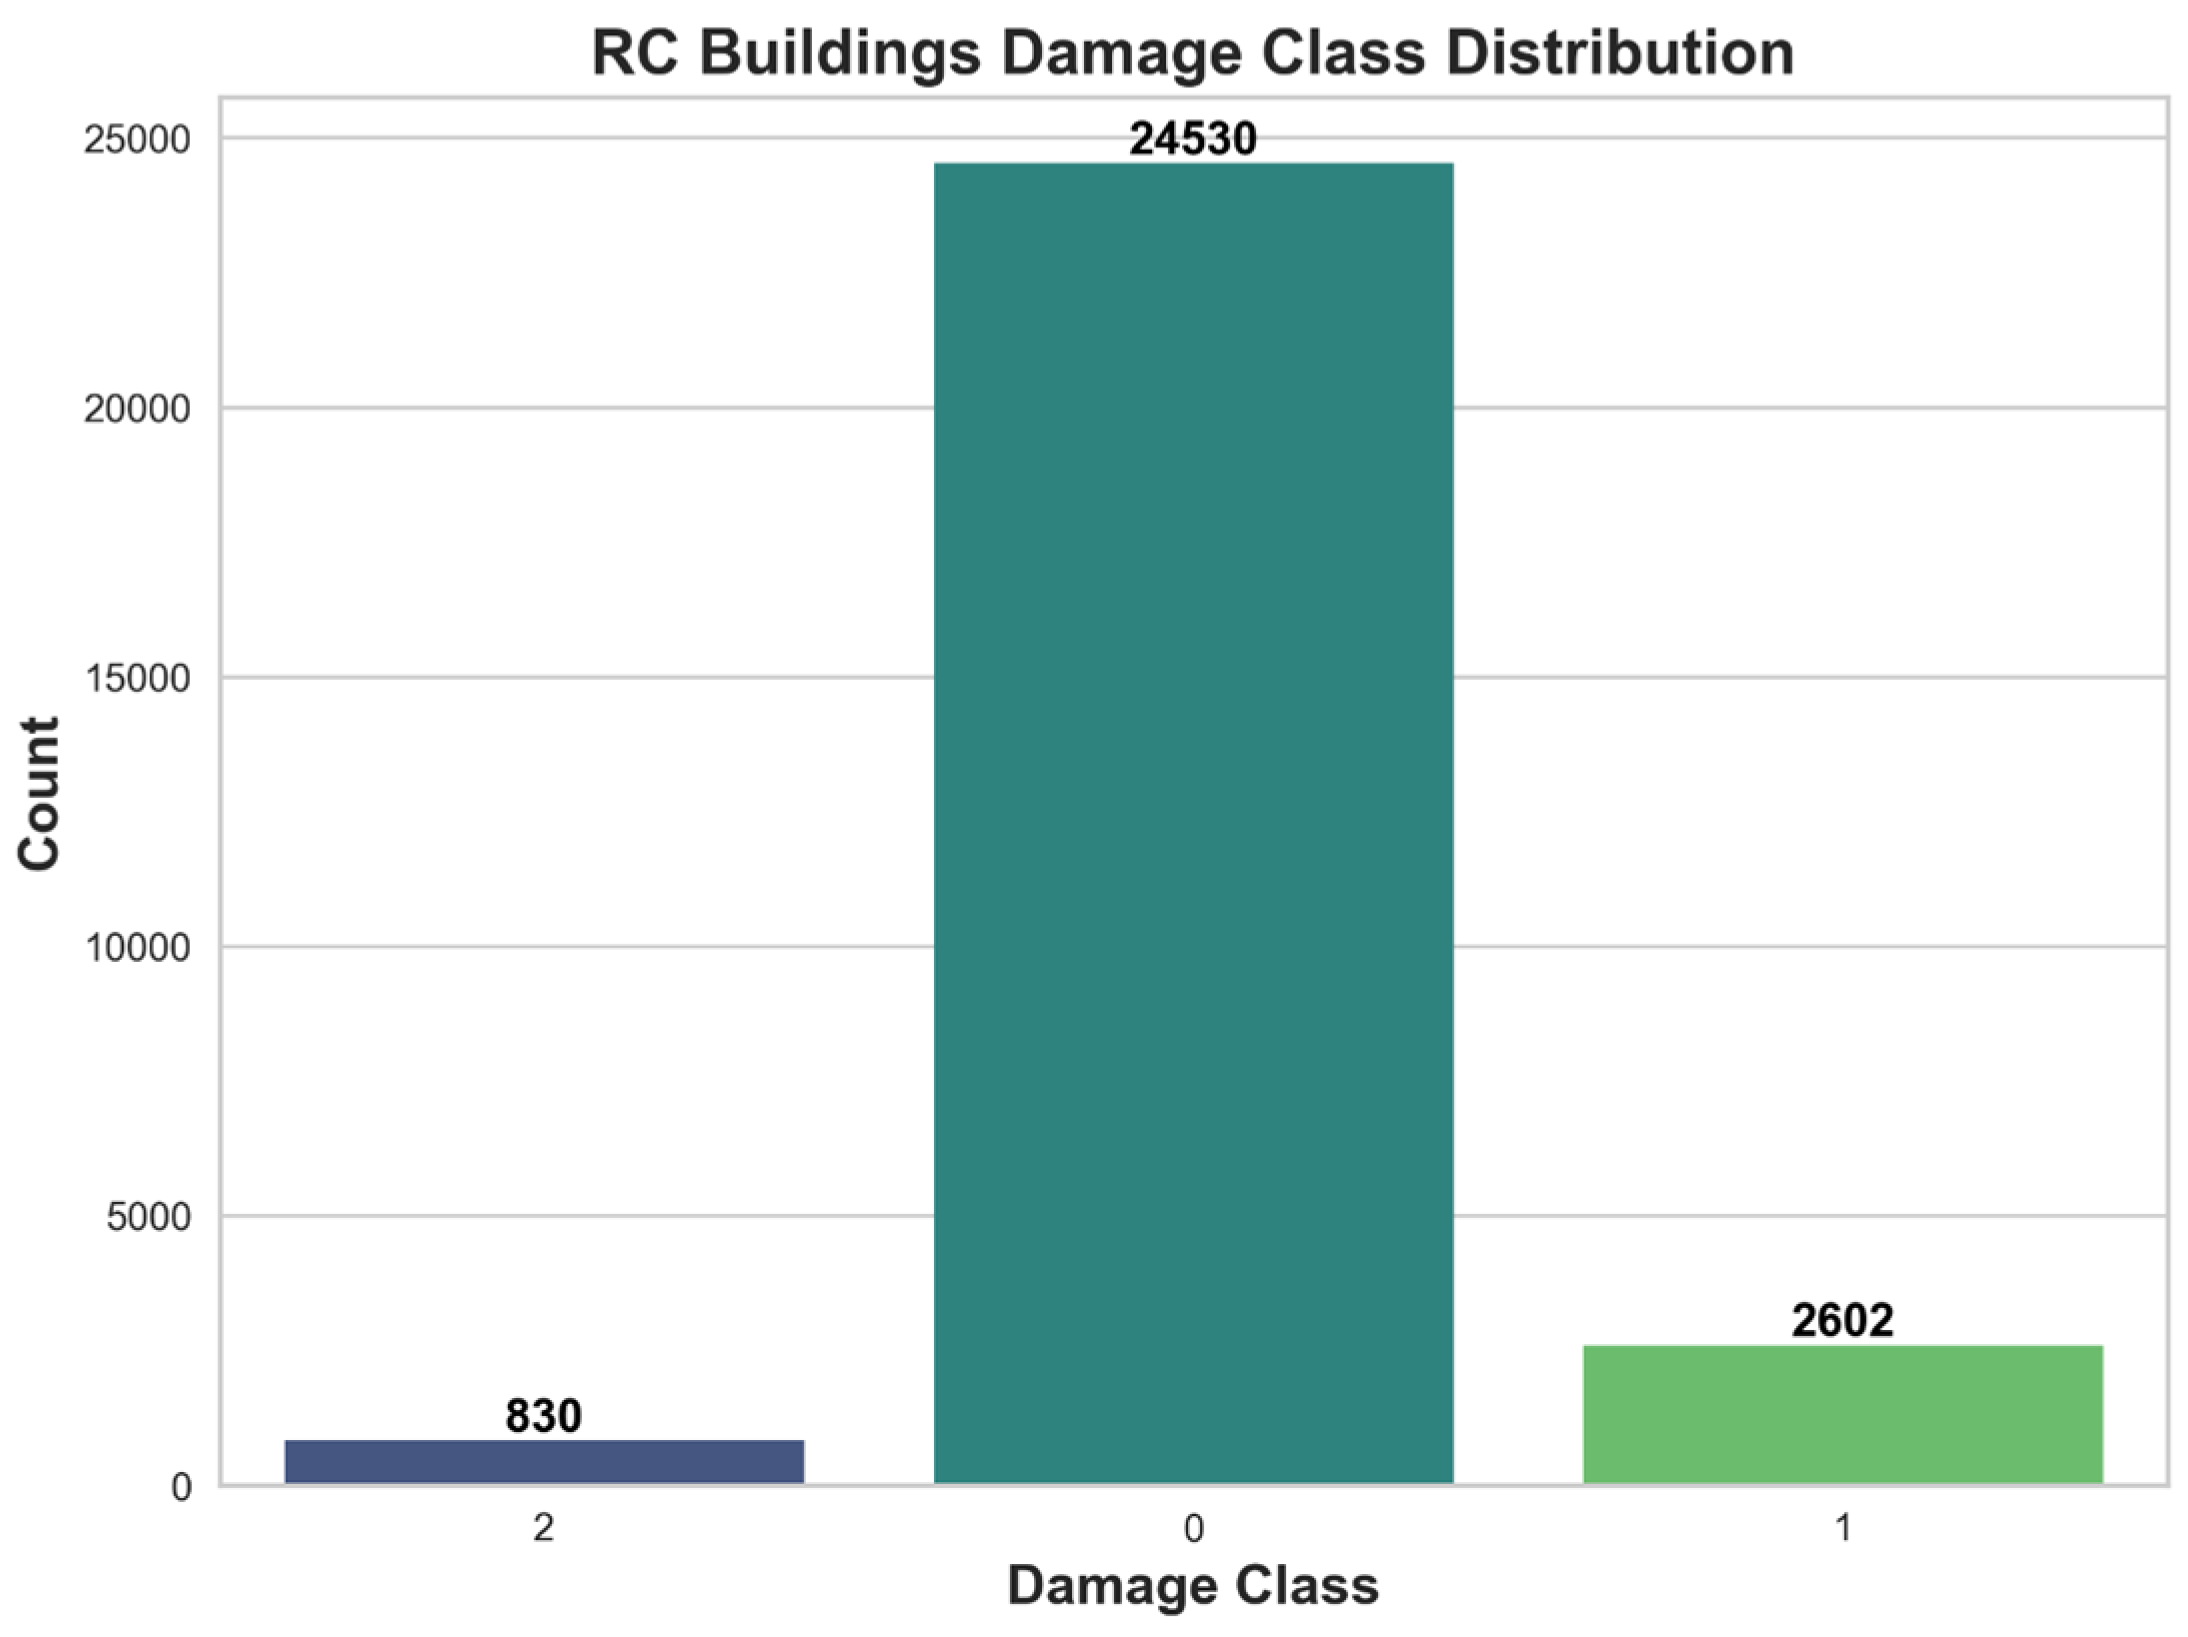
The distribution of the damage_class variable within the RC dataset is illustrated in
Figure 7. Buildings classified as severely damaged (class 2) constitute only 830 records, whereas the majority of buildings, 24,530 observations, experienced low damage (class 0). A total of 2602 buildings fall into the moderate damage category (class 1). This distribution clearly indicates a significant class imbalance in favor of low-damage buildings.
Figure 8 displays the distribution of the damage_grade variable for reinforced concrete (RC) buildings. The number of buildings that experienced very high damage (grade 5) is relatively low, with only 337 observations. In contrast, a large portion of the RC buildings, 17,028 observations, fall under the very low damage category (grade 1). The remaining observations are distributed across the low (grade 2: 7502), moderate (grade 3: 2602), and high damage categories (grade 4: 493). This distribution highlights that most RC buildings sustained only minimal damage during the earthquake.
The dataset includes different data types such as integers, binary, and categorical variables. Since binary variables consist of 0 s and 1 s, no transformation was applied to these columns. For categorical variables, there is no inherent ordinal relationship among the categories. Therefore, one-hot encoding was used to convert each category into a separate binary column. Although this transformation increased the total number of columns, it does not pose a problem due to the large number of observations in the dataset. After this preprocessing step, the final dataset consists of 76 columns. As a result, the main dataset now includes 762,094 observations and 76 features, while the RC dataset consists of 27,962 observations and 76 features.
In this study, the columns damage_grade and damage_class were selected as the target (dependent) variables, and the main objective was to predict the class labels in these columns with the highest possible accuracy. Although the values in the damage_grade column are numeric, they represent discrete damage levels rather than continuous quantities; therefore, this task was treated as a classification problem. To perform the classification, three gradient-boosting-based classifiers, i.e., Gradient Boosting Machine (GBM) [
19], XGBoost [
20], and LightGBM [
21], were applied. Gradient Boosting is a machine learning technique that builds an ensemble of weak learners, usually decision trees, in a sequential manner. Each new tree is trained to correct the prediction errors made by the previous one. This method improves model accuracy over time but can be slower compared to newer approaches. XGBoost is an advanced implementation of gradient boosting that includes additional features like regularization, parallel processing, and efficient handling of missing data. It is known for its speed and high accuracy, making it popular in data science competitions and practical applications. LightGBM is a gradient boosting framework designed for high efficiency and low memory usage. It introduces two innovations, Gradient-based One-Side Sampling (GOSS) and Exclusive Feature Bundling (EFB), which allow it to train faster and handle large datasets more effectively than traditional methods.
All models were initially trained and evaluated using the original, imbalanced dataset. To address the issue of class imbalance, undersampling and oversampling techniques were also employed in parallel experiments to examine their effect on model performance.
A two-step approach is used in this study. In the first step, the entire dataset is used without separating building types. Several ML models are trained using this combined dataset. To improve classification performance, a new target variable is created by grouping the original five damage grades (Grades 1–5) into three categories: High (Grades 4 and 5), Medium (Grade 3), and Low (Grades 1 and 2). This helps to better separate damage levels and support the model’s predictive accuracy.
In the second step, data for only RC buildings is extracted from the full dataset. New ML models are developed specifically for RC buildings using both the original five-class damage labels and the new three-class version. This allows for comparison of the model performance under different classification schemes.
The dataset consists of buildings that were severely damaged or collapsed during the 2015 Nepal earthquake. This creates class imbalance, where high-damage cases are overrepresented. To address this, sampling techniques like oversampling and undersampling are applied during data preprocessing. Model performance is evaluated using both overall accuracy and F1 scores, which help reflect performance across all classes more fairly, especially under imbalanced conditions.
Finally, the results from models trained on the full dataset are compared with those trained only on RC buildings. This comparison aims to evaluate whether building-type-specific modeling improves the accuracy of seismic damage prediction. The findings may offer useful insights on how to handle different building types in future ML-based damage assessments and the potential benefits of customized models for RC structures.
To address the class imbalance in the dataset, a resampling strategy was adopted to equalize the number of observations across all target classes. All datasets were split into training and testing subsets, with 80% of the observations used for training and the remaining 20% reserved for testing. Importantly, resampling techniques were applied only to the training data, not to the test set, in order to prevent data leakage and ensure the validity of model evaluation.
For hyperparameter optimization, a random search algorithm was implemented on the training set to identify the best-performing parameter combinations. In addition, to prevent overfitting during model training, 5-fold cross-validation was applied.
Since the problem was formulated as a classification task, model performance was evaluated using appropriate classification metrics—specifically, accuracy and F1 score were used as the primary performance indicators.
The basic formulas for classification metrics used to evaluate models developed in this study are provided below. For more information on fundamental machine learning concepts, please refer to [
22].
where TP is true positive, TN is true negative, FN is false negative, and FP is false positive.
In this study, the dependent variables are the damage_grade and damage_class columns. Among the remaining columns, the building ID and region number were excluded, and all other columns were used as independent variables. Since the age_building column, which represents the building’s age, contained outliers, buildings with an age greater than 100 were replaced with the median value in the dataset for RC structures.
As mentioned in the previous sections, the dataset used in this study includes various types of buildings. In this study, unlike others, the data belonging to the RC (reinforced concrete) building class were separated to create a new dataset. This new dataset was then used to predict seismic damage specifically for RC buildings. In this way, it was tested, using the same analysis methods, whether the proposed approach improves damage prediction for RC structures. Separate models were trained on the RC dataset to predict both the damage_class and damage_grade variables.
3. Results
3.1. The Full Dataset
The performance metrics obtained for each classification model after applying different resampling techniques to the main dataset are presented in
Table 1. As mentioned earlier, accuracy on the raw dataset can be misleading. Therefore, it is more appropriate to focus on the F1 score. The F1 scores were measured separately for each class: damage_class = 0 for slightly damaged buildings, damage_class = 1 for moderately damaged buildings, and damage_class = 2 for heavily damaged buildings.
The results from the raw dataset show that the LightGBM and XGBoost classification methods performed better than the others. In the oversampled dataset, the situation is more complex. Since the number of observations for the minority classes was increased to balance the dataset, the accuracy metric should also be considered. According to the accuracy scores, the best performance was again achieved by the LightGBM classifier.
When evaluating the F1 scores, it is also clear that the LightGBM model provided better results for all damage_class values. The LightGBM model achieved an average accuracy of 71% on both the raw and oversampled datasets. Although this percentage is the same, when the F1 scores of individual damage_class values are examined, the performance on the oversampled dataset shows a significant improvement.
In the raw dataset, the F1 score for moderately damaged buildings (damage_class = 1) was as low as 0.13, while in the oversampled dataset, this value increased to 0.67. This clearly shows that the LightGBM model improves its class prediction performance when sufficient data is available. For slightly damaged buildings (damage_class = 0), the F1 score increased from 0.64 to 0.78, indicating good performance in this class as well.
On the other hand, for heavily damaged buildings (damage_class = 2), the F1 score dropped from 0.82 to 0.69 after oversampling. However, this suggests that the model has now learned to recognize not only one dominant class but also the other classes more effectively. This improvement in balance shows that the model has become more generalizable and can be better applied to real-world scenarios.
In the undersampled model, where the dataset was balanced by reducing the number of samples, the overall accuracy dropped to 0.63, but the F1 scores became more realistic compared to the raw dataset. In the raw dataset, the class imbalance led to serious performance issues, especially for moderately damaged buildings (damage_class = 1), where the F1 score remained as low as 0.13. In contrast, with the use of oversampling, the F1 score for this class increased to 0.67. Similarly, for slightly damaged buildings (damage_class = 0), the F1 score improved from 0.64 to 0.78.
For heavily damaged buildings (damage_class = 2), the F1 score decreased from 0.82 in the raw dataset to 0.69 after oversampling. However, this indicates that the model has started to learn not only the dominant class but also the other classes, which can be interpreted as an improvement in the model’s ability to generalize. This result suggests that the model has become more suitable for real-world applications.
In the undersampled dataset, the F1 scores for each class appear to be more balanced, but the overall performance is lower compared to the oversampled dataset. These findings indicate that, when more data is provided, the LightGBM model has strong potential to achieve high performance both in general accuracy and in distinguishing between different damage classes.
Based on the overall results obtained from the Nepal earthquake dataset, it can be concluded that LightGBM achieved the best performance among the machine learning classification algorithms used in this study.
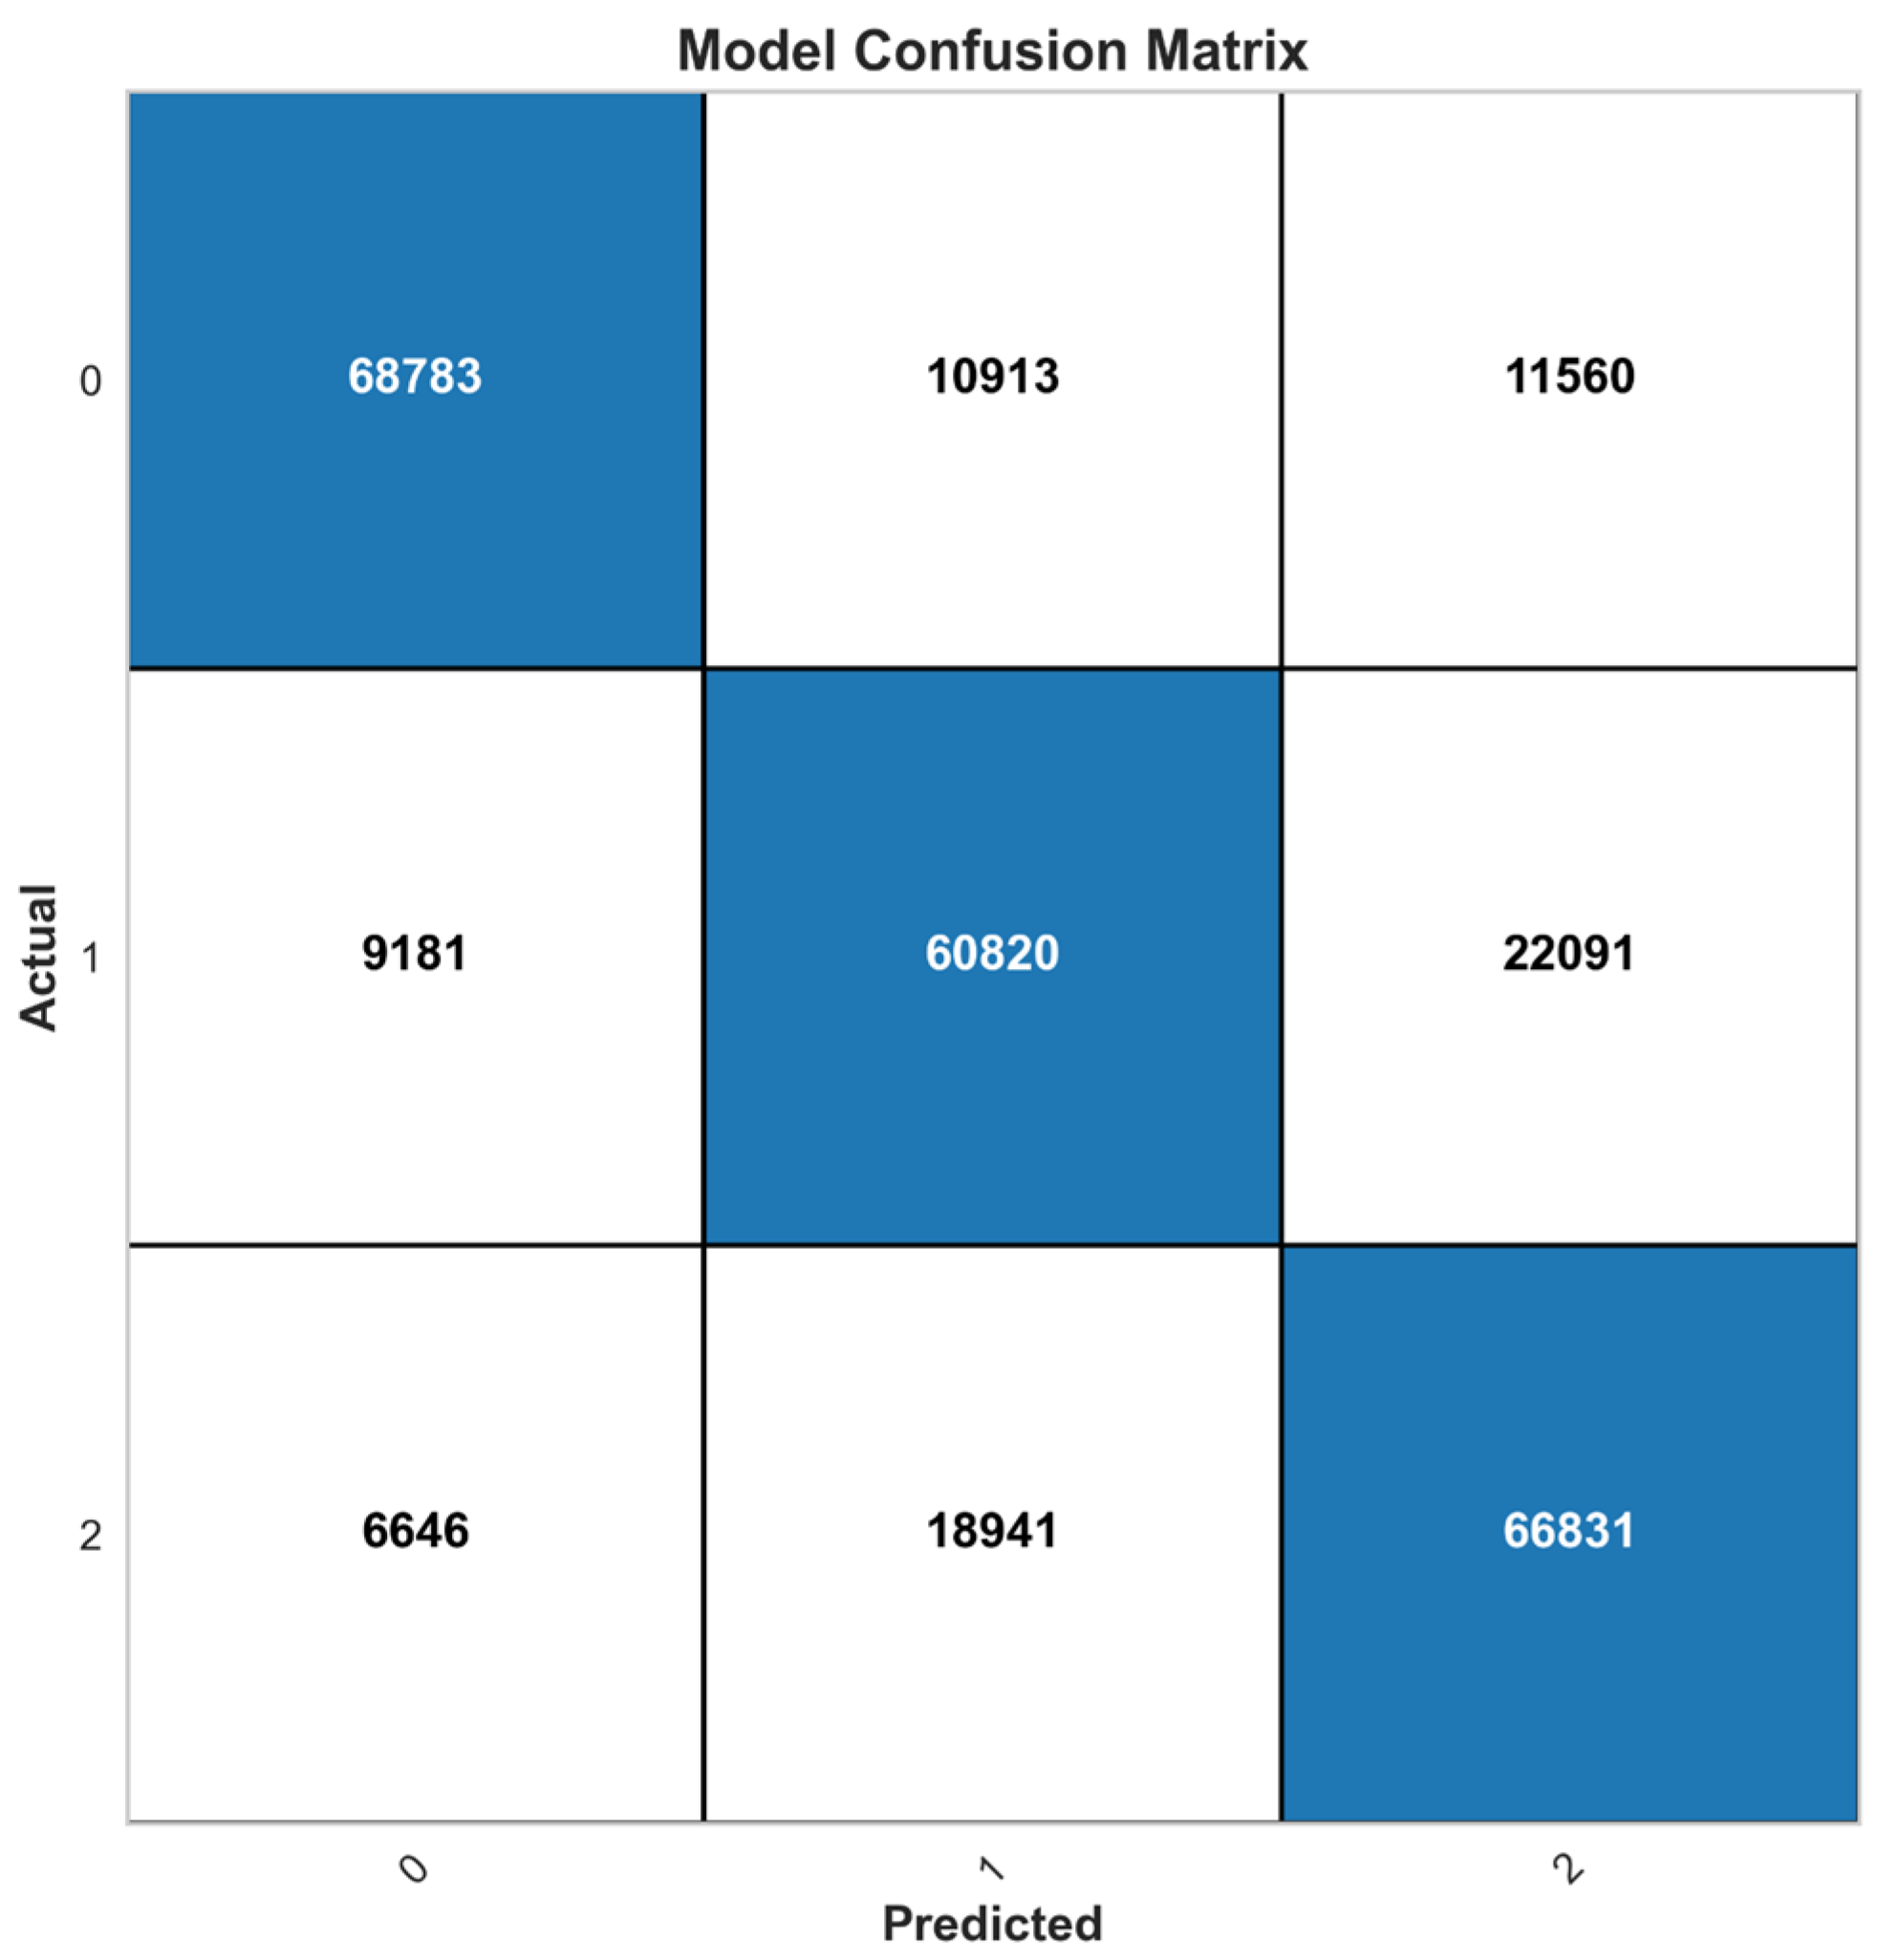
The confusion matrix showing the prediction performance for each damage class using the LightGBM model on the oversampled dataset is presented in
Figure 9.
As shown in
Figure 9, the model correctly predicted 68,783 of the slightly damaged buildings, while 22,473 were misclassified. About half of these misclassified cases were predicted as moderately damaged, and the other half as heavily damaged.
For moderately damaged buildings, the model correctly predicted 60,820 observations, while 31,272 were misclassified. Among these misclassified buildings, approximately 70% were predicted as heavily damaged, and the remaining 30% as slightly damaged.
These results suggest that there are clear distinctions between slightly and heavily damaged buildings, while the boundary between moderate and heavy damage is more gradual. One possible reason for this could be that, during field assessments in the earthquake region, damage grades 3 and 4 may have overlapped, and the classification of these levels may have varied depending on the individuals collecting the data.
For heavily damaged buildings, the model correctly classified 66,831 observations, while 25,587 were misclassified. Among the misclassified cases, 74% were predicted as moderately damaged, and the remaining 26% as slightly damaged. As can be seen, distinguishing between moderate and heavy damage remains more difficult for the model.
It can be suggested that collecting more clear-cut and consistent data between damage grades 3 and 4, independent of individual interpretations, would help improve model performance. The subjective nature of the criteria used for damage classification and the differences in judgment among field surveyors make it harder for the model to distinguish between class 1 (moderate damage) and class 2 (heavy damage), especially when the observed damage falls somewhere between the two classes. This highlights the need for more precise classification guidelines or datasets enriched with expert-labeled observations.
Figure 9 highlights the model’s overall classification behavior. It performs well in distinguishing the extremes of the damage scale (slight vs. heavy damage), but shows higher confusion between moderate and heavy classes, reflecting both model limitations and the intrinsic ambiguity of the data. Errors are asymmetrically biased: heavily damaged buildings are often underestimated as moderate (≈74%), which may pose risks for disaster response. This pattern suggests that while the model captures clear signals at the boundaries, intermediate levels remain challenging, and future work should address this by dataset rebalancing and feature refinement.
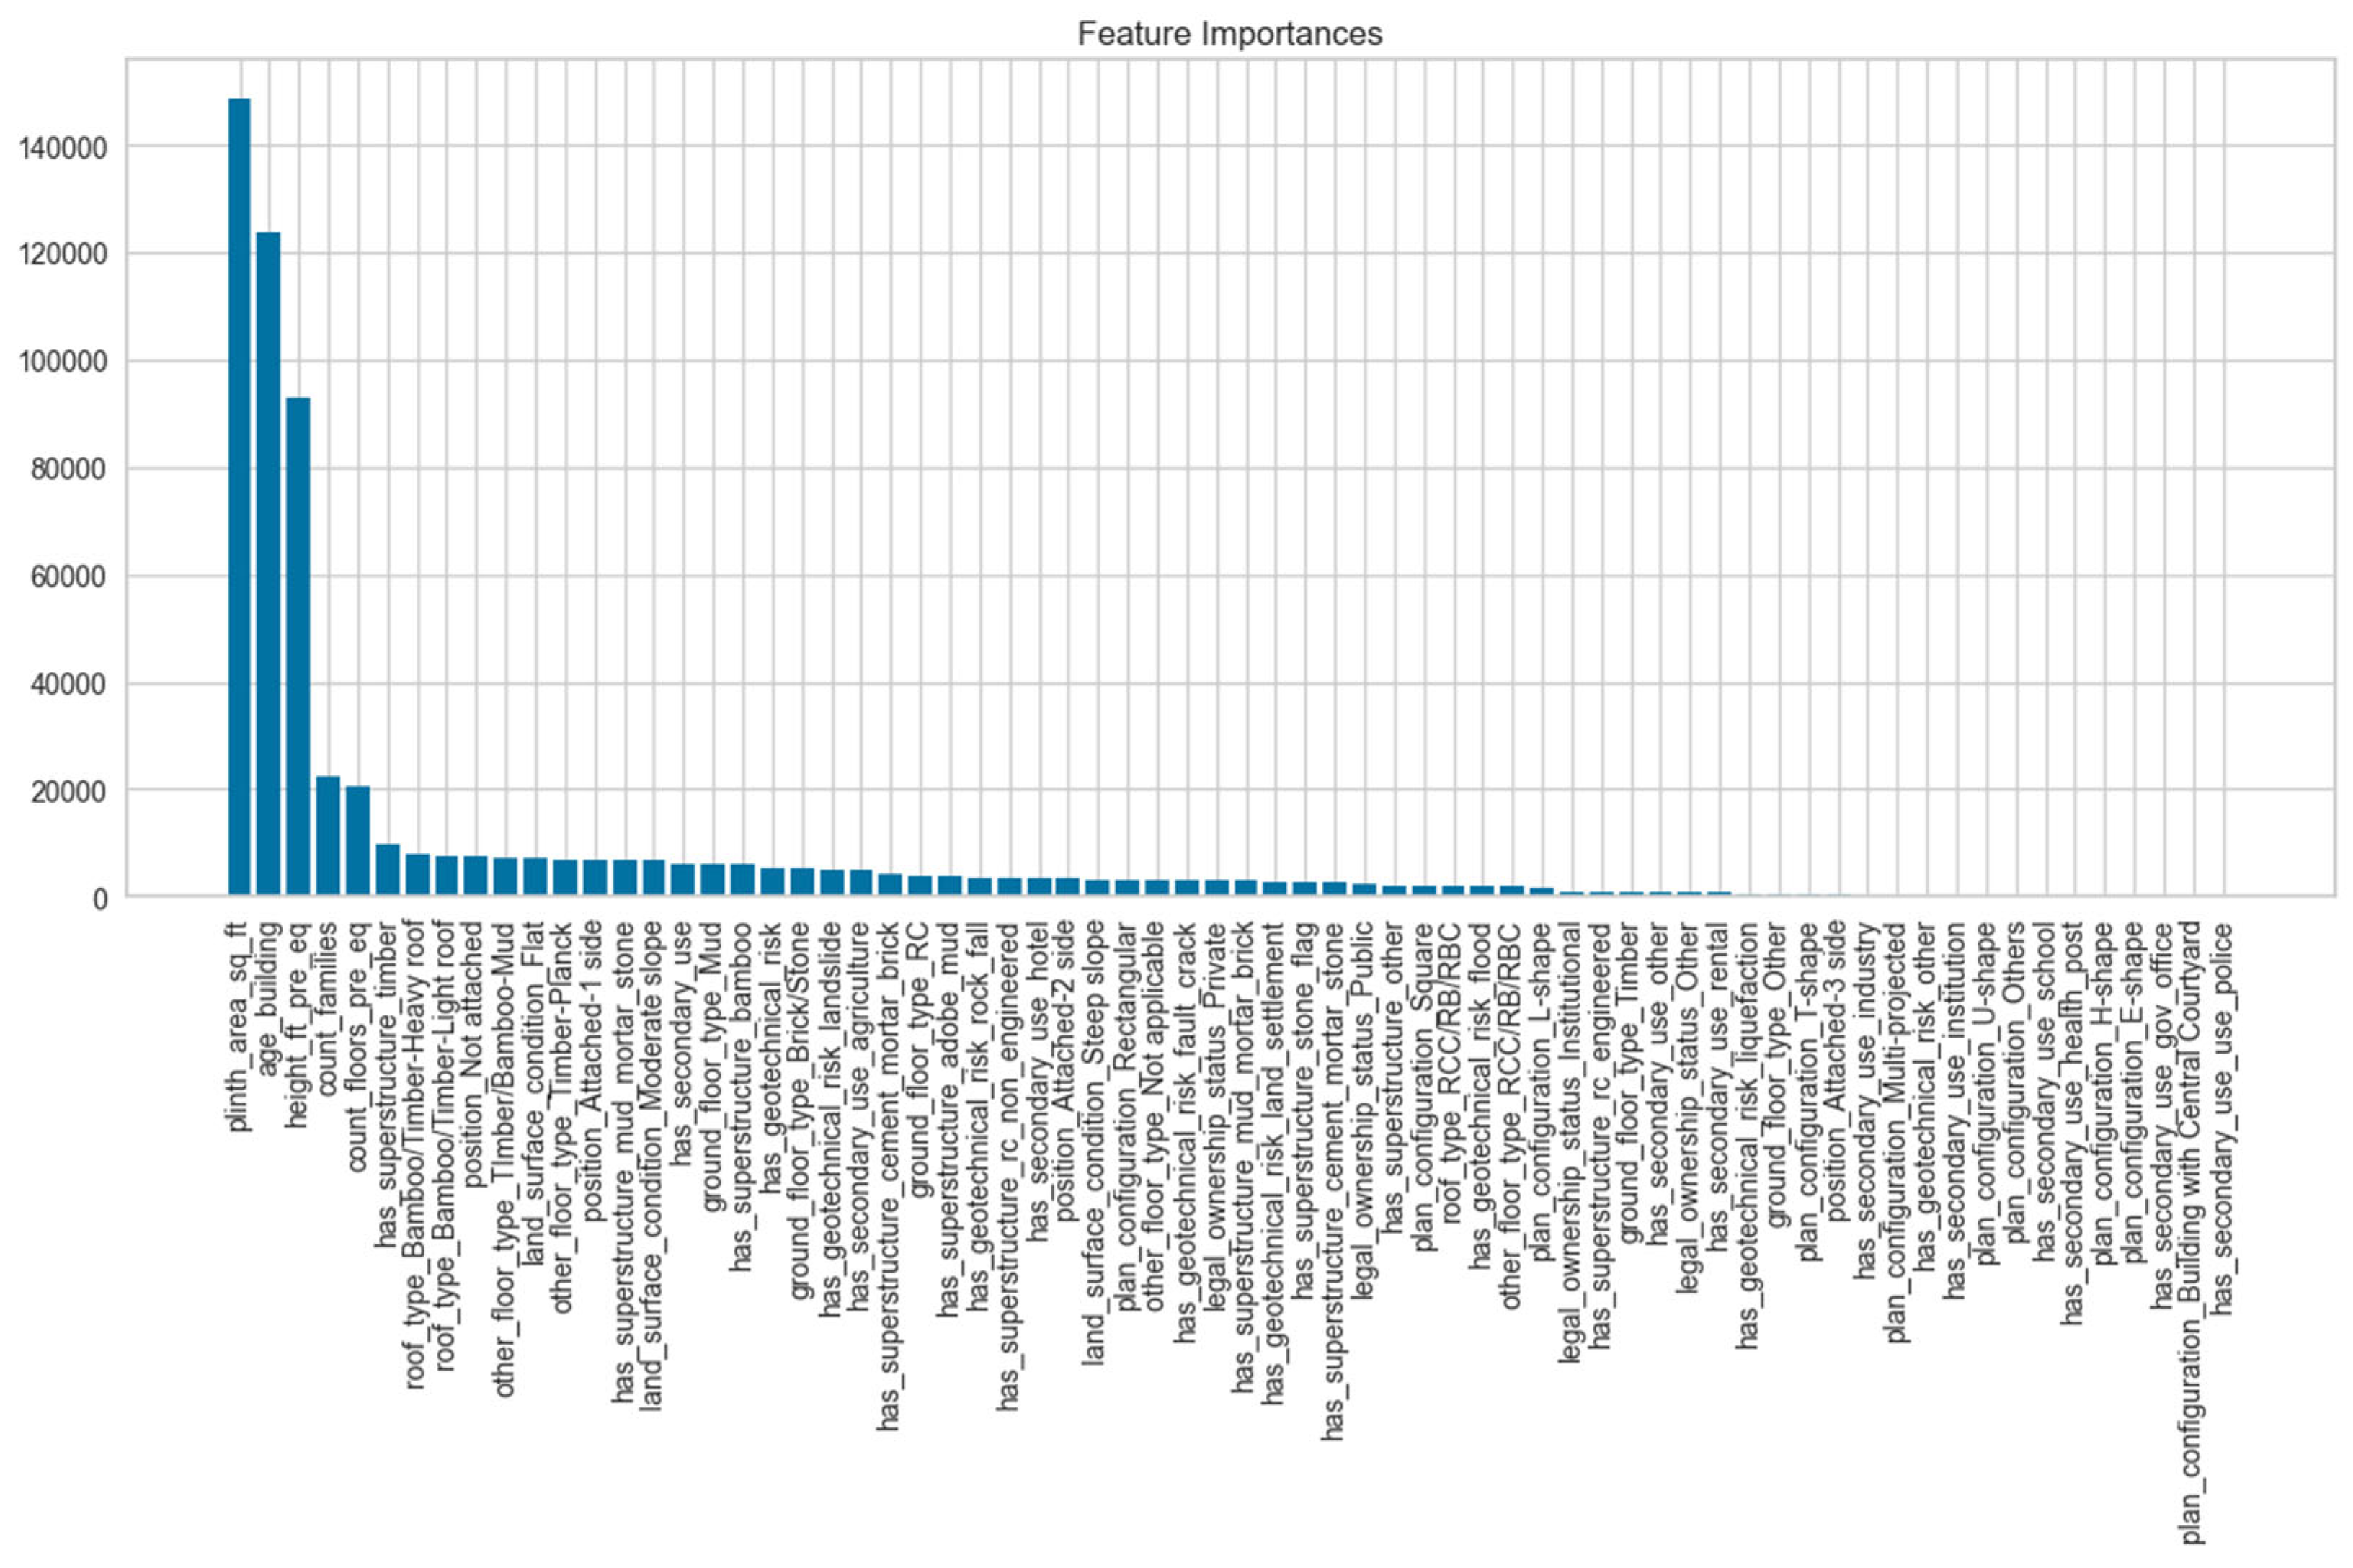
Based on the model performances, LightGBM was selected as the final model. One of the key features of the models is the impact of independent variables on the target variable and ranking them by importance. This ranking is shown in
Figure 10 for the LightGBM model, where all variables are listed from most to least important based on their influence.
When examining
Figure 10, it is clear that, for the oversampled dataset, the features that most affect the target variable damage_class are plinth_area_sq_ft (building area), age_of_building, and height_ft_pre_eq (pre-earthquake building height). The fact that plinth_area_sq_ft is the most important feature suggests that damage is directly related to the physical size of the building. The high importance of age_of_building and height_ft_pre_eq also confirms that structural characteristics are strongly associated with the level of damage.
In contrast, many other variables related to architectural design, geotechnical conditions, or building type appear to have lower influence. This indicates that physical structure parameters play a more significant role in damage prediction.
3.2. RC Structures Dataset
After examining the entire dataset, separate models were developed to predict both the damage_class and damage_grade variables specifically for the RC structures. The performance results for the three-class variable damage_class are presented in
Table 2. According to the results, the LightGBM model achieved the highest overall accuracy and class-based F1 scores compared to the XGBoost and Gradient Boosting models. When
Table 2 is evaluated, the results can be summarized as follows:
In the models applied to the raw dataset, the accuracy rates remained around 88%, but due to class imbalance, the F1 scores for the less represented class 1 and class 2 were quite low. For example, the LightGBM model produced F1 scores of 0.13 for class 0 and 0.04 for class 1, indicating that the class imbalance had a significant negative impact on the model’s performance.
To address this issue, random oversampling and undersampling techniques were applied to the dataset. The results obtained from the oversampled dataset showed a significant improvement in performance for all models. The comparison of model performance across datasets highlights the importance of handling class imbalance. In the raw datasets, all three models achieved similar overall accuracy, but extremely low F1 scores for minority classes indicated that predictions were dominated by the majority class. Oversampling dramatically improved performance, with LightGBM and Gradient Boosting reaching 0.978 accuracy and producing balanced F1 scores close to 1.00, while XGBoost also performed strongly. By contrast, undersampling led to a significant drop in accuracy, showing that excessive data reduction undermines model reliability. The reported confidence intervals further support these findings: narrow ranges in the oversampled datasets confirm both the stability and robustness of the models, whereas raw and undersampled datasets show consistent but biased or weak predictions. Overall, these results demonstrate that oversampling is essential for reliable classification of earthquake damage and that boosting-based models, particularly LightGBM and Gradient Boosting, offer the strongest performance.
The confusion matrix of the LightGBM model is shown in
Figure 11. The model’s classification performance on the damage_class variable was analyzed in detail. According to the results, the model demonstrated very high prediction performance for class 2.
As shown in
Figure 11, the confusion matrix indicates that all 5032 instances with a true value of class 2 (heavy damage) were correctly predicted, resulting in 100% accuracy for this class. Similarly, high performance was observed for class 1 (moderate damage), where 4840 out of 4845 instances were correctly classified. Only five instances were misclassified as class 2, which shows that the model provides highly balanced and reliable predictions for class 1.
For class 0 (slight damage), the model correctly predicted 4522 instances, while 289 were misclassified as class 1, and 30 as class 2. This indicates that there is some uncertainty between class 0 and class 1, and the model occasionally has difficulty distinguishing between these two classes. Nevertheless, the overall accuracy for class 0 is also quite high.
In conclusion, the LightGBM model demonstrated very strong performance in identifying buildings with slight, moderate, and severe damage.
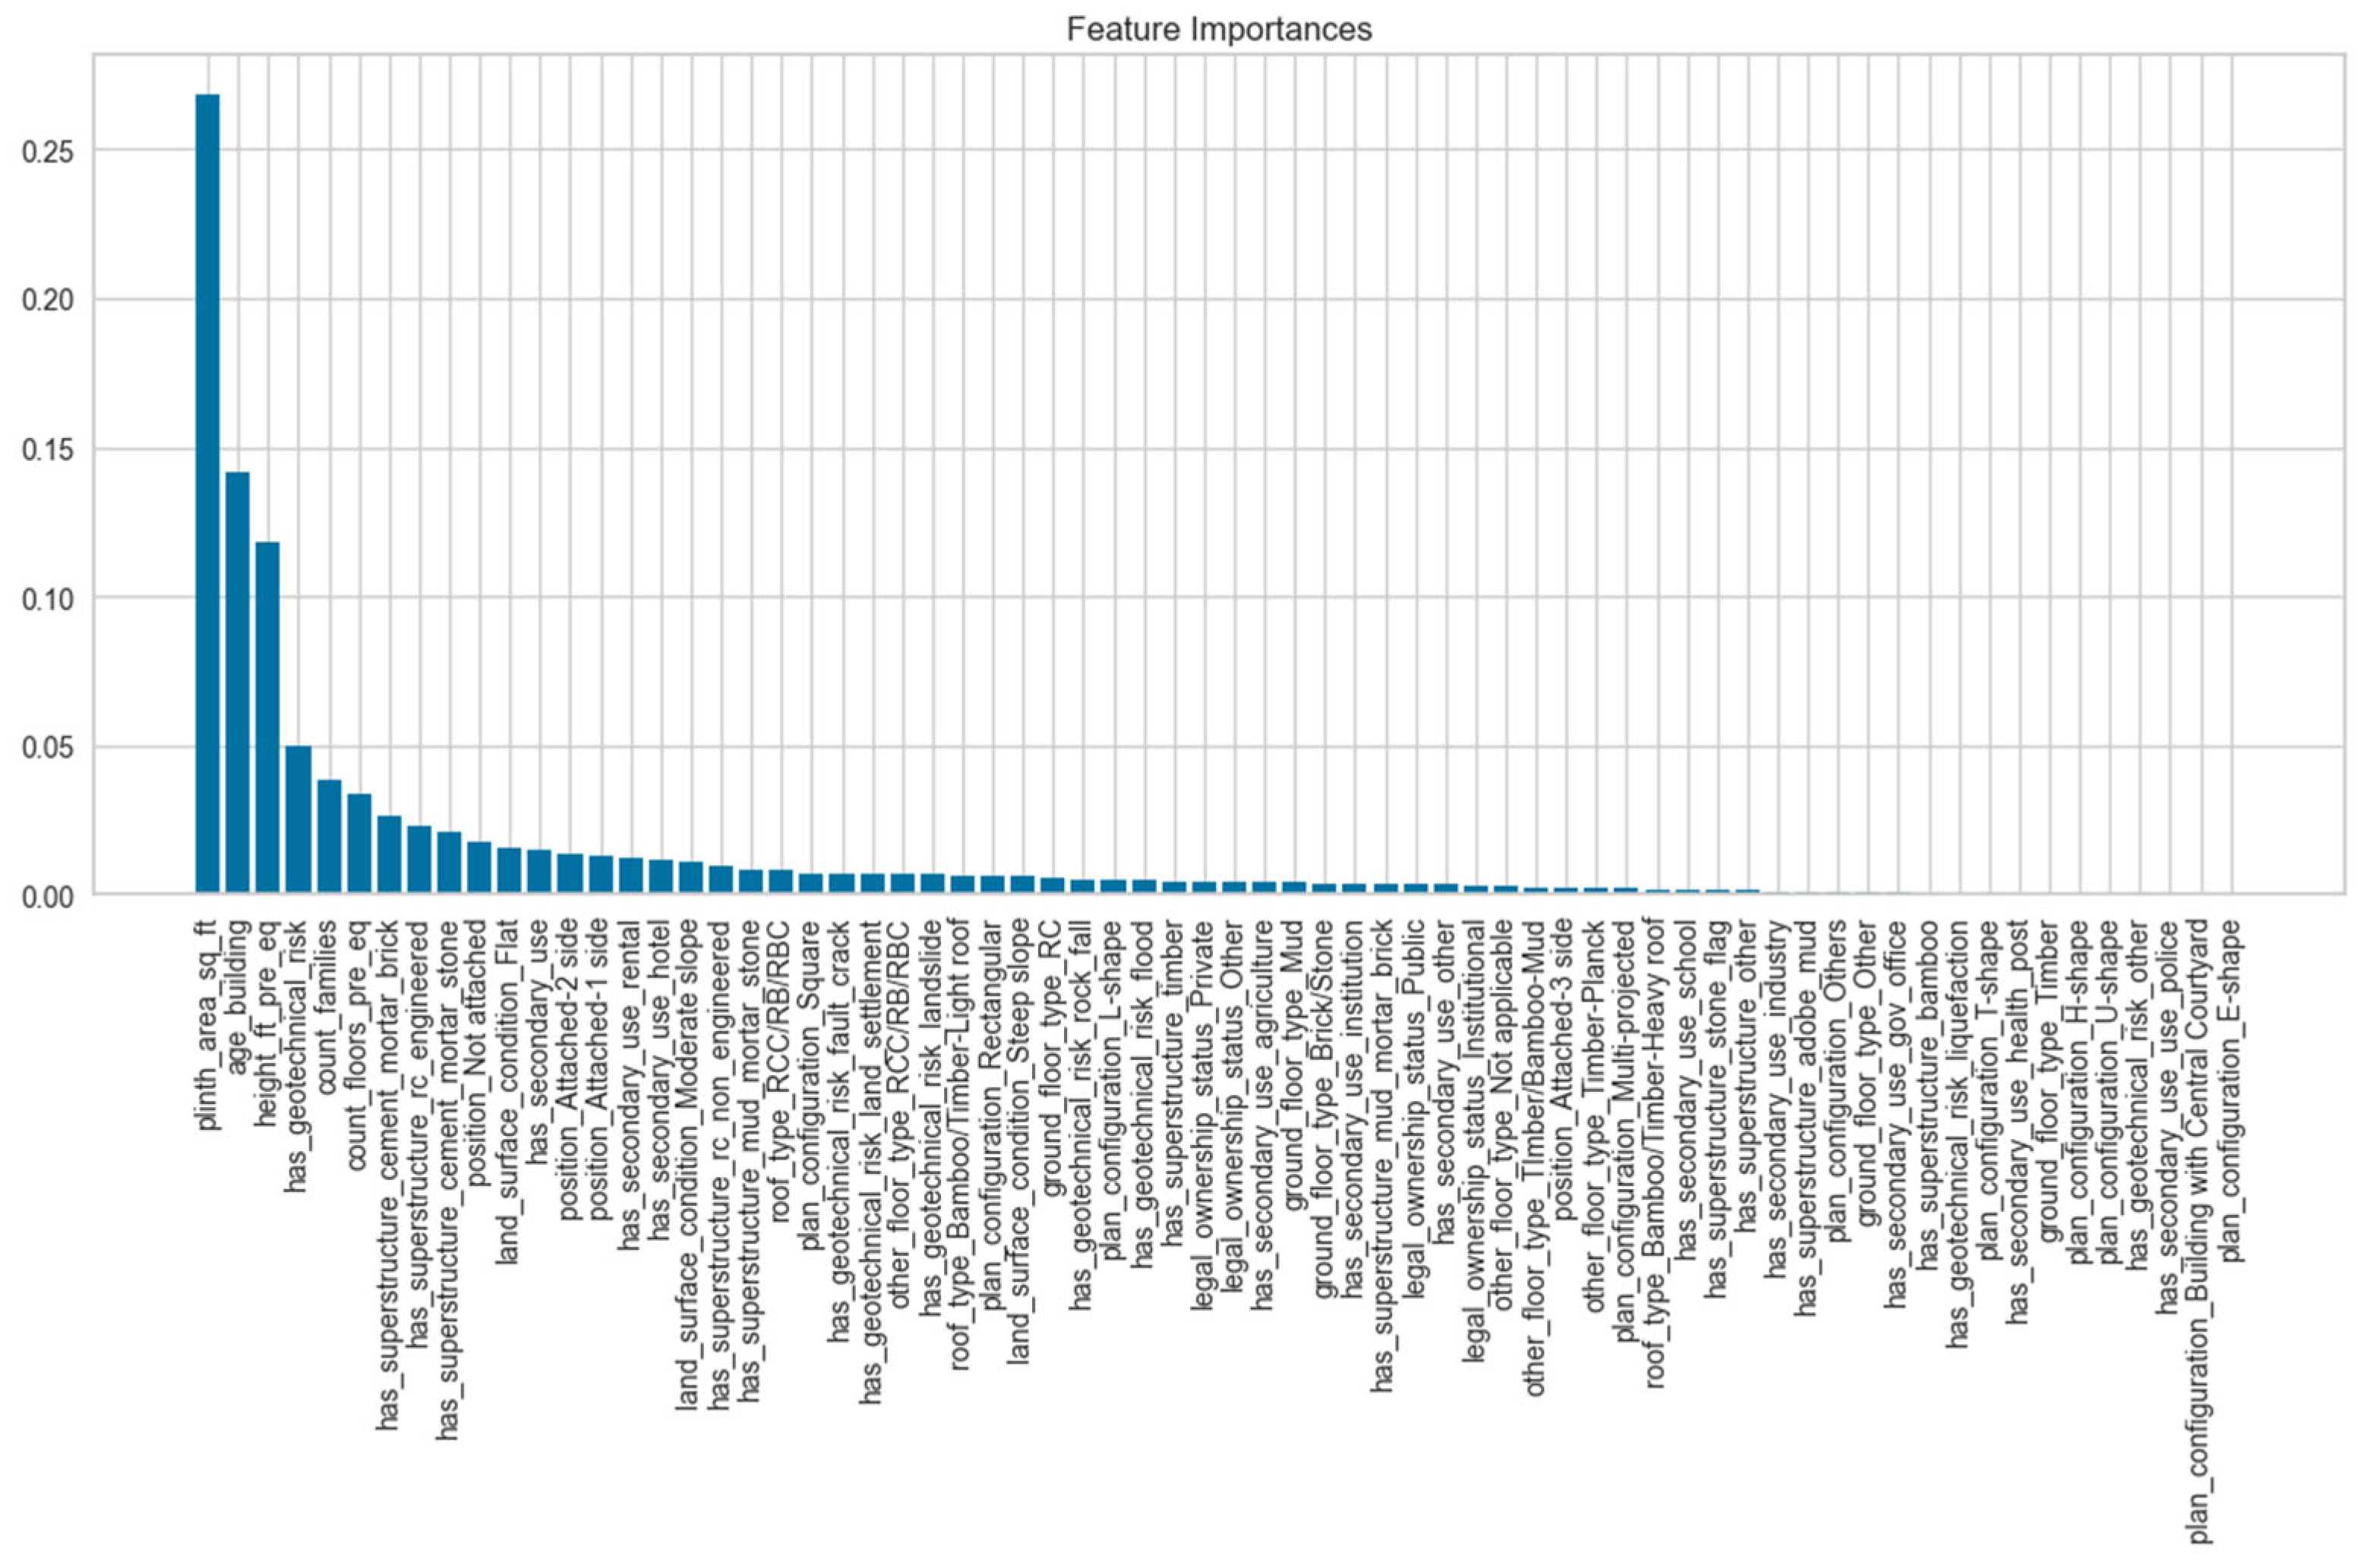
The feature importance ranking of all variables in the LightGBM model is shown in
Figure 12. When examining the ranking as in the raw dataset, the most influential features on the target variable damage_class in the oversampled dataset are the building area, building age, and building height.
A similar study was also carried out using the RC structures dataset, this time with damage_grade as the target variable. For the classification models built to predict damage_grade, the LightGBM, XGBoost, and Gradient Boosting algorithms were used, and the results are summarized in
Table 3. Each model was trained separately on the raw, randomly oversampled, and undersampled datasets, and their accuracy and class-based F1 scores were evaluated.
The five-class classification analysis reinforces the importance of addressing class imbalance. In the raw datasets, all three models achieved only moderate accuracy, and their ability to classify minority classes, particularly heavy and severe damage (classes 3 and 4), was very limited, with F1 scores approaching zero. This indicates that without balancing, the models mainly learn the majority classes while systematically neglecting the most critical categories. Undersampling improved the balance of F1 scores across classes but led to a substantial decline in accuracy, reflecting the loss of valuable information when the dataset size is reduced. By contrast, oversampling produced remarkable gains: LightGBM achieved the highest accuracy (0.925) with consistently high and near-perfect F1 scores across all classes, closely followed by Gradient Boosting, while XGBoost also improved significantly, though its performance was slightly weaker for some classes. Importantly, the narrow 95% confidence intervals in the oversampled datasets confirm that these improvements are not only large but also statistically stable. These results demonstrate that oversampling is indispensable in multi-class earthquake damage prediction, where imbalanced distributions are common. Moreover, they highlight that boosting-based models, particularly LightGBM, are well suited to capture the full spectrum of seismic damage, from slight to severe, offering valuable support for post-disaster decision-making and resource allocation.
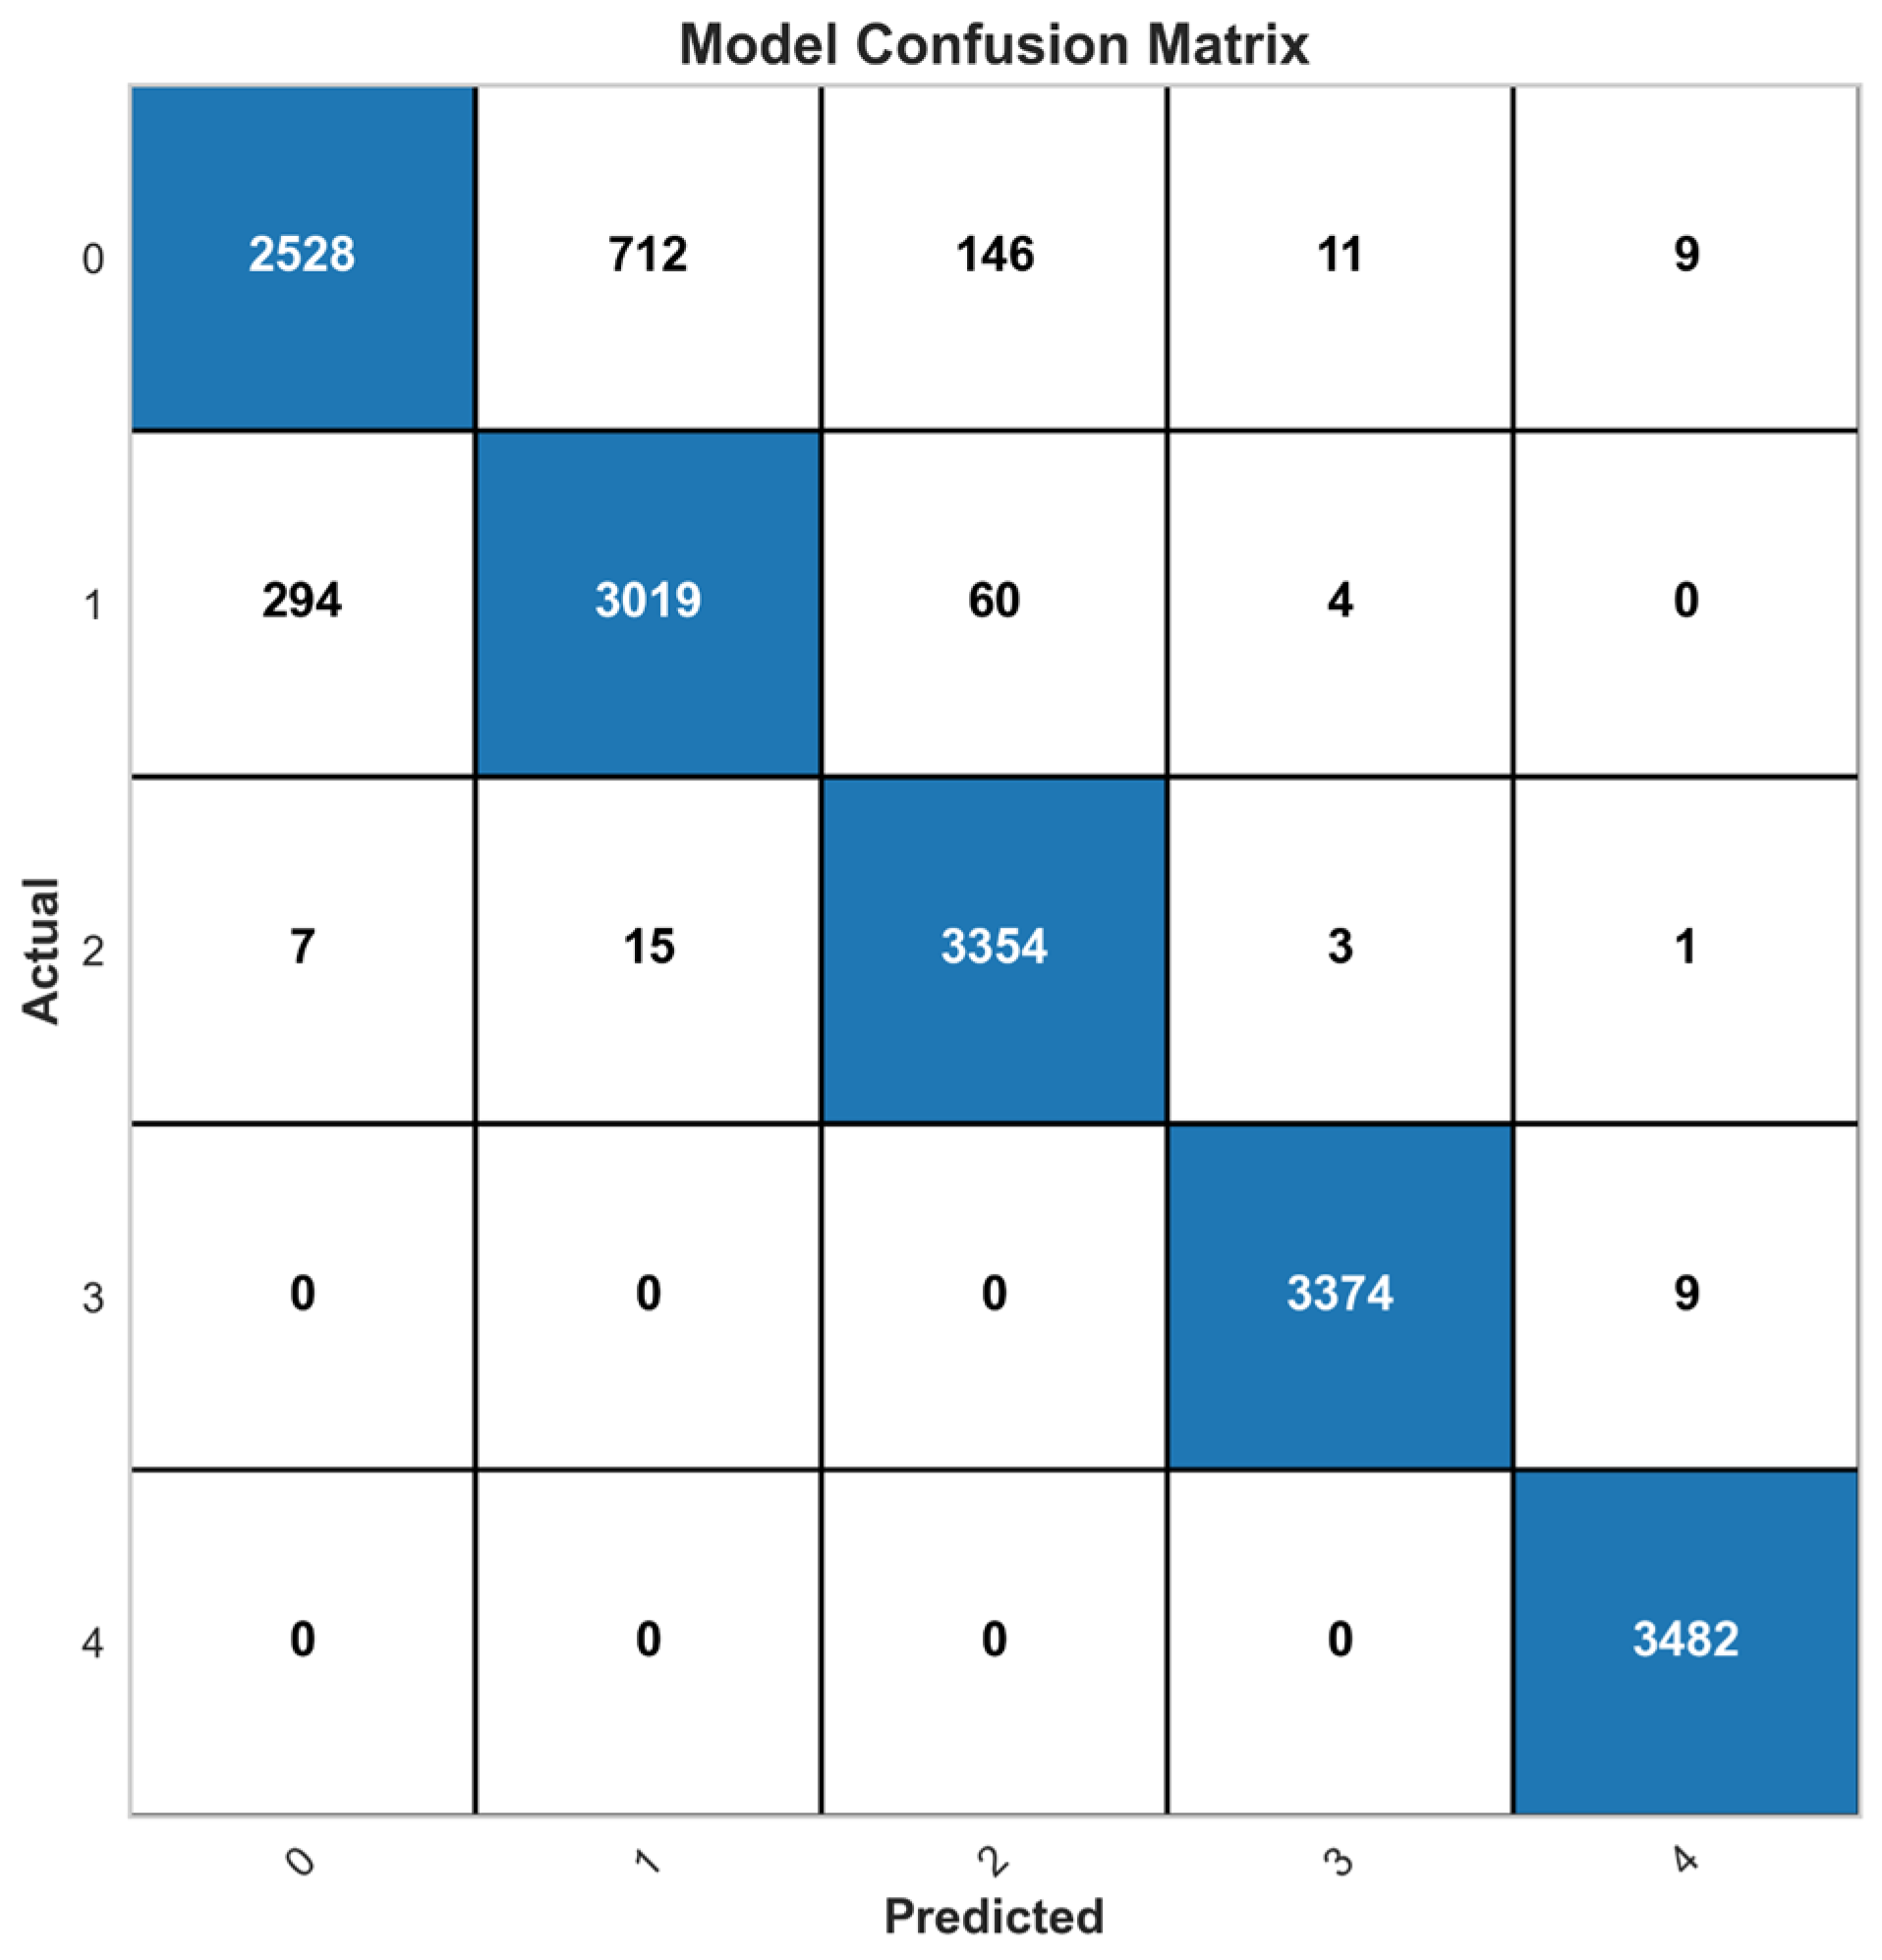
Among the models developed for the damage_grade variable, the LightGBM model achieved the best results. Its confusion matrix for predicting the five damage levels is shown in
Figure 13. The model achieved a high overall classification performance, with 93% accuracy on the oversampled dataset. The class-based F1 scores also support this high effectiveness; in particular, the model achieved near-perfect or perfect accuracy for the class 3 and class 4 categories.
As shown in
Figure 13, the results of the confusion matrix clearly reflect this situation. All examples in class 4 were correctly predicted, and for class 3, only nine examples were confused with class 4. In class 2, which represents moderately damaged buildings, 3354 examples were correctly classified, with only a few mistakes. These findings show that the model has strong performance in identifying buildings in high-risk damage classes.
On the other hand, the model was less successful in distinguishing between class 0 (very slight damage) and class 1 (low damage). Many examples in class 0 were classified as class 1, which suggests confusion due to similar data patterns and structural features between these two classes. This shows that additional methods such as feature engineering, sampling strategies, or class weighting may be needed to improve the model’s ability to separate low-damage levels.
Nevertheless, the confusion matrix in
Figure 13 shows that the model has good classification ability for both class 0 and class 1. In conclusion, the LightGBM model shows excellent performance in predicting moderate and severe damage levels, and it has strong potential to support decision-making in post-disaster response processes.
In the LightGBM model, the feature importance ranking for predicting damage_grade is shown in
Figure 14. When the feature importance is examined, it can be seen that, just like in the previous analysis, the most influential features in the oversampled dataset are the building area, building age, and building height.
4. Discussion
In this study, different machine learning classification models were used to predict the seismic damage levels of buildings affected by the 2015 Nepal earthquake. Three models were employed: Gradient Boosting (GBM), XGBoost, and LightGBM. The models were tested on two types of datasets: the full dataset of all building types, and a filtered dataset that included only reinforced concrete (RC) structures. The purpose of analyzing RC buildings separately was to improve the prediction performance specifically for this structural category.
For both datasets, three different versions were prepared: the raw dataset, the oversampled dataset, and the undersampled dataset. The raw dataset suffered from class imbalance, which is a common problem in earthquake damage classification. To address this issue, oversampling and undersampling techniques were applied. Each model was trained and tested separately on each version of the data.
The results showed that the LightGBM model achieved the best performance overall. In the raw dataset, LightGBM reached a good level of accuracy; however, the F1 scores for the minority classes were quite low. For example, in the full dataset, the F1 score for class 1 (moderate damage) was only 0.13, mainly due to the class imbalance problem. After applying oversampling, the model’s performance improved significantly. The F1 score for class 1 increased from 0.13 to 0.67, and for class 0 from 0.64 to 0.78. Although the F1 score for class 2 (heavy damage) slightly decreased, the model became more balanced and generalizable.
A similar trend was observed in the RC structure dataset. Using the oversampled version, LightGBM reached 98% accuracy for the damage_class variable and 93% accuracy for the damage_grade variable. The model showed excellent performance, especially in identifying heavy and severe damage cases, such as class 3 and class 4, where the F1 scores reached up to 1.00. However, the model had some difficulty distinguishing between class 0 (no or very slight damage) and class 1 (low damage). Many buildings in class 0 were incorrectly predicted as class 1. This could be explained by the similarities in structural characteristics between these two classes.
On the other hand, models trained on the undersampled datasets gave lower performance. Although class distribution was more balanced, the reduction in total sample size led to a loss of information, resulting in lower accuracy and lower F1 scores in most classes.
The confidence intervals calculated for accuracy further strengthen these findings. In the oversampled datasets, the CIs are very narrow, demonstrating both the stability and robustness of the high accuracy values. In the raw datasets, the confidence intervals are also narrow but centered around lower accuracies, confirming consistent yet imbalanced predictions dominated by majority classes. By contrast, in the undersampled datasets, the confidence intervals are slightly wider and centered around much lower accuracies, indicating that the models consistently underperform when data reduction leads to information loss. Overall, the confidence interval analysis confirms that oversampling not only improves predictive performance but also enhances the reliability of the models.
The imbalanced distribution of damage levels in the RC dataset, particularly the relatively small number of severe-damage cases compared to low-damage cases, has important implications for model reliability. Although oversampling was applied to mitigate this issue, the limited representation of severe-damage buildings may still affect the model’s generalization ability and lead to an underestimation of the most critical cases. This limitation highlights the need for cautious interpretation of the results and indicates that future studies could benefit from incorporating additional severe-damage samples, alternative rebalancing strategies, or domain-informed feature engineering to further improve the robustness of RC-specific models.
Finally, feature importance analysis showed that in both datasets (full and RC), the most important features for damage prediction were building area, age of the building, and building height. These variables had the highest influence on the model’s predictions. In contrast, other features, such as building type or soil condition, had lower importance in determining the level of damage.
An important aspect of this study is the generalizability of the developed models. Although the models were trained and tested on data from the 2015 Nepal earthquake, the methodology can be applied to other earthquake datasets that provide comparable structural and contextual variables. However, variations in local construction practices, building codes, and data collection procedures may influence the transferability of the results. Therefore, while the findings demonstrate the potential of boosting-based models for earthquake damage prediction, future research should evaluate their performance on diverse datasets to confirm robustness and adaptability across different seismic contexts.
In addition, although this study focused on post-earthquake damage assessment, the same machine learning approaches can be adapted for pre-earthquake early warning systems by integrating seismic hazard indicators and real-time monitoring data. Such extensions would contribute to saving lives and reducing economic losses in future disasters.
5. Conclusions
This study focused on predicting earthquake damage levels using machine learning classification models based on data from the 2015 Nepal earthquake. Three models were tested: Gradient Boosting, XGBoost, and LightGBM. The models were applied to both the full dataset and a filtered dataset that included only reinforced concrete (RC) buildings. To address the class imbalance problem, oversampling and undersampling techniques were used.
The results clearly showed that the LightGBM model performed better than the other models in both datasets. Especially when oversampling was applied, LightGBM reached high accuracy and produced balanced F1 scores across all damage classes. For example, in the RC dataset, the model achieved 98% accuracy for predicting damage_class and 93% accuracy for predicting damage_grade. In some damage levels, like class 3 and class 4, the model even reached perfect scores.
In contrast, models trained on the raw and undersampled datasets showed lower performance. In the raw data, the models could not learn minority classes well. In the undersampled data, performance dropped due to the loss of useful information.
In addition, the inclusion of 95% confidence intervals for accuracy confirmed that the oversampled models are not only highly accurate but also statistically robust. These results highlight the reliability of boosting-based approaches, particularly LightGBM, for earthquake damage prediction.
The feature importance analysis showed that the most influential variables in damage prediction were building area, building age, and building height. These findings suggest that collecting reliable structural data is important for improving model performance.
In conclusion, the LightGBM model, when trained on an oversampled dataset, is a powerful tool for earthquake damage classification. It can help decision-makers after disasters by providing fast and reliable damage predictions, especially for buildings with moderate and severe damage levels.
It is also important to acknowledge potential biases and uncertainties in both the data and model predictions. The dataset relies on field assessments, which may contain subjective variations in labeling damage levels due to differences in training and interpretation among survey teams. In addition, the strong imbalance across classes, particularly the limited number of severe-damage cases, introduces further uncertainty into the model’s ability to generalize. While oversampling techniques partially mitigate this issue, they may also amplify noise in the minority class. These factors highlight that the predictions, although robust within the dataset, should be interpreted with caution in practical decision-making and complemented by expert judgment and additional data sources whenever possible.
Beyond oversampling, several alternative methods could be considered to address class imbalance. Approaches such as assigning class weights, applying focal loss functions, or designing domain-informed features may improve the detection of minority classes without artificially duplicating data. Although these techniques were not applied in this study, they provide promising directions for future research to further enhance the robustness and reliability of earthquake damage prediction models.
