Abstract
Water pumping stations are essential components of national water infrastructure, yet their construction involves complex, high-risk processes, and traditional risk management approaches often show significant limitations in practice. To address this challenge, this study proposes a Building Information Modeling (BIM)-based approach that integrates structured risk information into an interactive nD BIM environment. We first developed an extended Risk Breakdown Matrix (eRBM), which systematically organizes risk factors, assessment levels, and causal relationships. This is linked to the BIM model through a customized BIM–risk integration framework. Subsequently, the framework is further implemented and quantitatively validated via a Navisworks plug-in. The system incorporates three core components: (1) a structured risk information model, (2) a visualization mechanism for dynamic, spatiotemporal risk representation and (3) risk influence path analysis using the Decision-Making Trial and Evaluation Laboratory–Interpretive Structural Modeling (DEMATEL–ISM) method. The plug-in allows users to access risk information on demand and monitor its evolution over time and space during the construction process. This study makes contributions by innovatively integrating risk information with BIM and developing a data-driven visualization tool for decision support, thereby enhancing project managers’ ability to anticipate, prioritize, and mitigate risks throughout the construction lifecycle of water pumping station projects.
1. Introduction
With the advancement of the National Water Network initiative, inter-basin water transfer projects and large-scale hydraulic infrastructure have become more critical for achieving spatial equilibrium and systematic governance of water resources across China. Among these infrastructures, water pumping stations play a pivotal role in water regulation and management. They serve essential functions such as flood control, drainage, and irrigation support and provide a powerful mechanism for the rational allocation of water resources [1]. Modern water pumping station construction is an inherently complex process that requires the coordination of funding, personnel, construction technologies, environmental and site conditions, and potential natural hazards. These factors contribute to a wide range of risks that must be carefully managed to meet the stringent standards of high-quality hydraulic infrastructure development. In particular, high-risk construction activities, such as deep foundation excavation, operation under complex geological conditions, and large-scale concrete structures [2], often pose significant challenges. Inadequate risk management in these areas may lead to serious outcomes, including structural damage or collapse, budget overruns, construction delays, and even personal injury or loss of life. Therefore, it is imperative to enhance fine-grained risk management during the construction phase to reduce potential hazards and ensure water security.
Given the inherent complexity of construction risk management, a variety of systematic methods, both qualitative and quantitative, have been developed to support the identification, assessment, and analysis of risks [3]. Since construction risks often stem from the interaction of multiple contributing factors, researchers have increasingly focused on uncovering the interrelationships among risk factors and revealing the underlying mechanisms that drive risk propagation. For pumping station projects, this feature of risk coupling is particularly pronounced. Their construction is often constrained by complex geological conditions, stringent structural performance requirements, and parallel multi-process operations, all of which create a unique and highly sensitive risk environment. Therefore, classifying construction risks in pumping station projects and examining the interrelationships among these risk factors constitutes a necessary foundation for this study. Although many existing studies have provided valuable theoretical insights, their practical application remains limited. Many construction workers and on-site managers lack specialized training in risk management and often struggle to interpret complex analytical outputs or numerical models [4]. This disconnect highlights the need for more accessible and intuitive tools. To bridge this gap, translating quantified risk data into visual formats has become essential for enhancing the usability of risk management systems.
Building Information Modeling (BIM), as a widely adopted digital technology in the construction industry, not only supports project lifecycle management but also plays a critical role in risk identification and control during the design, construction, and operation phases. Its strengths in visualization, integration, and simulation provide a solid foundation for data consolidation and intuitive representation in construction risk management. Accordingly, this study takes BIM as the core platform and focuses on the management and practical application of construction risks in water pumping station projects, with the aim of exploring visualization-based approaches for risk control. A considerable number of studies utilize basic color-coding techniques to link BIM components with predefined risk levels, enabling intuitive visualization of the spatial and temporal distribution of risks and enhancing stakeholders’ perception of potential hazards [5]. However, while these methods offer preliminary insights, they often fall short in actual project contexts where risk identification, causal analysis, and dynamic assessment are key concerns for construction risk managers. Most current BIM-based visualization techniques lack the capacity to represent the interdependence and evolution of risk factors in a comprehensive and meaningful way.
To address this gap, this study proposes an integrated BIM–risk information integration framework tailored for water pumping station construction. A key contribution is the development of an extended Risk Breakdown Matrix (eRBM), which systematically organizes risk factors, assessment levels, and causal relationships. The eRBM is tightly linked to the BIM model through the proposed integration framework, enabling seamless association between physical components and associated risks. To support practical application, a visualization tool was developed using BIM secondary development techniques. The system architecture consists of three core components: (1) a structured risk information model to manage heterogeneous construction and risk data; (2) a risk influence path analysis module utilizing the Decision-Making Trial and Evaluation Laboratory–Interpretive Structural Modeling (DEMATEL–ISM) method to uncover causal relationships and hierarchical risk structures; (3) a spatiotemporal visualization mechanism that enables intuitive exploration of evolving risks. All data are managed using a tabular format, allowing the definition of multidimensional relationships across BIM components, construction schedules, and risk attributes. Based on this structure, the visualization mechanism is implemented through a custom Navisworks plug-in, developed via Application Programming Interface (API). The resulting prototype enables users to spatially identify risk sources and monitor their temporal evolution throughout the construction lifecycle, thereby effectively addressing critical limitations in existing risk integration and visualization methods for complex water infrastructure projects.
2. Literature Review
2.1. Traditional Approaches to Construction Risk Management
Within the Architecture, Engineering, and Construction (AEC) industry, risk refers to unforeseen events or conditions that may disrupt or damage a project, including site accidents, labor disputes, equipment failures, construction defects, supply chain interruptions, design or technical errors, and weather-related delays [6]. Traditional risk management, as standardized by the International Organization for Standardization (ISO), typically follows a systematic process of identification, analysis, and evaluation to mitigate risks and support decision-making [7].
2.1.1. Construction Risk Identification
Risk identification emphasizes recognizing potential risks, categorizing them, and analyzing their impacts on projects [8]. Existing methods can be broadly grouped into three types: experience and case-based approaches, which rely on expert judgment and accident records [9,10]; statistical and data-driven techniques, such as probabilistic analysis and machine learning [11,12,13]; and knowledge-based methods, including ontologies and knowledge graphs for modeling risk propagation [14,15]. For water pumping station projects, where complex geology, strict structural demands, and multi-process operations create highly coupled risks, relying on a single method is inadequate. Effective risk identification in such contexts often requires combining multiple approaches to capture both explicit risk events and latent interdependencies.
2.1.2. Construction Risk Assessment
Construction risk assessment aims to analyze and prioritize potential risks that may affect project objectives, in order to develop appropriate mitigation strategies [16]. Most studies adopt a probability–impact (P–I) risk model to evaluate construction risks, where the risk value R is calculated as the product of probability (P) and impact (I). To enhance the accuracy of risk modeling, various additional parameters have been introduced to describe the inherent characteristics of risk, such as manageability [17], controllability [18], predictability, detectability [19], and frequency of occurrence. However, for pumping station projects, the variability of geological conditions and the scarcity of project-specific data make it difficult to quantify these indicators in practice.
Since single-metric risk models often fail to capture the interactions and systemic effects among risks, this study adopts the probability–impact model to comprehensively assess water pumping station construction risks at the component or subproject level. The complexity of construction risk has also led researchers to use probabilistic methods to account for randomness and uncertainty, including Bayesian networks [20], Monte Carlo simulation, and fault tree analysis [21]. However, the limited availability of historical data in many construction projects often restricts the application of these probabilistic approaches [22]. As a result, deterministic methods—based on computing the product of probability and impact—remain more widely accepted in the risk assessment of water pumping station construction.
2.1.3. Construction Risk Analysis
Conventional risk assessment often treats risks as independent and static, while in practice uncertainty arises from multiple causes, events, and consequences [23]. Construction risks usually result from combined factors, and many studies have examined their interdependencies through causal analysis, complex network theory, and intelligent algorithms. Complex network theory, in particular, models interactions among risk factors and captures their systemic and dynamic nature [24]. For instance, system dynamics and social network analysis have been used to simulate risk evolution and identify key nodes in risk networks [25,26], while extensions such as the N–K model and coupling theory have been applied in tunnel engineering [27]. Intelligent algorithms, including models combining genetic algorithms and neural networks, further improve risk modeling [23], though their reliance on large historical datasets limits application in water pumping station projects.
Currently, integrating static and dynamic approaches has become mainstream, and combining qualitative with quantitative methods is common. Given the dynamic nature of construction risk, traditional management methods struggle to support effective information sharing [28], thereby limiting stakeholders’ risk perception and control efficiency [29]. This underscores the need for digital solutions that can enhance interactive risk information exchange and intuitive visualization, with BIM emerging as a particularly promising platform.
2.2. BIM-Based Construction Risk Management
BIM is increasingly applied across the full lifecycle of construction projects, offering notable advantages for risk management. As a data integration platform, it enables interactive risk management with other tools. Real-time updates and rule-based automated checks further improve efficiency and accuracy in risk management [30]. Building on these capabilities, Moshtaghian et al. [31] integrated 3D BIM, planning data, and on-site monitoring into a dynamic database, allowing early warning and control of construction risks, though its effectiveness relies heavily on real-time data. BIM also allows embedding risk information into 3D/4D models, facilitating integration and visualization [32]. A common approach is color-coding BIM components to represent risk levels, which highlights their spatial and temporal distribution [13]. Extending this idea, Yasser et al. [5] automated the transfer of digital risk data into BIM via a Dynamo-based system, while Zou et al. [3] embedded a customized RBS for risk visualization in 4D BIM environments. These methods enhance communication and stakeholder awareness of hazards.
Overall, BIM demonstrates clear benefits through automated rule checking [33], early detection of potential risks, and the effective visualization and reuse of risk information [34]. However, given the dynamic and interrelated nature of risks, current visualization methods still struggle to achieve comprehensive and standardized integration of risk information in BIM-based environments.
2.3. Construction Risk Management in Water Pumping Station Projects
Compared with general construction projects, the complexity of water pumping station construction further accentuates the limitations of the above risk management methods. As critical nodes in water infrastructure systems, water pumping station construction projects face multiple risk challenges. On the one hand, they are frequently located in geologically sensitive areas, where unstable formations and variable groundwater conditions heighten the uncertainty of underground works and increase the probability of construction hazards [35]. On the other hand, the structural system itself must endure long-term service under combined static and dynamic loads, placing considerable stress on materials and raising the risk of performance degradation during construction and subsequent operation [36]. At the system level, water pumping stations are not isolated structures but nodes within a wider water supply and energy regulation network; early design and capacity planning thus introduce risks associated with interdependence and cross-project coordination [37]. The construction process further intensifies these challenges, as large volumes of work are divided into parallel sections and carried out under conditions often complicated by difficult terrain, adverse climate, and geological disturbances, all of which can disrupt schedules, resource allocation, and progress control [38,39]. These factors together define the unique risk profile of water pumping station construction, necessitating more refined and systematic risk management approaches.
Although construction risk management has been extensively studied in the AEC sector, research specifically addressing water pumping station projects remains scarce. To fill this gap, and given the complex geological, structural, and organizational risks inherent in such projects, this study explores BIM-based approaches to enhance risk communication and management. Existing BIM-related research, however, often lacks standardized integration mechanisms and effective representation of evolving risks. To address these shortcomings, this study develops a BIM-based risk information integration framework tailored for water pumping station construction. The framework introduces an eRBM to systematically organize risk information and links it with a customized Work Breakdown Structure (WBS) to associate risks with physical components. Furthermore, a Navisworks plug-in was developed to operationalize the framework, providing three complementary modes of risk visualization that enable exploration of risk factors, assessment results, and influence paths. This integrated approach offers new insights into BIM-based risk information management and contributes a practical tool for more refined and systematic risk management in complex water infrastructure projects.
3. Methodological Framework
This study proposes a construction risk information integration and visualization management framework tailored for water pumping station projects and implements it through a BIM-based plug-in tool. The overall methodological framework is illustrated in Figure 1. Section 4 introduces the risk information integration framework. It first identifies three core information sources—building components, construction activities, and construction risks—then organizes risk data systematically through the eRBM, and further establishes a BIM–risk information integration mechanism based on the WBS. Section 5 shifts to the implementation of the framework, presenting the design of the risk information model, the analysis of risk influence paths, the visualization mechanism, and the system architecture, followed by the functional modules and user interface of the prototype system to support practical application. Section 6 demonstrates the application of the framework and tool through a case study, thereby validating the feasibility and practical value of the proposed approach.
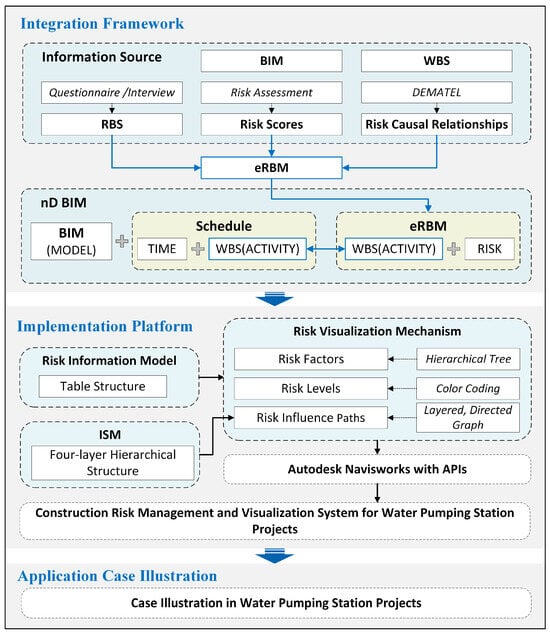
Figure 1.
Methodological framework for BIM-based integration and visualization management of construction risks of water pumping station projects.
4. Information Integration Framework
4.1. Information Source
- Building Component Information
BIM typically consists of predefined 3D architectural objects, in which rich construction-related data are embedded as attributes or parameters [40,41]. In the context of water pumping station projects, BIM models primarily include core components such as the foundation, collection tank, and suction well, as well as specialized facilities like the pump units, inlet and outlet pipelines, and electrical control equipment. These components exhibit various spatial topological relationships, such as adjacency and association, forming functional structures including foundations, pump rooms, inflow and outflow pools. In a construction scenario, BIM models also incorporate temporary components (e.g., scaffolding, earthworks), construction machinery (e.g., tower cranes, excavators), and surrounding site environments.
- 2.
- Construction Activity Information
The WBS is a hierarchical system that divides a construction project into various tasks and activities. It provides a unified structure to classify and organize construction projects at different levels [42]. According to current regulations, a construction project should be decomposed progressively down to the operation level, including unit project and item project. The WBS method is then used to further decompose the work processes into specific tasks, forming a detailed list of work activities. For water pumping station projects, by referring to the Code of Bills of Quantities and Valuation for Hydraulic Engineering [43], the Technical Specification for Quality Inspection of Hydraulic Engineering [44], and the Construction and Acceptance Code for Pumping stations [45], the initial WBS comprises six unit projects including foundation treatment and support, metal structure installation, and electrical works, along with 27 corresponding item projects like ground trenching, foundation drainage, and foundation treatment.
- 3.
- Construction Risk Information
In the our previous study [46], construction risk factors were identified at the item project level of water pumping station projects, followed by the development of a Risk Breakdown Matrix (RBM) that was built upon the WBS. The matrix was used to assess the composite construction risk levels of the item projects and to explore the influencing relationships between the construction risk factors of the item projects. Specifically:
- Identification of Construction Risk Factors: Through accident case studies in hydraulic engineering and expert knowledge, construction risk factors are classified into eight categories using the 6M1E1S model, i.e., Man, Machinery, Material, Method, Measurement, Money, Environment, and Society. These categories form a structured Risk Breakdown Structure (RBS).
- Assessment of Risk Levels: Using fuzzy set theory, risk scores for each item project were calculated by evaluating the general likelihood of risk occurrence and the severity of potential consequences during construction. These scores were subsequently used to determine risk levels and establish a prioritized ranking of the item projects within the overall water pumping station construction project.
- Analysis of Risk Factor Causal Relationships: The DEMATEL method, which helps understand the causal relationships within complex systems, was employed to analyze the causal relationships among the construction risk factors. Based on expert evaluations of inter-factor influence, the DEMATEL method quantified each factor’s centrality and causality. Centrality reflects the degree to which a risk factor influences and is influenced by others, while causality indicates whether a factor is a root cause or an outcome.
4.2. Organization of Construction Risk Information with eRBM
In order for a comprehensive presentation of the construction risk information, an extended RBM, eRBM, is constructed, as illustrated in Figure 2. In our previous study [44], construction risk factors were first identified at the item project level of water pumping station projects. Based on this, an RBM was developed to link each item project with its classified risk factors under the 6M1E1S model, providing a structured foundation for risk management. However, the original RBM mainly functioned as a tool for risk identification and lacked the ability to incorporate quantitative assessments or represent the interdependencies among risk factors. The eRBM directly remedies these limitations by extending the RBM to include both quantitative risk assessment and causal relationships among factors.
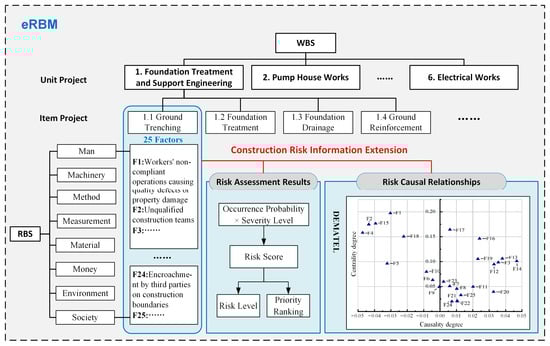
Figure 2.
Illustration of eRBM.
On the basis of the RBM, the risk scores derived from the occurrence probability and severity level, together with the resulting risk levels and priority rankings, constitute the risk assessment results for each item project. In parallel, the centrality and causality attributes of each risk factor reflect its role within the risk system, thereby forming risk causal relationships of the eRBM. By incorporating these, the eRBM extends the original RBM beyond a tool for risk identification to a multidimensional and integrated representation of construction risk information. Each item project is thereby linked not only to its classified risk factors but also to risk assessment results and risk factor causal relationships.
Taking the item project “1.1 Ground Trenching” as an example, the eRBM identifies a total of 25 construction risk factors categorized by 6M1E1S. These potential risk factors provide benchmarks for assessing the general likelihood of risk occurrence and the severity of potential consequences during construction, ultimately calculating this item project’s risk score (0.568), risk level (Level I), and priority ranking (4th) among all the item projects. Through the DEMATEL method, each of the 25 construction factors was quantified with two properties including centrality and causality, forming item project-specific risk causal relationships. For the Ground Trenching item project, among the 25 identified risk factors, the top three in terms of centrality are F1 (0.197), F15 (0.177), and F2 (0.175), indicating that these risk factors have the greatest impact on the construction of this item project. In addition, 17 risk factors with positive causal degrees are identified as cause factors, exerting significant influence on other risks. The remaining 8 construction risks, characterized by negative causal degrees, are regarded as effect factors in the risk system.
4.3. Comprehensive Framework of Information Integration
To support visual risk management during the construction process of water pumping station projects, this study proposes an integration method that combines the BIM model components with the associated construction risk information, based on the WBS. The overall framework is illustrated in Figure 3.
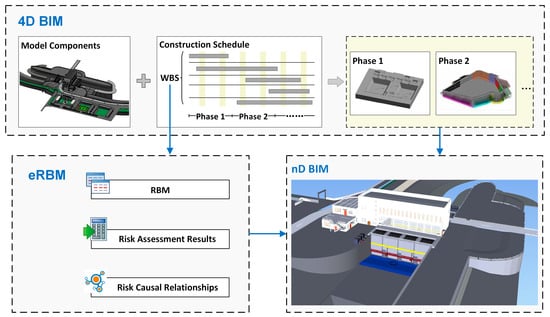
Figure 3.
Information integration framework.
According to the WBS, construction activities are decomposed into the smallest executable tasks, i.e., the item projects of the water pumping station case. Each item project is associated with temporal attributes—such as start date, end date, and duration—which, when structured within the WBS hierarchy, collectively define the overall construction schedule. Similarly, the water pumping station BIM model is broken down into a hierarchical set of components aligned with the WBS. By using the WBS as the central reference, a direct mapping is established between BIM model components and construction tasks, effectively linking the digital model to construction activities and their timelines. This integration enables the development of a 4D BIM model that incorporates both spatial and temporal dimensions [47].
As previously described, the eRBM organizes construction risk information at the item project level of the WBS. It includes identified risk factors across different construction stages, associated risk levels, and the causal relationships through which these risks may impact the project. Because the eRBM is structured in alignment with the WBS, the WBS serves as a bridge between the 4D BIM model and the eRBM. This linkage facilitates the seamless integration of construction risk information into an nD BIM environment [28]. Consequently, both the temporal evolution of risks throughout the project schedule and their spatial distribution across the BIM model can be effectively visualized and managed via the information integration framework.
5. Implementation Platform
To enable effective data manipulation and functional implementation, five key design tasks were undertaken: (1) the development of risk information model, (2) the analysis of risk influence paths, (3) the design of risk visualization mechanism, (4) the construction of implementation architecture, and (5) the design of system prototype. These are described in detail below.
5.1. Risk Information Model
To support the integration of the three types of information sources, BIM, WBS, and eRBM, this study adopts a tabular data structure. This structured approach provides a clear and systematic basis for data-level integration, enabling efficient linkage and management across the datasets. The overall structure is illustrated in Figure 4.
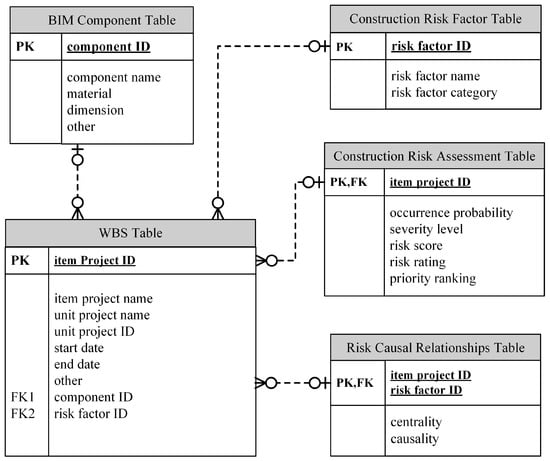
Figure 4.
Tabular data structure.
Initially a structured risk information model was designed, comprising five interrelated tables: the BIM component table, WBS table, construction risk factor table, construction risk assessment table and risk causal relations table. In the BIM component table, the component ID serves as the primary key, with additional attributes such as component name, material type, and dimensions, capturing the physical and functional properties of each model component. To ensure the uniqueness of each component, this study generates unique component IDs by combining type codes (e.g., “01” for support structures and “02” for pipelines) with serial numbers. For instance, “01-001” denotes the first support structure component.
The WBS table uses the item project ID as its primary key and includes information such as the item project name, unit project name, unit project ID, construction start and end dates. A hierarchical coding system is adopted to decomposition of construction tasks. The six unit projects, such as “foundation treatment and support”, “pump house construction”, and “inlet and outlet structures”, are assigned top-level numerical codes in the WBS. The 27 item projects are assigned second-level codes to reflect their relationship to the corresponding unit projects—for instance, “1.1” refers to the “ground trenching” task under the “foundation treatment and support” unit project. To facilitate data linkage, the WBS table also incorporates component ID and risk factor ID as foreign keys, connecting to the BIM component table and the construction risk factor table, respectively.
The construction risk factor table is structured around the risk factor ID as the primary key, with additional fields capturing the name and category of each risk factor. Following the 6M1E1S risk classification system, each individual risk factor is assigned a unique ID under its respective category. The ID coding follows the format “X-XX-XX”, where X represents the first letter of each major category in the 6M1E1S risk classification system. The middle XX indicates the category number within the 6M1E1S system, ranging from 01 to 08, corresponding to different categories (e.g., “Man” category is 01, “Machinery” category is 02, and so on). The final XX represents the specific risk factor number within that category, starting from 01, and sequentially identifies different risk factors within each category. For example, “M0101” refers to “unsafe operation or execution errors by construction workers resulting in quality or property loss” under the “Man” category.
The construction risk assessment table adopts the item project ID as its primary key and stores key risk evaluation metrics—such as risk occurrence probability, severity level, risk score, risk level, and risk priority ranking—evaluated specifically at the item project level.
Finally, the risk causal relationships table contains the centrality and causality values of the risk factors, which are linked to their respective item projects through the item project ID and risk factor ID.
This relational model enables seamless integration of construction, BIM, and risk data, providing a solid foundation for dynamic risk visualization and management.
5.2. Analysis of Risk Influence Paths Based on ISM
The authors’ previous study explored the causal relationships among risk factors at the item project level using the DEMATEL method. Building upon this foundation, this study further applies Interpretive Structural Modeling (ISM)—a methodology originally developed by John N. Warfield in 1973 to construct hierarchical models of interrelated factors in complex systems [48]—to analyze the influence paths of construction risks. Specifically, the direct influence matrix derived from DEMATEL is transformed into a binary adjacency matrix, which serves as the input for the ISM process. This transformation enables the identification and representation of direct relationships among risk factors. The ISM approach involves three main steps, as outlined below:
- (1)
- Establishing the overall influence matrix
The DEMATEL method evaluates the strength of relationships among risk factors in item project by constructing a direct influence matrix , as shown in Equation (1).
where represents the influence of factor on factor as assessed by the p-th expert. This matrix is normalized using Equations (2) and (3) to obtain the normalized direct influence matrix .
Then, the comprehensive influence matrix is obtained, as shown in Equation (4).
I in Equation (4) is the identity matrix.
- (2)
- Establishing the reachable matrix
Since the matrix T does not account for the self-influence of each factor, the identity matrix I is introduced and combined with T to derive the overall influence matrix, as shown in Equation (5).
The reachable matrix is derived through the overall influence matrix, as indicated in Equation (6) and (7).
In Equation (7), denotes the threshold value, which is typically determined by experienced experts based on the complexity of the system. Setting an appropriate threshold helps simplify the complex interrelationships among factors within the system, thereby facilitating a more reasonable hierarchical structure.
- (3)
- Establishing the hierarchical structural model
The set of factors influenced by the factor is referred to as the reachable set , while the set of factors that influence the factor is referred to as the antecedent set . In accordance with the reachable matrix, and are obtained using Equations (8) and (9). It is then checked whether the reachable set and the antecedent set satisfy Equation (10). Factors that satisfy Equation (10) are identified as the first-level factors of the system. The corresponding rows and columns are then removed from the reachability matrix. This process is repeated using Equations (8)–(10) until all factors are classified.
By removing factors layer by layer, the factors are finally divided into different hierarchies. Factors are iteratively removed and classified into hierarchical levels, with the reachable matrix used to determine the influencing paths among construction risk factors. For the Ground Trenching item project, the 25 construction risk factors are stratified into four hierarchical levels: root level, deep level, middle level, and shallow level, as shown in Figure 5. Root level factors act as primary drivers of systemic risk, significantly influencing other tiers, while shallow level factors are derivative in nature, predominantly affected by external forces. For example, the root level risk “E0701” directly affects the deep level risk “M0315”, and “M0403” impacts the middle-level risk “S0803”, ultimately influencing the shallow level risk “M0204”. With the reachable matrix, risk “E0701” can also impact risk “M0502” across levels. The same applies to the relationship between “M0403” and “M0103”. Moreover, substantial interdependencies exist among co-stratified factors within each hierarchical level. At the deep level, risks “M0315” and “M0403” can influence each other, while at the shallow level, “M0204” directly impacts “M0101”, which in turn affects “M0301” and “M0303”.
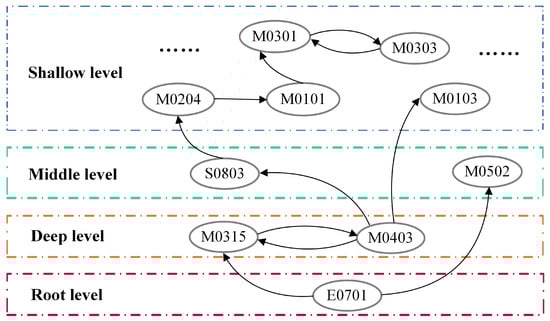
Figure 5.
Hierarchical structure diagram.
5.3. Risk Visualization Mechanism
Guided by the integration framework and the tabular data model, construction risk information for water pumping stations, including the enriched risk influence paths identified using the DEMATEL-ISM method, can be effectively linked to BIM components and visualized within the nD BIM environment. To accommodate different types of risk information, this study proposes three corresponding visualization approaches, as detailed below.
- (1)
- Visualization of Risk Factors
Construction risk factors are visualized through a hierarchical tree structure. In this structure, parent nodes represent risk categories, and child nodes display the corresponding risk factor IDs and descriptions. Using the data linkage mechanism (i.e., component ID → item project ID → risk factor ID), BIM components are associated with relevant risk factors, thus enabling risk factor visualization at the component level.
- (2)
- Visualization of Risk Levels
Construction risk levels are visualized through coded colors categorized based on risk assessment results. The risk levels are defined as shown in Table 1:

Table 1.
Definition and coded color of risk levels.
Using the bidirectional linkage between BIM and WBS, each item project’s risk level is mapped to the associated BIM components and visually distinguished by color. This enables intuitive understanding of the spatial distribution of construction risks.
Since the BIM model and WBS share unified construction schedule data, the dynamic evolution of risks can be simulated throughout the construction process. Importantly, item projects are not executed in strict chronological order, but rather in overlapping or parallel sequences. This leads to a temporal mix of risk levels across multiple ongoing tasks. To analyze this dynamic behavior, a frequency-based statistical method is used to count the occurrences of each risk level at different time points, as shown in Figure 5. The risk frequency is measured by the number of BIM components affected at each risk level. A composite risk score is then calculated to track trends over time. Assuming at time t, there are N item projects under construction, then the composite risk score F(t) can be expressed as follows:
where Ci denotes the component quantity of the i-th item project, Ri represents the risk score of the i-th item project. According to the predefined color-coding scheme, this allows for intuitive visualization of risk evolution within the BIM model, offering temporal (along the construction schedule) and spatial (among the physical components) insights to enhance fine-grained risk control during construction, shown in Figure 6.
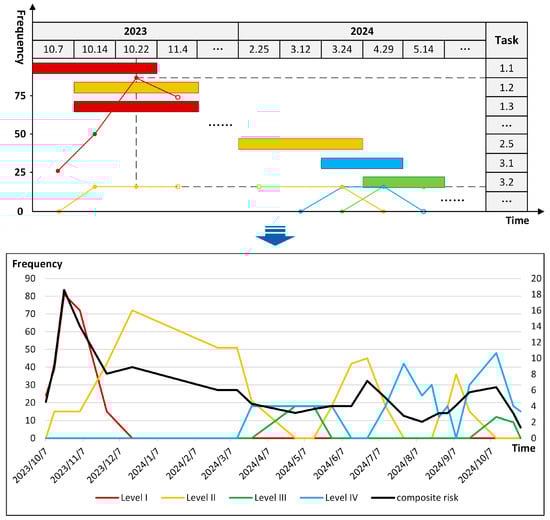
Figure 6.
Dynamic evolution of risks.
- (3)
- Visualization of Risk Influence Paths
After examining the causal relationships among risk factors via DEMATEL, the ISM method further analyzes the direct relationships and hierarchical classification of these factors. For visualization, a layered, directed graph structure is adopted, where risk factors are treated as nodes with three attributes (centrality, causality, and hierarchical level), with directed edges representing the influence pathways between them, as shown in Figure 7.
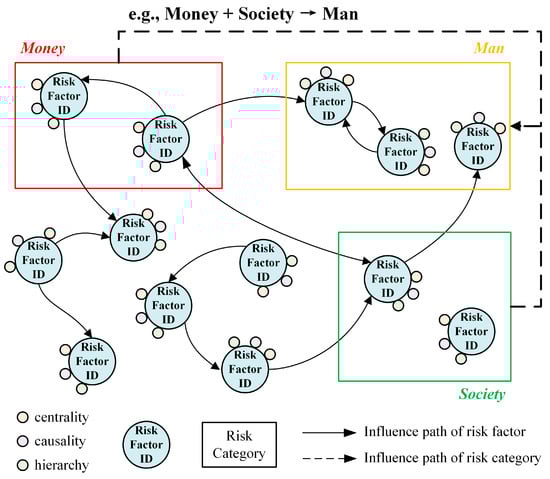
Figure 7.
Risk influence paths at both factor and category levels.
To visualize the influence pathways at a higher level, namely the influence pathways among the six risk categories, this study aggregates the risk factor influence pathways according to node attributes. At the category level, the reachable counting matrix is constructed by aggregating factor-level edges based on the categories of their source and target nodes:
Here, is defined as the category indicator matrix, which enables the aggregation of reachable paths from the factor level to the category level. Since the entries of represent the counts of reachable pairs, a binarization is applied to preserve the ISM semantics:
yielding the category-level directed reachable matrix . Then, the category-level reachability and antecedent sets are obtained using Formulas (8)–(10), from which the direct influence paths among categories are identified. The directed paths between these risk categories may exhibit overlap (merging) or self-referencing (deletion), necessitating categorization and cleaning to ensure clarity. These are then linked back to the detailed risk factors to visualize influence paths by category. For example, analysis may reveal that financial and social risks often co-occur and trigger behavioral risks, forming a chain like “Money + Society → Man”, as shown in the dash line of Figure 7. This path can also be traced to reveal the influence paths among the risk factors within these three categories. The graph-based visualization of risk interactions offers a clear view of key risks and their relationships across different construction stages, supporting data-driven strategies for refined risk control in water pumping station projects.
5.4. Implementation Architecture
This study employs BIM secondary development techniques to extend and integrate BIM functionalities through the use of Application Programming Interfaces (APIs) provided by mainstream BIM software such as Autodesk Revit, Autodesk Navisworks, Bentley, and Tekla. Among these, Autodesk Navisworks is selected as the core development platform for implementing the integrated risk visualization tool. In terms of data sources, Autodesk Revit is used to create the 3D BIM model of the water pumping station, while Microsoft Project stores the construction schedule data. These two datasets are imported and associated within Autodesk Navisworks 2021 to support 4D construction simulation. For risk-related data, Microsoft Excel is utilized to manage structured information on construction risk factors and risk assessment results. In addition, NetworkX 3.2, a Python-based library, is used to model and visualize the risk influence paths generated through the DEMATEL-ISM method. The Navisworks plug-in interface (UI) is developed in C# using the Microsoft .NET Framework and compiled in Microsoft Visual Studio 2021. It interacts with the external risk data sources though the Navisworks API to deliver key functionalities, including BIM–risk data linkage, dynamic spatiotemporal visualization of construction risks, and interactive exploration of risk influence paths. The tool is expected to allow users to interactively explore BIM models, access related risk information, including structured data on risk factors, risk levels, and causal relationships, and perform intuitive risk-informed decision-making within the 4D BIM environment. The overall development framework is illustrated in Figure 8.
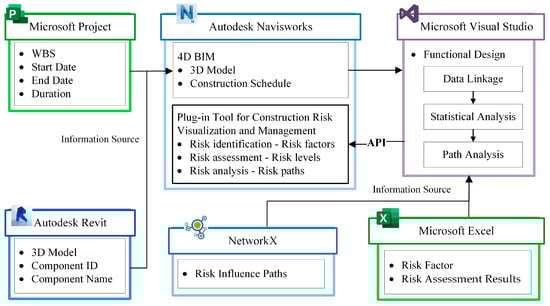
Figure 8.
Development framework.
5.5. System Prototype
Figure 9 illustrates the user interface of the system prototype developed in this study. The system is composed of four core functional modules: Construction Risk Management, Construction Risk Visualization, Model Data Center, and Document Management, each designed to support different aspects of construction risk information integration and visualization for water pumping station projects.
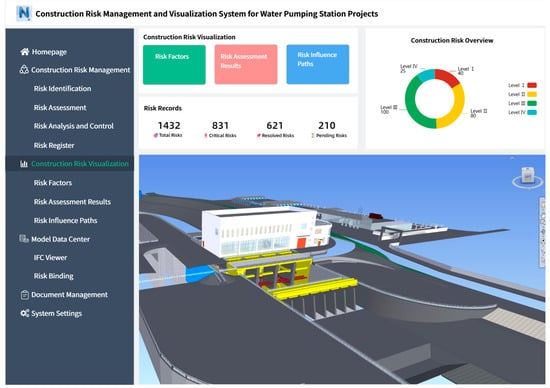
Figure 9.
Proposed construction risk management and visualization system for water pumping station projects.
The Construction Risk Management module supports a comprehensive risk management lifecycle, encompassing risk identification, assessment, and causal analysis. The process begins by identifying potential risk factors for each construction unit—corresponding to each item project in this study—guided by a dynamically updated risk register. Once risk factors are identified, each item project is evaluated based on the general likelihood of risk occurrence and the severity of its potential consequences, resulting in calculated risk scores and corresponding risk levels. An integrated DEMATEL–ISM algorithm supports further analysis by modeling the interdependencies and influence paths among risk factors. The module also functions as both a repository for historical risk data and a platform for case-by-case updates, supporting continuous refinement and expansion. Additionally, it prepares structured risk data for seamless integration with the Construction Risk Visualization module, enabling dynamic and informed risk representation in the BIM environment.
As the core of the prototype system, the Construction Risk Visualization module enables the dynamic analysis and visualization of construction risk information within a 4D BIM environment. Built on the Autodesk Navisworks platform, it supports interactive exploration of BIM models while visualizing associated risk data, including risk factors, risk levels, causal relationships, and further influence paths. Through this module, users are empowered to conduct intuitive, visually supported, and data-informed risk assessments and decision-making processes directly within the spatial temporal context of the project.
The Model Data Center and Document Management modules underscore the importance of IFC-based interoperability for nD BIM integration and multi-source data management. The Model Data Center serves as a central hub for managing BIM model data, while the Document Management module handles construction documents, standards, and related files. Although these components lie outside the primary scope of this study, they form an essential part of the system architecture. Future research will further explore their mechanisms and integration strategies for enhanced data interoperability and lifecycle management.
6. Application Case Illustration
This study uses a water pumping station project as a case to validate the proposed integration framework and analyze the applicability of the visualization tool in construction risk management. The project mainly involves constructing a new drainage pumping station and traffic bridge on the southeast side of the existing sluice gate. It also includes embankment construction along the upstream and downstream diversion channels and the inner and outer rivers, aiming to enhance drainage capacity and the connectivity of water conservancy infrastructure. Figure 10 presents the case project BIM model created in Autodesk Revit. The complete 3D model covers key structures such as the inlet, pump house, pipelines, valves, and electrical equipment. To facilitate the integration, the 3D model was directly imported into Autodesk Navisworks for further decomposition and scheduling. According to the previously defined WBS for water pumping station project, the model components were organized into selection sets corresponding to the item project level. With the help of the Timeliner tool, the construction schedule was imported and attached to the corresponding selection sets in the 3D model. The total planned duration of the project is 18 months, with the ground trenching phase taking the longest and thus becoming a key focus of risk monitoring. Accordingly, this study first collected risk data related to ground trenching project. The identified risk factors, assessment results, and their centrality and causality attributes were stored in tabular form, enabling real-time interaction and visualization through the API linked with the Navisworks plugin, where NetworkX was applied for graph-based analysis and representation.
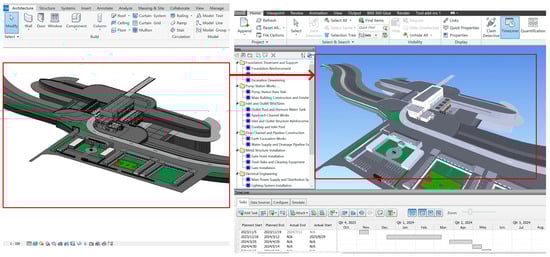
Figure 10.
BIM for water pumping station project.
In Navisworks, the prototype tool includes three modules for risk visualization and management. During the identification of risk factors, the tool allows users to select unit projects and item projects, enabling the associated components to be linked and highlighted. In the “ground trenching” task, a total of 25 risk factors are involved, covering eight categories including human, machinery, and materials. Most risks are concentrated in the categories of human, machinery, and method, and these risk factors are displayed in the UI in the form of an RBS, as shown in Figure 11a.
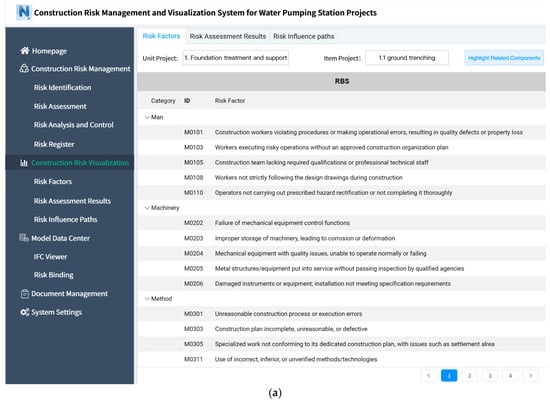
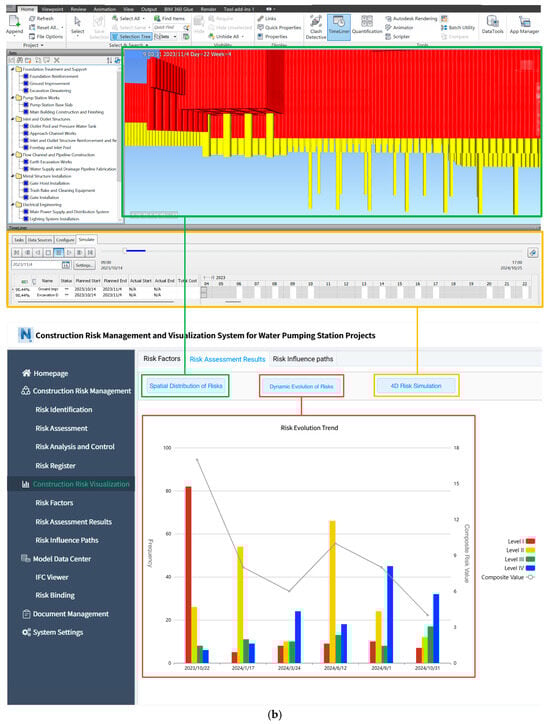
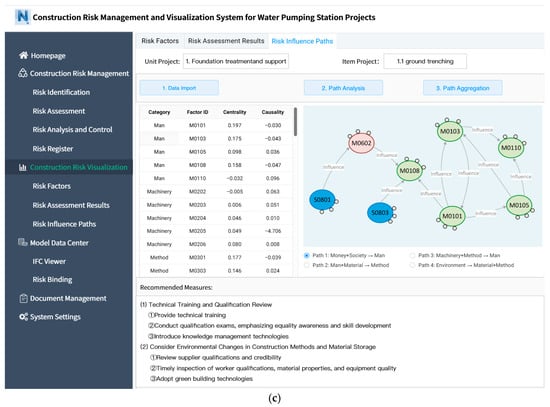
Figure 11.
Risk information details for ground trenching project. (a) Structure of risk factors; (b) Risk assessment results; (c) Risk influence paths.
For risk assessment results, the prototype tool offers “spatial risk distribution”, “dynamic risk evolution”, and “4D construction simulation” functions to visualize construction risk levels over time and space. According to the predefined color-coding rules, BIM components are automatically colored based on their construction risk levels to present the spatial distribution of risks. At the same time, by counting the number of component types affected by different risk levels at each time node and calculating the overall risk score, the evolution trend of construction risks can be derived, as shown in Figure 11b. It can be observed that high-risk construction activities are mainly concentrated in the early phase of the project, particularly during the foundation treatment and support stage. This is because foundation treatment involves complex soil conditions, groundwater control, and the stability of support structures—all of which are difficult to predict and are directly related to the safety of the project’s foundation. Additionally, construction of flow channels and pipelines is closely tied to the functional performance and safety of subsequent structures, and therefore also bears higher risk. In contrast, the construction procedures in the metal structure installation and electrical works stages are relatively mature, with more controllable environments. Construction personnel can follow standardized processes, significantly reducing uncertainty and potential risks in the later stages of the project. Thanks to Navisworks’ unique construction simulation capabilities, the “4D Risk Simulation” function in the prototype tool can trigger Timeliner to simulate the distribution and evolution of construction risks throughout the entire project process, as illustrated in Figure 11b.
To further visualize the interaction mechanisms among construction risks, the plug-in tool gradually presents the analysis process of risk influence paths and corresponding control measures. As illustrated in Figure 11c, based on the 25 risk factor nodes and their attributes such as centrality and causality, path analysis can be conducted to determine the influence hierarchy and interdependencies among risk factors. Through path aggregation, four cross-category risk influence paths are inferred: (1) “Money + Society → Man”, (2) “Man + Material → Method”, (3) “Environment → Material + Method”, (4) “Machinery + Method + Measurement → Man”. These findings offer important reference points for proposing targeted recommendations for this item project. For Path 1, financial risks—such as wage disputes or contract conflicts—can directly impact worker behavior, while social risks are often closely tied to stakeholder interests and can exert negative effects on the construction process. In response, the application of knowledge management technologies can help mitigate the impact of contractual disputes. An effective social risk mitigation system should include fair compensation mechanisms, skilled information processing and communication strategies, and a comprehensive emergency management framework for social-related issues.
7. Discussion
During the construction planning stage of an item project, the developed BIM–WBS–eRBM plugin tool was applied. The results demonstrate that the proposed framework can effectively identify, assess, and visualize construction risks. Compared with traditional tabular or text-based reports, the BIM-based approach enhanced risk perception by providing clear spatial and temporal representations, enabling stakeholders to better understand the distribution and evolution of risks across item projects. More importantly, site managers consistently evaluated the system as highly usable. They noted that the separation of visualization modes, covering risk factors, risk levels, and influence paths, allowed them to quickly locate priority risks and trace their potential propagation. This intuitive representation not only reduced the cognitive burden of interpreting large volumes of abstract data but also supported more efficient decision-making in construction planning and monitoring. Nevertheless, feedback indicated that further improvements are needed in enhancing risk communication and intelligent risk management.
To enhance the sharing of risk information in construction projects, future research will leverage Industry Foundation Classes (IFCs) to provide an open solution for the deep integration of multi-source heterogeneous data. Moreover, the system will integrate a semi-automated risk analysis module, which will calculate risks based on input values for the probability and severity of risks. Project managers will also be able to set up an automatic attachment mechanism for risk information, achieving seamless integration of risk data with the BIM model. This function will be implemented in the “Construction Risk Management” module, as shown in Figure 9. Nevertheless, the framework and proposed system in this study are primarily targeted at the early stages of water pumping station construction and are somewhat dependent on historical experience. To improve the intelligence of risk management, future research could incorporate technologies such as the Internet of Things (IoT) and cloud computing for real-time risk prediction, as well as deploy cloud databases for reporting project progress and risks through online communication. From an organizational perspective, the proposed approach may face challenges such as the substantial cost of personnel training and the expected resistance to adopting new methods in construction practice. These issues must be addressed in future implementation.
8. Conclusions
Effective risk management is a critical component of construction projects, and the application of BIM technology shows great potential for practical risk control. To this end, this study proposed an approach that integrates BIM information with risk data and developed a system tool for risk visualization and management on the BIM platform. Specifically, the WBS of pumping station construction serves as a structured bridge to link risk information with the BIM model. By applying BIM secondary development techniques, construction risk data were embedded into the BIM environment, enabling visual risk management in Navisworks. The implementation results demonstrate that, compared with traditional text-based reports, the visualization interface allows site managers to more quickly identify high-priority risks and understand their influence paths, thereby reducing the cognitive burden of interpreting complex data.
Given the current challenges in risk information sharing and tool intelligence, future research will consider leveraging the IFC standard to facilitate the deep integration of multi-source heterogeneous data and exploring automated data integration mechanisms. At the same time, the incorporation of IOT and cloud computing technologies will enrich data sources and analytical capacity, enabling real-time prediction and dynamic management of construction risks. Although the study focused on construction risks in water pumping station projects, the proposed data integration method and visualization tool have the potential to be adapted and validated in other types of construction projects.
Author Contributions
Y.X. and M.L. are equally contributed. Conceptualization, Y.X., M.L. and G.L.; methodology, Y.X., C.L. and X.X.; software, Y.X., C.L. and Z.G.; investigation, G.H. and Q.L.; resources, C.L. and G.L.; writing—original draft preparation, Y.X., X.Z. and M.L.; writing—review and editing, X.Z. and M.L.; visualization, G.H.; supervision, X.X. and X.Z.; funding acquisition, X.X. All authors have read and agreed to the published version of the manuscript.
Funding
This research was funded by the National Natural Science Foundation of China (grant number 72401090) and Suzhou Water Conservancy and Water Services Technology Project (2023010).
Data Availability Statement
All data used for the analysis are available from the corresponding author on request.
Acknowledgments
The funders are gratefully acknowledged. We would like to thank the editor and reviewers for their valuable suggestions and detailed feedback, which have significantly improved the quality of this paper.
Conflicts of Interest
Author Meiru Li, Cong Li and Gang Lai were employed by the company POWERCHINA Chengdu Engineering Corporation Limited. The remaining authors declare that the research was conducted in the absence of any commercial or financial relationships that could be construed as a potential conflict of interest.
References
- Zhang, J.; Yu, Y.; Yan, J.; Chen, J. Data-Driven Parameter Prediction of Water Pumping Station. Water 2023, 15, 1128. [Google Scholar] [CrossRef]
- Cui, P.; Qin, Y. Introducing Methods for Analyzing and Detecting Concrete Cracks at the No. 3 Huaiyin Pumping Station in the South-to-North Water Diversion Project in China. Buildings 2024, 14, 2431. [Google Scholar] [CrossRef]
- Zou, Y.; Kiviniemi, A.; Jones, S.W.; Walsh, J. Risk Information Management for Bridges by Integrating Risk Breakdown Structure into 3D/4D BIM. KSCE J. Civ. Eng. 2019, 23, 467–480. [Google Scholar] [CrossRef]
- Kang, L.S.; Kim, S.-K.; Moon, H.S.; Kim, H.S. Development of a 4D Object-Based System for Visualizing the Risk Information of Construction Projects. Autom. Constr. 2013, 31, 186–203. [Google Scholar] [CrossRef]
- Yasser, M.; Rashid, I.A.; Nagy, A.M.; Elbehairy, H.S. Integrated Model for BIM and Risk Data in Construction Projects. Eng. Res. Express 2023, 4, 045044. [Google Scholar] [CrossRef]
- Vrouwenvelder, T.; Lovegrove, R.; Holicky, M.; Canisius, G.; Tanner, P. Risk Assessment and Risk Communication in Civil Engineering; CIB Report; CIB General Secretariat: Ottawa, ON, Canada, 2001; Available online: https://tinyurl.com/y2ad6e3r (accessed on 1 January 2021).
- Sousa, V.; De Almeida, N.M.; Dias, L.A. Risk Management Framework for the Construction Industry According to the ISO 31000:2009 Standard. J. Risk Anal. Crisis Response 2012, 2, 261. [Google Scholar] [CrossRef]
- Al-Bahar, J.F.; Crandall, K.C. Systematic Risk Management Approach for Construction Projects. J. Constr. Eng. Manag. 1990, 116, 533–546. [Google Scholar] [CrossRef]
- Siraj, N.B.; Fayek, A.R. Risk Identification and Common Risks in Construction: Literature Review and Content Analysis. J. Constr. Eng. Manag. 2019, 145, 03119004. [Google Scholar] [CrossRef]
- Gao, N.; Touran, A.; Wang, Q.; Beauchamp, N. Construction Risk Identification Using a Multi-Sentence Context-Aware Method. Autom. Constr. 2024, 164, 105466. [Google Scholar] [CrossRef]
- Chen, W.; Deng, J.; Niu, L. Identification of Core Risk Factors and Risk Diffusion Effect of Urban Underground Engineering in China: A Social Network Analysis. Saf. Sci. 2022, 147, 105591. [Google Scholar] [CrossRef]
- Tixier, A.J.-P.; Hallowell, M.R.; Rajagopalan, B.; Bowman, D. Construction Safety Clash Detection: Identifying Safety Incompatibilities among Fundamental Attributes Using Data Mining. Autom. Constr. 2017, 74, 39–54. [Google Scholar] [CrossRef]
- Hou, X.; Li, C.; Fang, Q. Computer Vision-Based Safety Risk Computing and Visualization on Construction Sites. Autom. Constr. 2023, 156, 105129. [Google Scholar] [CrossRef]
- Wang, L.; Liu, X.; Liu, Y.; Li, H.; Liu, J.; Yang, L. Multimodal Knowledge Risk assessment of construction projects Graph Construction for Risk Identification in Water Diversion Projects. J. Hydrol. 2024, 635, 131155. [Google Scholar] [CrossRef]
- Xing, X.; Zhong, B.; Luo, H.; Li, H.; Wu, H. Ontology for Safety Risk Identification in Metro Construction. Comput. Ind. 2019, 109, 14–30. [Google Scholar] [CrossRef]
- Zavadskas, E.K.; Turskis, Z.; Tamošaitiene, J. Risk Assessment of Construction Projects. J. Civ. Eng. Manag. 2010, 16, 33–46. [Google Scholar] [CrossRef]
- Aven, T.; Vinnem, J.E.; Wiencke, H.S. A Decision Framework for Risk Management, with Application to the Offshore Oil and Gas Industry. Reliab. Eng. Syst. Saf. 2007, 92, 433–448. [Google Scholar] [CrossRef]
- Dikmen, I.; Birgonul, M.T.; Han, S. Using Fuzzy Risk Assessment to Rate Cost Overrun Risk in International Construction Projects. Int. J. Proj. Manag. 2007, 25, 494–505. [Google Scholar] [CrossRef]
- Yazdani, M.; Abdi, M.R.; Kumar, N.; Keshavarz-Ghorabaee, M.; Chan, F.T.S. Improved Decision Model for Evaluating Risks in Construction Projects. J. Constr. Eng. Manag. 2019, 145, 04019024. [Google Scholar] [CrossRef]
- Lin, S.-S.; Zhou, A.; Shen, S.-L. Multi-Status Bayesian Network for Analyzing Collapse Risk of Excavation Construction. Autom. Constr. 2024, 158, 105193. [Google Scholar] [CrossRef]
- Hua, Y.; He, J.; Gong, J.; Zhao, J. Hazardous Area Risk-Based Evacuation Simulation and Analysis of Building Construction Sites. J. Constr. Eng. Manag. 2020, 146, 04020047. [Google Scholar] [CrossRef]
- Wu, W.; Lin, Y.; Geng, S.; Lu, H.; Yao, J. Multistate Probabilistic Assessment of Third-Party Damage Risk for Oil and Gas Pipelines Based on DEMATEL-ISM-Røed-BN. J. Perform. Constr. Facil. 2024, 38, 04024020. [Google Scholar] [CrossRef]
- Elbashbishy, T.S.; Hosny, O.A.; Waly, A.F.; Dorra, E.M. Assessing the Impact of Construction Risks on Cost Overruns: A Risk Path Simulation–Driven Approach. J. Manag. Eng. 2022, 38, 04022058. [Google Scholar] [CrossRef]
- Xiang, P.; Yang, Y.; Yan, K.; Jin, L. Identification of Key Safety Risk Factors and Coupling Paths in Mega Construction Projects. J. Manag. Eng. 2024, 40, 04024023. [Google Scholar] [CrossRef]
- Bai, L.; Xie, Q.; Lin, J.; Liu, S.; Wang, C.; Wang, L. Dynamic Selection of Risk Response Strategies with Resource Allocation for Construction Project Portfolios. Comput. Ind. Eng. 2024, 191, 110116. [Google Scholar] [CrossRef]
- Chen, Y.; Zhu, L.; Hu, Z.; Chen, S.; Zheng, X. Risk Propagation in Multilayer Heterogeneous Network of Coupled System of Large Engineering Project. J. Manag. Eng. 2022, 38, 04022003. [Google Scholar] [CrossRef]
- Guo, D.; Song, Z.; Xu, T.; Zhang, Y.; Ding, L. Coupling Analysis of Tunnel Construction Risk in Complex Geology and Construction Factors. J. Constr. Eng. Manag. 2022, 148, 04022097. [Google Scholar] [CrossRef]
- Alirezaei, S.; Taghaddos, H.; Ghorab, K.; Tak, A.N.; Alirezaei, S. BIM-Augmented Reality Integrated Approach to Risk Management. Autom. Constr. 2022, 141, 104458. [Google Scholar] [CrossRef]
- Zou, Y.; Kiviniemi, A.; Jones, S.W. Developing a Tailored RBS Linking to BIM for Risk Management of Bridge Projects. Eng. Constr. Archit. Manag. 2016, 23, 727–750. [Google Scholar] [CrossRef]
- Collinge, W.H.; Farghaly, K.; Mosleh, M.H.; Manu, P.; Cheung, C.M.; Osorio-Sandoval, C.A. BIM-Based Construction Safety Risk Library. Autom. Constr. 2022, 141, 104391. [Google Scholar] [CrossRef]
- Moshtaghian, F.; Golabchi, M.; Noorzai, E. A Framework to Dynamic Identification of Project Risks. Smart Sustain. Built Environ. 2020, 9, 375–393. [Google Scholar] [CrossRef]
- Philipp, N.H. Building Information Modeling (BIM) and the Consultant: Managing Roles and Risk in an Evolving Design and Construction Process. Proc. Meet. Acoust. 2013, 19, 015095. [Google Scholar] [CrossRef]
- Zhang, S.; Teizer, J.; Lee, J.-K.; Eastman, C.M.; Venugopal, M. Building Information Modeling (BIM) and Safety: Automatic Safety Checking of Construction Models and Schedules. Autom. Constr. 2013, 29, 183–195. [Google Scholar] [CrossRef]
- Ding, L.Y.; Zhong, B.T.; Wu, S.; Luo, H.B. Construction Risk Knowledge Management in BIM Using Ontology and Semantic Web Technology. Saf. Sci. 2016, 87, 202–213. [Google Scholar] [CrossRef]
- Wu, J.; Zhou, Z.; Wang, H.; Chen, B.; Wang, J. A Comparative Study for Evaluating the Groundwater Inflow and Drainage Effect of Jinzhai Pumped Storage Power Station, China. Appl. Sci. 2024, 14, 9123. [Google Scholar] [CrossRef]
- Yuan, M.; Zhu, X.; Han, L.; Qi, Y.; Xie, Z.; Qin, X.; Dong, Y. Research on the Full Life Cycle Deformation, Stress Response, and Dynamic Fatigue Performance of Concrete Structures in Pump Stations. Buildings 2024, 14, 4052. [Google Scholar] [CrossRef]
- Chen, C.; Huang, S.; Yin, Y.; Tang, Z.; Shuai, Q. Enhancing Pumped Hydro Storage Regulation Through Adaptive Initial Reservoir Capacity in Multistage Stochastic Coordinated Planning. Energies 2025, 18, 2707. [Google Scholar] [CrossRef]
- Fu, X.; Ji, K.; Zhang, Y.; Xie, Q.; Huang, J. Intelligent Optimization Method for Rebar Cutting in Pump Stations Based on Genetic Algorithm and BIM. Buildings 2025, 15, 1790. [Google Scholar] [CrossRef]
- Harrison, J.; Chanslor, K.; Rhames, A.; Woodruff, R.; Nutt, L.; Ringgold, W. Challenges Associated with the Construction of 40 Miles of Regional Water Transmission Pipeline and the Associated Pump Station Facility. In Pipelines 2019, Nashville, TN, USA, 21–24 July 2019; American Society of Civil Engineers: Nashville, TN, USA, 2019; pp. 435–444. [Google Scholar]
- Liu, H.; Al-Hussein, M.; Lu, M. BIM-Based Integrated Approach for Detailed Construction Scheduling under Resource Constraints. Autom. Constr. 2015, 53, 29–43. [Google Scholar] [CrossRef]
- Azhar, S.; Khalfan, M.; Maqsood, T. Building Information Modelling (BIM): Now and Beyond. Constr. Econ. Build. 2015, 12, 15–28. [Google Scholar] [CrossRef]
- Park, J.; Cai, H. WBS-Based Dynamic Multi-Dimensional BIM Database for Total Construction as-Built Documentation. Autom. Constr. 2017, 77, 15–23. [Google Scholar] [CrossRef]
- GB50501; Pricing Specification for Water Conservancy Engineering Quantity List. China Planning Press: Beijing, China, 2007.
- SL734-2016; Technical Regulations for Quality Testing of Water Conservancy Projects. China Water Power Press: Beijing, China, 2016.
- GBT 51033; Construction and Acceptance Specifications for Water Conservancy Pump Stations. China Planning Press: Beijing, China, 2024.
- Guo, Z.; Xu, X.; Gao, X.; Xu, Y.; Liu, J.; Zhang, M.; Li, F. Enhanced Risk-Based Quality Control for Hydraulic Engineering Construction Projects Considering the Risk-Influencing Mechanism. J. Constr. Eng. Manag. 2025, 151, 04024204. [Google Scholar] [CrossRef]
- Jeong, J.; Jeong, J. Novel Approach of the Integrated Work & Risk Breakdown Structure for Identifying the Hierarchy of Fatal Incident in Construction Industry. J. Build. Eng. 2021, 41, 102406. [Google Scholar] [CrossRef]
- Huo, T.; Cong, X.; Cheng, C.; Cai, W.; Zuo, J. What Is the Driving Mechanism for the Carbon Emissions in the Building Sector? An Integrated DEMATEL-ISM Model. Energy 2023, 274, 127399. [Google Scholar] [CrossRef]
Disclaimer/Publisher’s Note: The statements, opinions and data contained in all publications are solely those of the individual author(s) and contributor(s) and not of MDPI and/or the editor(s). MDPI and/or the editor(s) disclaim responsibility for any injury to people or property resulting from any ideas, methods, instructions or products referred to in the content. |
© 2025 by the authors. Licensee MDPI, Basel, Switzerland. This article is an open access article distributed under the terms and conditions of the Creative Commons Attribution (CC BY) license (https://creativecommons.org/licenses/by/4.0/).