Article

Study on Chloride Diffusion Performance and Structural Durability Design of UHPC Under Chloride Salt Erosion

School of Highway, Chang’an University, Xi’an 710064, China
*
Author to whom correspondence should be addressed.
These authors contributed equally to this work.
Buildings 2025, 15(19), 3569; https://doi.org/10.3390/buildings15193569
Submission received: 6 August 2025 / Revised: 21 September 2025 / Accepted: 24 September 2025 / Published: 3 October 2025
(This article belongs to the Section Building Structures)

Abstract

Normal concrete exhibits poor resistance to chloride penetration, often leading to reinforcement corrosion and premature structural failure. In contrast, ultra-high-performance concrete (UHPC) demonstrates superior resistance to corrosion caused by chloride salts. The chloride diffusion behaviour of UHPC was investigated via long-term immersion (LTI) and rapid chloride migration (RCM) tests. Additionally, this study presents the first development of a time-dependent diffusion model for UHPC under chloride corrosion, as well as the proposal of a performance-based design method for calculating the protective layer thickness. Results show that the incorporation of steel fibers reduced the chloride diffusion coefficient ( D ) by 37.9%. The free chloride content (FCC) in UHPC increased by 92.0% at 2 mm after 300 d of the action of LTI. D decreased by up to 91.0%, whereas the surface chloride concentration ( C s ) increased by up to 92.5% under the action of LTI. The time-dependent models of D and C s followed power and logarithmic functions, respectively. An increase in UHPC surface temperature, relative humidity, and tensile stress ratio significantly diminishes the chloride resistance of UHPC. The minimum UHPC protective layer thicknesses required for UHPC-HPC composite beams with design service lives of 100 years, 150 years, and 200 years are 30 mm, 37 mm, and 43 mm, respectively.

1. Introduction

Reinforced concrete (RC) structures are subjected to various factors, such as loads and chloride-induced erosion during service time [1,2]. These factors lead to durability-related issues, such as steel corrosion, structural cracking, and concrete deterioration, thereby shortening the actual service life of RC structures [3,4].
Chloride in concrete primarily migrates into its interior through diffusion, binding, capillary action, permeation [5,6], and electro-migration [7]. The long-term immersion (LTI) test is one of the main methods for evaluating the chloride diffusion performance of concrete. LTI is similar to actual environmental conditions and easy to operate, with the main migration mechanism being diffusion. Extensive research has been conducted on chloride diffusion models for normal concrete (NC). Under LTI, researchers have modified the chloride diffusion model based on Fick’s second law [8,9,10] by introducing factors, such as water-to-cement ratio (w/c) [11], temperature [12], loading [13], and mineral admixtures [14], thereby making these models highly in line with chloride diffusion in natural environments. The chloride diffusion coefficient ( D ) and surface chloride concentration ( C s ) serve as essential indicators for characterizing chloride transport and impermeability in concrete. Song et al. [15,16,17,18] studied the effects of w/c, mineral admixtures, and other factors on D and C s , and pointed out that D and C s are time-dependent parameters. Liao et al. [19] measured the free chloride concentration (CC) at different exposure durations and diffusion depths, and proposed a time-dependent model for D and C s . Wang et al. [20] established a time-dependent model of D and C s , considering their time-dependent behaviour. These studies have further refined the chloride diffusion theory for chloride-induced corrosion in NC and provided a theoretical reference for the durability research of concrete. However, the above studies all focused on the time-dependent models for D and C s of NC under chloride erosion. In contrast, the time-dependent models for D and C s of UHPC under chloride erosion has not been reported. Therefore, it is particularly important to investigate the durability of UHPC by further revealing the time-dependent model of D and C s of UHPC under chloride erosion.
Ultra-high-performance concrete (UHPC) exhibits superior durability properties compared with NC and high-performance concrete (HPC) due to the combination of advanced fiber and binder material technologies [21,22]. The D of UHPC is at least one order of magnitude lower than that of NC [23]. Roux et al. [24] found that the D of C30 and UHPC is 1.1 × 10⁻¹³ m2/s and 2 × 10⁻¹⁴ m2/s, respectively. Dobias et al. [25] reported that the D of UHPC is less than 1.4 × 10⁻¹³ m2/s, which is consistent with the findings of Voo [26]. However, research on the chloride diffusion theory in UHPC is limited. Yang et al. [27,28] discovered that lowering the w/c can effectively reduce the D of UHPC and enhance its durability against chloride salt attack. Abbas et al. [29] found that the ability of UHPC to resist chloride penetration was improved after incorporating different volumes of steel fibers into the mixture. Algaifi et al. [30] discovered that the porosity of the concrete matrix increases, owing to steel fiber corrosion, resulting in accelerated chloride penetration.
Although the aforementioned studies provided valuable insights into the chloride diffusion performance of UHPC, most focus on the effects of factors such as reducing the w/c and steel fiber corrosion on the chloride diffusion properties of UHPC [31]. However, the variation laws of the two key indicators for evaluating the durability of UHPC have not been revealed. Furthermore, existing research methods for evaluating the chloride diffusion performance of UHPC remain inconsistent. Currently, the primary research approaches for UHPC durability can be categorized into two main types: experimental tests (e.g., chloride ion erosion tests, freeze–thaw tests, carbonation tests, etc.) and numerical simulation. Among the experimental methods, chloride erosion test methods include a rapid chloride migration (RCM) method [32], natural immersion method [33], salt spray method [34], dry–wet cycle method [35], etc. Pyo et al. [33] immersed UHPC specimens in a 10.0% NaCl solution for 1 year. Abbas et al. [29] immersed UHPC specimens in 3.5% and 10.0% NaCl solutions for 90 and 180 d. Niu et al. [36] conducted 15, 30, 60, and 100 d wet–dry cycle tests on the UHPC specimens. While existing experiments have studied the chloride diffusion performance of UHPC, they face critical limitations: significant differences between salt concentrations and in situ environmental conditions (e.g., temperature, relative humidity, tensile stress ratio, and other influencing factors), compounded by relatively short durations, which fail to accurately simulate the chloride diffusion characteristics of UHPC under chloride salt erosion.
UHPC-NC composite beams can enhance the structural durability of beams by using UHPC in crack-prone or corrosion-susceptible zones. However, in harsh environments, the porous nature of NC in the compression zone facilitates chloride penetration, thereby accelerating steel bar corrosion. In contrast, HPC exhibits excellent durability, making it an ideal substitute for NC. The incorporation of mineral admixtures and water reducers into HPC results in a denser internal structure, retarding the penetration and diffusion of harmful ions. Compared with NC, the D of HPC is reduced by approximately two orders of magnitude [37]. The resulting UHPC-HPC composite beams can reduce long-term maintenance costs and extend the structural service life. In addition, the durability design for UHPC structures has not yet been reported in existing studies.
In this paper, using the LTI erosion mode, the chloride diffusion performance of UHPC under different erosion durations was studied, and the influence of steel fibers on the D of UHPC was investigated through RCM tests. Meanwhile, time-dependent models for D and C s under LTI were established based on the experimental data. COMSOL Multiphysics 6.0 was used to simulate the chloride diffusion behaviour in UHPC under three different variables: temperature, relative humidity, and loading. Finally, a durability design method for UHPC structures was proposed, and the required thickness of the protective layer for UHPC under different service lives was determined.

2. Experimental Program

2.1. Overview of the Specimens

This experiment involved a total of 25 UHPC cube specimens and six cylindrical specimens. The dimensions of the UHPC specimens for the action of LTI were 100 × 100 × 100 mm. Meanwhile, the specimens for the RCM test had a diameter of 100 mm and a height of 50 mm. The specific dimensions of the specimens used in different erosion experiments are shown in Figure 1a,b.
The main components of UHPC include premix, water reducer, water, and steel fibers, all of which were provided by Jiangsu Sobute New Materials Co., Ltd., located in Jiangning District, Nanjing, China. The mixing ratio of UHPC is shown in Table 1, where premix denotes a material that can be used directly by pre-mixing. The steel fibers are straight with a circular cross-section, measuring 13 mm in length and 0.2 mm in diameter, and the copper plating on their surface enhances their corrosion resistance.

2.2. Test Parameters

The RCM tests on UHPC and chloride diffusion tests on the UHPC specimens under different erosion durations were conducted in this experiment. The specific test parameters are shown in Table 2, where UHPCSF0 refers to the UHPC without steel fibers, and UHPCSF2 represents the UHPC with 2% steel fibers (referred to as UHPC).

2.3. Test Procedure

(1)
LTI
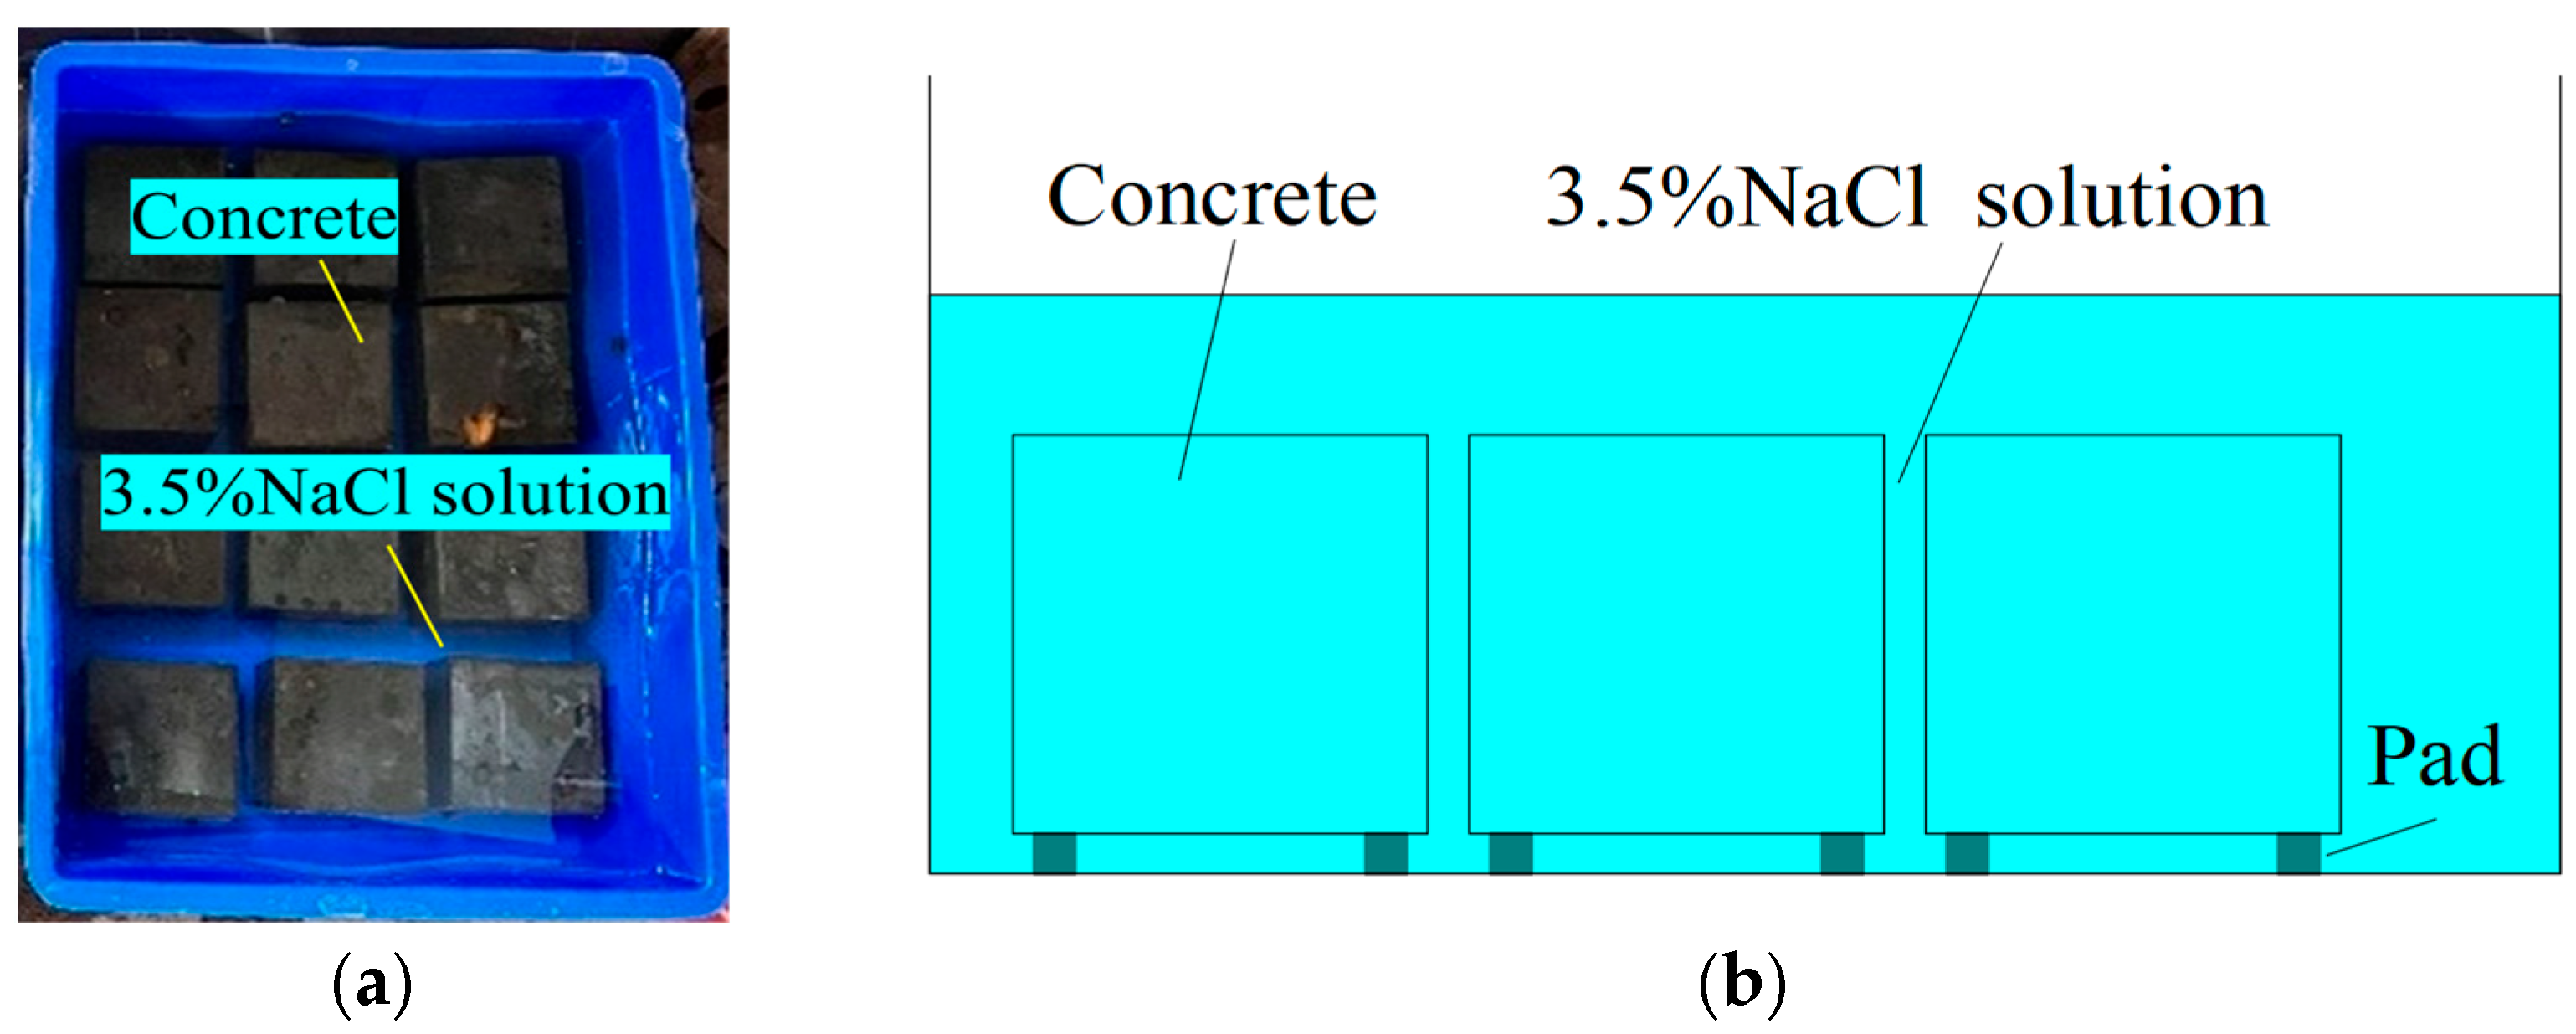
Five surfaces of the specimens were sealed with epoxy resin to achieve one-dimensional (1D) chloride diffusion behaviour. A 10 mm high cubic spacer was placed at the bottom of the container to separate the specimen from the container itself, thereby ensuring uniform solution concentration and free permeation of chloride. Once the epoxy resin had cured, the specimens were immersed in a rectangular container filled with chloride solution for LTI testing. In the LTI test, a 3.5% NaCl solution was used, whose concentration is close to that of seawater, to simulate the actual service environment of a concrete structure [38]. During the corrosion process of the specimen, the solution concentration was measured using an ion concentration meter every 5 d to maintain the stability of the chloride ion concentration in the solution. If the concentration is too high, deionized water is added slowly to the solution while gently stirring, with real-time monitoring via the ion concentration meter until the concentration drops to the set value; if the concentration is too low, the pre-prepared chloride ion solution is supplemented, adjusting via gradual addition and real-time monitoring. Notably, the direct addition of solid NaCl to the solution is prohibited. Five specimens were used for each erosion time (see Figure 2).
(2)
RCM experiment
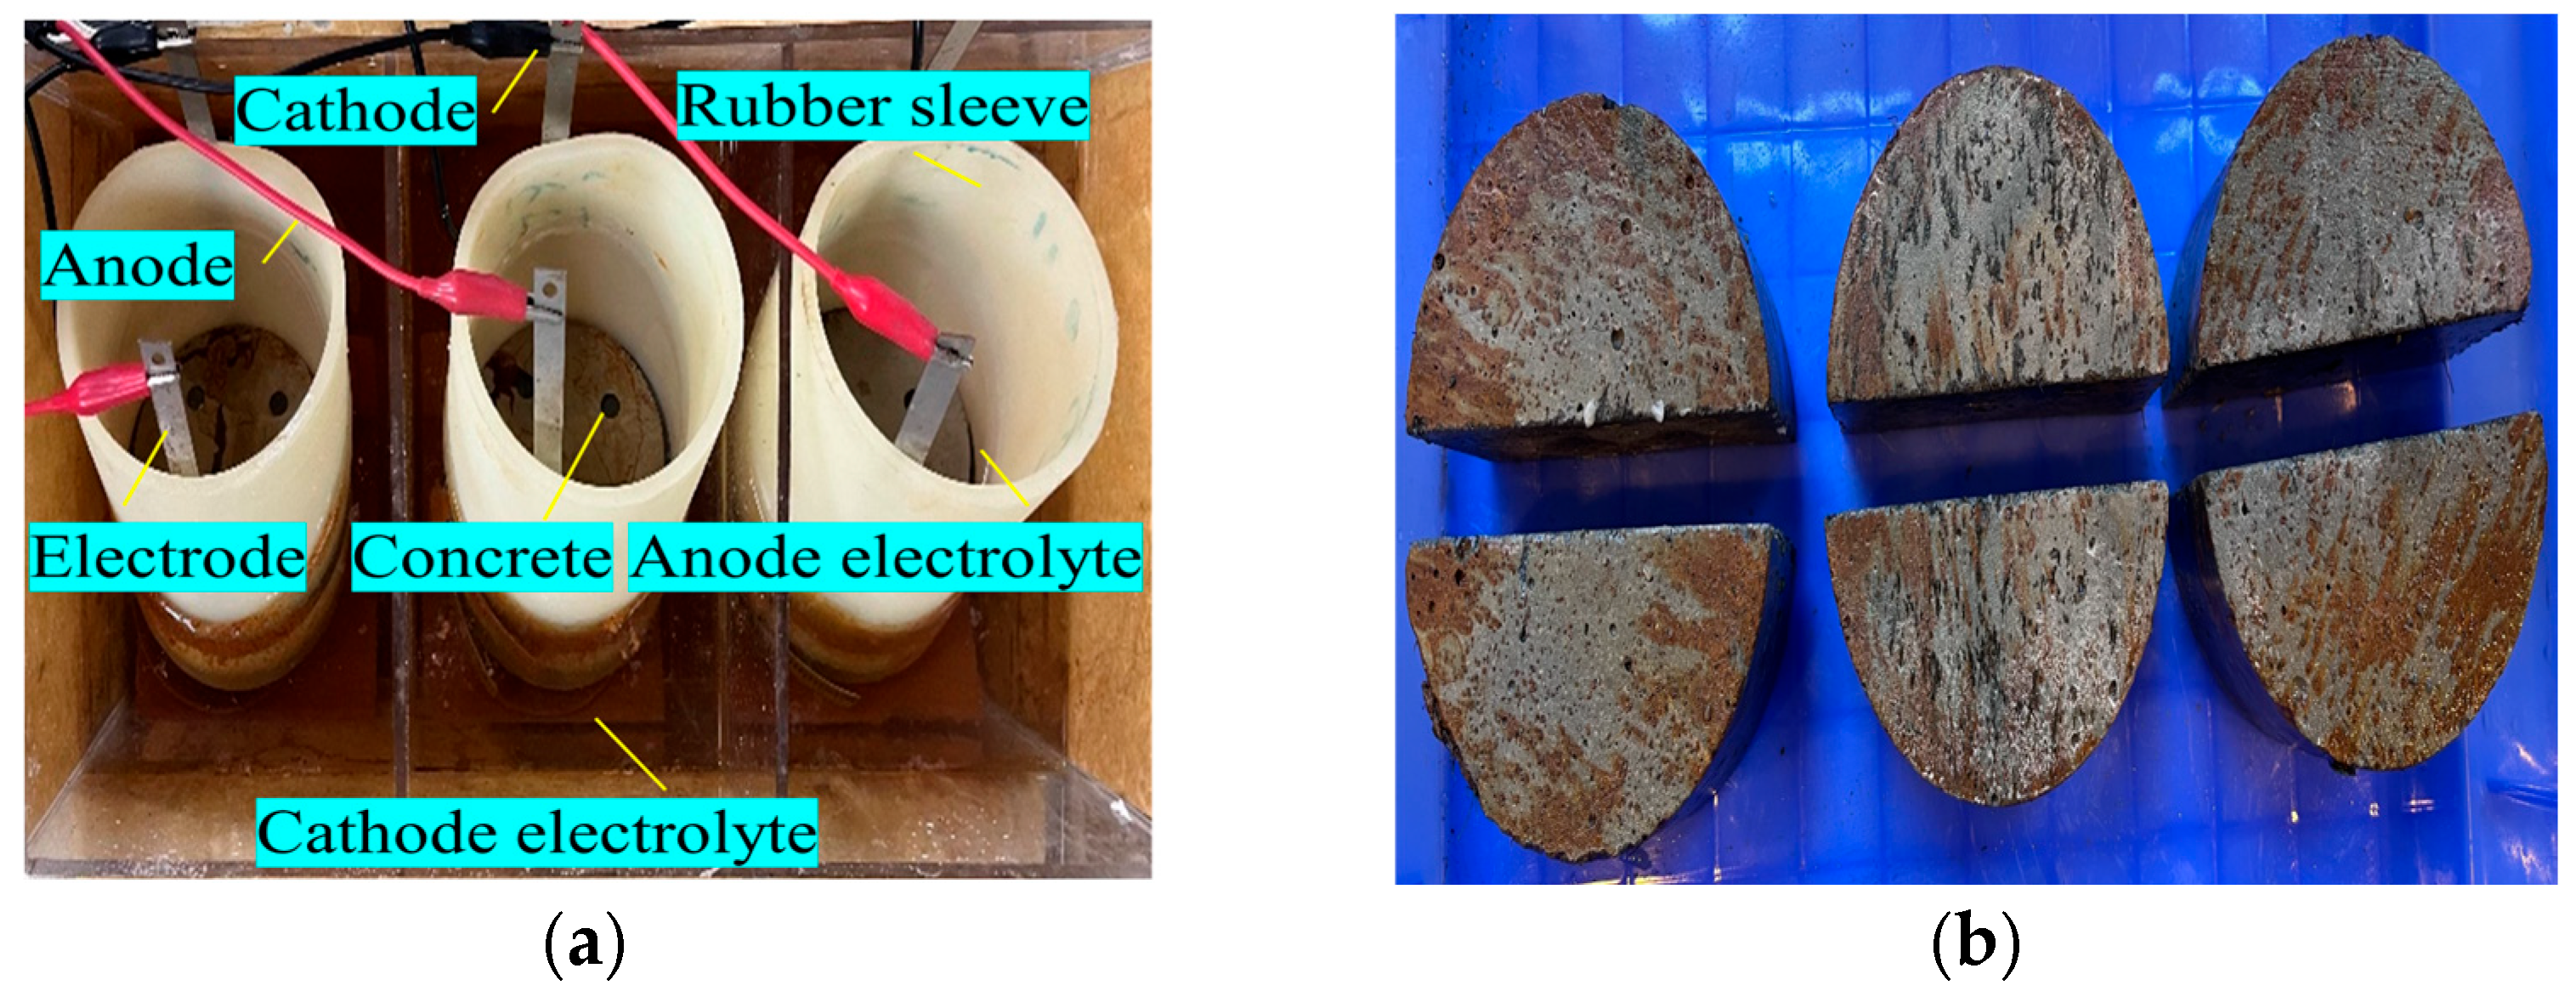
The D of chloride in concrete under non-steady-state migration conditions was determined according to the RCM test method [39]. The UHPC specimens were saturated in an automatic intelligent vacuum water saturation machine for 96 h. Following saturation, the concrete D tester was used for testing, as shown in Figure 3a. The testing voltage was set at 60 V, with a 0.3 mol/L NaOH solution used as the anode and a 10% NaCl solution employed for the cathode. In the RCM test, using a 10% NaCl solution can form a substantial concentration difference with the anode solution; this works in conjunction with the applied electric field to effectively drive the chloride to migrate rapidly into the concrete and shorten the time required for the test. Furthermore, this concentration is consistent with explicit stipulations in multiple standards: China GB/T 50082 [40], European EN 12390-11 [41], American ASTM C1202 [42], among others, all of which clearly stipulate that the cathode solution concentration for the RCM test shall be 10% NaCl. Following the test, the specimen surface was rinsed with water immediately. The specimen was then split axially into two semi-cylindrical parts using a pressure testing machine and a cutting machine. A 0.1 mol/L AgNO3 solution was sprayed onto the surface, and the coloration appeared, as shown in Figure 3b. Subsequently, the chloride penetration depth was measured, and the D was calculated based on this measurement.

2.4. Chloride Content Test Method

(1)
RCM
After the 0.1 mol/L AgNO3 solution was sprayed onto the split surface for approximately 15 min, an indicator was used to assist in observation, and color boundary lines x 1 x 7 (Figure 4) were selected for measurement. The chloride penetration depth x d was taken as the mean of these measured values. The D of UHPC with and without steel fibers was calculated according to Equation (1) based on the aforementioned measurement results:
D RCM = 0.0239 × ( 273 + T ) ( U 2 ) t ( x d 0.0238 ( 273 + T ) L x d U 2 ) ,
where D RCM is the D non-steady-state chloride migration coefficient of the cement concrete (m2/s); U is the absolute value of the applied voltage (V); T is the average value of the initial and final temperatures of the anode solution (°C); L is the specimen thickness (mm), with an accuracy of 0.1 mm; x d is the average chloride penetration depth (mm); and t is the duration of the test (h).
(2)
Chloride content determination
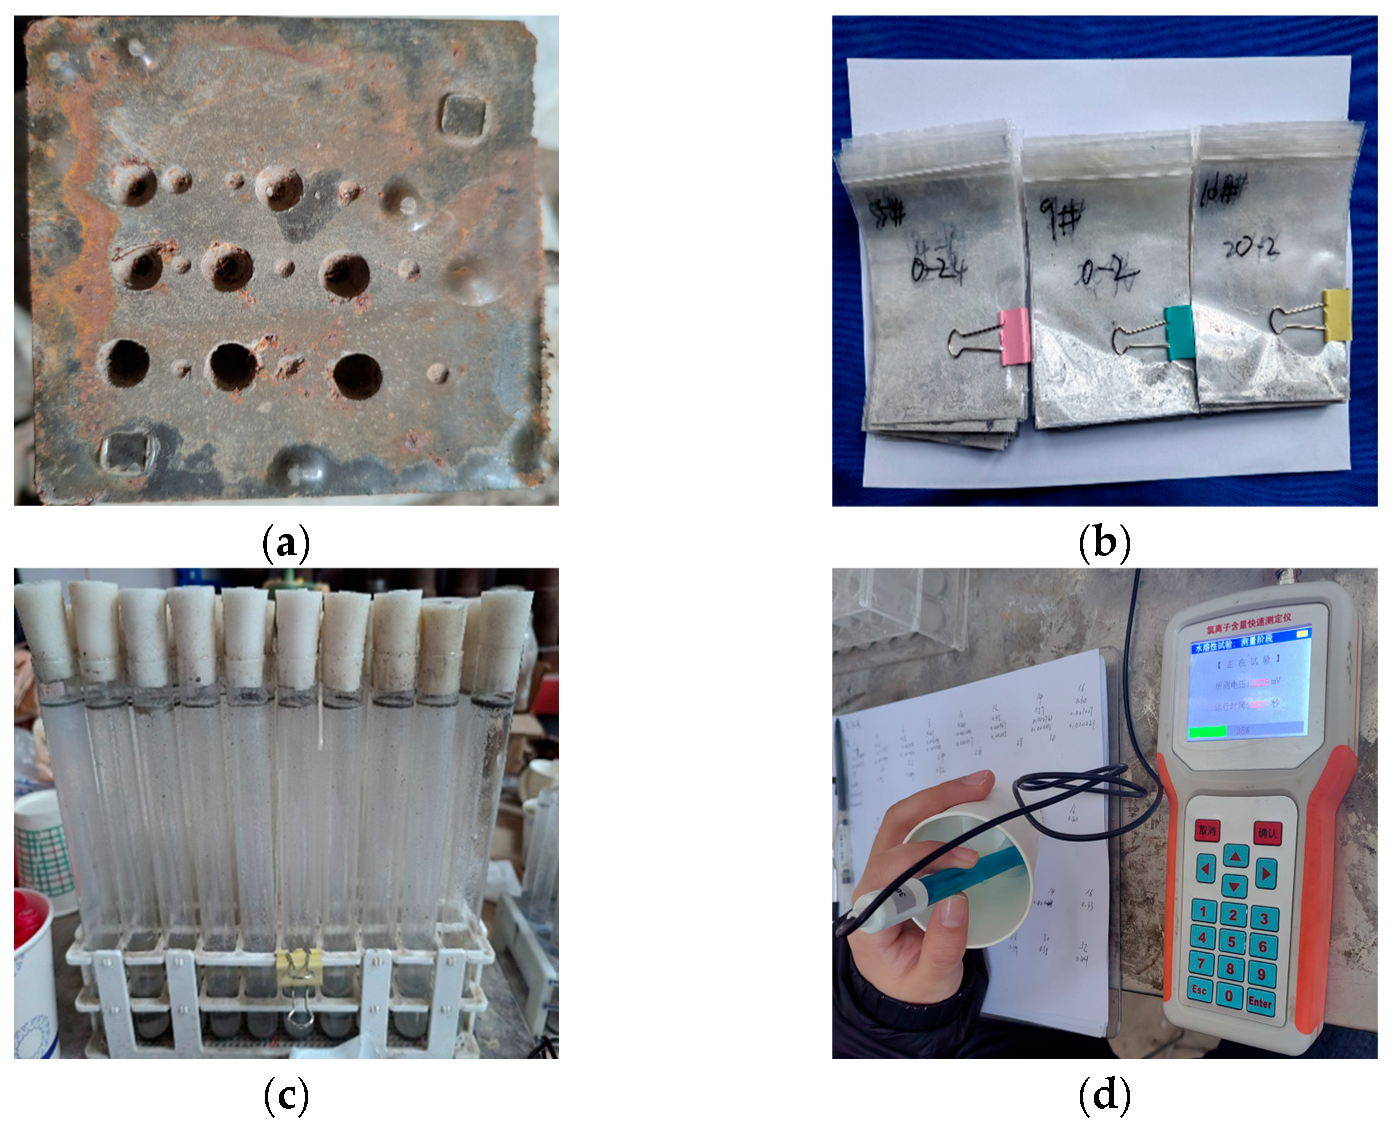
Once the chloride salt erosion test on the UHPC specimens was completed, a bench drill fitted with a 10 mm diameter bit was used to drill holes at 2 mm intervals from the specimen surface inward, for collecting internal powder samples. A total of six holes were arranged at the sampling position to collect internal powder samples, with a sampling depth of 30 mm. After powder collection, the samples were sieved through a standard 0.06 mm test sieve and then stored in different plastic bags with labels. Before measurement, the powder samples were dried to constant weight in an oven to eliminate moisture interference. Thereafter, each dried powder sample was placed in a glass test tube containing distilled water and shaken thoroughly for 2 min to facilitate the leaching of free chloride. After the mixture was rested for 24 h, a chloride diffusion meter was applied to measure the free chloride content (FCC) in the UHPC. The specific process is shown in Figure 5.

3. Test Results

3.1. LTI Diffusion Model

Chloride diffusion in concrete under LTI follows Fick’s second law of diffusion (known as the unsteady-state diffusion equation). The expression is as follows [43]:
C ( x , t ) t = D 2 C x 2
where C ( x , t ) is the CC in the concrete at the diffusion time ( mol m - 3 ); t is the chloride diffusion time ( s ); D is the D in the concrete ( m 2 s - 1 ); x is the depth of chloride diffusion in the concrete; C ( x , t ) t is the change rate of CC with time in the concrete; and 2 C x 2 is the change rate of the CC gradient with depth.
Setting initial conditions: when t = 0 , C ( x , 0 ) = C 0 ; boundary conditions: when x = 0 , C ( 0 , t ) = C s , the analytical solution of Equation (2) is as follows [43]:
C ( x , t ) = C 0 + ( C s C 0 ) [ 1 erf ( x 2 D t ) ] ,
where C 0 is the initial CC in the concrete; C s is the surface chloride concentration of the concrete; and erf is the Gaussian error function.

3.2. FCC

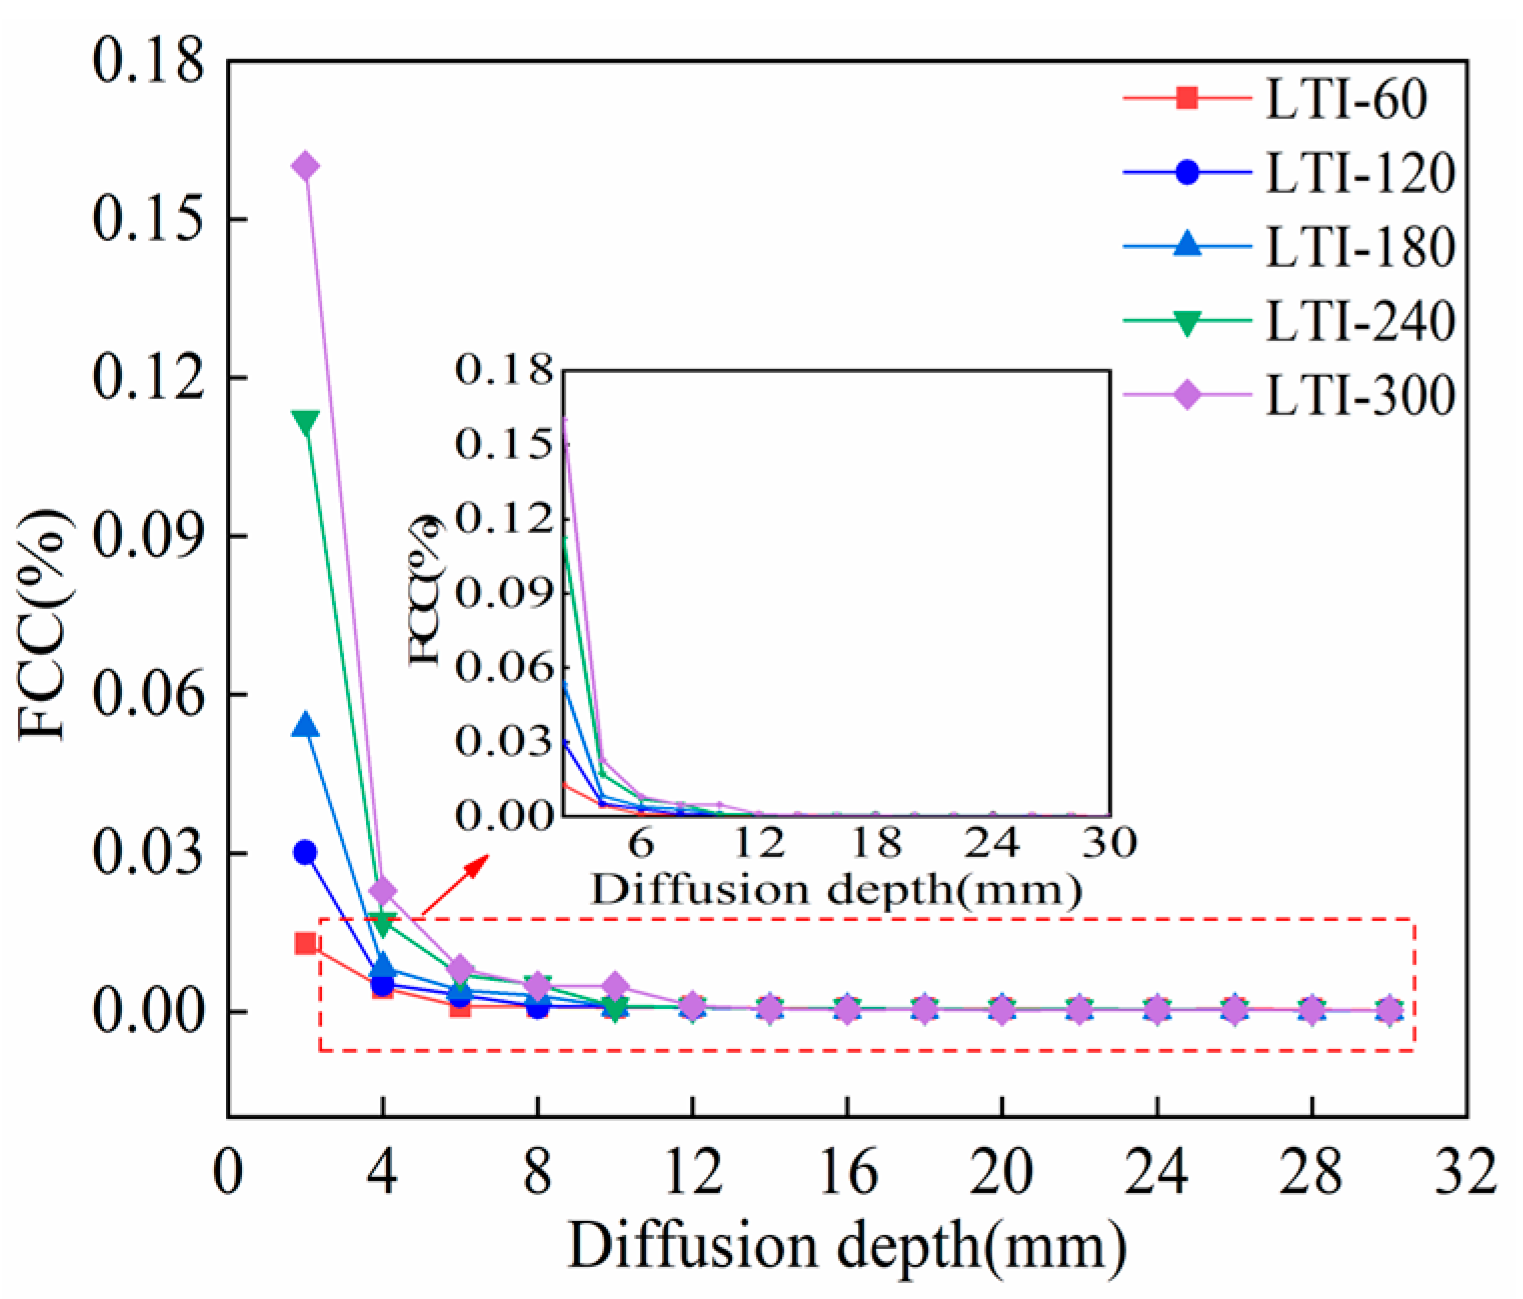
Figure 6 shows the FCC in UHPC under the action of LTI. In Figure 6, under the action of LTI, the FCC inside UHPC decreases with increasing depth due to factors such as the reduction in CC and the densification of the pore structure. The diffusion depth of chloride and the FCC in UHPC increase with the increase in LTI time. The FCC in the UHPC at 2 mm after 300 d of LTI increased by 92.0% compared with that after 60 d of immersion. When the chloride diffusion depth reaches 18 mm or more, the FCC in the UHPC gradually tends to zero. Notably, the longer the LTI duration for UHPC, the longer the time required for the FCC to tend to zero, and the greater the depth corresponding to CC to approach zero. After 60 d of LTI, the depth at which the FCC tends to zero is 6 mm; in contrast, after 300 d of LTI, the depth is greater than 18 mm.

3.3. D

After spraying AgNO3 solution onto the split of UHPC specimens, the chloride-induced coloration phenomenon in UHPC is obscured (Figure 7), making it difficult to determine the chloride penetration depth. The reasons for this situation are as follows: (1) The UHPC exhibits excellent durability, with a stable and dense microporous structure. This effectively prevents harmful substances from entering the UHPC and results in a shallow penetration depth that is not visible to the naked eye; (2) the CC at the coloration boundary for different materials is different.
Considering the unclear coloration from the AgNO3 spray test on the UHPC split surface and the inherent errors in visually observing the chloride penetration depth, which affect the determination of D , this study adopted the method of drilling to collect powder and measure the chloride content for calculating D .
The FCC in the UHPC was fitted using Origin software 2018 to obtain D based on Fick’s second law (Table 3).
Table 3 shows the D of UHPCSF0 and UHPC obtained by fitting. The D value of UHPC with steel fibers was 37.9% lower than that of UHPCSF0 without steel fibers. The incorporation of steel fibers optimized the pore structure inside the UHPC, reduced its porosity, and improved its density and impermeability, effectively hindering the penetration of chloride. These improvements collectively act to effectively hinder the penetration of chloride [44].
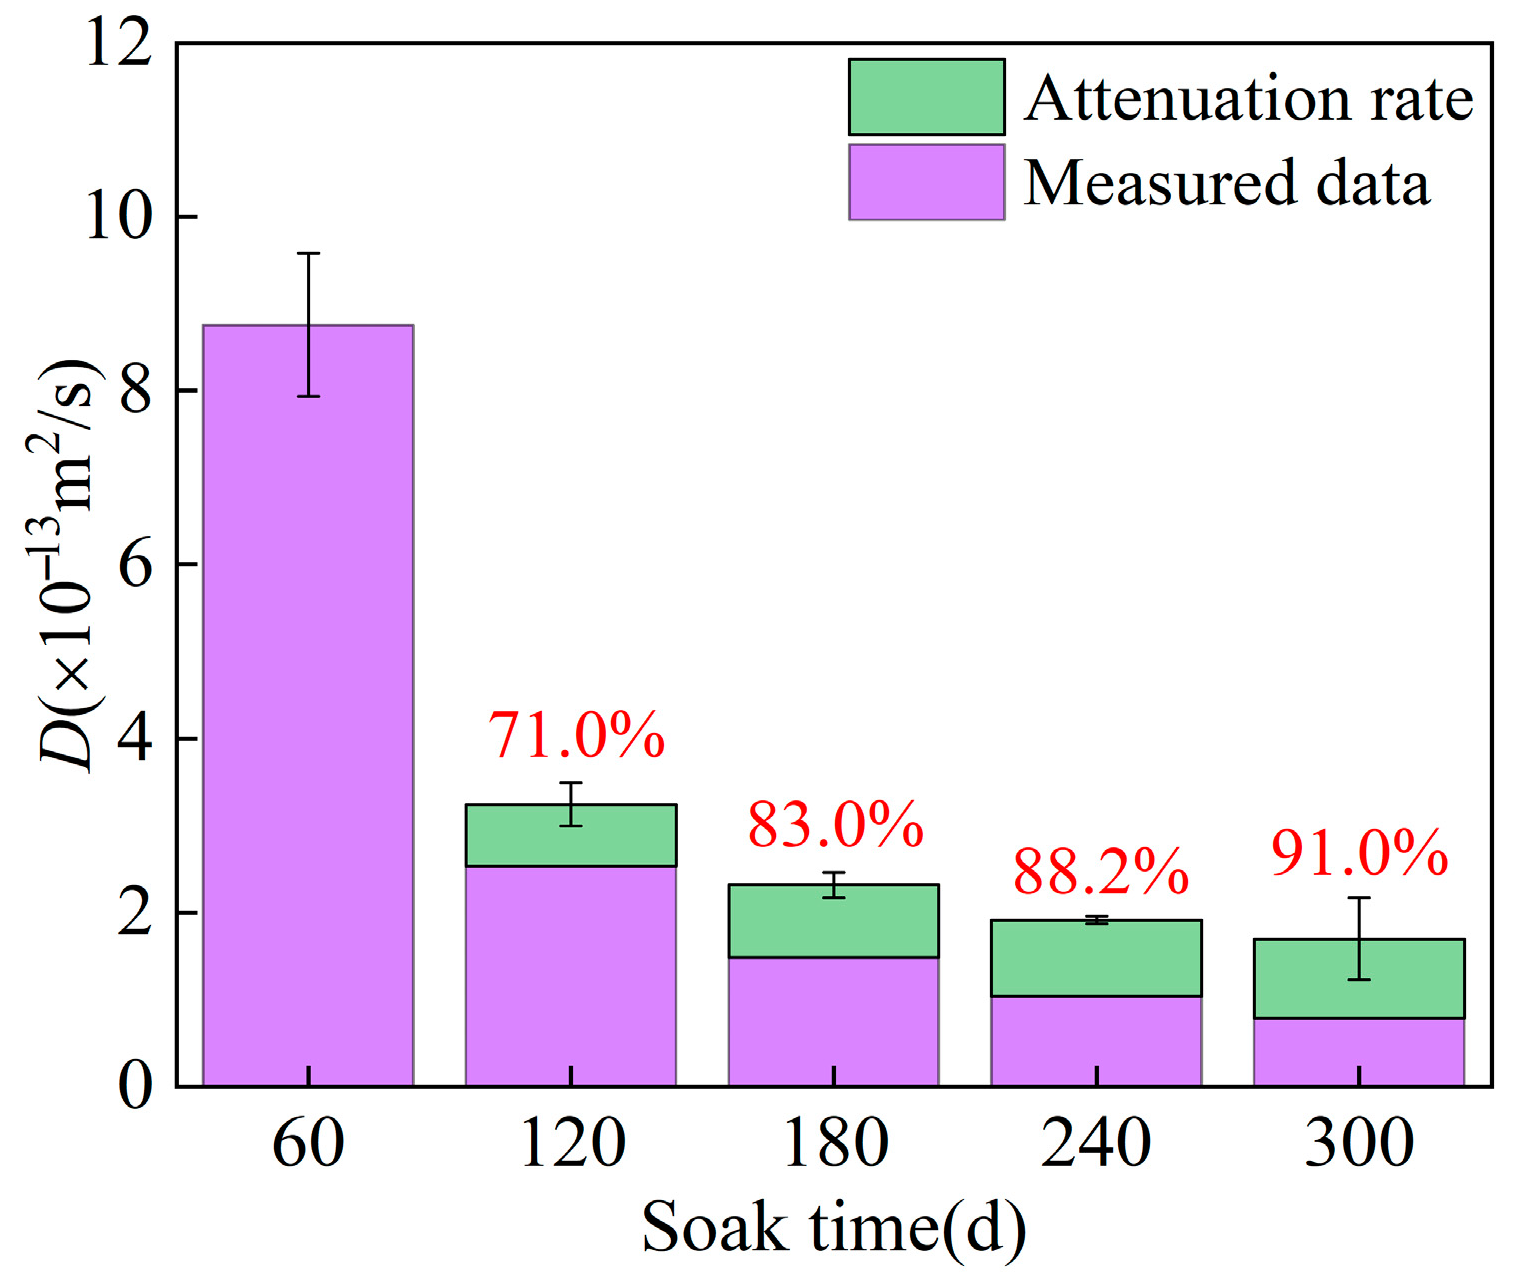
Figure 8 shows the variation in the D of UHPC with time. Under LTI, D decreases with time, which is consistent with existing research findings [4,9]. However, with the increase in erosion time, the concentration gradient inside and outside the concrete gradually decreases and finally tends to a balanced state. The main reason for the decrease is that a prolonged exposure time promotes the continuation of the internal hydration reaction of concretes, and the hydration products, such as hydrated calcium silicate (C-S-H) gel, further fill the pores, compact the internal pore structure, and thereby hinder the intrusion of chloride [45]. Secondly, the hydration products formed under prolonged soaking conditions exhibit a denser structure [46]. In Figure 8, a reduction in the D of UHPC is observed with the extension of immersion time. The longer the immersion time, the slower the reduction rate of the D , and it gradually stabilizes after 300 d. The D of UHPC soaked for 120, 180, 240, and 300 d decreased by 71.0%, 83.0%, 88.2%, and 91.0%, respectively, compared with the D of UHPC, which was soaked for 60 d.

3.4. Cs

Figure 9 shows the variation in the C s of UHPC with time.
In Figure 9, an increase in the C s of UHPC occurs with the extension of the immersion time. The C s of UHPC after 300 d of immersion increases by 92.5% compared with that after 60 d of immersion. However, the growth rate decreases as the immersion time increases. This phenomenon is primarily attributed to two factors: first, UHPC rehydration densifies the internal pore structure of concrete; second, the concentration difference between the chloride concentration on the internal surface of concrete and that in the external solution decreases, thereby attenuating the chloride diffusion rate [47].

3.5. Time-Dependent Model of D

The D is a key parameter for characterizing the chloride migration rate through the concrete pore structure. With time, the D value in concrete gradually decreases and eventually tends to stabilize at a certain value.
The majority of existing studies use the form of Equation (4) to characterize the change of D with time, and the values of D 0 and t 0 are different. In reference [48], D 0 represents the D of concrete at the curing age t 0 = 28 d. In reference [49], D 0 refers to the D of concrete when exposed to a chloride salt environment at time t 0 . Both these variables can effectively reflect the variation of D in concrete with time. If the D at the concrete curing age of 28 d was known, then the fitting was carried out according to the formula in [48]; otherwise, the opposite is true.
D ( t ) = D 0 ( 28 t ) m
D ( t ) = D 0 ( t 0 t ) m
where D ( t ) and D 0 are the D of concrete at exposure times t and t 0 in a chloride salt environment, respectively; and m is the time decay coefficient of the D in concrete.
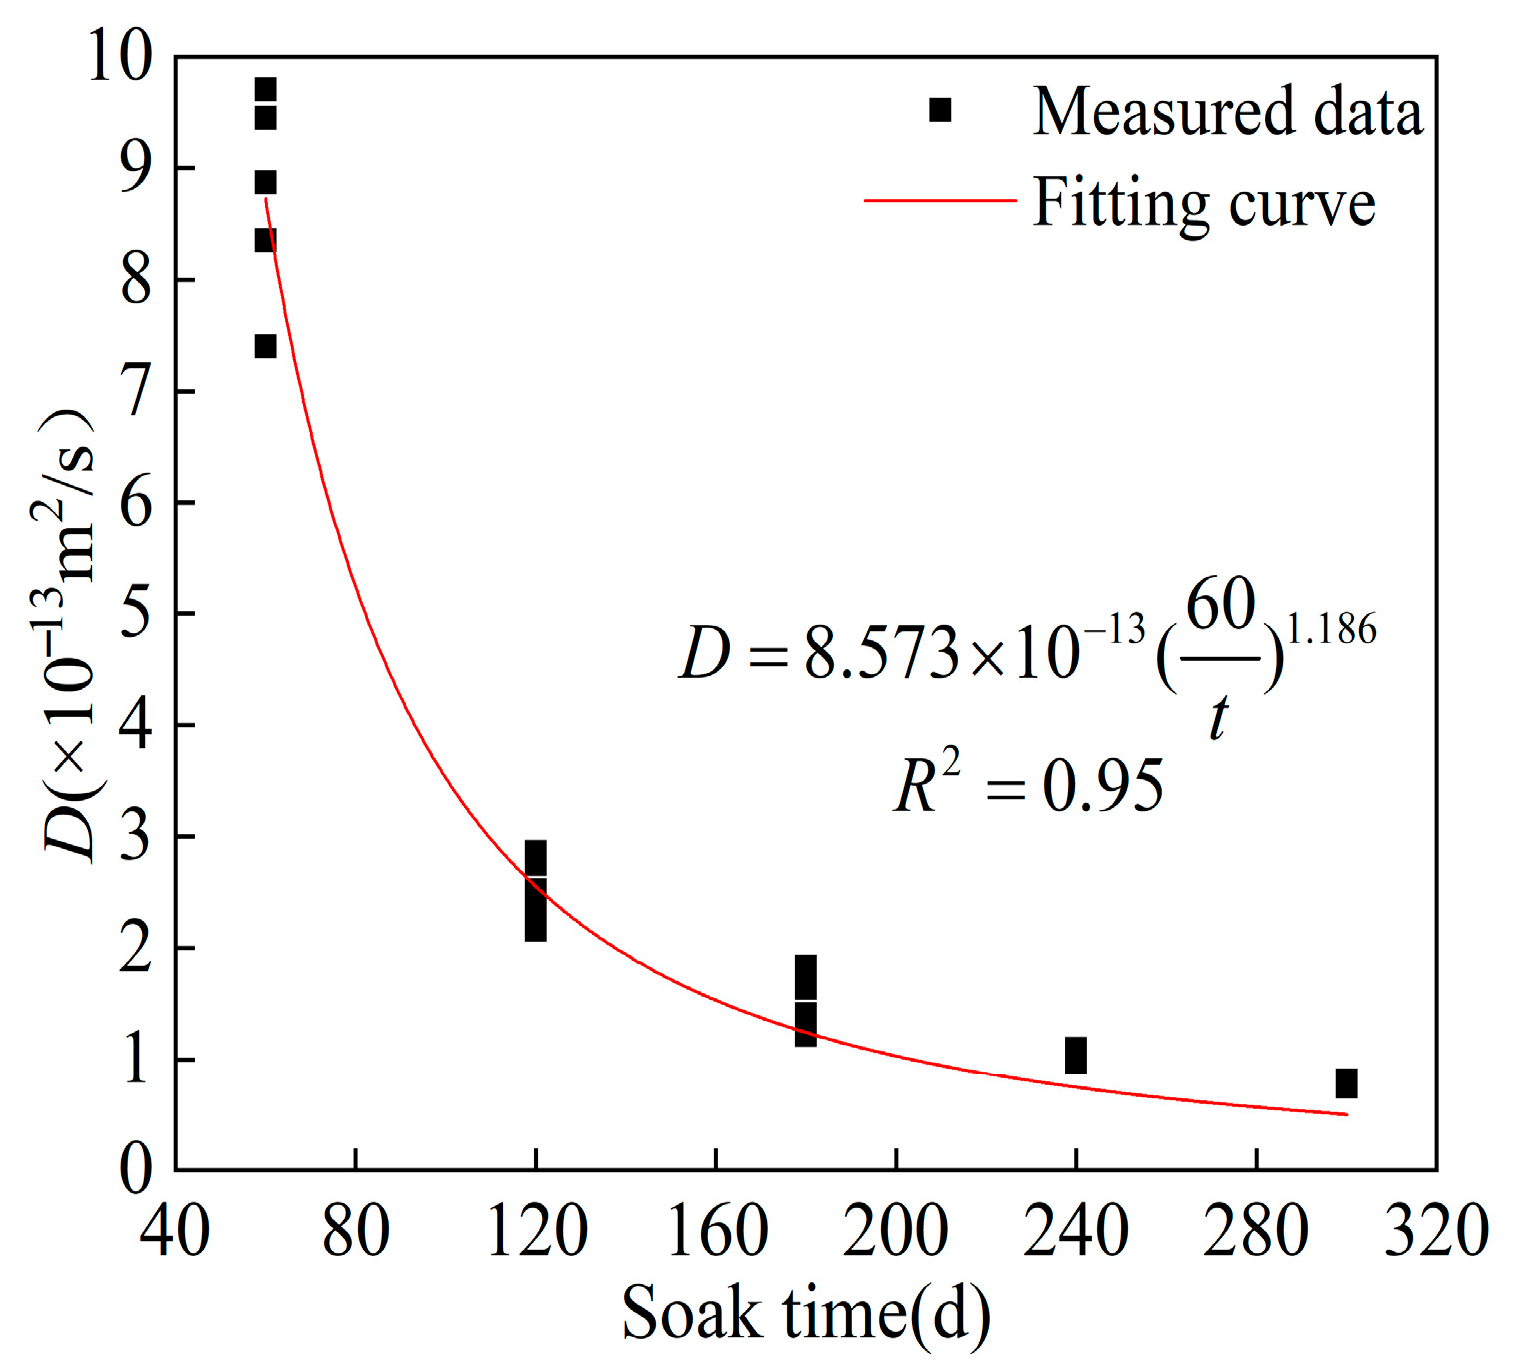
In this study, D is fitted according to the expression of Equation (5) in reference [49], and the fitting curve is shown in Figure 10.
The time decay coefficient m indicates the attenuation characteristic of the D in UHPC with time. The larger the time attenuation coefficient m , the faster the attenuation rate of D . The chloride diffusion rate under LTI is slow due to the high durability of UHPC, and the D tends to stabilize earlier. In Figure 10, the D decreases rapidly in the early stage, and then decreases gradually in the later stage, which also corresponds to the gradual stabilization of the attenuation rate of the chloride diffusion coefficient in Figure 8.

3.6. Time-Dependent Model of Cs

Existing studies assume that the C s of concrete remains constant [50]. However, practical research has found that C s is not constant but is time-dependent [51]. C s exhibits various time-dependent forms, such as square root, logarithmic, and power function types [52], as shown in Equations (6)–(8):
Square-root:
C s ( t ) = C s 1 + k t
Logarithmic:
C s ( t ) = C s 2 + β ln ( t )
Power-law:
C s ( t ) = C s 3 t i
where C s ( t ) represents the surface chloride concentration at corrosion time t ; C s 1 , C s 2 , C s 3 , k , β , and i are the fitting parameters.
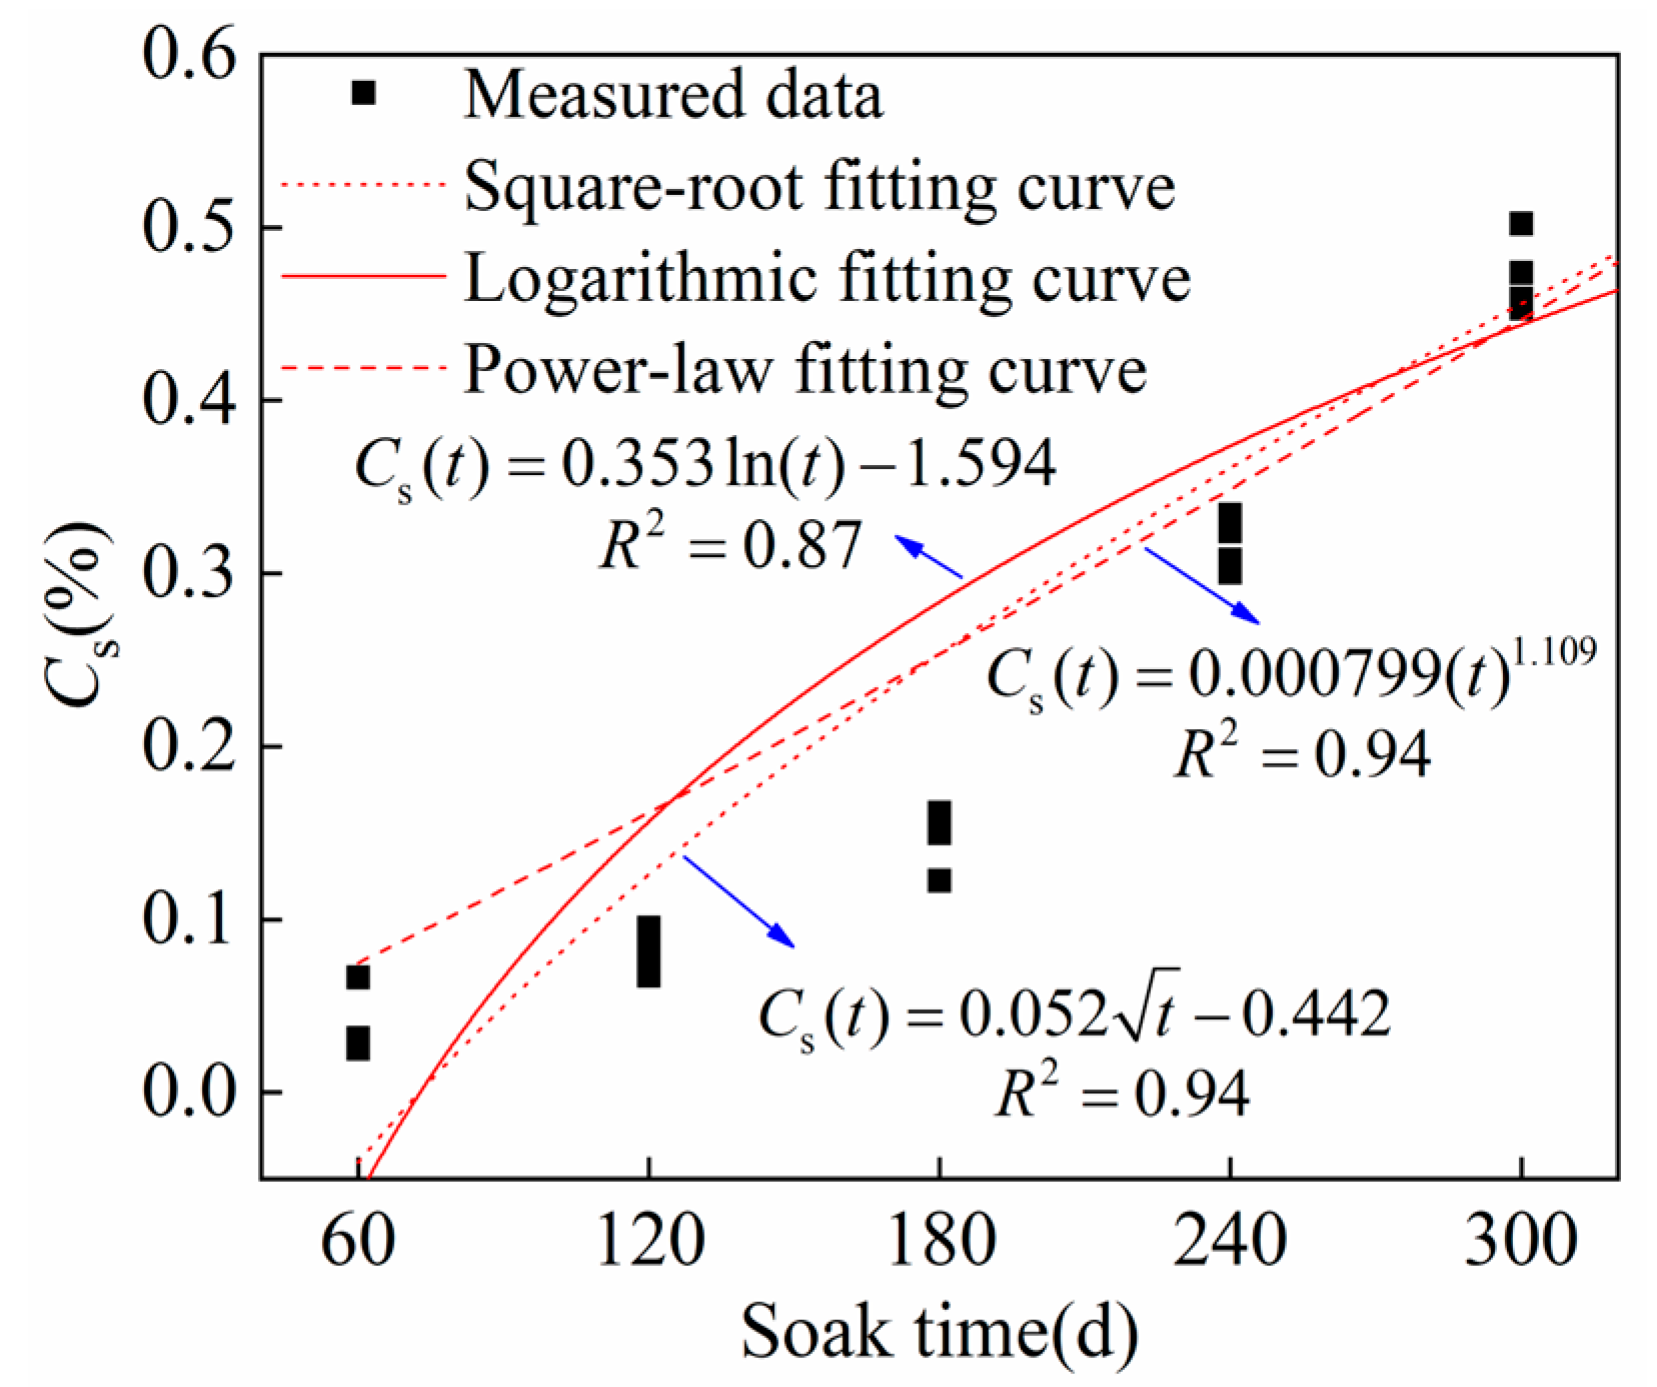
The three above-mentioned types of functions were used to fit and analyze the measured data of C s under the action of LTI in this study. The fitted curves are shown in Figure 11.
The logarithmic function model better fits the characteristic that the C s in the structure is relatively low in the initial stage and tends to stabilize with time compared with the square root and power function models (Figure 11). This observation is consistent with the time-dependent patterns of C s found in related studies by other researchers [52,53], and it also corresponds to the observation in Section 3.4 of this study, where the CC growth rate decreases with the increase in the corrosion time. Accordingly, the logarithmic type was used as the fitting model of C s with time in this study. The expressions under LTI are shown in Equation (9):
C s ( t ) = 0.353 ln ( t ) 1.594

4. Finite-Element Simulation of Chloride Diffusion

4.1. Finite-Element Model Building

COMSOL Multiphysics 6.0 is a multi-physics coupling simulation software featuring robust modeling, simulation, and post-processing capabilities.
(1)
Boundary set
In COMSOL Multiphysics, the “Dilute Matter Transfer“ physical field was selected and paired with a transient analysis type to simulate time-dependent chloride diffusion. A 1:1 full-scale geometric model of the UHPC specimens was established based on their actual size, and the boundary conditions for three sides of the model were defined and assigned, as depicted in Figure 12.
(2)
Mesh subdivision
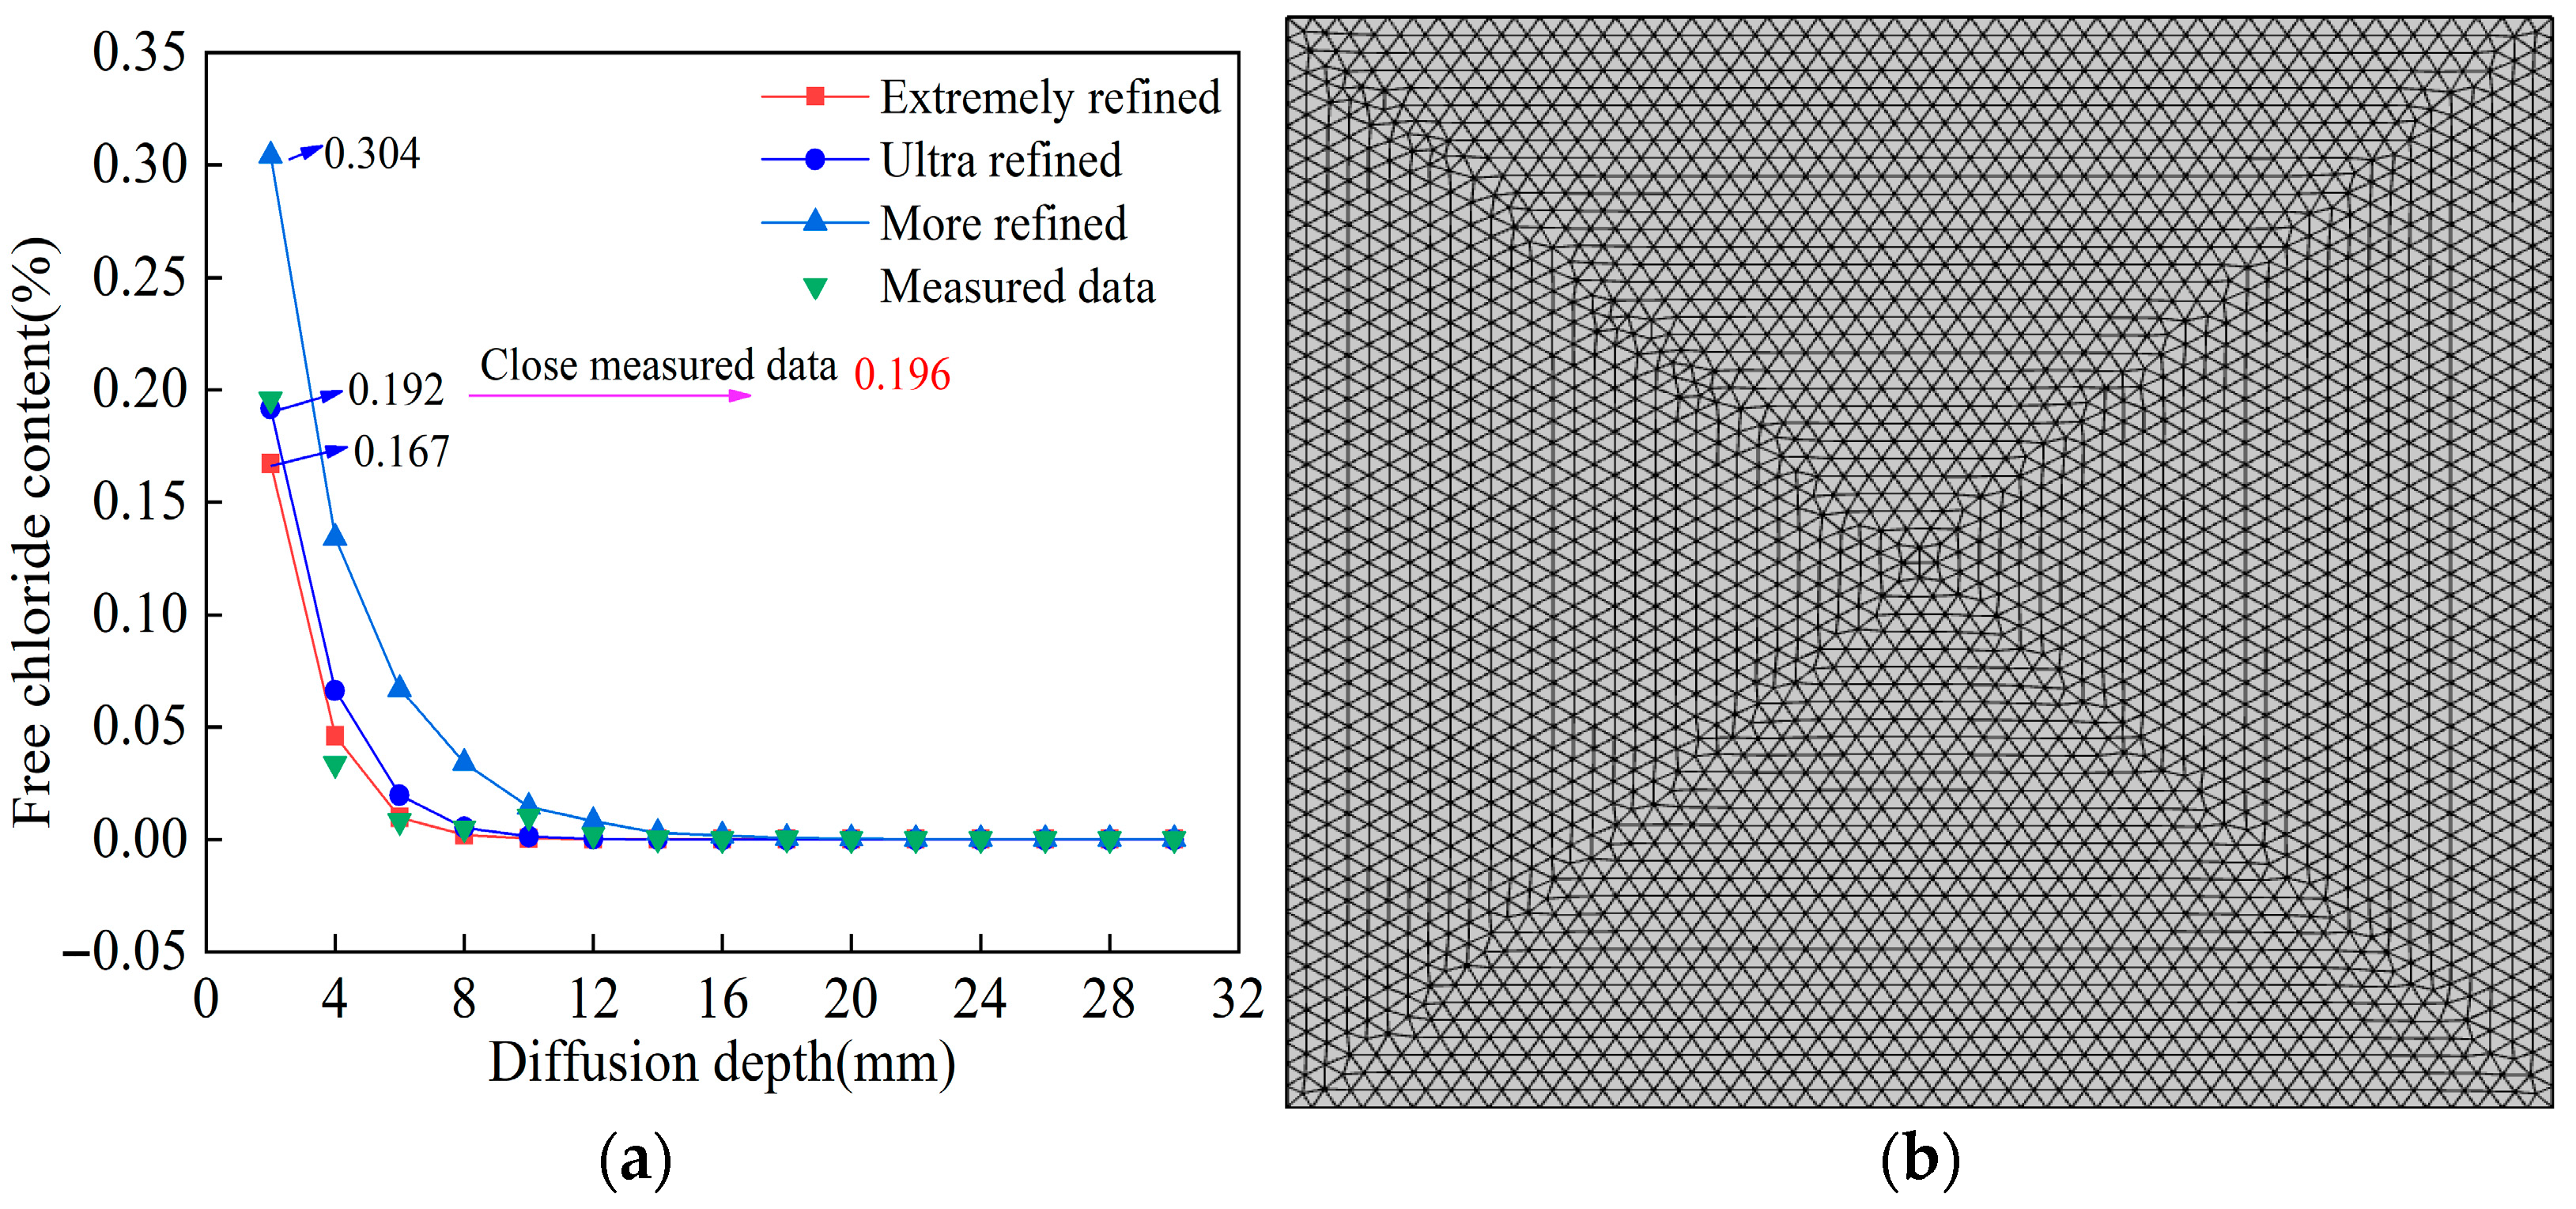
Three meshing methods were systematically evaluated in COMSOL—extremely refined, ultra-refined, and moderately refined—for a grid sensitivity analysis. As shown in Figure 13a, simulation with the moderately refined mesh led to a significant overestimation of FCC, resulting in large discrepancies when compared with experimental data. In contrast, both the extremely refined and ultra-refined meshes align well with the experimental data. However, the computation time for the extremely refined mesh was 39 s, whereas that for the ultra-refined model was only 11 s. Given the comparable accuracy and significantly reduced computational cost, the ultra-refined mesh configuration was selected for all subsequent simulations, as shown in Figure 13b.
(3)
Model solution calculation
Based on the requirements of the parameter analysis, the model was solved with appropriate boundary conditions, defining a time-dependent solver with adaptive time stepping to capture the non-linear chloride diffusion process accurately.

4.2. Comparative Analysis of Experimental and Numerical Results

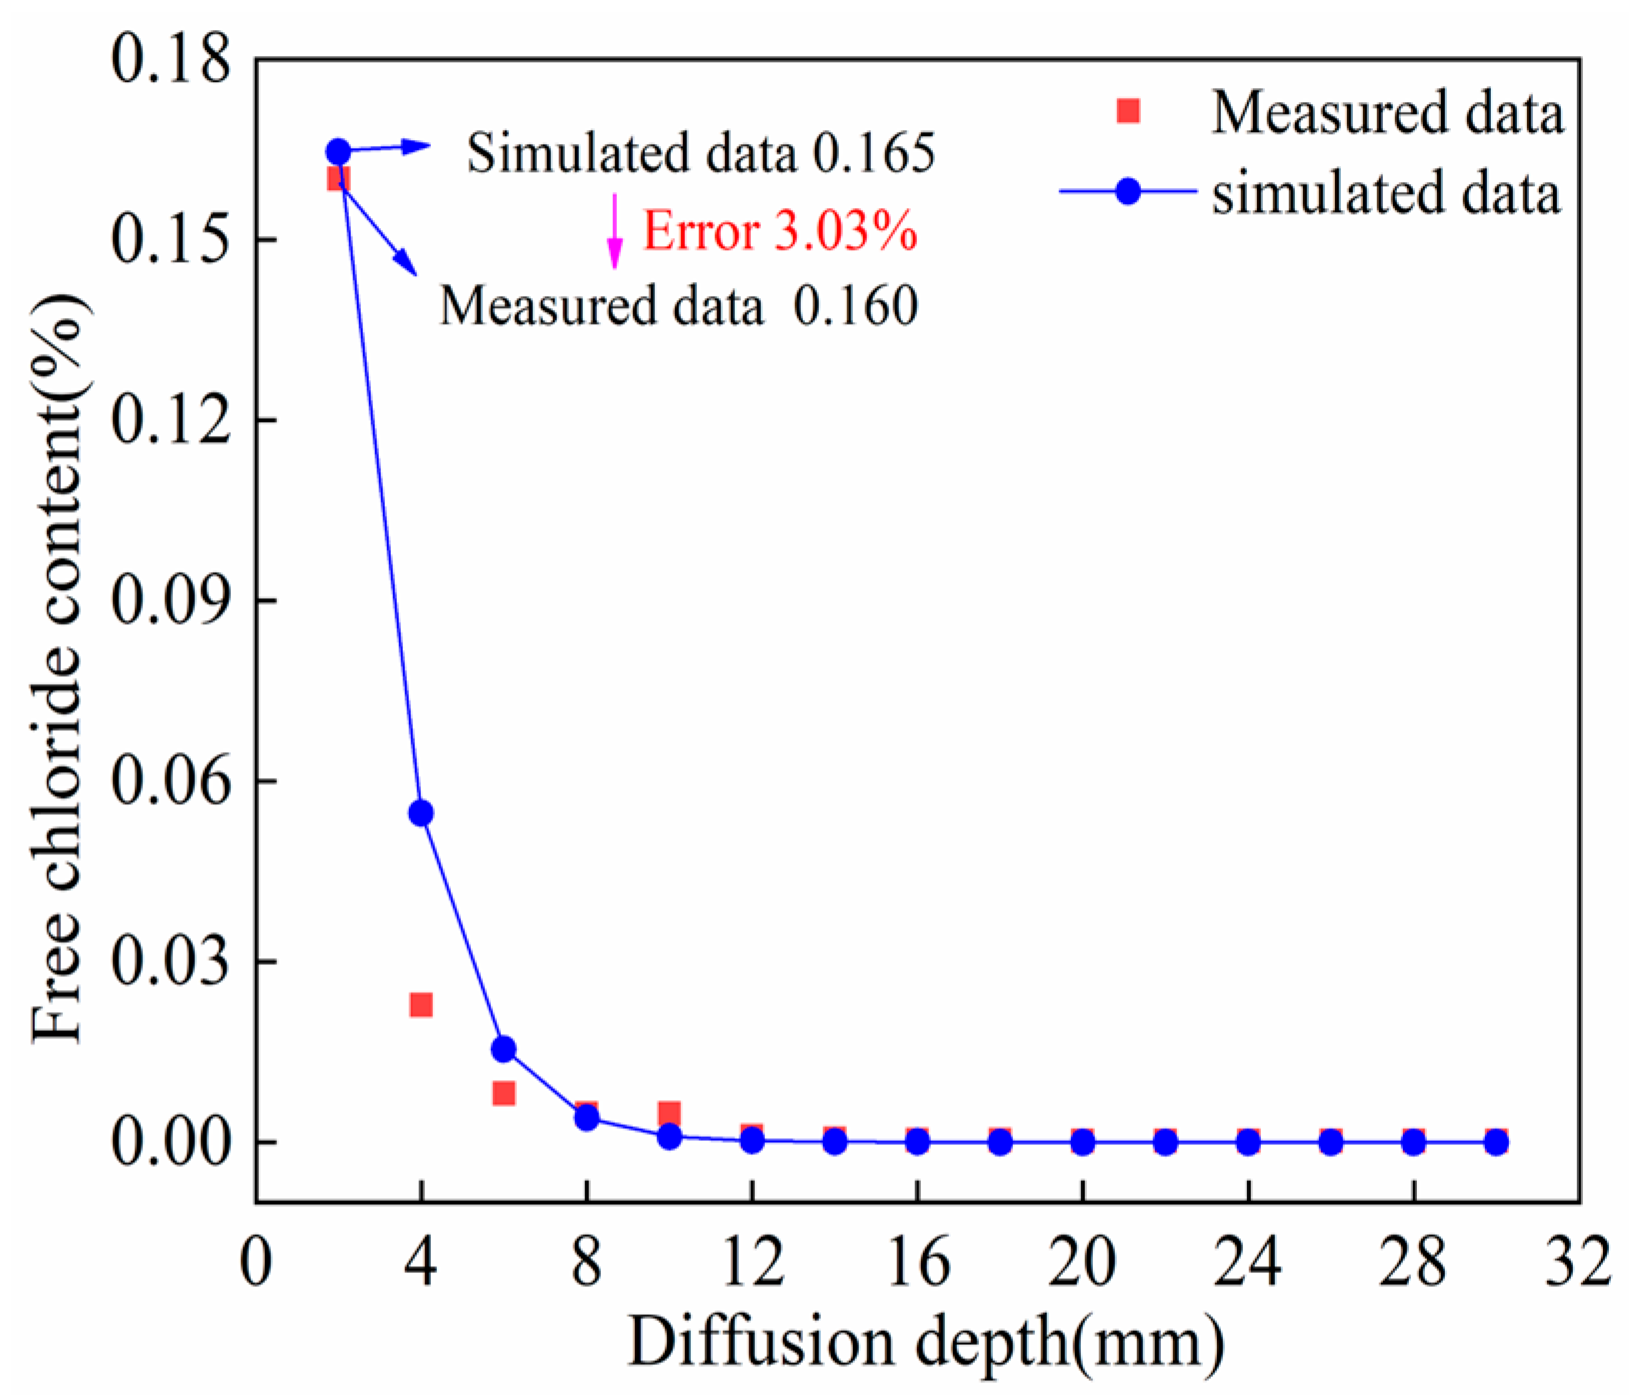
Relevant parameters such as D and C s were input for the simulation after model establishment. The FCC of UHPC under 300 d LTI was compared with measured data (see Figure 14).
In Figure 14, the measured FCC in UHPC after 300 d of LTI agrees well with the simulated values, and the relative discrepancy between the two remains below 4%, which validates the reliability of the established chloride diffusion model for simulating chloride diffusion behaviour in UHPC.

4.3. Parametric Analysis

(1)
Temperature
Chloride diffusion behaviour in concrete structures is significantly influenced by temperature. According to previous research [42], the relationship between temperature and chloride diffusion is characterized by Equation (10):
K ( T ) = exp U R 1 T ref 1 T
where R is the molar gas constant (R = 8.314 J/(mol·K)); U is the ion diffusion activation energy, which is significantly affected by the concrete’s water–cement ratio. Table 4 lists the values of U , from which 36.2 KJ/mol was selected for UHPC via linear interpolation. T ref denotes the concrete ambient temperature ( T ref = 295 K), and T represents the absolute temperature.
In accordance with the temperature variation in concrete structures in marine environments, the temperature influence coefficients at 10, 20, 30, 40, and 50 °C were calculated using Equation (10). These coefficients were then used to correct the D . The diffusion law of chloride in UHPC at different temperatures was revealed, as shown in Figure 15.
The FCC in UHPC increases significantly with rising ambient temperature, accompanied by an increase in the chloride diffusion depth, as shown in Figure 15. As the temperature rises, chloride migration and chemical reaction rates increase, while the chloride-binding capacity decreases. As temperature increases, the rise in FCC in concrete is mainly because elevated temperatures tend to damage the microstructure of concrete hydration products, reducing their physical adsorption capacity and the chemical bonding stability of chloride, thereby promoting the desorption of bound chloride into FCC [55]. As the temperature rises from 10 °C to 50 °C, the FCC in UHPC changes significantly at depths of 4–24 mm, but shows a gentle variation at 2 mm. Compared with the control group, the FCC in UHPC at the 10 mm depth increased by 96.1% when the temperature increased to 50 °C.
(2)
Relative humidity
Chloride in concrete is transported through pore water, with its transport behaviour influenced by variables such as saturation or relative humidity. The pore water saturation significantly affects chloride transport. Bazant et al. [56] proposed an expression for the D influenced by internal relative humidity:
K ( R H ) = [ 1 + ( 1 R H ) 4 ( 1 R H c ) 4 ] 1
where R H c is the critical relative humidity, generally R H c = 0.75; R H is the relative humidity inside the concrete.
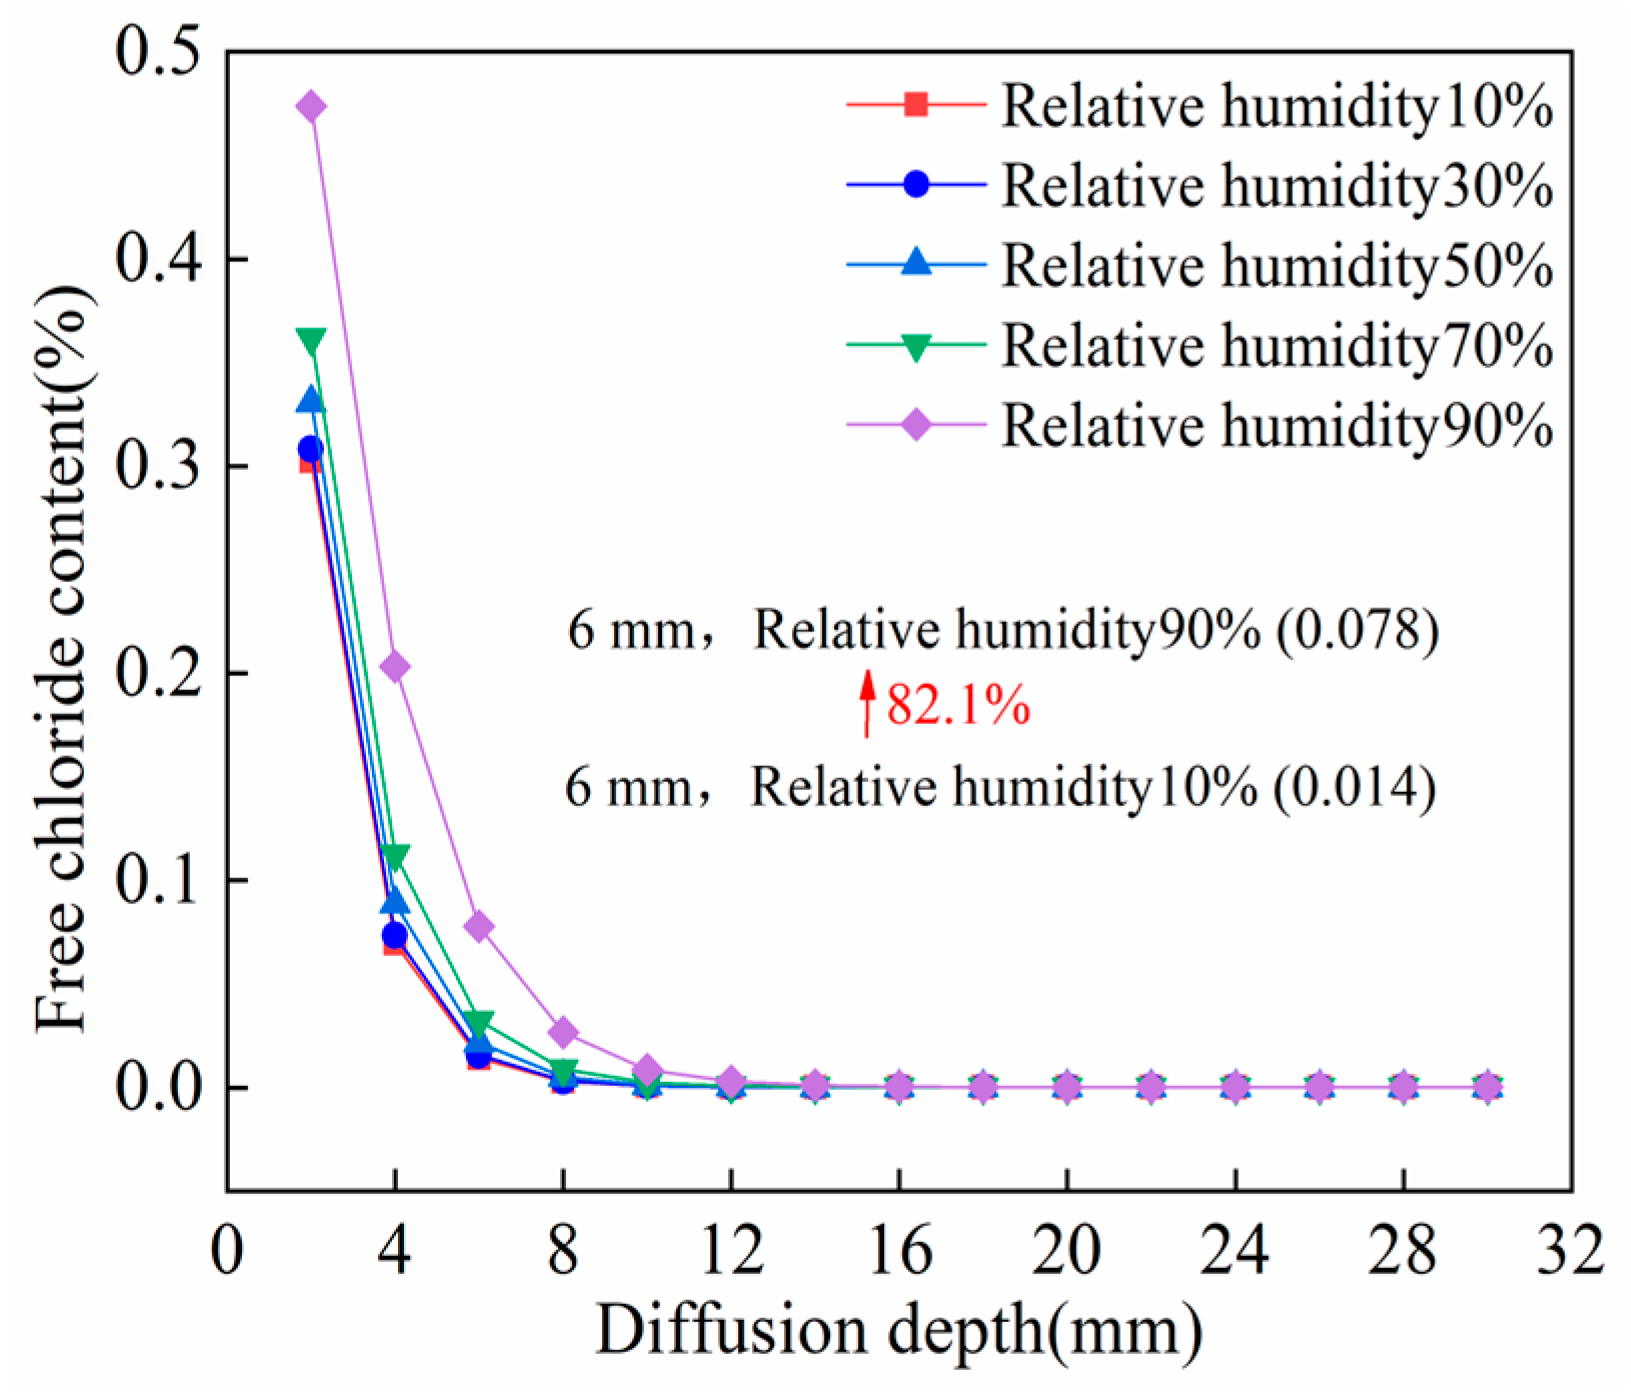
Using 10%, 30%, 50%, 70%, and 90% as the internal UHPC relative humidity levels, the influence coefficients of different relative humidity levels on chloride diffusion were calculated via Formula (11) to modify the D for simulation. The simulation results are presented in Figure 16.
Figure 16 shows that when the internal relative humidity of UHPC is lower than 50%, the FCC in UHPC remains relatively stable. This stability is primarily attributed to the fact that low internal humidity reduces the pore water content, preventing continuous water film formation and limiting chloride migration [57]. Meanwhile, the cementitious materials exhibit a strong chloride adsorption capacity under low-humidity conditions, which further immobilizes a significant portion of chloride in the solid phase. Conversely, when the internal relative humidity exceeds 50%, the increased moisture content facilitates chloride migration through multiple mechanisms: higher pore water content promotes the formation of continuous water films, enhancing pore connectivity and facilitating diffusion. Water molecules also occupy adsorption sites on cementitious materials, weakening the chloride-binding capacity. This weakening increases the concentration of free chloride in the pore solutions, thereby accelerating the migration and accumulation via diffusion and penetration. Notably, at 90% relative humidity, the FCC at 6 mm depth under LTI increases by 82.1% compared to 10% relative humidity (see Figure 16).
(3)
Tensile stress ratio
Under the action of load, UHPC accumulates damage, which further leads to material degradation and changes in chloride transport behaviour. Li [58] proposed the relationship between load and D , which is expressed as follows:
K ( λ ) = D ( 2.1078 λ 2 0.3018 λ + 1 ) ; λ = σ / f t ,
where K ( λ ) is the influence coefficient of loading, and f t is the tensile strength of UHPC.
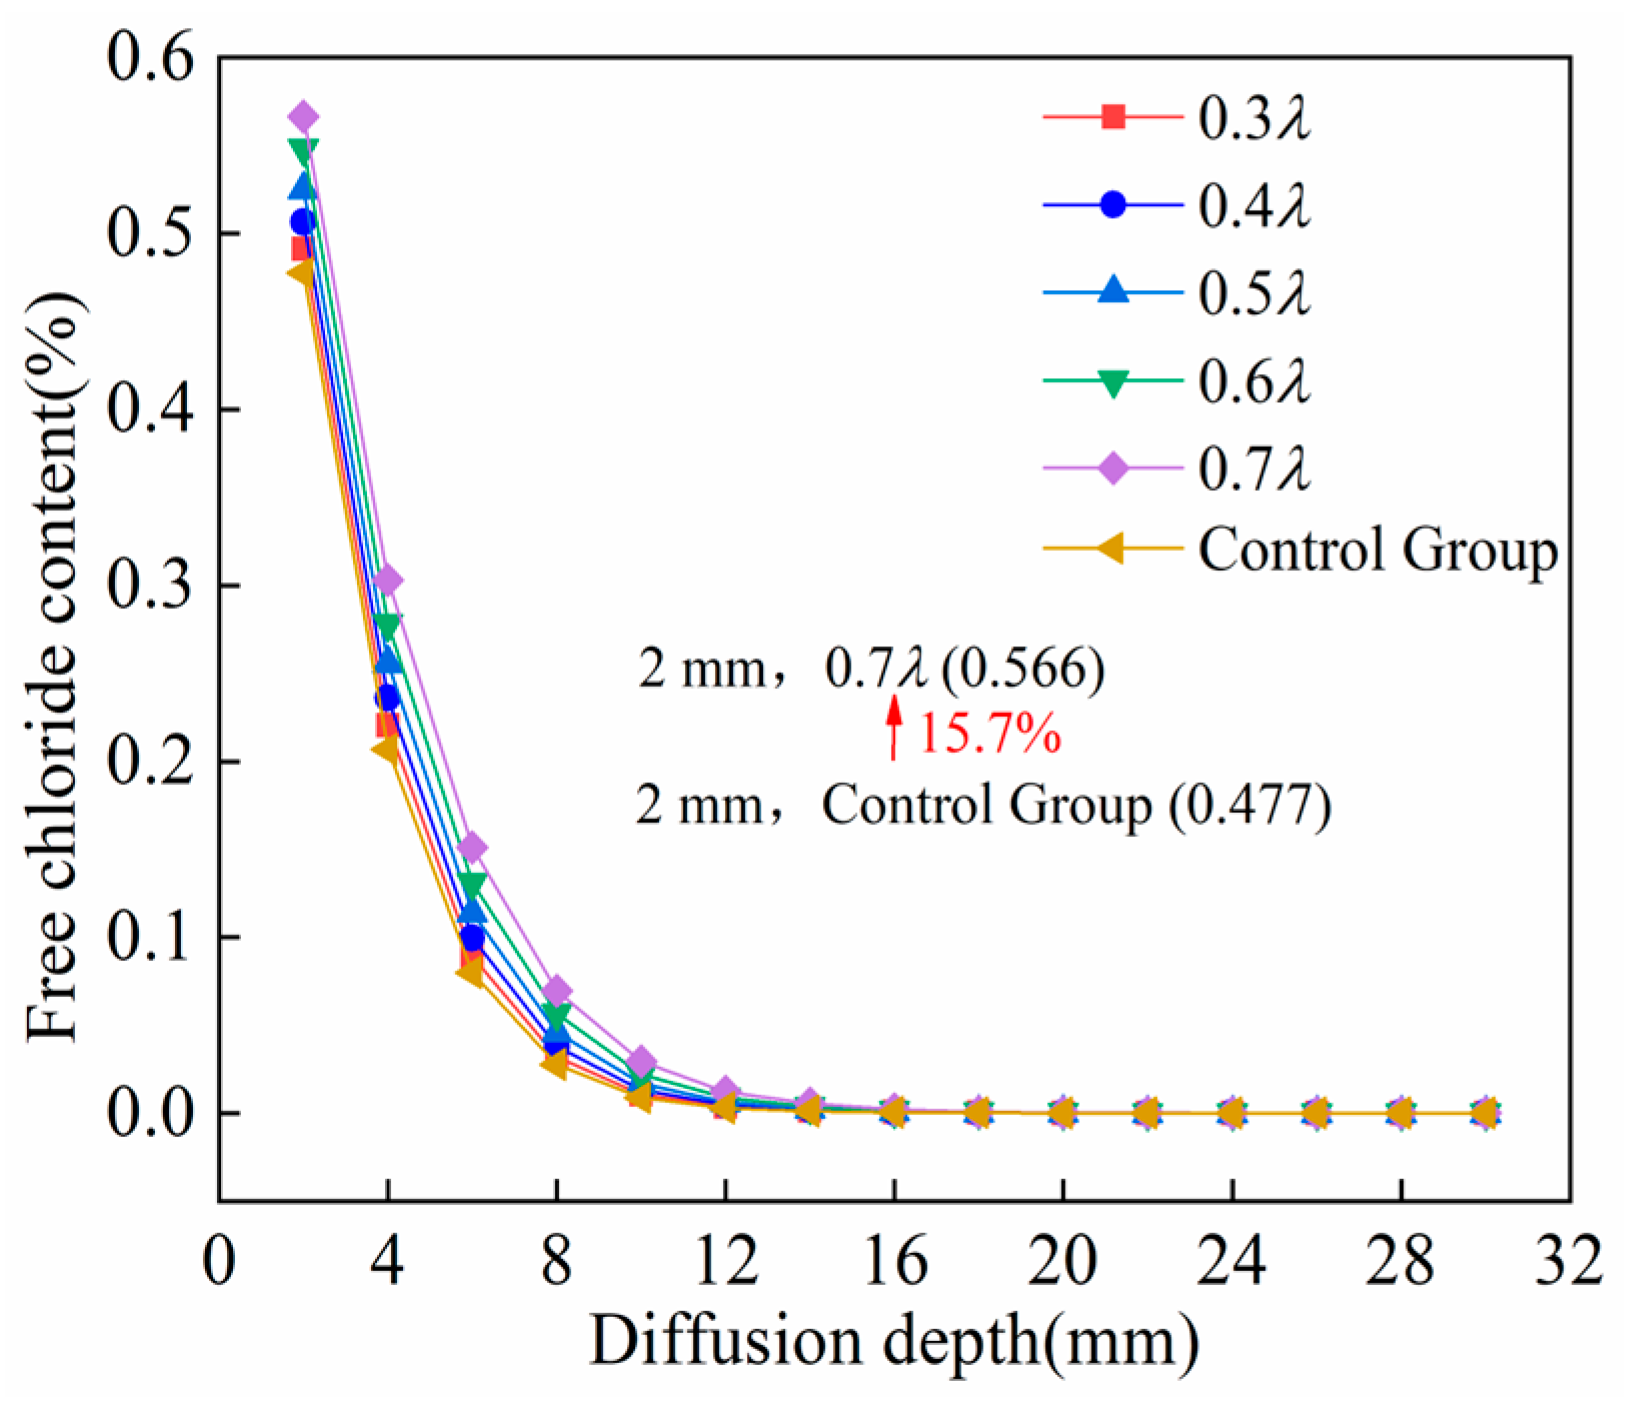
The tensile loading range for UHPC was varied from 0.3 to 0.7 times its ultimate tensile strength. The load-induced influence coefficients corresponding to different tensile stress ratios were calculated using Equation (12), and these coefficients were then used to modify the D of UHPC. The simulation results are presented in Figure 17.
Figure 17 shows that the FCC in UHPC increases progressively with the tensile stress ratio. When the ratio is below 0.4, the chloride content remains relatively stable, primarily because UHPC’s ultra-high compactness and extremely low porosity inhibit microcrack propagation under low tensile stress [59], which in turn maintains the stability of its pore structure. Additionally, the addition of steel fibers enhances the material’s tensile strength and toughness, further reducing its cracking tendency [60]. Conversely, when the tensile stress ratio exceeds 0.4, microcracking initiates in UHPC, creating preferential migration pathways for chloride diffusion and increasing the internal FCC and diffusion depth. Specifically, at a 2 mm depth, the FCC in UHPC with a tensile stress ratio of 0.7 is 15.7% higher than that in the unloaded control specimen.

5. Durability Design of UHPC-HPC Composite Beams

5.1. Durability Limit State

Reinforcement steel corrosion is a critical factor affecting the structural safety and durability. The duration of the initial corrosion period of steel bars is particularly critical, as it directly determines the overall service life of the structure.
Environmental variables (such as CC and humidity) are regarded as action variables, while those related to material durability properties (such as chloride penetration resistance and corrosion resistance) are regarded as resistance variables. The performance function of the durability limit state can be expressed as follows:
Z ( X ) = C cr γ C ( x , t ) = 0 ,
where X is a random variable composed of durability limit state parameters, X = D ,   C s ,   m ,   x ; γ is the partial safety factor of the chloride corrosion of a concrete structure; C cr is the chloride threshold value.
In terms of the safety of concrete-structure durability design, partial coefficients of D , C s , and C cr are introduced for the atmospheric zone. By incorporating the analytical solution of Fick’s second law, the durability limit state equation for UHPC members was established as
Z ( X ) = C cr γ C cr γ C 0 + ( γ C s C s C 0 ) 1 erf ( x 2 γ D cl D t ) = 0 ,
where γ D cl , γ C s , and γ cr are the partial coefficients of D , C s , and C cr , respectively. According to the values in the “Standard for Durability Design of Port and Waterway Engineering Structure” (JTS 153-2015) [61], they are 1.1, 1.2, and 1.1, respectively.
The expression of the minimum protective layer thickness of concrete members during service life was obtained from Equation (14):
x = 2 γ D cl D t erf 1 ( γ γ C s C s k cr C cr / γ C cr γ ( γ C s C s C 0 ) )

5.2. Example Verification of UHPC-HPC Composite Beam

(1)
Parameter setting
1)
Partial safety factor
By considering the inherent uncertainties in various actions and material properties, partial safety factors ensure the long-term reliability and security of the structure [62]. This approach effectively extends the service life and reduces the maintenance costs of the structure, thereby playing a crucial role in improving the durability and overall performance of the structure.
γ = γ dur γ mod γ cu γ cl γ ma
where γ dur is the durability importance coefficient of the structure or component, which should not be less than 1.1 for the structure or component with a design service life of 100 a or more, and should not be less than 1.0 for those with a service life within 100 a; γ mod is the uncertainty coefficient of the durability design model, taken as 1.0 in the chloride, carbonization, and freeze–thaw environments. γ cu is the influence coefficient of concrete curing and pouring, 1.0 for vibration-compacted concrete and 1.3 for non-vibration-compacted concrete; γ cl is the uncertainty of the design value of CC, generally taken as 1.3, and 1.1 for the flowing concrete. γ ma is the influence coefficient of maintenance level, which is used to characterize the maintenance or repair level of a specific structure during the service life. The value ranges from 0.8 to 1.0, depending on the maintenance requirements of the construction unit.
2)
C cr
The value of the C cr in UHPC remains inconclusive. Ma et al. [63] adopted the C cr of conventional concrete, suggesting 0.12% relative to the mass of UHPC when predicting the service life of UHPC thin-walled components. Huang et al. [64] determined that the critical chloride content in UHPC reached 1.2% (relative to the mass of cement) at the onset of steel reinforcement corrosion. These studies demonstrate that the C cr varies significantly due to different experimental methodologies and mixture designs. Based on Wu’s [65] statistical analysis of 276 datasets from concrete chloride exposure tests, the mean C cr was established as 0.75% relative to the weight of the binder weight (B); this value demonstrates reasonable reliability. Therefore, this study employs 0.75%B as the C cr threshold for UHPC, which serves as the basis for calculating the protective layer thickness in UHPC structural design.
3)
C s
The C s value varies across different specifications, standards, and research studies, as this parameter depends on multiple factors, including concrete composition, exposure duration, and testing methodologies. Wang et al. [66] considered a stabilization period of 30 years for C s when designing concrete structures with a 120-year service life. In reference [66], according to the time-dependent model of D for concrete under LTI, the D of concrete at 30 years was calculated to be 99.0% lower than its initial value. When its D value decreases by 99.0% relative to its initial D value, the corresponding stabilization time was determined to be 5.9 years.
4)
D
The D of a concrete structure varies due to factors such as exposure environment, admixture performance, and load type [67]. In this paper, the material influence coefficient, environmental influence coefficient, and load influence coefficient are introduced for the modification of D :
D d , m = k m k e k l D
where k m is the material influence coefficient. The material influence coefficient for UHPC with steel fiber is 1.0, and that of UHPC without steel fiber is 1.61, according to the ratio of D between UHPCSF0 and UHPC with the 2% steel fiber in Section 3.3 of this paper; k e is the environmental impact coefficient. In reference [49], the environmental impact coefficient for the atmospheric zone in a chloride environment is 1.10; k l is the load influence coefficient, taken as 1.0 under unload conditions.

5.3. Design of UHPC-HPC Composite Beam

The T-beams of a beam bridge, located in a Class I environmental category, have a height of 1.7 m, a beam spacing of 2.4 m, a 10 cm cast-in-place concrete layer, and a 10 cm asphalt pavement layer. The standard cross-section of this bridge is shown in Figure 18.
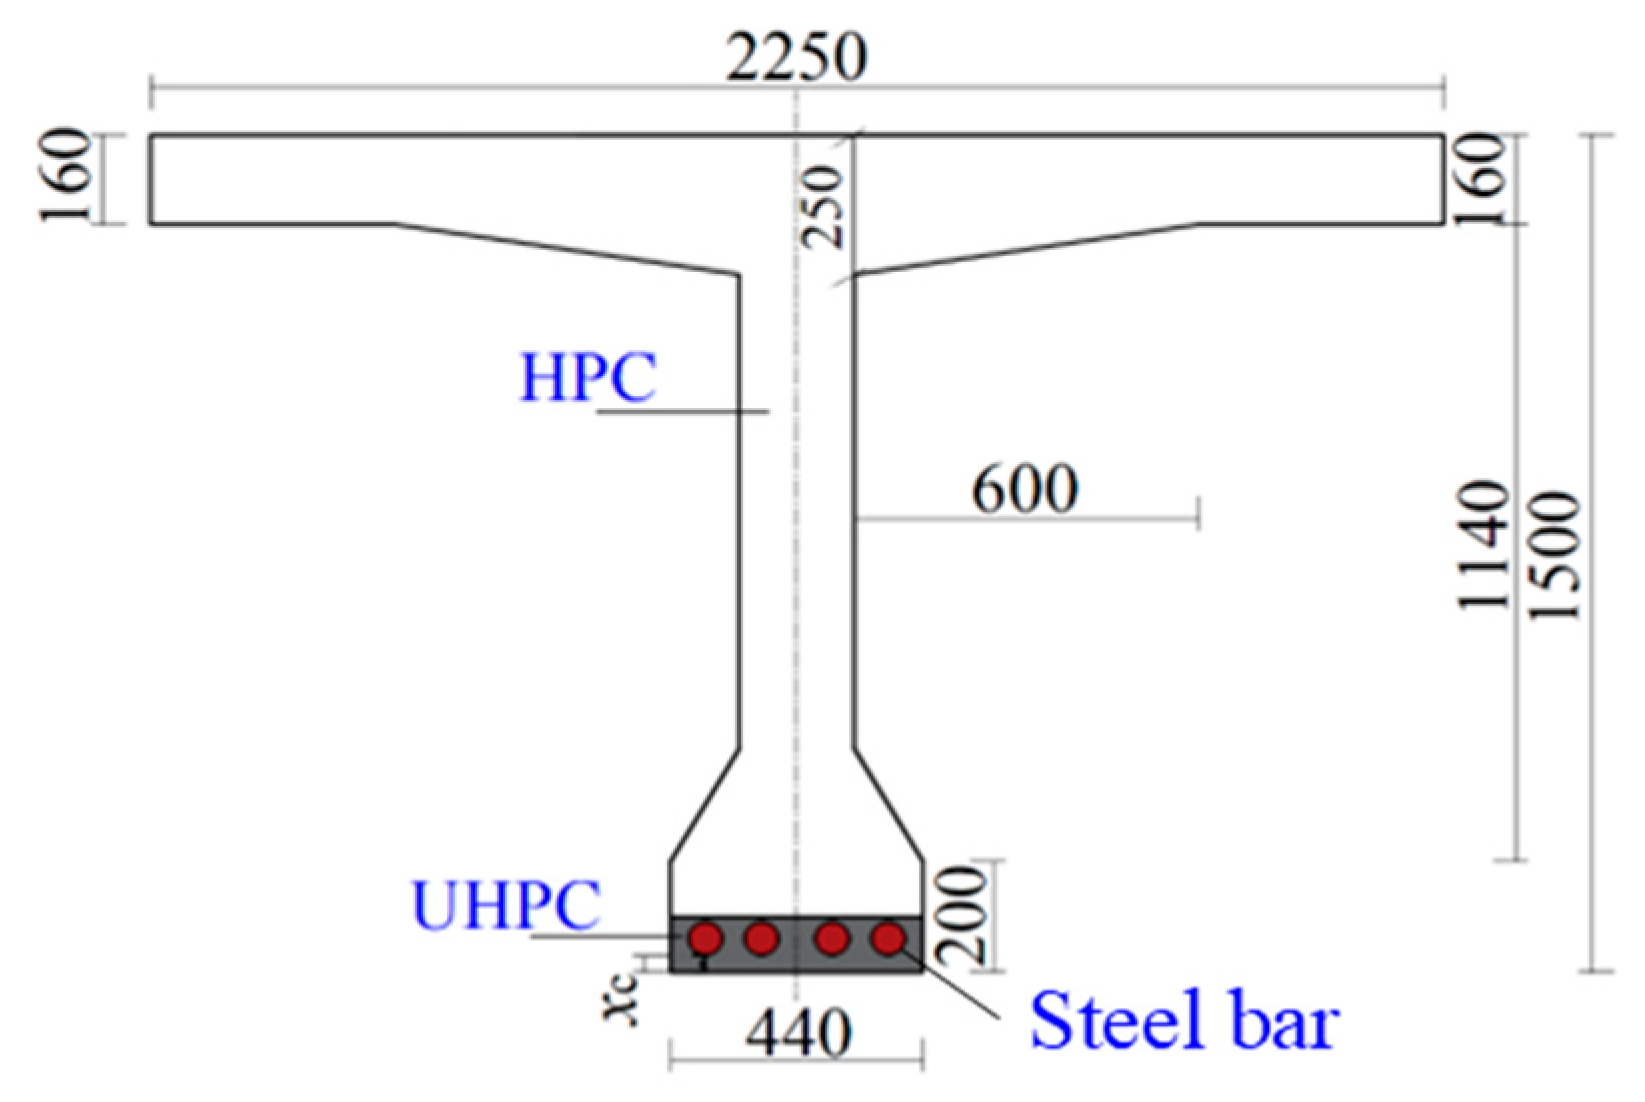
The superstructure of the bridge adopts a UHPC-HPC composite structural configuration, with UHPC used for the lower section of the beam and HPC utilized for the remaining cross-sectional components, as illustrated in Figure 19. The setting of UHPC in the tensile zone of the composite beam can enhance the toughness of the beam, inhibit crack propagation, and improve the section stiffness.
The D , C s , and C cr were selected as random variables, and the thickness of the UHPC protective layer was used as the durability design parameter. The coefficient of variation (a key statistical characteristic) for each random variable is determined primarily with reference to domestic and international sources. Table 5 provides the specific statistical results.
In China’s “Standard for design of concrete structure durability” (GB/T 50476-2019) [71], material degradation caused by environmental corrosion is defined as an irreversible serviceability limit state, which requires a target reliability index greater than 1.5. This study focuses on safety considerations and sets the target reliability index for the initial corrosion threshold of UHPC-HPC composite beams at 1.5 due to the excellent durability of UHPC. Taking the thickness of the UHPC protective layer as an unknown variable, and combining it with Equation (15), MATLAB software 2018 was used to calculate the minimum required thickness of the UHPC protective layer for structures with design service lives of 100, 150, and 200 years. These calculations were performed under the condition that the target reliability index for the steel bar corrosion threshold is 1.5. Table 6 presents the calculation results.
It can be seen from Table 6 that for UHPC-HPC composite beams with design service lives of 100, 150, and 200 years, the minimum required UHPC protective layer thicknesses are 30 mm, 37 mm, and 43 mm, respectively. When compared with the specifications in French codes, the calculated thickness of the UHPC protective layer for a 100-year service life in this study is larger. This discrepancy may be due to differences in factors such as UHPC composition materials, UHPC strength grade, C cr , and other factors. In China, the existing UHPC-related specifications or procedures are currently under preparation or approval. The draft Technical Specification for Ultra-High Performance Concrete Structure Design stipulates that for UHPC structures designed for a 100-year service life in chloride environments, the minimum protective layer thickness is 20 mm for ordinary UHPC structures and 25 mm for prestressed UHPC structures. The draft Technical Specification for Highway Ultra-high Performance Concrete (UHPC) Bridges specifies a minimum protective layer thickness of 25 mm for beams in a chloride environment. The draft Technical Specification for Ultra-High Performance Concrete Structures stipulated that, for a UHPC structure designed for a 50-year service life in chloride environments, the minimum protective layer thickness of the UHPC beam is 25 mm, increasing to 35 mm for a 100-year design.
In summary, the minimum protective layer thickness required for a UHPC structure with a 100-year design service life in a chloride environment ranges from 20 mm to 35 mm. The 30 mm value obtained in this study for a 100-year design service life falls within this range, demonstrating reasonable reliability and providing a reference for the ultra-long-life design of UHPC structures.

6. Conclusions

In this study, the chloride diffusion performance of UHPC under the action of LTI was investigated, and the effect of steel fibers on the D of UHPC was investigated through RCM tests. Time-dependent models for D and C s were established based on the experimental data. Finite-element numerical simulation revealed the effects of environmental factors on chloride diffusion behaviour. Furthermore, a calculation model of the protection thickness of UHPC structures under chloride salt erosion was established based on the performance design method. The main conclusions were as follows:
(1)
The D of UHPC with steel fibers was 37.9% lower than that of UHPC without steel fibers, indicating that steel fibers effectively mitigate chloride-induced corrosion. Under LTI, the FCC in UHPC exhibits a negative correlation with diffusion depth, while it shows a positive correlation with erosion time.
(2)
Under LTI, the D of UHPC decreased, and C s increased with prolonged corrosion time, with a maximum reduction in D of 91.0% and a maximum increase in FCC of 92.5%, respectively. The time-dependent models for D and C s follow power-law and logarithmic functions, respectively.
(3)
The chloride erosion resistance of UHPC decreases significantly (with marked FCC increase) under elevated surface temperatures, internal relative humidity levels exceeding 50%, and tensile stress ratios exceeding 0.4.
(4)
The calculated protective layer thickness for UHPC structures with a 100-year design service life is 30 mm, which falls within the 25–35 mm range specified in the UHPC structure draft technical specifications for the same service life; this result provides a reference for durability design of UHPC structures with different service life requirements.
(5)
Further research is required on the durability of UHPC and UHPC composite beams under multi-factor coupling conditions. This research on durability is crucial for consolidating and advancing the theoretical system of UHPC durability, specifically in chloride erosion environments.

Author Contributions

W.K.: Investigation, data curation, visualization, writing—original draft, validation. K.M.: Conceptualization, supervision, funding acquisition. W.L.: Investigation, data curation, formal analysis. S.S.: Methodology. All authors have read and agreed to the published version of the manuscript.

Funding

This research was funded by the China National Key Research and Development, grant number 2021YFB2601000.

Data Availability Statement

The data presented in this study are available on request from the corresponding author.

Acknowledgments

The authors would like to express their gratitude for the financial support provided by the China National Key Research and Development (No. 2021YFB2601000).

Conflicts of Interest

The authors declare that they have no known competing financial interests or personal relationships that could have appeared to influence the work reported in this paper.

References

  1. Lu, Z.; Li, J.; Xie, J.; Huang, P.; Xue, L. Durability of Flexurally Strengthened RC Beams with Prestressed CFRP Sheet under Wet–Dry Cycling in a Chloride-Containing Environment. Compos. Struct. 2021, 255, 112869. [Google Scholar] [CrossRef]
  2. Zhao, Y.; Yu, J.; Jin, W. Damage Analysis and Cracking Model of Reinforced Concrete Structures with Rebar Corrosion. Corros. Sci. 2011, 53, 3388–3397. [Google Scholar] [CrossRef]
  3. Mohammed, H.; Giuntini, F.; Sadique, M.; Shaw, A.; Bras, A. Polymer Modified Concrete Impact on the Durability of Infrastructure Exposed to Chloride Environments. Constr. Build. Mater. 2022, 317, 125771. [Google Scholar] [CrossRef]
  4. Wu, L.; Ju, X.; Liu, M.; Guan, L.; Ma, Y.; Li, M. Influences of Multiple Factors on the Chloride Diffusivity of the Interfacial Transition Zone in Concrete Composites. Compos. Part B Eng. 2020, 199, 108236. [Google Scholar] [CrossRef]
  5. Šavija, B.; Pacheco, J.; Schlangen, E. Lattice Modeling of Chloride Diffusion in Sound and Cracked Concrete. Cem. Concr. Compos. 2013, 42, 30–40. [Google Scholar] [CrossRef]
  6. Fares, M.; Villain, G.; Bonnet, S.; Palma Lopes, S.; Thauvin, B.; Thiery, M. Determining Chloride Content Profiles in Concrete Using an Electrical Resistivity Tomography Device. Cem. Concr. Compos. 2018, 94, 315–326. [Google Scholar] [CrossRef]
  7. Wang, Y.; Miao, Y.; Liu, Z.; Wang, F.; Wang, L.; Gao, S.; Jiang, J. Convection-Diffusion-Electromigration Coupled Numerical Simulation of Water and Chloride in Cement-Based Materials. Constr. Build. Mater. 2024, 426, 136149. [Google Scholar] [CrossRef]
  8. Noushini, A.; Castel, A.; Aldred, J.; Rawal, A. Chloride Diffusion Resistance and Chloride Binding Capacity of Fly Ash-Based Geopolymer Concrete. Cem. Concr. Compos. 2020, 105, 103290. [Google Scholar] [CrossRef]
  9. Ying, J.; Chen, W.; Chen, S.; Chen, B. Chloride Ion Diffusion in Recycled Concrete Containing Slag under Biaxial Compression. Constr. Build. Mater. 2024, 454, 139136. [Google Scholar] [CrossRef]
  10. Li, P.; Li, C.; Jia, C.; Li, D. A Comparative Study on Chloride Diffusion in Concrete Exposed to Different Marine Environment Conditions. J. Build. Eng. 2024, 94, 109845. [Google Scholar] [CrossRef]
  11. Yiğiter, H.; Yazıcı, H.; Aydın, S. Effects of Cement Type, Water/Cement Ratio and Cement Content on Sea Water Resistance of Concrete. Build. Environ. 2007, 42, 1770–1776. [Google Scholar] [CrossRef]
  12. Han, S.-H. Influence of Diffusion Coefficient on Chloride Ion Penetration of Concrete Structure. Constr. Build. Mater. 2007, 21, 370–378. [Google Scholar] [CrossRef]
  13. Zhou, Q.; Lu, C.; Wang, W.; Wei, S.; Lu, C.; Hao, M. Effect of Fly Ash and Sustained Uniaxial Compressive Loading on Chloride Diffusion in Concrete. J. Build. Eng. 2020, 31, 101394. [Google Scholar] [CrossRef]
  14. Shafikhani, M.; Chidiac, S.E. A Holistic Model for Cement Paste and Concrete Chloride Diffusion Coefficient. Cem. Concr. Res. 2020, 133, 106049. [Google Scholar] [CrossRef]
  15. Song, H.-W.; Lee, C.-H.; Ann, K.Y. Factors Influencing Chloride Transport in Concrete Structures Exposed to Marine Environments. Cem. Concr. Compos. 2008, 30, 113–121. [Google Scholar] [CrossRef]
  16. Petcherdchoo, A. Time Dependent Models of Apparent Diffusion Coefficient and Surface Chloride for Chloride Transport in Fly Ash Concrete. Constr. Build. Mater. 2013, 38, 497–507. [Google Scholar] [CrossRef]
  17. Bao, J.; Wei, J.; Zhang, P.; Zhuang, Z.; Zhao, T. Experimental and Theoretical Investigation of Chloride Ingress into Concrete Exposed to Real Marine Environment. Cem. Concr. Compos. 2022, 130, 104511. [Google Scholar] [CrossRef]
  18. Liu, Q.; Hu, Z.; Lu, X.; Yang, J.; Azim, I.; Sun, W. Prediction of Chloride Distribution for Offshore Concrete Based on Statistical Analysis. Materials 2020, 13, 174. [Google Scholar] [CrossRef]
  19. Liao, C.; Jin, H.; Liu, W.; Liu, J.; Zhong, S.; Xing, F.; Tang, L. Numerical and Experimental Analysis of Chloride and Iodide Transports in Concrete under Natural Diffusion. Constr. Build. Mater. 2023, 392, 131902. [Google Scholar] [CrossRef]
  20. Wang, J.; Yang, L.; Huang, J.; Yu, B. Service Life Prediction Model for Marine Concrete Structures Considering Structural Shape and Time-Dependent Behaviour. Ocean Eng. 2023, 285, 115276. [Google Scholar] [CrossRef]
  21. Yuan, S.; Liu, Z.; Tong, T.; Liu, J. Experimental, Analytical, and Numerical Investigation on Flexural Behavior of Hybrid Beams Consisting of Ultra-High Performance and Normal-Strength Concrete. Eng. Struct. 2022, 268, 114725. [Google Scholar] [CrossRef]
  22. Provete Vincler, J.; Sanchez, T.; Turgeon, V.; Conciatori, D.; Sorelli, L. A Modified Accelerated Chloride Migration Tests for UHPC and UHPFRC with PVA and Steel Fibers. Cem. Concr. Res. 2019, 117, 38–44. [Google Scholar] [CrossRef]
  23. Chuang, M.L.; Huang, W.H. Durability Analysis Testing on Reactive Powder Concrete. Adv. Mater. Res. 2013, 811, 244–248. [Google Scholar] [CrossRef]
  24. Roux, N.; Andrade, C.; Sanjuan, M.A. Experimental Study of Durability of Reactive Powder Concretes. J. Mater. Civ. Eng. 1996, 8, 1–6. [Google Scholar] [CrossRef]
  25. Dobiáš, D.; Pernicová, R.; Mandlík, T. Water Transport Properties and Depth of Chloride Penetration in Ultra High Performance Concrete. Key Eng. Mater. 2016, 711, 137–142. [Google Scholar] [CrossRef]
  26. Voo, Y.; Foster, S. Characteristics of Ultra-High Performance ‘Ductile’ Concrete and Its Impact on Sustainable Construction. IES J. Part A Civ. Struct. Eng. 2010, 3, 168–187. [Google Scholar] [CrossRef]
  27. Yang, J.; Chen, B.; Su, J.; Xu, G.; Zhang, D.; Zhou, J. Effects of Fibers on the Mechanical Properties of UHPC: A Review. J. Traffic Transp. Eng. (Engl. Ed.) 2022, 9, 363–387. [Google Scholar] [CrossRef]
  28. Park, S.; Wu, S.; Liu, Z.; Pyo, S. The Role of Supplementary Cementitious Materials (SCMs) in Ultra High Performance Concrete (UHPC): A Review. Materials 2021, 14, 1472. [Google Scholar] [CrossRef]
  29. Abbas, S.; Soliman, A.M.; Nehdi, M.L. Exploring Mechanical and Durability Properties of Ultra-High Performance Concrete Incorporating Various Steel Fiber Lengths and Dosages. Constr. Build. Mater. 2015, 75, 429–441. [Google Scholar] [CrossRef]
  30. Algaifi, H.A.; Bakar, S.A.; Sam, A.R.M.; Abidin, A.R.Z.; Shahir, S.; AL-Towayti, W.A.H. Numerical Modeling for Crack Self-Healing Concrete by Microbial Calcium Carbonate. Constr. Build. Mater. 2018, 189, 816–824. [Google Scholar] [CrossRef]
  31. Pourjahanshahi, A.; Madani, H. Chloride Diffusivity and Mechanical Performance of UHPC with Hybrid Fibers under Heat Treatment Regime. Mater. Today Commun. 2021, 26, 102146. [Google Scholar] [CrossRef]
  32. Chen, M.-Y.; Chen, R.-P.; Chen, Y.-Q.; Ma, X.-Y.; Kang, X. Stray Current Induced Chloride Ion Transport and Corrosion Characteristics of Cracked Ultra-High Performance Concrete. Constr. Build. Mater. 2023, 398, 132536. [Google Scholar] [CrossRef]
  33. Pyo, S.; Koh, T.; Tafesse, M.; Kim, H.-K. Chloride-Induced Corrosion of Steel Fiber near the Surface of Ultra-High Performance Concrete and Its Effect on Flexural Behavior with Various Thickness. Constr. Build. Mater. 2019, 224, 206–213. [Google Scholar] [CrossRef]
  34. Li, T.; Yan, Y.; Xu, C.; Han, X.; Liu, Y.; Qi, H.; Ming, Y. Effect of Hollow 304 Stainless Steel Fiber on Corrosion Resistance and Mechanical Properties of Ultra-High Performance Concrete (UHPC). Materials 2023, 16, 3612. [Google Scholar] [CrossRef]
  35. Lü, C.; Liu, D.; Ding, Y.; Lü, X.; Zhou, Z.; Mu, S.; Sun, Y. Effect of Early Dry-Wet Cycles on the Mechanical Performance and Microstructure Characteristics of Ultra-High Performance Concrete (UHPC) with Varying Metakaolin (MK) Contents. Constr. Build. Mater. 2025, 490, 142471. [Google Scholar] [CrossRef]
  36. Niu, L.; Zhang, S. Performance of Cracked Ultra-high-performance Fiber-reinforced Concrete Exposed to Dry-wet Cycles of Chlorides. Adv. Mater. Sci. Eng. 2021, 2021, 4625972. [Google Scholar] [CrossRef]
  37. Sohail, M.G.; Kahraman, R.; Al Nuaimi, N.; Gencturk, B.; Alnahhal, W. Durability Characteristics of High and Ultra-High Performance Concretes. J. Build. Eng. 2021, 33, 101669. [Google Scholar] [CrossRef]
  38. Zhou, Q.; Mei, K.; Wang, F.; Li, B.; Xu, S.; Sun, S. Complex Salt Frost Resistance of Pre-Damaged Reinforced HPC Columns Wrapped with BFRP Sheets. Arch. Civ. Mech. Eng. 2024, 25, 34. [Google Scholar] [CrossRef]
  39. Wang, Y.; Fu, K. Comparisons of Instantaneous Chloride Diffusion Coefficients Determined by RCM Method and Chloride Natural Diffusion Test. Constr. Build. Mater. 2019, 223, 595–604. [Google Scholar] [CrossRef]
  40. GB/T 50082-2024; Standard for Test Methods of Long-Term Performance and Durability of Concrete. China Architecture & Building Press: Beijing, China, 2024.
  41. CEN-EN 12390-11; Testing Hardened Concrete—Part 11: Determination of the Chloride Resistance of Concrete, Unidirectional Diffusion. BSI Standards Limited: Chiswick, UK, 2015.
  42. C1202; Standard Test Method for Electrical Indication of Concrete’s Ability to Resist Chloride Ion Penetration. American Society for Testing and Materials: Conshohocken, PA, USA, 2022.
  43. Yu, H.; Li, L.; Ma, H.; Lu, Y.; Hu, D. Study on Time Range of Definite Integral in Derivation Process of Chloride Ion Diffusion Theoretical Model of Concrete. Constr. Build. Mater. 2024, 428, 135876. [Google Scholar] [CrossRef]
  44. Liu, J.; Jia, Y.; Wang, J. Calculation of Chloride Ion Diffusion in Glass and Polypropylene Fiber-Reinforced Concrete. Constr. Build. Mater. 2019, 215, 875–885. [Google Scholar] [CrossRef]
  45. Wang, J.; Kim, Y.J. Evolutionary Characteristics of Microstructural Hydration and Chloride Diffusion in UHPC. Mater. Des. 2023, 225, 111528. [Google Scholar] [CrossRef]
  46. Dong, L.; Yang, Y.; Liu, Z.; Yang, T.; Xue, C.; Shao, R.; Wu, C. Effect of Chloride Ion Migration Behaviour on the Microstructure and Mechanical Properties of Ultra-High Performance Concrete: A Review. J. Build. Eng. 2024, 82, 108233. [Google Scholar] [CrossRef]
  47. Ou, Y.; Xu, M.; Chen, D.; Jiang, M.; Xiao, L.; Mei, G. Effect of Reverse Water Pressure on Chloride Penetration within Finite Concrete during Drying-Wetting Cycles. Ocean Eng. 2022, 257, 111606. [Google Scholar] [CrossRef]
  48. Wu, L.; Wang, Y.; Wang, Y.; Ju, X.; Li, Q. Modelling of Two-Dimensional Chloride Diffusion Concentrations Considering the Heterogeneity of Concrete Materials. Constr. Build. Mater. 2020, 243, 118213. [Google Scholar] [CrossRef]
  49. Konečný, P.; Lehner, P.; Ghosh, P.; Morávková, Z.; Tran, Q. Comparison of Procedures for the Evaluation of Time Dependent Concrete Diffusion Coefficient Model. Constr. Build. Mater. 2020, 258, 119535. [Google Scholar] [CrossRef]
  50. Zhou, S. Analytical Model for Square Root Increase of Surface Chloride Concentration and Decrease of Chloride Diffusivity. J. Mater. Civ. Eng. 2016, 28, 4015181. [Google Scholar] [CrossRef]
  51. Pack, S.-W.; Jung, M.-S.; Song, H.-W.; Kim, S.-H.; Ann, K.Y. Prediction of Time Dependent Chloride Transport in Concrete Structures Exposed to a Marine Environment. Cem. Concr. Res. 2010, 40, 302–312. [Google Scholar] [CrossRef]
  52. Guo, R.; Wang, J.; Yuan, Y.; Li, D.; Jin, Y.; Shan, H. Interpretation of Dual Time-Dependent Chloride Diffusion in Concrete Based on Physical Information Neural Networks. Case Stud. Constr. Mater. 2024, 21, e03769. [Google Scholar] [CrossRef]
  53. Yang, L.; Wang, L.; Yu, B. Time-Varying Behavior and Its Coupling Effects with Environmental Conditions and Cementitious Material Types on Surface Chloride Concentration of Marine Concrete. Constr. Build. Mater. 2021, 303, 124578. [Google Scholar] [CrossRef]
  54. Page, C.L.; Short, N.R.; El Tarras, A. Diffusion of Chloride Ions in Hardened Cement Pastes. Cem. Concr. Res. 1981, 11, 395–406. [Google Scholar] [CrossRef]
  55. Lyu, W.; Poh, L.H. Temperature Effect on Chloride Transport in Cement-Based Materials. J. Build. Eng. 2025, 111, 113311. [Google Scholar] [CrossRef]
  56. Bažant, Z.P.; Najjar, L.J. Nonlinear Water Diffusion in Nonsaturated Concrete. Matér. Constr. 1972, 5, 3–20. [Google Scholar] [CrossRef]
  57. Jin, H.; Fan, X.; Li, Z.; Zhang, W.; Liu, J.; Zhong, D.; Tang, L. An Experimental Study on the Influence of Continuous Ambient Humidity Conditions on Relative Humidity Changes, Chloride Diffusion and Microstructure in Concrete. J. Build. Eng. 2022, 59, 105112. [Google Scholar] [CrossRef]
  58. Li, W. Simulation of Chloride Ions Erosion in Concrete Under Loadings and Environmental Factors. Ph.D. Thesis, Southeast University, Nanjing, China, 2019. [Google Scholar] [CrossRef]
  59. Zhong, R.; Ai, X.; Pan, M.; Yao, Y.; Cheng, Z.; Peng, X.; Wang, J.; Zhou, W. Durability of Micro-Cracked UHPC Subjected to Coupled Freeze-Thaw and Chloride Salt Attacks. Cem. Concr. Compos. 2024, 148, 105471. [Google Scholar] [CrossRef]
  60. Su, Y.; Li, J.; Wu, C.; Wu, P.; Li, Z.-X. Effects of Steel Fibres on Dynamic Strength of UHPC. Constr. Build. Mater. 2016, 114, 708–718. [Google Scholar] [CrossRef]
  61. JTS 153-2015; Standard for Durability Design of Port and Waterway Engineering Structure. China Communications Press: Beijing, China, 2015.
  62. Chen, A.; Feng, S.; Ma, R. Study on design method of durability of concrete bridge based on partial safety factor. J. Highw. Transp. Res. Dev. 2014, 31, 64–70. [Google Scholar] [CrossRef]
  63. Ma, X.; Xue, H.; Qi, J.; Liu, G. Service life prediction of ultra-high performance concrete based on chloride ion permeation mechanism. J. Shenyang Jianzhu. Univ. Nat. Sci. 2018, 34, 22–30. [Google Scholar]
  64. Huang, W.; Chen, Z.; Chen, R.; Ying, F.; Huang, Q.; Liu, S. Passivation behavior of steel bar in ultra-high performance concrete under coupling effect of different internal chloride salts. J. China. Ceram. Soc. 2023, 51, 1928–1937. [Google Scholar] [CrossRef]
  65. Wu, L. Chloride Penetration and Durability Assessment of Harbor Concrete Structures. Ph.D. Thesis, Shanghai Jiaotong University, Shanghai, China, 2016. [Google Scholar] [CrossRef]
  66. Wang, S.; Su, Q.; Fan, Z.; Li, Q.; Zhou, X.; Li, K. Durability design principle and method for concrete structures in Hong Kong-Zhuai-Macau sea link project. China Civ. Eng. J. 2014, 47, 1–8. [Google Scholar] [CrossRef]
  67. Xu, Y.; Gao, Y.; Yu, H.; Ma, H.; Xu, M.; Xu, Z.; Feng, T. Time Variation Law of Chlorine Diffusion Coefficient of Marine Concrete Structures in Tidal Zone and Its Influence on Service Life. J. Build. Eng. 2023, 76, 107379. [Google Scholar] [CrossRef]
  68. Wu, Q. Research on Flexural RC Components Exposed to Marine Environments: Durability and Life Prediction. Ph.D. Thesis, Nanjing University of Aeronautics and Astronautics, Nanjing, China, 2010. [Google Scholar] [CrossRef]
  69. Firodiya, P.K.; Sengupta, A.K.; Pillai, R.G. Evaluation of Corrosion Rates of Reinforcing Bars for Probabilistic Assessment of Existing Road Bridge Girders. J. Perform. Constr. Facil. 2015, 29, 4014067. [Google Scholar] [CrossRef]
  70. Vu, K.A.T.; Stewart, M.G. Structural Reliability of Concrete Bridges Including Improved Chloride-Induced Corrosion Models. Struct. Saf. 2000, 22, 313–333. [Google Scholar] [CrossRef]
  71. GB/T 50476-2019; Standard for Design of Concrete Structure Durability. China Architecture & Building Press: Beijing, China, 2019.
  72. NF P 18-710; National Addition to Eurocode 2-Design of Concrete Structures: Specific Rules for Ultra-High Performance Fibre-Reinforced Concrete (UHPFRC). French Standardization Association: Paris, France, 2016.
Figure 1. Dimensions of UHPC specimens under different erosion experiments (unit: mm): (a) LTI; (b) RCM.
Buildings 15 03569 g001
Figure 2. UHPC under the action of LTI: (a) LTI device; (b) Schematic of LTI device.
Buildings 15 03569 g002
Figure 3. RCM experimental process: (a) Chloride migration; (b) Specimen cutting.
Buildings 15 03569 g003
Figure 4. Numbering of the color change boundary lines.
Buildings 15 03569 g004
Figure 5. Determination of chloride content in UHPC: (a) Drilling for powder; (b) Powder collection; (c) Powder solution to be tested; (d) Determination of chloride.
Buildings 15 03569 g005
Figure 6. FCC in UHPC.
Buildings 15 03569 g006
Figure 7. Comparison of UHPC specimens before and after spraying AgNO3 solution: (a) Before spraying AgNO3 solution; (b) After spraying AgNO3 solution.
Buildings 15 03569 g007
Figure 8. D of UHPC under different erosion durations.
Buildings 15 03569 g008
Figure 9. C s of UHPC under different erosion times.
Buildings 15 03569 g009
Figure 10. D of UHPC under different erosion durations.
Buildings 15 03569 g010
Figure 11. C s of UHPC under different erosion durations.
Buildings 15 03569 g011
Figure 12. UHPC solid model construction.
Buildings 15 03569 g012
Figure 13. UHPC solid model mesh subdivision: (a) Grid sensitivity analysis; (b) Mesh subdivision.
Buildings 15 03569 g013
Figure 14. Comparison of measured and simulated values of FCC in UHPC.
Buildings 15 03569 g014
Figure 15. FCC in UHPC at different temperatures.
Buildings 15 03569 g015
Figure 16. FCC in UHPC at different relative humidity levels.
Buildings 15 03569 g016
Figure 17. FCC in UHPC at different tensile stress ratios.
Buildings 15 03569 g017
Figure 18. Bridge standard cross-sectional view (unit: mm): (a) Cross-section; (b) Three-dimensional diagram.
Buildings 15 03569 g018
Figure 19. Structure size of composite beam (unit: mm).
Buildings 15 03569 g019
Table 1. Mix ratio of UHPC.
Premix
(kg·m−3)
Water Reducer
(kg·m−3)
Water
(kg·m−3)
Steel Fibers
(kg·m−3)
223216199195
Table 2. Experimental parameters.
ExperimentSolution ConcentrationMaterialSample NumberErosion Methods (d)
RCM10.0% NaClUHPCSF03/
UHPCSF23/
Diffusion experiment3.5% NaClUHPCSF25 × 5LTI 60, 120, 180, 240, 300
Table 3. D of UHPC with and without steel fibers.
Specimen D   ( × 10 12 m 2 s - 1 ) Mean Value
UHPCSF08.68.48.38.43
UHPC5.44.65.75.23
Table 4. Value of U [54].
Water–Cement RatioU/(KJ/mol)
0.441.8 ± 4.0
0.544.6 ± 4.3
0.632.0 ± 2.4
Life365 model35.0
Table 5. Statistical results of random variables.
VariableDistribution PatternMean ValueCoefficient of VariationStandard Deviation
D lognormal distribution1.130 × 10−14 m2/s0.1 [68]0.80
C s 1.00%B0.5 [69]0.50
C cr 0.75%B0.2 [70]0.15
Table 6. Minimum UHPC protective layer thickness for different design service lives.
Design Service Life (a)100150200100 [72]
x (mm)30374325
Disclaimer/Publisher’s Note: The statements, opinions and data contained in all publications are solely those of the individual author(s) and contributor(s) and not of MDPI and/or the editor(s). MDPI and/or the editor(s) disclaim responsibility for any injury to people or property resulting from any ideas, methods, instructions or products referred to in the content.