Article

A Novel Optimal Control Method for Building Cooling Water Systems with Variable Speed Condenser Pumps and Cooling Tower Fans

1
School of Smart Constructionand Energy Engineering, Hunan Institute of Engineering, Xiangtan 411104, China
2
Guangzhou Shijie Energy-Saving Technology Co., Ltd., Guangzhou 510630, China
*
Authors to whom correspondence should be addressed.
Buildings 2025, 15(19), 3568; https://doi.org/10.3390/buildings15193568
Submission received: 8 September 2025 / Revised: 23 September 2025 / Accepted: 28 September 2025 / Published: 2 October 2025

Abstract

The optimal control of cooling water systems is of great significance for energy saving in chiller plants. Previously optimal control methods optimize the flow rate, temperature or temperature difference setpoints but cannot control pumps and cooling tower fans directly. This study proposes a direct optimal control method for pumps and fans based on derivative control strategy by decoupling water flow rate optimization and airflow rate optimization, which can make the total power of chillers, pumps and fans approach a minimum. Simulations for different conditions were performed for the validation and performance analysis of the optimal control strategy. The optimization algorithms and implementation methods of direct optimal control were developed and validated by experiment. The simulation results indicate that total power approaches a minimum when the derivative of total power with respect to water/air flow rate approaches zero. The power-saving rate of the studied chiller plant is 13.2% at a plant part-load ratio of 20% compared to the constant-speed pump/fan mode. The experimental results show that the direct control method, taking power frequency as a controlled variable, can make variable frequency drives regulate their output frequencies to be equal to the optimized power frequencies of pumps and fans in a timely manner.

1. Introduction

Buildings consume 40% of global primary energy and contribute to in excess of 30% of greenhouse gas emissions [1]. The heating, ventilation and air conditioning systems contribute a large portion of building energy consumption [2,3]. Monitoring data in 2023 showed that the electricity consumption for air conditioning accounts for 33.8% of total building electricity consumption in Shanghai, the largest city in China [4]. The optimal control of air conditioning system operation is essential for improving a system’s energy efficiency.
A cooling water system is crucial for the heat rejection of a chiller plant. The operational optimization of a cooling water system is of great significance for the energy performance of a chiller plant. Model-based optimization is the most effective approach for the operational optimization of chiller plants [5]. Much research has been carried out regarding the model-based operational optimization of cooling water systems.
The success of optimal control is highly reliant on the accuracy of energy models for chillers, pumps and cooling towers [6,7]. Previous research has employed empirical, [8,9,10,11,12], data-driven [7,13,14,15] and physics-based modelling approaches [16,17,18,19]. Empirical models, also called black box models, have low accuracy because they can only be used within the range of conditions for which they were fit [20]. Data-driven models are built based on data. Machine or statistical learning algorithms are used to find the relationship between input data and output data. The generalization ability of data-driven models is the major barrier for their real-world application [7]. If the diversity of history data for model development is limited, the developed data-driven models will result in a large prediction error [7]. Relatively speaking, physical models were used more frequently by researchers due to their physical basis.
It should be noted that some energy models for condenser pumps were based on similarity law [5,8,12], which is inapplicable to an open-loop water circulation system. The existing equipment-based optimization models need many measured data and must be solved by a specific algorithm (such as genetic algorithm [11], particle swarm optimization algorithm [7,10], ant lion optimizer algorithm [8], etc.) under certain constraints using supervisory computers, making the optimization process time-consuming and the control process complicated [6].
Most optimized variables in the previous research are cooling water flow rate (CWFR) [9,10,11,12,18], airflow rate of cooling tower (ARCT) [9,10,11], cooling water supply temperature [15,16,18,19] or temperature difference of cooling water [7,13]. However, the direct control parameter for pumps and fans is power frequency, rather than the setpoints of flow rate, temperature or temperature difference. The optimized setpoints are only intermediate parameters. Corresponding control circuits, such as PID controllers, should be used to achieve the optimized setpoints. As for the control of flow rate, water temperature or temperature difference, significant control deviation and oscillation are inevitable due to the hysteresis of the controlled variable. The inconvenience of realizing optimized setpoints is a barrier for the successful practical application of optimal control systems for cooling water systems.
In this study, a novel optimal control method for a cooling water system by decoupling water flow rate optimization and airflow rate optimization was proposed. Derivative control strategies for operational optimization of cooling water systems were developed and validated by simulation. Direct control methods for condenser pumps and cooling tower fans were developed and validated by experiment. The proposed method can avoid complicated control systems and time-consuming solutions of optimization models and also can avoid the inconvenience of control strategies with intermediate parameters.

2. Description of the Studied Cooling Water System

In this study, the cooling water system of a hotel’s chiller plant is used as the case study. Figure 1 is the schematic of the studied cooling water system. The chiller plant is equipped with two identical chillers, two identical cooling towers, two identical condenser pumps and two identical chilled water pumps. Each chiller’s rated cooling capacity and CWFR are 1758 kW (500 RT) and 88 kg/s, respectively. The cooling capacity of each chiller can be adjusted between 10% and 100% continuously. Each cooling tower has a nominal heat rejection rate of 2641.8 kW (700 RT) at 35 °C entering water temperature, 29.4 °C leaving water temperature and 26.7 °C wet-bulb temperature. Considering that local wet-bulb temperature is significantly higher than the design condition most of the time, the nominal heat rejection rate of the cooling tower has to be larger than the design heat rejection load.
In view of the fact that the hotel’s chiller plant operates at low part-load ratio (PLR) most of the time, the pumps and tower fans are all equipped with variable frequency drives (VFD). The operation of each pump is dedicated to the operation of the correlated chiller that it serves. The two cooling towers are operated in all-run mode until their power frequency is adjusted to the lower limit (25 Hz).

3. Formulation of the Optimal Control Method

3.1. Control Strategy

The task of optimal control of variable-speed condenser pumps and cooling tower fans is to minimize the total power of chillers, pumps and fans. The variations of CWFR and ARCT bring reverse impacts on chiller power and pump/fan power. The increase in CWFR helps to reduce condensing temperature and chiller power, and the increase in ARCT helps to decrease the outlet water temperature of cooling tower and the chiller power. With the increase in CWFR and ARCT, the chiller power decreases while the pump and fan powers increase. In contrast, the chiller power increases while the pump and fan powers decrease with the decrease in CWFR and ARCT. When flow rate varies from low to high, the total power decreases at a relatively low flow rate and increases at a relatively high flow rate. There exist optimal values of CWFR and ARCT that minimize the total power at a certain PLR and working conditions.
According to the extreme value theorem, a local extreme value will occur at the point where the derivative is zero. The total powers of chillers and pumps/fans approach the minimum value when the derivatives of total power with respect to water/air flow rates approach zero. The controller determines the optimal CWFR and ARCT that make the derivatives approach zero based on current building cooling load and working conditions. If the current derivative value is positive, the CWFR and ARCT should be reduced to make the derivative value approach zero. In contrast, the CWFR and ARCT should be increased if the derivative value is negative.

3.2. Calculation Method for the Derivative of Total Power

The derivative of total power with respect to CWFR can be expressed by the sum of the derivatives of chiller power and pump power, as represented by
N t o t M = N c M + N p M
where Nc is power of a chiller, Np is power of a pump, Ntot is total power kW, and M is the CWFR of a chiller, kg/s.
It is necessary to establish an accurate chiller power model that can reflect the relationship between chiller power and CWFR. Chiller power models can be classified into three categories: mechanistic models, empirical models and physical models. Mechanistic models are used to simulate the transient and detailed behavior of a chiller and are usually used for chiller design by simulation using a software system. Empirical models have limited accuracy and generalization ability, thus leading to considerable prediction errors. According to the existing literature, even the most sophisticated empirical chiller power model can not reflect the relationship between chiller power and CWFR. The empirical chiller power model suggested by the ASHRAE handbook and used in DOE-2 building simulation software is a function of cooling load, outlet water temperature of evaporator and inlet water temperature of condenser [21].
In contrast to empirical models that have no physical basis, physical models are based on fundamental thermodynamic or heat transfer considerations [21]. Gordon and Ng proposed a physical chiller power model based on first principles of thermodynamics and linearized irreversible losses [20,22]. The original Gordon–Ng model took no account of the heat loss from the compressor. In this study, we improved the original Gordon–Ng model by considering the heat loss from the compressor. The improved Gordon–Ng model is a three-parameter model in the following form:
T e o 1 + ( 1 f ) N c Q e T c i ( 1 f ) N c + Q e T c i c w M 1 = C 1 T e o Q e + C 2 T c i T e o T c i Q e + C 3 ( 1 f ) N c + Q e T c i
where Qe is the cooling load of a chiller (kW); Teo is outlet water temperature of evaporator (K); Tci is inlet water temperature of condenser (IWTC) (K); cw is specific heat of water; f is the proportion of heat loss from compressor to the power of compressor; and C1, C2 and C3 are model parameters.
Rewriting the above implicit equation into an explicit equation, we can get the following equation:
N c = C 1 T e o T c i Q e + T c i T e o 1 + C 2 Q e + Q e C 3 + 1 c w M ( 1 f ) T e o Q e 1 c w M C 3
The derivative of chiller power with respect to CWFR can be expressed as
N c M = C 1 T e o T c i Q e T c i T e o 1 + C 2 Q e T e o c w M 2 ( 1 f ) T e o Q e 1 c w M C 3 2
Since the cooling water system is an open circulation loop, the flow resistance is given by
H = H 0 + k ρ 2 M 2
where H0 is the static head that condenser pumps need to lift (mH2O), and k is the fluid dynamic impedance of the cooling water loop (s2/m5). The pump power can be calculated by
N p = M g H 0 + k ρ 2 M 2 ρ η p η m
where ηp and ηm are pump efficiency and motor efficiency, respectively. The derivative of pump power with respect to CWFR can be derived as
N p M = g H 0 + 3 g k ρ 2 M 2 ρ η p η m
Thus, the derivative of total power with respect to CWFR can be calculated by
N t o t M = C 1 T e o T c i Q e T c i T e o 1 + C 2 Q e T e o c w M 2 ( 1 f ) T e o Q e 1 c w M C 3 2 + g H 0 + 3 g k ρ 2 M 2 ρ η p η m
Letting the derivative of total power with respect to CWFR equal zero, the optimal CWFR can be determined by solving the following equation with M as a unknown:
C 1 T e o T c i Q e + T c i T e o 1 + C 2 Q e + T e o c w M 2 ( 1 f ) T e o Q e 1 c w M C 3 2 = g H 0 + 3 g k ρ 2 M 2 ρ η p η m
The constant term of Equation (9) including Tci is a linear expression like λTci. The proposed method optimizes ARCT after CWFR optimization, and the adjustment of ARCT according to the optimized value may result in the change in Tci in turn. Since the adjustment rate of an adjustment of ARCT is limited, the change in Tci resulting from an adjustment of ARCT is no more than 2 °C. When Tci varies from 25 °C (298 K) to 37 °C (310 K) in a cooling season, the corresponding change rate of constant term including Tci in Equation (9) is no more than 0.67%. Such a minor change in the constant term including Tci hardly affects the solution of Equation (9). The impact of changes in Tci on the optimal CWFR can be neglected. It will be validated in Section 4.2 that the optimal CWFR at the operating point of approaching zero derivative is not affected by the changes in IWTC (i.e., Tci). Therefore, we can optimize the ARCT based on the obtained optimal CWFR.
The IWTC equals the outlet water temperature of the cooling towers and can be calculated by the cooling tower model proposed by Jin et al. [23].
T c i = T c o b 3 m b 2 1 c w + c w b 1 m G b 2 ( T c o T w b )
where m is water flow rate of a cooling tower; G is airflow rate of a cooling tower; Tco is the outlet water temperature of condenser; Twb is outdoor wet-bulb temperature; and b1, b2 and b3 are model parameters. Considering that the chiller COP (coefficient of performance) variation before and after adjustment has very little impact on the heat rejection rate of a chiller, the heat rejection rate corresponding to the current COP is used to calculate Tco approximately:
T c o = ( 1 + C O P 1 ) Q e c w M + T c i
Substituting Equation (11) in Equation (10), we can get the calculating formula of IWTC. Substituting the calculating formula of IWTC in Equation (3), we can get the correlation between chiller power and ARCT. If only a chiller is put into operation, the IWTC and derivative of chiller power with respect to airflow rate are as follows:
T c i = ( 1 + C O P 1 ) Q e 1 + b 1 ( M / 2 G ) b 2 2 b 3 ( M / 2 ) b 2 ( 1 + C O P 1 ) Q e c w M + T w b
N c G = 1 + C 1 T e o + C 2 Q e ( 1 f ) T e o Q e 1 c w M C 3 × ( 1 + C O P 1 ) Q e b 1 b 2 2 b 3 G 1 + b 2
If two chillers are put into operation, the IWTC and derivative of chiller power with respect to airflow rate are as follows:
T c i = ( 1 + C O P 1 ) Q e 1 + b 1 ( M / G ) C 2 b 3 M b 2 ( 1 + C O P 1 ) Q e c w M + T w b
N c G = 1 + C 1 T e o + C 2 Q e ( 1 f ) T e o Q e 1 c w M C 3 × ( 1 + C O P 1 ) Q e b 1 b 2 b 3 G 1 + b 2
The fan power can be expressed as a function of airflow rate by a cubic polynomial. Thus, the derivative of total power with respect to airflow rate can be expressed as the sum of the derivative of chiller power with respect to airflow rate and the derivative of fan power with respect to airflow rate.

4. Validation and Performance of the Proposed Optimal Control Strategy

Steady-state simulations under different conditions were performed for the validation and performance analysis of the proposed optimal control strategy.

4.1. Determination of the Parameters of Chiller and Pump Models

Assuming that two chillers have identical models, the models of #1 chiller and its corresponding condenser pump were used for validation. The parameters for the improved Gordon–Ng model shown in Equation (2) were determined by multivariable regression. If we introduce
y = T e o 1 + ( 1 f ) N c Q e T c i ( 1 f ) N c + Q e T c i c w M 1
x 1 = T e o Q e
x 2 = T c i T e o T c i Q e
x 3 = ( 1 f ) N c + Q e T c i
the improved Gordon–Ng model assumes the following form:
y = C 1 x 1 + C 2 x 2 + C 3 x 3
The measured values of Qe, Teo, Tci and M of every measurement record were used to determine the values of y, x1, x2 and x3. Since the measurement records at high PLR were relatively less, we established two models for different PLR to improve model accuracy. A total of 1374 measurement records at the PLR of 40~100% and 3397 measurement records at the PLR of 15~40% were used for the multivariable linear regressions to determine the parameters C1, C2 and C3. Test data from the manufacturer of centrifugal refrigerators indicated that the value of f ranges from 0.03 to 0.051. The mean value of f is taken as 0.04.
Model accuracy was evaluated by the normalized mean bias error (NMBE) and the coefficient of variation of the root mean squared error (CVRMSE), which are commonly used to estimate relative errors. NMBE is an indicator that represents the overall bias of predicted values, and CVRMSE is used to evaluate the average standard error of the predicted values [24].
The NMBE and CVRMSE are determined using following equations [24]:
N M B E = 1 ( n 1 ) z ¯ i = 1 n z i z ^ i
C V R M S E = 1 z ¯ i = 1 n z i z ^ i 2 n 1
where n is the number of measurements, zi is the ith measured value, z ^ i is the ith predicted value, and z ¯ is the arithmetic mean of measured values.
The parameters and indicators of chiller power models are listed in Table 1. A NMBE of close to zero and a CVRMSE of below 0.03 indicate that chiller power can be predicted by the models with good enough accuracy. Furthermore, it can be more directly seen from Figure 2a,b that the chiller power models fit the measurement data well.
The static head (H0) is the necessary pressure head for the lift height and the spray pressure of a cooling tower and equals 4 mH2O in this case. Since the valves in cooling water systems are seldom adjusted, the fluid dynamic impedance (k) during the operational process can be regarded as a constant. The fluid dynamic impedance was estimated to be 1025 s2/m5 by means of regression analysis using the measurement records of pump power and pump flow rate. The water density and specific heat are determined at the mean value of inlet and outlet water temperatures of the condenser and are 996 kg/m3 and 4.18 kJ/(kg·°C), respectively. The average efficiencies of pumps and motors are 0.72 and 0.88, respectively.
The parameters of the cooling tower model are from the model of a cooling tower of the same type, in which the parameters are estimated as b1 = 1.12, b2 = 1.11 and b3 = 4.43 [23]. The rated airflow rate and fan power of a cooling tower are 71.4 kg/s and 15 kW, respectively. The fan power can be expressed as the following fitting equation:
W = 0.856 2.886 G 71.4 2 + 17.051 G 71.4 3

4.2. Validation Results

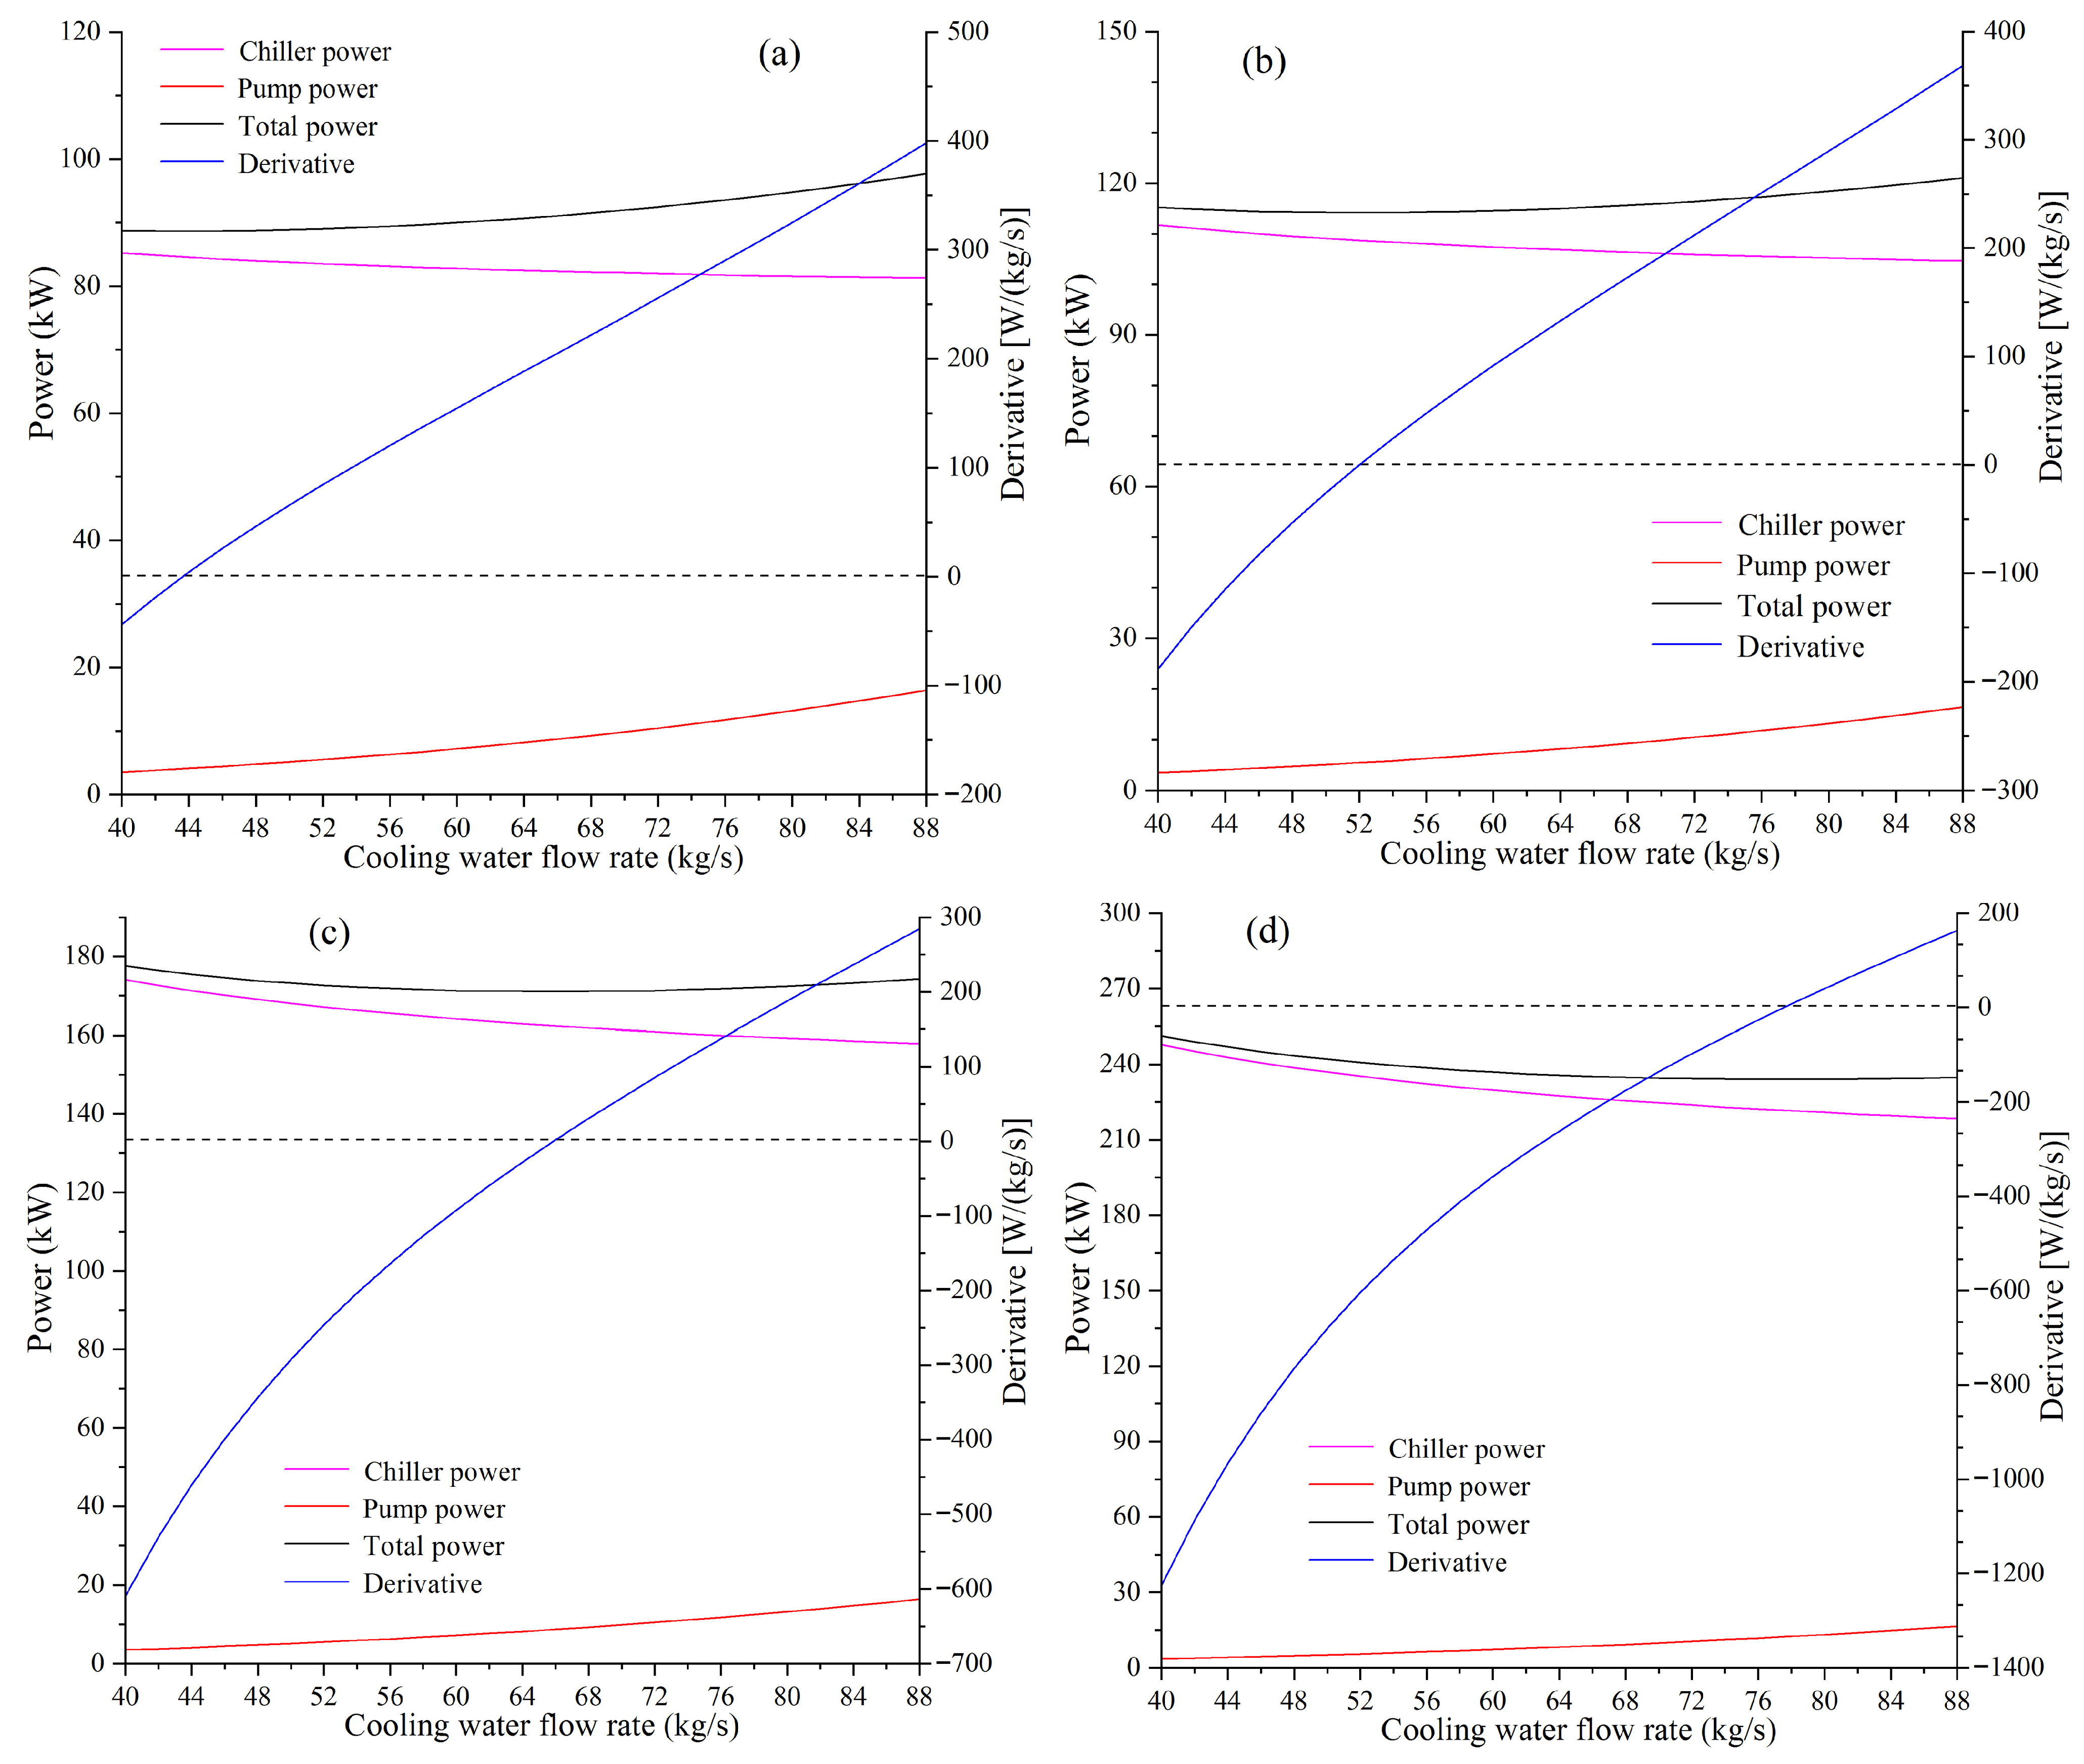
The proposed operational optimization method includes two steps: water flow rate optimization and airflow rate optimization. Simulations for different operating conditions were performed using the aforementioned equations for the calculation of derivatives and powers. Figure 3a–d show the variations of power and derivative with CWFR at different cooling loads. The IWTC (Tci) and outlet water temperature of evaporator (Teo) were set at 30 °C and 7 °C, respectively, which corresponds to the standard condition in the Chinese national standard [25]. The chiller power decreases when CWFR increases, whilst the pump power increases. It can be observed from Figure 3a–d that the total power of chiller and pump reaches a minimum when the derivative equals zero, which proves that the proposed control strategy for condenser pumps is feasible. The flow rate value at which both the total power reaches a minimum and the derivative equals zero is the optimal CWFR.
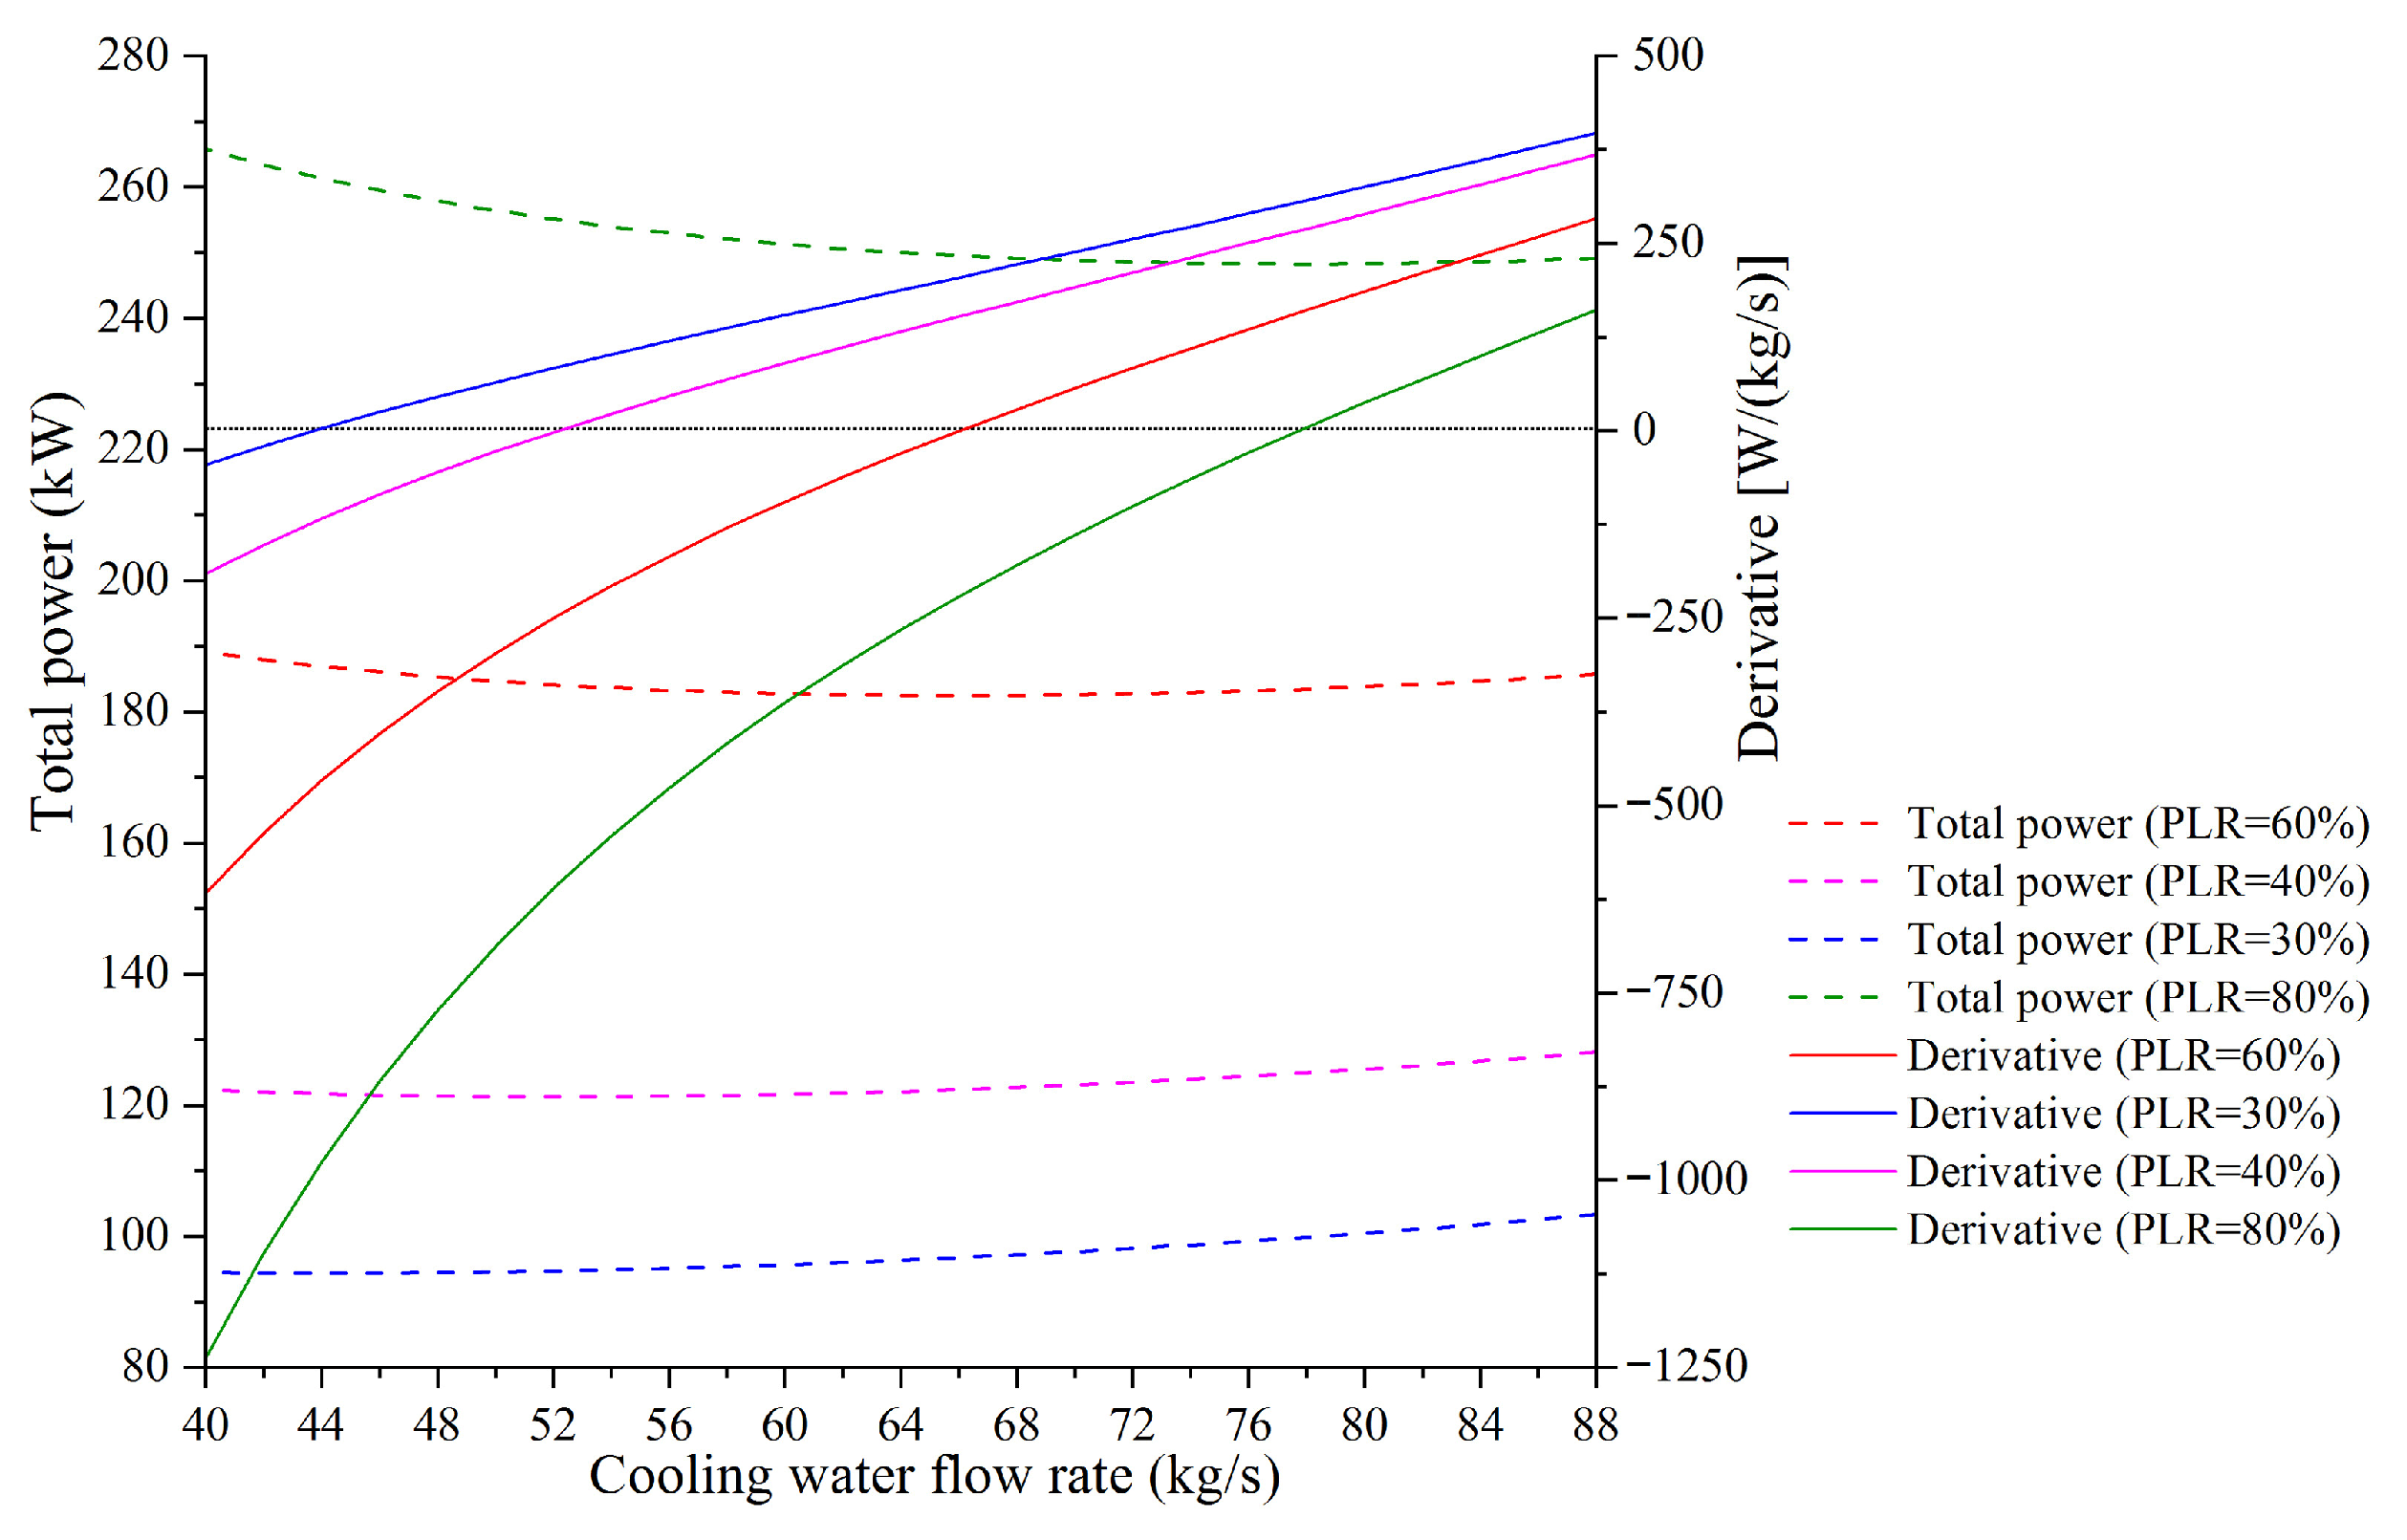
Simulations for the operating condition of IWTC at 32 °C (Teo = 7 °C) were also performed, and the simulation results are shown in Figure 4. The optimal CWFR and total power saved for the PLRs of 80%, 60%, 40% and 30% are the same as those at the operating condition of IWTC at 30 °C, respectively. A condenser inlet water temperature change of 2 °C does not affect the optimal CWFR and power saved but does affect chiller power. The simulation results verified the deduction in Section 3.2 that the impact of changes in IWTC on the optimal CWFR can be neglected. Therefore, the changes in the outlet temperature of a cooling tower due to changes in wet- and dry-bulb temperatures or adjustment of air flow rate do not affect the optimal CWFR. This characteristic enables the ARCT to be optimized based on the optimal CWFR. The control strategy of decoupling water flow rate optimization and airflow rate optimization is feasible.
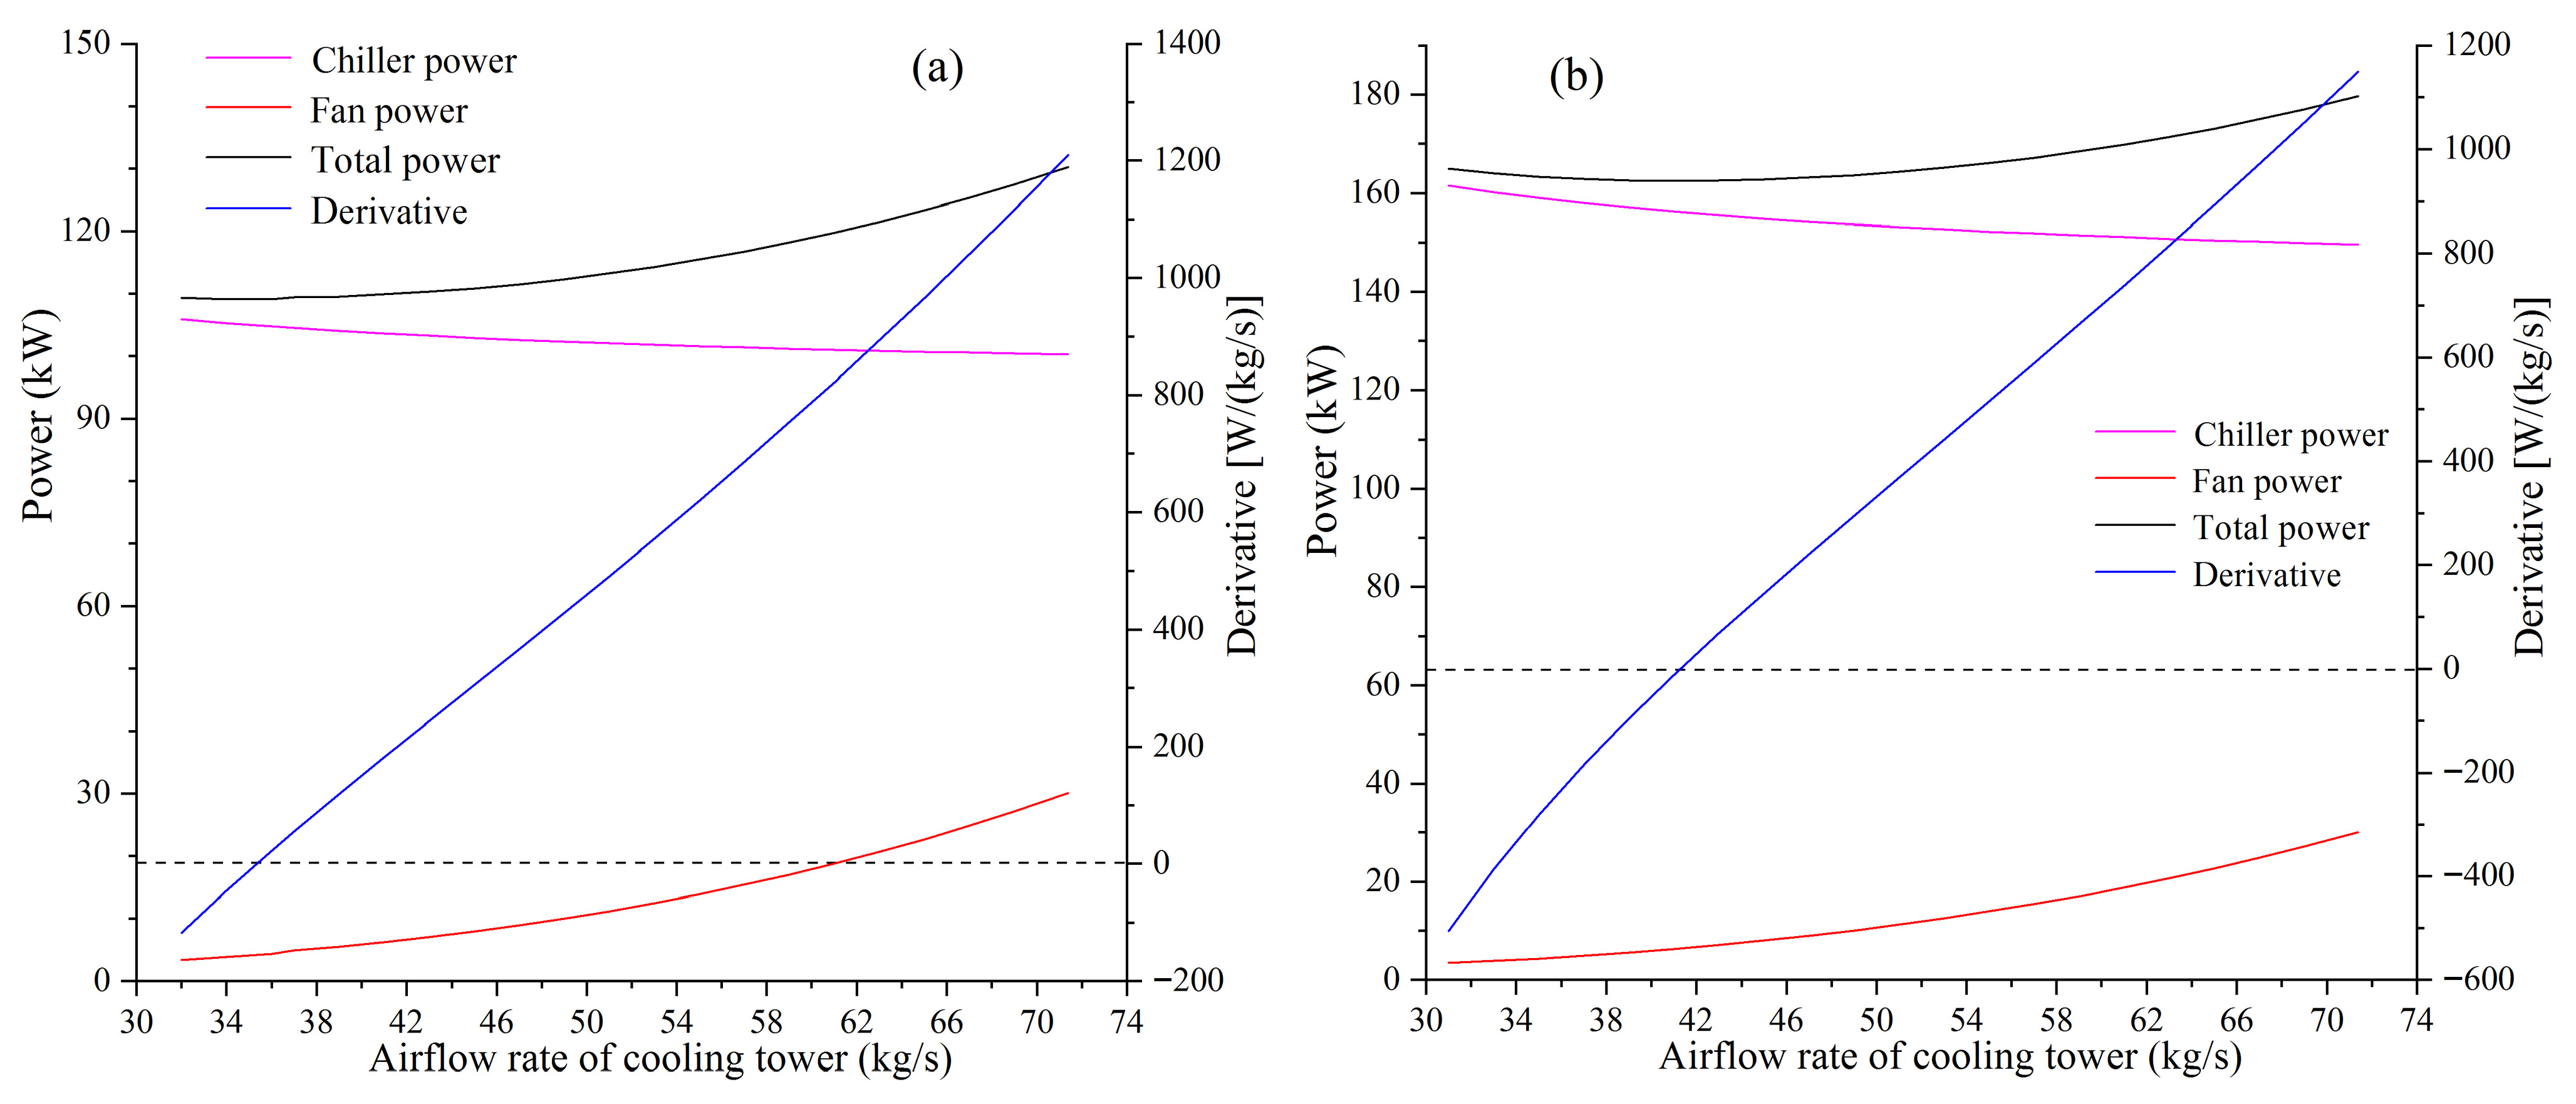
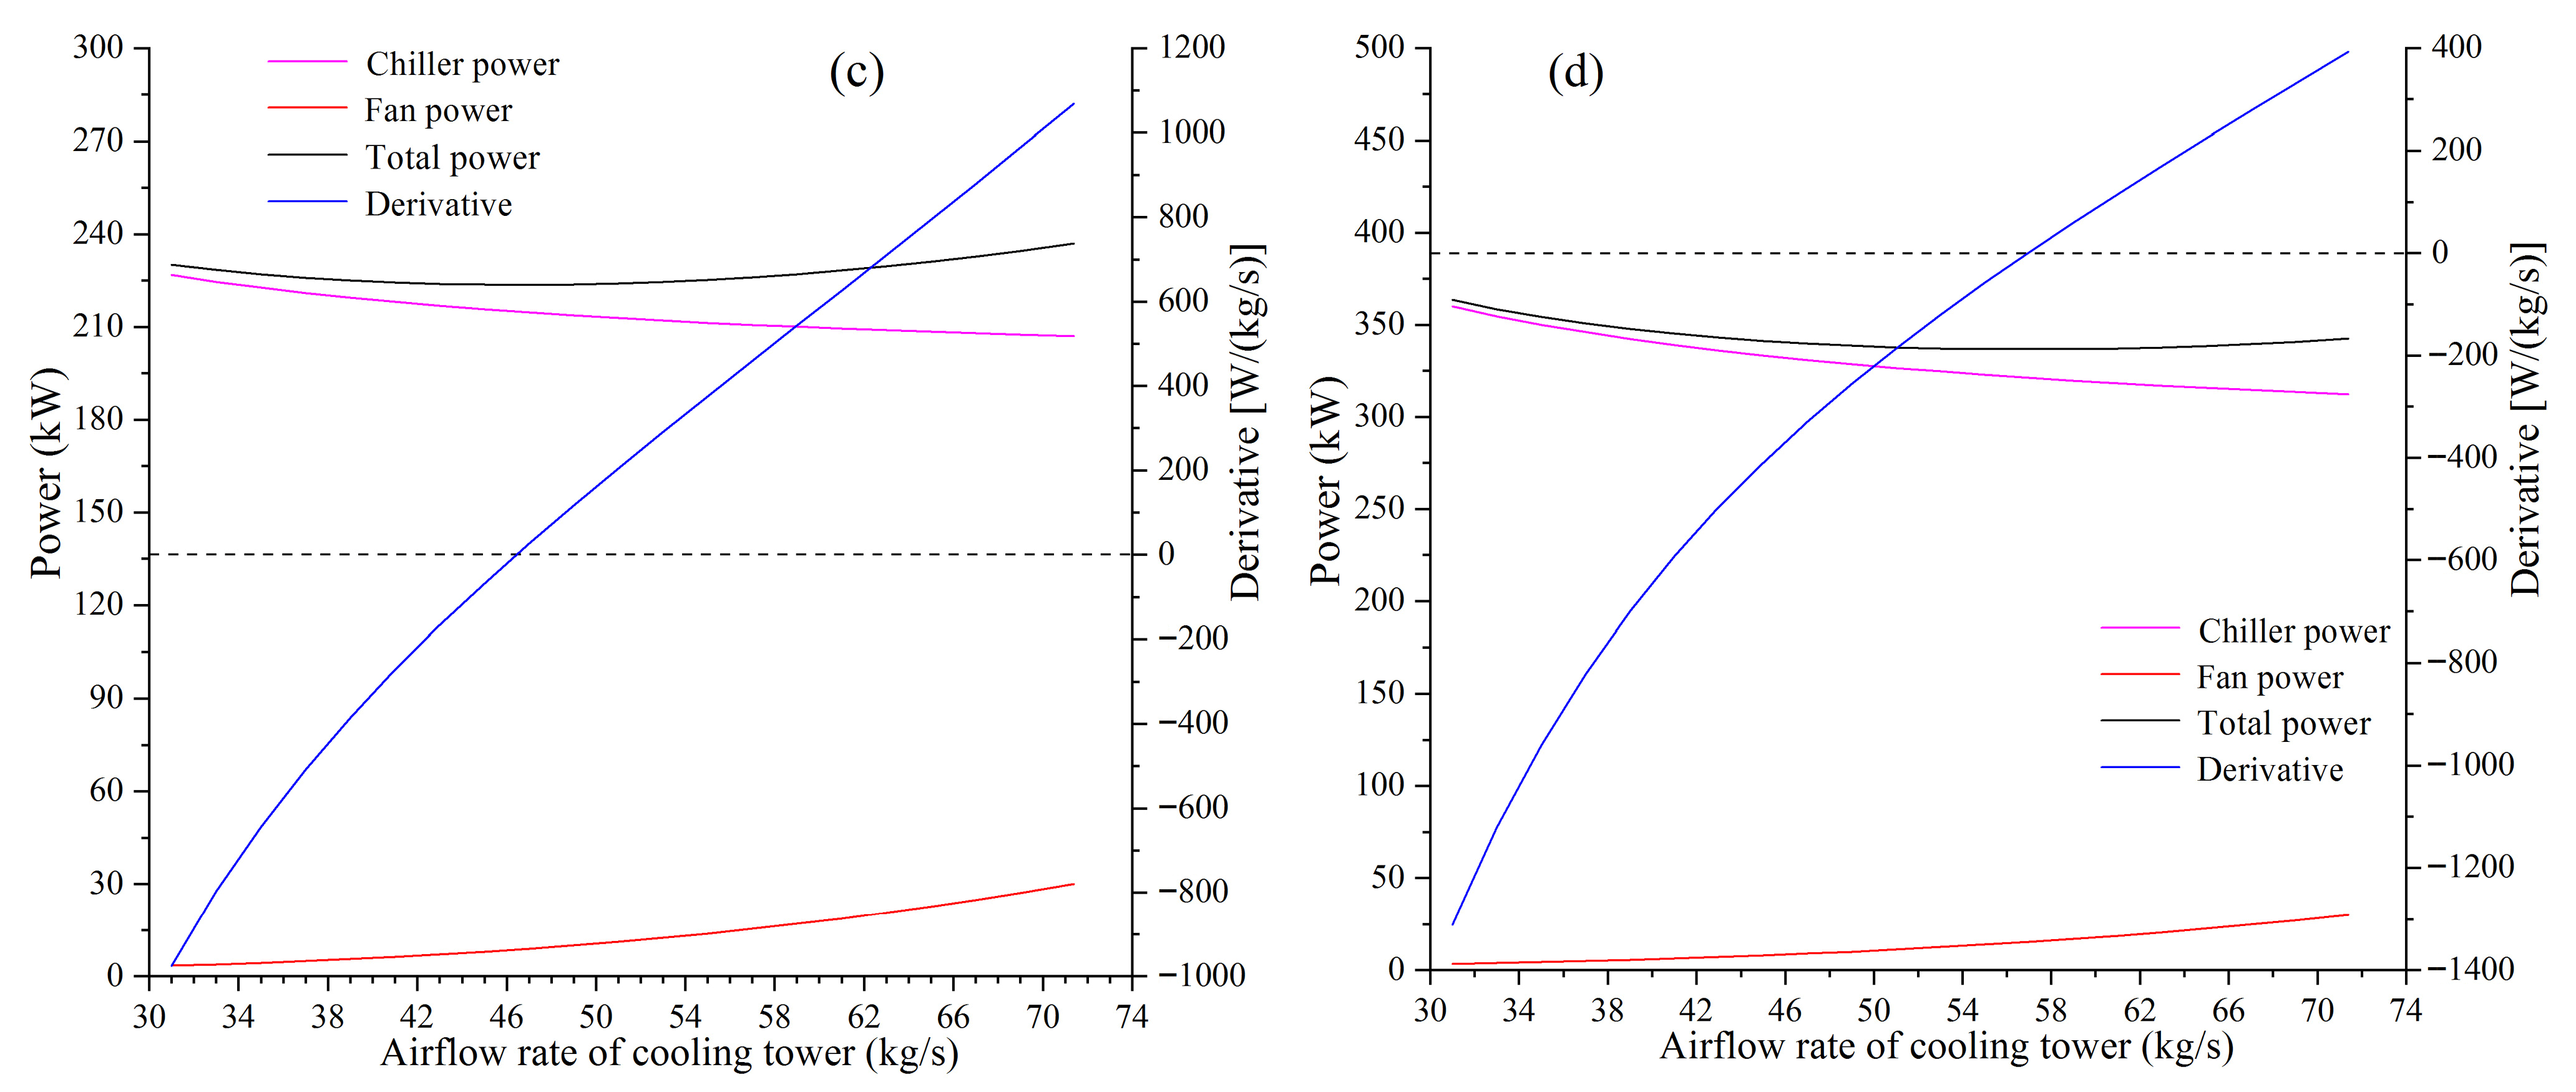
Figure 5a–d show the variations of power and derivative with ARCT at different cooling loads. The optimal CWFR determined at the first step is used to determine the water flow rate passing through the cooling tower. The wet-bulb temperature and outlet water temperature of the evaporator were set at 28 °C and 7 °C, respectively. The chiller power decreases when ARCT increases, whilst the fan power increases. It can be seen from Figure 5a–d that the total power of chiller and fans reaches a minimum when the derivative equals zero, which proves that the proposed control strategy for cooling tower fans is feasible. When the total power reaches a minimum and the derivative equals zero, the corresponding airflow rate is the optimal ARCT.

4.3. Performance Analysis

It can be observed from Figure 3a–d that the power-saving effects of variable-speed pumps have much to do with chiller PLR. The lower the chiller PLR is, the more the total power saved. When operating at relatively high PLR, relatively high CWFR should be maintained to meet the load. In addition, the fact that chiller power is more sensitive to CWFR variation at relatively high chiller PLR leads to very limited space for the reduction of CWFR. The optimal CWFR at 30% of full load is 44 kg/s, which equals 50% of rated CWFR. In engineering practice, the lowest CWFR is suggested to be 45~50% of rated CWFR to avoid rapid deterioration of heat transfer in a condenser and possible unstable operation of pumps due to too low speed [17,26]. Thus, it is suggested that the CWFR should be maintained at 45~50% of rated CWFR when chiller PLR is less than 30% in this case.
Figure 5a–c shows the power/derivative variation with ARCT when a chiller is running. If only a chiller is put into operation, two cooling towers operate with variable speed fans to take full advantage of the two towers’ heat exchange area. Although airflow rate is decreased, the water flow rate of a tower is also decreased. The leaving water temperature of two cooling towers is close to that of a cooling tower with constant-speed fans because the air–water ratio changes little. The optimal airflow rates at 40%, 60% and 80% of full load are 35.7 kg/s, 41.4 kg/s and 46.5 kg/s, respectively, and fan power can be significantly reduced due to the cubic relation between airflow rate and fan power. The optimal airflow rate at 40% of full load equals 50% of rated airflow rate, which means that the power frequency of fans is adjusted to the lower limit (25 Hz). The ARCT should be fixed at 50% of rated airflow rate when chiller PLR is less than 40% in this case. If the period when the power frequency of fans is fixed at 25 Hz lasts half an hour, a cooling tower should be shut down. Figure 5d shows the power/derivative variation with ARCT when plant PLR is 60%. If two chillers and two cooling towers are all put into operation, the space for the reduction of ARCT is limited. The optimal ARCT is 57 kg/s, whilst the optimal ARCT at the same chiller PLR (60%) with one chiller running is 41.4 kg/s.
Although the operational optimization includes two steps, the power-saving rate should be evaluated based on the combination of variable-speed pumps and fans. Table 2 shows the performance comparison between variable- and constant-speed pump/fan modes at different operating conditions. In constant-speed pump/fan mode, pumps and cooling towers operate at the rated flow rate, and one chiller and one cooling tower are running when the plant PLR is lower than 50%. As a whole, the power-saving rate increases with the decrease inplant PLR. The power-saving rate equals 13.2% when the PLR of the chiller plant is 20%. The technique of variable-speed pumps and fans is very applicable for chiller plants with long operation time and low PLR most of the time, such as chiller plants of hotels.

5. Implementation of the Direct Optimal Control Method

5.1. Optimization Algorithms and Direct Control Method

Figure 6 describes the structure and optimization algorithms of the proposed optimal control system proposed. The data of IWTC, current chiller power, inlet/outlet water temperatures of evaporator and chilled water flow rate are collected. A supervisory computer or a programmable logic controller (PLC) is used to calculate current cooling load, COP and derivative, and then determine the optimal CWFR and ARCT. The cooling load of a chiller is calculated by
Q e = c w F T e i T e o
where F is chilled water flow rate, and Tei is inlet water temperature of evaporator. A search algorithm is used to determine the optimal CWFR and ARCT. The initial values of M and G are suggested to be the rated CWFR and ARCT, respectively, and the values of ΔM and ΔG are suggested to be 1 kg/s. Once the derivative becomes negative, the current values of M and G are the optimal CWFR and ARCT, respectively. In the optimal control system, the controlled variables are not CWFR and ARCT but power frequency to eliminate control deviation and oscillation during the process of flow rate control. The optimal CWFR and ARCT should be transformed to corresponding pump and fan speeds. Since pump and fan speeds are all proportional to power frequency, corresponding power frequencies are then determined as the setpoints of the output frequencies of VFDs.
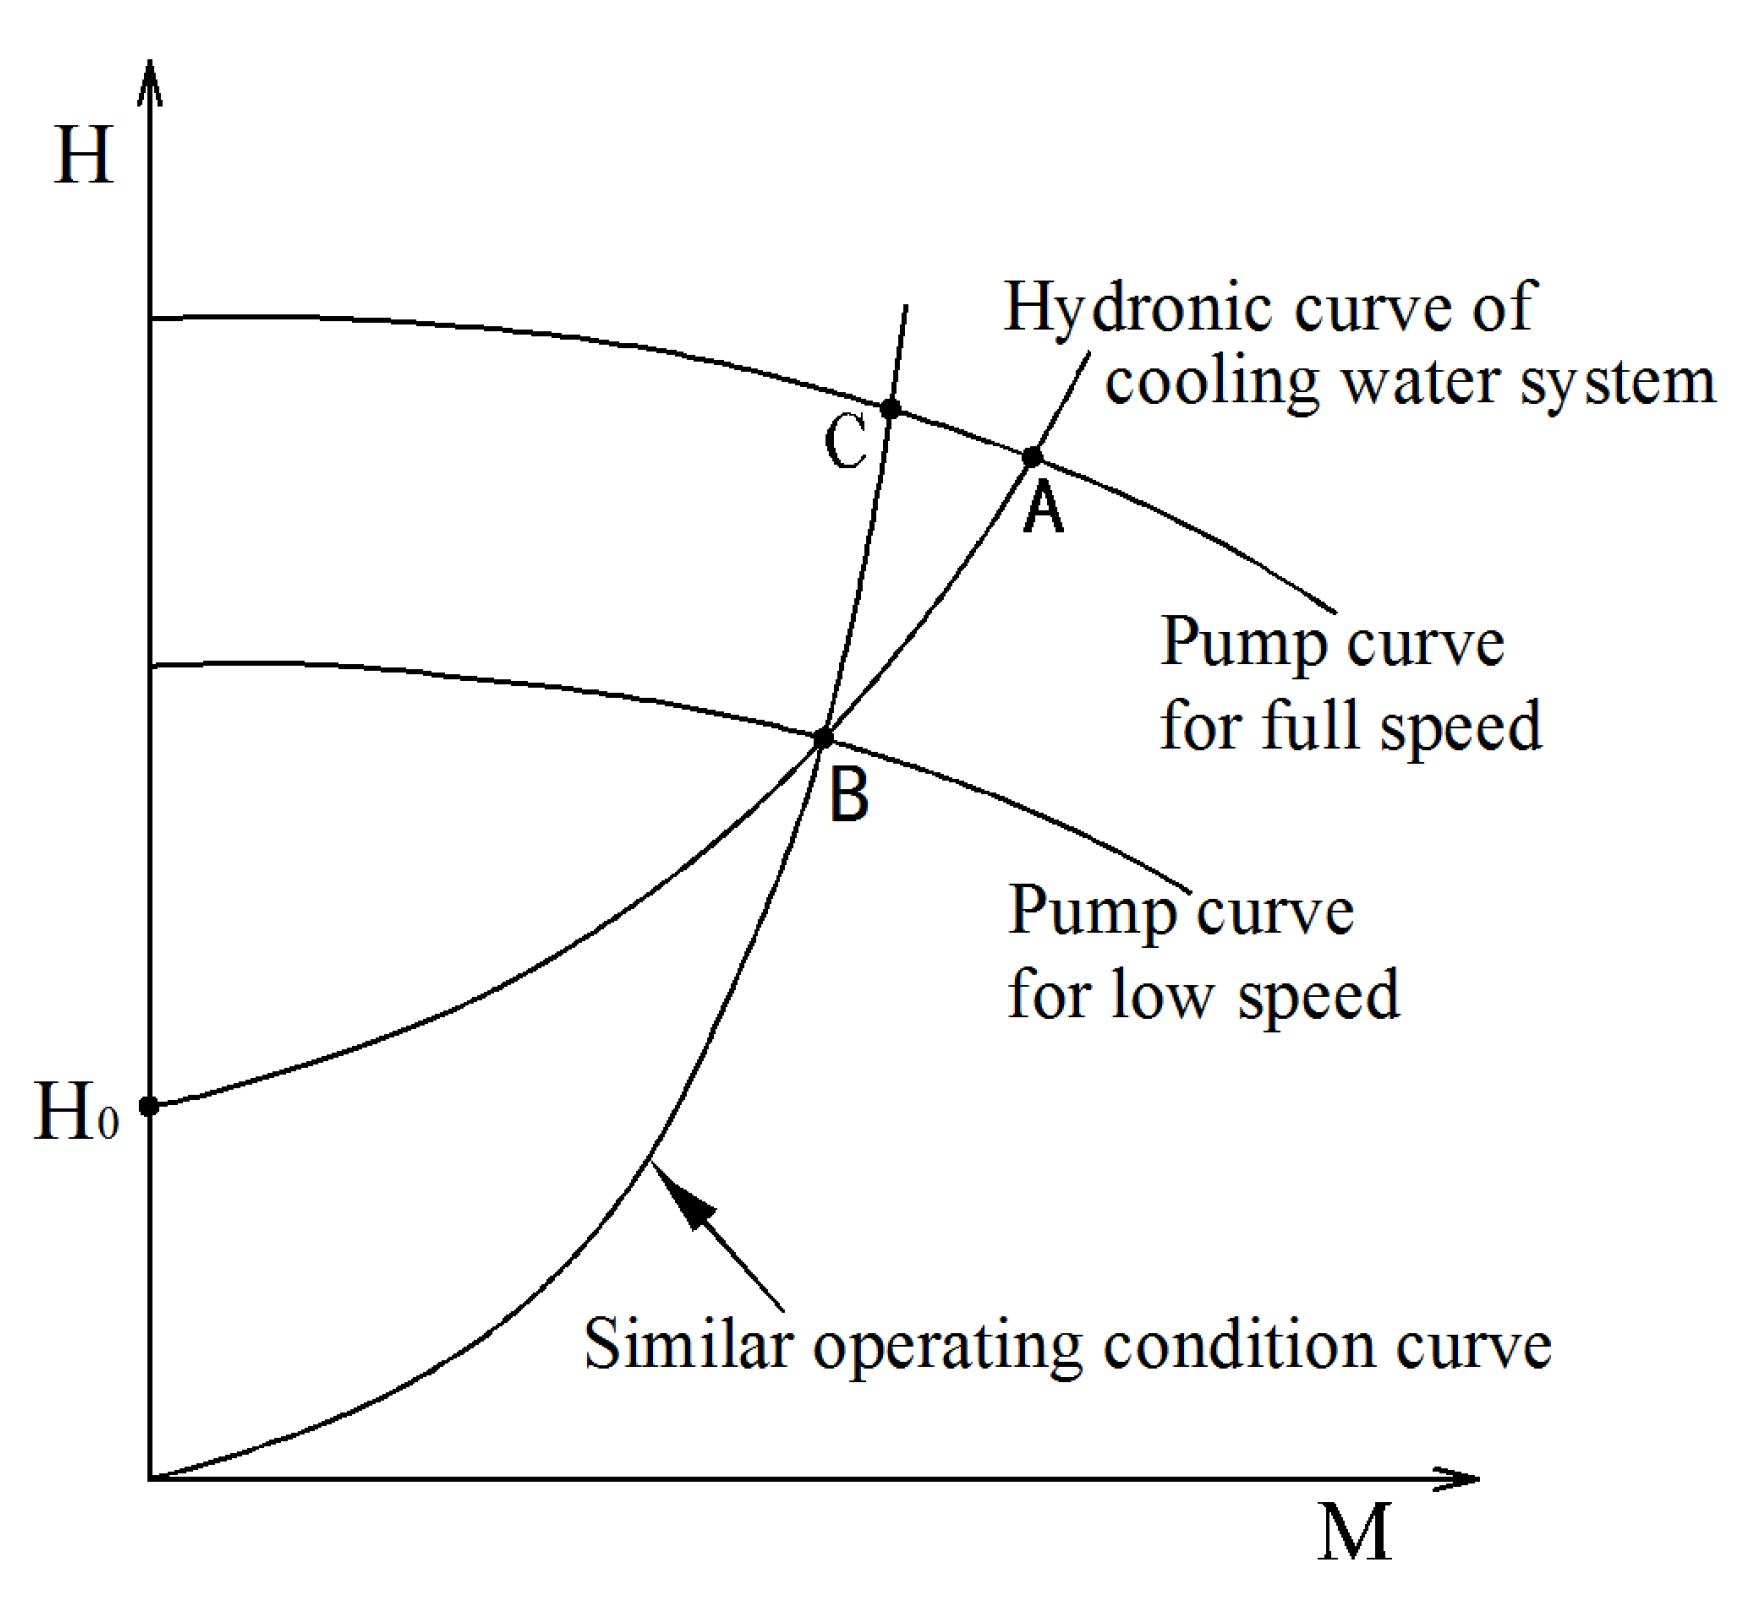
In a closed-loop system, pump flow rate is proportional to pump speed and power frequency based on similarity law. However, such a principle is not applicable to an open-loop system due to the existence of static head. It is necessary to establish a new relation between pump flow rate and pump speed (power frequency). Figure 7 shows pump and system curves during the speed adjustment process of a cooling water system. Point B is the optimal operating point of condenser pumps at low speed, whilst point A is the operating point with rated flow rate at full speed. When pump speed is adjusted from full speed to low speed, the operating point moves from point A to point B. In an open-loop system, point B does not have a similar operating condition to point A. Point B is on the hydronic curve of the cooling water system, and the flow rate of point B (MB) is the optimal CWFR demanded. According to Equation (5) and its parameter values estimated in Section 4.1, the pressure loss of point B (HB) is
H B = 4 + 1.03325 × 10 3 M B 2
Thus, the similar operating condition curve that passes through point B and coordinate origin can be expressed by the following equation:
H = 4 + 1.03325 × 10 3 M B 2 M B 2 M 2
The pump curve for full speed in this case can be expressed by the following quadratic curve fitting equation:
H = 13.964 + 0.02086 M 0.00047 M 2
Since point C is the intersection point of the pump curve for full speed and the similar operating condition curve, the flow rate of point C (MC) can be determined by solving the following equation:
13.964 + 0.02086 M 0.00047 M 2 = 4 + 1.03325 × 10 3 M B 2 M B 2 M 2
Then, the flow rate of point C is given by
M C = 0.02086 + 0.0844 + 223.424 M B 2 3.007 × 10 3 + 8 M B 2
Point C has a similar operating condition to point B because the two points are all on the similar operating condition curve. The pump’s full speed is 1480 r/min, and the speed for point B can be calculated by
S B = 1480 × M B M C
Since the power frequency for full speed is 50 Hz, the power frequency for point B should be calculated by
f B = 50 × M B M C
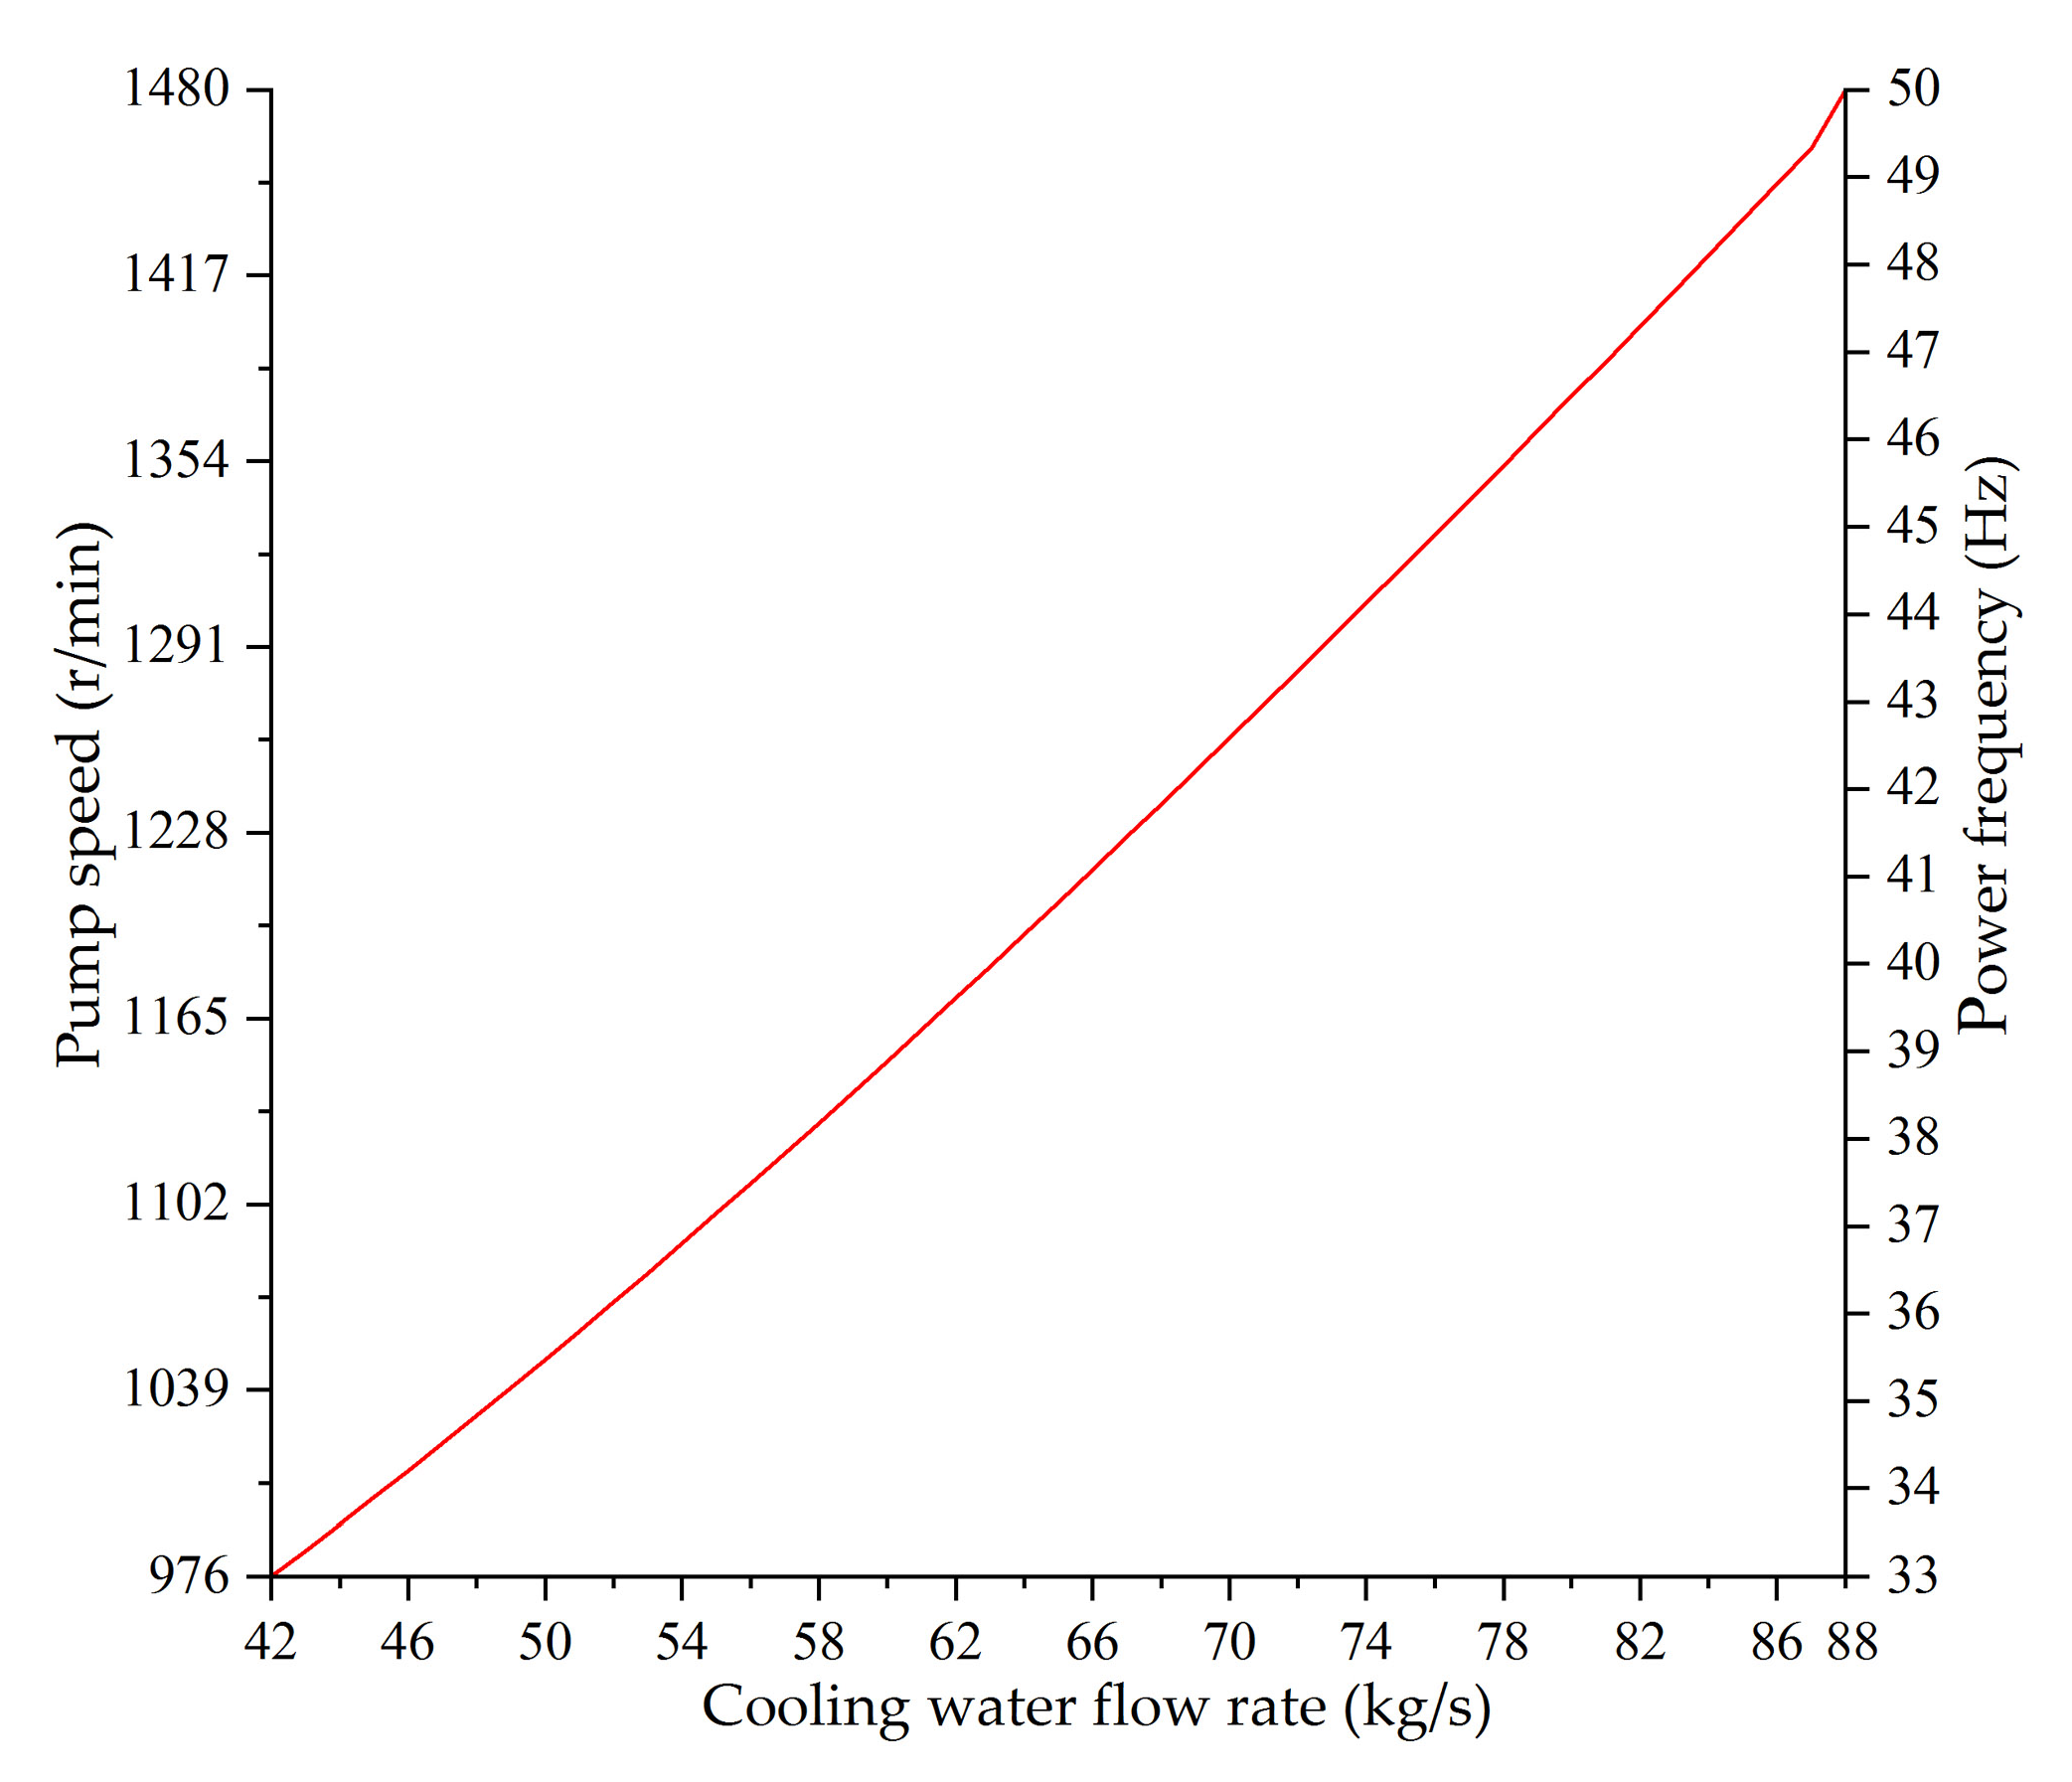
Figure 8 shows pump speeds and power frequencies corresponding to various CWFR. If the adjustable range of flow rate is from 88 kg/s to 42 kg/s, the corresponding adjustable ranges of pump speed and power frequency are from 1480 r/min to 976 r/min and from 50 Hz to 33 Hz, respectively. The adjustable ranges of pump speed and power frequency are all smaller than those of a closed-loop system.
According to the proportional relation between airflow rate and power frequency, the power frequency for the optimal ARCT is
f o p = 50 × G o p G R
where Gop is the optimal ARCT (kg/s). Two VFDs are used to adjust the power frequencies taking fB and fop as the setpoints of output frequencies under the control of instructions from the PLC, respectively.

5.2. Experiment Validation of the Direct Control Method for Condenser Pumps and Fans

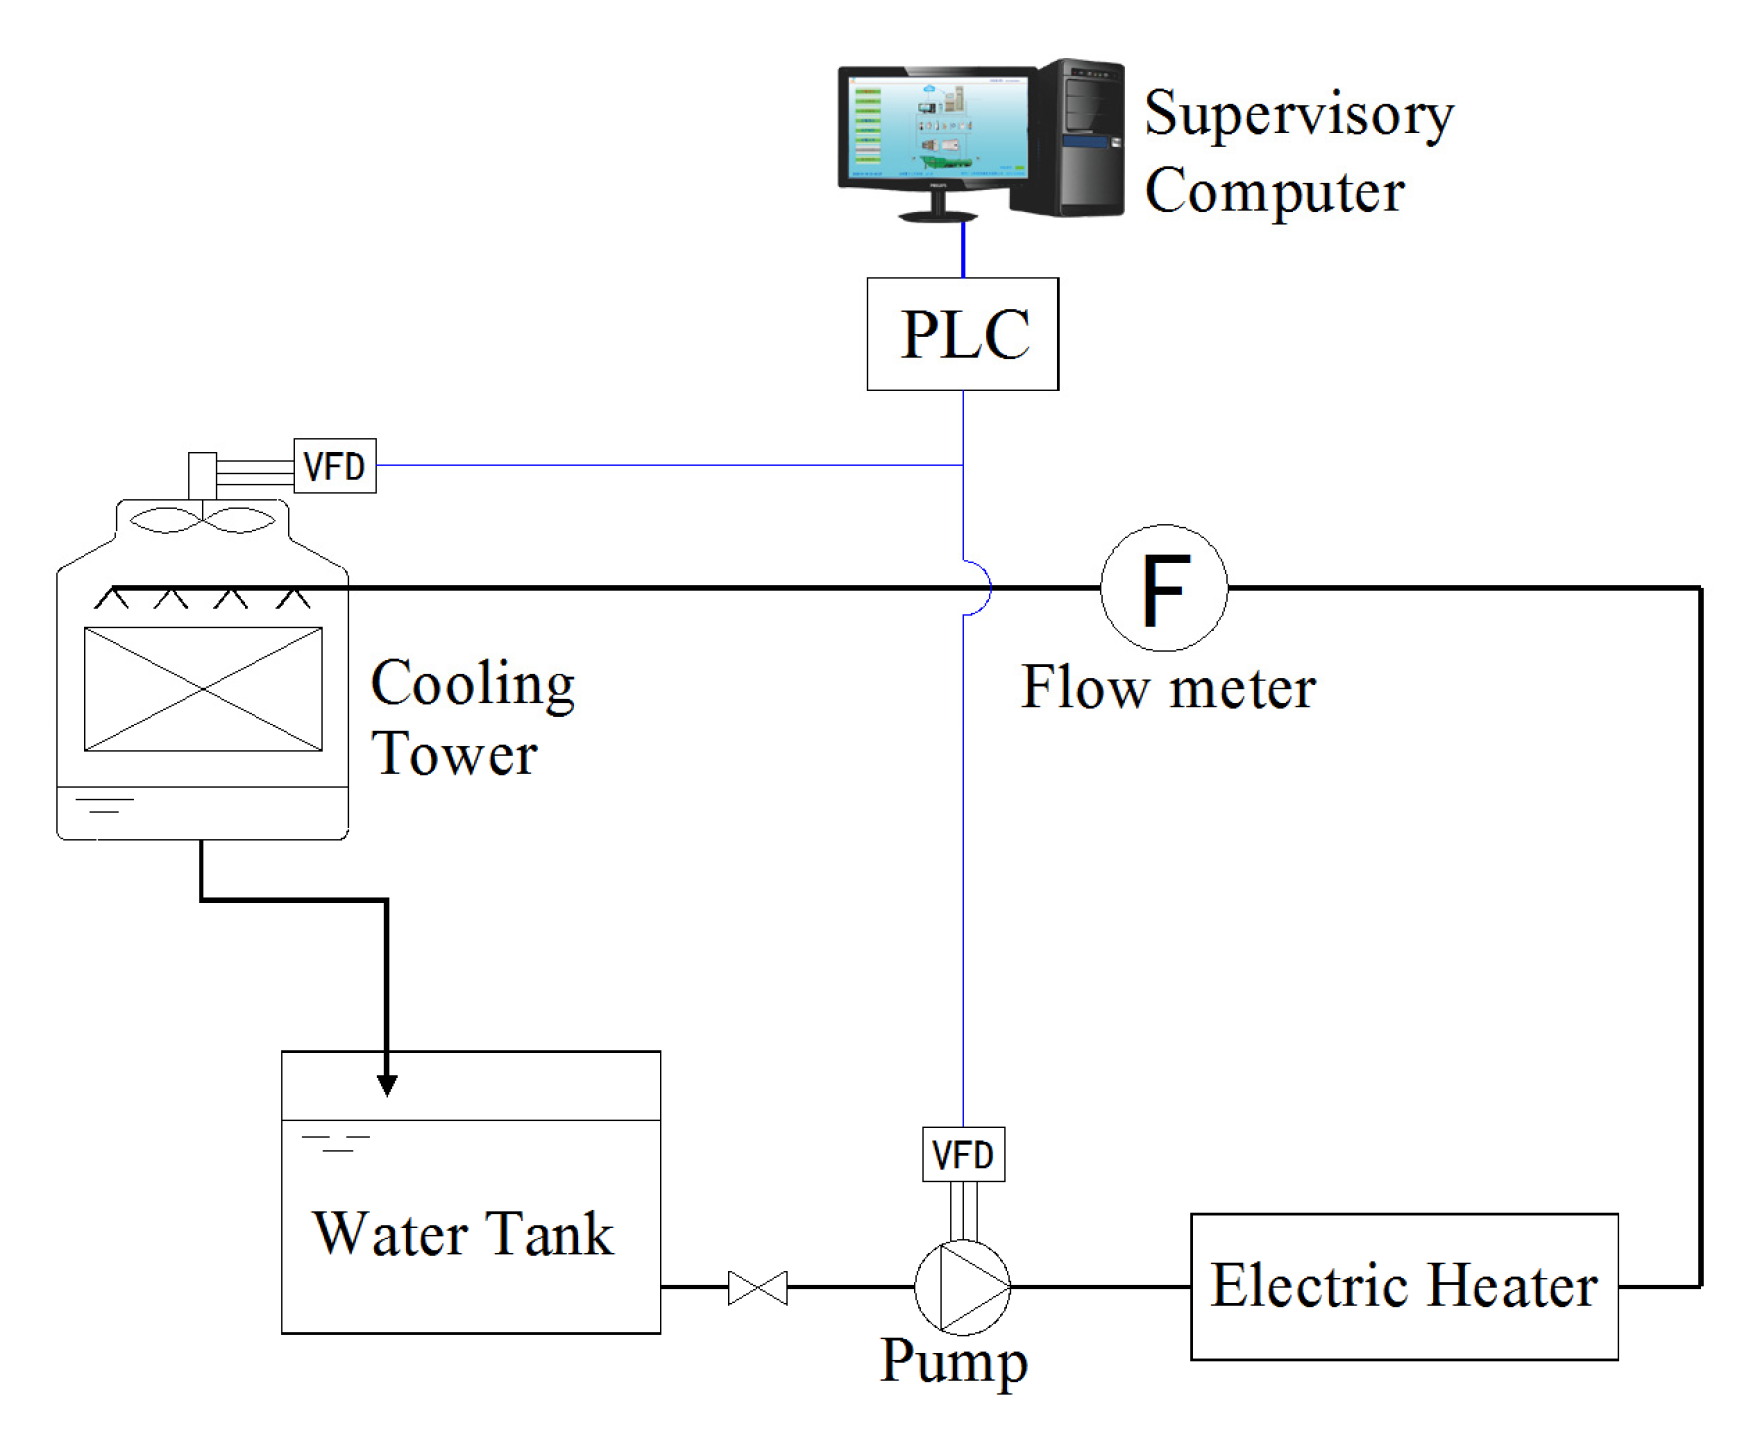
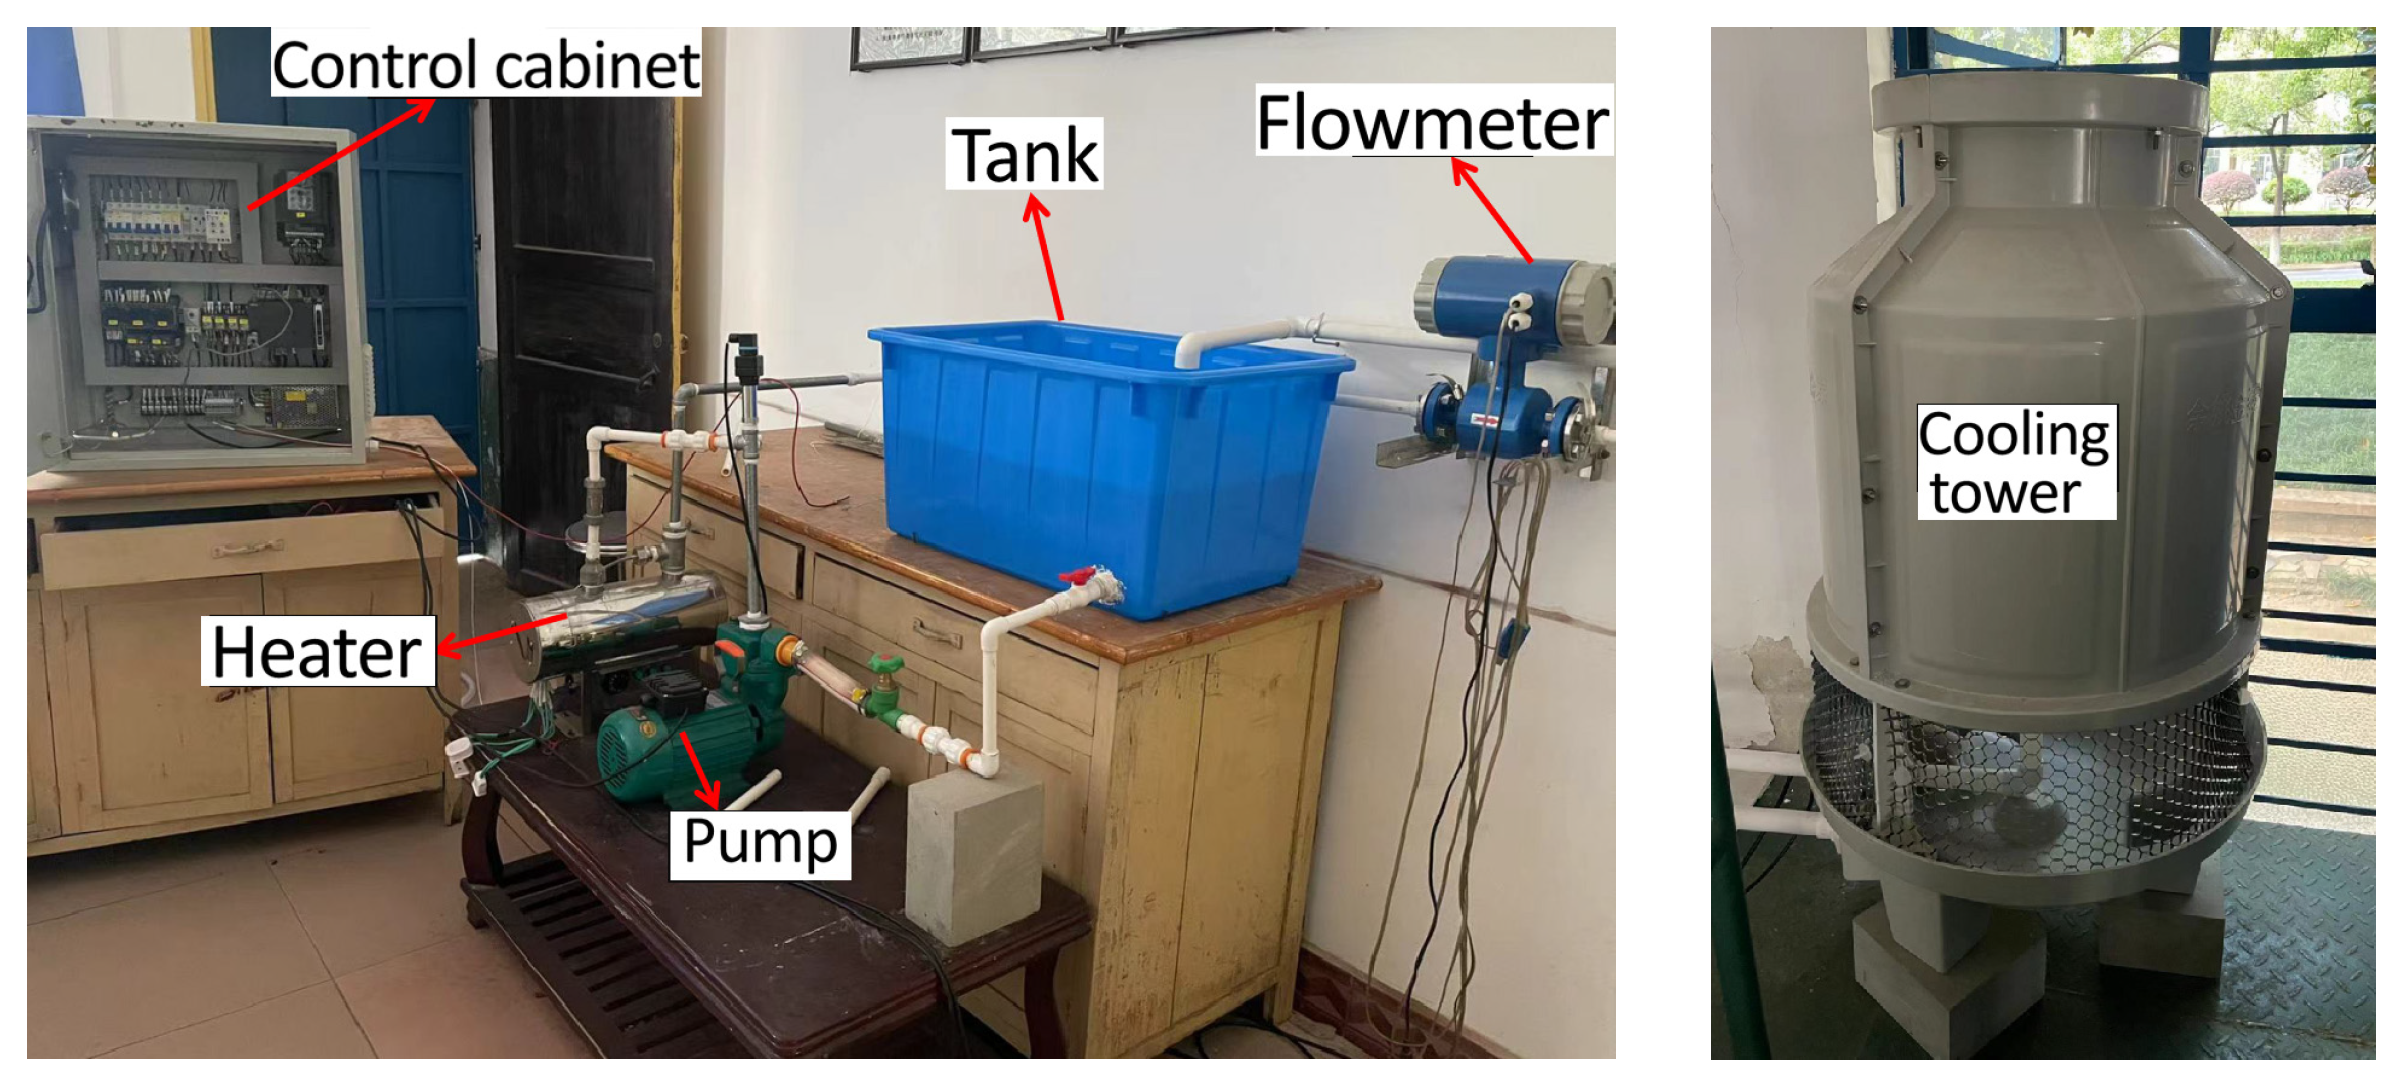
An experimental control system, instead of a real chiller plant, was built to validate the optimization algorithms and implementation method of the direct control method. Figure 9 and Figure 10 show the schematic and pictures of the experimental control system, respectively. An electric heater with a heat output of 6 kW is used to generate the heat-rejection load of a cooling tower with a rated heat rejection of 6 kW. A water tank is installed between the cooling tower and pump to avoid air being entrained into the pump when starting up the pump. The flow meter is used to observe the change in water flow rate when adjusting the water flow rate. The pump and cooling tower are all driven by a three-phase motor and VFD. The supervisory computer can communicate with the PLC. A control software is developed to determine the optimal CWFR/ARCT and corresponding power frequencies.
The optimization process is performed on the supervisory computer taking the studied case as optimization object. The needed data input, including Qe, Teo, Tci and current COP, are set on the interface of the control software, and the number of searches, optimized results and monitored power frequencies are all displayed on the interface. Table 3 shows the number of searches and optimized results from the calculation by control software when one chiller is running (Teo = 7 °C, Tci = 30 °C, COP = 5.9). Since several searches are needed, the optimization results can be obtained immediately. The comparison made by Hu et al. indicated that the running time of nine optimization algorithms ranged from 327 s to 2336 s under the same operating conditions of a chiller plant [6]. The running time of the proposed optimization algorithm can be significantly decreased compared with the optimization algorithms in Ref. [6].
If the optimized power frequency is less than the lower limit, power frequency is fixed at the lower limit. The optimized power frequencies are sent to the PLC from the supervisory computer. The instructions from the PLC are sent to the VFDs of pump and fan to regulate their output frequencies to be equal to the optimized frequencies. The results of multiple experiments indicated that the two VFDs can regulate their output frequencies to be equal to the optimized power frequencies for pump and fan taking 4~8 s of time.
It can be observed from Figure 3, Figure 4 and Figure 5 that total power does not change obviously when CWFR and ARCT change within the range near the optimal value. Sometimes, the optimized CWFR or ARCT may be slightly affected by the small change in Tci or model parameters in Equations (8) and (15) after a certain period. However, the change in total power due to the small change in optimized CWFR or ARCT is slight. It is acceptable that CWFR and ARCT are adjusted within a certain range near the optimal value without an obvious change in total power. The proposed optimal control method exhibits a certain ability of fault tolerance. It is suggested that the model parameters be updated after the refrigeration operating period of a year to avoid the possible influence of changes in model parameters on the optimization operation. Another advantage of the proposed method is that less data input is needed compared with the existing operational optimization models. Some data, such as wet-bulb temperature, the outlet water temperature of the condenser, CWFR and ARCT, are not needed for the calculation of the derivative, which makes the control system less complicated. In view of the fact that the optimization algorithms shown in Figure 6 are not complicated, the determination of optimal CWFR/ARCT and corresponding power frequencies can also be executed by some top PLC models, such as Siemens S7-1200/1500.

6. Conclusions

This study proposed a direct optimal control method for condenser pumps and cooling tower fans that can avoid time-consuming solutions of optimization models and the inconvenience of control strategies with intermediate parameters. The following can be concluded:
  • The impact of changes in IWTC on the optimal CWFR can be neglected, and it is feasible to decouple water flow rate optimization and airflow rate optimization. The total power approaches a minimum when the derivative of total power with respect to water/air flow rate approaches zero.
  • The power-saving rate has much to do with the PLR of the chiller plant. The lower the plant PLR is, the higher the power-saving rate is. The total power can be reduced by 13.2% at a plant PLR of 20% compared to the constant speed pump/fan mode.
  • The flow rate of condenser pumps is not proportional to pump speed and power frequency. In the direct optimal control method, the optimal CWFR and ARCT are transformed to corresponding power frequencies of pumps and fans. Experimental results show that the optimization results can be obtained immediately and VFDs can regulate their output frequencies to be equal to the optimized power frequencies for pump and fan taking 4~8 s of time.
The steady-state simulations and experiment results indicate that the proposed optimal control method is a feasible and promising control method. In practical applications, different formulas should be used to calculate the derivatives of each chiller’s power with respect to flow rates. For the chiller plants with more than two chillers, more scenarios for the number of operating units should be considered for ARCT optimization. In the future, the control software will be improved, and we will test the practical performance of the proposed optimal control method in practical application.

Author Contributions

Conceptualization, X.C.; methodology, X.C.; software, X.C. and L.G.; validation, L.G. and P.G.; formal analysis, C.Y.; investigation, X.C. and C.Y.; resources, L.G. and P.G.; data curation, J.X.; writing—original draft preparation, X.C.; writing—review and editing, X.C. and C.Y.; visualization, C.Y.; supervision, X.C.; project administration, X.C.; funding acquisition, X.C. All authors have read and agreed to the published version of the manuscript.

Funding

This research was financially supported by the Hunan Provincial Natural Science Foundation of China (Grant No. 2023JJ50027).

Data Availability Statement

The data presented in this study are available on request from the corresponding author.

Conflicts of Interest

Authors Lingjun Guan, Peihong Ge and Jinrui Xiaare employed by the Guangzhou Shijie Energy-Saving Technology Co., Ltd. The remaining authors declare that the research was conducted in the absence of any commercial or financial relationships that could be construed as a potential conflict of interest.

Abbreviations

The following abbreviations are used in this manuscript:
CWFRCooling water flow rate
ARCTAirflow rate of cooling tower
PIDProportional–integral–derivative
PLRPart-load ratio
VFDVariable-frequency drive
IWTCInlet water temperature of condenser
COPCoefficient of performance
NMBENormalized mean bias error
CVRMSECoefficient of variation of the rootmeansquared error
PLCProgrammable logic controller

References

  1. Coa, A.; Keane, M.M.; Torrens, J.I.; Corry, E. Building operation and energy performance: Monitoring, analysis and optimisation toolkit. Appl. Energy 2013, 101, 310–316. [Google Scholar] [CrossRef]
  2. Pérez-Lombard, L.; Ortiz, J.; Pout, C. A review on buildings energy consumption information. Energy Build. 2008, 40, 394–398. [Google Scholar] [CrossRef]
  3. Liang, X.; Chen, S.; Zhu, X.; Jin, X.; Du, Z. Domain knowledge decomposition of building energy consumption and a hybrid data-driven model for 24-h ahead predictions. Appl. Energy 2023, 344, 121244. [Google Scholar] [CrossRef]
  4. Shanghai Committee of Municipal and Rural Construction. Monitoring and Analysis Report of Building Energy Consumption and Carbon Emissions in Shanghai; Shanghai Committee of Municipal and Rural Construction: Shanghai, China, 2023. [Google Scholar]
  5. Cao, Y.; Wang, C.; Wang, S.; Fu, X.; Ming, X.G. Energy modeling and optimization of building condenser water systems with all-variable speed pumps and tower fans: A case study. Build. Simul. 2024, 17, 1085–1111. [Google Scholar] [CrossRef]
  6. Xue, Q.; Jin, X.Q.; Jia, Z.Y.; Lyu, Y.; Du, Z.M. Optimal control strategy of multiple chiller system based on background knowledge graph. Appl. Energy 2024, 375, 124132. [Google Scholar] [CrossRef]
  7. Liang, X.B.; Liu, Y.; Chen, S.L.; Li, X.L.; Jin, X.Q.; Du, Z.M. Physics-informed neural network for chiller plant optimal control with structure-type and trend-type prior knowledge. Appl. Energy 2025, 390, 125857. [Google Scholar] [CrossRef]
  8. Hu, B.; Guo, Y.H.; Huang, W.J.; Jin, J.X.; Zou, M.X.; Zhu, Z.K. Energy-saving optimization of HVAC Systems using an antlion optimizer with enhancements. Buildings 2024, 14, 2842. [Google Scholar] [CrossRef]
  9. Zhang, D.; Luh, P.B.; Fan, J. Chiller plant operation optimization: Energy-efficient primary-only and primary–secondary systems. IEEE Trans. Autom. Sci. Eng. 2018, 15, 341–355. [Google Scholar] [CrossRef]
  10. Karami, M.; Wang, L. Particle swarm optimization for control operation of an all-variable speed water-cooled chiller plant. Appl. Therm. Eng. 2018, 130, 962–978. [Google Scholar] [CrossRef]
  11. Lu, L.; Cai, W.; Soh, Y.C. HVAC system optimization—Condenser water loop. Energy Convers. Manag. 2004, 45, 613–630. [Google Scholar] [CrossRef]
  12. Yao, Y.; Lian, Z.W.; Hou, Z.J. Optimal operation of a large cooling system based on an empirical model. Appl. Therm. Eng. 2004, 24, 2303–2321. [Google Scholar] [CrossRef]
  13. Wang, L.; Lee, E.W.M.; Yuen, R. A practical approach to chiller plants’ optimisation. Energy Build. 2018, 169, 332–343. [Google Scholar] [CrossRef]
  14. He, K.; Fu, Q.M.; Lu, Y.; Wang, Y.Z.; Luo, J.; Wu, H.J.; Chen, J.P. Predictive control optimization of chiller plants based on deep reinforcement learning. J. Build. Eng. 2023, 76, 107158. [Google Scholar] [CrossRef]
  15. Kang, W.H.; Yoon, Y.; Lee, J.H.; Song, K.W.; Chae, Y.T.; Lee, K.H. In-situ application of an ANN algorithm for optimized chilled and condenser water temperatures set-point during cooling operation. Energy Build. 2021, 233, 110666. [Google Scholar]
  16. Ma, Z.; Wang, S.; Xu, X.; Xiao, F. A supervisory control strategy for building cooling water systems for practical and real-time applications. Energy Convers. Manag. 2008, 49, 2324–2336. [Google Scholar] [CrossRef]
  17. Yu, F.W.; Chan, K.T. Optimization of water-cooled chiller system with load-based speed control. Appl. Energy 2008, 85, 931–950. [Google Scholar]
  18. Jiang, X.; Long, W.; Li, M. Optimum control strategy for all-variable speed chiller plant. J. Cent. South Univ. 2011, 18, 573–579. [Google Scholar]
  19. Huang, S.; Zuo, W.; Sohn, M.D. Improved cooling tower control of legacy chiller plants by optimizing the condenser water setpoint. Build. Environ. 2017, 111, 33–46. [Google Scholar]
  20. Jiang, W.; Reddy, T.A. Reevaluation of the Gordon-Ng performance models for water-cooled chillers. ASHRAE Trans. 2003, 109 Pt 2, 4655. [Google Scholar]
  21. American Society of Heating, Refrigerating and Air-conditioning Engineers (ASHRAE). Energy estimating and modeling methods. In ASHRAE Handbook—Fundamentals; ASHRAE Inc.: Atlanta, GA, USA, 2009. [Google Scholar]
  22. Gordon, J.M.; Ng, K.C. Cool Thermodynamics; Cambridge International Science Publishing: Cambridge, UK, 2000. [Google Scholar]
  23. Jin, G.-Y.; Cai, W.-J.; Lu, L.; Lee, E.L.; Chiang, A. A simplified modeling of mechanical cooling tower for control and optimization of HVAC systems. Energy Convers. Manag. 2007, 48, 355–365. [Google Scholar] [CrossRef]
  24. Park, S.K.; Moon, H.J.; Min, K.C.; Hwang, C.; Kim, S. Application of a multiple linear regression and an artificial neural network model for the heating performance analysis and hourly prediction of a large-scale ground source heat pump system. Energy Build. 2018, 165, 206–215. [Google Scholar] [CrossRef]
  25. GB/T 18430.1-2024; National Standard. Water Chilling (Heat Pump) Packages Using the Vapor Compression Cycle. Standards Press of China: Beijing, China, 2024. (In Chinese)
  26. Rishel, J.; Durkin, T.; Kincaid, B. HVAC Pump Handbook, 2nd ed.; McGraw-Hill Professional: New York, NY, USA, 2006. [Google Scholar]
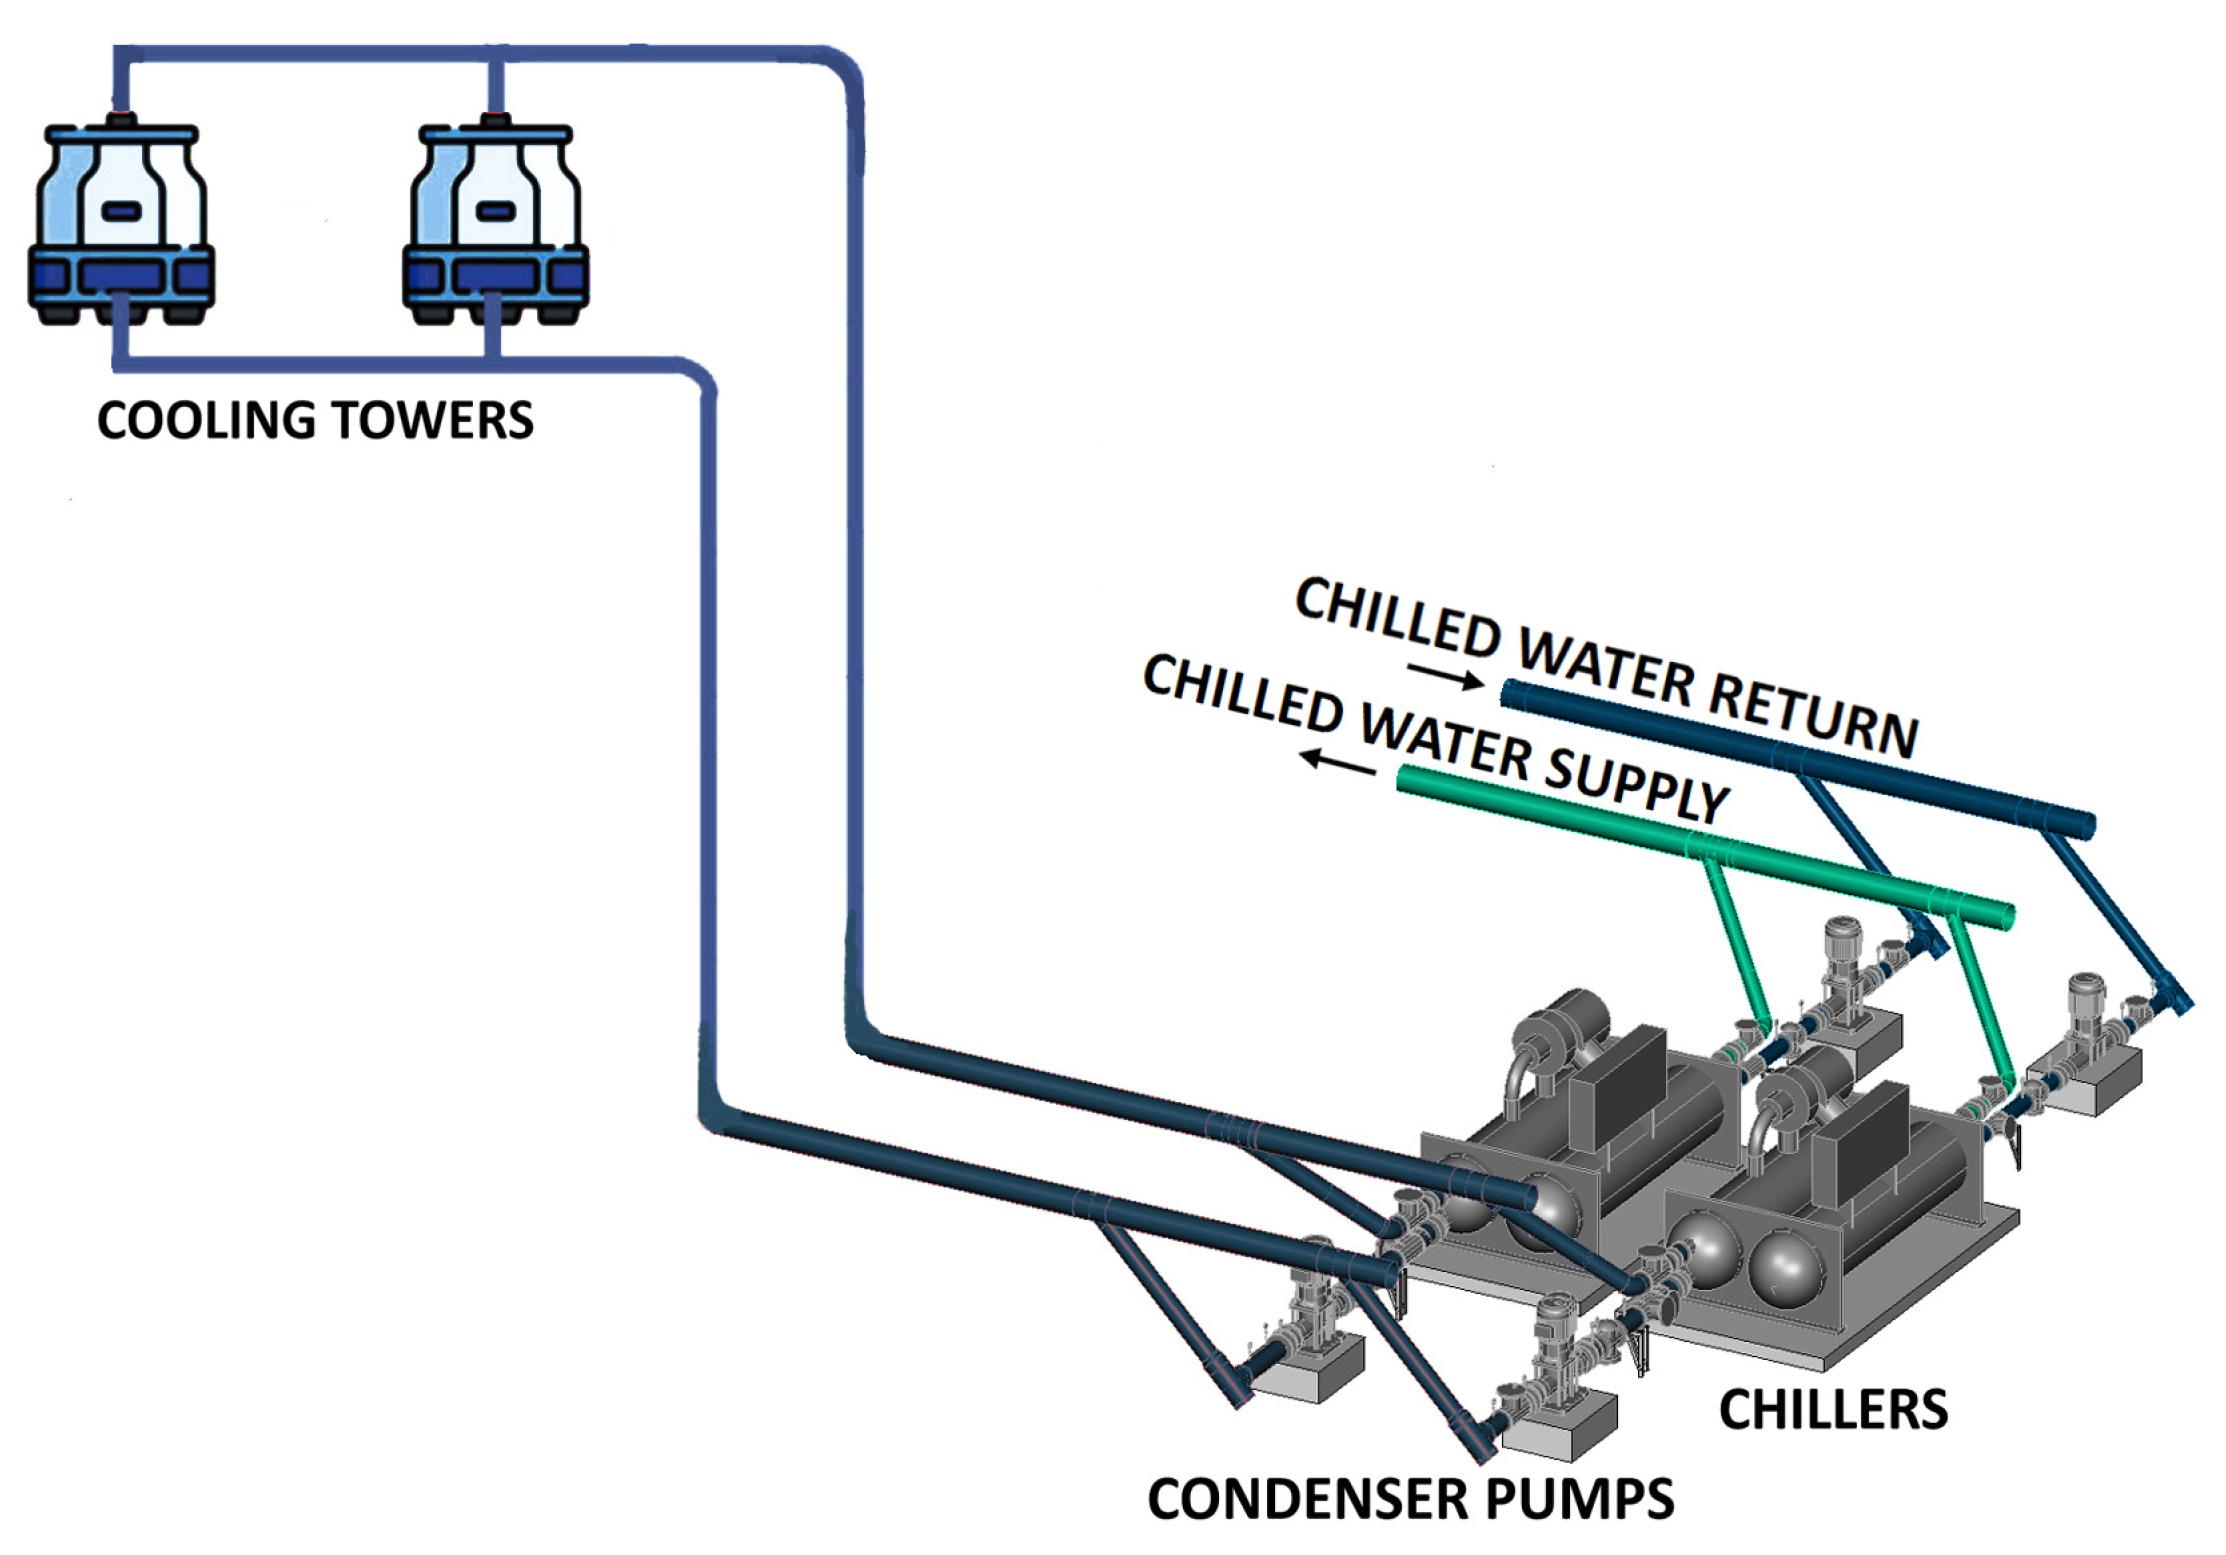
Figure 1. Schematic of the studied cooling water system.
Buildings 15 03568 g001
Figure 2. Measured power vs. predicted power with chiller PLR at (a) 15~40%, and (b) 40~100%.
Buildings 15 03568 g002
Figure 3. Power/derivative vs. CWFR with chiller PLR at (a) 30%, (b) 40%, (c) 60% and (d) 80%.
Buildings 15 03568 g003
Figure 4. Variations of power and derivative with IWTC at 32 °C.
Buildings 15 03568 g004
Figure 5. Power/derivative vs. ARCT with chiller PLR at (a) 40%, (b) 60%, (c) 80% and (d) plant PLR at 60%.
Buildings 15 03568 g005aBuildings 15 03568 g005b
Figure 6. Structure and optimization algorithms of the optimal control system.
Buildings 15 03568 g006
Figure 7. Pump and system curves.
Buildings 15 03568 g007
Figure 8. Pump speeds and power frequencies corresponding to various CWFR.
Buildings 15 03568 g008
Figure 9. Schematic of the experimental control system.
Buildings 15 03568 g009
Figure 10. Pictures of the experimental control system.
Buildings 15 03568 g010
Table 1. Parameters and indicators of chiller power models.
ModelC1C2C3NMBECVRMSE
Model for the conditions of PLR at 40~100%−0.026569436.7936870.0054616−4.8789 × 10−40.0218
Model for the conditions of PLR at 15~40%0.0195159223.7547630.00635775.8995 × 10−60.0282
Table 2. Performance comparison at different operating conditions.
Operating
Condition 1
Operating
Condition 2
Operating
Condition 3
Operating
Condition 4
Plant PLR60%40%30%20%
Chiller PLR60%80%60%40%
Number of operating chillers2111
Number of operating cooling towers2222
Optimal CWFR (kg/s)66786652
Optimal airflow rate (kg/s)5746.541.435.7
Variable-speed pump/fan modeChiller power (kW)321.2214.7156.2104.7
Pump power (kW)17.412.58.75.5
Fan power (kW)15.48.96.34.3
Total power (kW)354236.1171.2114.5
Constant-speed pump/fan
mode
Chiller power (kW)308216.7154100.6
Pump power (kW)32.816.416.416.4
Fan power (kW)30151515
Total power (kW)370.8248.1185.4132
Total power saved (kW)16.81214.217.5
Power-saving rate4.53%4.84%7.66%13.23%
Table 3. Number of searches and optimized results.
Set Values of Chiller Load
(kW)
Number of Searches for Optimal CWFR
(Times)
Number of Searches for Optimal ARCT
(Times)
Optimal CWFR
(kg/s)
Optimal ARCT
(kg/s)
Optimized Power
Frequency of Pump
(Hz)
Optimized Power
Frequency of Fans
(Hz)
5284542443033.2721 (fixed at 25 Hz)
7043637523636.1025
8802934593838.5126.61
10552331664140.6928.71
12321729714342.9530.11
14071126784645.2932.21
1583624824847.2933.61
Disclaimer/Publisher’s Note: The statements, opinions and data contained in all publications are solely those of the individual author(s) and contributor(s) and not of MDPI and/or the editor(s). MDPI and/or the editor(s) disclaim responsibility for any injury to people or property resulting from any ideas, methods, instructions or products referred to in the content.