Article

Deformation and Energy-Based Comparison of Outrigger Locations in RC and BRB-Core Tall Buildings Under Repetitive Earthquakes

by
İlhan Emre İnam
1,* and
Ahmet Anıl Dindar
2
1
Department of Civil Engineering, Gebze Technical University, Kocaeli 41400, Türkiye
2
MARTEST Research and Training Center, Gebze Technical University, Kocaeli 41400, Türkiye
*
Author to whom correspondence should be addressed.
Buildings 2025, 15(19), 3563; https://doi.org/10.3390/buildings15193563
Submission received: 26 August 2025 / Revised: 19 September 2025 / Accepted: 30 September 2025 / Published: 2 October 2025
(This article belongs to the Section Building Structures)

Abstract

The aim of this study is to investigate how the positioning of outrigger systems affects the seismic performance of high-rise buildings with either reinforced concrete (RC) shear walls or buckling-restrained braces (BRBs) in the core. Two important questions emerge as the focus and direction of the study: (1) How does the structural performance change when outriggers are placed at various positions? (2) How do outrigger systems affect structural behavior under sequential earthquake scenarios? Nonlinear time history analyses were employed as the primary methodology to evaluate the seismic response of the two reinforced concrete buildings with 24 and 48 stories, respectively. Each building type was developed for two different core configurations: one with a reinforced concrete shear wall core and the other with a BRB core system. Each analysis model also includes outrigger systems constructed with BRBs positioned at different floor levels. Five sequential ground motion records were used to assess the effects of main- and aftershocks. The analysis results were evaluated not only based on displacement and force demands but also using a damage measure called the Park-Ang Damage Index. In addition, displacement-based metrics, particularly the maximum inter-story drift ratio (MISD), were also utilized to quantify lateral displacement demands under consecutive seismic loading. With the results obtained from this study, it is aimed to provide design-oriented insights into the most effective use of outrigger systems formed with BRB in high-rise RC buildings and their functions in increasing seismic resistance, especially in areas likely to experience consecutive seismic events.

1. Introduction

Earthquake engineers face significant challenges in performance-based seismic design for high-rise buildings, particularly in ensuring structural strength under strong ground motions and limiting earthquake-induced damage. Due to increasing urbanization and the vertical growth needs of cities, the importance of lateral load-bearing systems used in high-rise buildings has significantly increased, and outrigger systems have emerged as one of the most challenging and effective solutions among these systems. Outrigger systems utilize a mechanical connection between the perimeter columns and the core element of high-rise buildings, increasing the overall rigidity of the structure and significantly reducing lateral drifts. In particular, optimal placement of outrigger systems at selected floor levels can significantly enhance energy dissipation capacity and improve earthquake resistance in tall buildings. Although high-rise buildings with reinforced concrete shear wall (SW) core systems have been extensively studied in the literature, the formation of the central core system with buckling-restrained bracing (BRB) and its interaction with outrigger systems may offer novel opportunities for improved seismic resistance. This study fills the gap in this area by extensively examining the optimal location for outrigger systems in high-rise buildings where the central core system is being formed with either BRB or reinforced concrete (RC) shear walls.
A substantial body of research has examined the performance of outrigger systems in tall buildings. Previous studies have primarily focused on RC shear wall core systems and their drift-reduction performance when combined with outrigger and belt truss mechanisms. In a comparative study of outrigger placement in braced-core and RC buildings, Samadi et al. [1] found that outrigger systems, especially when placed at higher levels, provided higher relative story drift reduction when the core system was formed by RC wall systems. Placing outrigger systems at two-thirds or the top of the building height provided noteworthy lateral stiffness increases; the effect was less pronounced in braced core configurations. Due to their high energy dissipation nature and high ductility, the application of core systems with BRB elements has recently become widespread in the literature. Buildings with RC frame systems with BRB systems have been studied in studies such as Xing et al. [2] and Bai et al. [3], and it has been shown that BRBs greatly increase the stiffness and energy dissipation in both static and cyclic loading cases. These two studies did not evaluate cumulative damage under sequential seismic loading scenarios. The focus was primarily on the optimum location or interaction behavior.
Furthermore, for core systems such as BRB and RC shear walls, there is a lack of comparative analyses addressing how outrigger locations simultaneously affect both deformation and performance measures with respect to energy. Ayash et al. [4] studied the application of BRBs as outrigger systems at various floor levels. They showed that in double outrigger systems, the three-quarter and top height positions give the most suitable results in terms of inter-story drift ratio and base shear force. Recent contributions further support these trends—showing that mid-height or upper-level outriggers reduce lateral demands (Sthapit et al. [5]), multiple-outrigger systems outperform single layouts (Kushwaha et al. [6]), and damped outriggers enhance energy dissipation (Morales-Beltrán et al. [7])—consistent with the energy-based assessment adopted herein.
In terms of seismic sequence effects, Hatzivassiliou et al. [8] and Hoveidae et al. [9] have shown that repeated ground motions cause cumulative damage accumulation, especially in RC buildings. Their studies underline the importance of considering the main- and aftershock sequences in structural performance assessments. The effects of these sequences are more pronounced in flexible systems, and their consideration becomes essential in determining the residual capacities and long-term functionality of the structure. Energy-based seismic assessment methods have been utilized as complementary to traditional drift-based assessments. Kim et al. [10] and Choi et al. [11] proposed energy-based structural frameworks for BRB systems and related the input seismic energy with the hysteretic energy dissipation capacity of BRB elements. These studies confirm the potential of using energy-based engineering demand parameters to better capture the real demand-capacity relationship under earthquake loading. The application of these energy-based approaches to multi-degree structural systems has been investigated by Gholami et al. [12] and Leelataviwat et al. [13], where compatibility with performance-based design scenarios has been demonstrated.
To evaluate seismic damage, several researchers have proposed indices in the literature. The indices include solely the peak deformation, strength ratios, or cumulative change in the response of the system. The most rational approach is to use a combined index that accounts for both deformation and energy dissipation. Park and Ang [14] introduced a widely used damage index that accounts for both maximum displacement and cumulative energy dissipation, forming the foundation for many recent applications. Kappos [15] and Cao et al. [16] further developed the damage indices for reinforced concrete buildings, emphasizing the expression of global and story-level damage. Hait et al. [17] performed global damage index (GDI) prediction in RC buildings. The results show that the artificial neural network model is quite successful, especially with inputs such as dissipated hysteretic energy and ductility, which are energy-based parameters. Kalateh et al. [18] evaluated the post-earthquake safety of buildings under mainshock-aftershock scenarios. For this purpose, they [18] used the Park-Ang damage index. In their studied model, they produced residual collapse capacity plots and showed that structures cannot be considered safe when a certain damage level is exceeded as measured by the damage index levels.
A recent study by Zhao et al. [19] assessed the seismic behavior of a steel trussed-tube high-rise using improved performance-based procedures. While their system differs from RC or BRB-core structures, it highlights the broader trend toward system-level seismic performance evaluation. Although their system differs from RC or BRB-core configurations, Zhao et al. [19] emphasized system-level performance evaluation, which aligns with the objectives of the present study. It has been observed that there is a lack of comparative studies that evaluate outrigger effectiveness in RC core buildings under sequential seismic loading using both deformation- and energy-based metrics. The current work aims to fill this research gap by offering a thorough assessment of outrigger performance, particularly in tall buildings exposed to seismic events. Prior studies such as Samadi et al. [1] and Ayash et al. [4] have investigated the impact of outrigger positioning in tall buildings with RC or BRB core systems; they primarily focused on single-event seismic analyses or drift-based evaluations. Similarly, Choi et al. [11] introduced energy-based design using hysteretic energy spectra but did not consider the interaction of BRB outriggers with core systems under repeated seismic events. The novelty of the current study lies in the combined use of deformation-based (MISD) and energy-based (Park–Ang damage index) metrics under sequential earthquake sequences to evaluate the cumulative performance of outrigger systems in both RC wall and BRB-core high-rise buildings. Furthermore, the study proposes a comparative framework that identifies optimum outrigger positions (e.g., 0.33H and 1.0H) under multiple seismic scenarios, a topic that remains underexplored in the existing literature. This integrative and comparative approach provides design-oriented insights for improving seismic resilience under realistic ground motion sequences.
Structural analysis models were created for 24- and 48-story buildings with central core systems, namely BRB and RC shear wall scenarios. To facilitate comparative evaluation, the analysis was structured in a staged manner: for each configuration, a reference model without outriggers was analyzed first, followed by models including outrigger systems at selected levels. To assess the impact of the outrigger configuration, both single-level and double-level outrigger layouts were considered. By using the nonlinear time history analysis method, five separate consecutive earthquake events were employed to model noteworthy historical consecutive earthquake events. In summary, this study aims to assess cumulative damage using energy-based damage indices, investigate the impact of outrigger level on inter-story drift in buildings with BRB and RC core systems, and identify an appropriate outrigger location that balances displacement reduction and energy dissipation.
The originality of this study lies in the combined evaluation of both deformation-based and energy-based seismic performance criteria under successive earthquake effects. While previous studies have mostly focused on single earthquake scenarios or only RC wall core systems, this study comparatively addresses RC wall and BRB core systems, examines different outrigger positions (including single and double arrangements), and evaluates cumulative damage using the Park–Ang damage index and the maximum inter-story drift ratio. This comprehensive approach offers new design perspectives for outrigger optimization in tall buildings subjected to successive earthquakes.

2. Numerical Validation of BRB

Numerical modeling of BRB elements in the analyses was based on the experimental studies. Two specimens were chosen for the experimental investigations [20,21], and numerical representations of BRB elements were simulated using the structural analysis program ETABS [22]. BRB specimens have the labels “1G” [20] and “3G” [21], respectively. Multilinear plastic link members were used to represent BRBs using the hardening hysteresis model that is available in ETABS. Both isotropic and kinematic hardening components that are present in the inelastic cyclic behavior of typical concrete-encased BRBs are taken into consideration by the given “BRB hardening hysteresis” model. It permits the backbone curve to evolve progressively in a manner consistent with observed hardening behavior under repeated loading [22]. Hardening factor, maximum plastic deformation level at complete hardening, maximum accumulated plastic deformation level at full hardening, and proportion of accumulated plastic deformation are typical coefficients defined to carry out this modeling. The following are the BRB hardening parameters: The hardening factor for the 1G specimen is taken as 1.31, and the maximum and cumulative plastic deformations exceed 7. The 3G specimen has a maximum and cumulative plastic deformation value of 6.5, and the hardening factor rises to 1.38. For both 1G and 3G specimens, the percentage of accumulated plastic deformation is considered as zero. The hardening behavior and plastic deformation capability of BRBs under cyclic stress are described by these parameters. It should be noted that a thorough optimization study was carried out to identify the hardening parameters that best matched the experimental results.
The selection of basic BRB modeling parameters, including the hardening factor and maximum/cumulative plastic deformation values, was performed through an iterative calibration process. For each experimental specimen (1G and 3G), pushover and reverse-cyclic simulations were performed in ETABS to replicate their stiffness and hysteretic behavior. The parameters were adjusted repeatedly—through dozens of trial-and-error iterations—until the numerical force-displacement curves closely matched those obtained from experimental testing. As shown in Figure 1, the final parameter set provides a strong agreement with the measured cyclic response. Nevertheless, these calibrated values are specific to the tested specimens and may require adjustment when modeling other BRB configurations or geometries.
Figure 1 compares the BRB responses from experimental data with the findings of numerical analysis. It has been noted that the numerical analysis tool’s multilinear plastic link type, hysteresis type, and related characteristics may accurately represent the BRB response.

3. Numerical Models

3.1. Studied Archetypes

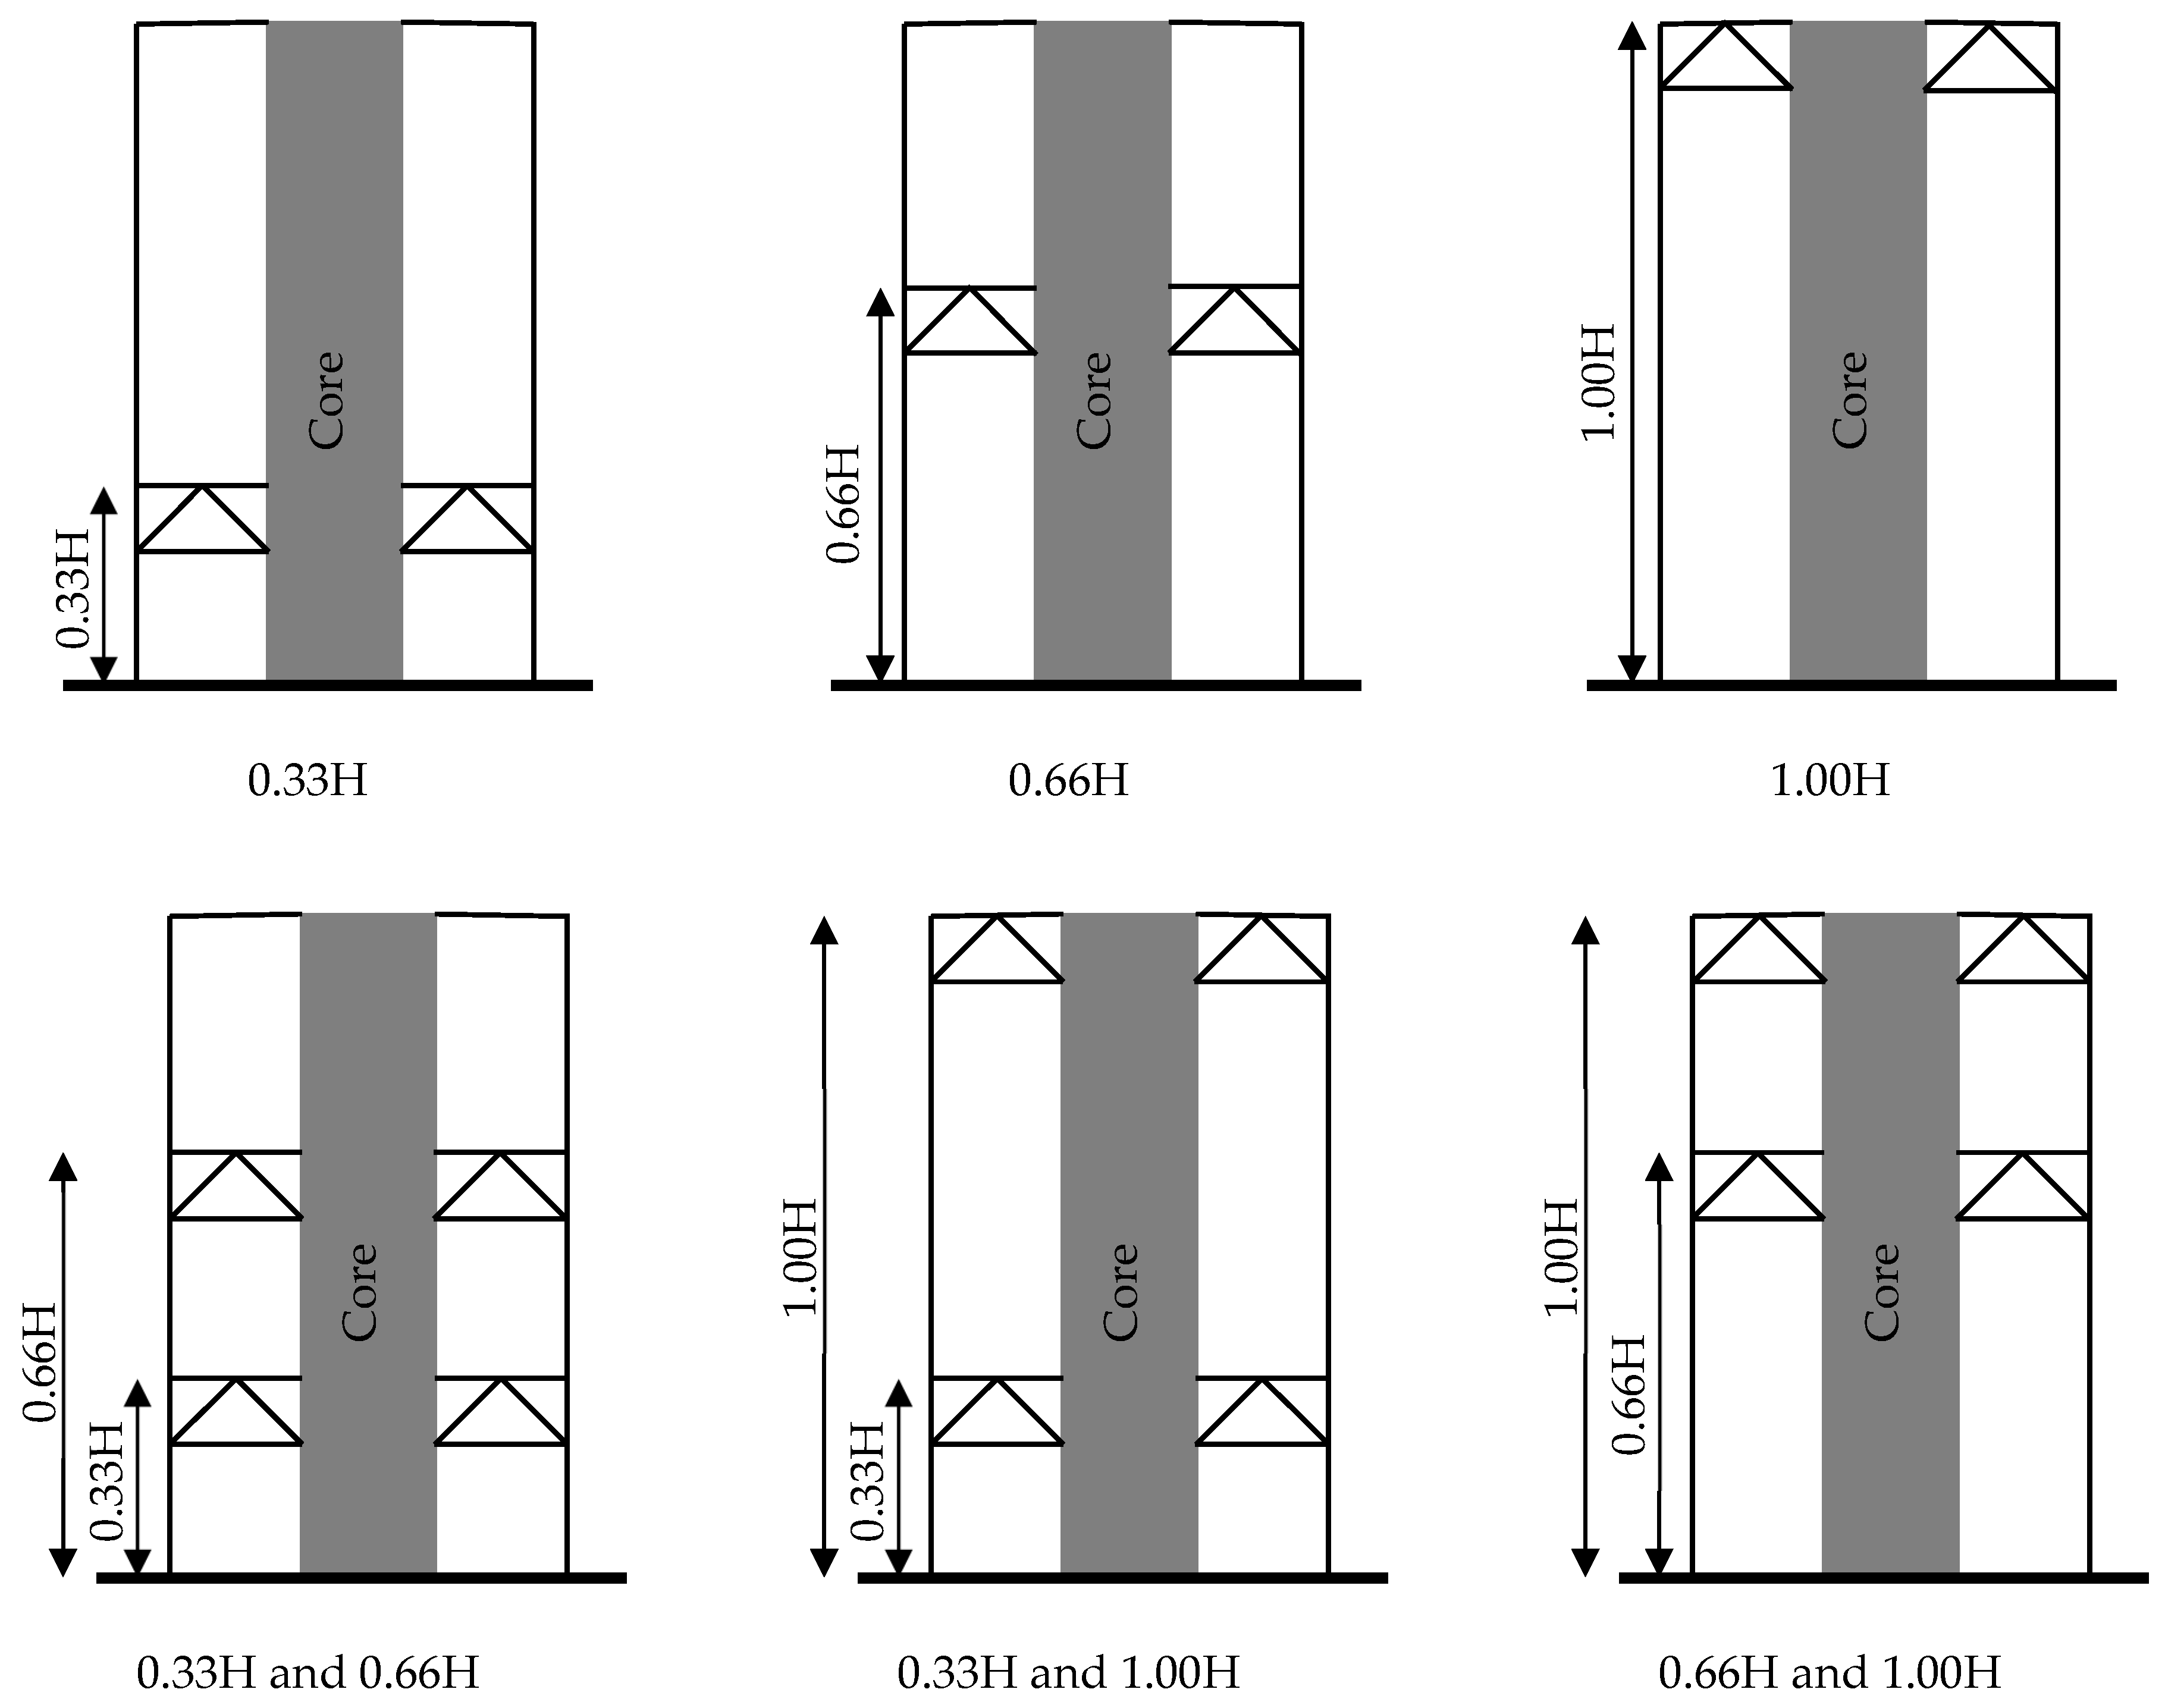
Two-dimensional structural models of four high-rise RC buildings were developed using ETABS software [22]. Each model consists of RC beams, columns, and a core system located at the center of the structure, which is either BRB or RC SW. The story height of all models was taken as 4 m. Specifically, the prototypes include the following: (1) a 24-story building with a BRB core; (2) a 24-story building with an RC SW core; (3) a 48-story building with a BRB core; and (4) a 48-story building with an RC SW core. All models assume regular configuration without vertical or horizontal irregularities. A distributed superimposed dead load of 3 kN/m2 and a live load of 2.4 kN/m2 were applied to all beams. Each numerical model is labeled using the format “MA-BCD-F”, where “A” indicates the number of stories (e.g., 24 or 48), “BCD” represents the core system type: BRB-braced or RC shear wall, and “F” denotes the outrigger configuration, specifying the floor levels where BRB outriggers are placed. The outrigger configurations include both single-level and dual-level layouts, representing different placements (e.g., 0.33H, 0.66H, or 1.0H of building height), as shown in Figure 2. For example, the model code “M24-BRB-3” refers to a 24-story building with a BRB core and the third type of outrigger configuration. Typical elevation views for 24- and 48-story prototype buildings are illustrated in Figure 3.
In all building models, the concrete compressive strength was assumed to be 40 MPa. The yield strength of both longitudinal and transverse reinforcement was taken as 500 MPa. For the columns, the longitudinal reinforcement ratio was set at 1%. In the beams, both the top and bottom longitudinal reinforcements were modeled with a cross-sectional area of 1256 mm2. For the RC shear wall cores, the vertical reinforcement ratio was defined as 0.25%, as per the Turkish Building Earthquake Code [23]. The dimensions of the column, beam, and wall are given in Table 1.
The estimated fundamental vibration periods of the examined building types are listed in Table 2. The effect of outrigger systems established at different floor levels on the dynamic characteristics of the structures is observed. As can be understood from the results, the presence of outriggers at different floor levels significantly affects the fundamental vibration period. It is revealed that this effect varies depending on both the building height and the type of the core system in the center. Among the building types where a single outrigger is used, the placement of the outrigger system at the 0.33H level, especially in the M24-BRB and M48-BRB models, has been observed to produce the shortest fundamental vibration periods. Buildings with BRB cores exhibit longer periods than buildings with SW cores in all configurations. However, buildings with BRB cores are found to be more sensitive to outrigger placement, and more significant decreases in the period are observed when double outriggers are used. For example, in the M48-BRB model, the fundamental period decreases from 8.861 s (no outrigger) to 8.498 s (0.33H and 0.66H double outrigger), while in the M48-SW model, the corresponding decrease is from 7.653 s to 7.196 s.
All archetypes are plan-symmetric, with the core and outrigger perimeter columns aligned with the mass/stiffness centers. The 2D models were thus adopted to isolate the vertical effect of outrigger placement while intentionally suppressing torsion. Consequently, the fundamental period T1 in Table 2 should be viewed as a slight upper bound relative to a full 3D model (torsional/diaphragm coupling would modestly stiffen the system), which is conservative for drift. However, the 2D idealization may under-represent local torsional drift concentrations near perimeter corners; project-specific design should be verified in 3D. Under the symmetric conditions considered here, added 3D stiffness is expected to affect all layouts similarly, so the relative ranking of outrigger locations reported remains robust.
For each archetype, an eigenvalue analysis was performed, and the first five modes in the analysis direction are summarized in Table A1 in Appendix A (periods T i , modal mass participation M x , i , and cumulative j i M x , j ). Nonlinear time-history analyses employed classical proportional damping implemented as Rayleigh damping [24].

3.2. Numerical Modeling of BRBs

The overall length of a BRB was determined by measuring the distance between the work points at each end. The area of the elastic part was 3.2 times that of the yielding section. The area of the yielding part was 2.4 times that of the transition segment. The yielding, transition, and elastic sections were each 0.24, 0.06, and 0.7 times the overall BRB length, respectively. BRB core plates are composed of structural steel that has a 235 MPa yield strength.
BRB outriggers are implemented in ETABS as link elements with nonlinear axial bilinear hysteresis; end rotations are released (pinned), with axial local DOF (U1) active and lateral local DOFs (U2–U3) restrained, yielding an axial-only brace idealization. Links are attached to the core and perimeter through short, rigid offsets.
Equation (1) provides the expression for the relative BRB stiffness ratio (k), where K F R represents the story stiffness of the RC 2D frame and K B R B is the total stiffness of the BRBs per story. The response spectrum analysis (RSA) approach was used to determine story stiffnesses in order to calculate the necessary BRB stiffness ratio. 24- and 48-story bare frames that have been fully modeled in accordance with the seismic characteristics and standard processes specified by the Turkish seismic legislation [23].
k = K B R B K F R
Assuming a story stiffness ratio (k) of one, the total required core (yield section) areas of each archetype are calculated and summarized in Table 3. The yield section area of the BRB core of each archetype was determined based on the story stiffness values. The yielding section area on the first floor was calculated according to the story stiffness. For the upper floors, the building height was divided into three equal parts, and the largest story stiffness in that part was determined for each part. The yielding section area corresponding to this largest value was used in these equal parts divided into three. The BRB core was proportioned using the story stiffness ratio (k) with a target k = 1 to balance stiffness with the moment frame and isolate outrigger-placement effects across archetypes. After dividing the height into three equal parts, each zone was sized to the largest story stiffness within that zone, so k ≈ 1 at the controlling story and slightly above unity at non-controlling stories (conservative for drifts). We note qualitatively that k > 1 would shorten fundamental period T, reduce drifts, and increase energy demand in the core, whereas k < 1 would lengthen T, shift demand to the frame, and reduce outrigger axial effectiveness.
The ultimate and yield displacements of all BRBs were calculated as 51.45 and 4.79 mm, respectively. To define the bilinear force-displacement relation, the input ultimate and yielding forces for 24-story and 48-story buildings are listed in Table 3. The other BRB parameters specified are as follows: the hardening factor is selected as 1.3, the maximum plastic and accumulated plastic deformations at full hardening as a ratio of yield are both seven, and the proportion of accumulated plastic deformation is set to zero.
The RC column’s nonlinear behavior was simulated utilizing a deformation-controlled fiber. The length of the plastic hinge was fixed at half the height of the column cross-section. The Takeda hysteresis type and deformation-controlled bending moment (M3) hinge type were used to simulate the nonlinear behavior of the RC beam. The length of the plastic hinge was taken at half the height of the beam cross-section. The theoretical stress–strain model for confined concrete was considered, and yielding moment, ultimate moment, yielding curvature, and ultimate curvature were determined as 437.8 kNm, 452.04 kNm, 0.00608 1/m, and 0.158 1/m, respectively, taking confinement effects into account as per Mander [25]. 75% of the maximum moment was determined to be the drop percentage, which shows the decrease in moment after achieving the maximum.

4. Nonlinear Time History Analyses

4.1. Mainshock-Aftershock Seismic Sequences

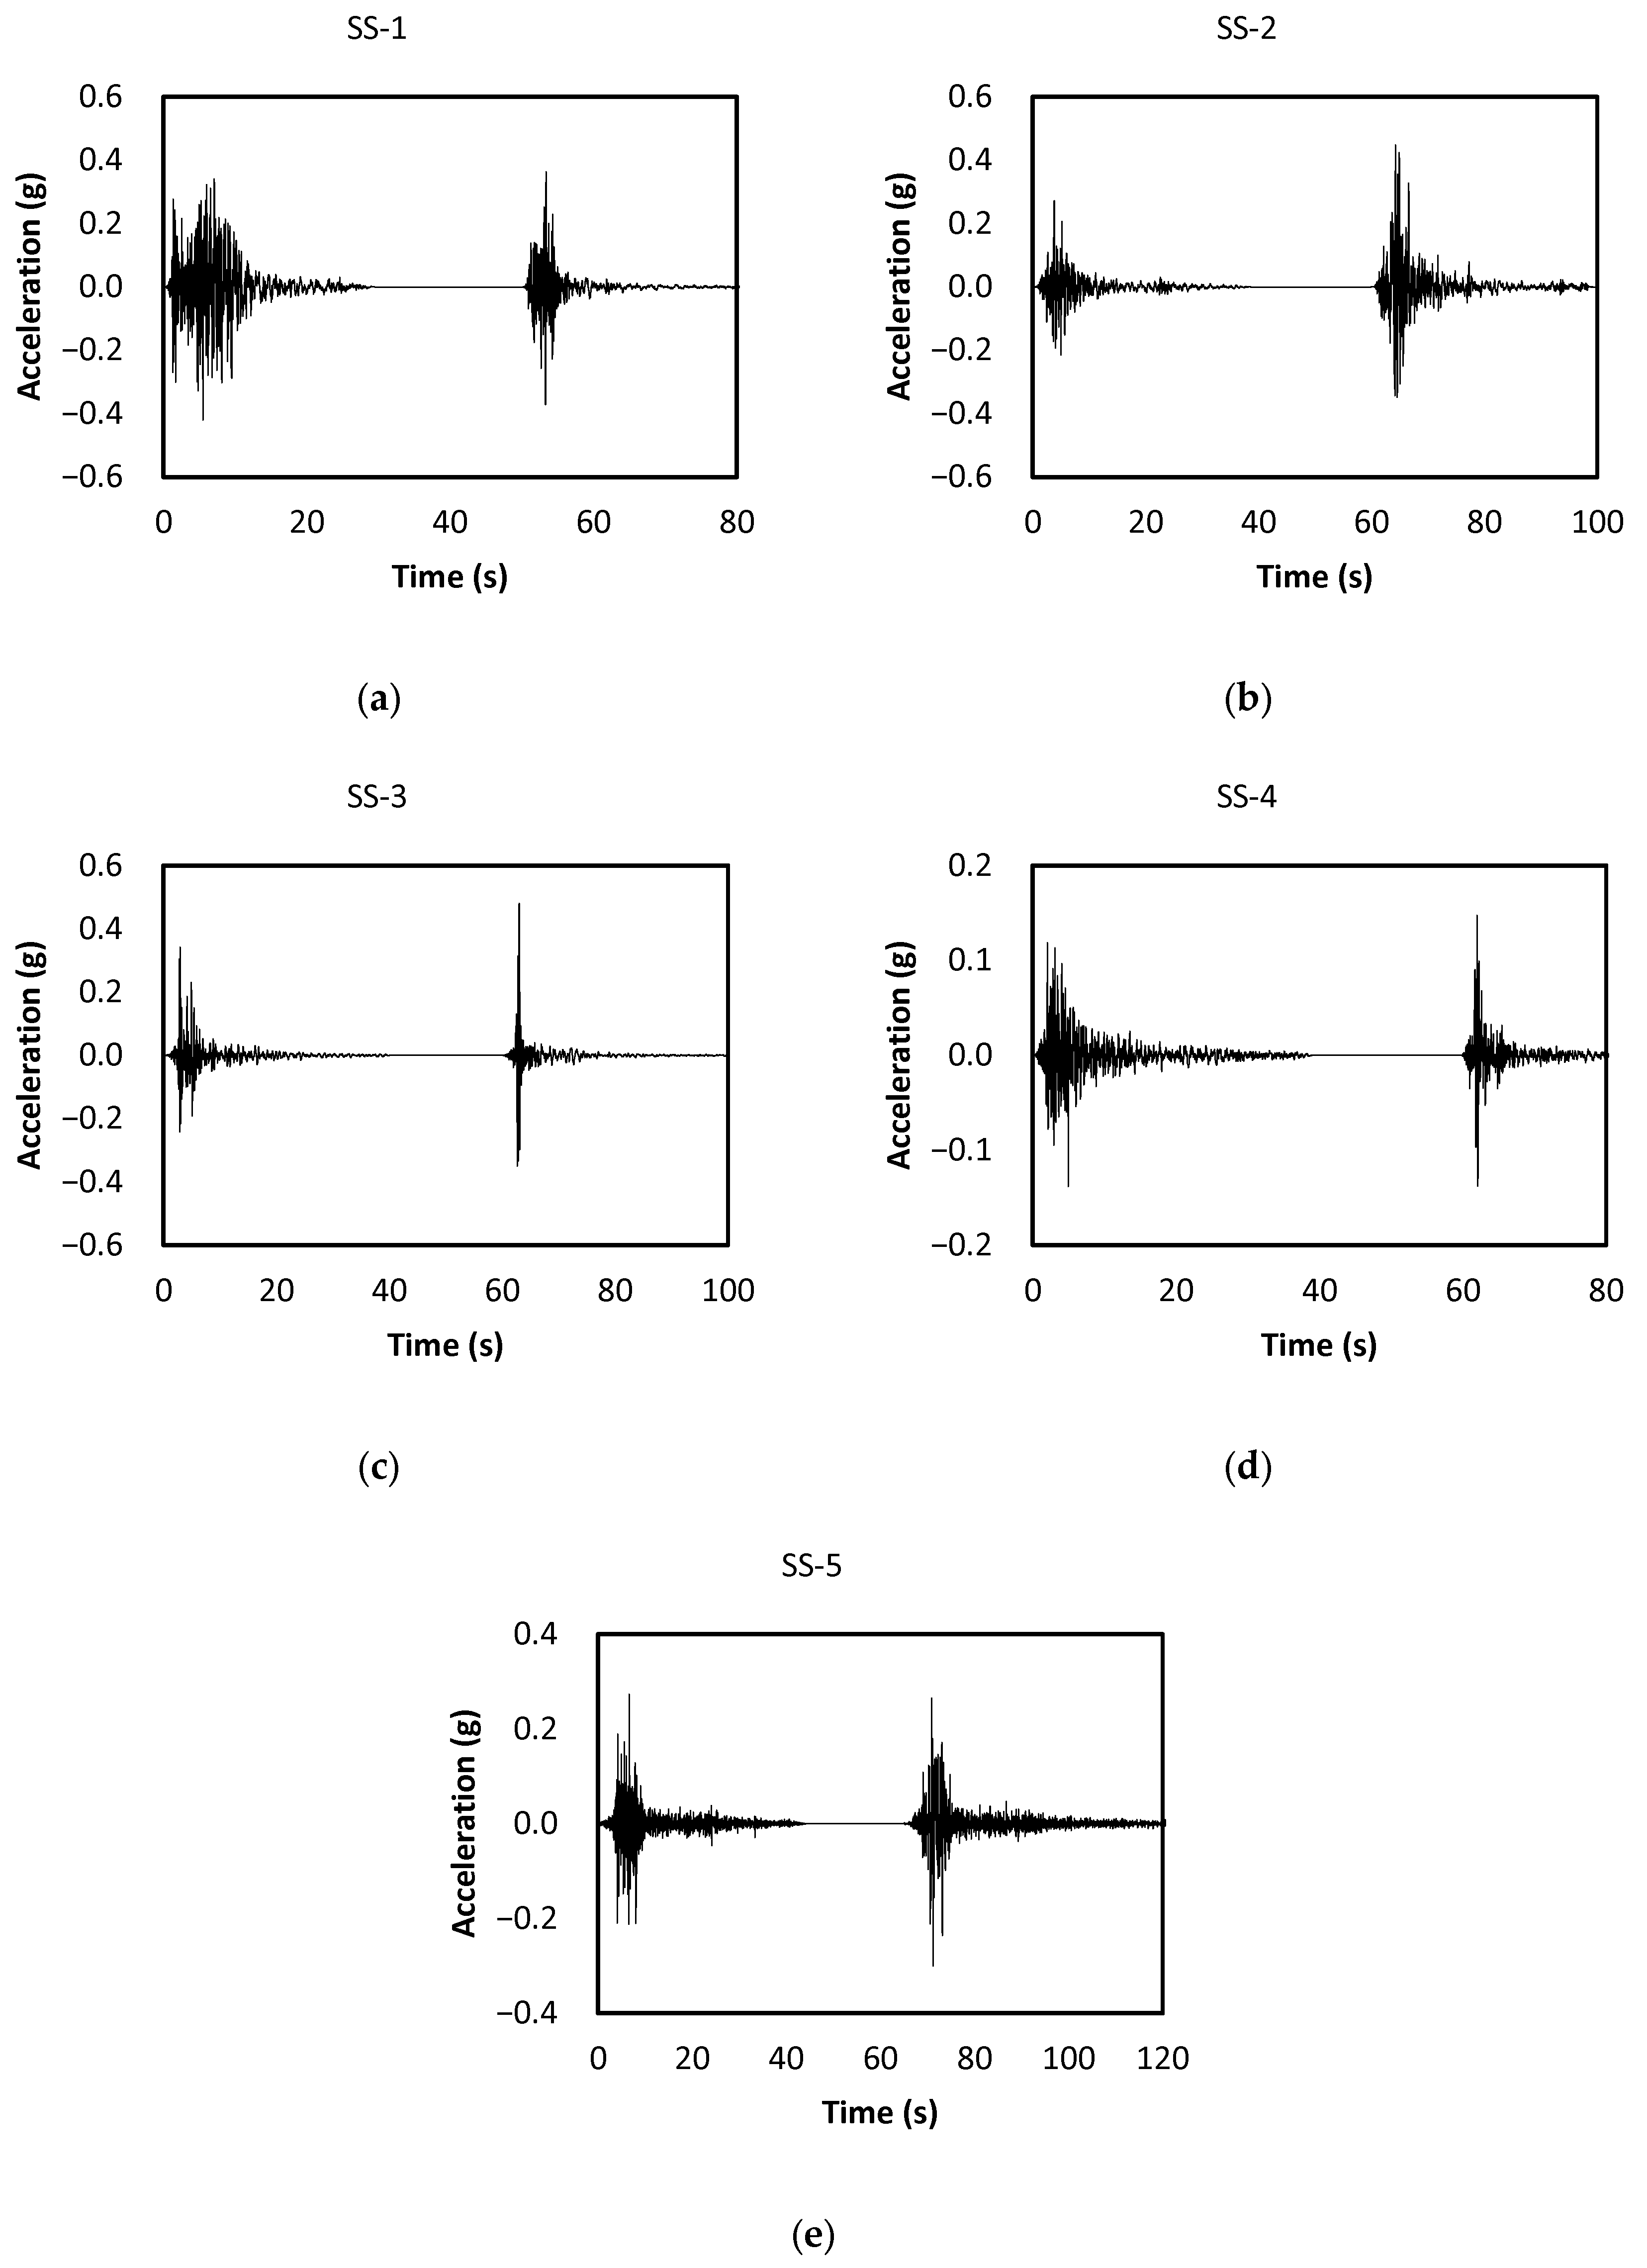
The dynamic behavior of the sample frame models analyzed in ETABS [1] was examined using the dynamic time history analysis method. To precisely record the dynamic response of the building, a time step size of 0.01 s is selected. The structure is subjected to time-varying dynamic loads, and the nonlinear direct integration method is used to describe these loading conditions. Time step integration was performed using the Hilber–Hughes–Taylor technique. The time series was subjected to a scaling technique because of the high intensity of the ground motions. The sequential acceleration recordings were characterized by combining individual ground motion records. A time gap of 20 s with zero acceleration was applied between main and aftershock seismic events to allow the structure to rest at the end of the first seismic event and before the subsequent seismic event. This approach is consistent with practices adopted in previous studies such as Hatzivassiliou et al. [8] and Hoveidae et al. [9], where an artificial rest period was introduced to better observe the residual effects and ensure clear interpretation between events. Studied individual seismic records and seismic sequence events are listed in Table 4, which have been downloaded from the strong ground motion database of the Pacific Earthquake Engineering Research (PEER) Center [26]. For each event, we report Arias intensity ( I a ) [27] and significant duration ( D S   5 95 ) [28,29] in Table 4. In this study, aftershocks were not scaled differently from mainshocks; both were matched to the same DBE target, and we discuss implications in Section 6.3. Figure 4 illustrates the acceleration time history plots for examined seismic sequences.

4.2. Matching the Accelerograms

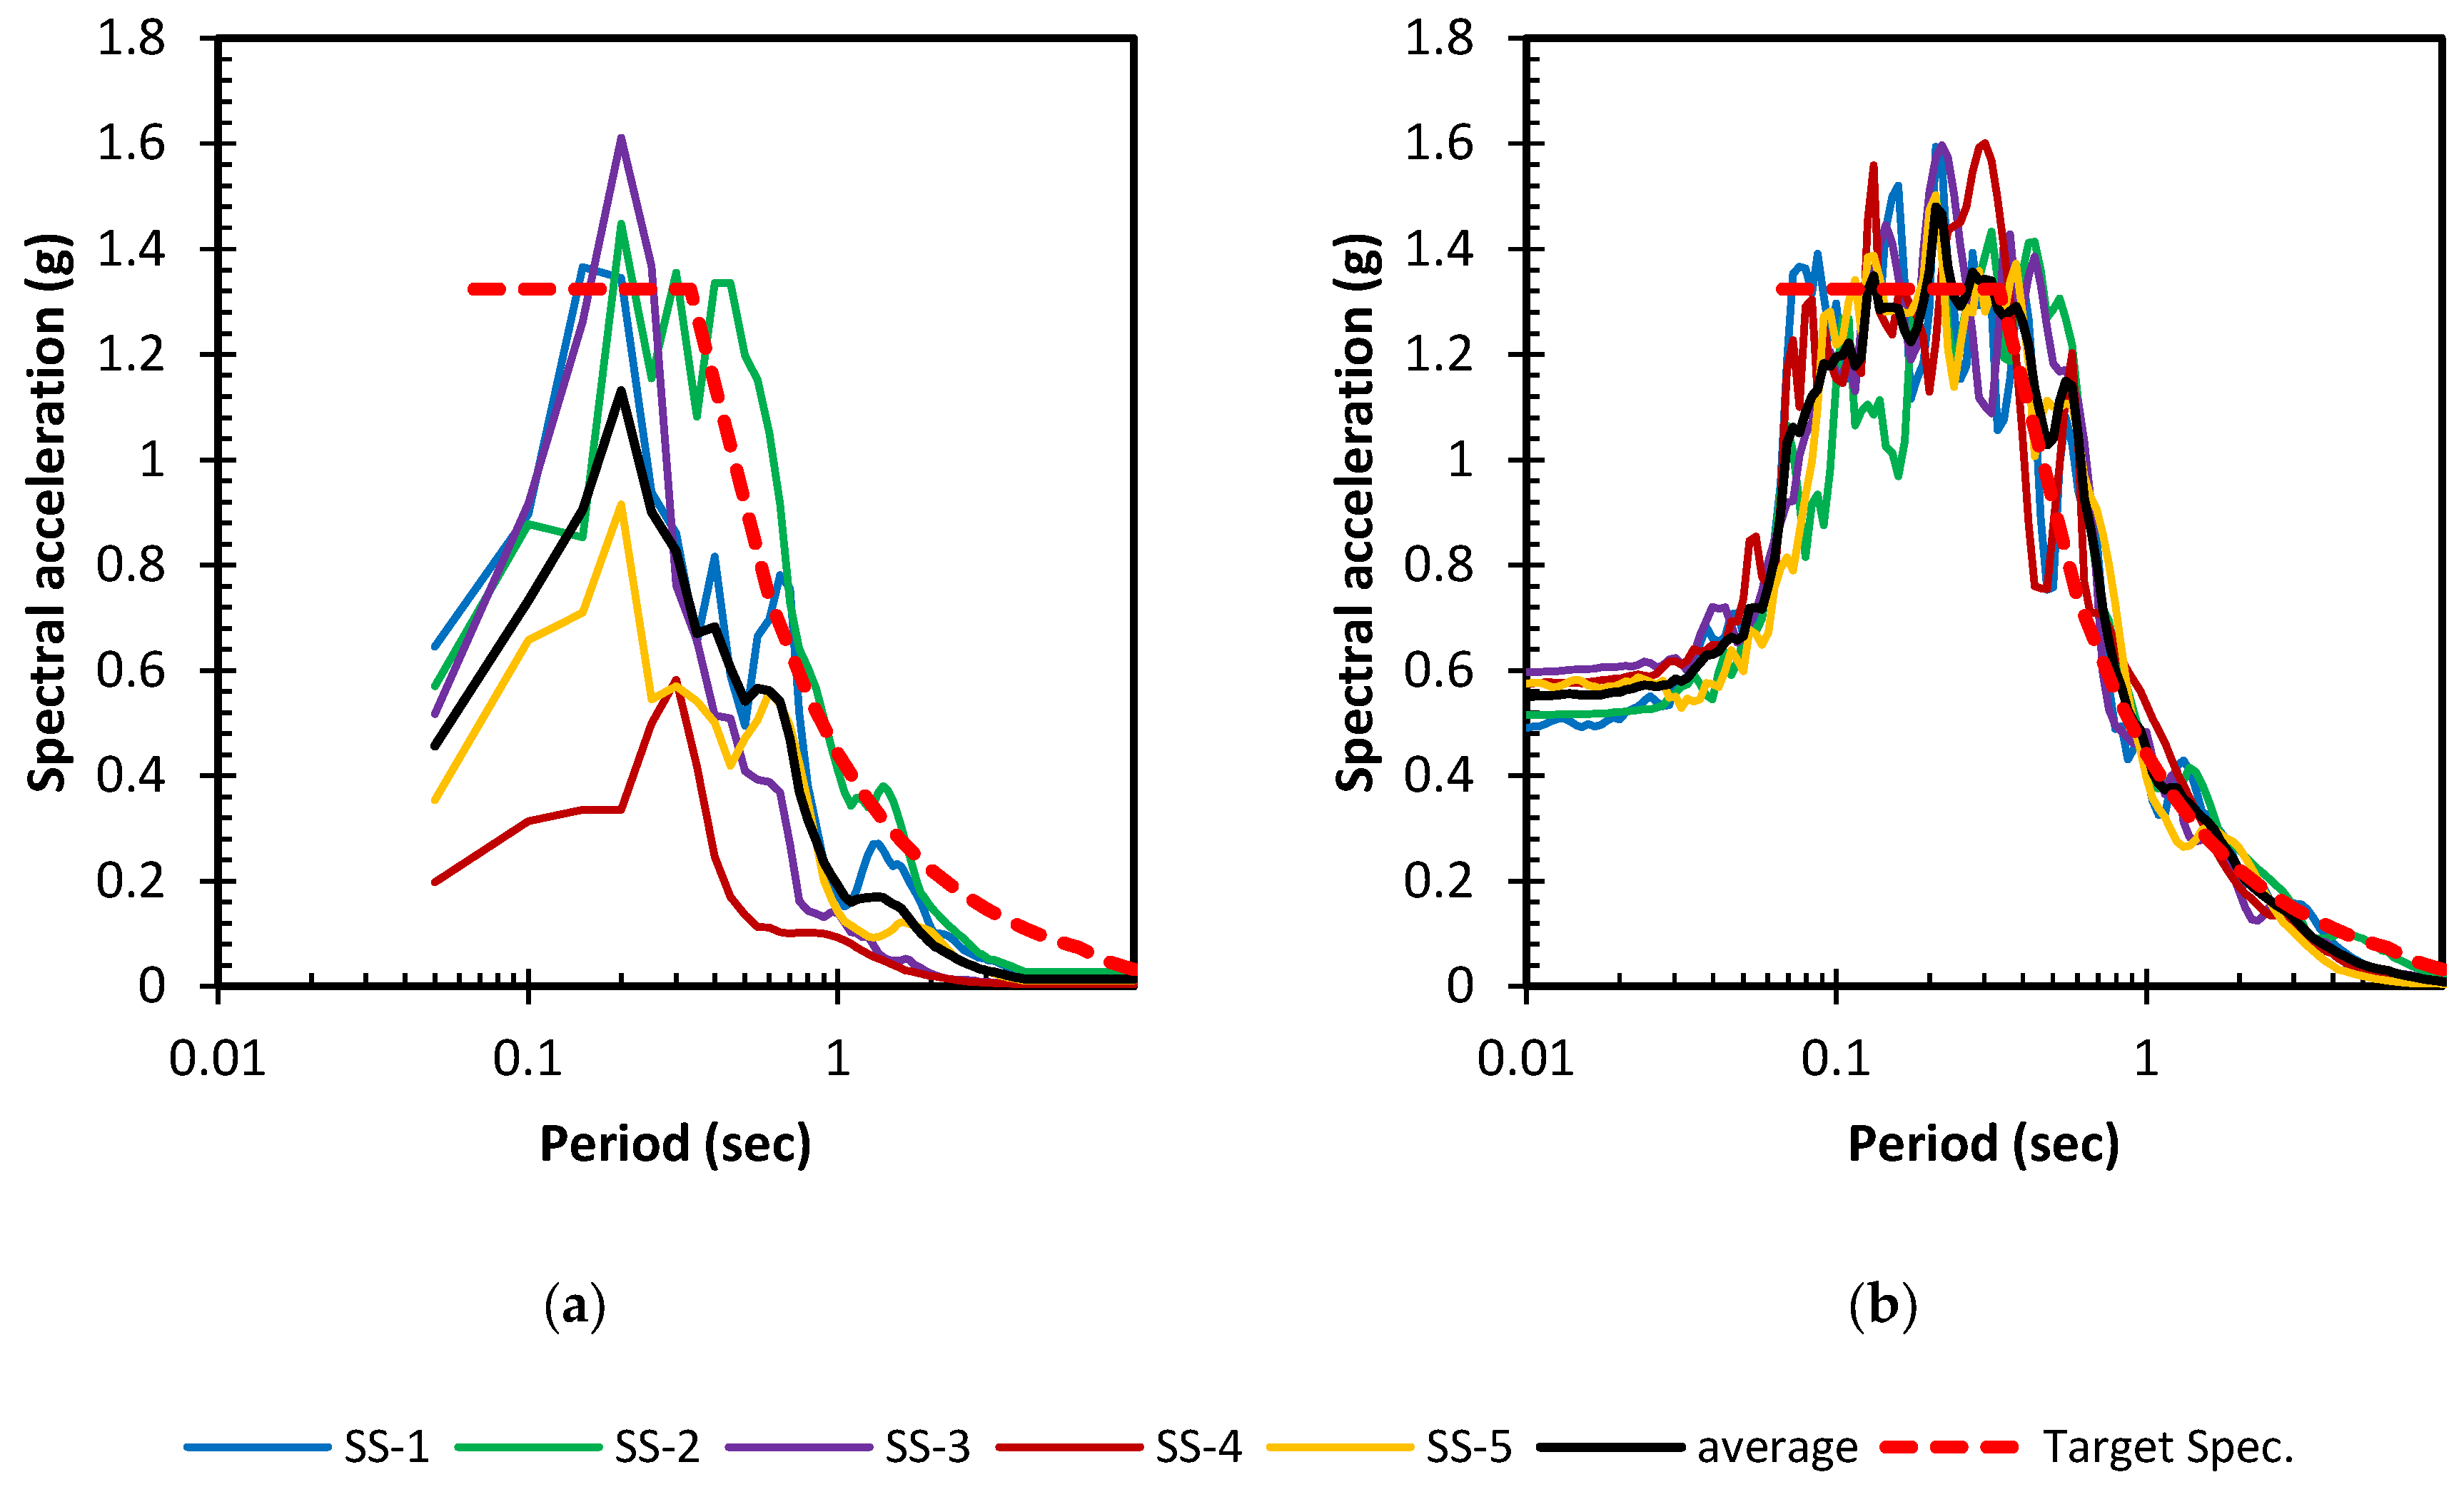
Comparison of the elastic acceleration spectrum for each acceleration-time record from seismic sequence no. 1 to no. 5 (SS-1 to SS-5) and the average record with the design target spectrum is shown in Figure 5. The selected earthquake records were matched by transforming them to achieve spectral compatibility with the defined design spectrum. The target design spectrum aligns with the Design Basis Earthquake (DBE) level, where the spectral magnitudes have a 10% probability of exceedance in 50 years.

5. Effect of Outrigger Level on Structural Response

The following section uses abbreviations that represent key seismic performance measures: MIDR (maximum inter-story drift ratio), SDI (story damage index), and GDI (global damage index). These are defined at their first appearance and used consistently throughout the analysis.

5.1. Maximum Inter-Story Drift Ratio

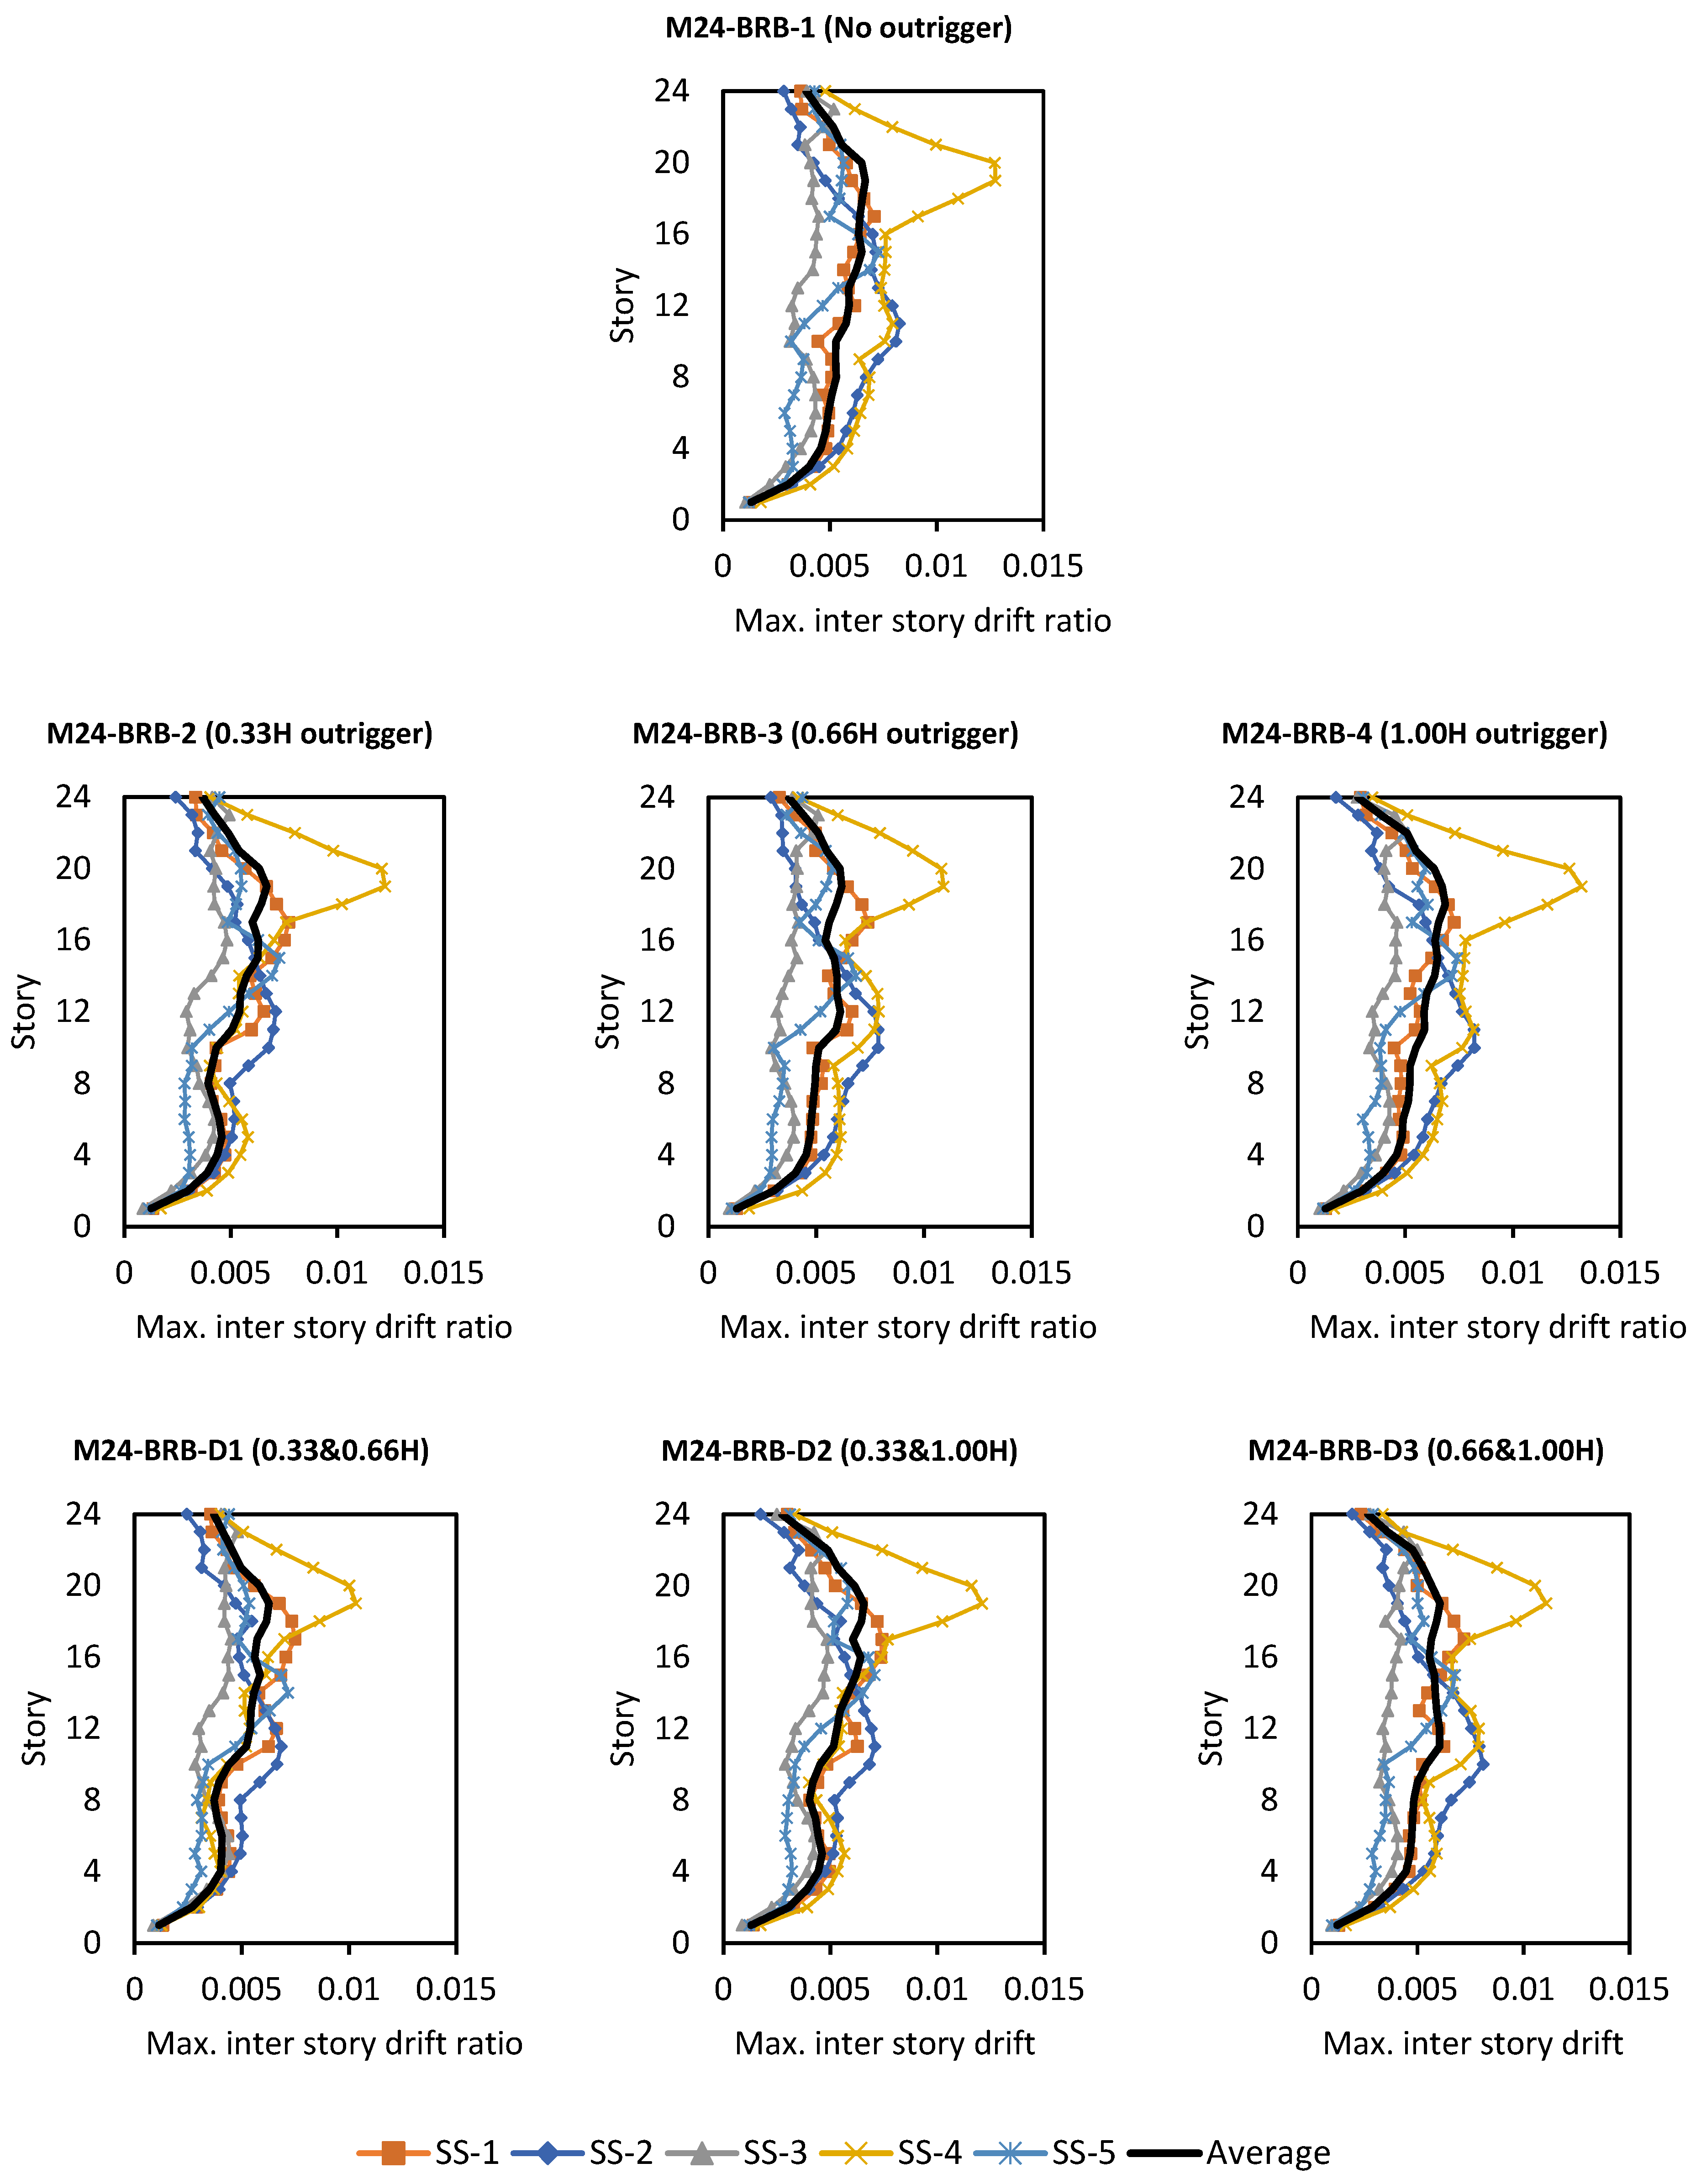
Figure 6, Figure 7, Figure 8 and Figure 9 present the maximum inter-story drift ratios obtained from nonlinear time history analyses for 24- and 48-story buildings with two different core systems: BRB core (Mxx-BRB) and RC SW core (Mxx-SW). Each configuration was examined under five seismic sequences (SS-1 to SS-5), and the average drift response is considered for comparative evaluation.
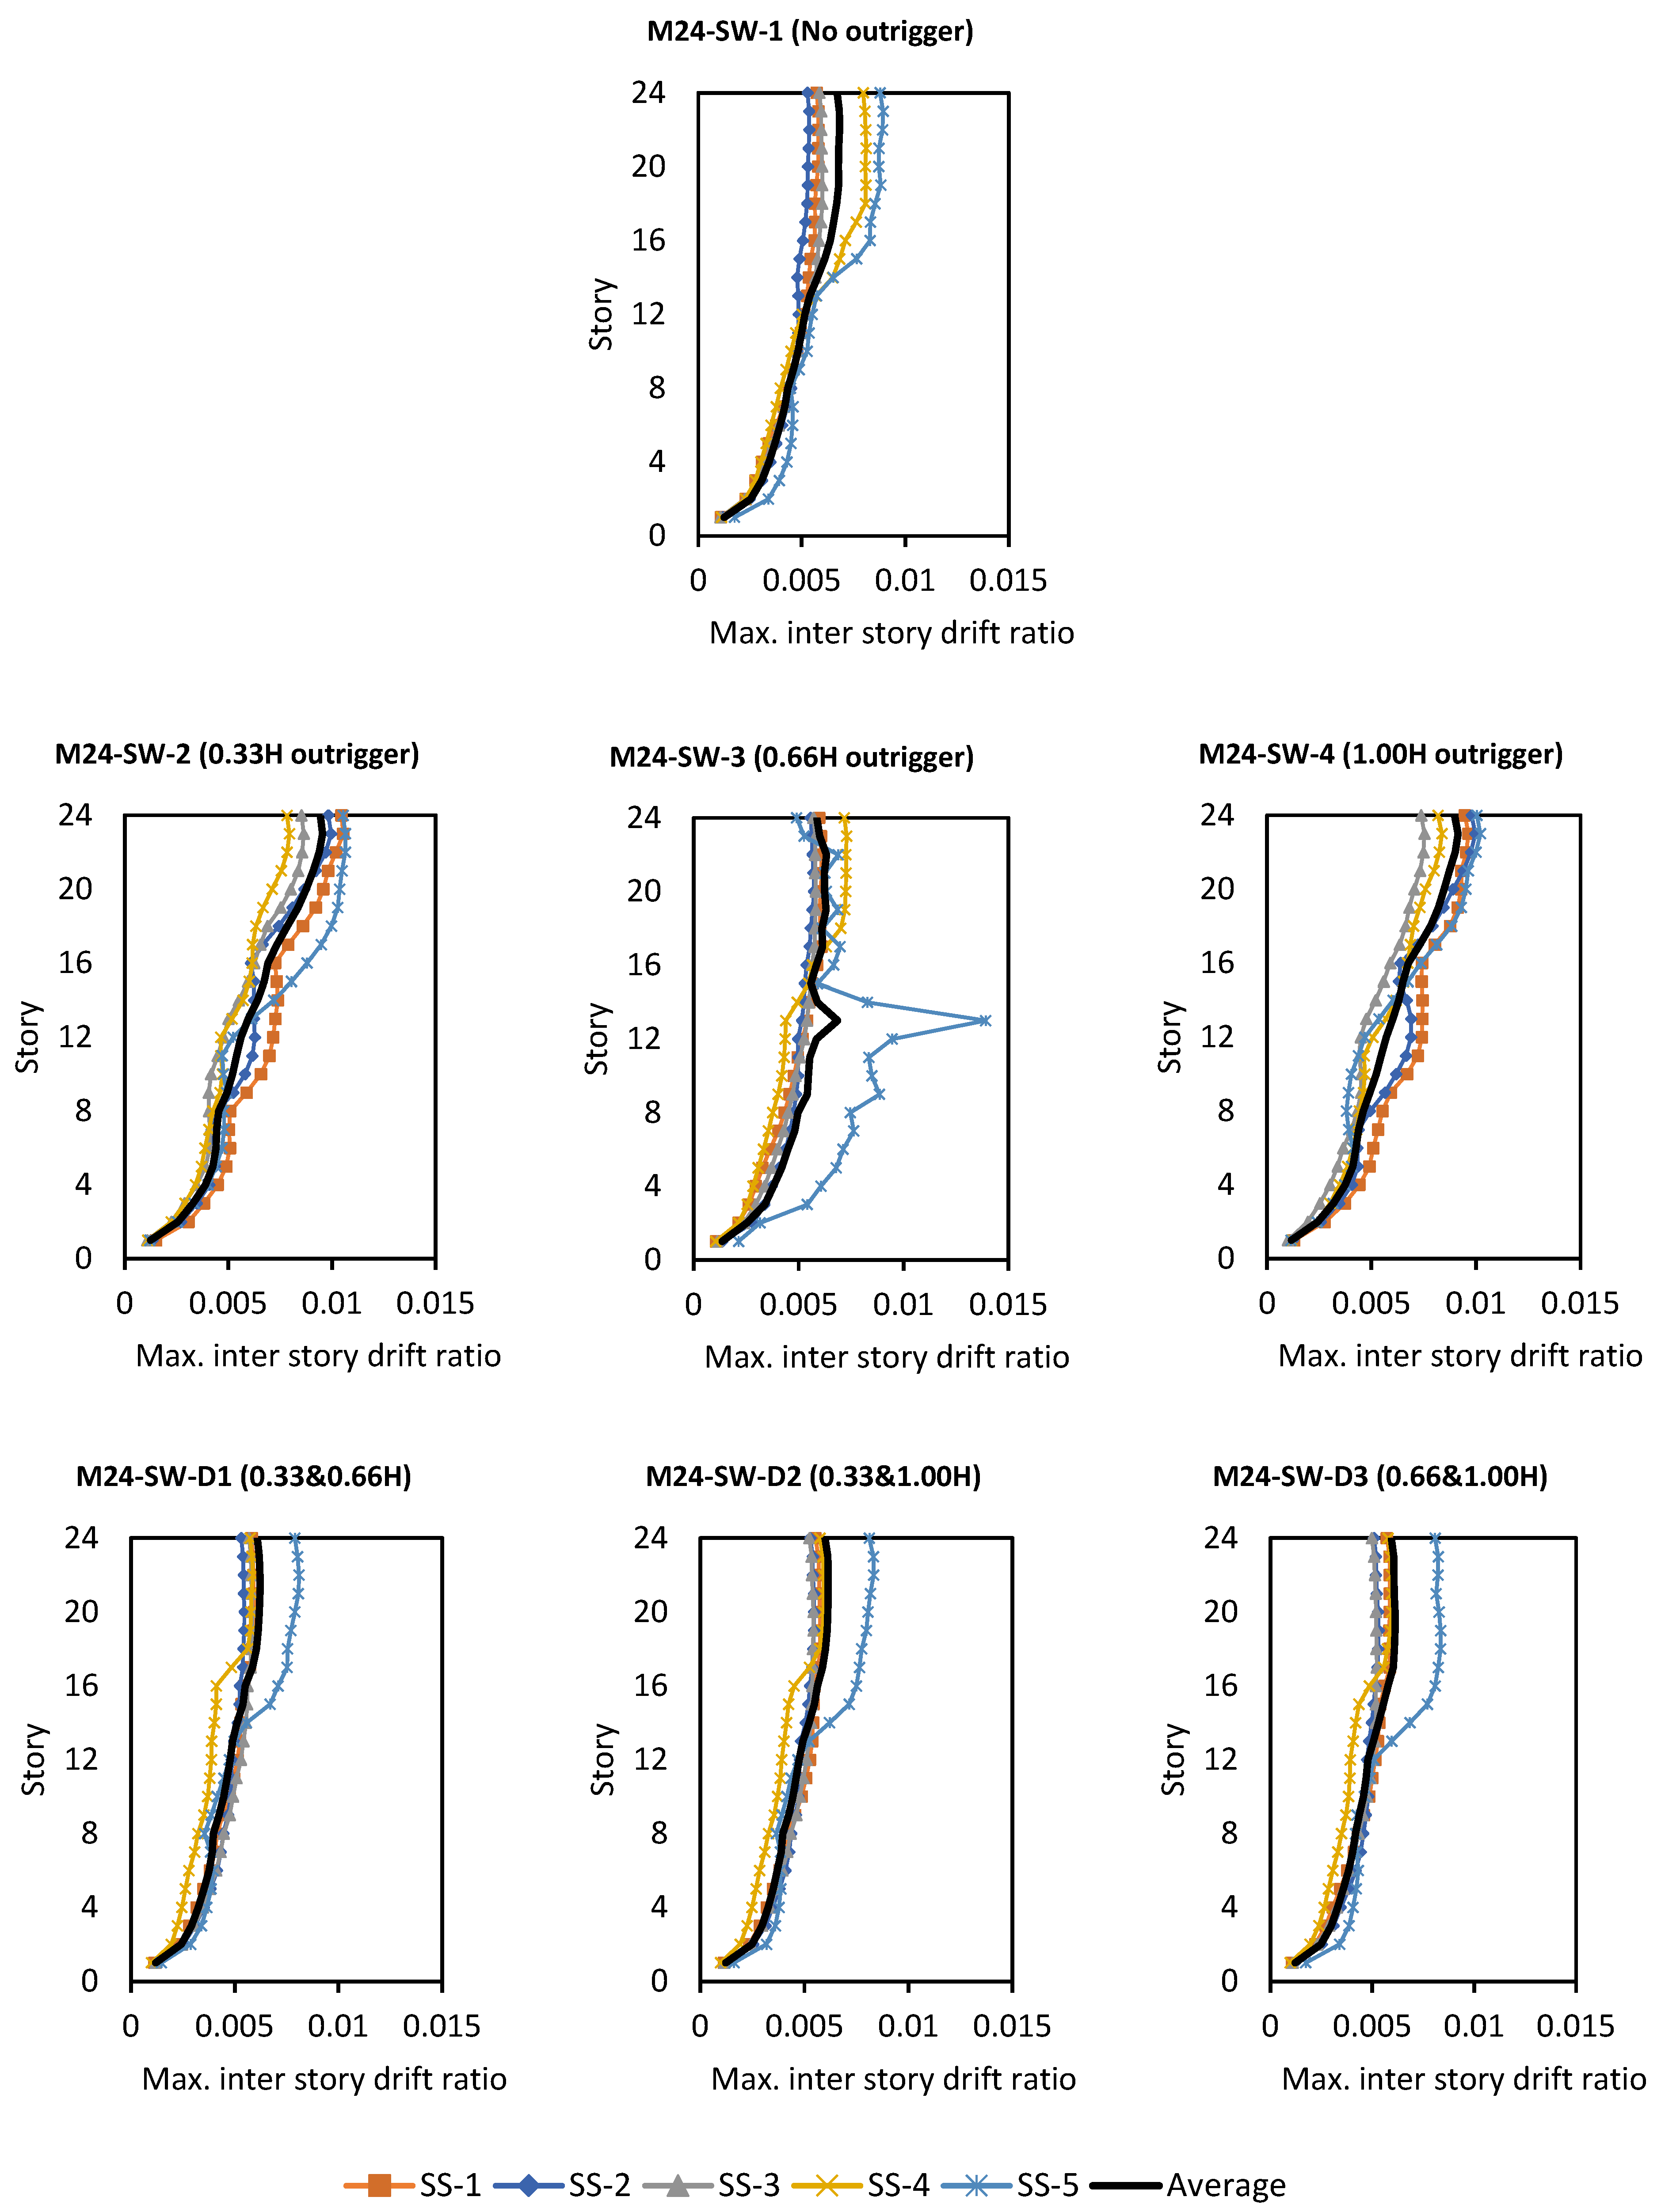
Effect of outrigger placement in M24-BRB series buildings is illustrated in Figure 6. The model without outrigger (M24-BRB-1) shows the highest inter-story drift for 24-story BRB core buildings, which is interpreted as indicating weaker lateral stiffness. A single outrigger installed at 0.33H (M24-BRB-2) significantly reduces the drift values, suggesting that buildings benefit more from lower outrigger placement when it comes to stiffness increase. Stiffness control is significantly increased in double outrigger systems, especially at 0.33H and 0.66H (M24-BRB-D1), which creates the effect of a more evenly distributed building stiffness throughout the height.
Response of 24-story core buildings with shear walls (M24-SW Series) are shown in Figure 7. Although the relative floor drift at the lowest floor is less in the reinforced concrete core wall (M24-SW-1) building than in its BRB core counterpart, a similar trend was observed. The relative floor drift results were more suitable when the outrigger system was positioned at lower floors, for example, M24-SW-2 model (0.33H), than when the outrigger system was positioned at a higher snow level, for example, the 1.0H M24-SW-4. The formation of the outrigger system on two floors, especially the M24-SW-D2 model (0.33H and 1.0H), showed a more consistent relative floor drift distribution.
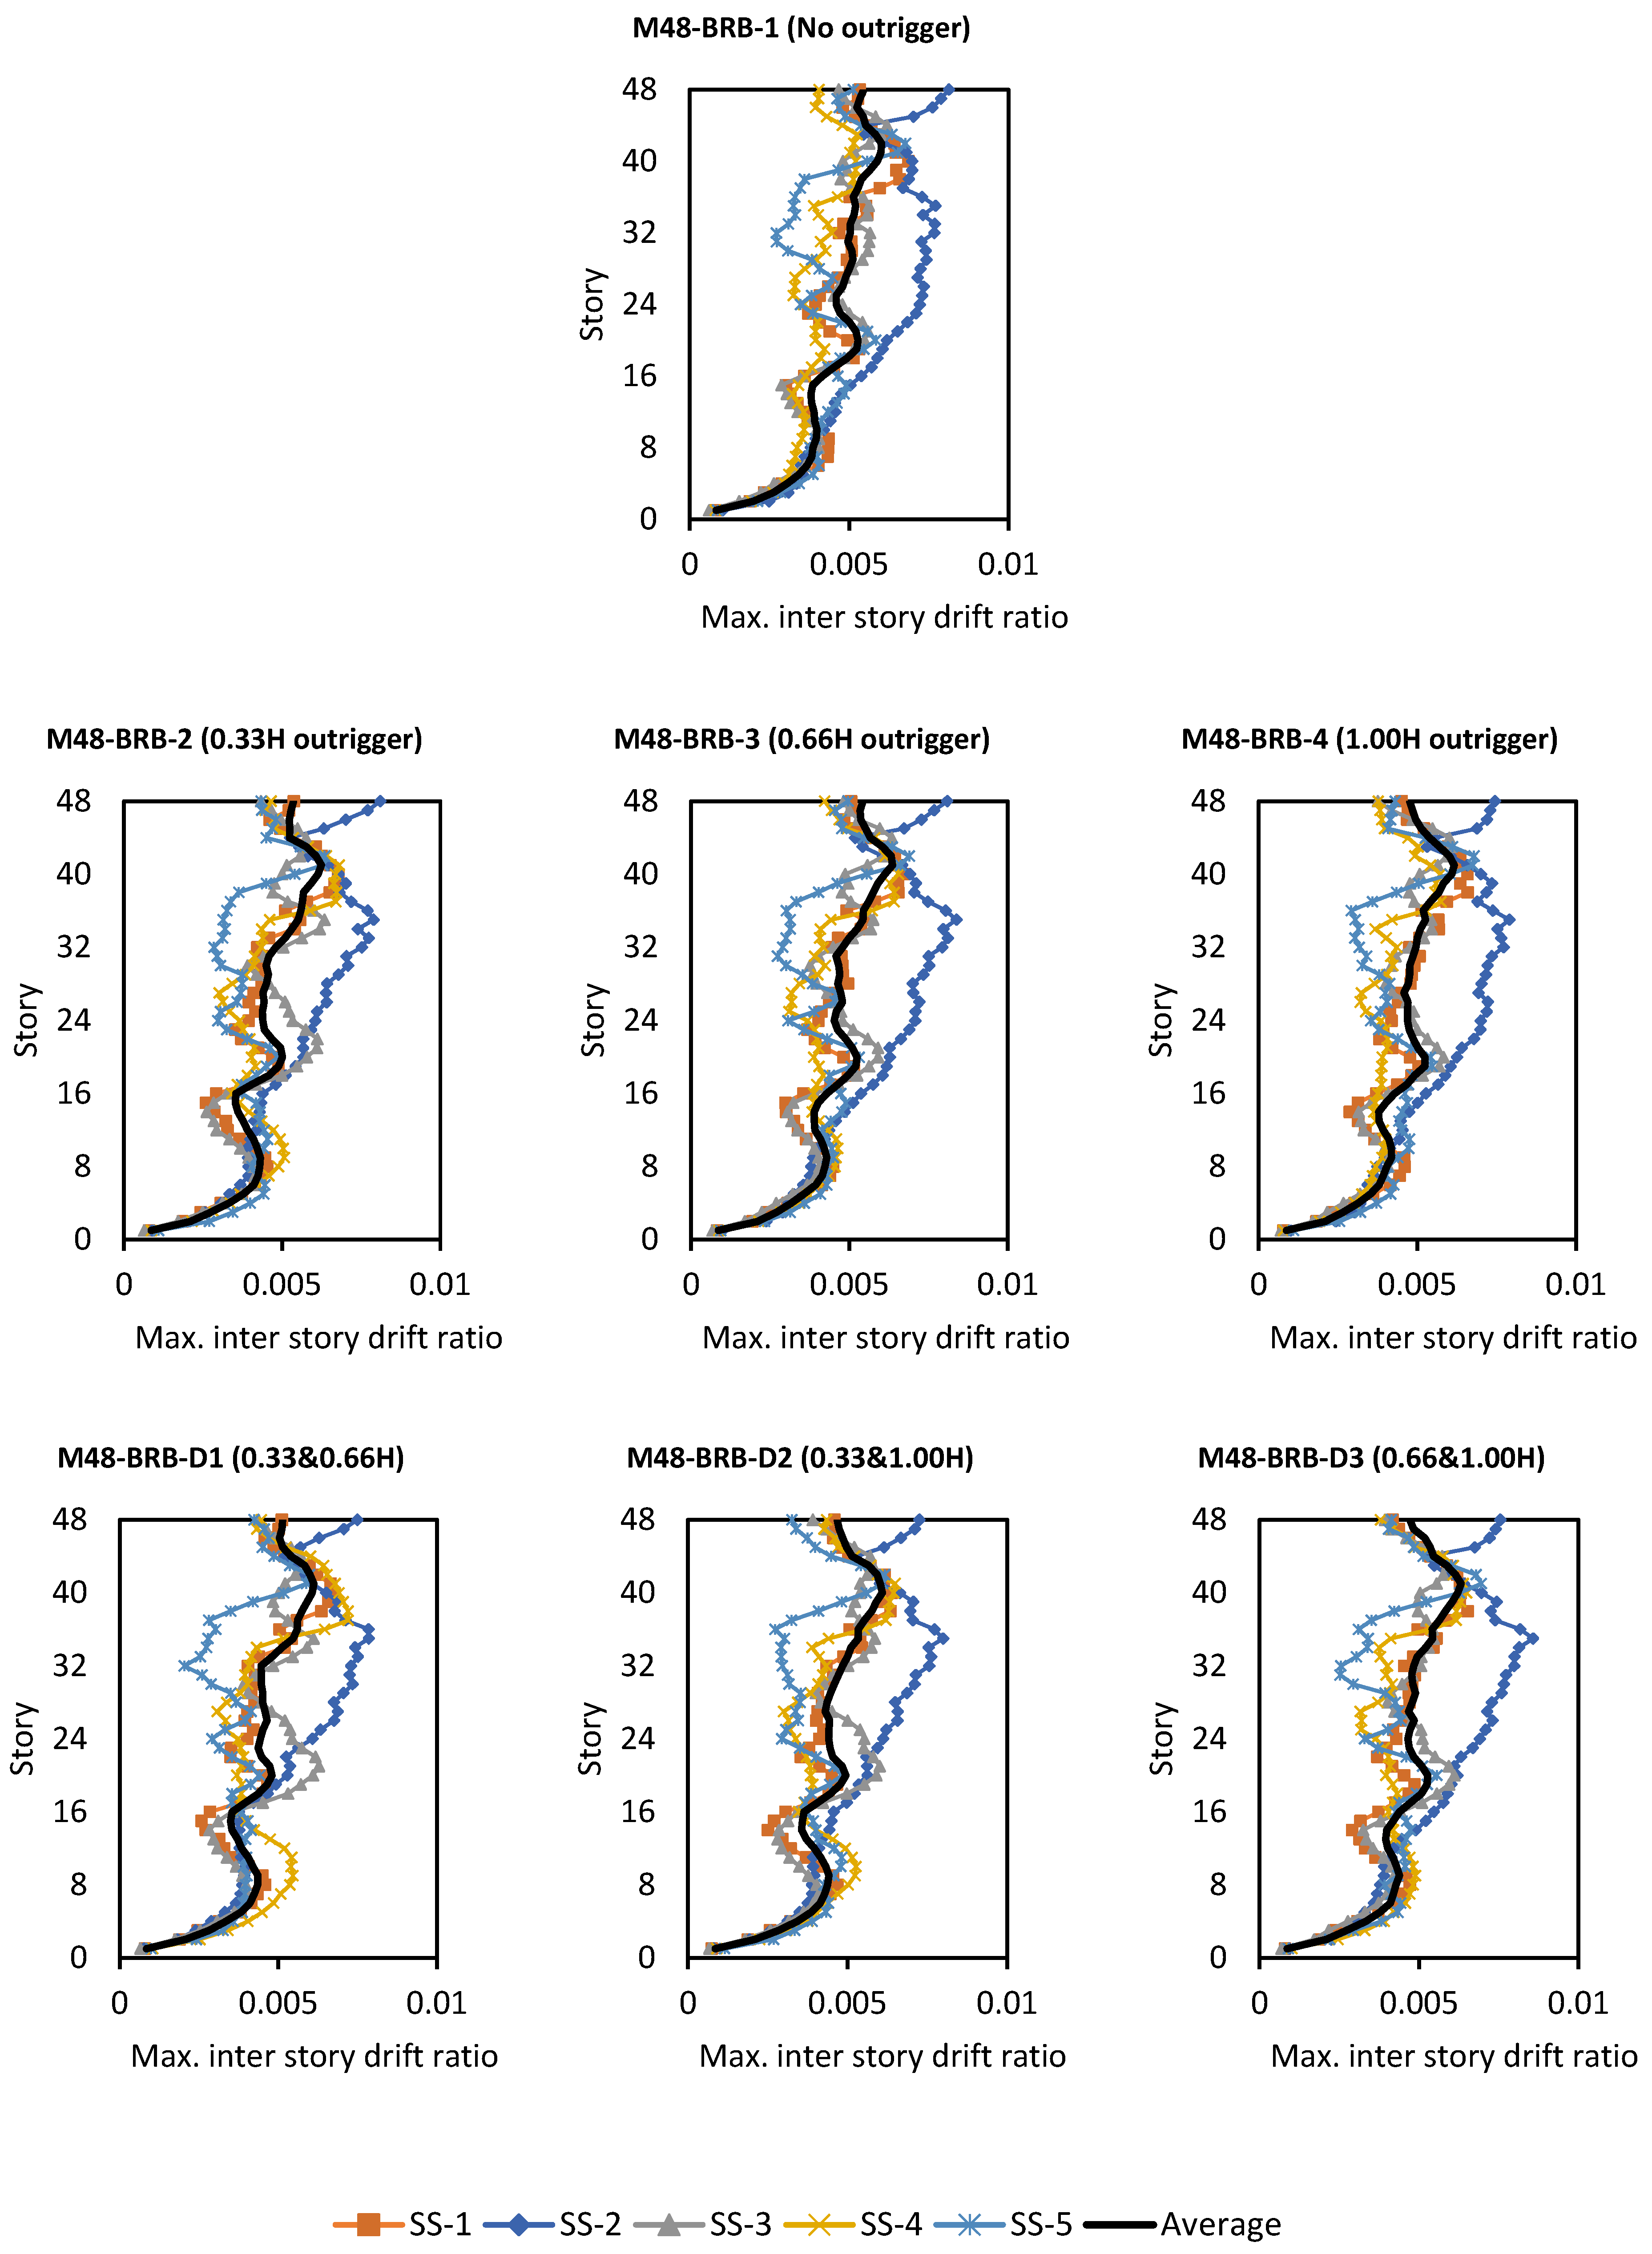
The effect on 48-story BRB-Core buildings (M48-BRB Series) is presented in Figure 8. In taller BRB-core buildings, the effectiveness of outriggers becomes more pronounced. The M48-BRB-1 model shows considerable drift in mid- to upper stories. This suggests that upper floors in BRB-core tall buildings require additional lateral stiffness provisions. A single outrigger at 0.33H (M48-BRB-2) reduces drift mainly in the lower part of the building but leaves higher stories more vulnerable. Dual outriggers such as M48-BRB-D2 (0.33H and 1.0H) are particularly effective in reducing drift across the full height, demonstrating the necessity of multiple stiffening points in high-rise structures.
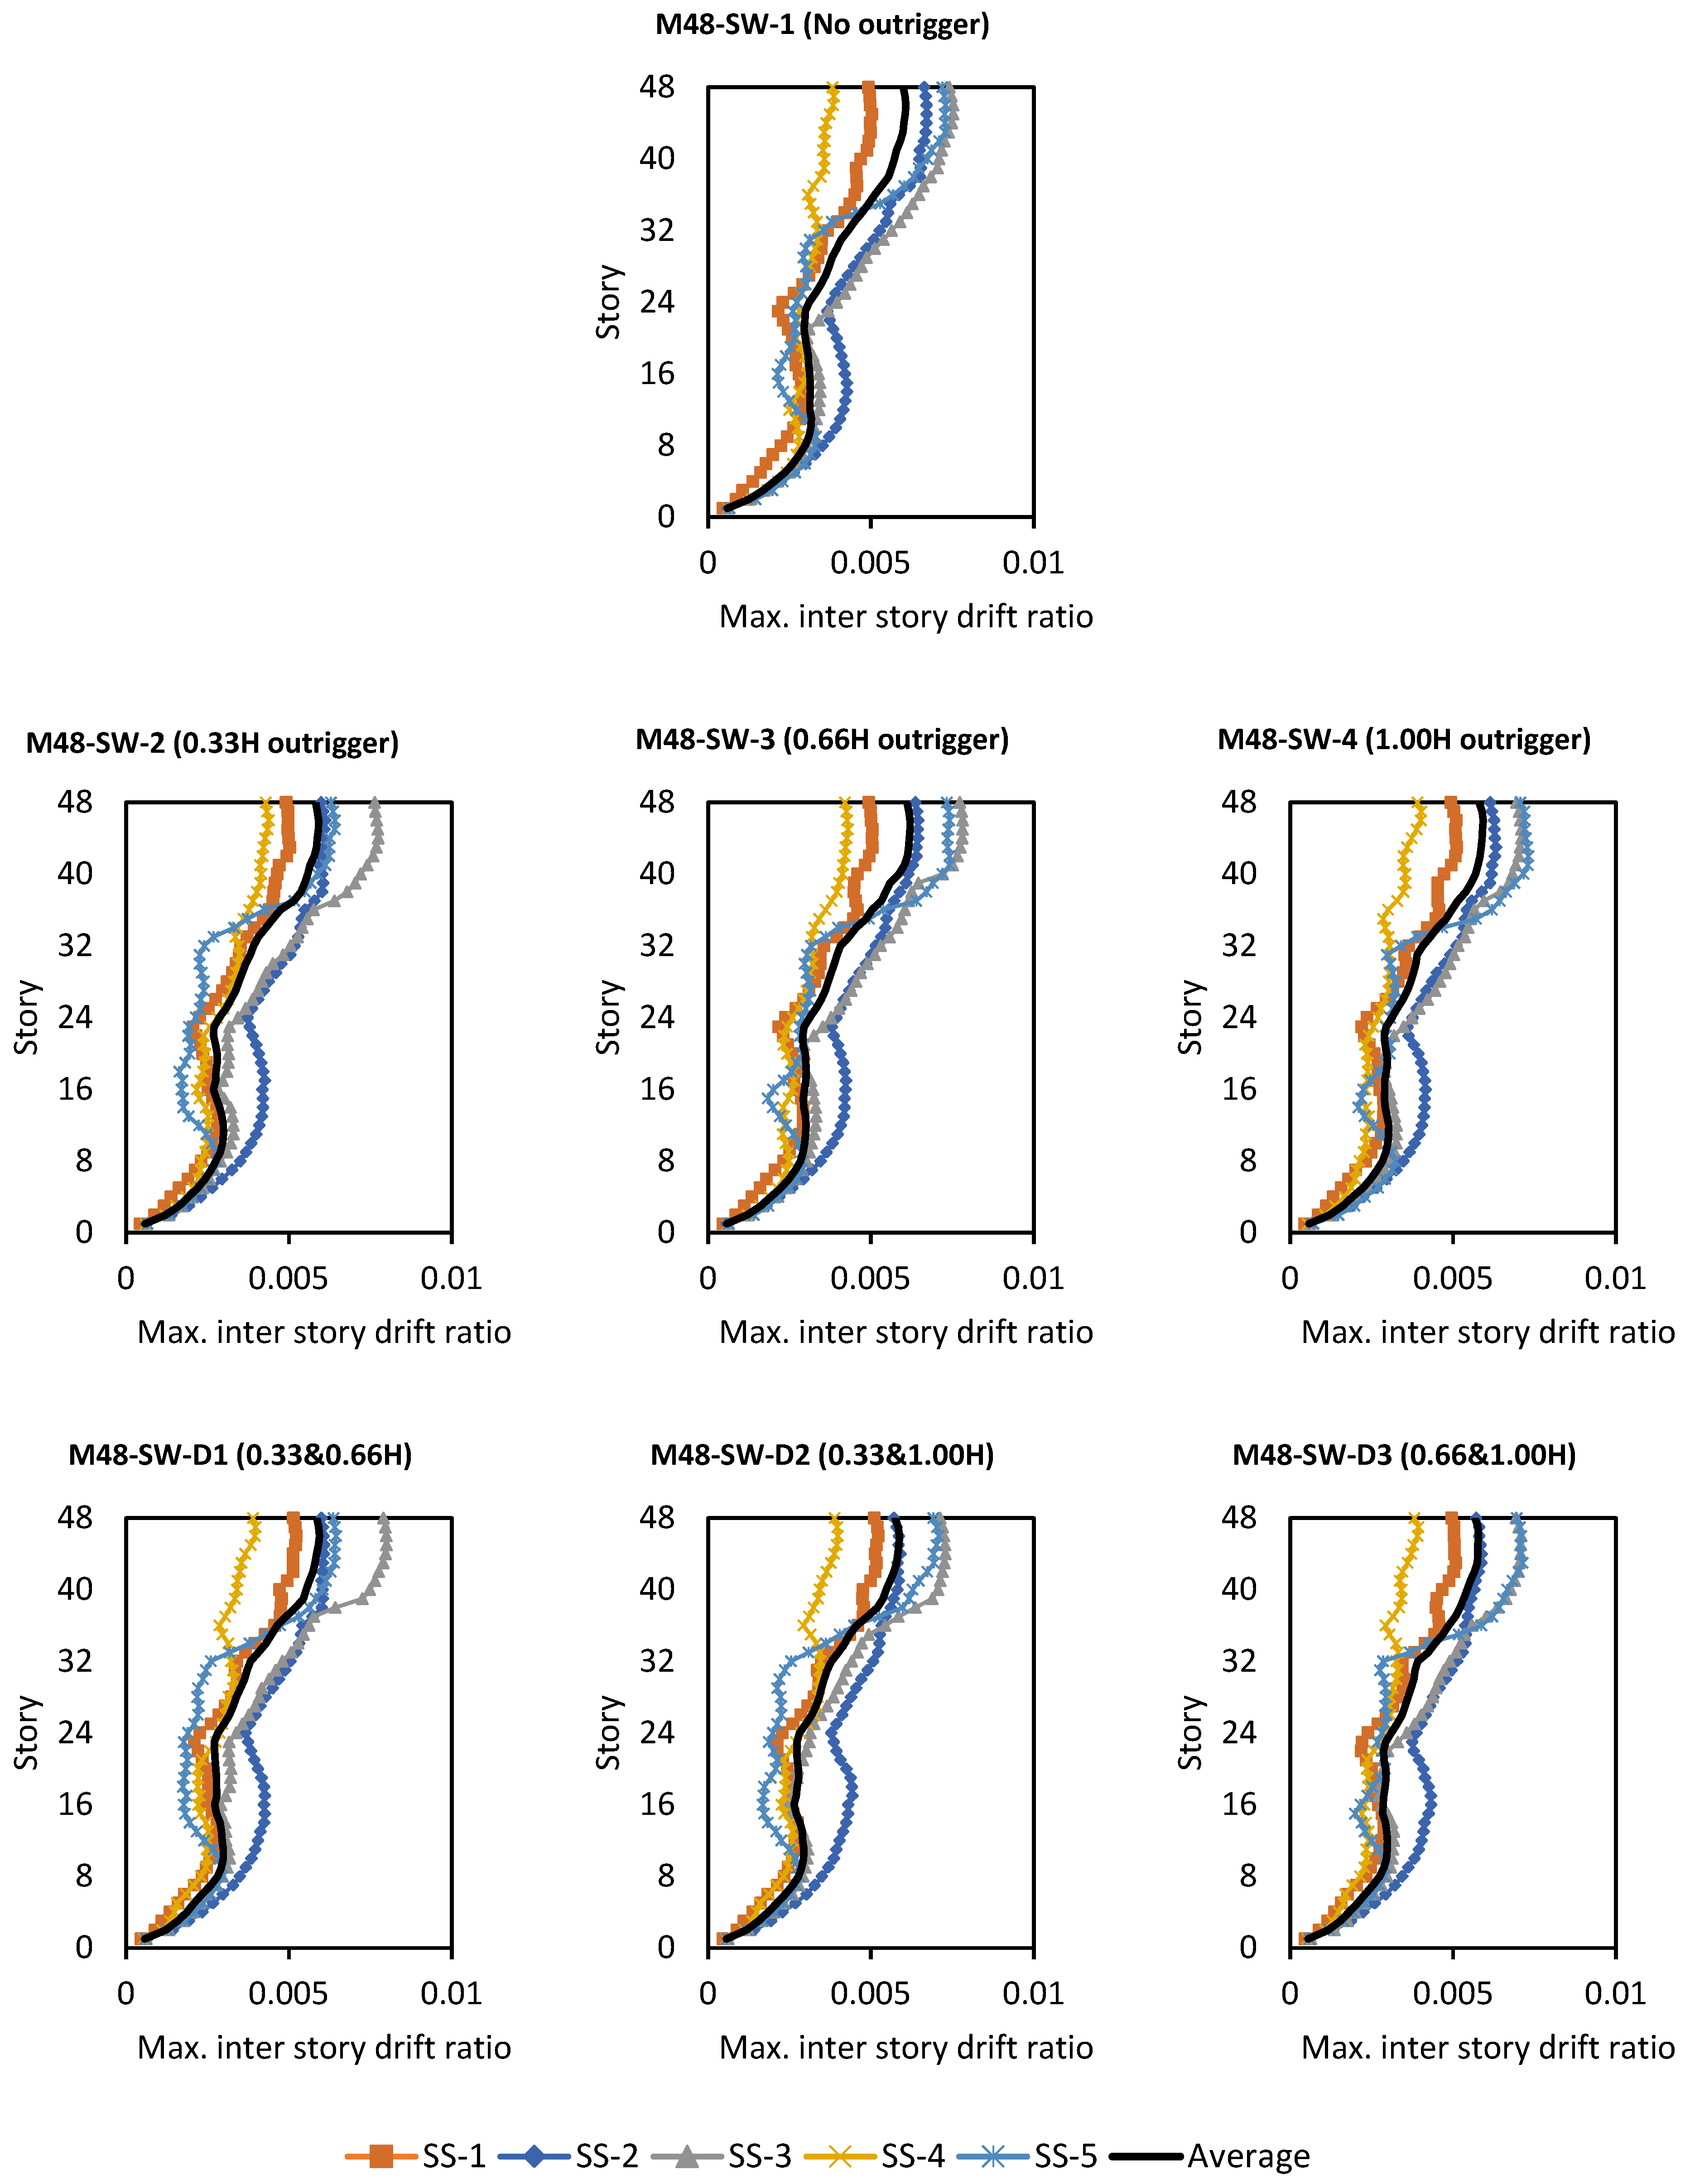
As can be seen from Figure 9, due to the high stiffness of the reinforced concrete shear wall in the center, the M48-SW-1 model (without outrigger) has the least relative story drift amount among all outrigger system configurations among the M48-SW Series. The relative story drift ratio increases as the floors increase. It has been observed that the outrigger system locations established in double floors such as M48-SW-D2 and D3 significantly improve the relative story drift ratio performance by reducing the peak values and providing a more uniform response along the height. The 0.33H outrigger location (M48-SW-2) is found to perform better than the 1.0H (M48-SW-4) in the single outrigger scenarios.
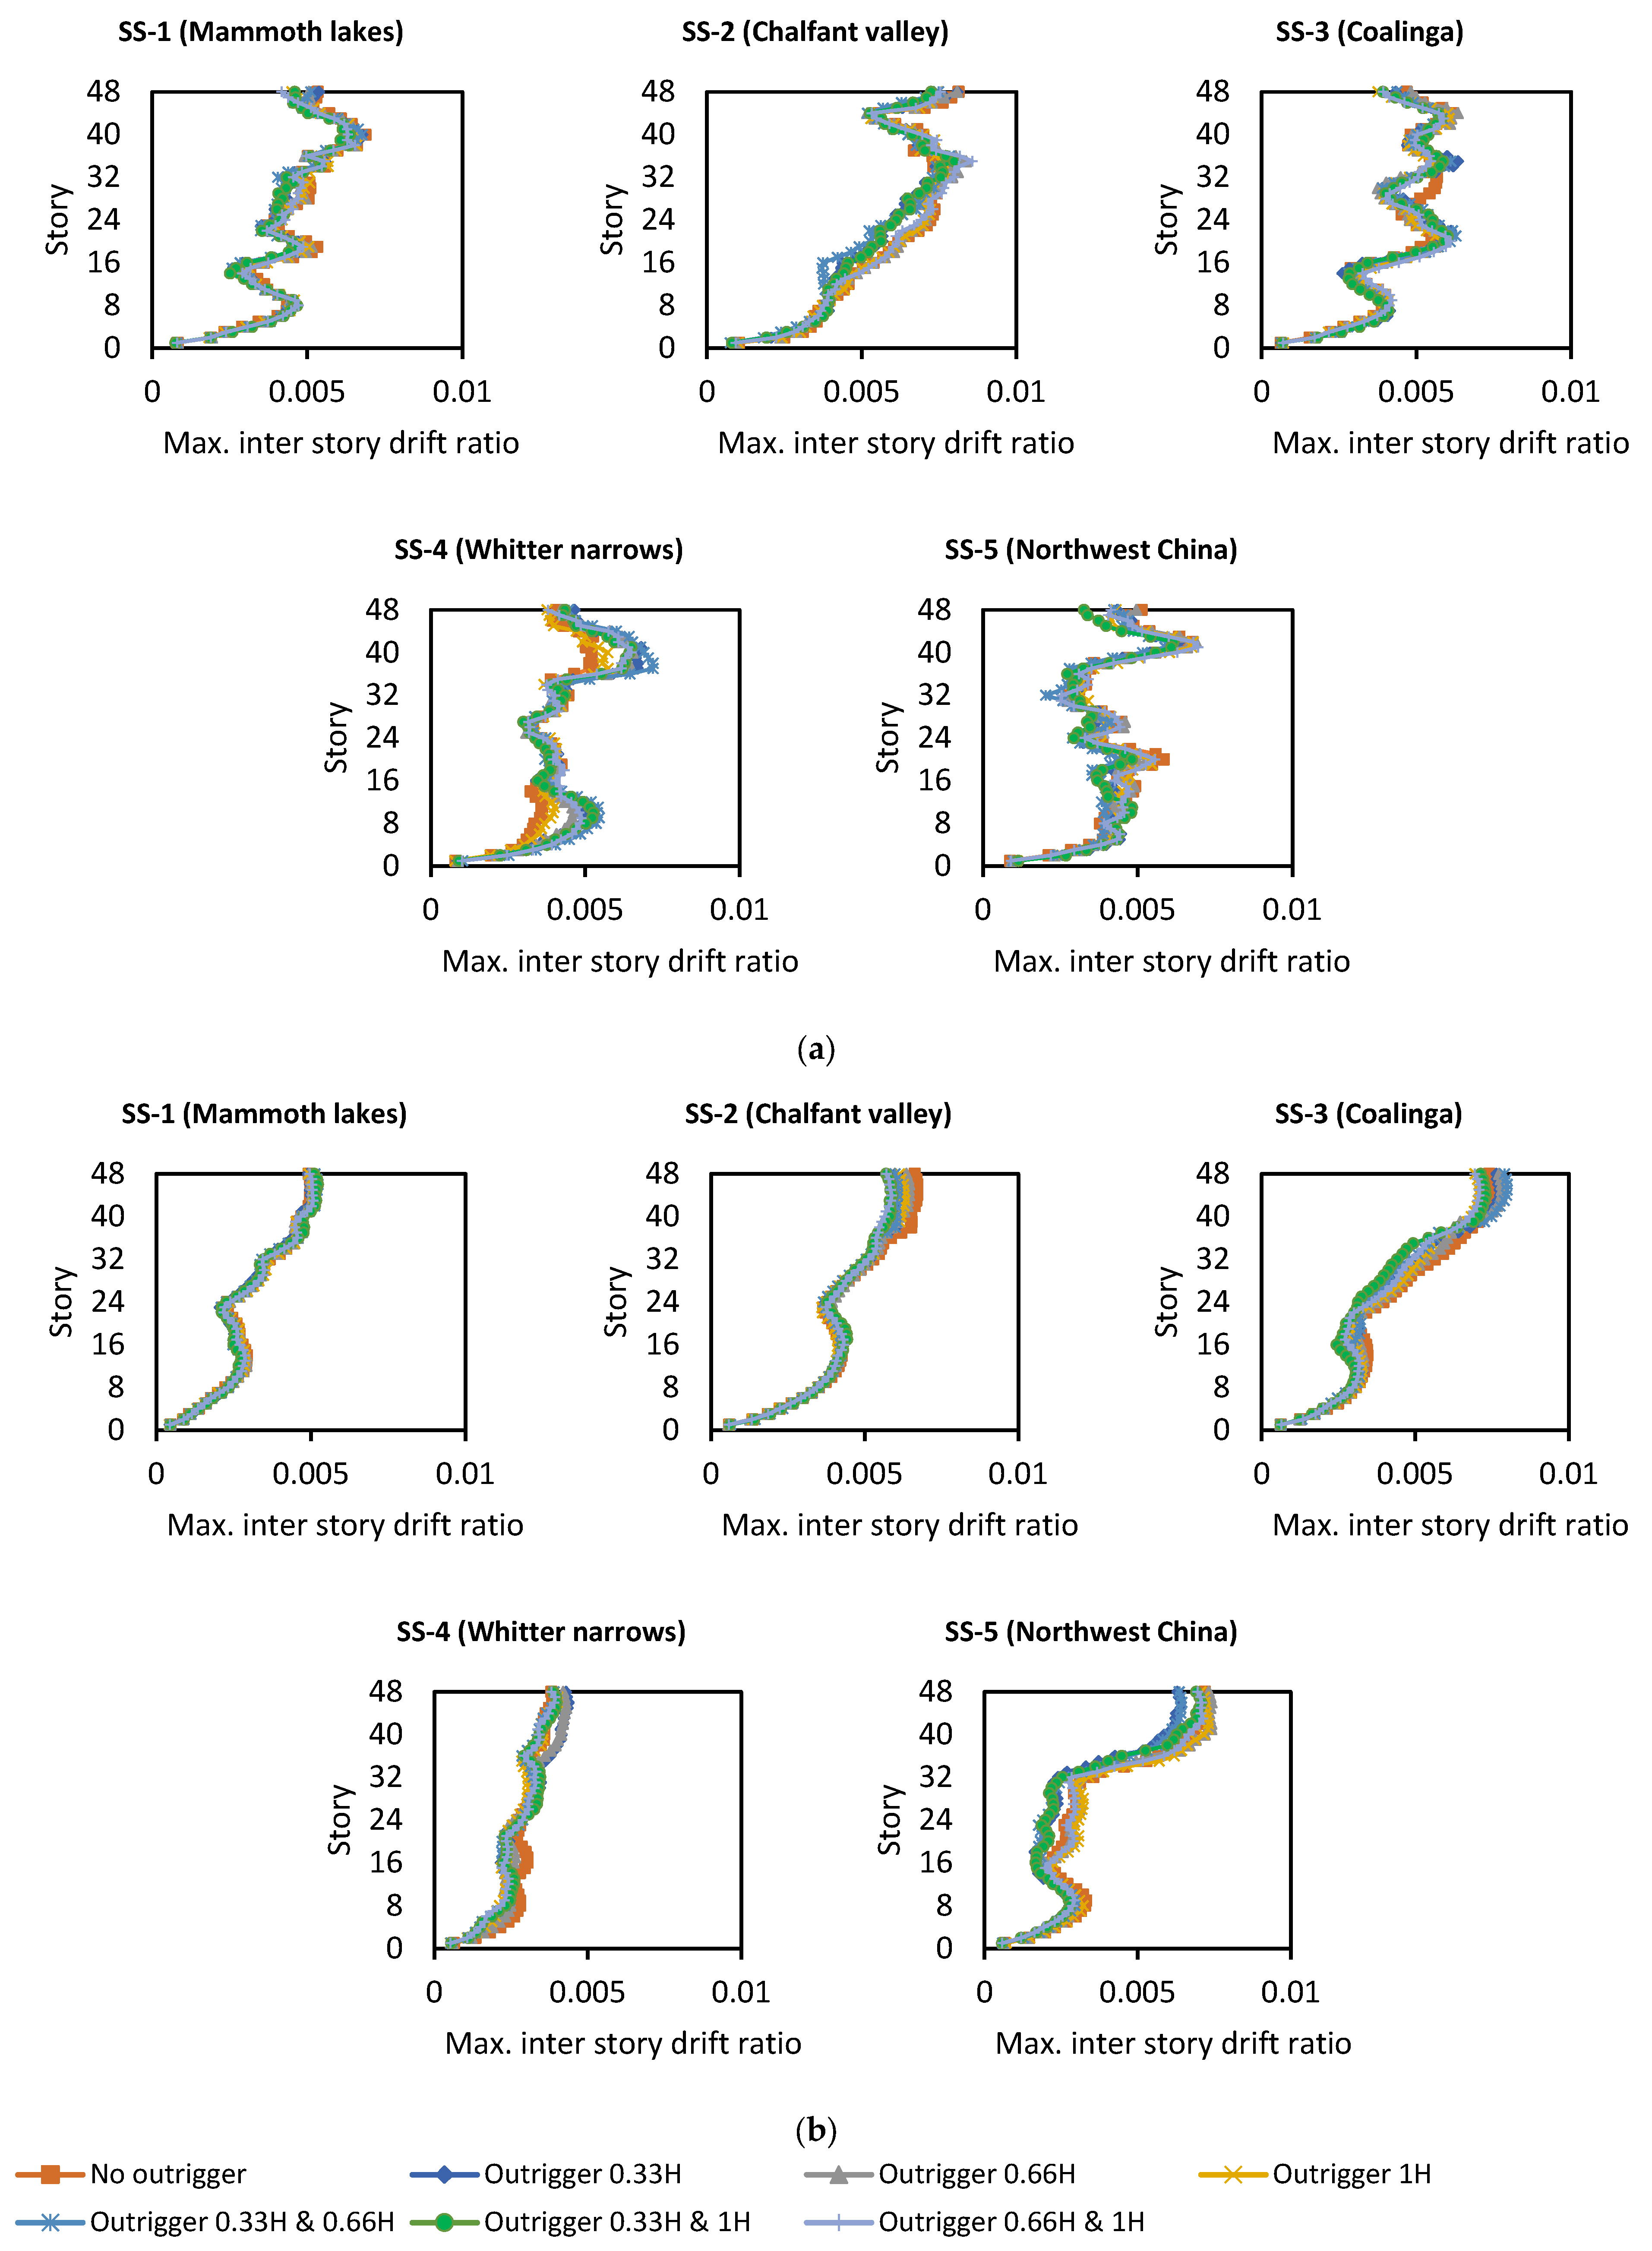
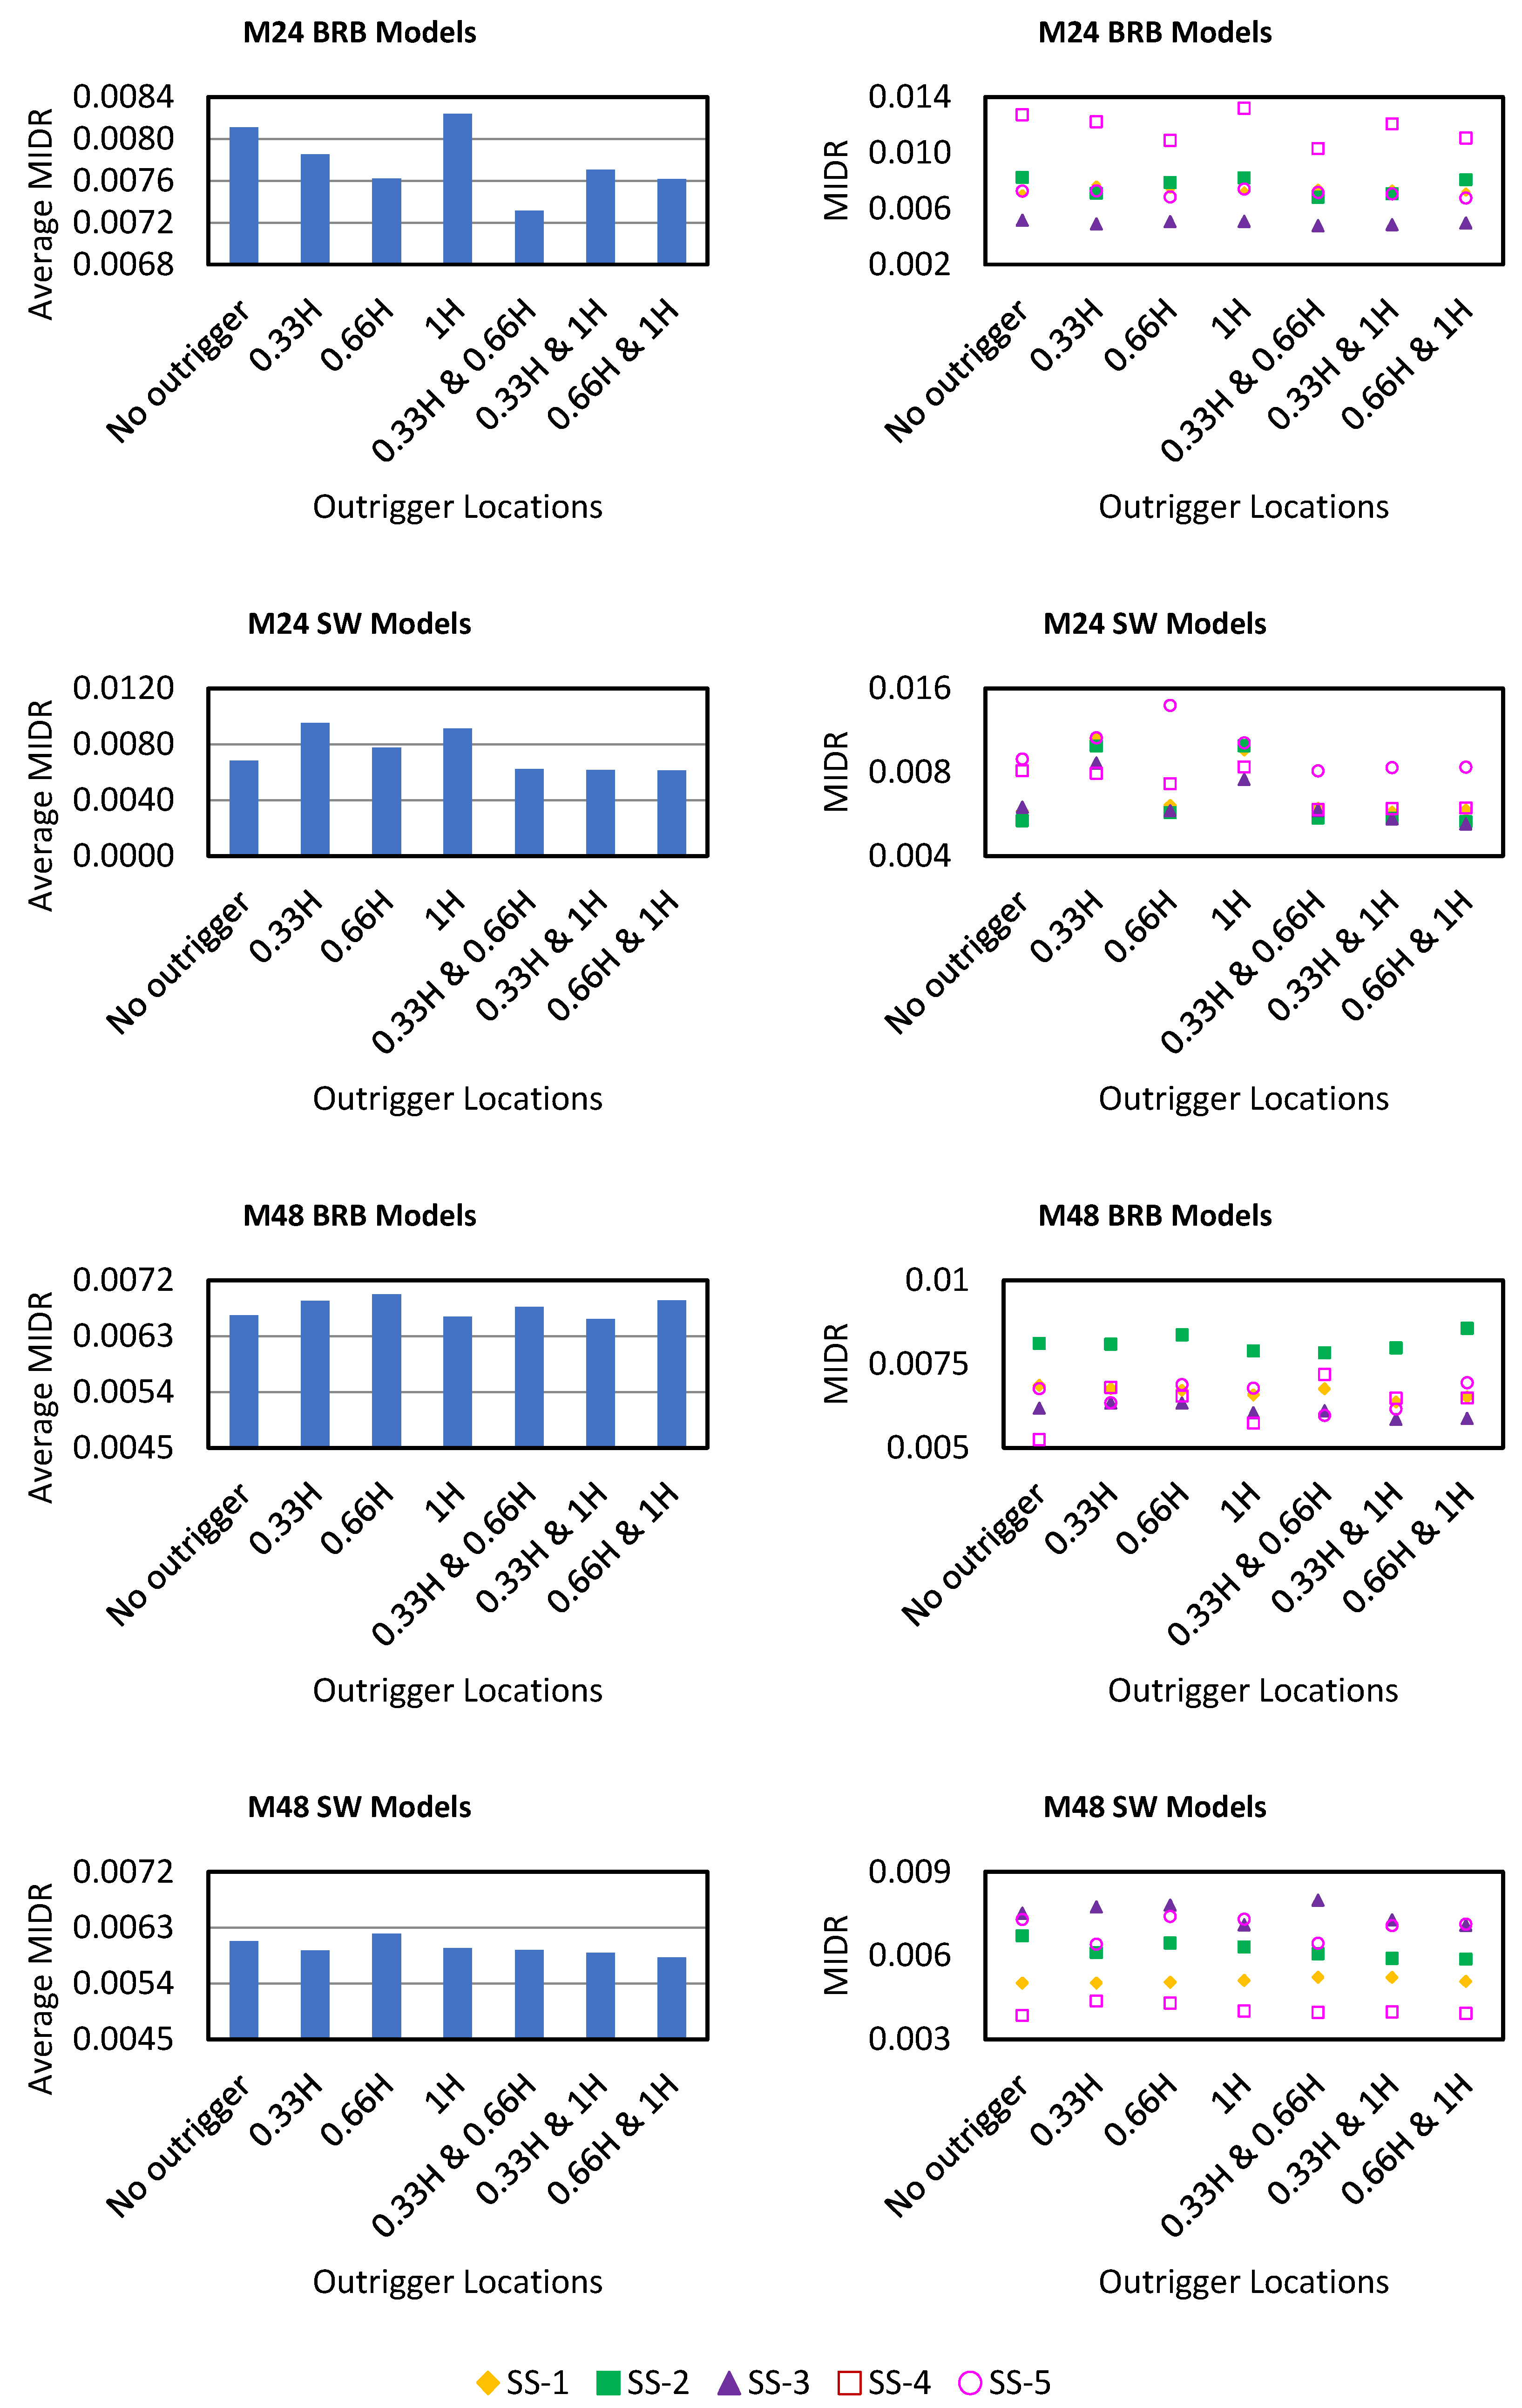
The distribution of maximum inter-story drift ratios (MIDR) during five different seismic sequences (SS-1 to SS-5) for 24- and 48-story buildings with BRB and RC SW core systems is shown in Figure 10, Figure 11, Figure 12 and Figure 13. The analysis demonstrates how various strong ground motion properties affect drift demands in structures with different outrigger configurations and core types.
The response of 24-story BRB core buildings is illustrated in Figure 10a. The MIDR profiles show significant sensitivity to the characteristics of the input ground motions. SS-3 (Coalinga) results in the lowest overall drift, whereas SS-4 (Whittier Narrows) and SS-5 (Northwest China) induce the highest drifts, particularly in the mid- to upper stories. This implies that in 24-story buildings with flexible core systems, story displacements may be increased by ground motions with greater velocity pulses or higher spectral content at medium period intervals. Regardless of the seismic sequence, the outrigger application consistently lowers the peak drift, particularly at 0.33H and in dual setups, demonstrating its efficacy in a range of excitation types. For the 24-story models with RC shear wall cores, drift demands are lower in all sequences compared to BRB-core counterparts, as shown in Figure 10b. The benefit of outriggers is still visible, particularly under SS-2 (Chalfant Valley) and SS-5, where a slight concentration of drift in upper stories is mitigated. The RC core provides higher initial stiffness, which appears more robust against frequency content variation in the applied seismic records. For the 48-story BRB core buildings, as shown in Figure 11b, SS-1 and SS-4 provide the highest MIDRs in BRB core high-rise buildings, with maximum drift moving toward the upper regions. It is well known that thin structures with little stiffness at the top exhibit this vertical demand shift. Dual-positioned outriggers (e.g., 0.33H and 1.0H) greatly reduce these effects. Under softer arrays such as SS-3 (Coalinga), the drift profile remains more consistent and modest, once again emphasizing the importance of the input motion frequency characteristics. In the 48-story configurations, the reinforced concrete wall core once again demonstrates higher drift efficiency, as presented in Figure 11b. For most of the cases and seismic inputs, MIDR levels remain below 0.01. Dual outrigger systems effectively reduce upper-story drift (e.g., SS-1), while RC cores show consistent drift control across all seismic inputs. Figure 12 and Figure 13 show that the average MIDR decreases across all building types when outriggers are used, particularly in dual configurations. The highest average MIDRs are consistently observed in BRB-core models under seismic sequences SS-4 and SS-5.
Table 5 and Table 6 summarize the percentage change in peak MIDR for each outrigger configuration relative to the non-outrigger reference, based on SS-1–SS-5 and the overall average. In 24-story BRB core models, the 0.66H and 1.0H double and 0.66H single placements provided the highest reductions on average, demonstrating the advantage of arrangements placed in the upper third (paired with a second outrigger near the roof). In 24-story RC wall-core models, dual placements—particularly 0.66H and 1.0H—provide the best overall performance, while 0.33H or 1.0H single placements may increase displacement in some cases. No significant improvement is achieved on average in 48-story BRB-core buildings, while moderate improvements are observed in 48-story RC shear wall core models, with 0.66H and 1.0H ranking highest. These trends are consistent for both individual series results and overall averages and suggest design guidelines favoring two-level arrangements and the use of at least one outrigger at the top level, particularly in tall buildings, except in cases where the behavior of the BRB core limits drift reduction.

5.2. Cumulative Damage Indices

Damage indices (DI) are generally classified into two main categories: cumulative and non-cumulative types. Non-cumulative DIs are typically straightforward, but because they do not account for the impacts of cyclic loading, they frequently do not adequately depict the level of damage. However, cumulative DI gives more consistent results than non-cumulative DI because it takes into account the consequences of cyclic loading. However, slightly more complex calculations are required. The hysteretic energy and maximum displacements of structural components developed during the earthquake duration are used to construct the damage index proposed by Park and Ang [14], as shown in the following formula:
D I = δ M δ U + β Q y δ U d E
where δ M and δ U are maximum and the ultimate deformations of structural elements under seismic events. β is a coefficient to control strength detonation, which is assumed to be 0.05 [30]. d E is hysteric energy dissipated by the structural elements during the seismic event. Q y is the yielding strength of the structural members. A common β = 0.05 , reflecting moderate cyclic degradation in RC flexural hinges and the stable bilinear hysteresis of BRB links (Section 2). A single β maintains cross-component comparability when energy shares shift with outrigger level. In this study, it is assumed that damages are localized only to BRB members, beams, and RC shear walls; the damage index of columns is not considered in the evaluation. Hysteretic energy for weighting was taken as link hysteretic energy (BRBs) and frame hinge hysteretic energy (RC beams/walls with flexural M–θ hinges); column hysteretic energy was excluded from the tallies. P-Δ was active globally, but P-Δ work was not included; wall shear hysteresis was not modeled. The story damage index, which represents a combination of the local DI of structural members within a story and the global damage index, defined as the sum of the DI of all stories, can be estimated using the following formulas proposed by Park et al. [31]:
D I s t o r e y = i = 1 M D I i E i i = 1 M E i
D I g l o b a l = i = 1 N D I s t o r e y , i E s t o r e y , i i = 1 N E s t o r e y , i
where D I s t o r e y is the damage index of a story, D I i is damage index of ith element, E i is dissipated hysteric energy of the ith structural element in the story. E s t o r e y , i is the dissipated hysteric energy of the ith story. D I g l o b a l is the global damage index of the structure. M and N are number of members in a particular story and number of the story in the building, respectively. Park-Ang DI classified damage states into five levels which are listed in Table 7, which are adopted from Ang [32].
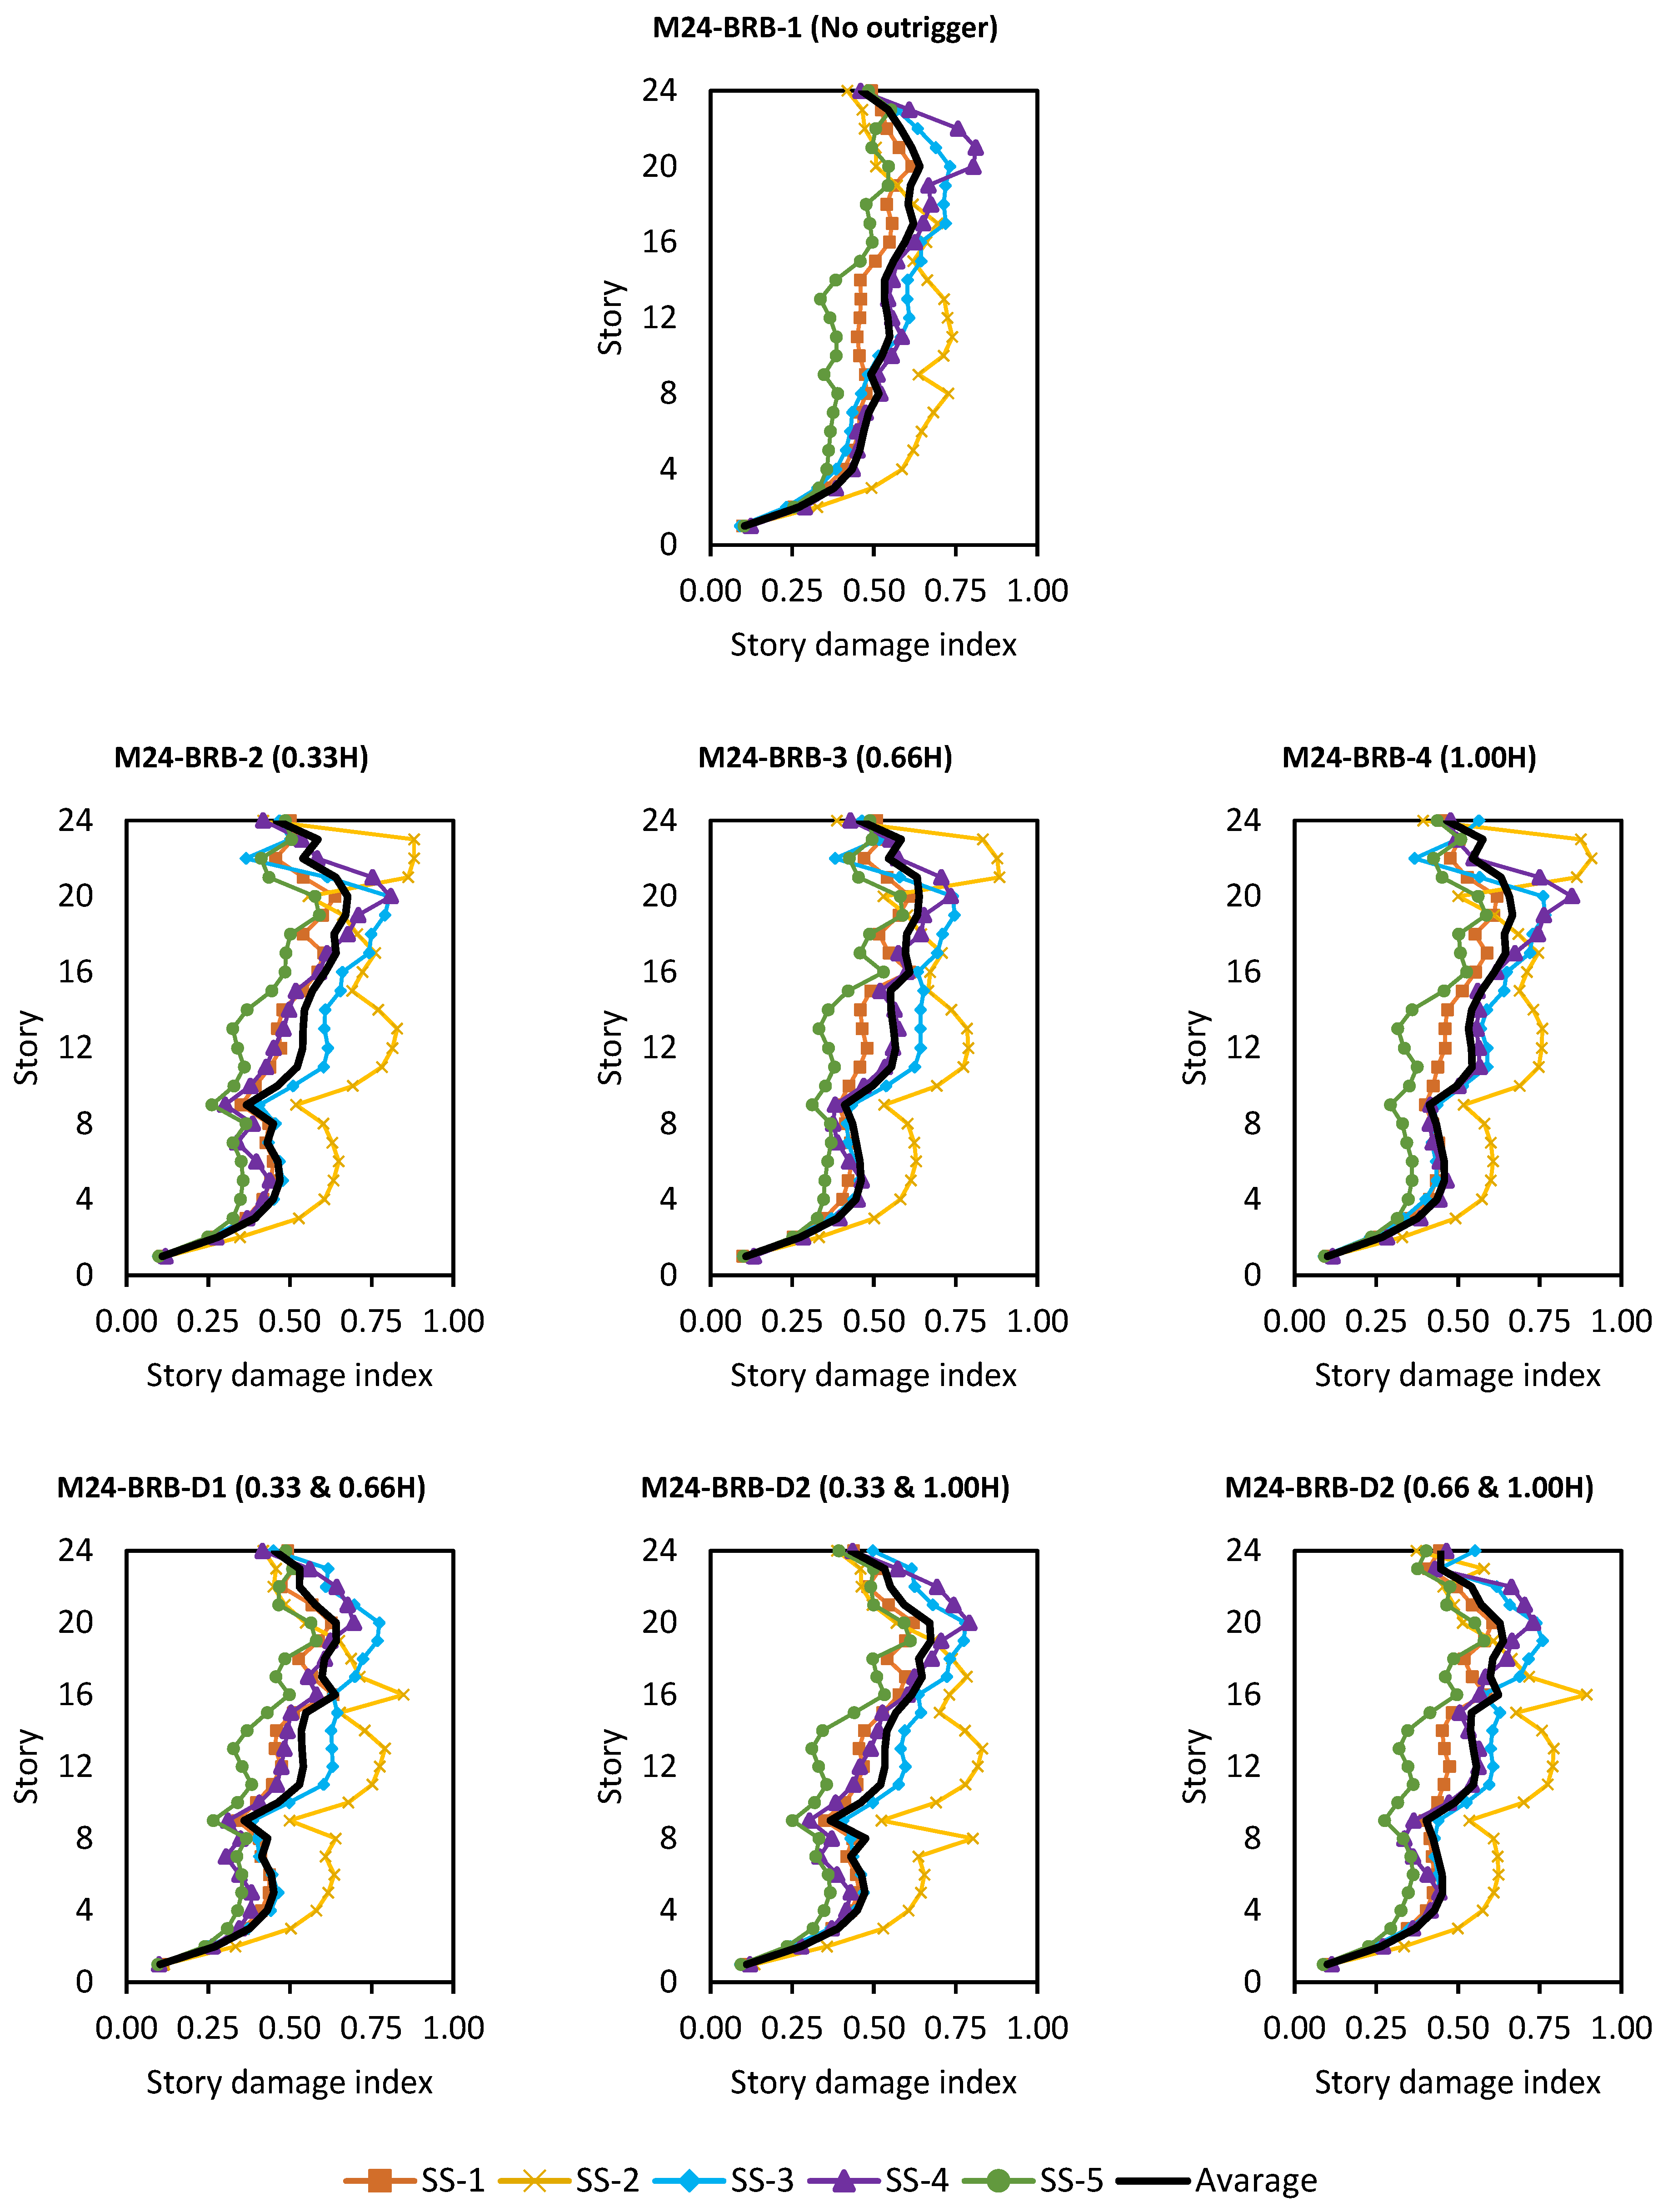
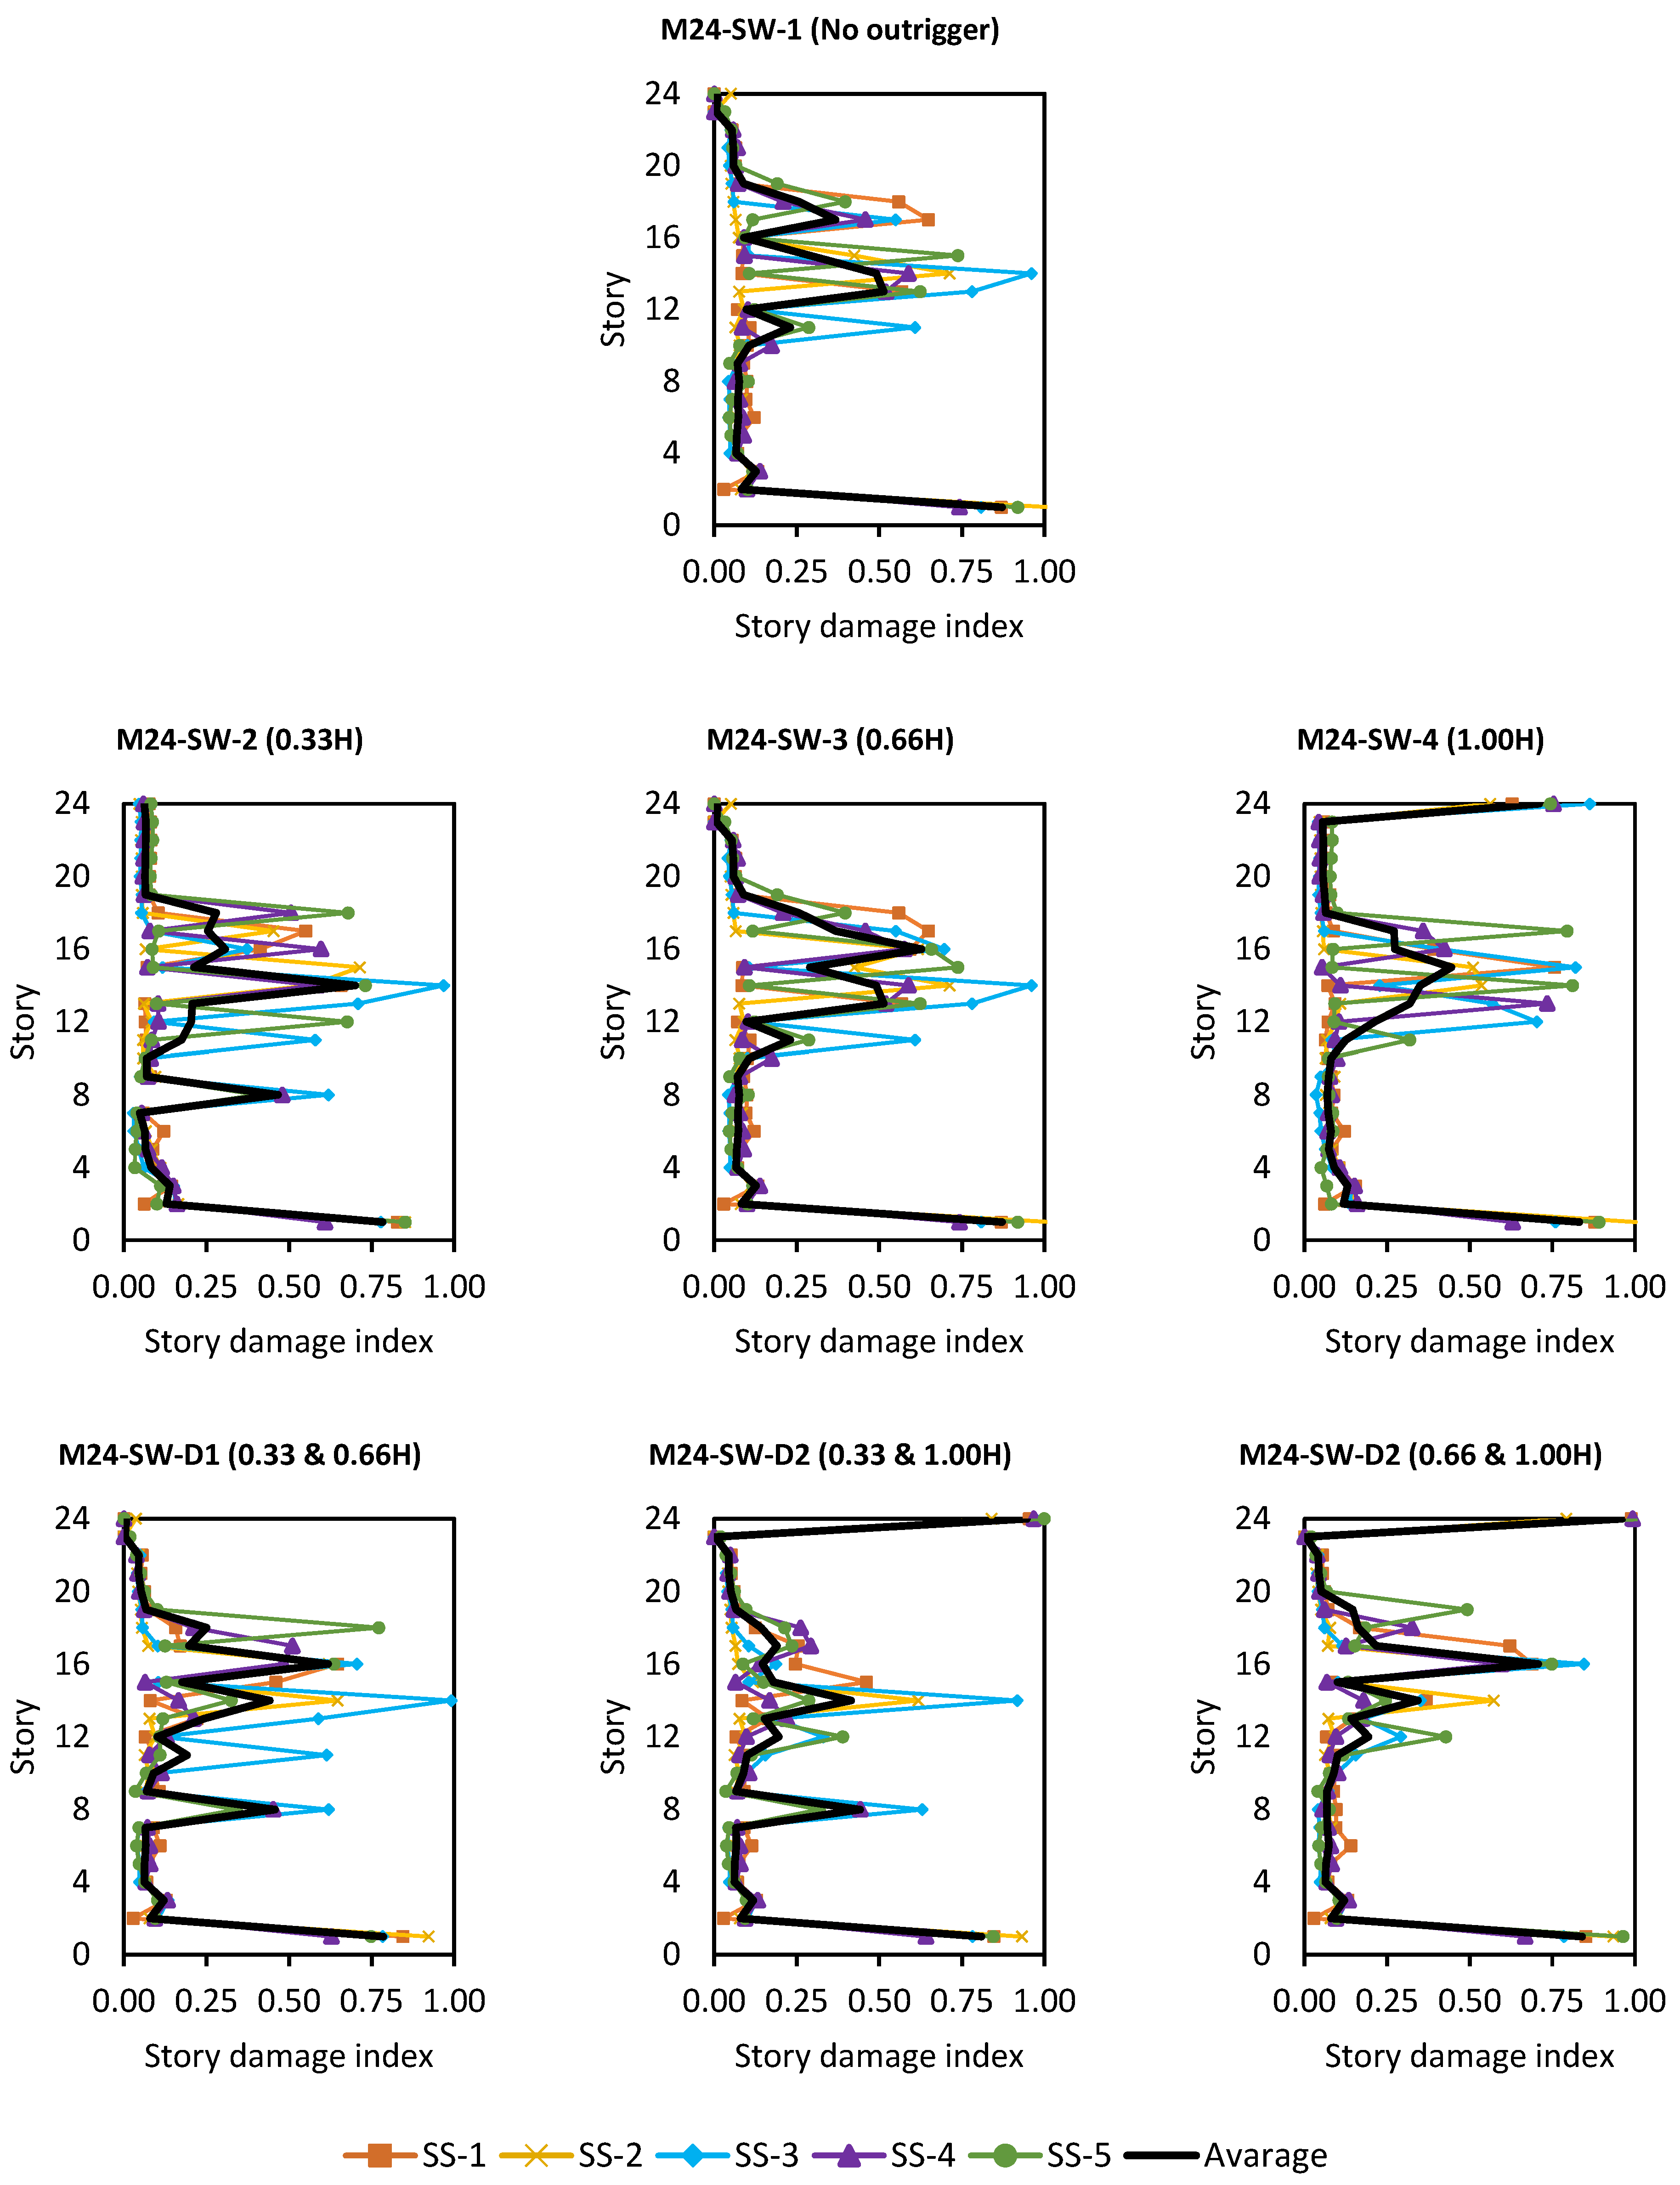
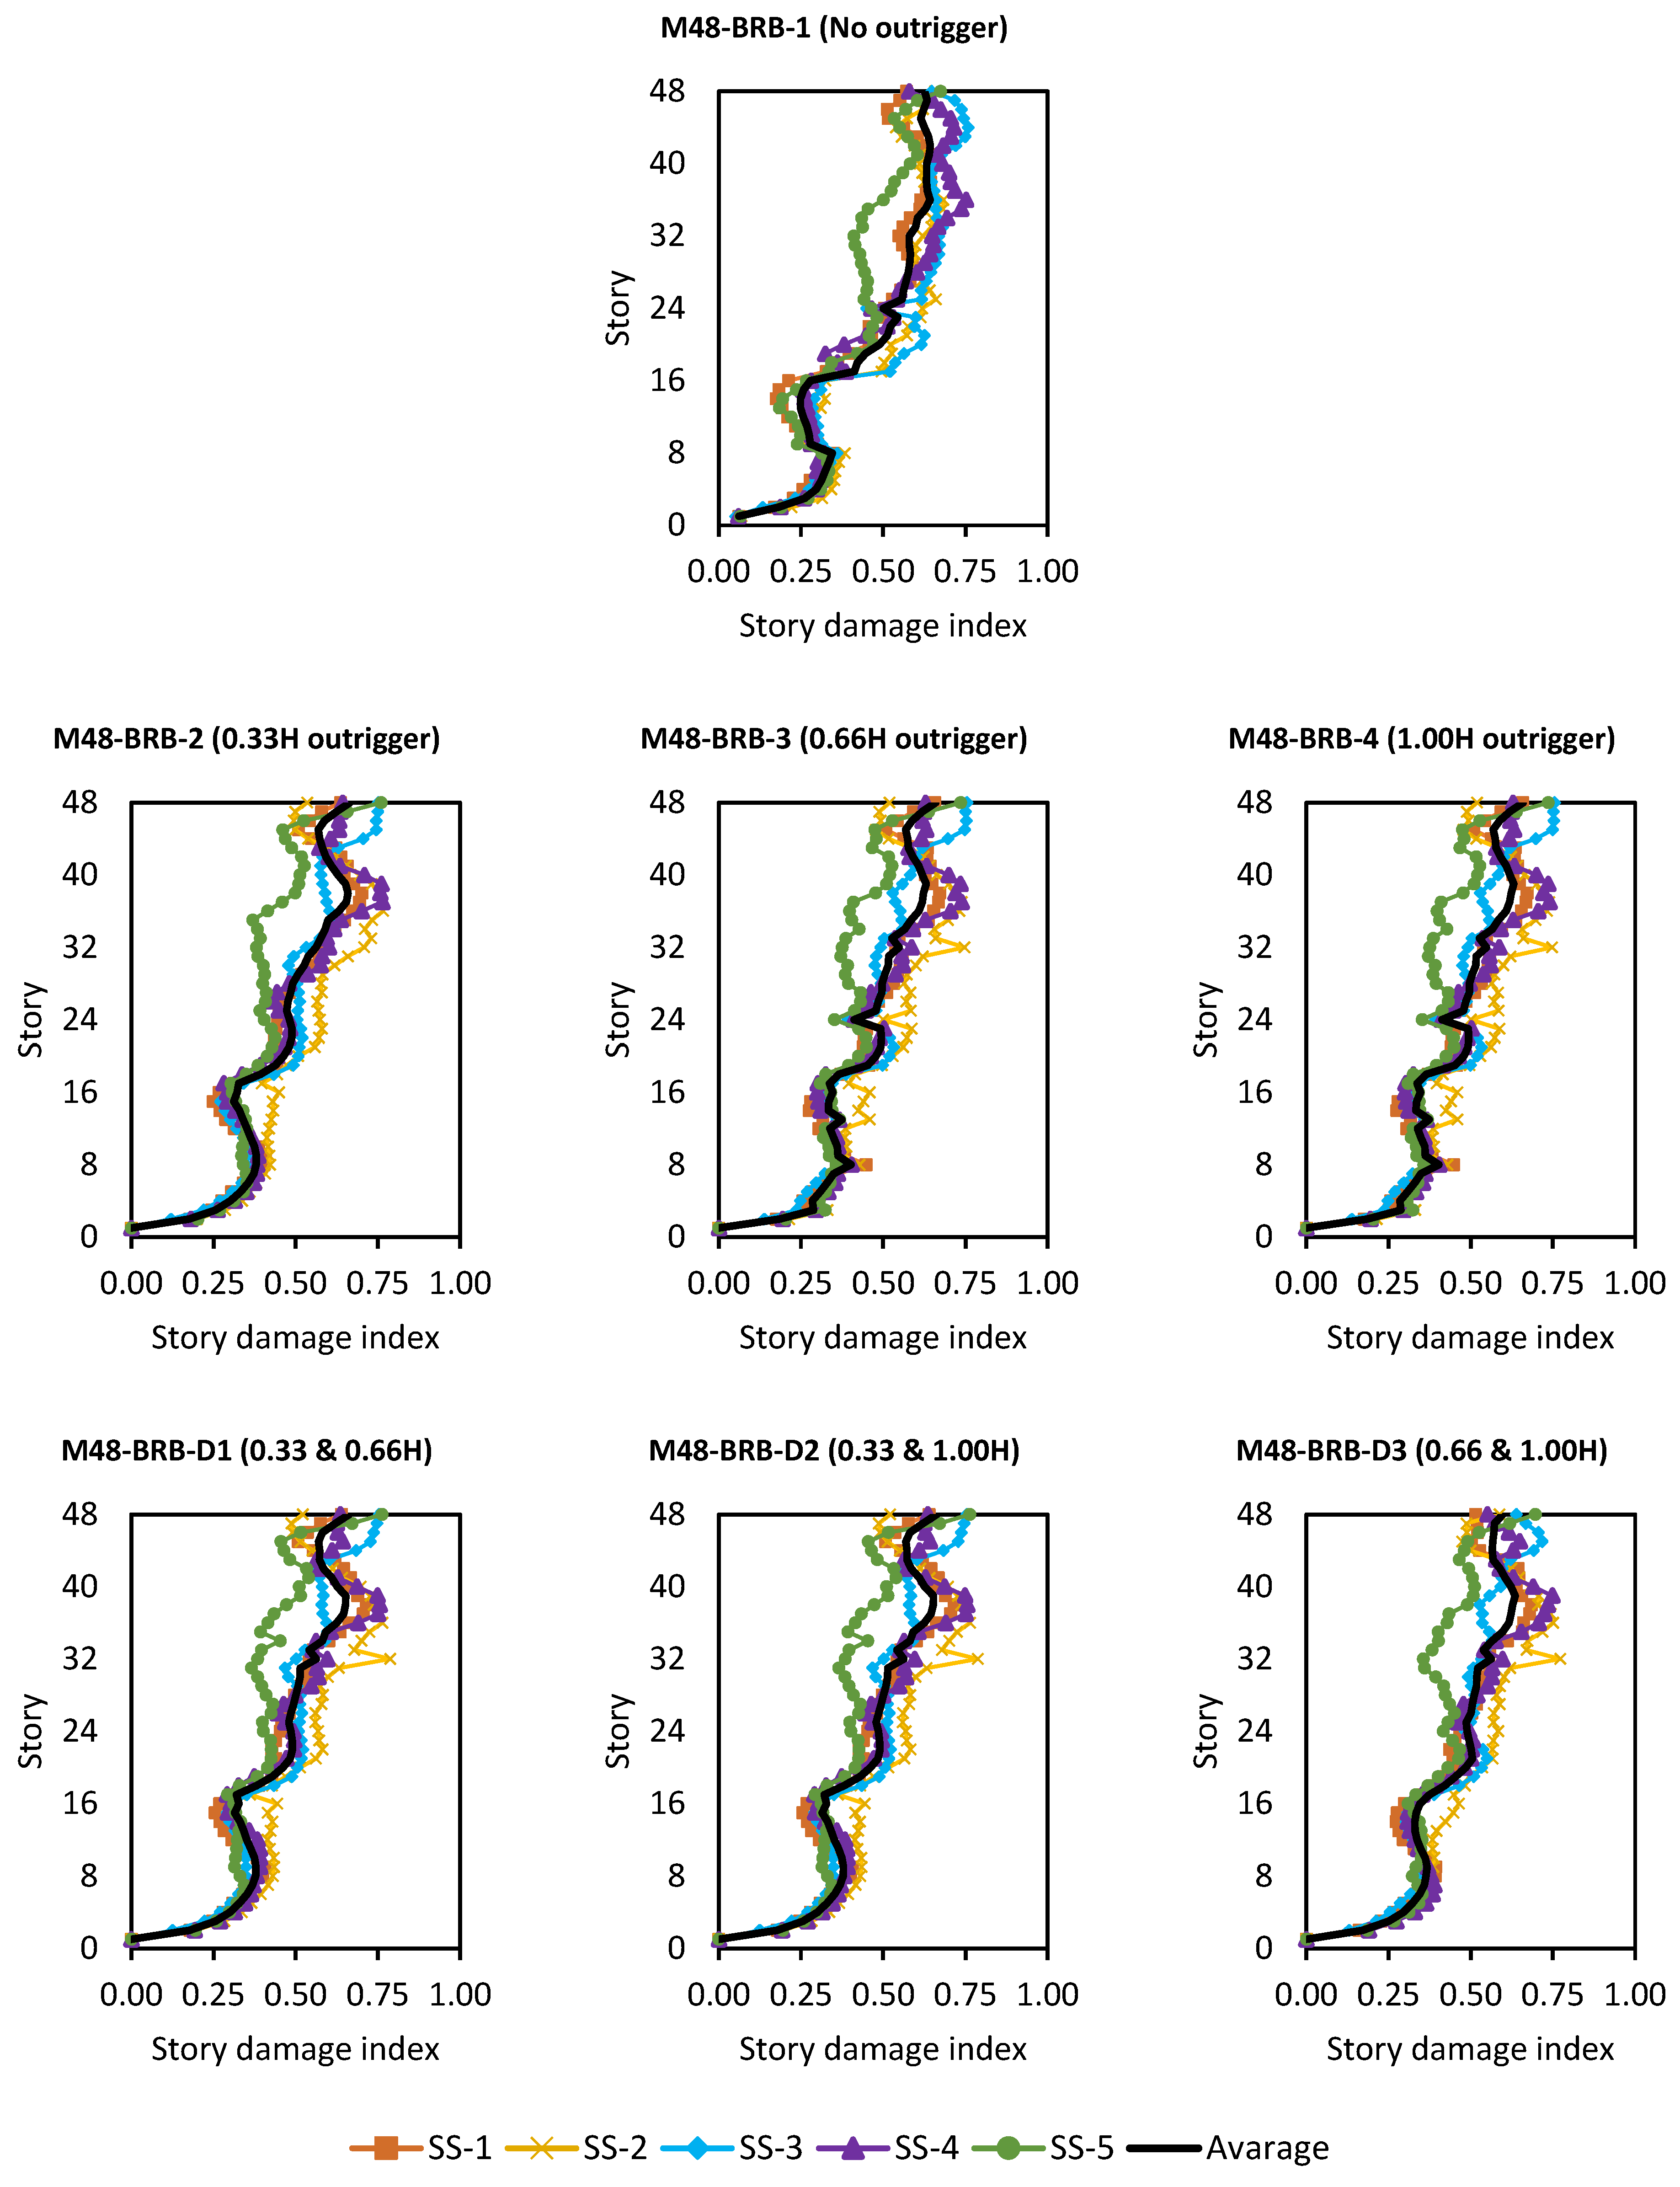
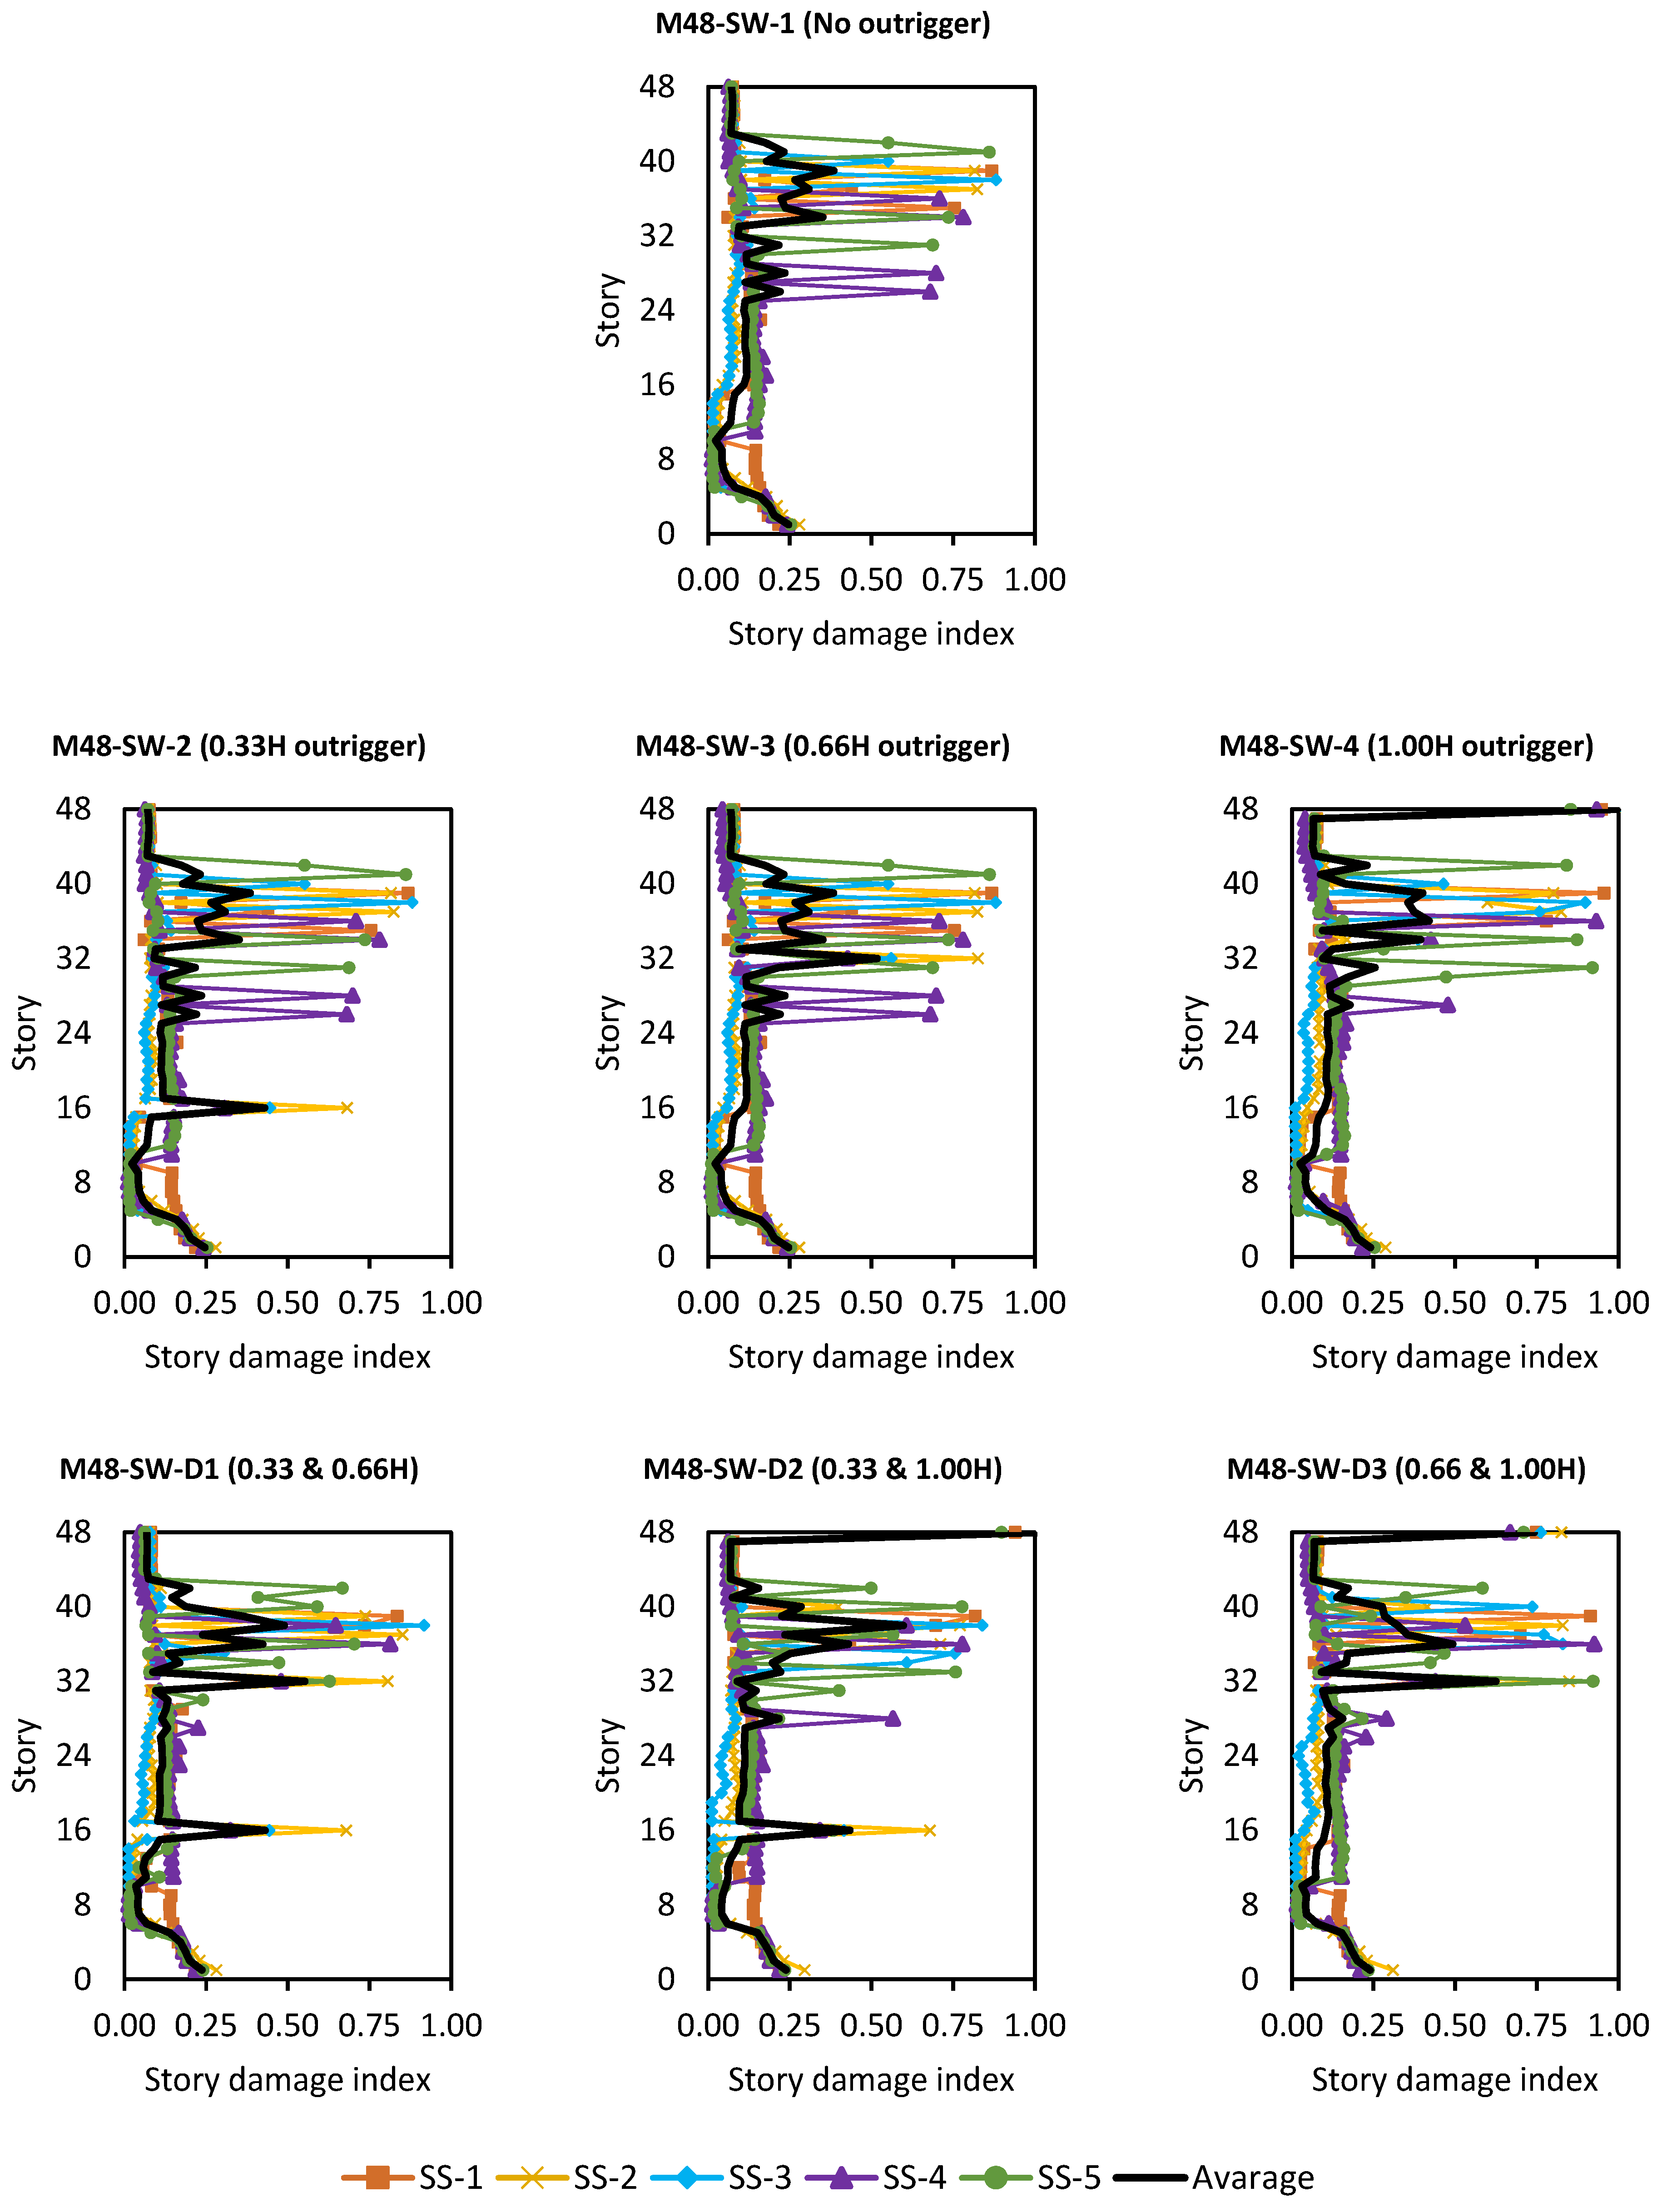
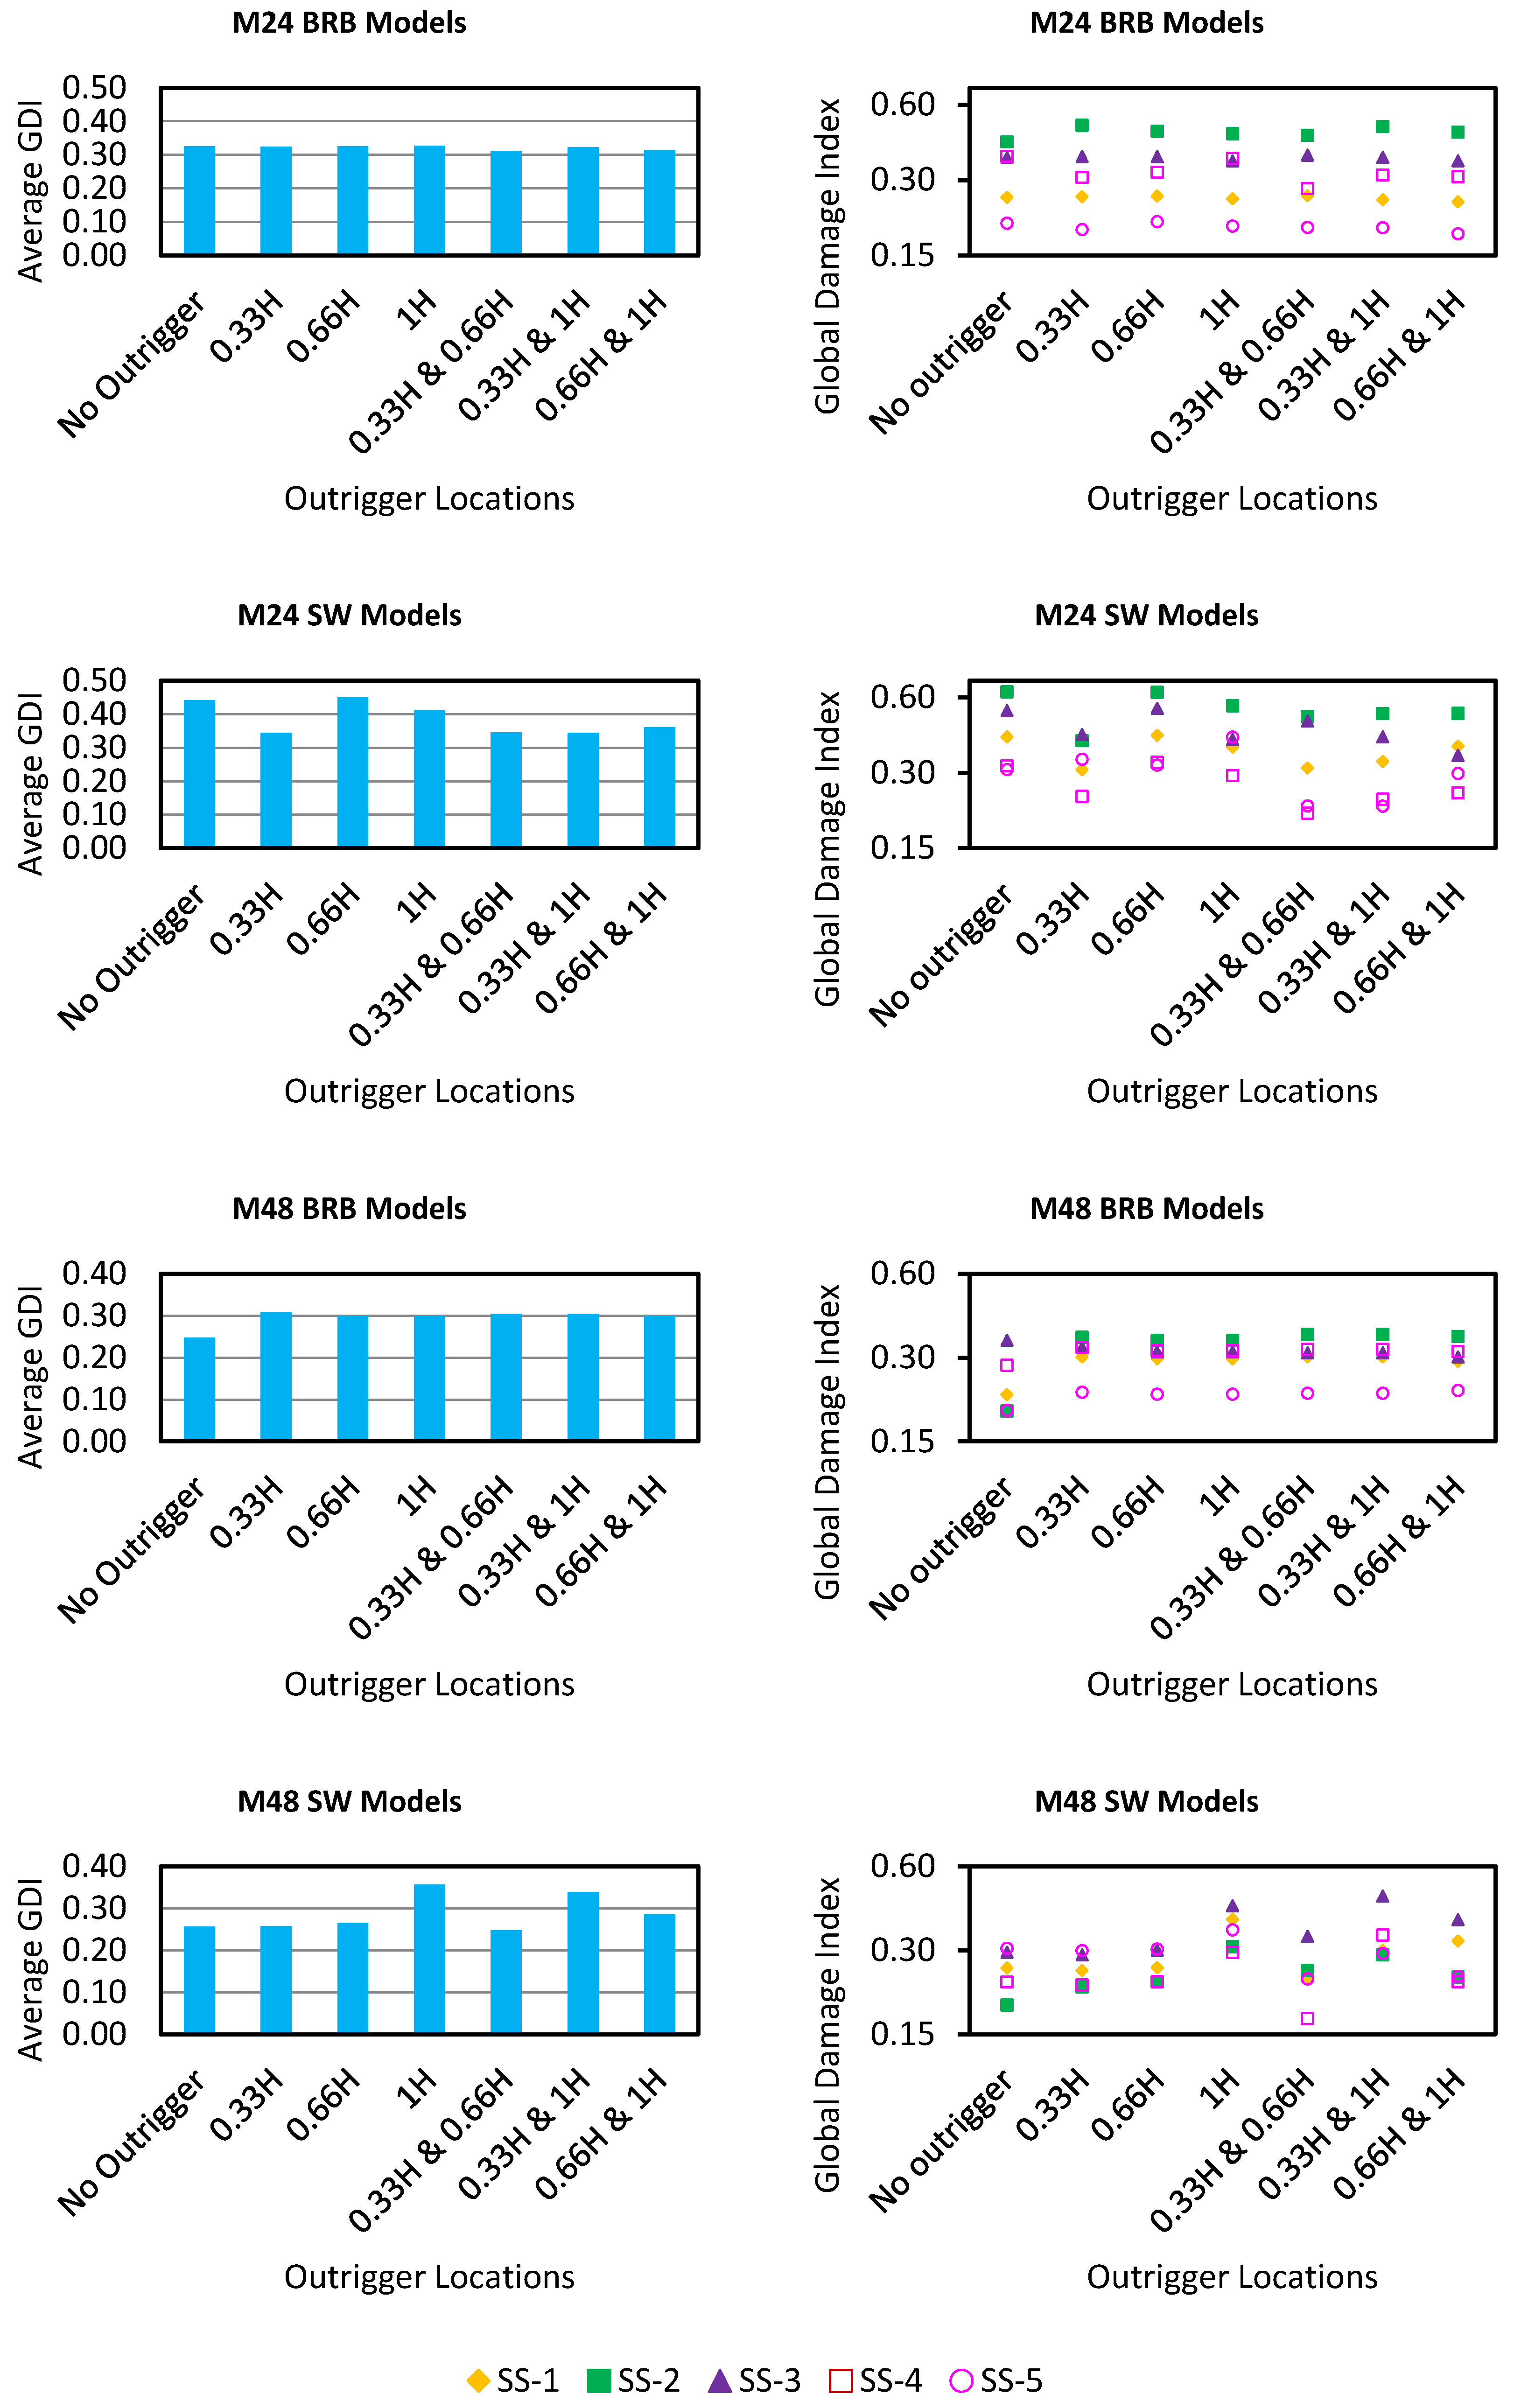
The distribution of the global damage index (GDI) and story damage index (SDI) determined by nonlinear time history analyses under five earthquake sequences is shown in Figure 14, Figure 15, Figure 16, Figure 17 and Figure 18. The findings show how damage distribution and concentration in tall structures are impacted by various outrigger configurations, core systems, and building heights.
Response of the buildings with BRB core—24-story tall buildings are plotted in Figure 14. The mid-stories for the no-outrigger configuration (M24-BRB-1) in BRB-core 24-story models have the greatest SDI values, which suggests localized inelastic deformation and inadequate lateral stiffness. While multiple arrangements of outriggers, especially 0.33H and 0.66H (M24-BRB-D1), provide a more spread damage profile along the height, lowering peak values below the damage threshold (SDI < 0.4 in most circumstances), adding a single outrigger at 0.33H (M24-BRB-2) greatly decreases mid-story damage. For the 24-story RC wall core buildings (Figure 15), the upper stories are more likely to be damaged when outriggers have not been installed (M24-SW-1). Dual placements (M24-SW-D2 and D3) and outriggers at 0.33H (M24-SW-2) aid in redistributing these demands, producing more consistent and lower SDI profiles across the structure. In the no-outrigger model (M48-BRB-1), SDI values for 48-story BRB-core buildings show that upper-mid levels have significant damage concentrations (Figure 16). Installing outriggers significantly lowers peak SDI values and flattens the damage distribution, particularly in double installation of outriggers (M48-BRB-D2: 0.33H and 1.00H).
The global damage index (GDI) values are consistent with the results obtained with SDI data, as shown in Figure 18. Compared to the single outrigger and without outrigger scenarios, the double outrigger configuration offers the most effective damage reduction method, significantly reducing the GDI. Due to the greater flexibility and higher modal participation, the difference in GDI between single and double outriggers is more pronounced in 48-story buildings.
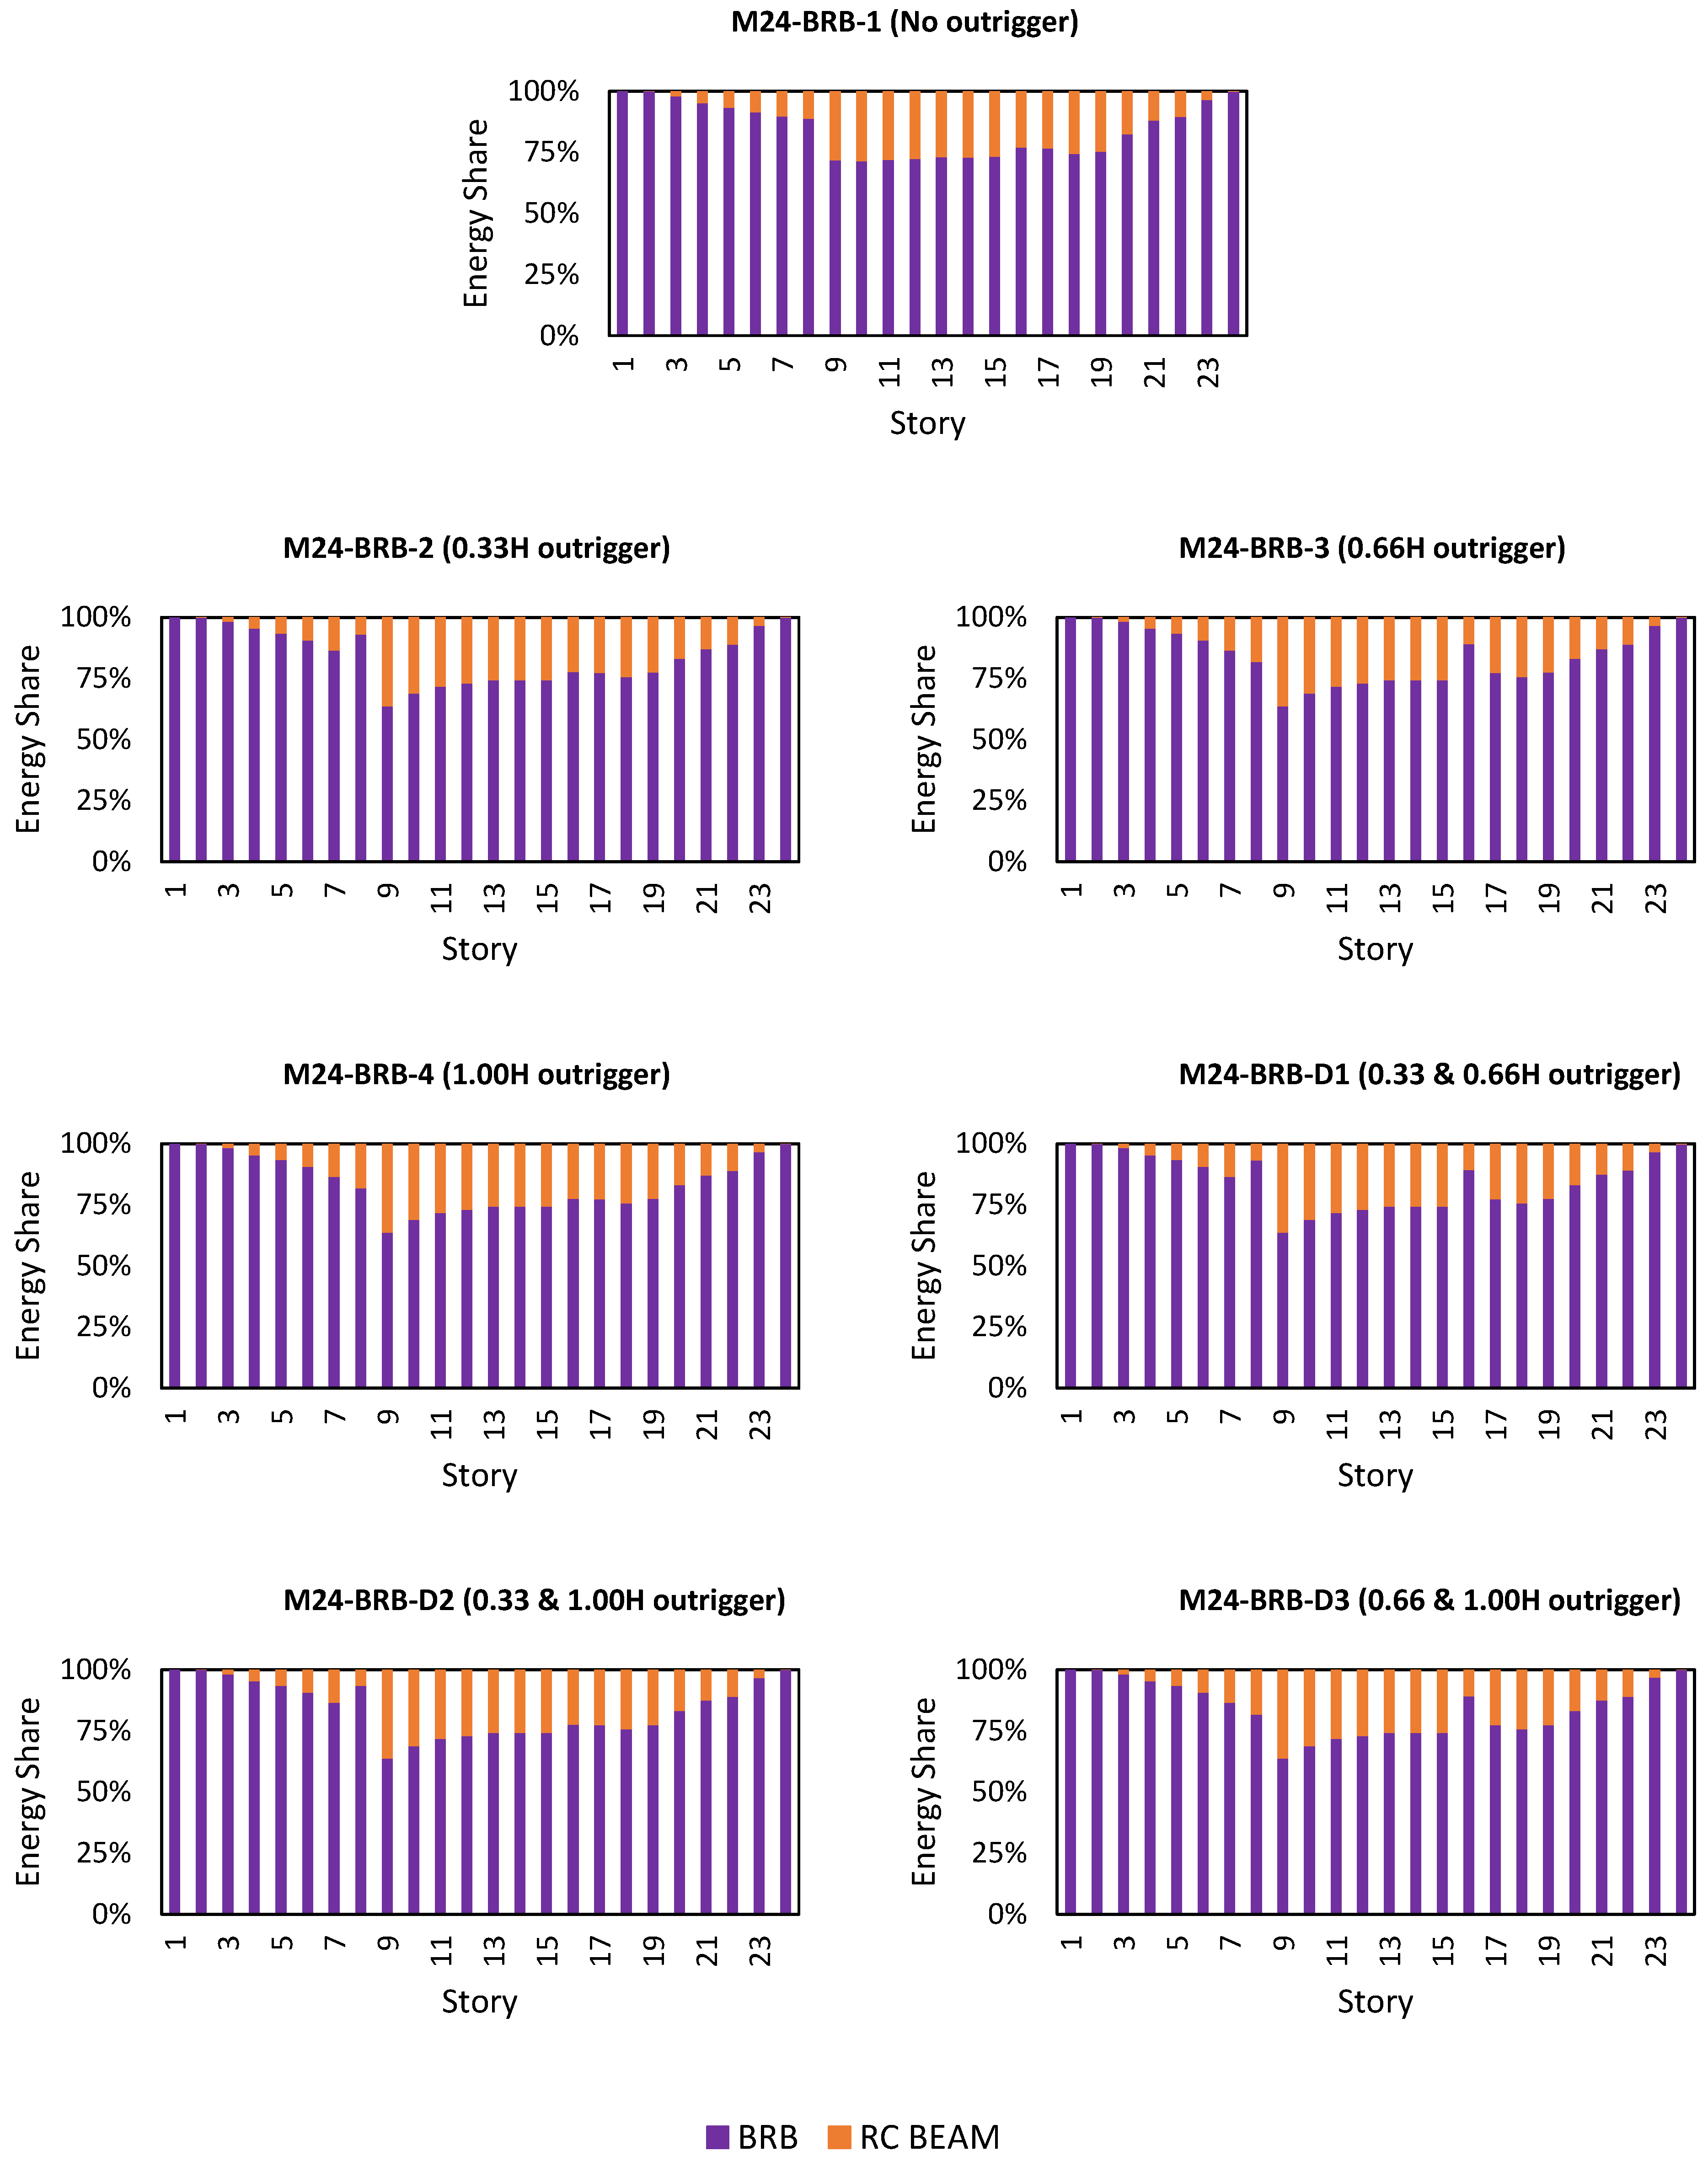
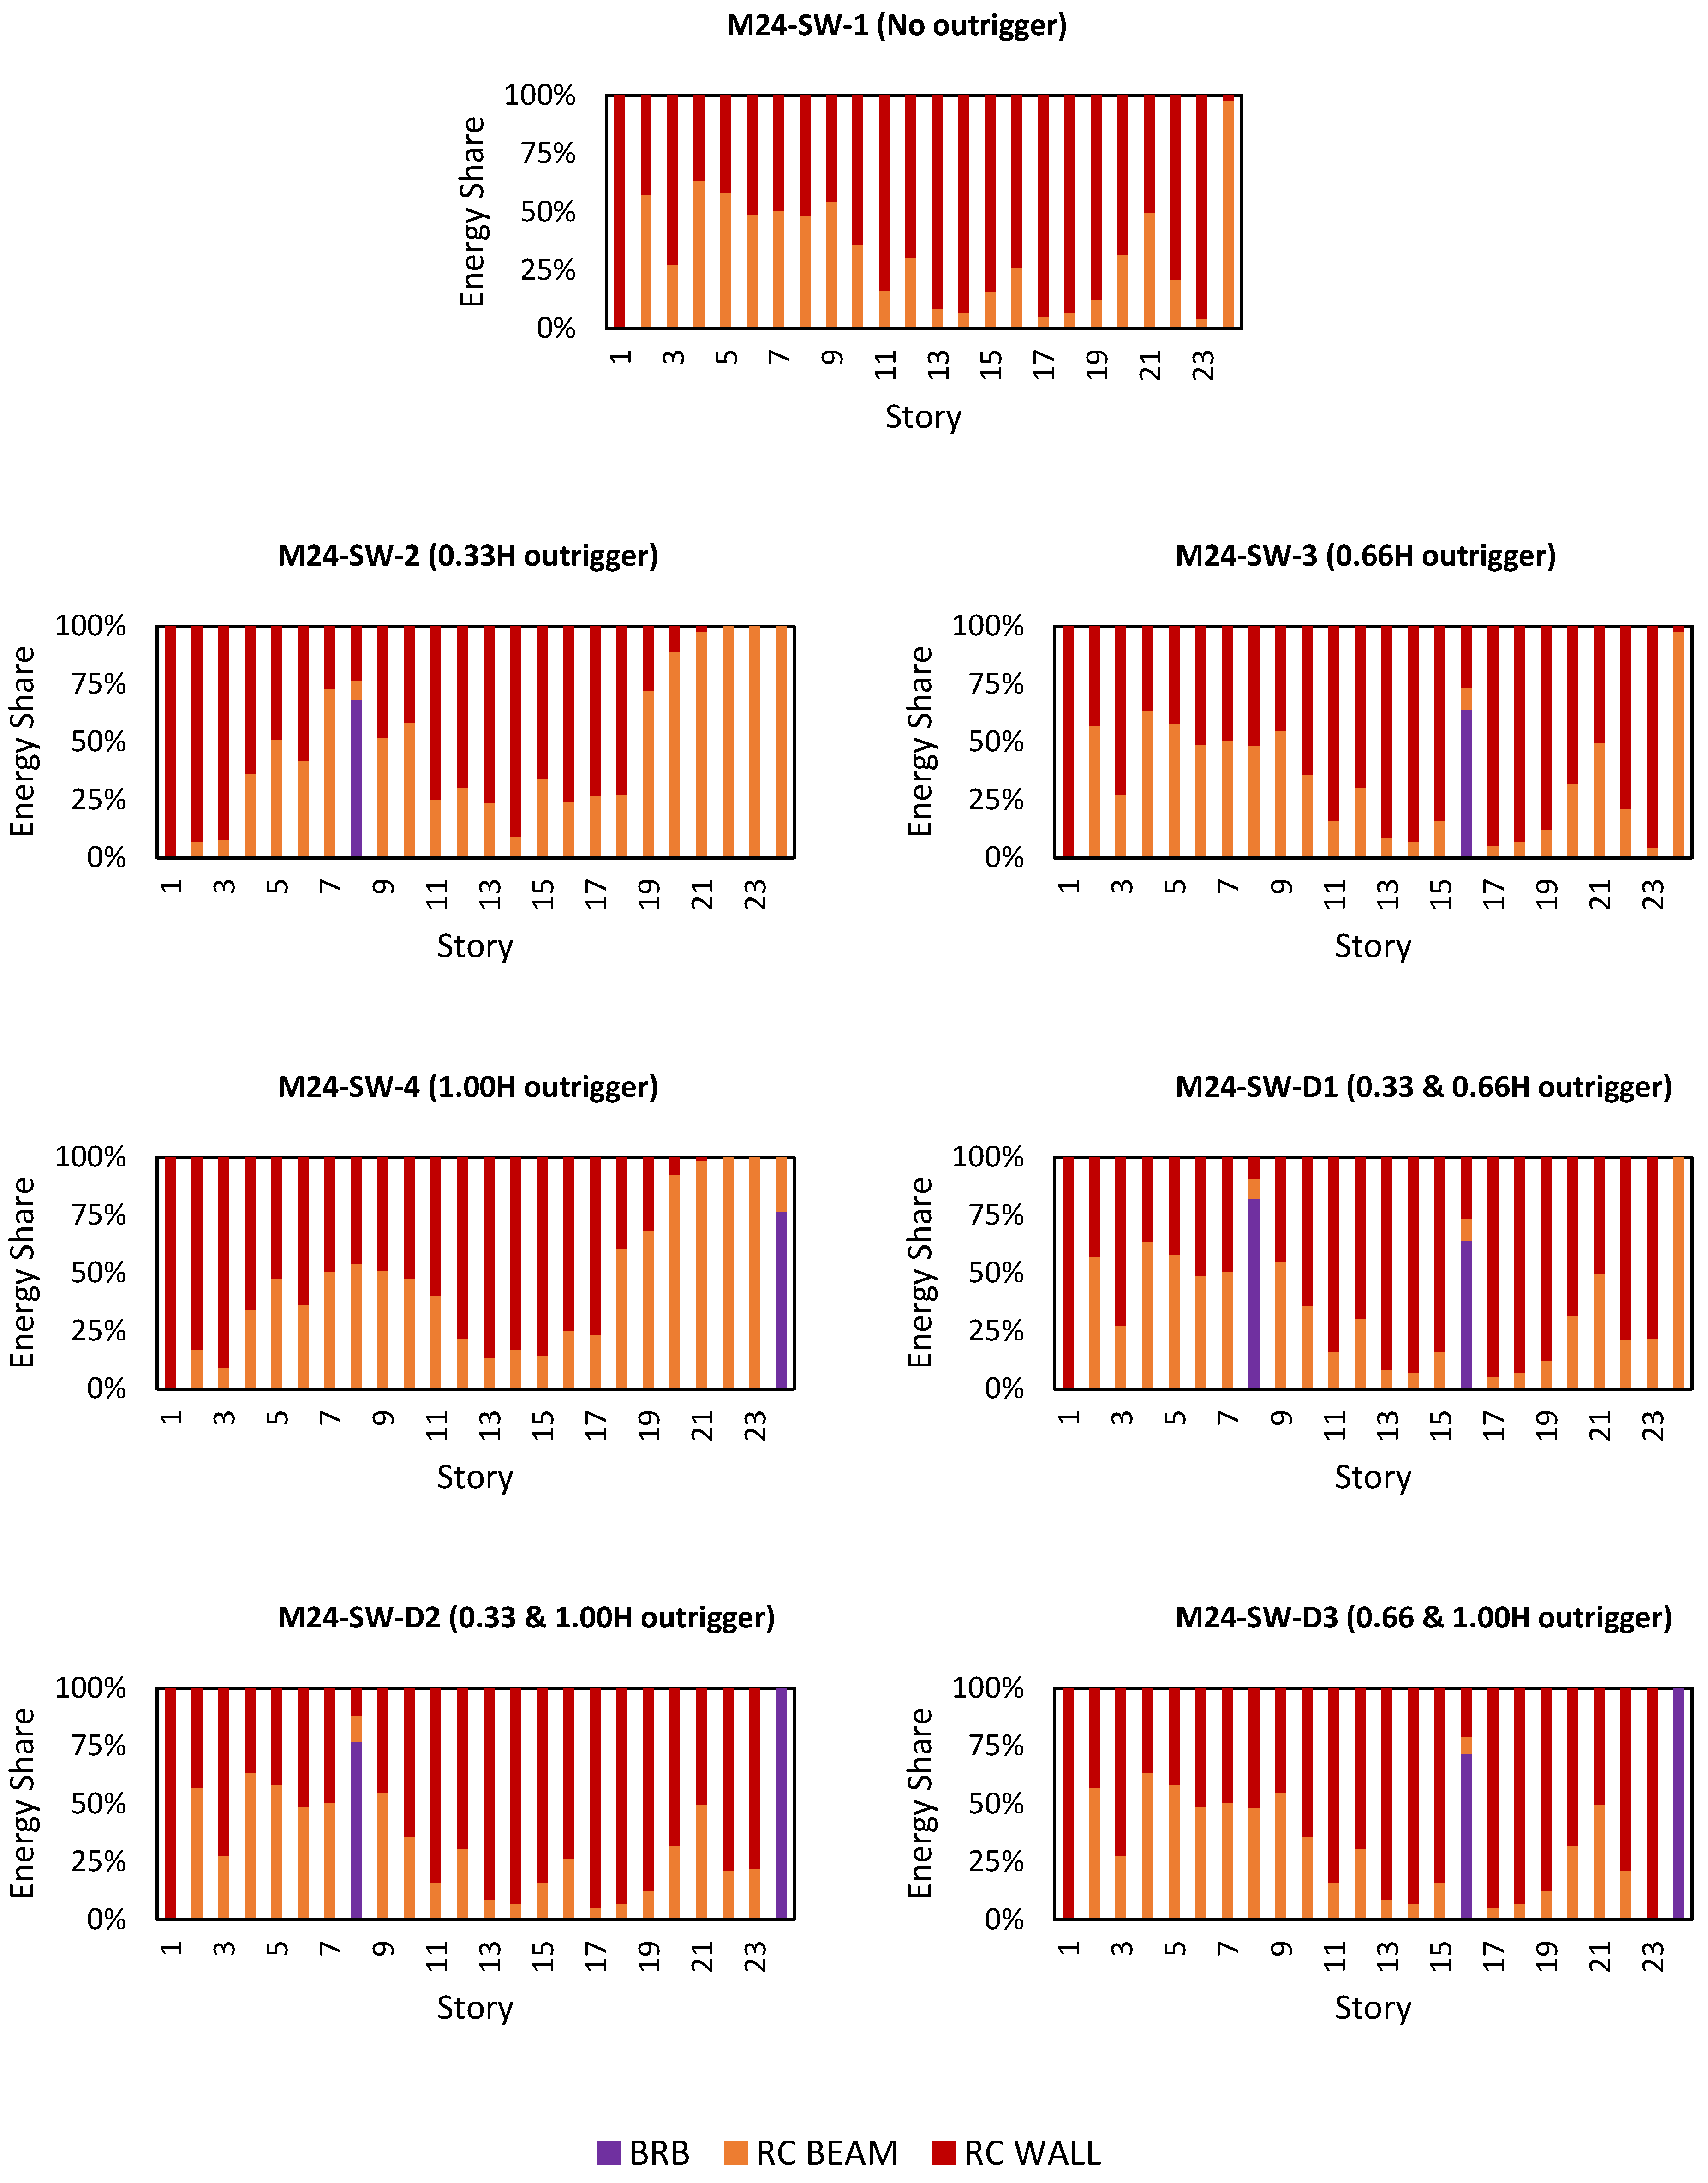
Figure 19 and Figure 20 summarize the story-level shares of hysteretic energy—BRB links vs. RC beams and walls—for the 24-story archetypes, averaged across SS-1–SS-5, thereby contextualizing the SDI/GDI trends in Figure 14, Figure 15, Figure 16, Figure 17 and Figure 18. The 48-story maps are omitted for brevity.

5.3. Integrated Performance Index (PI) and Ranking

To reconcile mixed trends in periods, MISD, and GDI, we define a composite Performance Index (PI) expressed as in Equation (5) as follows:
P I = w M I S D M I S D M I S D n o O G + w G D I G D I G D I n o O G
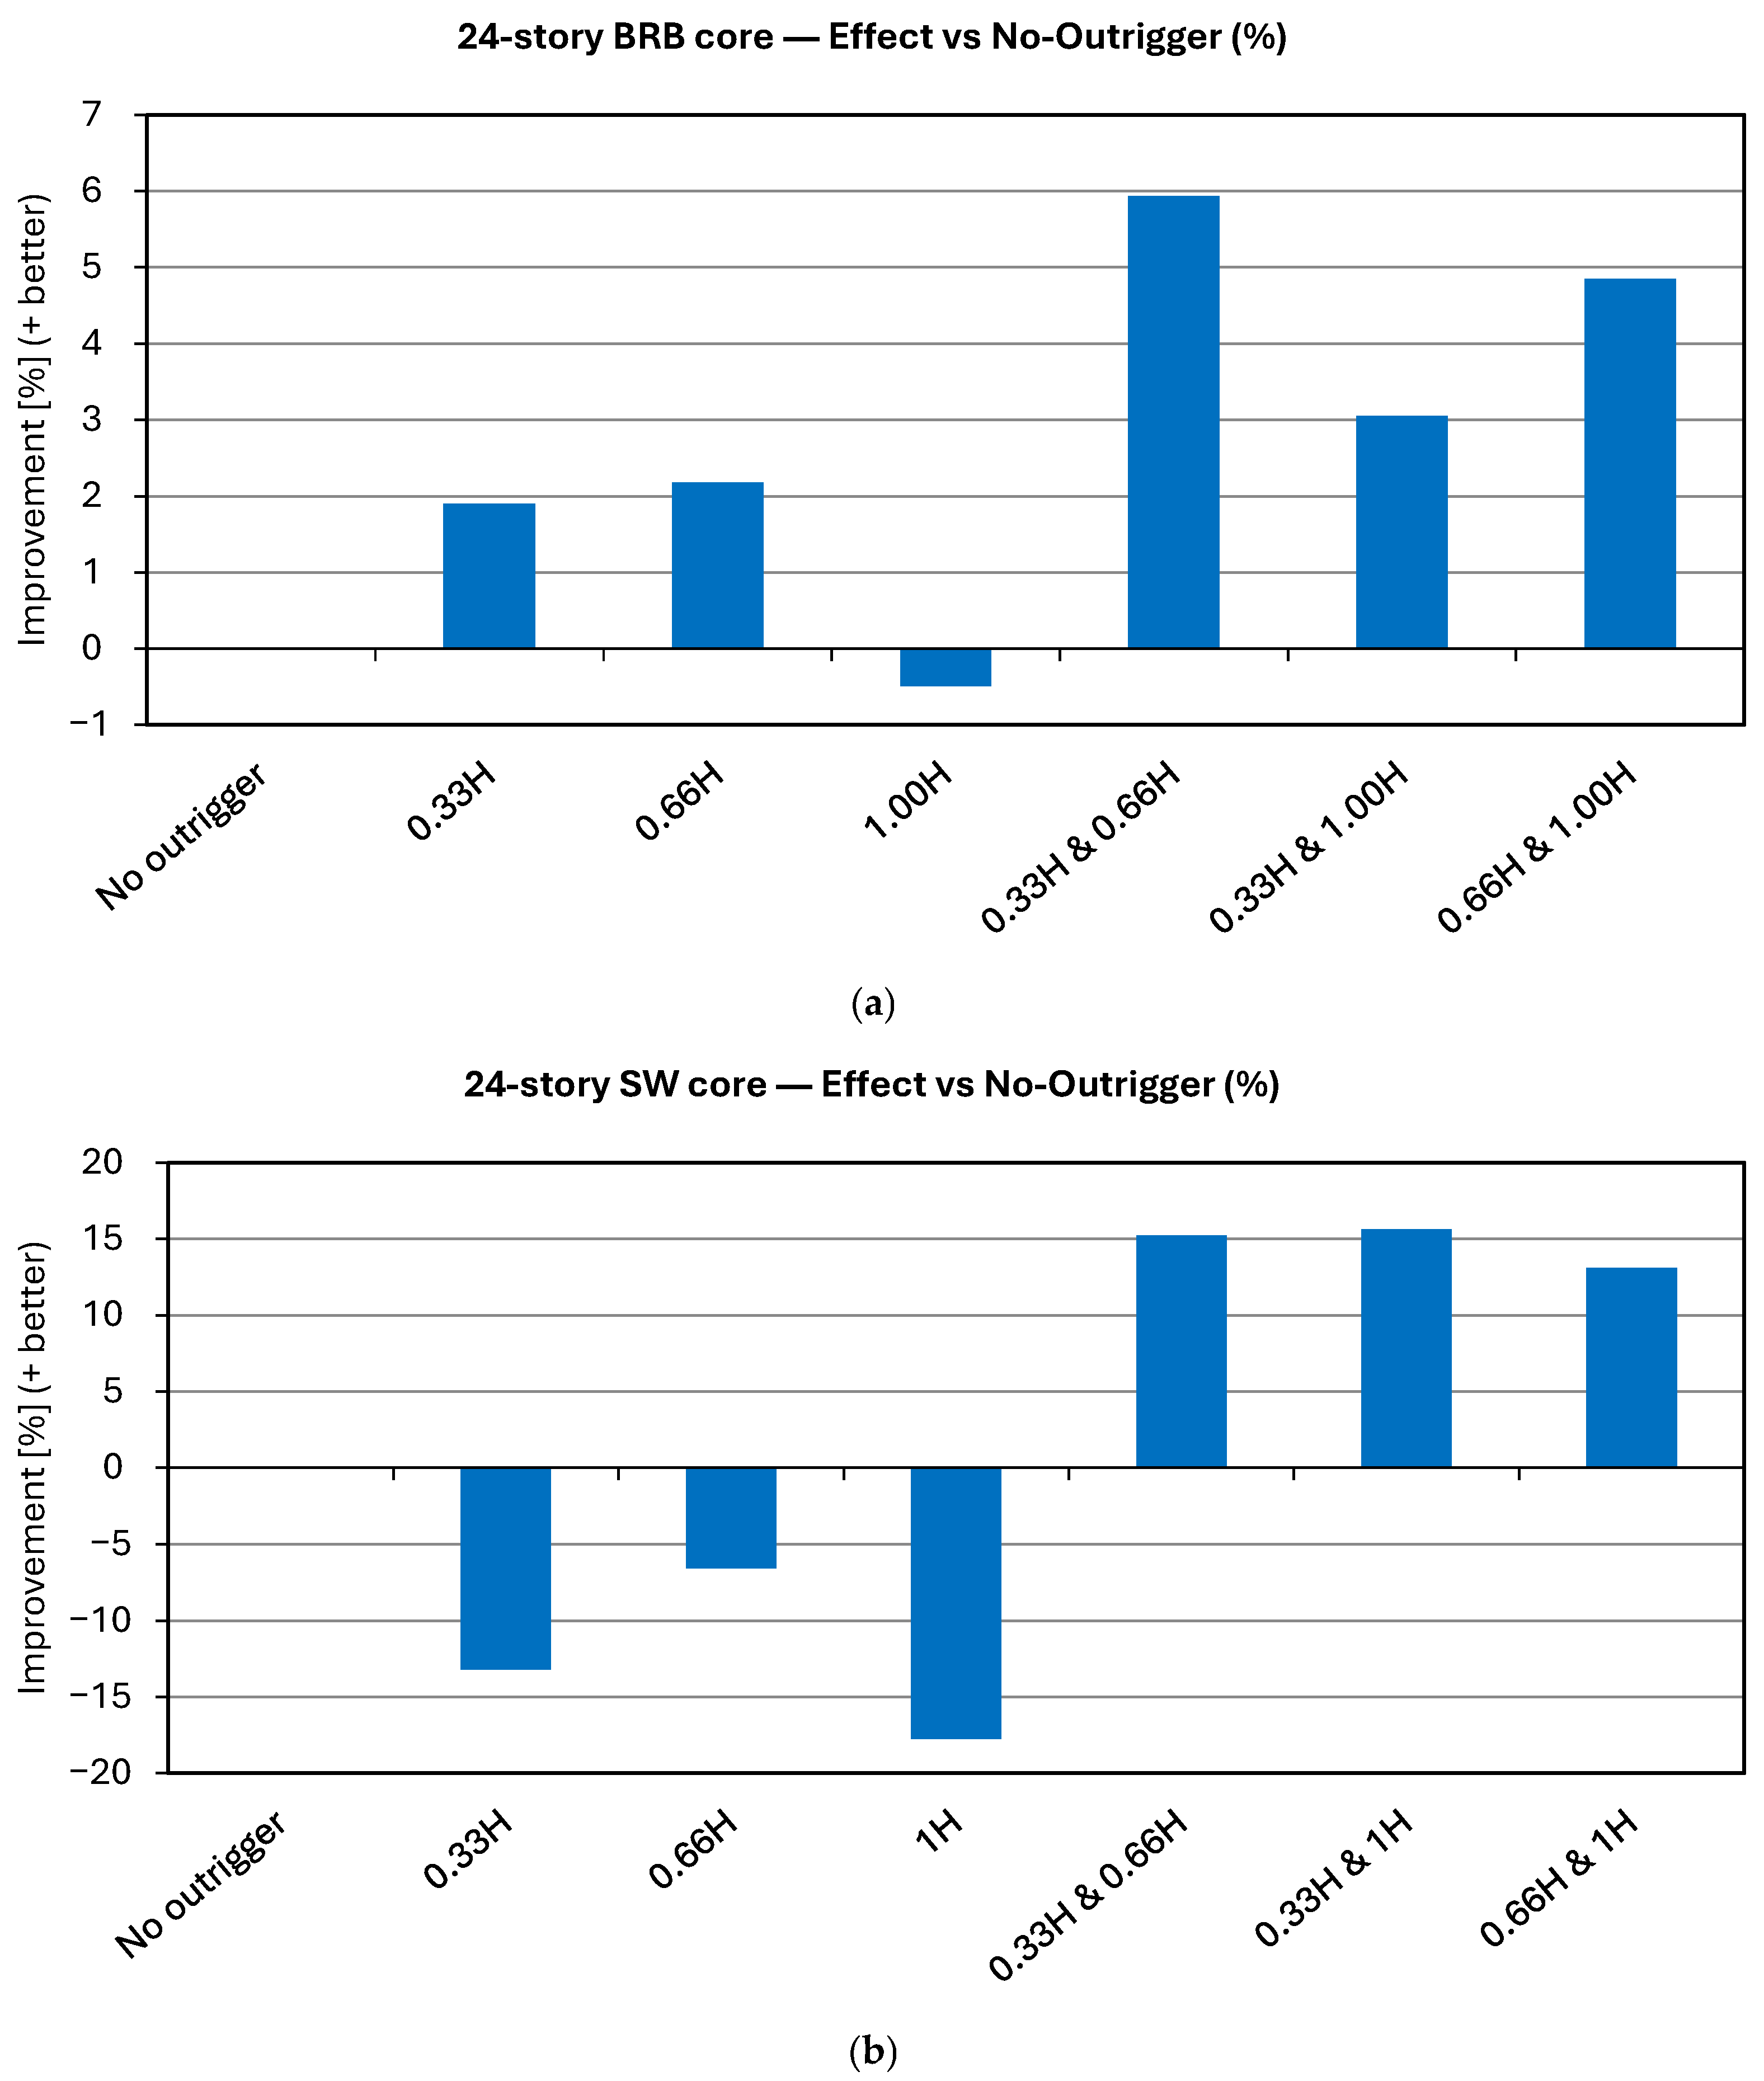
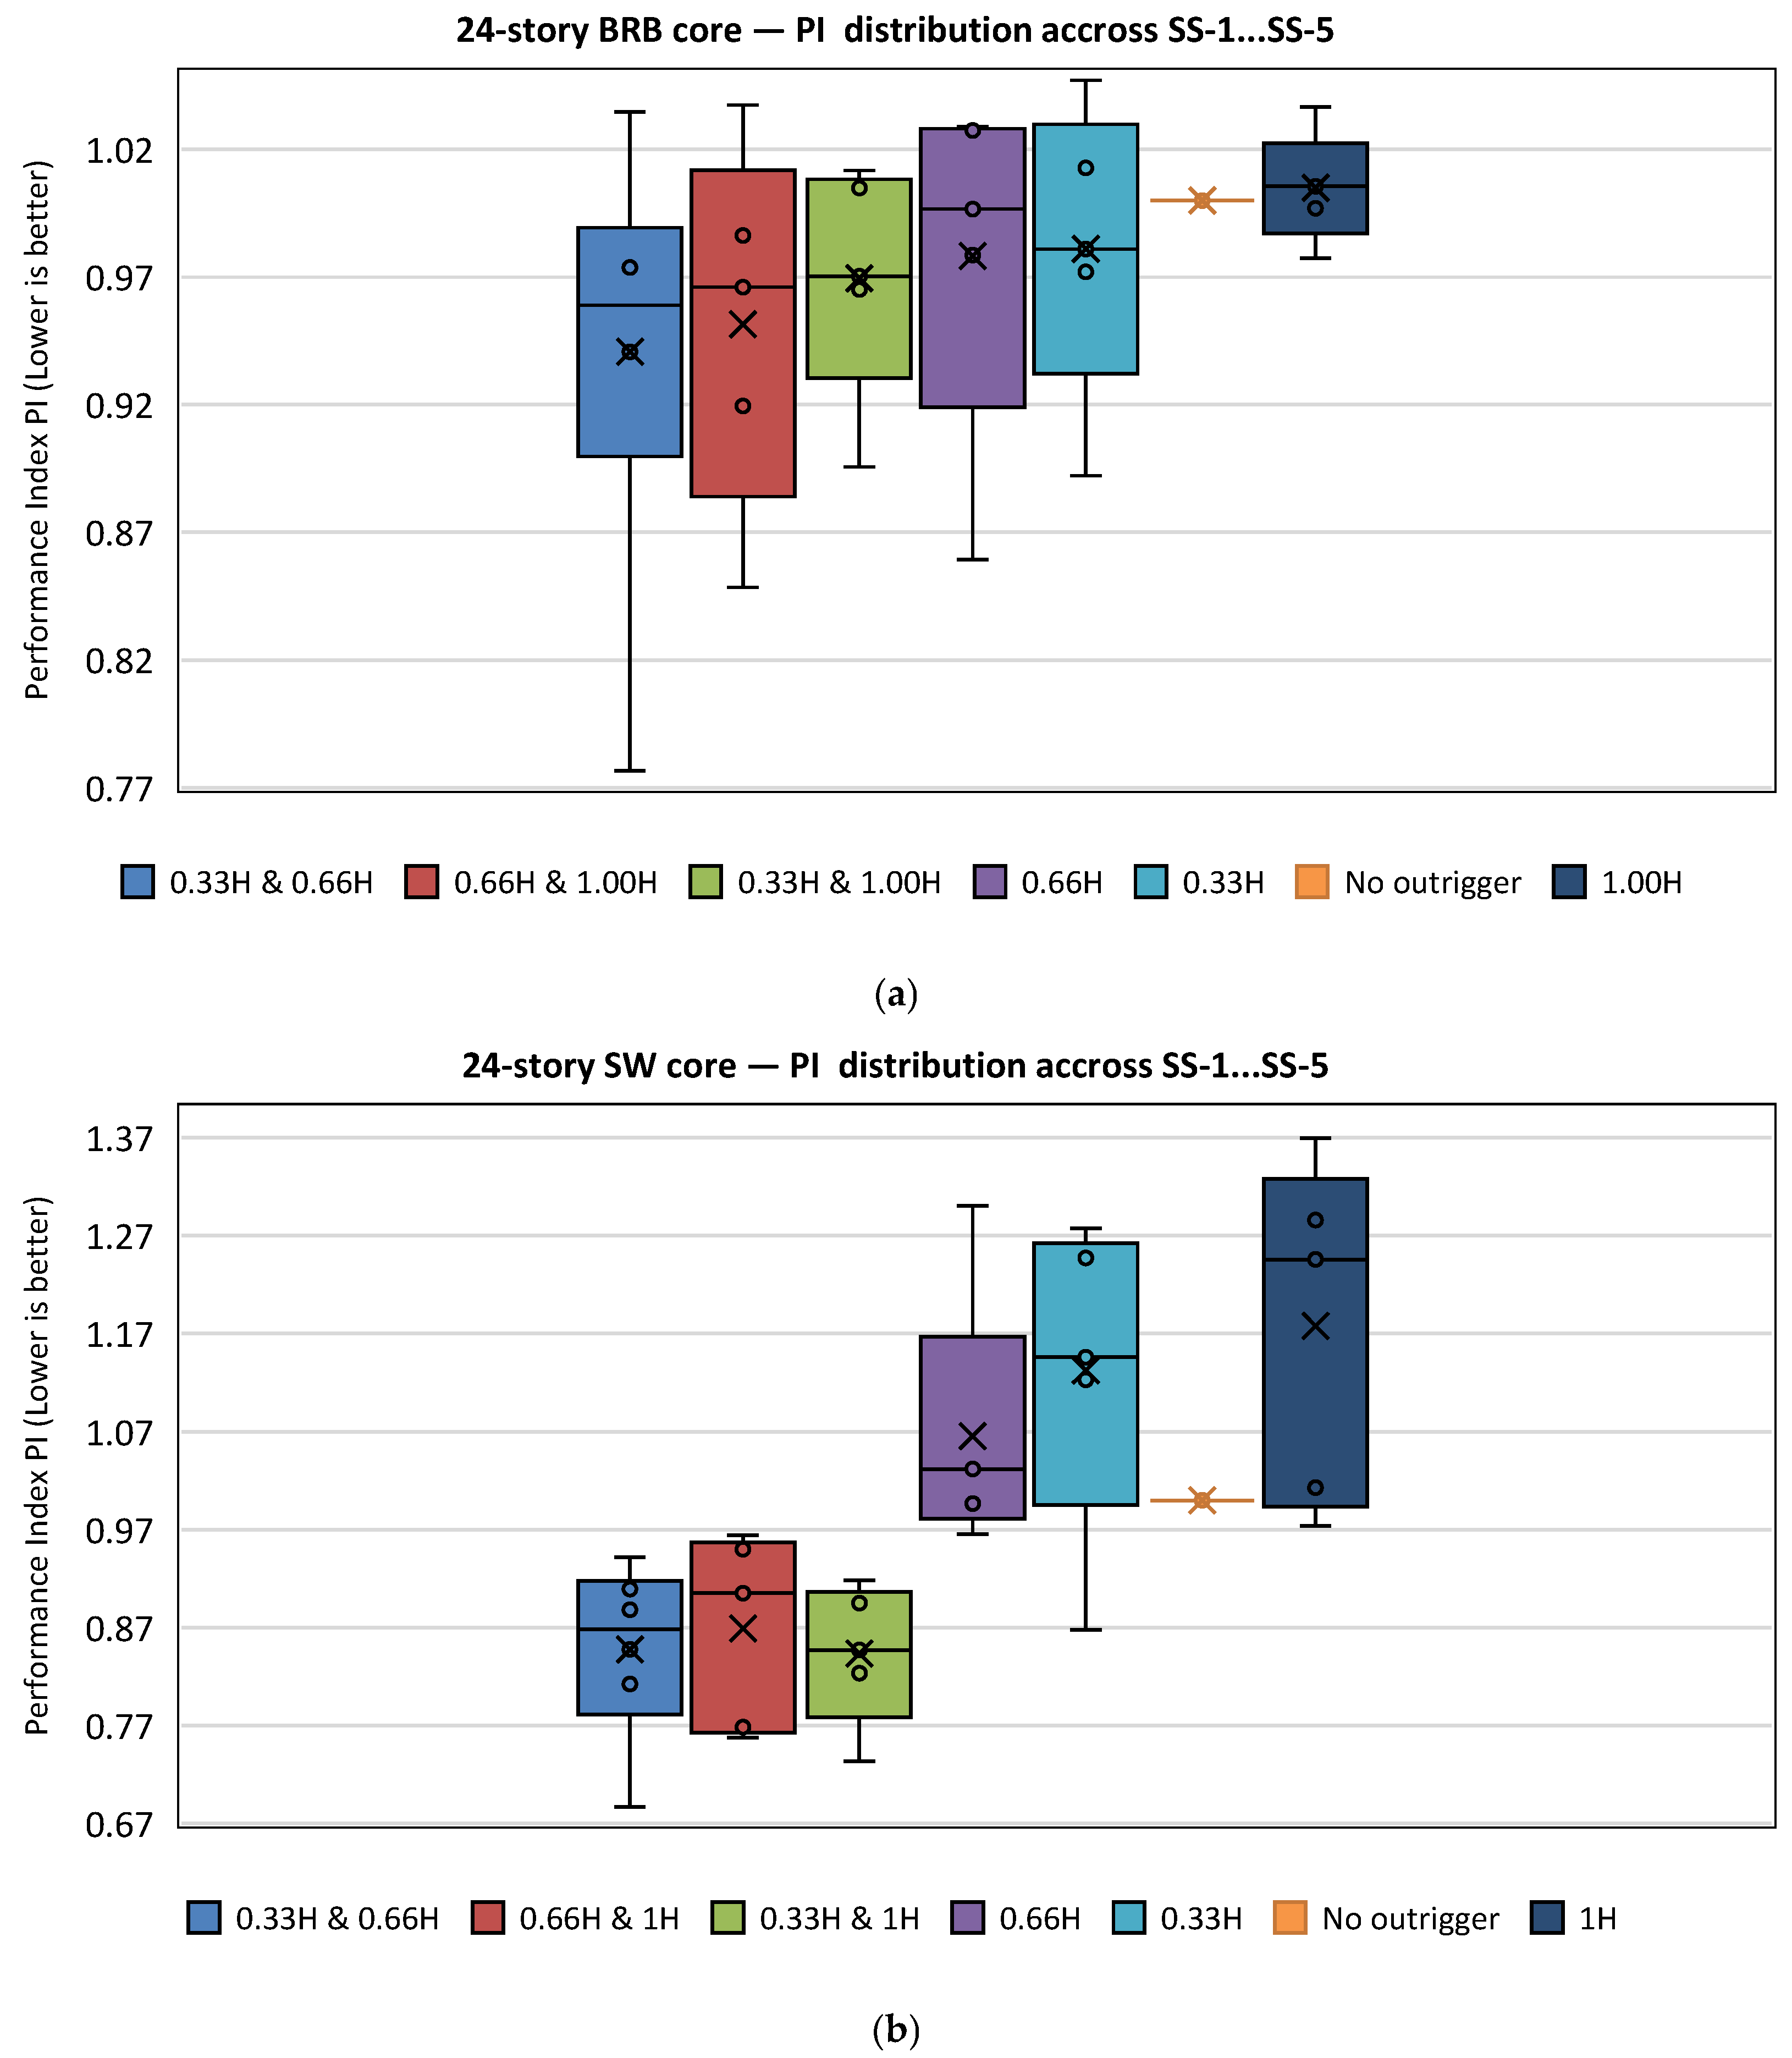
where w M I S D and w G D I are weighting factors that are selected as 0.5 by default (other reasonable weightings yield consistent rankings). PI computed per sequence and summarized by mean (with std. dev. and min–max across SS-1–SS-5). Figure 21, Figure 22 and Figure 23 show the ranking and effect sizes for each archetype; for example, the 24-story BRB core is minimized by dual 0.33H and 0.66H (≈5.9% below baseline), and the 24-story RC wall by dual 0.33H and 1.0H (≈15.6% below baseline), whereas the 48-story BRB shows no composite benefit from outriggers. The 48-story archetypes are omitted for brevity.

6. Conclusions

6.1. Desing Orientation and Interpretation

The conclusion includes both numerical summaries and interpretation of results to guide practical design decisions. The seismic performance of tall buildings with outrigger systems was studied using the peak and cumulative response values. The peak response was quantified as the maximum inter-story drift (MISD), which depicts the displacement requirement, whereas the cumulative response was accounted for as a global damage index (GDI), which calculates the energy dissipation at the end. MISD is an effective tool for assessing lateral stiffness, serviceability, and drift control. It was seen that the drift ratio is significantly reduced in the case of the BRB core. On the other hand, RC wall cores typically exhibit reduced drift values due to their inherent stiffness. Although this study is based on numerical simulations, the trends observed—such as drift concentration in flexible BRB-core buildings and the effectiveness of dual outriggers—are consistent with post-earthquake field observations in tall buildings. This consistency supports the practical relevance of the presented findings.
To benchmark T 1 , we compute the ASCE 7 [33] approximate period T a = C t h x using ( C t ,   x ) values for RC shear-wall systems and for braced/dual systems, based on the governing core type. Table 8 lists the h (building height), T a , and T 1 / T a for all configurations. Across archetypes, T 1 falls within the expected band relative to T a ; outriggers slightly shorten T 1 when stiffness is added near the engaged height(s), and may lengthen it when mass–stiffness redistribution shifts the first-mode shape. These modal shifts help rationalize the sequence-dependent MISD localization discussed in Section 5.2.

6.2. Summary of Observed Results

According to the analyses and results, the following conclusions were observed:
  • GDI indicates overall energy loss and structural degeneration. Even if the drift ratio remains within permissible limits, the GDI may nevertheless indicate a considerable danger of damage, especially in the case of consecutive seismic events.
  • For single outrigger systems, it has been shown that the optimal approach to minimizing relative inter-story drift ratio is obtained when the outrigger is located at approximately 0.33H (one-third of the building height).
  • Dual locations of outriggers (0.33H and 0.66H or 0.33H and 1.0H) provide more consistent inter-story drift ratio reductions throughout the building height compared to single-outrigger configurations. For tall buildings with flexible core systems such as BRB cores that provide both base and top floor control, 0.33H and 1.0H have been found to be a suitable choice between these configurations.
  • RC wall cores maintain lower drift profiles even without outriggers but still show notable improvements with optimal placement, especially in 48-story cases.
  • Drift ratio requirement is greatly impacted by seismic sequence features, with SS-4 and SS-5 sequences being the most crucial for all building model types.
  • RC wall core systems respond more consistently to various seismic sequence inputs and provide superior inter-story drift ratio control.
  • In all seismic sequence conditions, dual outriggers provide the best drift ratio reduction, particularly at 0.33H and 1.0H. While the dual-outrigger placement shows optimal performance, its implementation in real buildings may be limited by architectural and construction constraints. Future studies may consider multi-disciplinary optimization for practical integration.
  • Outrigger placements are quite beneficial in reducing local DI and GDI, especially in BRB cored models and taller building models. This is especially true at 0.33H and 1.00H of the double outrigger configurations.
  • Based on average GDI relative to the no-outrigger baseline across SS-1–SS-5, dual 0.33H and 0.66H (~4.0%) or dual 0.66H and 1.0H (~3.9%) in 24-story BRB cores may be considered, single 0.33H (~22.1%) or dual 0.33H and 1.0H (~21.9%) in 24-story RC shear-wall cores may be considered, outriggers in 48-story BRB cores may not provide average GDI reductions (e.g., dual 0.66H and 1.0H ≈ −20.9%) and thus may not be relied upon for GDI control, and dual 0.33H and 0.66H in 48-story RC shear-wall cores offers a modest average reduction (~3.3%) while single 1.0H appears detrimental (~−39.0%), with all values reflecting averages across sequences and sequence-to-sequence scatter that should be considered in performance-based design.
  • Although outrigger optimization is still advantageous, RC shear wall cores naturally perform better under seismic conditions.
  • While MISD may indicate acceptable deformation levels, the GDI can reveal hidden vulnerabilities related to material degradation and low-cycle fatigue, especially in BRB-core systems.
  • These findings provide practical design guidance by indicating that dual outrigger placements at 0.33H and 1.0H offer a favorable balance between stiffness enhancement and energy dissipation, especially in BRB-core tall buildings.
  • The strategic use of outriggers in RC wall core systems, even if these cores already offer high stiffness, helps further reduce drift demands in critical stories and supports serviceability requirements.
  • It is important to consider seismic sequences rather than individual events when assessing damage accumulation. Outrigger systems are effective in reducing permanent damage caused by multiple events.
  • Design codes and performance-based frameworks can benefit from explicit recommendations for outrigger positions and configurations that account for both deformation-based and energy-based damage measurements under sequential ground motions.

6.3. Limitations and Future Work

While the study utilized five different real earthquake sequences (SS-1 to SS-5), some variability in drift and damage response was observed across sequences, particularly SS-4 and SS-5, which produced higher deformation and cumulative damage. Although a full probabilistic or quantitative sensitivity analysis was beyond the scope of this work, a qualitative comparison indicates that seismic records with higher velocity pulses and longer spectral content tend to produce greater responses in BRB-core buildings. Nevertheless, the relative performance trends—such as the effectiveness of dual outriggers at 0.33H and 1.0H—remained consistent across all events. This supports the robustness of the presented design recommendations under varying seismic demands.
The quantitative assessment of capacity after the mainshock is beyond the scope of this study. This study focuses on comparing outrigger placements under successive earthquakes using inter-story drift and energy-based criteria. In future work, residual displacements and stiffness/strength preservation will be quantitatively reported to support repair or continue-in-service decisions.
Spectral matching every event to a DBE target can modify duration and cumulative energy, potentially overstating relative aftershock severity when compared to hazard-consistent pairs. We reported Aria’s intensity ( I a ) and significant duration ( D S   5 95 ) for transparency (Table 4). A differential aftershock target or as-recorded sequences would better bound these artifacts and are identified as future work. As our conclusions are based on relative differences among outrigger layouts, we expect rankings to be robust, while absolute damage/drift magnitudes may shift.
Because column DI/energy was excluded by assumption, absolute SDI/GDI magnitudes may be slightly biased; however, the relative ranking of outrigger layouts is expected to be unaffected under the symmetric archetypes considered.
At fixed response histories, DI(β) is linear in β; changing β scales only the energy term. Varying β within 0.03–0.15 mainly shifts absolute SDI/GDI values, while qualitative rankings of outrigger placements are expected to remain unchanged.
The conclusion of this study clearly reveals that further studies are required in understanding the feasibility of the outrigger systems with RC tall buildings with wall or BRB core systems. Future work may extend this framework to hybrid core systems, near-fault seismic inputs, irregular building configurations, and design scenarios involving architectural and construction constraints, while also incorporating a direct comparison of energy dissipation capacity between BRB and RC cores to clarify cumulative damage patterns.

Author Contributions

İ.E.İ.: Writing—original draft, visualization, software, investigation, data curation. A.A.D.: Writing—review and editing, supervision, project administration. All authors have read and agreed to the published version of the manuscript.

Funding

The author(s) reported there is no funding associated with the work featured in this article.

Data Availability Statement

The data used in this study are available from the corresponding author upon reasonable request.

Conflicts of Interest

The authors declare no conflicts of interest.

Appendix A

Table A1. Modal properties and mass participation (analysis direction).
ArchetypeOutrigger
Configuration
ModeT_i [s]Mass Participation
Mx [%]
Cumulative
ΣMx [%]
24F–BRBNo outrigger14.17570.88%70.88%
21.43712.66%83.54%
30.8374.95%88.49%
40.5582.52%91.01%
50.4051.69%92.70%
0.33H14.03270.33%70.33%
21.42213.92%84.25%
30.8364.66%88.91%
40.552.04%90.95%
50.3971.62%92.57%
0.66H14.12271.57%71.57%
21.4111.97%83.54%
30.8365.08%88.62%
40.5472.45%91.07%
50.4051.66%92.73%
1.0H14.17370.92%70.92%
21.43412.68%83.60%
30.8324.96%88.56%
40.5532.53%91.09%
50.41.71%92.80%
0.33H and 0.66H13.97871.09%71.09%
21.39613.16%84.25%
30.8354.79%89.04%
40.5381.96%91.00%
50.3971.63%92.63%
0.33H and 1.0H14.0370.37%70.37%
21.41913.93%84.30%
30.8314.66%88.96%
40.5442.06%91.02%
50.3911.66%92.68%
0.66H and 1.0H14.1271.60%71.60%
21.40711.99%83.59%
30.8325.08%88.67%
40.5412.49%91.16%
50.41.66%92.82%
24F–SWNo outrigger12.68363.85%63.85%
20.58118.80%82.65%
30.2436.96%89.61%
40.1423.33%92.94%
50.0981.90%94.84%
0.33H12.62163.59%63.59%
20.57819.20%82.79%
30.2436.86%89.65%
40.1413.27%92.92%
50.0981.93%94.85%
0.66H12.63864.11%64.11%
20.57918.53%82.64%
30.2436.97%89.61%
40.1423.32%92.93%
50.0981.89%94.82%
1.0H12.664.55%64.55%
20.56918.24%82.79%
30.2416.86%89.65%
40.1413.30%92.95%
50.0971.88%94.83%
0.33H and 0.66H12.57763.85%63.85%
20.57618.93%82.78%
30.2436.88%89.66%
40.1413.26%92.92%
50.0981.92%94.84%
0.33H and 1.0H12.58563.90%63.90%
20.57318.95%82.85%
30.2426.82%89.67%
40.1413.26%92.93%
50.0981.92%94.85%
0.66H and 1.0H12.60364.41%64.41%
20.57418.30%82.71%
30.2426.93%89.64%
40.1413.31%92.95%
50.0981.88%94.83%
48F–BRBNo outrigger18.86166.07%66.07%
22.96615.05%81.12%
31.7416.12%87.24%
41.1392.71%89.95%
50.8011.76%91.71%
0.33H18.58765.53%65.53%
22.93616.28%81.81%
31.745.80%87.61%
41.1212.29%89.90%
50.7861.77%91.67%
0.66H18.77266.55%66.55%
22.93414.59%81.14%
31.7416.17%87.31%
41.1272.70%90.01%
50.81.71%91.72%
1.0H18.85466.11%66.11%
22.96115.05%81.16%
31.7356.13%87.29%
41.1322.70%89.99%
50.7951.77%91.76%
0.33H and 0.66H18.49866.03%66.03%
22.90515.79%81.82%
31.7395.84%87.66%
41.1092.27%89.93%
50.7861.73%91.66%
0.33H and 1.0H18.5865.57%65.57%
22.9316.29%81.86%
31.7335.79%87.65%
41.1142.28%89.93%
50.781.79%91.72%
0.66H and 1.0H18.76566.58%66.58%
22.92814.60%81.18%
31.7356.17%87.35%
41.122.70%90.05%
50.7941.72%91.77%
48F–SWNo outrigger17.65364.71%64.71%
21.83216.35%81.06%
30.7576.66%87.72%
40.4173.44%91.16%
50.272.11%93.27%
0.33H17.29664.10%64.10%
21.81317.27%81.37%
30.7566.43%87.80%
40.4133.32%91.12%
50.2692.17%93.29%
0.66H17.54465.01%65.01%
21.82216.04%81.05%
30.7576.67%87.72%
40.4163.44%91.16%
50.272.10%93.26%
1.0H17.58664.98%64.98%
21.81316.16%81.14%
30.7536.61%87.75%
40.4153.43%91.18%
50.2692.11%93.29%
0.33H and 0.66H17.19664.41%64.41%
21.80316.96%81.37%
30.7566.45%87.82%
40.4123.32%91.14%
50.2692.16%93.30%
0.33H and 1.0H17.23364.39%64.39%
21.79517.07%81.46%
30.7526.38%87.84%
40.4123.31%91.15%
50.2682.17%93.32%
0.66H and 1.0H17.48265.27%65.27%
21.80315.86%81.13%
30.7536.62%87.75%
40.4153.42%91.17%
50.2692.10%93.27%

References

  1. Samadi, M.; Jahan, N. Comparative study on the effect of outrigger on seismic response of tall buildings with braced and RC wall core. I: Optimum level and examining modal response spectrum analysis reliability. Struct. Des. Tall Spec. Build. 2021, 30, e1848. [Google Scholar] [CrossRef]
  2. Xing, L.; Zhou, Y.; Huang, W. Seismic optimization analysis of high-rise buildings with a buckling-restrained brace outrigger system. Eng. Struct. 2020, 220, 110959. [Google Scholar] [CrossRef]
  3. Bai, J.; Chen, H.; Jin, S. Investigation on the interaction between BRBs and the RC frame in BRB-RCF systems. Eng. Struct. 2021, 243, 112685. [Google Scholar] [CrossRef]
  4. Ayash, N.M.; Shaker, F.M.F.; Mahmoud, F.A. Seismic Performance of Tall Buildings having Steel Plate Shear Wall Combined with BRB-Outriggers. Eng. Res. J. 2024, 183, 107–132. [Google Scholar] [CrossRef]
  5. Sthapit, N.; Shrestha, R.K.; Paudel, S. Seismic Response Analysis of High-Rise Reinforced Concrete Buildings Using Outrigger System. J. Inst. Eng. Ser. A 2023, 104, 943–952. [Google Scholar] [CrossRef]
  6. Kushwaha, V.; Mishra, N. A Review on Dynamic Analysis of Outrigger Systems in High Rise Building against Lateral Loading. Int. J. Res. Appl. Sci. Eng. Technol. 2022, 10, 564–568. [Google Scholar] [CrossRef]
  7. Morales-Beltran, M.; Turan, G.; Dursun, O.; Nijsse, R. Energy dissipation and performance assessment of double damped outriggers in tall buildings under strong earthquakes. Struct. Des. Tall Spec. Build. 2019, 28, e1554. [Google Scholar] [CrossRef]
  8. Hatzivassiliou, M.; Hatzigeorgiou, G.D. Seismic sequence effects on three-dimensional reinforced concrete buildings. Soil. Dyn. Earthq. Eng. 2015, 72, 77–88. [Google Scholar] [CrossRef]
  9. Hoveidae, N.; Radpour, S. Performance evaluation of buckling-restrained braced frames under repeated earthquakes. Bull. Earthq. Eng. 2021, 19, 241–262. [Google Scholar] [CrossRef]
  10. Kim, J.; Choi, H.; Chung, L. Energy-based seismic design of structures with buckling-restrained braces. Steel Compos. Struct. 2004, 4, 437–452. [Google Scholar] [CrossRef]
  11. Choi, H.; Kim, J. Energy-based seismic design of buckling-restrained braced frames using hysteretic energy spectrum. Eng. Struct. 2006, 28, 304–311. [Google Scholar] [CrossRef]
  12. Gholami, N.; Garivani, S.; Askariani, S.S. State-of-the-Art Review of Energy-Based Seismic Design Methods. Arch. Comput. Methods Eng. 2021, 29, 1965–1996. [Google Scholar] [CrossRef]
  13. Leelataviwat, S.; Saewon, W.; Goel, S.C. An Energy Based Method for Seismic Evaluation of Structures. In Proceedings of the 14th World Conference on Earthquake Engineering, Beijing, China, 12–17 October 2008. [Google Scholar]
  14. Park, B.Y.-J.; Ang, A.H.-S.; Asce, F. Mechanistic Seismic Damage Model for Reinforced Concrete. J. Struct. Eng. 1985, 111, 722–739. [Google Scholar] [CrossRef]
  15. Kappos, A.J. Seismic damage indices for RC buildings: Evaluation of concepts and procedures. Prog. Struct. Eng. Mater. 1997, 1, 78–87. [Google Scholar] [CrossRef]
  16. Cao, V.V.; Ronagh, H.R.; Ashraf, M.; Baji, H. A new damage index for reinforced concrete structures. Earthq. Struct. 2014, 6, 581–609. [Google Scholar] [CrossRef]
  17. Hait, P.; Sil, A.; Choudhury, S. Prediction of global damage index of reinforced concrete building using artificial neural network. Int. J. Comput. Methods Eng. Sci. Mech. 2021, 22, 386–399. [Google Scholar] [CrossRef]
  18. Kalateh-Ahani, M.; Amiri, S. A Park-Ang damage index-based framework for post-mainshock structural safety assessment. Structures 2021, 33, 820–829. [Google Scholar] [CrossRef]
  19. Zhao, P.P.; Wang, Z.Y.; Babaei, M.; Asemi, K. Applying Improved Performance-Based Instructions to Investigate Seismic Performance of a Code-Conforming Steel Trussed-Tube Building. Buildings 2025, 15, 34. [Google Scholar] [CrossRef]
  20. Merritt, S.; Uang, C.M.; Benzoni, G. Subassemblage Testing of Star Seismic Buckling-Restrained Braces; Report No. TR-2003/04; Department of Structural Engineering, University of California San Diego: La Jolla, CA, USA, 2003. [Google Scholar]
  21. Newell, J.; Uang, C.-M.; Benzoni, G. Subassemblage Testing of Corebrace Buckling-Restrained Braces (G Series); Report No. TR-06/01; Department of Structural Engineering, University of California San Diego: La Jolla, CA, USA, 2006. [Google Scholar]
  22. Etabs. Software for Building Analysis and Design, Version 20; Computers and Structures Inc.: Walnut Creek, CA, USA, 2020.
  23. TBSC-2018; Turkish Building Seismic Code. Disaster and Emergency Management: Ankara, Turkey, 2018.
  24. Chopra, A.K. Dynamics of Structures: Theory and Applications to Earthquake Engineering, 3rd ed.; Prentice Hall: Upper Saddle River, NJ, USA, 2007. [Google Scholar]
  25. Mander, J.B.; Priestley, M.J.N.; Park, R. Theoretical Stress-Strain Model for Confined Concrete. J. Struct. Eng. 1988, 114, 1804–1826. [Google Scholar] [CrossRef]
  26. PEER. Available online: https://peer.berkeley.edu/home (accessed on 6 January 2025).
  27. Arias, A. A measure of earthquake intensity. Seismic Design for Nuclear Power Plants. Mass. Inst. Technol. 1970, 60, 124–130. [Google Scholar]
  28. De Jesus Vega, E.; Montejo, L.A. Influence of ground motion duration on ductility demands of reinforced concrete structures. Int. J. Adv. Struct. Eng. 2019, 11, 503–517. [Google Scholar] [CrossRef]
  29. Pawirodikromo, W. The effects of earthquake significant duration D595 to the earthquake intensity measures and the inelastic response of SDOF reinforced concrete structure. MATEC Web Conf. 2019, 280, 1005. [Google Scholar] [CrossRef]
  30. Bertero, R.D.; Bertero, V.V. Performance-based seismic engineering: The need for a reliable conceptual comprehensive approach. Earthq. Eng. Struct. Dyn. 2002, 31, 627–652. [Google Scholar] [CrossRef]
  31. Park, Y.J.; Ang, A.H.; Wen, Y.K. Damage-Limiting Aseismic Design of Buildings. Earthq. Spectra 1987, 3, 1–26. [Google Scholar] [CrossRef]
  32. Ang, A.H.-S. Seismic damage assessment and basis for damage-limiting design. Probabilistic Eng. Mech. 1988, 3, 146–150. [Google Scholar] [CrossRef]
  33. ASCE 7-22; Minimum Design Loads and Associated Criteria for Buildings and Other Structures. ASCE: Reston, VA, USA, 2022.
Figure 1. BRB hysteresis curves, test vs. numerical model (units comply with the test values): (a) Specimen 1G; (b) Specimen 3G.
Buildings 15 03563 g001
Figure 2. Single-level and dual-level layouts of outrigger systems.
Buildings 15 03563 g002
Figure 3. Typical elevation views of buildings: (a) BRB core; (b) RC shear wall core.
Buildings 15 03563 g003
Figure 4. Original acceleration time history records for real seismic sequences: (a) Mammoth Lakes; (b) Chalfant Valley; (c) Coalinga; (d) Whittier Narrows; (e) Northwest China.
Buildings 15 03563 g004
Figure 5. Comparison of elastic spectral acceleration responses of seismic sequences: (a) original; (b) matched.
Buildings 15 03563 g005
Figure 6. Maximum inter-story drift ratio for 24-story models with BRB braced core at various outrigger locations from nonlinear time history analysis.
Buildings 15 03563 g006
Figure 7. Maximum inter-story drift ratio for 24-story models with RC shear wall core at various outrigger locations from nonlinear time history analysis.
Buildings 15 03563 g007
Figure 8. Maximum inter-story drift ratio for 48-story models with BRB braced core at various outrigger locations from nonlinear time history analysis.
Buildings 15 03563 g008
Figure 9. Maximum inter-story drift ratio for 48-story models with RC shear wall core at various outrigger locations from nonlinear time history analysis.
Buildings 15 03563 g009
Figure 10. Maximum inter-story drift ratio for 24-story models for various seismic sequences from nonlinear time history analysis: (a) BRB core; (b) RC wall core.
Buildings 15 03563 g010
Figure 11. Maximum inter-story drift ratio for 48-story models for various seismic sequences from nonlinear time history analysis: (a) BRB core; (b) RC wall core.
Buildings 15 03563 g011
Figure 12. Distributions of the average maximum inter-story drift ratio by height from nonlinear time history analysis.
Buildings 15 03563 g012
Figure 13. Distributions of the MIDR by various building types and seismic sequences from nonlinear time history analysis.
Buildings 15 03563 g013
Figure 14. Story damage index for 24-story models with BRB braced core at various outrigger locations from nonlinear time history analysis.
Buildings 15 03563 g014
Figure 15. Story damage index for 24-story models with RC wall core at various outrigger locations from nonlinear time history analysis.
Buildings 15 03563 g015
Figure 16. Story damage index for 48-story models with BRB braced core at various outrigger locations from nonlinear time history analysis.
Buildings 15 03563 g016
Figure 17. Story damage index for 48-story models with RC wall core at various outrigger locations from nonlinear time history analysis.
Buildings 15 03563 g017
Figure 18. Distributions of the global damage index by various building type and seismic sequences from nonlinear time history analysis.
Buildings 15 03563 g018
Figure 19. Story-level hysteretic energy shares for 24-story BRB-core archetypes—percent in BRB links and RC beams—averaged over SS-1–SS-5.
Buildings 15 03563 g019
Figure 20. Story-level hysteretic energy shares for 24-story RC-wall-core archetypes—percent in BRB links, RC beams, and RC walls—averaged over SS-1–SS-5.
Buildings 15 03563 g020
Figure 21. PI for 24-story models with (a) BRB core, (b) RC shear wall core at various outrigger locations.
Buildings 15 03563 g021
Figure 22. Improvement (%) in the PI relative to the no-outrigger baseline and averaged over SS-1–SS-5 for 24-story models with (a) BRB core, (b) RC shear wall core.
Buildings 15 03563 g022
Figure 23. Box–whisker plots of the PI for each outrigger configuration under SS-1–SS-5 for 24-story models with (a) BRB core, (b) RC shear wall core.
Buildings 15 03563 g023
Table 1. RC member dimensions.
Structure TypeStoriesColumn
Dimensions
(cm)
Wall
Thickness (cm)
Beam
Dimension (cm)
24-story1–8110 × 1105030 × 70
9–1690 × 90
17–2470 × 70
48-story1–3160 × 16070
4–6140 × 140
7–8120 × 120
Table 2. The fundamental period of sample models.
SINGLE OUTRIGGER LEVELDOUBLE OUTRIGGER LEVELS
Model TypeT (s)
No Outrigger0.33H0.66H1H0.33H, 0.66H0.33H, 1H0.66H, 1H
M24-BRB4.1754.0324.1214.1723.9784.0304.119
M48-BRB8.8618.5968.7718.8548.4988.5808.765
M24-SW3.1833.0723.1123.1343.0053.0253.067
M48-SW7.6537.2957.5447.5857.1967.2327.481
Table 3. BRB yielding section areas and input force.
Building TypeStory NumberKFR
Story Stiff.
(kN/m)
Sum of BRB Yielding
Section Area Asc (mm2)
Input Values
k = 1 T y
Yield Force
(kN)
T u
Ultimate Force
(kN)
24-story0–1203,7945188610881
2–878,2651992234338
9–1632,09881796139
17–2430,28577191131
48-story0–1512,64813,05015332215
2–16183,0294659547791
17–3239,3881003118170
33–4836,966941111160
Table 4. Seismic sequences.
Seismic
Sequence No.
Event NameStationRecord
Sequential Number
DatePGA
(g)
Magnitude D S   5 95
(s)
I a
(m/s)
SS-1Mammoth LakesConvict Creek2305/25/1980 (16:34)0.446.19.182.245
2405/25/1980 (20:35)0.485.73.670.647
SS-2Chalfant ValleyBrothers Ranch5477/20/1986 (14:29)0.275.88.480.525
5587/21/1986 (14:42)0.456.26.171.938
SS-3Coalinga46T04 CHP4067/22/1983 (02:39)0.525.88.510.543
4187/25/1983 (22:31)0.685.22.840.576
SS-4Whittier NarrowsSan Marino69110/1/1987 (14:42)0.196.011.440.130
71610/4/1987 (10:59)0.215.33.700.094
SS-5Northwest ChinaJiashi, China17485/4/1997 (23:46)0.276.114.380.491
175211/4/1997 (5:34)0.305.913.440.624
Table 5. Maximum inter-story drift ratio (MIDR) for each model and outrigger configuration across five seismic sequences (SS-1–SS-5) and the overall average.
Maximum Inter-Story Drift Ratio (MIDR)
StoriesCoreOutrigger
Location
SS-1SS-2SS-3SS-4SS-5Average
24BRBNo outrigger0.0070880.0082530.0051860.0127450.0072770.00811
0.33H0.0077140.0071070.0049250.012240.0072820.00785
0.66H0.0073960.0078780.0050920.0109110.0068470.00762
1H0.0072790.0082120.00510.0132010.0074160.00824
0.33H and 0.66H0.0074790.0068310.0047980.010320.0071580.00732
0.33H and 1H0.0074130.0070810.0048720.0120950.007070.00771
0.66H and 1H0.007190.0080910.0049740.0110650.0067630.00762
SWNo outrigger0.0058040.0053670.0059950.008110.0089360.00684
0.33H0.0105390.0099580.0086360.0079480.010640.00954
0.66H0.0060920.0057390.0058180.0072880.0139160.00777
1H0.0096440.0099740.0075390.0083720.0102150.00915
0.33H and 0.66H0.0059430.0054780.0058380.0058870.0081020.00625
0.33H and 1H0.0057530.0054630.0054390.0059320.0083230.00618
0.66H and 1H0.0058680.0053130.0052240.0059560.0083520.00614
48BRBNo outrigger0.0068670.0081280.0061870.0052520.0067720.00664
0.33H0.0067730.0081020.006340.006810.0063460.00687
0.66H0.006720.0083780.0063390.0065460.0068890.00697
1H0.0065860.0079010.0060530.0057450.0067870.00661
0.33H and 0.66H0.0067640.0078470.0061090.0071970.0059730.00678
0.33H and 1H0.0063810.0079890.0058530.006490.0061610.00657
0.66H and 1H0.0065260.0085740.0058810.0064940.006950.00689
SWNo outrigger0.0050210.0067110.0075240.0038630.0072960.00608
0.33H0.0050240.0061120.0077440.0043780.0064090.00593
0.66H0.0050470.0064510.0078140.0042980.0074130.0062
1H0.0051080.0063120.00710.0040190.007310.00597
0.33H and 0.66H0.0052250.0060780.0079920.0039710.0064440.00594
0.33H and 1H0.0052190.0059010.0072810.0039840.0070790.00589
0.66H and 1H0.0050760.0058770.0070840.0039340.0071360.00582
Table 6. Percentage reduction in peak MIDR relative to the no-outrigger baseline across SS-1–SS-5 and the overall average for each model and outrigger configuration.
Reduction (%)
StoriesCoreOutrigger
Location
SS-1SS-2SS-3SS-4SS-5Average
24BRBNo outrigger0.000.000.000.000.000.00
0.33H−8.8313.895.033.96−0.073.16
0.66H−4.354.541.8114.395.915.98
1H−2.690.501.66−3.58−1.91−1.63
0.33H and 0.66H−5.5217.237.4819.031.649.77
0.33H and 1H−4.5914.206.055.102.844.98
0.66H and 1H−1.441.964.0913.187.066.08
SWNo outrigger0.000.000.000.000.000.00
0.33H−81.58−85.54−44.052.00−19.07−39.49
0.66H−4.96−6.932.9510.14−55.73−13.57
1H−66.16−85.84−25.75−3.23−14.31−33.71
0.33H and 0.66H−2.39−2.072.6227.419.338.66
0.33H and 1H0.88−1.799.2726.866.869.65
0.66H and 1H−1.101.0112.8626.566.5410.23
48BRBNo outrigger0.000.000.000.000.000.00
0.33H1.370.32−2.47−29.666.29−3.51
0.66H2.14−3.08−2.46−24.64−1.73−5.02
1H4.092.792.17−9.39−0.220.40
0.33H and 0.66H1.503.461.26−37.0311.80−2.06
0.33H and 1H7.081.715.40−23.579.021.00
0.66H and 1H4.97−5.494.95−23.65−2.63−3.67
SWNo outrigger0.000.000.000.000.000.00
0.33H−0.068.93−2.92−13.3312.162.46
0.66H26.503.87−3.85−11.26−1.60−2.00
1H25.625.955.64−4.04−0.191.86
0.33H and 0.66H23.919.43−6.22−2.8011.682.32
0.33H and 1H24.0012.073.23−3.132.973.13
0.66H and 1H26.0812.435.85−1.842.194.30
Table 7. Classified damage levels [32].
Damage IndexDegree of DamagePhysical Appearance
<0.10SlightSporadic occurrence of cracking
0.10–0.25MinorMinor cracks; partial crushing of concrete in columns
0.25–0.40ModerateExtensive large cracks; spalling of concrete in weaker elements
0.40–1.00SevereExtensive crashing of concrete; disclosure of buckled reinforcement
>1.00CollapsePartial or total collapse of building
Table 8. Fundamental period versus ASCE 7 approximate period.
ArchetypeOutrigger
Config.
h [m]SystemCtxTa = Ct*h^x [s]T1 [s]T1/Ta
24F–BRBNo outrigger96Braced/Dual0.07310.752.2424.1751.86
0.33H96Braced/Dual0.07310.752.2424.0321.80
0.66H96Braced/Dual0.07310.752.2424.1211.84
1.0H96Braced/Dual0.07310.752.2424.1721.86
0.33H and 0.66H96Braced/Dual0.07310.752.2423.9781.77
0.33H and 1.0H96Braced/Dual0.07310.752.2424.031.80
0.66H and 1.0H96Braced/Dual0.07310.752.2424.1191.84
24F–SWNo outrigger96Shear wall0.04880.751.4973.1832.13
0.33H96Shear wall0.04880.751.4973.0722.05
0.66H96Shear wall0.04880.751.4973.1122.08
1.0H96Shear wall0.04880.751.4973.1342.09
0.33H and 0.66H96Shear wall0.04880.751.4973.0052.01
0.33H and 1.0H96Shear wall0.04880.751.4973.0252.02
0.66H and 1.0H96Shear wall0.04880.751.4973.0672.05
48F–BRBNo outrigger192Braced/Dual0.07310.753.7708.8612.35
0.33H192Braced/Dual0.07310.753.7708.5962.28
0.66H192Braced/Dual0.07310.753.7708.7712.33
1.0H192Braced/Dual0.07310.753.7708.8542.35
0.33H and 0.66H192Braced/Dual0.07310.753.7708.4982.25
0.33H and 1.0H192Braced/Dual0.07310.753.7708.582.28
0.66H and 1.0H192Braced/Dual0.07310.753.7708.7652.32
48F–SWNo outrigger192Shear wall0.04880.752.5177.6533.04
0.33H192Shear wall0.04880.752.5177.2952.90
0.66H192Shear wall0.04880.752.5177.5443.00
1.0H192Shear wall0.04880.752.5177.5853.01
0.33H and 0.66H192Shear wall0.04880.752.5177.1962.86
0.33H and 1.0H192Shear wall0.04880.752.5177.2322.87
0.66H and 1.0H192Shear wall0.04880.752.5177.4812.97
Disclaimer/Publisher’s Note: The statements, opinions and data contained in all publications are solely those of the individual author(s) and contributor(s) and not of MDPI and/or the editor(s). MDPI and/or the editor(s) disclaim responsibility for any injury to people or property resulting from any ideas, methods, instructions or products referred to in the content.