Article

Analysis on Durability of Bentonite Slurry–Steel Slag Foam Concrete Under Wet–Dry Cycles

1
Department of Civil Engineering, Anhui University of Technology, Ma’anshan 243002, China
2
Guangxi Transportation Science & Technology Group Co., Ltd., Nanning 530007, China
3
School of Civil Engineering, Guilin University of Technology, Guilin 541004, China
*
Authors to whom correspondence should be addressed.
Buildings 2025, 15(19), 3550; https://doi.org/10.3390/buildings15193550
Submission received: 29 August 2025 / Revised: 24 September 2025 / Accepted: 28 September 2025 / Published: 2 October 2025
(This article belongs to the Section Building Structures)

Abstract

Wet–dry cycles are a key factor aggravating the durability degradation of foam concrete. To address this issue, this study prepared bentonite slurry–steel slag foam concrete (with steel slag and cement as main raw materials, and bentonite slurry as admixture) using the physical foaming method. Based on 7-day unconfined compressive strength tests with different mix proportions, the optimal mix proportion was determined as follows: mass ratio of bentonite to water 1:15, steel slag content 10%, and mass fraction of bentonite slurry 5%. Based on this optimal mix proportion, dry–wet cycle tests were carried out in both water and salt solution environments to systematically analyze the improvement effect of steel slag and bentonite slurry on the durability of foam concrete. The results show the following: steel slag can act as fine aggregate to play a skeleton role; after fully mixing with cement paste, it wraps the outer wall of foam, which not only reduces foam breakage but also inhibits the formation of large pores inside the specimen; bentonite slurry can densify the interface transition zone, improve the toughness of foam concrete, and inhibit the initiation and propagation of matrix cracks during the dry–wet cycle process; the composite addition of the two can significantly enhance the water erosion resistance and salt solution erosion resistance of foam concrete. The dry–wet cycle in the salt solution environment causes more severe erosion damage to foam concrete. The main reason is that, after chloride ions invade the cement matrix, they erode hydration products and generate expansive substances, thereby aggravating the matrix damage. Scanning Electron Microscopy (SEM) analysis shows that, whether in water environment or salt solution environment, the fractal dimension of foam concrete decreased slightly with an increasing number of wet–dry cycle times. Based on fractal theory, this study established a compressive strength–porosity prediction model and a dense concrete compressive strength–dry–wet cycle times prediction model, and both models were validated against experimental data from other researchers. The research results can provide technical support for the development of durable foam concrete in harsh environments and the high-value utilization of steel slag solid waste, and are applicable to civil engineering lightweight porous material application scenarios requiring resistance to dry–wet cycle erosion, such as wall bodies and subgrade filling.

1. Introduction

Owing to its advantageous properties—low density, high strength, and excellent thermal insulation—foam concrete (FC) serves as a widely utilized lightweight and porous material for walls, subgrade filling, and underground engineering backfilling applications [1,2,3]. However, its high porosity and fragile cementitious matrix render FC susceptible to strength degradation, cracking, and spalling under complex environmental conditions such as wet–dry cycles and freeze–thaw actions, significantly limiting its long-term durability and engineering applicability [4,5,6]. Degradation is particularly severe in saline-affected zones, coastal regions, or areas with fluctuating groundwater levels, where repeated cycles of water and deleterious ion ingress, followed by evaporation, accelerate microstructural damage and performance deterioration [7].
Wet–dry cycling is recognized as a key factor accelerating the durability degradation of FC. During this process, water penetration dissolves and mobilizes soluble components within the matrix, while the drying phase induces shrinkage stresses. These cyclic stresses promote the initiation and propagation of microcracks, which subsequently interconnect to form macrocracks and preferential pathways for fluid ingress. This increases the material’s water absorption, significantly reduces its strength, and ultimately leads to structural failure [8,9]. Liu et al. [10] observed that wet–dry cycles exacerbate the sulfate attack on FC, with increasing cycle numbers correlating with more surface cracks. Mahzabin et al. [11] stated that the compressive stress (CS) of treated kenaf fiber-reinforced FC (density: 1250 kg/m3) dropped from 6.003 MPa to 3.723 MPa following 30 wet–dry cycles. Tang et al. [12] noted significant surface cracking and even spalling in FC subjected to wet–dry cycles in acidic, alkaline, and saline solutions.
To enhance the durability of FC, researchers have explored various modification strategies [13,14,15,16]. Wu et al. [17] demonstrated that incorporating 0.6% polypropylene fiber improved the CS, initial failure stress, and maximum energy absorption efficiency of FC after 30 wet–dry cycles. The fibers partially mitigated the degradation, counteracting the potential reduction in base matrix integrity. Mydin et al. [18] found that adding 3% nano-silica significantly enhanced the compressive and splitting tensile strengths of FC. Furthermore, nano-silica incorporation markedly reduced the porosity, water absorption, intrinsic air permeability, and chloride diffusivity. The same researchers [19] also identified FC containing 0.25 wt% magnetite nanoparticles as exhibiting optimal performance in compressive, flexural, and splitting tensile strengths. Alani et al. [20] found that adding nano-calcined montmorillonite clay to cement mortar can improve the quality loss behavior of the mortar, reduce the generation of cracks, and enhance the matrix structure. However, these modification methods often incur high costs. In contrast, utilizing industrial solid wastes, such as fly ash and slag, as supplementary cementitious materials offers a dual benefit: reducing carbon emissions and enhancing durability [21,22,23].
Steel slag (SS), a key by-product from the steel manufacturing sector, has attracted interest due to its potential cementitious activity and micro-aggregate effect. Cai et al. [24] reported that incorporating SS at an optimal replacement ratio enhanced concrete frost resistance by 15–20% while achieving a 30% reduction in permeability. Devi et al. [25] observed a very low mass loss in acid immersion tests for concrete cubes where SS partially was replaced by fine and coarse aggregates. Andrade et al. [26] found that SS concrete exhibited a higher CS and an up to 60% reduced carbonation depth compared to conventional concrete. The dicalcium silicate (C2S) and ferrite phases abundant in SS can undergo secondary hydration reactions in alkaline environments, generating additional C-S-H gel that contributes to later-age strength development. Simultaneously, the “filling effect” of fine SS particles helps to refine the pore structure and reduces chloride ion penetration rates [27,28,29]. However, the presence of free lime (f-CaO) and periclase (f-MgO) in SS poses a risk of volume instability [30,31]. Under wet–dry cycling conditions, the potential for delayed expansion may accelerate material degradation. Mitigating these negative effects through pre-treatment or composite blending remains a significant research challenge.
Bentonite, valued for its unique layered montmorillonite structure and cation exchange capacity, has recently been introduced into concrete modification [32,33,34]. Memon et al. [35] demonstrated that concrete containing bentonite outperformed control mixtures in resisting acid attack, confirming the feasibility of partially substituting cement with bentonite. Masood et al. [36] further determined that a 15% bentonite addition yielded favorable compressive and tensile strengths while enhancing the resistance to chloride ion penetration. Li et al. [37] found that bentonite increased the plastic viscosity of ultra-high-performance concrete paste by 116% and the thixotropic index by 40% through steric hindrance effects exerted by its exfoliated nanosheets, effectively improving the material uniformity during forming. Xie et al. [38] also reported that bentonite slurry (BS) improved paste fluidity and reduced the thermal conductivity of FC.
Furthermore, the nano-layers released by bentonite upon water contact can combine with hydration products, forming a denser interfacial transition zone that inhibits crack propagation [39]. Consequently, the combined modification of concrete with bentonite and SS is expected to mitigate the particle agglomeration associated with SS incorporation and effectively suppress the cracking induced by the expansive reaction of f-CaO.
While existing research has primarily focused on the individual effects of SS or bentonite on FC properties, the synergistic mechanism by which bentonite and SS jointly enhance its durability under wet–dry cycling remains unexplored. This study aims to improve the environmental durability of FC by incorporating a composite of bentonite and SS powder. We systematically investigate the evolution of CS retention and pore structure bentonite slurry–steel slag foam concrete (BS-SSFC) of under wet–dry cycling conditions. Mercury Intrusion Porosimetry (MIP), X-ray Diffraction (XRD), and scanning electron microscopy (SEM) are employed to characterize the microstructural changes and elucidate the synergistic action between bentonite and SS under these conditions. A predictive model for CS under wet–dry cycling is established. This research provides a theoretical foundation for developing durable foam concrete suited for harsh environments and promotes the high-value utilization of SS waste, contributing to the advancement of low-carbon, functional civil engineering materials.

2. Experimental Materials and Methodology

2.1. Test Raw Materials

The test materials include the following: Anhui Conch P·O 42.5 Portland cement (Anhui Conch Cement Co., Ltd., Wuhu, China), SS from Ma’anshan Iron & Steel Group Co., Ltd. (Ma’anshan, China), deionized water, sodium bentonite (industrial grade, Sichuan Renshou Xingda Industry and Trade Co., Ltd., Meishan, China), and a synthetic foaming agent produced by a Shanghai White Cat Co., Ltd. (Shanghai, China).
The cement utilized in this study is Anhui Conch P·O 42.5 Portland cement, featuring an apparent density of 3100 kg/m3 and a specific surface area of 357 m2/kg. Its chemical composition and physical properties are presented in Table 1 and Table 2, correspondingly.
Figure 1 presents the SS utilized in this experiment. Table 1 also provides the chemical composition of the SS. It can be seen that the chemical composition of SS is very similar to that of Portland cement, which is why SS is usually called overburned Portland cement. However, its hydration reaction is relatively slow, and there are compositional differences, meaning that it cannot fully replace cement as a cementitious material. The SS used in this work is from the Ma’anshan Iron and Steel Group in Anhui Province, with an aging time of over 2 years. The SS was sieved through a 1.18 mm sieve, and its apparent density was measured as 3400 kg/m3. According to the Chinese standard YB/T 4328-2012 [42], the content of f-CaO was measured to be 2.7% by sucralose-EDTA complexometric titration, which met the standard requirements. In addition, according to the Chinese standard GB/T 24763-2009 [43], boiling and autoclave tests were conducted on the steel slag cement slurry, and its expansion rate was less than 7.8%, which was lower than the specified value in GB/T 24763-2009. Tests revealed that the steel slag had a long aging time and demonstrated excellent stability. Therefore, in this paper, the steel slag is used as the cementitious material to partially replace cement in order to reduce the amount of cement used.
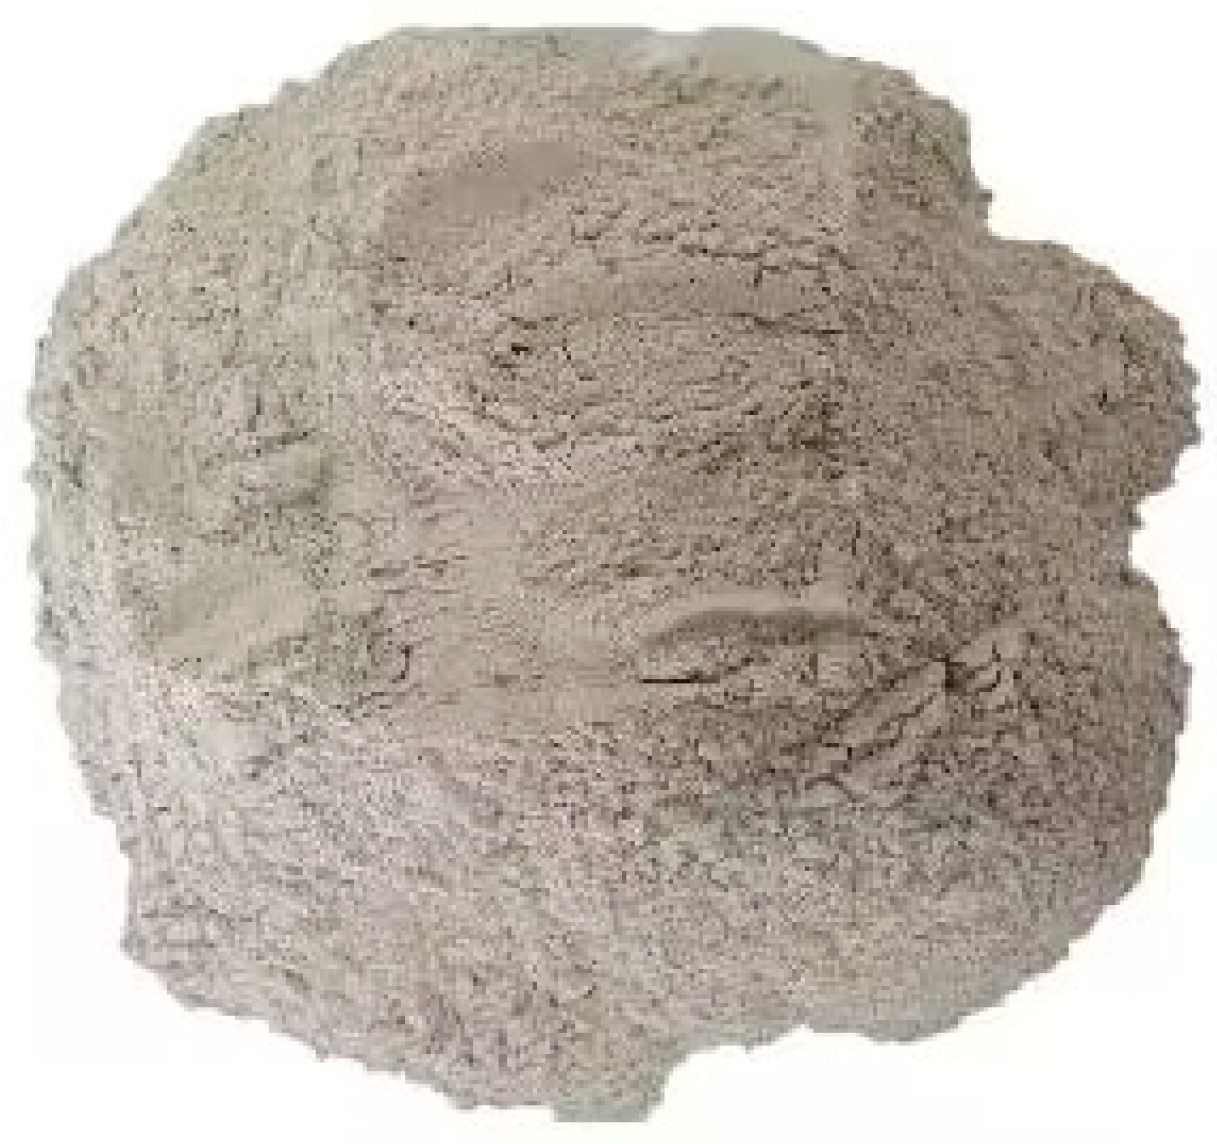
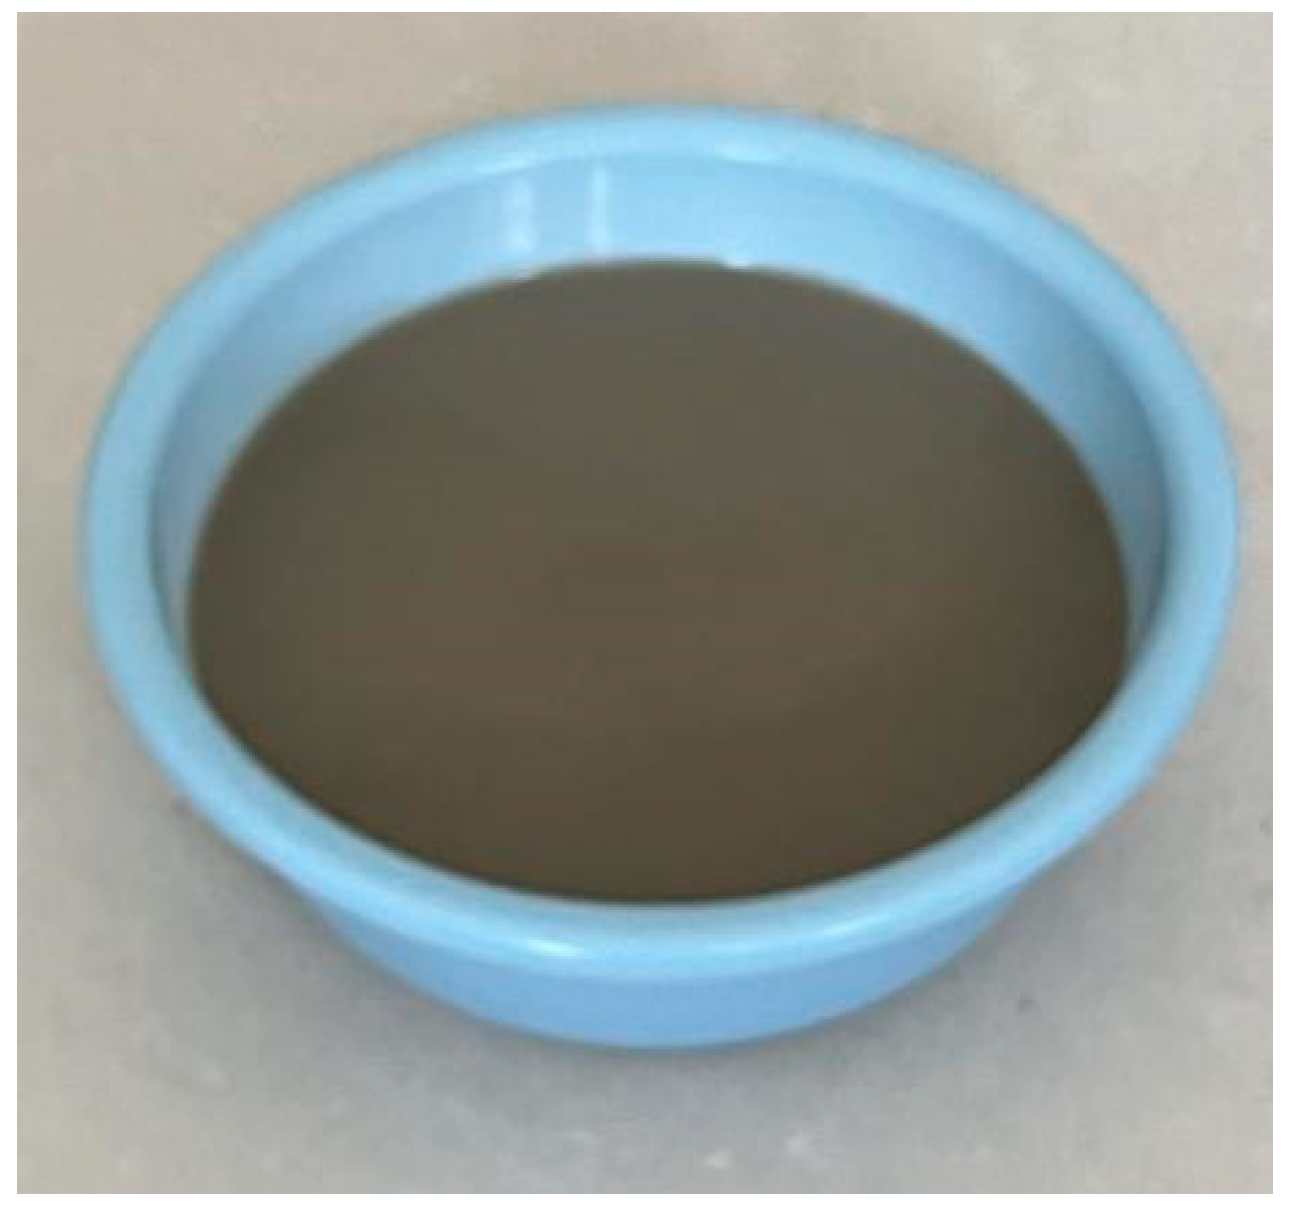
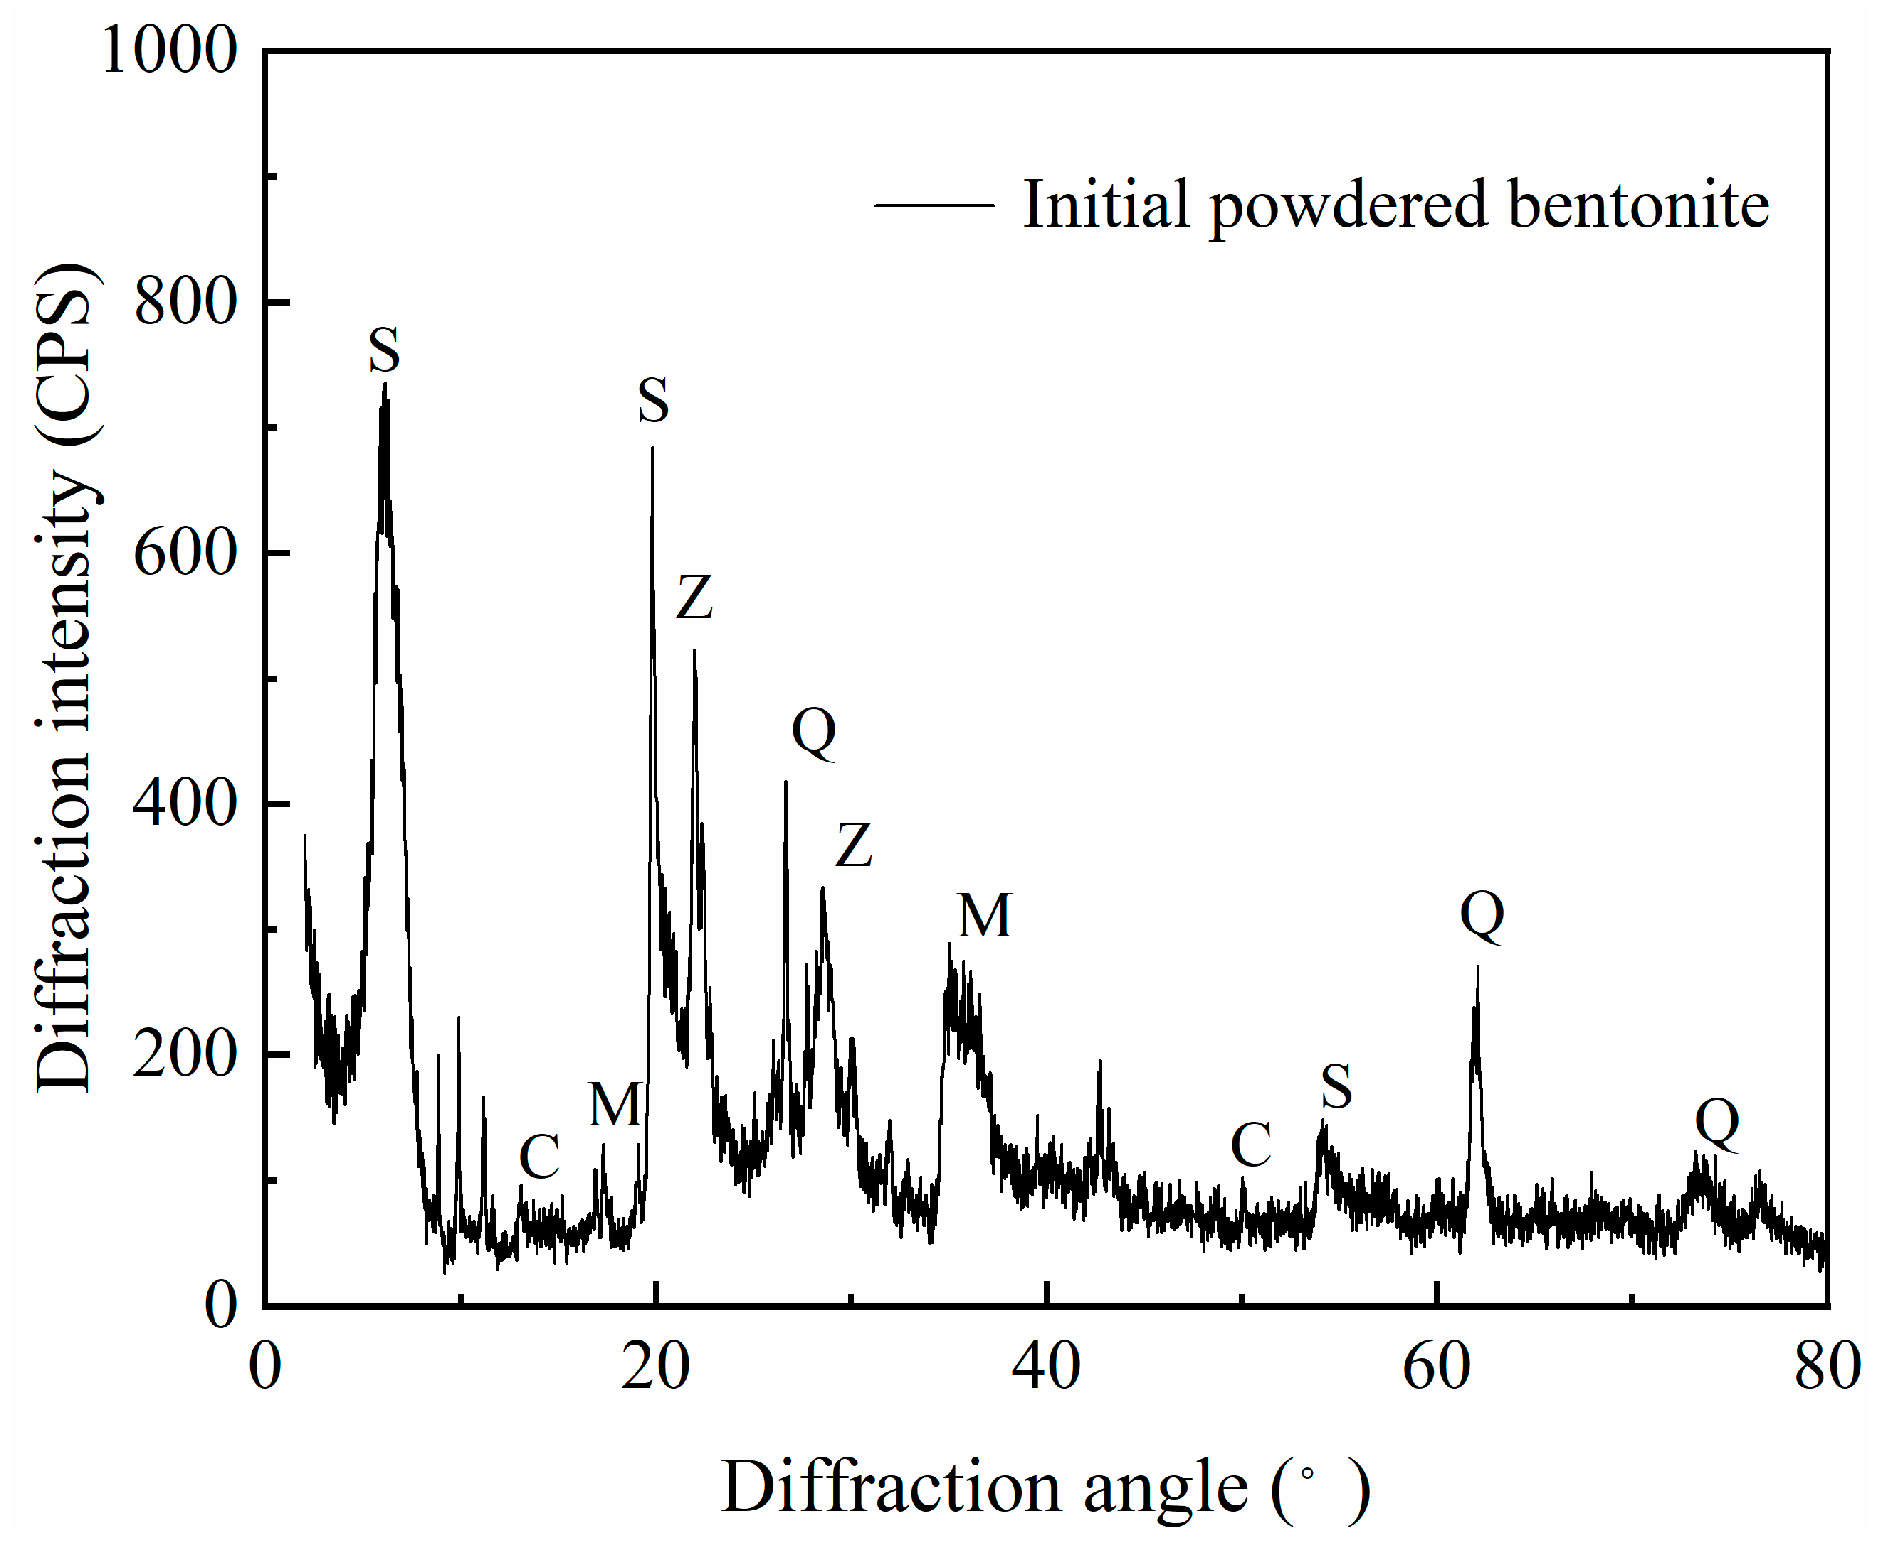
The bentonite utilized in this study was sodium-based bentonite in the form of a loose, grayish-white powder, as shown in Figure 2 and Figure 3. Upon water absorption, it expands into a gelatinous state. The swelling properties of bentonite depend on its mineral composition and content. X-ray diffraction (XRD) tests were conducted to identify its mineral components, and the findings are shown in Figure 4.
The dominant mineral in the bentonite is montmorillonite (>70%), a 2:1 phyllosilicate with a T-O-T structure consisting of two tetrahedral silica sheets sandwiching an octahedral alumina sheet. Its chemical formula is (Al1.67Mg0.33)Si4O10(OH)2·nH2O. Additionally, the bentonite contains accessory minerals including quartz, calcite, illite, zeolite, kaolinite, and feldspar.
An industrial-grade foaming agent (manufactured by a Tianjin-based company) was used in this study. The agent appeared as a transparent liquid with a pH of 8.3. Its primary chemical constituent was sodium dodecyl sulfate, exhibiting a foam expansion ratio of 40:1. All performance metrics complied with standard specifications.
The test water met the technical requirements specified in the Chinese standard JGJ 63-2006 [44] “Standard for Water of Concrete”.

2.2. Preparation of BS-SSFC and Determination of the Optimal Mix Proportion

The replacement amounts of SS for cement are designed as 0%, 10%, 20%, and 30%, corresponding to the mass ratios of SS to cement of 0:100, 10:90, 20:80, and 30:70, respectively. For the BS, the mass ratios of bentonite to water are set as 1:10, 1:15, and 1:20, and its mass fractions (percentage of the total mass of cement and SS) are 1%, 3%, 5%, 7%, 10%, 15%, and 20%. The water consumption in the test is controlled by a water–binder ratio of 0.45, meaning that the ratio of water to the total mass of cement and SS is 0.45, excluding the mass of water in the BS. The tests were performed in triplicate, and the data reported are the average of the three measurements.
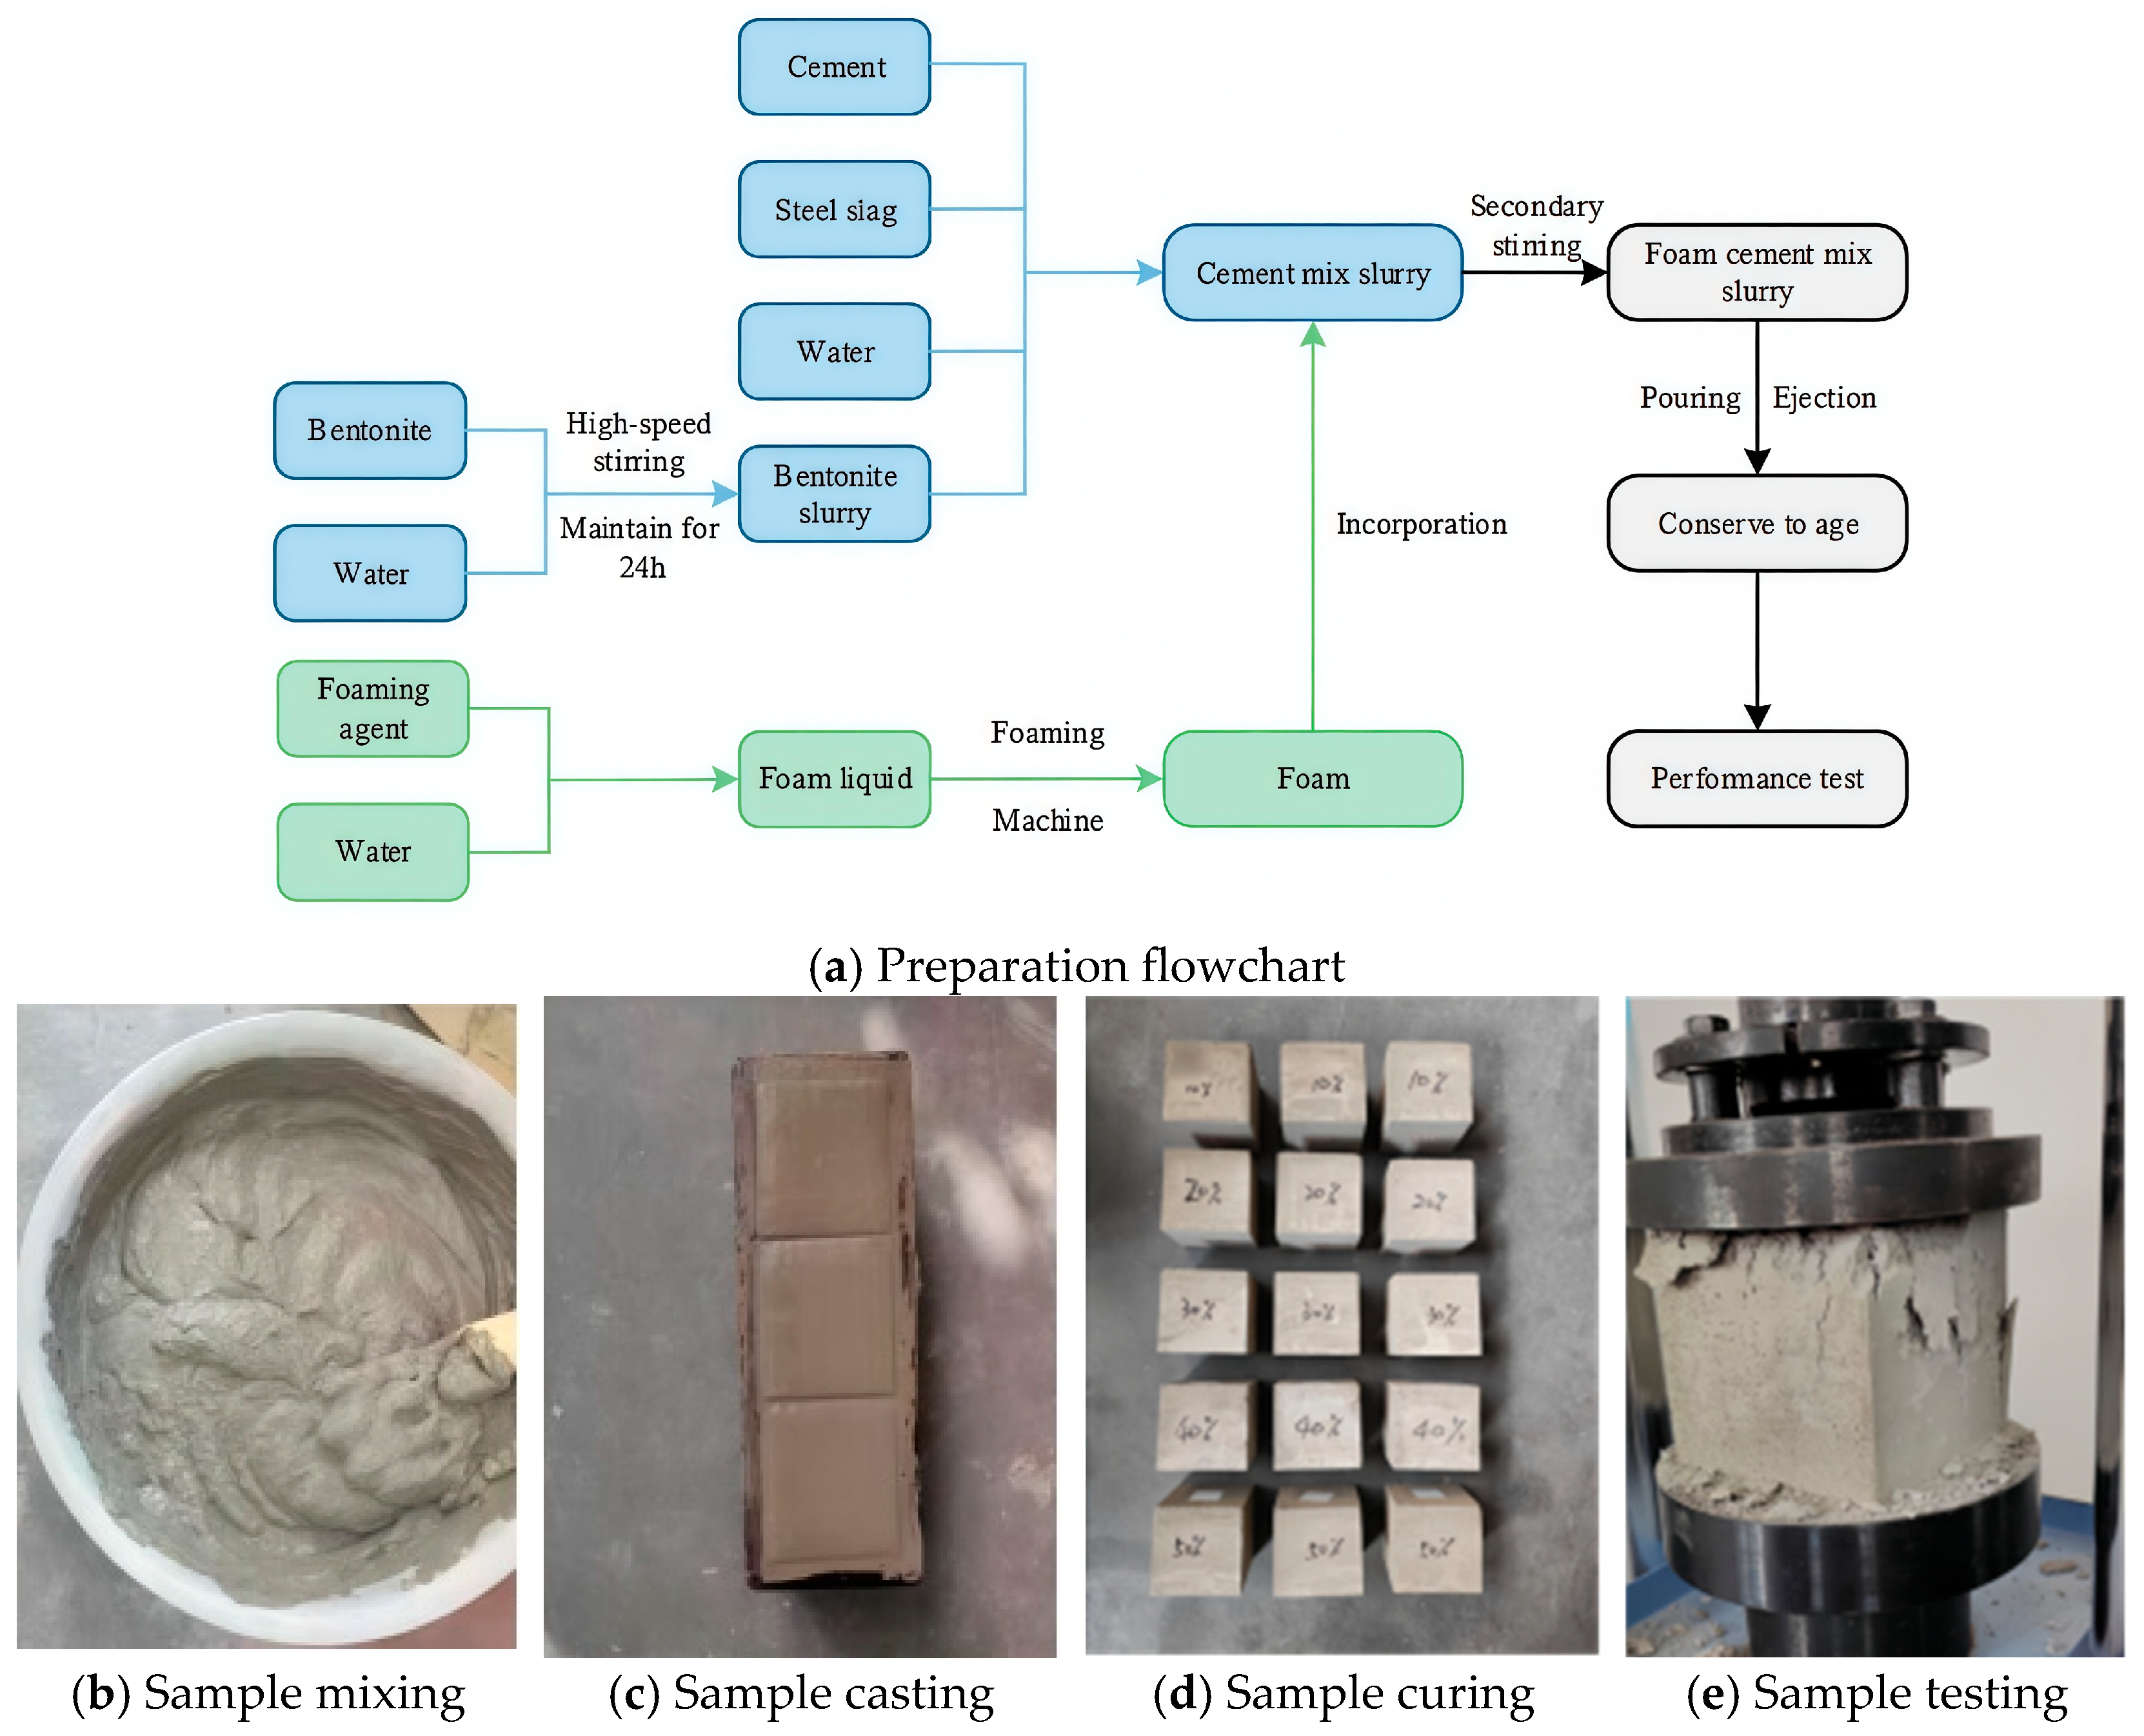
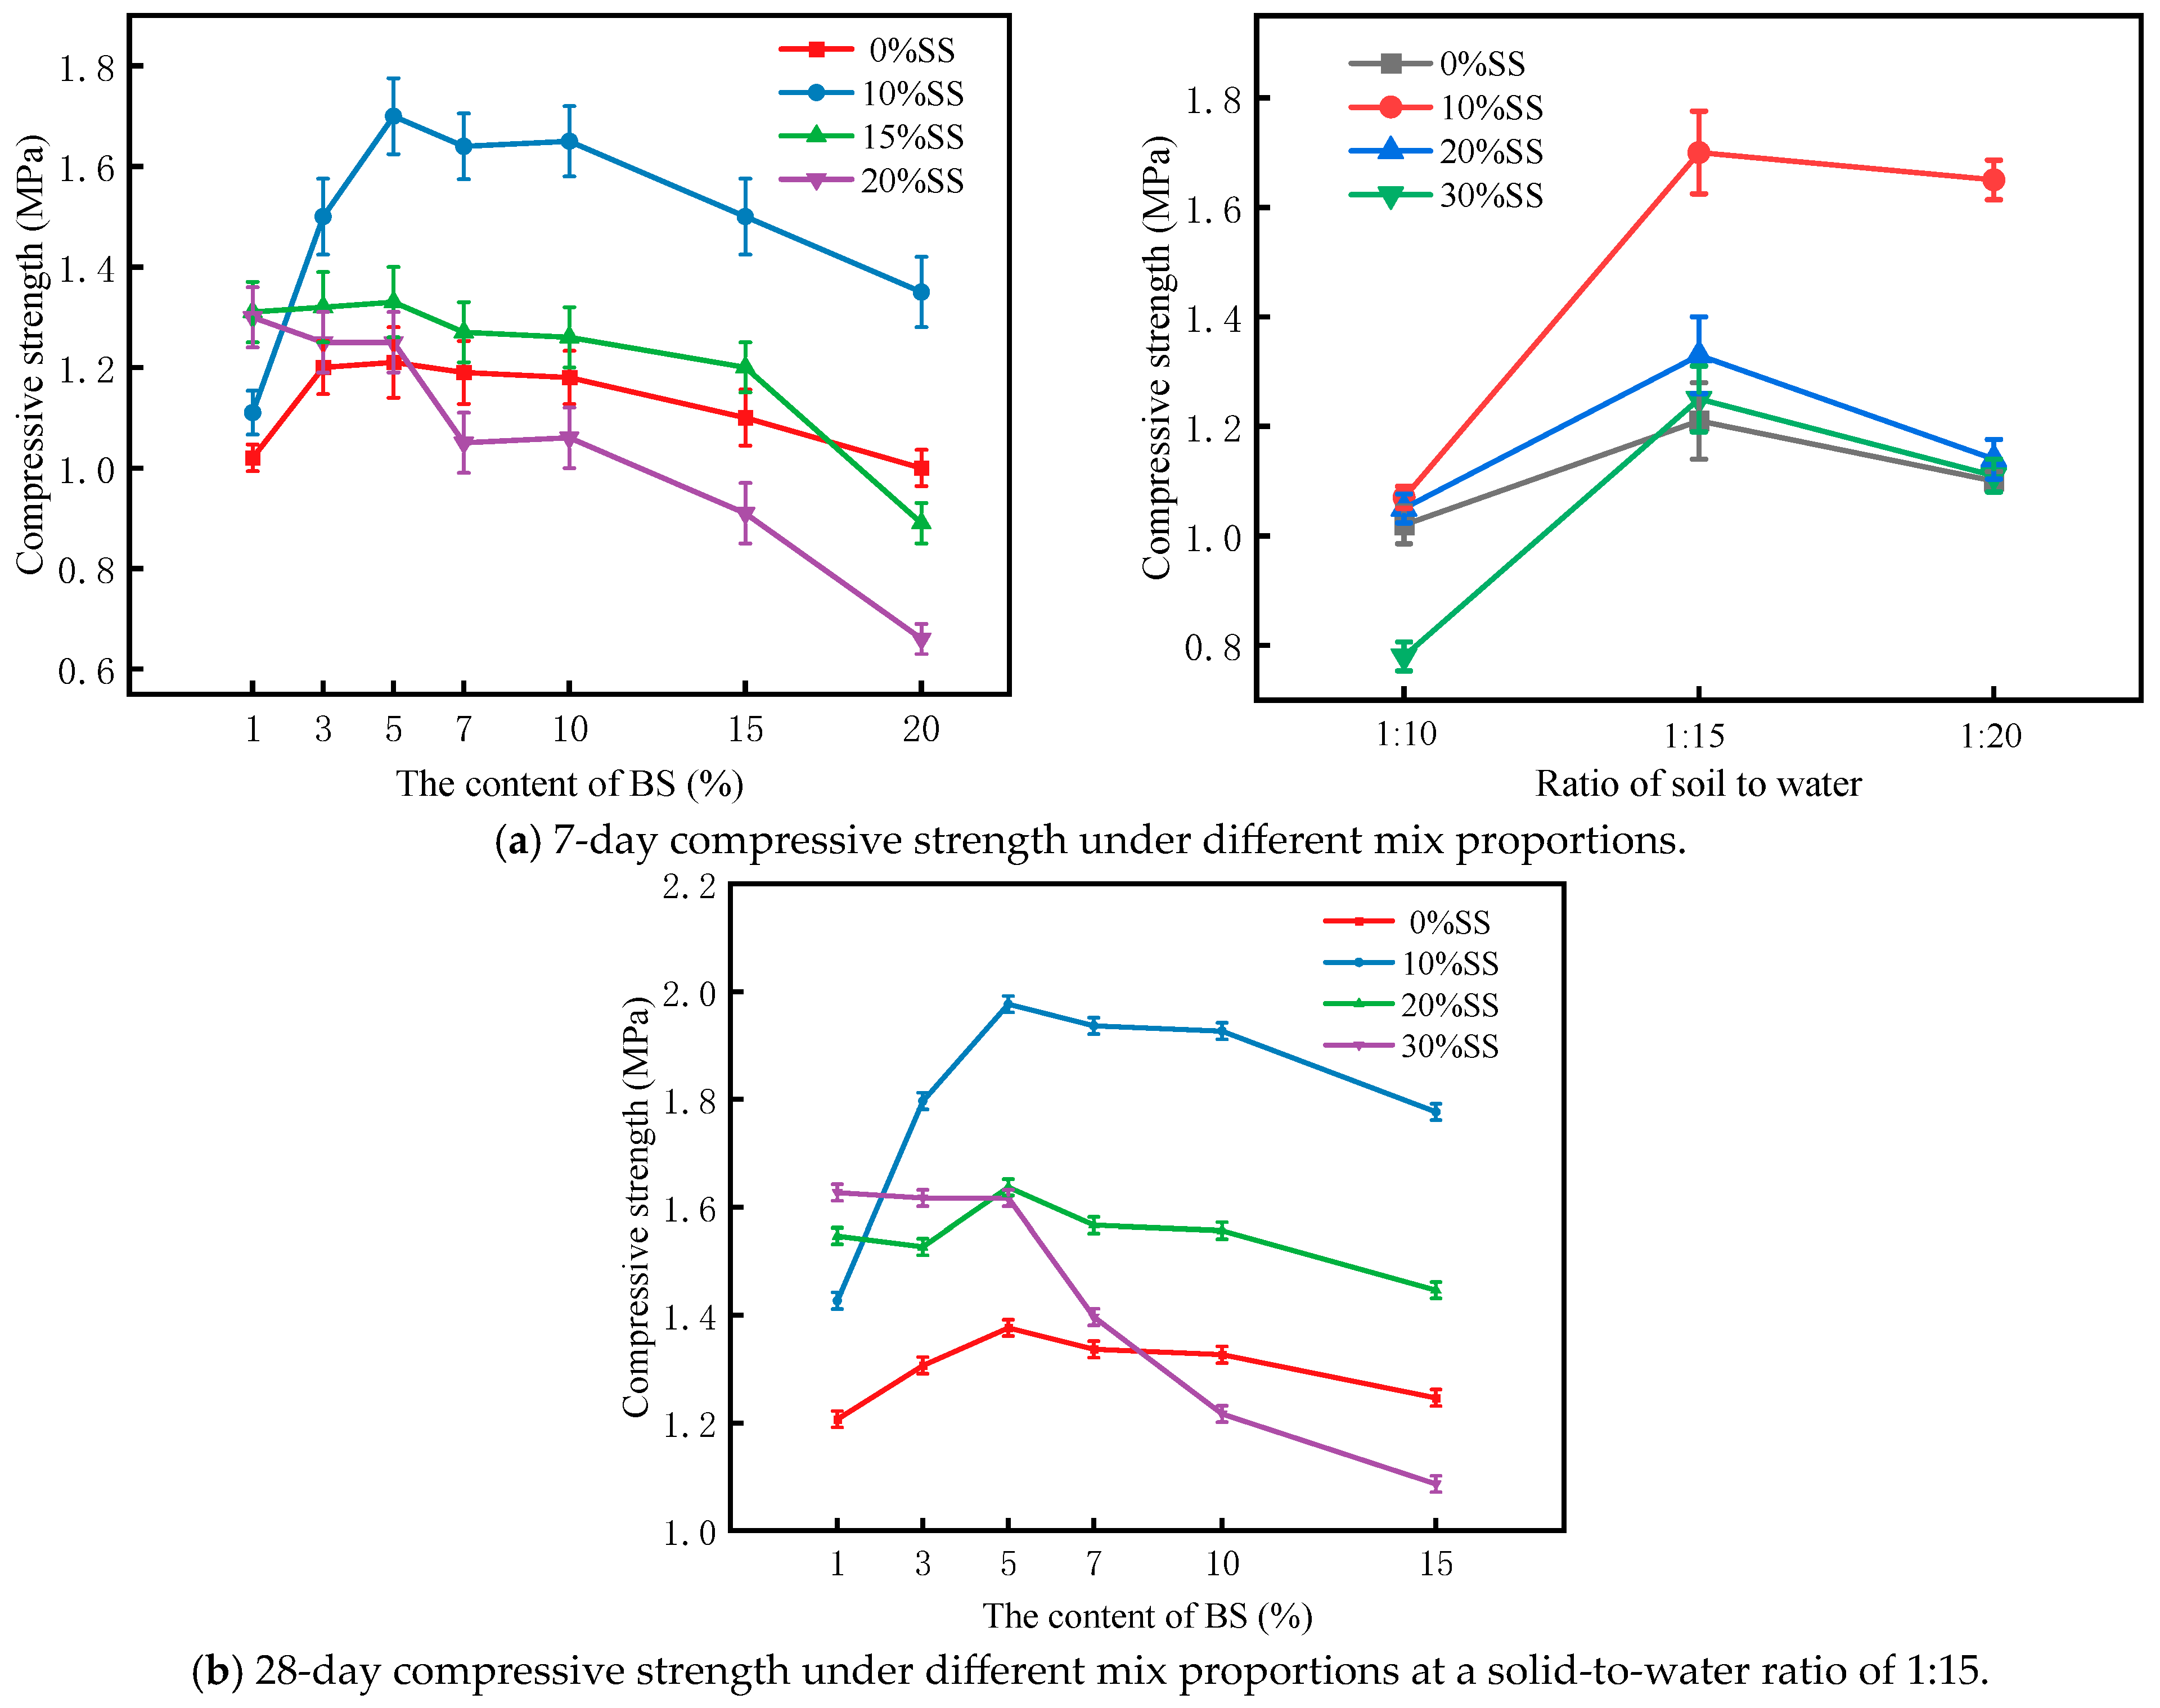
The optimal mix proportion of BS-SSFC is determined based on the 7-day unconfined SS of foam concrete. The preparation process is shown in Figure 5. Firstly, bentonite is dried to constant weight and sieved through a 200-mesh sieve. Then, bentonite and water are blended in line with a specific bentonite-to-water mass proportion, stirred in a high-speed mixer for 1 h, and allowed to stand for 24 h to make BS. This slurry is then set aside for mixing with steel slag foam concrete (SSFC). Cement, SS, and water are weighed according to the calculated required amounts, stirred uniformly, and, then, BS is added and mixed thoroughly. The foaming agent and water are mixed at a mass ratio of 1:30, and stable foam is prepared using a foaming machine. The foam is added to the slurry in batches with repeated stirring to produce a homogeneous foam-mixed slurry, which is then poured into molds. Demolding takes place after 24 h, and the specimens are maintained under standard curing conditions for 7 days.
The unconfined SS test was performed following the specification JG/T 266-2011 [45] to identify the optimal mix ratio. Prior to the SS test, the standard specimens (100 mm × 100 mm × 100 mm) were put in an oven at 60 °C until they reached a constant weight. The CS test of FC was conducted using a universal testing machine. Loading was displacement-controlled with a rate of 1.0 mm/min, and the axial load and axial displacement during the loading process were automatically recorded by a computer. Figure 6 presents the 7-day unconfined SS of concrete with different mix proportions.
As can be seen from Figure 6, the incorporation of SS and BS can effectively improve the strength of FC. On the one hand, the combined addition of the two can enhance the strength of foam walls, and reduce foam breakage, thereby effectively preventing the fusion between foams, avoiding the formation of large pores inside the structure, and making the matrix denser. On the other hand, SS, functioning as a cementitious substance, is capable of taking part in the hydration reaction to boost the quantity of hydration products. In contrast, BS primarily facilitates the hydration reaction through the introduction of free water, and, meanwhile, can effectively fill in gaps and lessen the formation of cracks. According to the results of the CS test, when the SS content is 10%, the mass fraction of BS is 5% and the bentonite-to-water ratio is 1:15, the SS of FC is improved most significantly. Therefore, the optimal mix proportion of BS-SSFC is determined as follows: the bentonite-to-water ratio of BS is 1:15, the SS content is 10%, and the mass fraction of BS is 5%.

2.3. Wet–Dry Cycle Experiments

To examine how BS and SS enhances the durability of FC, three control groups were established according to the optimal mix ratio: pure FC (without SS and BS) with a dry density of 700 kg/m3 (plain foamed concrete without steel slag and bentonite), 10% steel slag foam concrete (SSFC), and 5% bentonite slurry foam concrete (BSFC). Meanwhile, BB-SSFC under four different dry densities were prepared by using the optimal mix ratio for dry–wet cycling experiments in different solutions. Deionized water and 3.5% sodium chloride solution were selected as the solutions to analyze their resistance to water and salt erosion. The wet–dry cycle regimen used in this study was adapted from the “Durability Acceleration Test Method” outlined in the Chinese technical code Foamed Concrete Application Technical Specification (JG/T 266-2011 [45]), with modifications to better simulate the actual coastal environment characterized by approximately one daily cycle and prolonged seawater immersion. The specific protocol was as follows: (1) 48 h immersion: To ensure full saturation (pre-tests indicated 90% water absorption after 24 h and 100% after 48 h), simulating long-term immersion during high tide; (2) 7 h oven drying at 60 ± 5 °C: This temperature approximates the maximum daytime temperatures in coastal summer areas while avoiding the decomposition of hydration products that can occur above 80 °C; and (3) 30 min air cooling: Simulating the natural drying process after the tide recedes. The experimental process is as follows:
Specimens were prepared according to the above preparation procedure and cured in a sealed condition until 26 days of age. Then, specimens were grouped, with 6 pieces per group, and numbered. Subsequently, the specimens were immersed in the solution for 48 h before initiating the wet–dry cycle test. The specific steps are as follows: Place the specimens in the specimen box, with a spacing of 20 mm between adjacent specimens and a distance of not less than 20 mm between specimens and the sidewall of the box, ensuring that the solution level is at least 30 mm above the top of the specimens. After maintaining for 5 min, take out the specimens, air-dry them indoors for 30 min, and then place them in an oven to dry at (60 ± 5) °C for 7 h, and cool them indoors for 20 min. This constitutes one wet–dry cycle. These processes were repeated as needed to evaluate the effect of cycle number on the durability of BS-SSFC.

2.4. Scanning Electron Microscopy (SEM)

For SEM analysis, the foamed concrete samples cured for 7 days were first dried in a vacuum oven at 40 °C. The dried samples were then fractured to obtain small pieces of appropriate size. Subsequently, the fragments were sputter-coated with a thin layer of gold to ensure conductivity. Microscopic observation was performed using a JEOL JSM-6490LV scanning electron microscope (JEOL, Ltd., Tokyo, Japan). All SEM images were acquired under standardized conditions: an accelerating voltage of 20 kV and a magnification of 27×. For each specimen, at least three representative areas were randomly selected for imaging to ensure a comprehensive analysis of the microstructure.

2.5. Mercury Intrusion Porosimetry (MIP)

The MIP specimens were cored from the center of the BS-SSFC cubes and cut into cylinders measuring Φ5 mm × 10 mm. For each mix proportion, three replicate specimens were prepared. Prior to testing, the samples were vacuum-dried at 60 °C for 24 h. The pore structure was characterized using an AutoPore IV 9500 porosimeter (Micromeritics Instrument Corporation, Norcross, GA, USA) over a pressure range from 0.001 to 400 MPa. The final pore size distribution data for each group represent the average of the three measurements.

2.6. X-Ray Diffraction (XRD)

At the designated curing ages, the specimens were carefully broken, and samples were collected from the internal core region to avoid any effects from surface carbonation or contamination. The collected samples were ground into a fine powder and passed through a 200-mesh standard sieve to achieve particle size homogeneity. Phase identification was conducted using a Rigaku SmartLab X-ray diffractometer (Rigaku Corporation, Tokyo, Japan).

3. Experimental Results

3.1. Wet–Dry Cycle Tests in Different Solutions

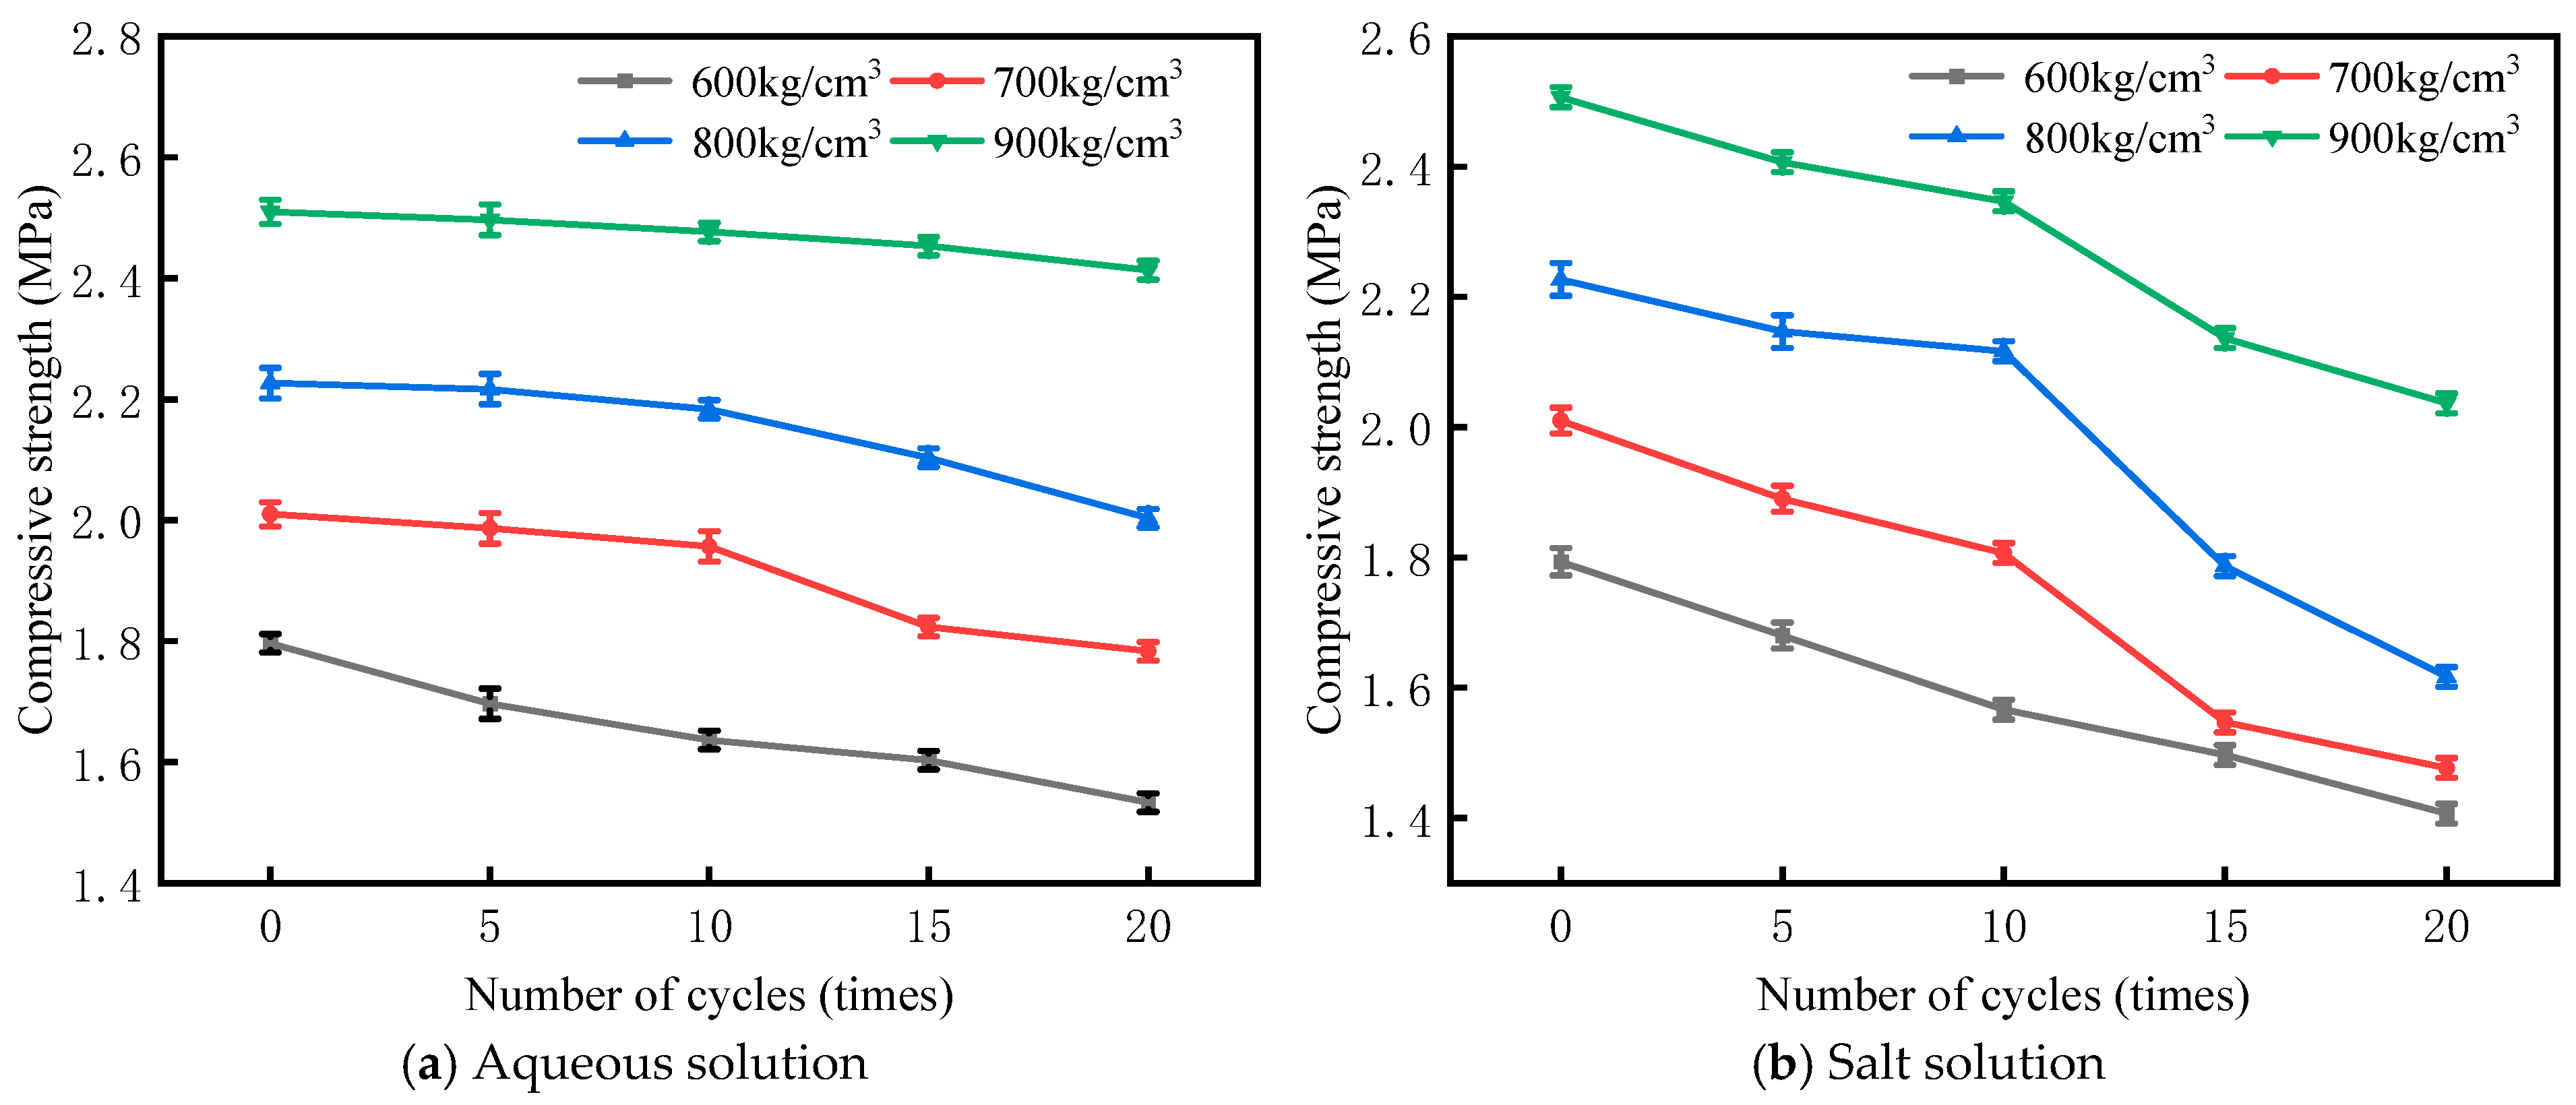
For BS-SSFC with different dry densities under the optimal mix proportion, the CS after 0, 5, 10, 15, and 20 wet–dry cycles were tested. The change pattern of CS following wet–dry cycles is presented in Figure 7, with a control group established for comparative analysis.
Figure 7 shows the evolution law of CS of BS-SSFC with the optimal mix proportion under wet–dry cycles in water and salt solutions. The study shows that, as the number of cycles rises, the CS loss rate of BS-SSFC exhibits a marked upward trend, and distinct differences exist in the strength loss rates under varying dry density conditions. When the dry density ranges from 600 to 900 kg/m3, the CS loss rates in the aqueous solution are 15% (±2%), 11.4% (±1%), 10.31% (±1%), and 3.98% (±2%) in sequence, while those in the salt solution are 21.67% (±2%), 27.41% (±2%), 27.35% (±2%), and 18.73% (±2%), respectively. This reveals that, as the dry density increases, the durability of BS-SSFC in the wet–dry cycle environment is significantly enhanced, among which the specimen with a dry density of 900 kg/m3 exhibits the optimal resistance to wet–dry cycles.
In terms of the mechanism, on one hand, the internal pore structure of BS-SSFC will generate a stress concentration effect under the action of water absorption–dehydration cycles, leading to the initiation of microcracks in the matrix around the pores. This promotes the gradual deterioration of originally closed pores into connected ones, and even the formation of through cracks with the increase in cycle times, thereby significantly deteriorating the material durability. On the other hand, the difference in porosity among BS-SSFC specimens with different dry densities results in varying water diffusion rates: specimens with a higher dry density have an increased matrix compactness and reduced porosity, leading to a significant slowdown in the water diffusion rate. As a result, the damage caused by wet–dry cycles is mainly limited to the surface layer of the specimens, and the damage process of the internal cement matrix is significantly delayed, which is manifested as a gradual decrease in the increment of the CS loss rate with the increase in dry density.
Figure 8 shows the evolution law of CS with cycle times for BS-SSFC (the optimal mix proportion) and control group FC in water and salt solution wet–dry cycle environments at a dry density of 700 kg/m3. Under aqueous solution cycling conditions, after 20 cycles, the CS loss rate of the FC (without BS and SS) is 18.12%; when 5% BS or 10% SS is added alone, the loss rates are 15.12% and 14.41%, respectively, while the CS loss rate of the binary-blended specimen is only 11.4%, which is 37.1% lower than that of the FC (without BS and SS). Similarly, in the NaCl solution cycling environment, the CS loss rate of FC (without BS and SS) after 20 cycles is 31.52%; when 5% BS or 10% SS is added alone, the loss rates decrease to 29.41% and 30.43%, respectively, with a reduction of 6.7% and 3.5%; the binary-blended specimen has the lowest strength loss rate (26.37%), which is 8.4% lower than that of the FC (without BS and SS). Statistical analysis using one-way ANOVA revealed that the strength loss rate of the group incorporating 10% steel slag (SSFC) or 5% bentonite slurry (BSFC) was significantly different from that of the baseline group (FC) (p < 0.05). Furthermore, the binary blend group (BS-SSFC) showed statistically significant differences compared to all other groups (p < 0.01).
A comparative analysis shows that, whether in a water or salt solution environment, the incorporation of SS or BS can reduce the CS loss rate to varying degrees, and the binary blending achieves the optimal improvement effect on durability. This is primarily due to the synergistic effect of hydration products generated from SS, which fill the pores, and the sealing effect of nanoscale montmorillonite lamellae in bentonite, which collectively improve the pore structure of the matrix. This inhibits solution penetration and the expansive damage caused by erosion products, thus validating the excellent durability performance of the BS-SSFC mix proportion under wet–dry cycling conditions. It is also found that salt solution erosion is significantly more severe than aqueous solution erosion. This is because Cl in the salt solution infiltrates the internal pores and microcracks of FC via capillary action, diffusion, and permeation. Cl interacts with hydration products, leading to the dissolution of cementitious products and the formation of expansive substances. As the reaction continues, the generated expansive products increase, and the accumulated expansion stress gradually builds up. When this stress goes beyond the tensile strength threshold of the FC matrix or pore walls, new microcracks are initiated or existing ones propagate. These newly formed defects provide channels for more corrosive media to invade, forming a vicious cycle.

3.2. Mechanism of SS and BS for Enhancing the Durability of FC

3.2.1. Pore Structure Analysis (MIP)

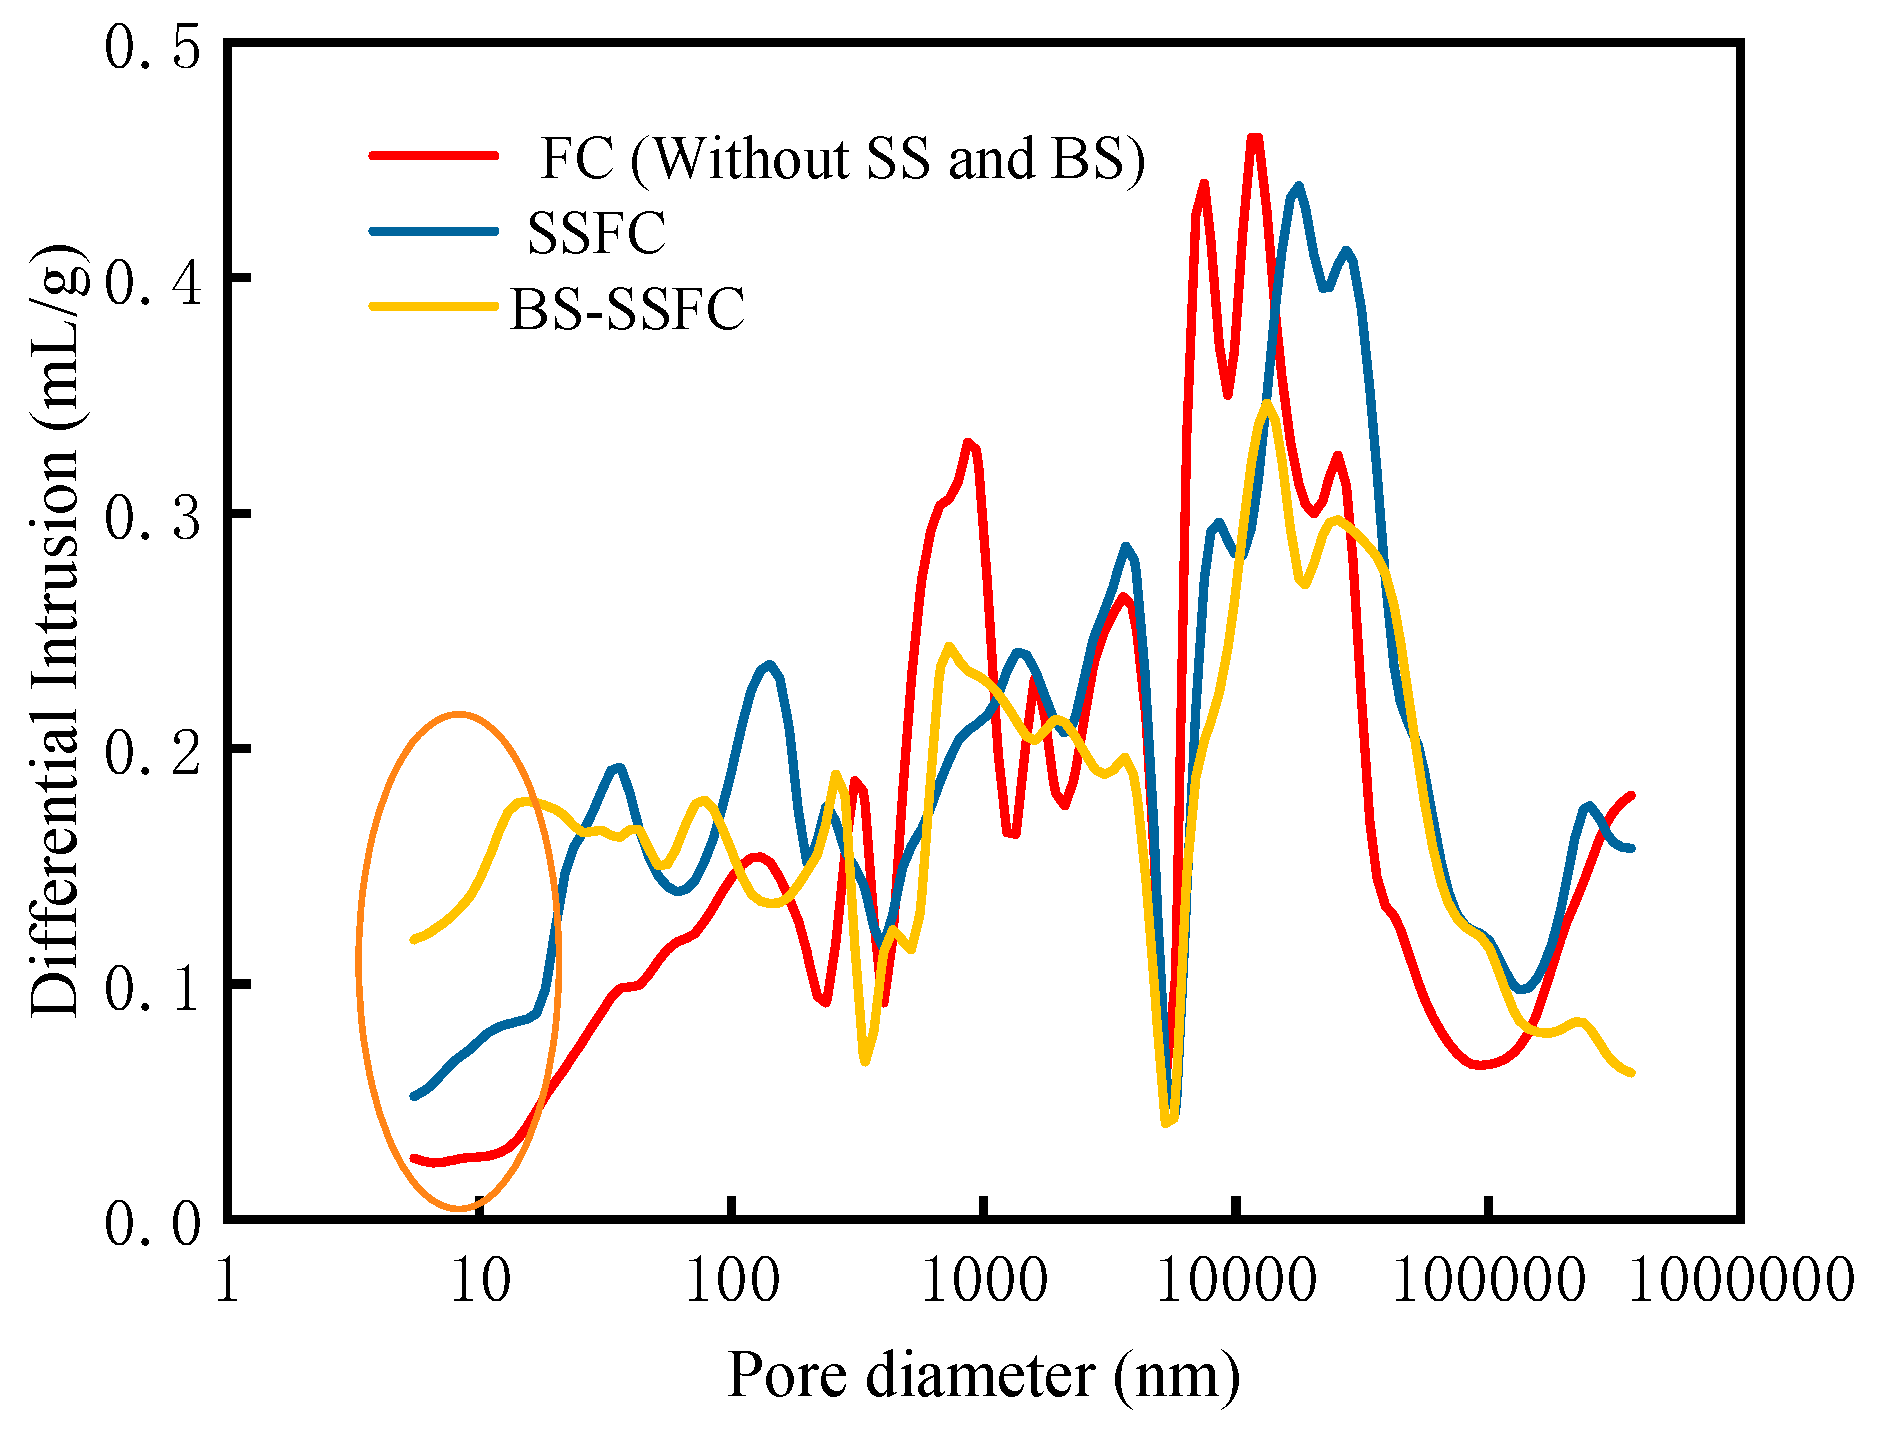
Figure 9 shows the pore size distribution results of BS-SSFC and the control group. The MIP test results indicate that, compared with the pure FC control group, the addition of SS significantly increased the nanoscale pores in the foam concrete, while the combination of SS and BS further increased the number of nanoscale pores, significantly reduced large pores, and also significantly decreased the proportion of harmful pores (>200 nm). This change mainly stems from the physical effects of SS and BS. As a micro-aggregate, SS particles effectively divide the large pores in the cement matrix through their “skeleton effect”, making the pore structure more compact. Meanwhile, the bentonite component in BS is uniformly dispersed in the foam concrete, and the nanoscale montmorillonite flakes stripped off can effectively block the capillary channels and microcracks. This “nanoplug” effect can significantly delay the penetration path of corrosive media.

3.2.2. XRD Analysis

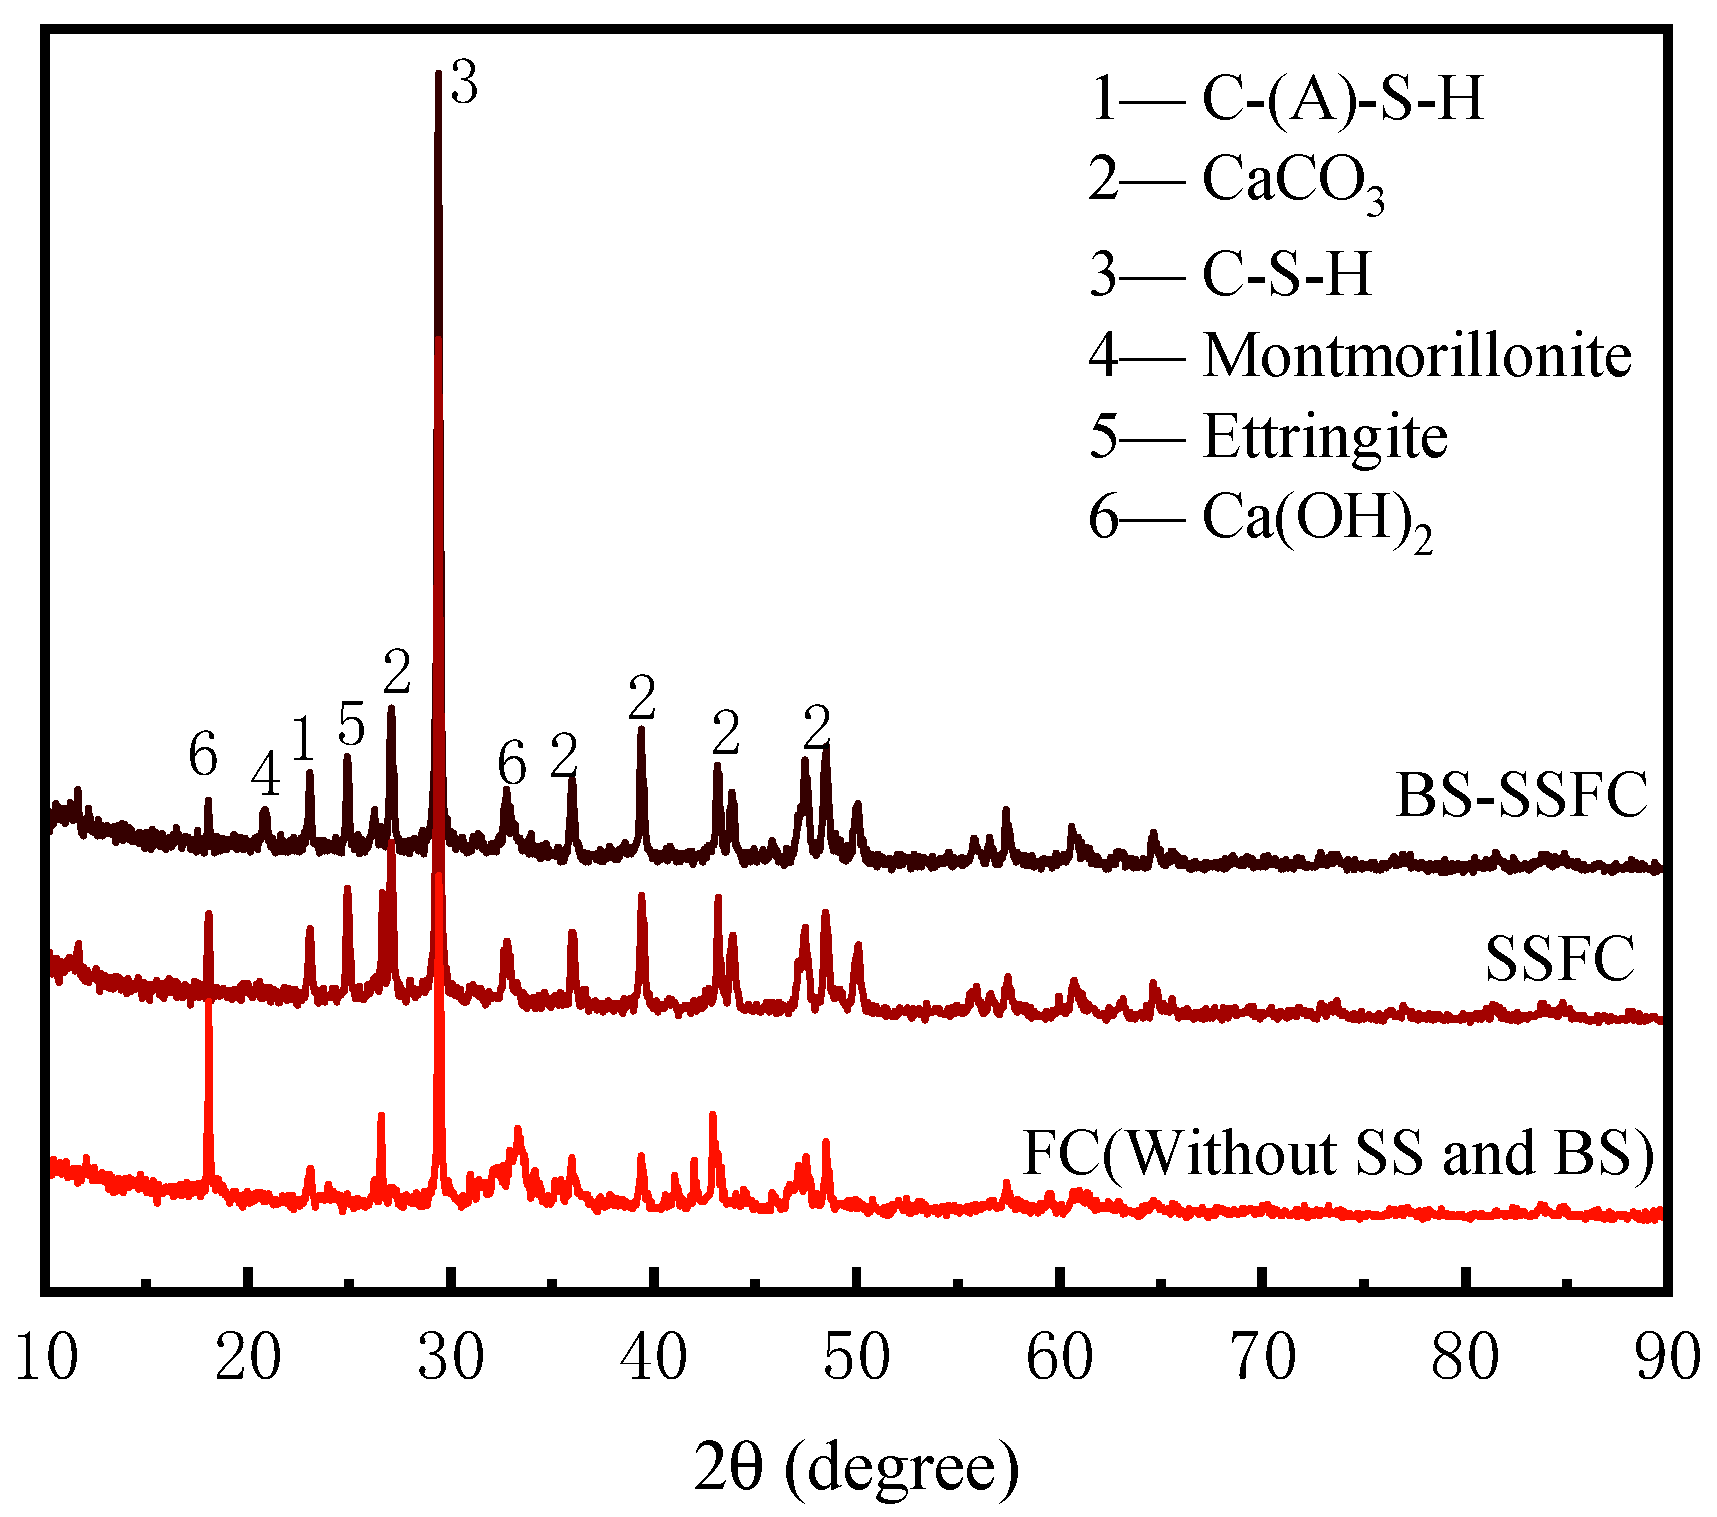
The XRD results provide direct evidence for the chemical synergistic effect. Figure 10 shows the XRD patterns of BS-SSFC and the control group after standard curing for 7 days. Compared to the FC control group, the diffraction peak intensity of Ca(OH)2 is conspicuously decreased in both the SSFC and BS-SSFC groups. This indicates that a pozzolanic reaction occurred involving the active components (e.g., C2S) in SS, consuming Ca(OH)2 to generate additional C-S-H gel. It is noteworthy that, in the BS-SSFC group, the Ca(OH)2 peaks are weaker than those in the SSFC group, while the peaks corresponding to the C-S-H gel are more pronounced. This confirms that the incorporation of BS further promotes the hydration reaction. The underlying mechanism is that the additional water introduced by BS and the enormous specific surface area provided by its layered structure create a more favorable environment for the secondary hydration reaction of SS. This establishes a synergistic mode where SS provides chemical activity, and BS optimizes the reaction environment.

3.2.3. SEM Analysis

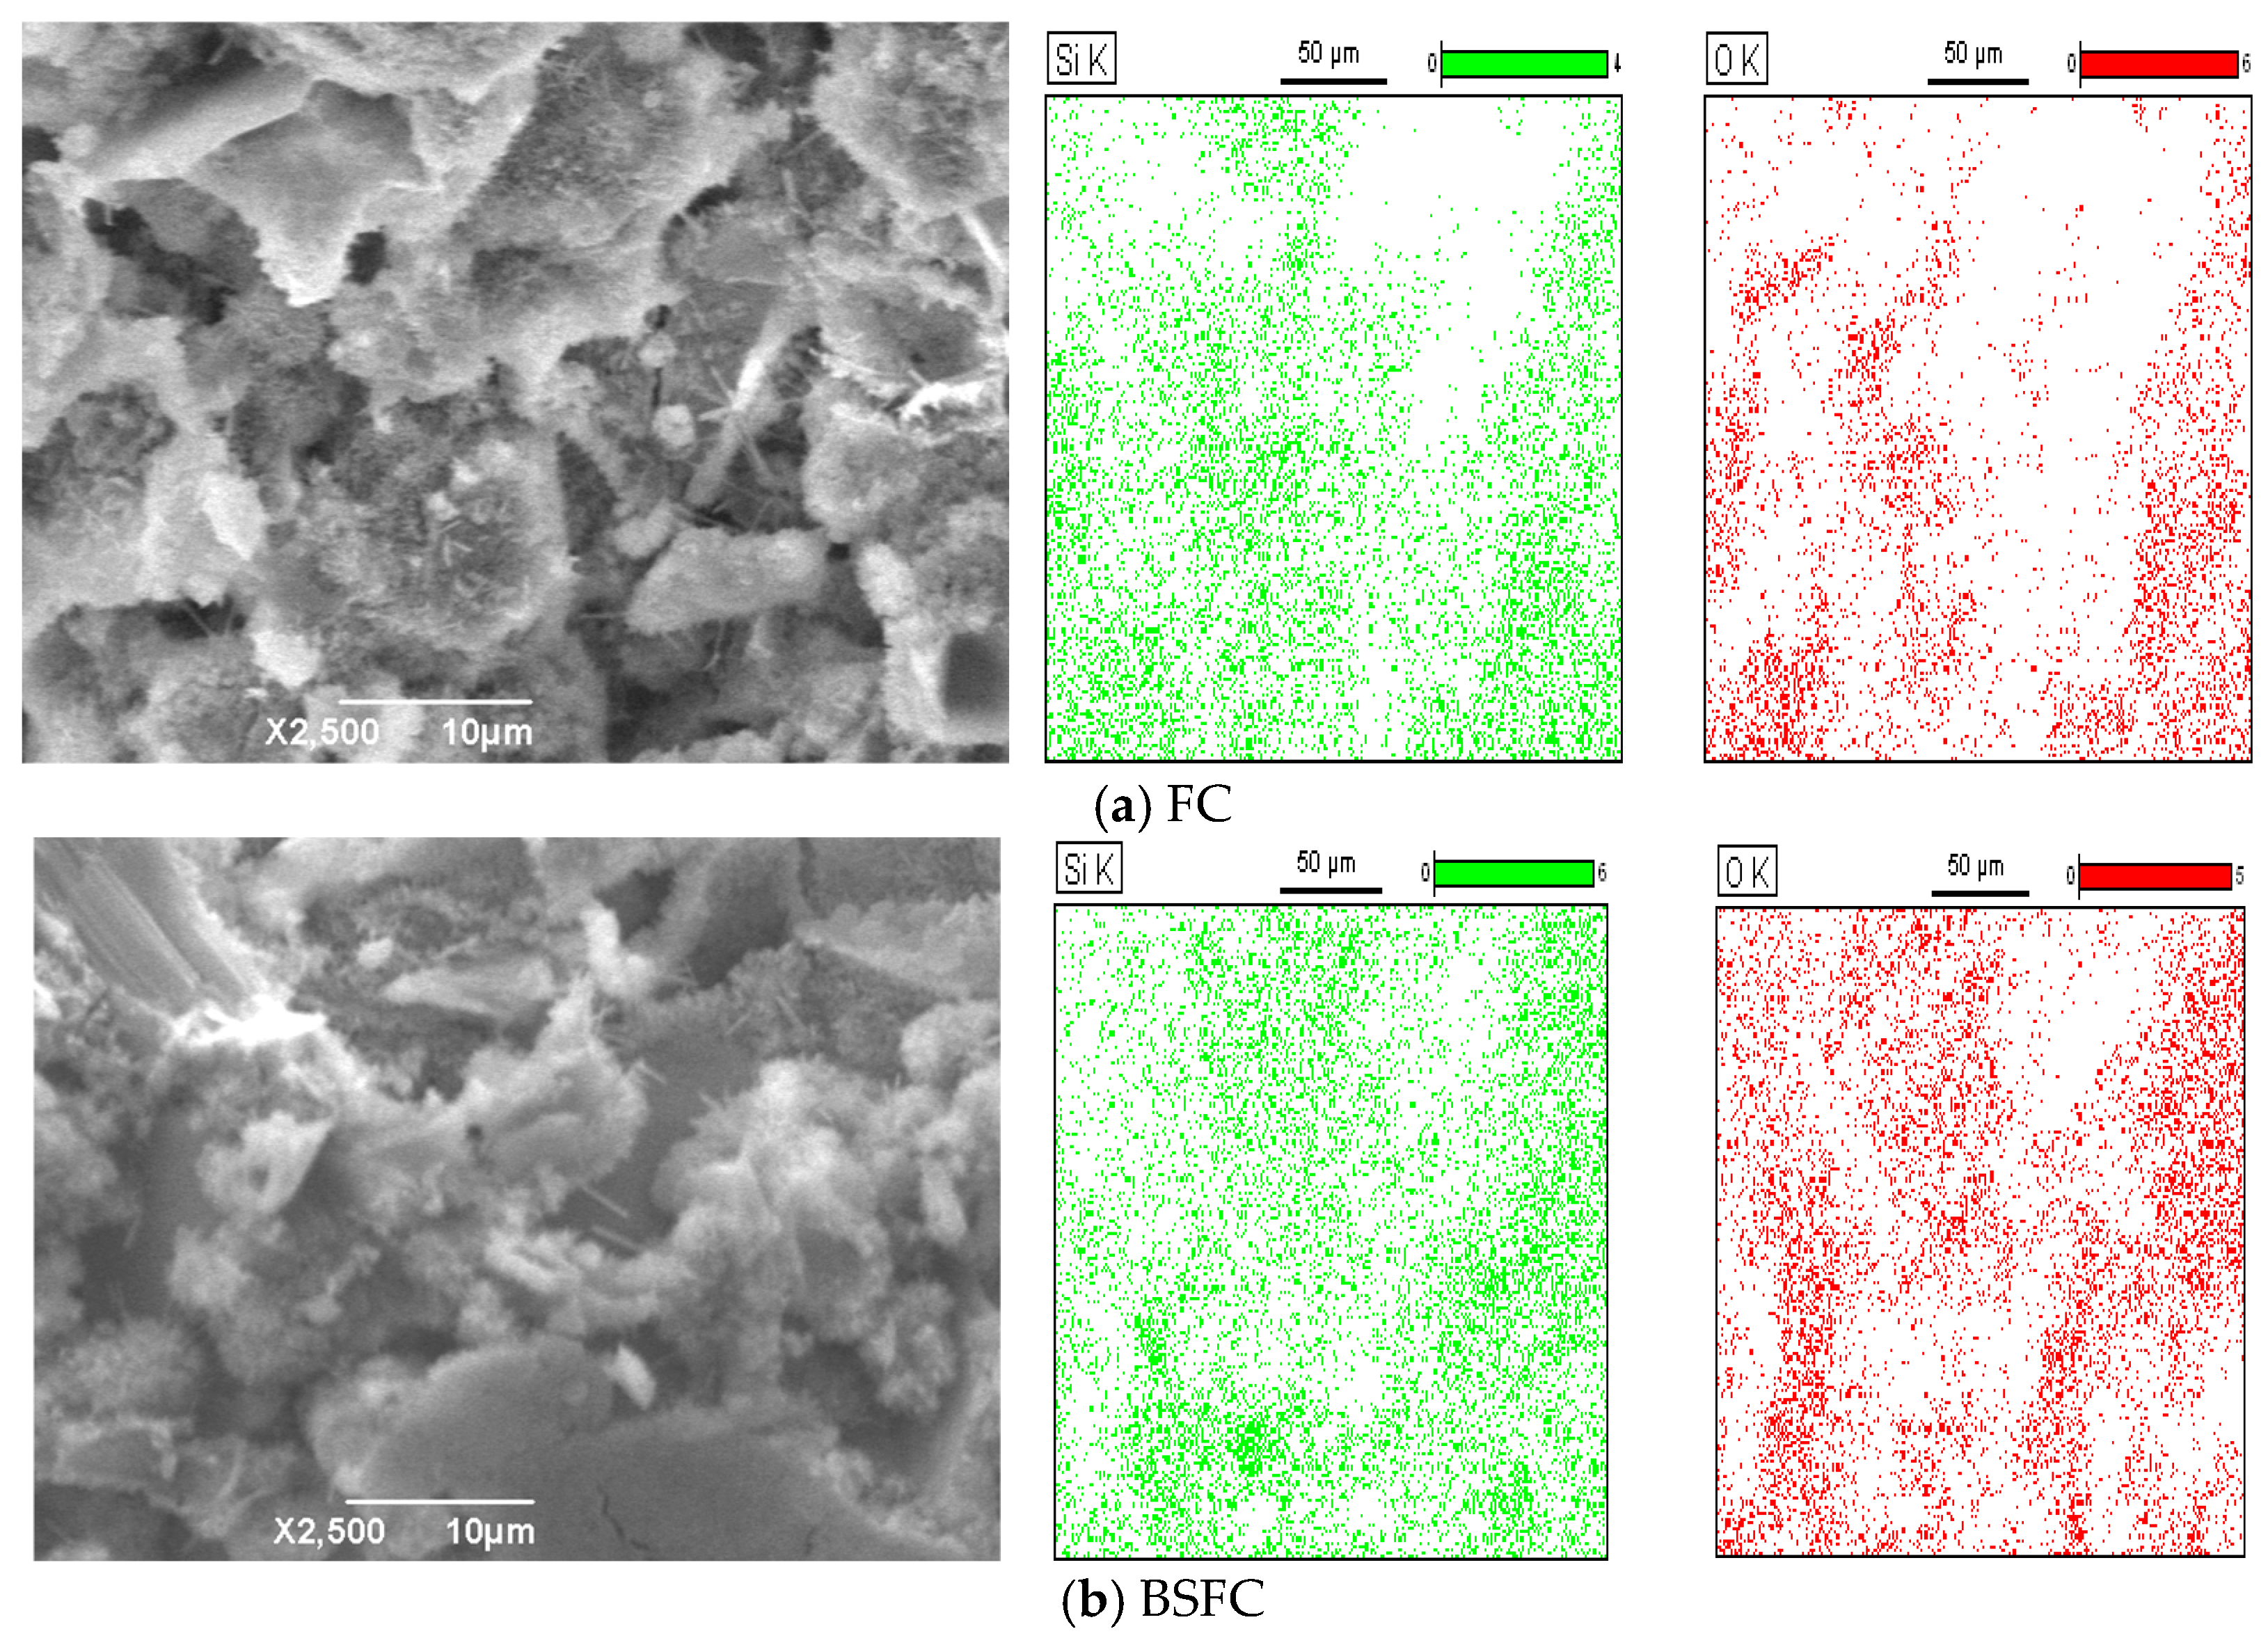
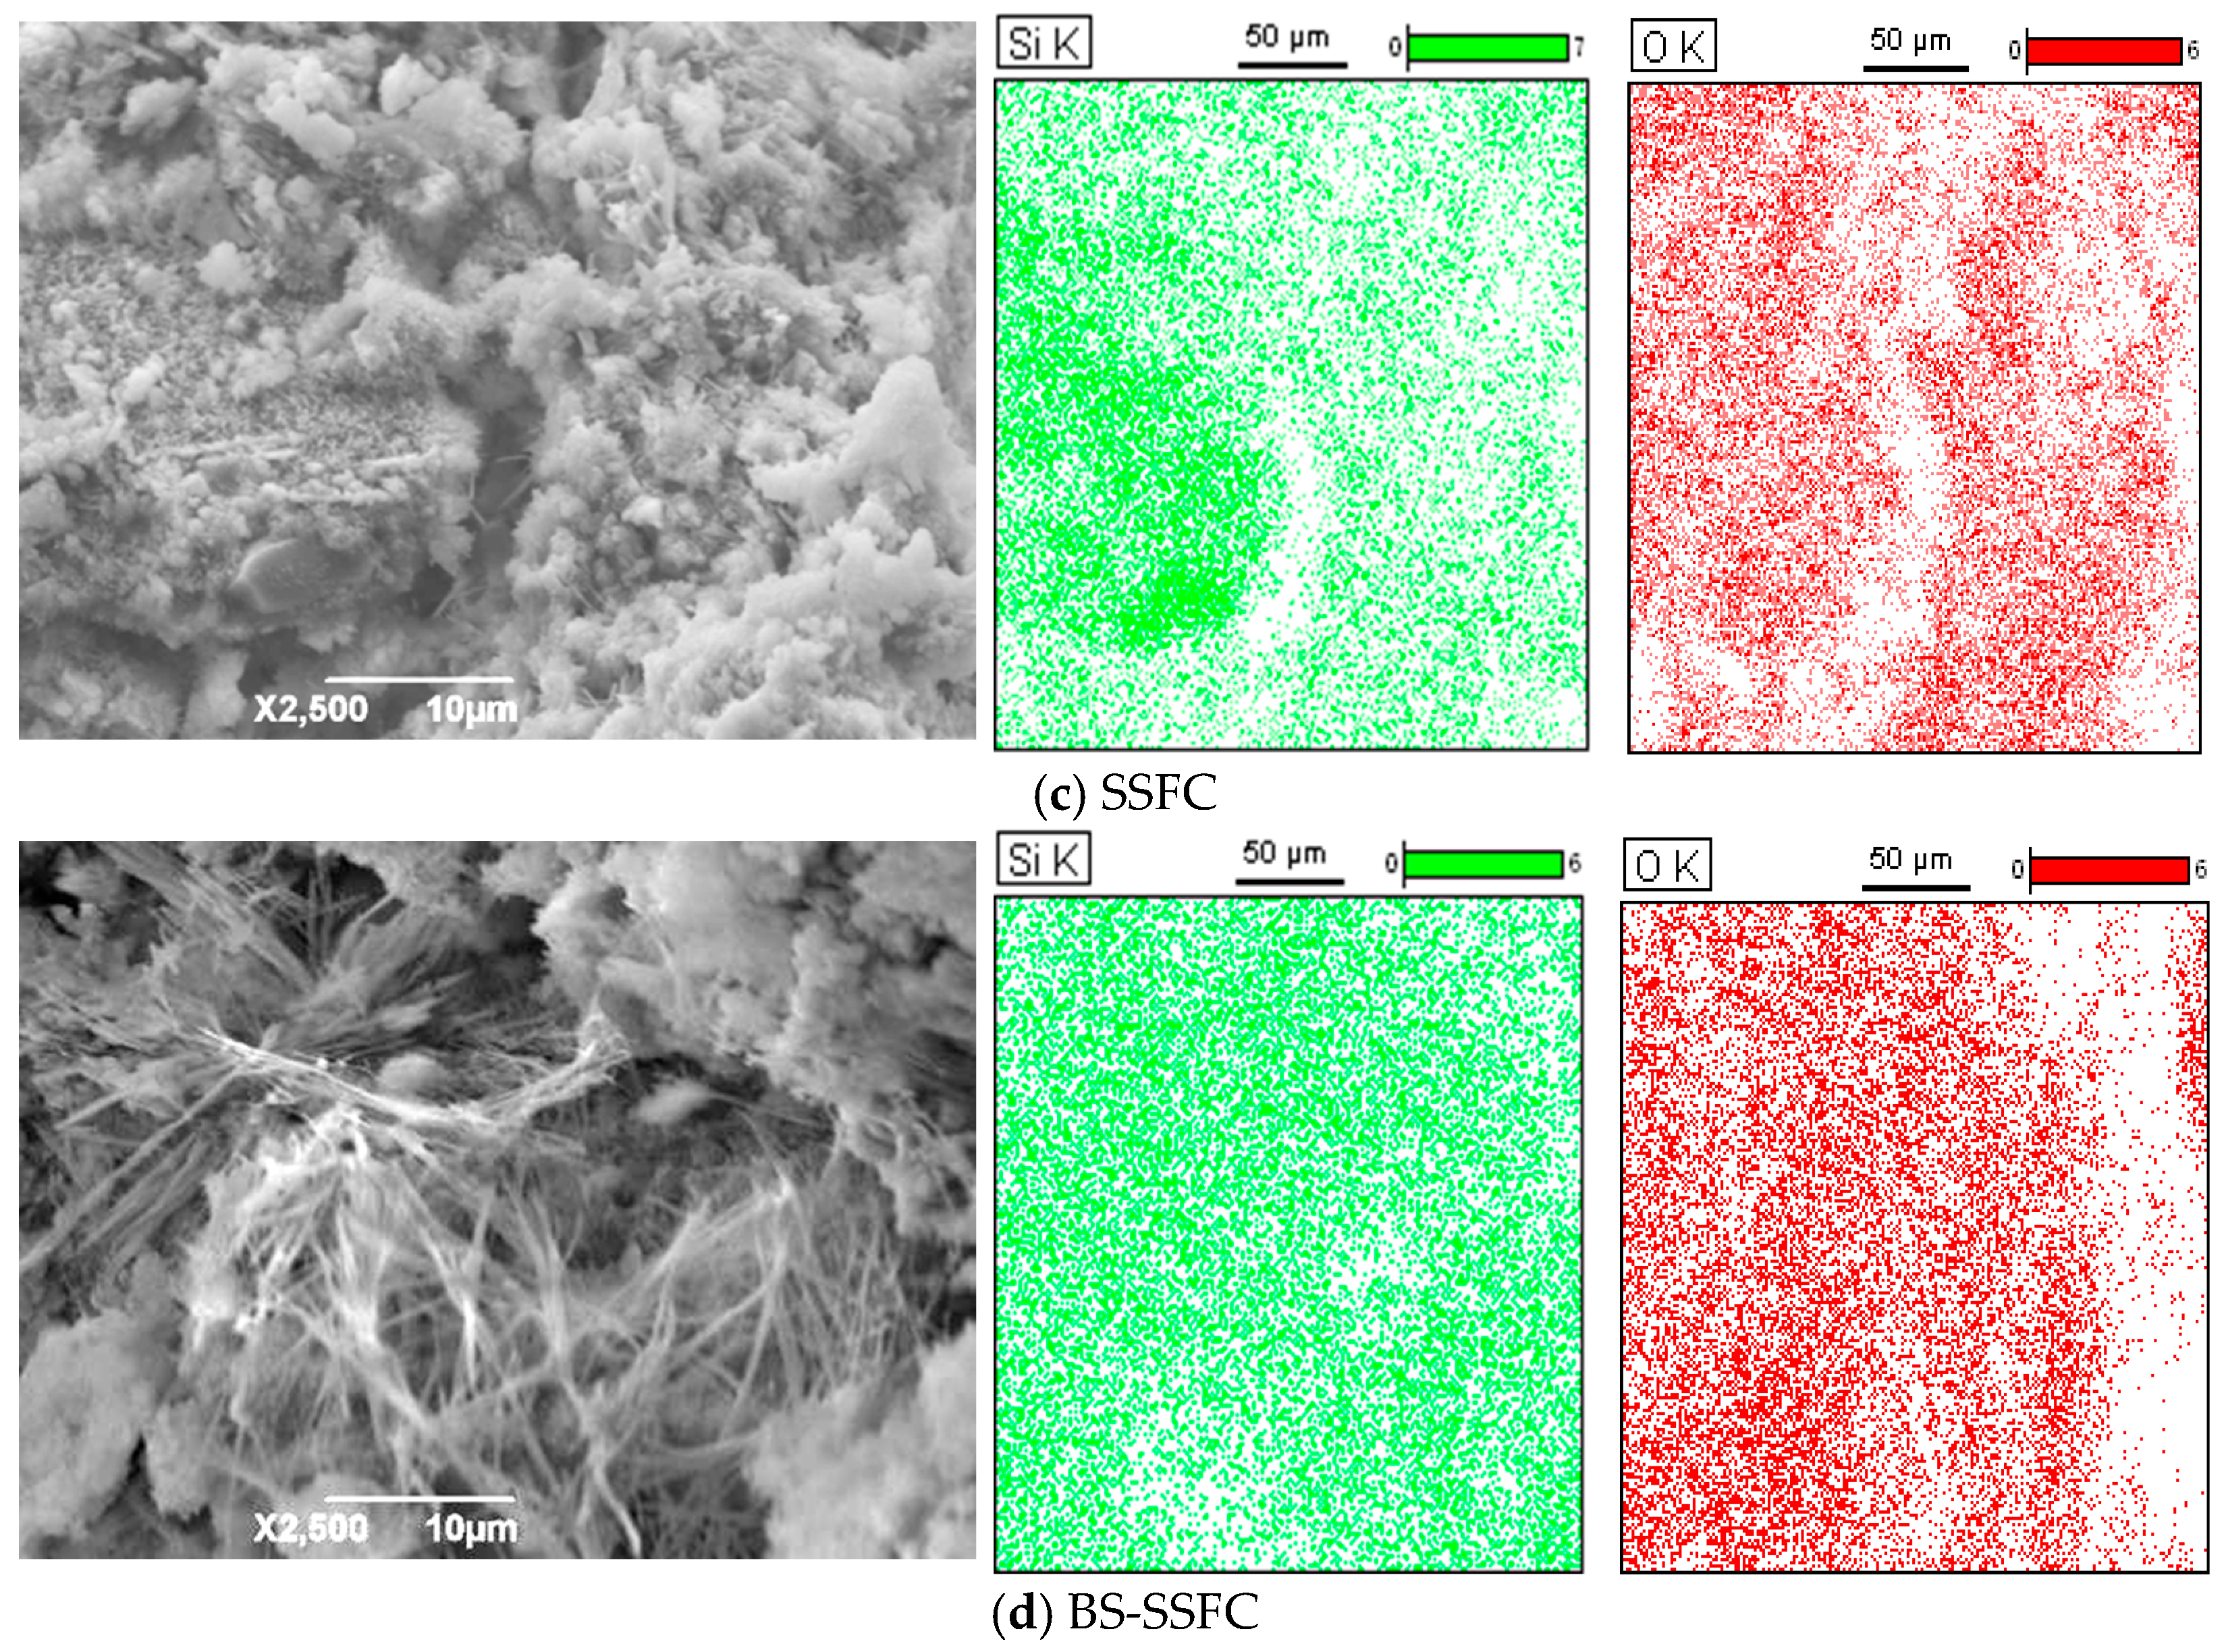
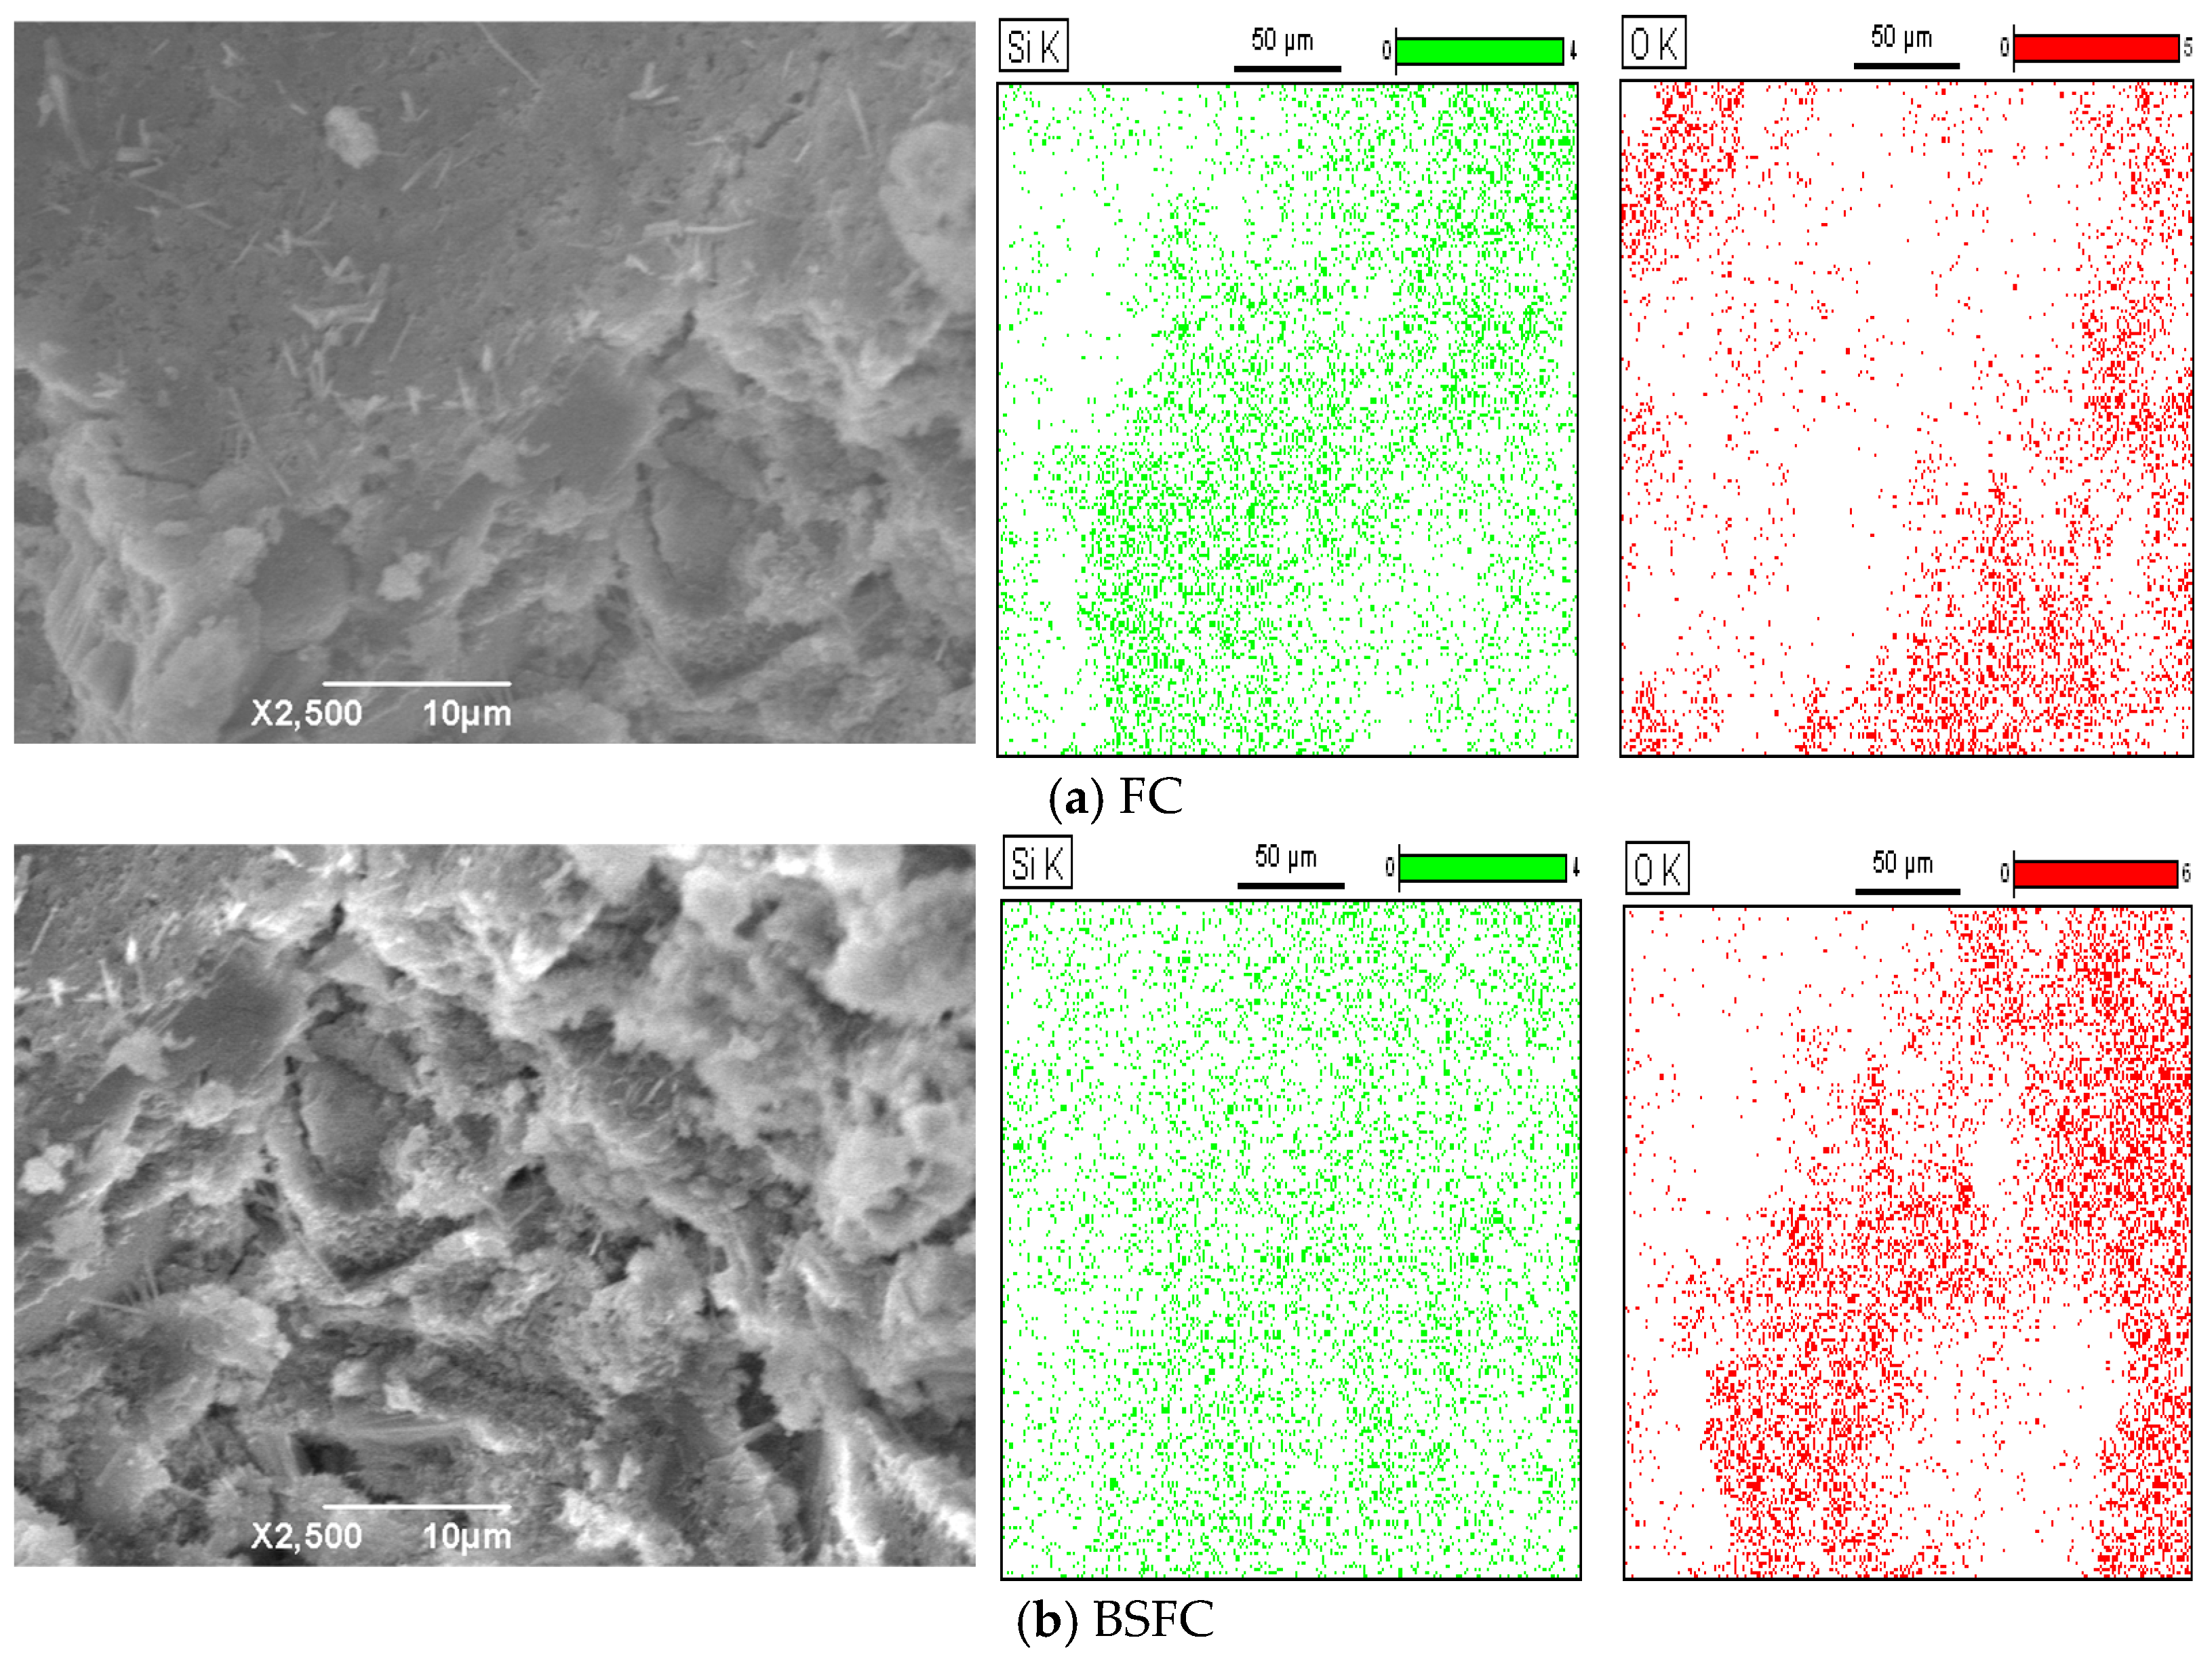
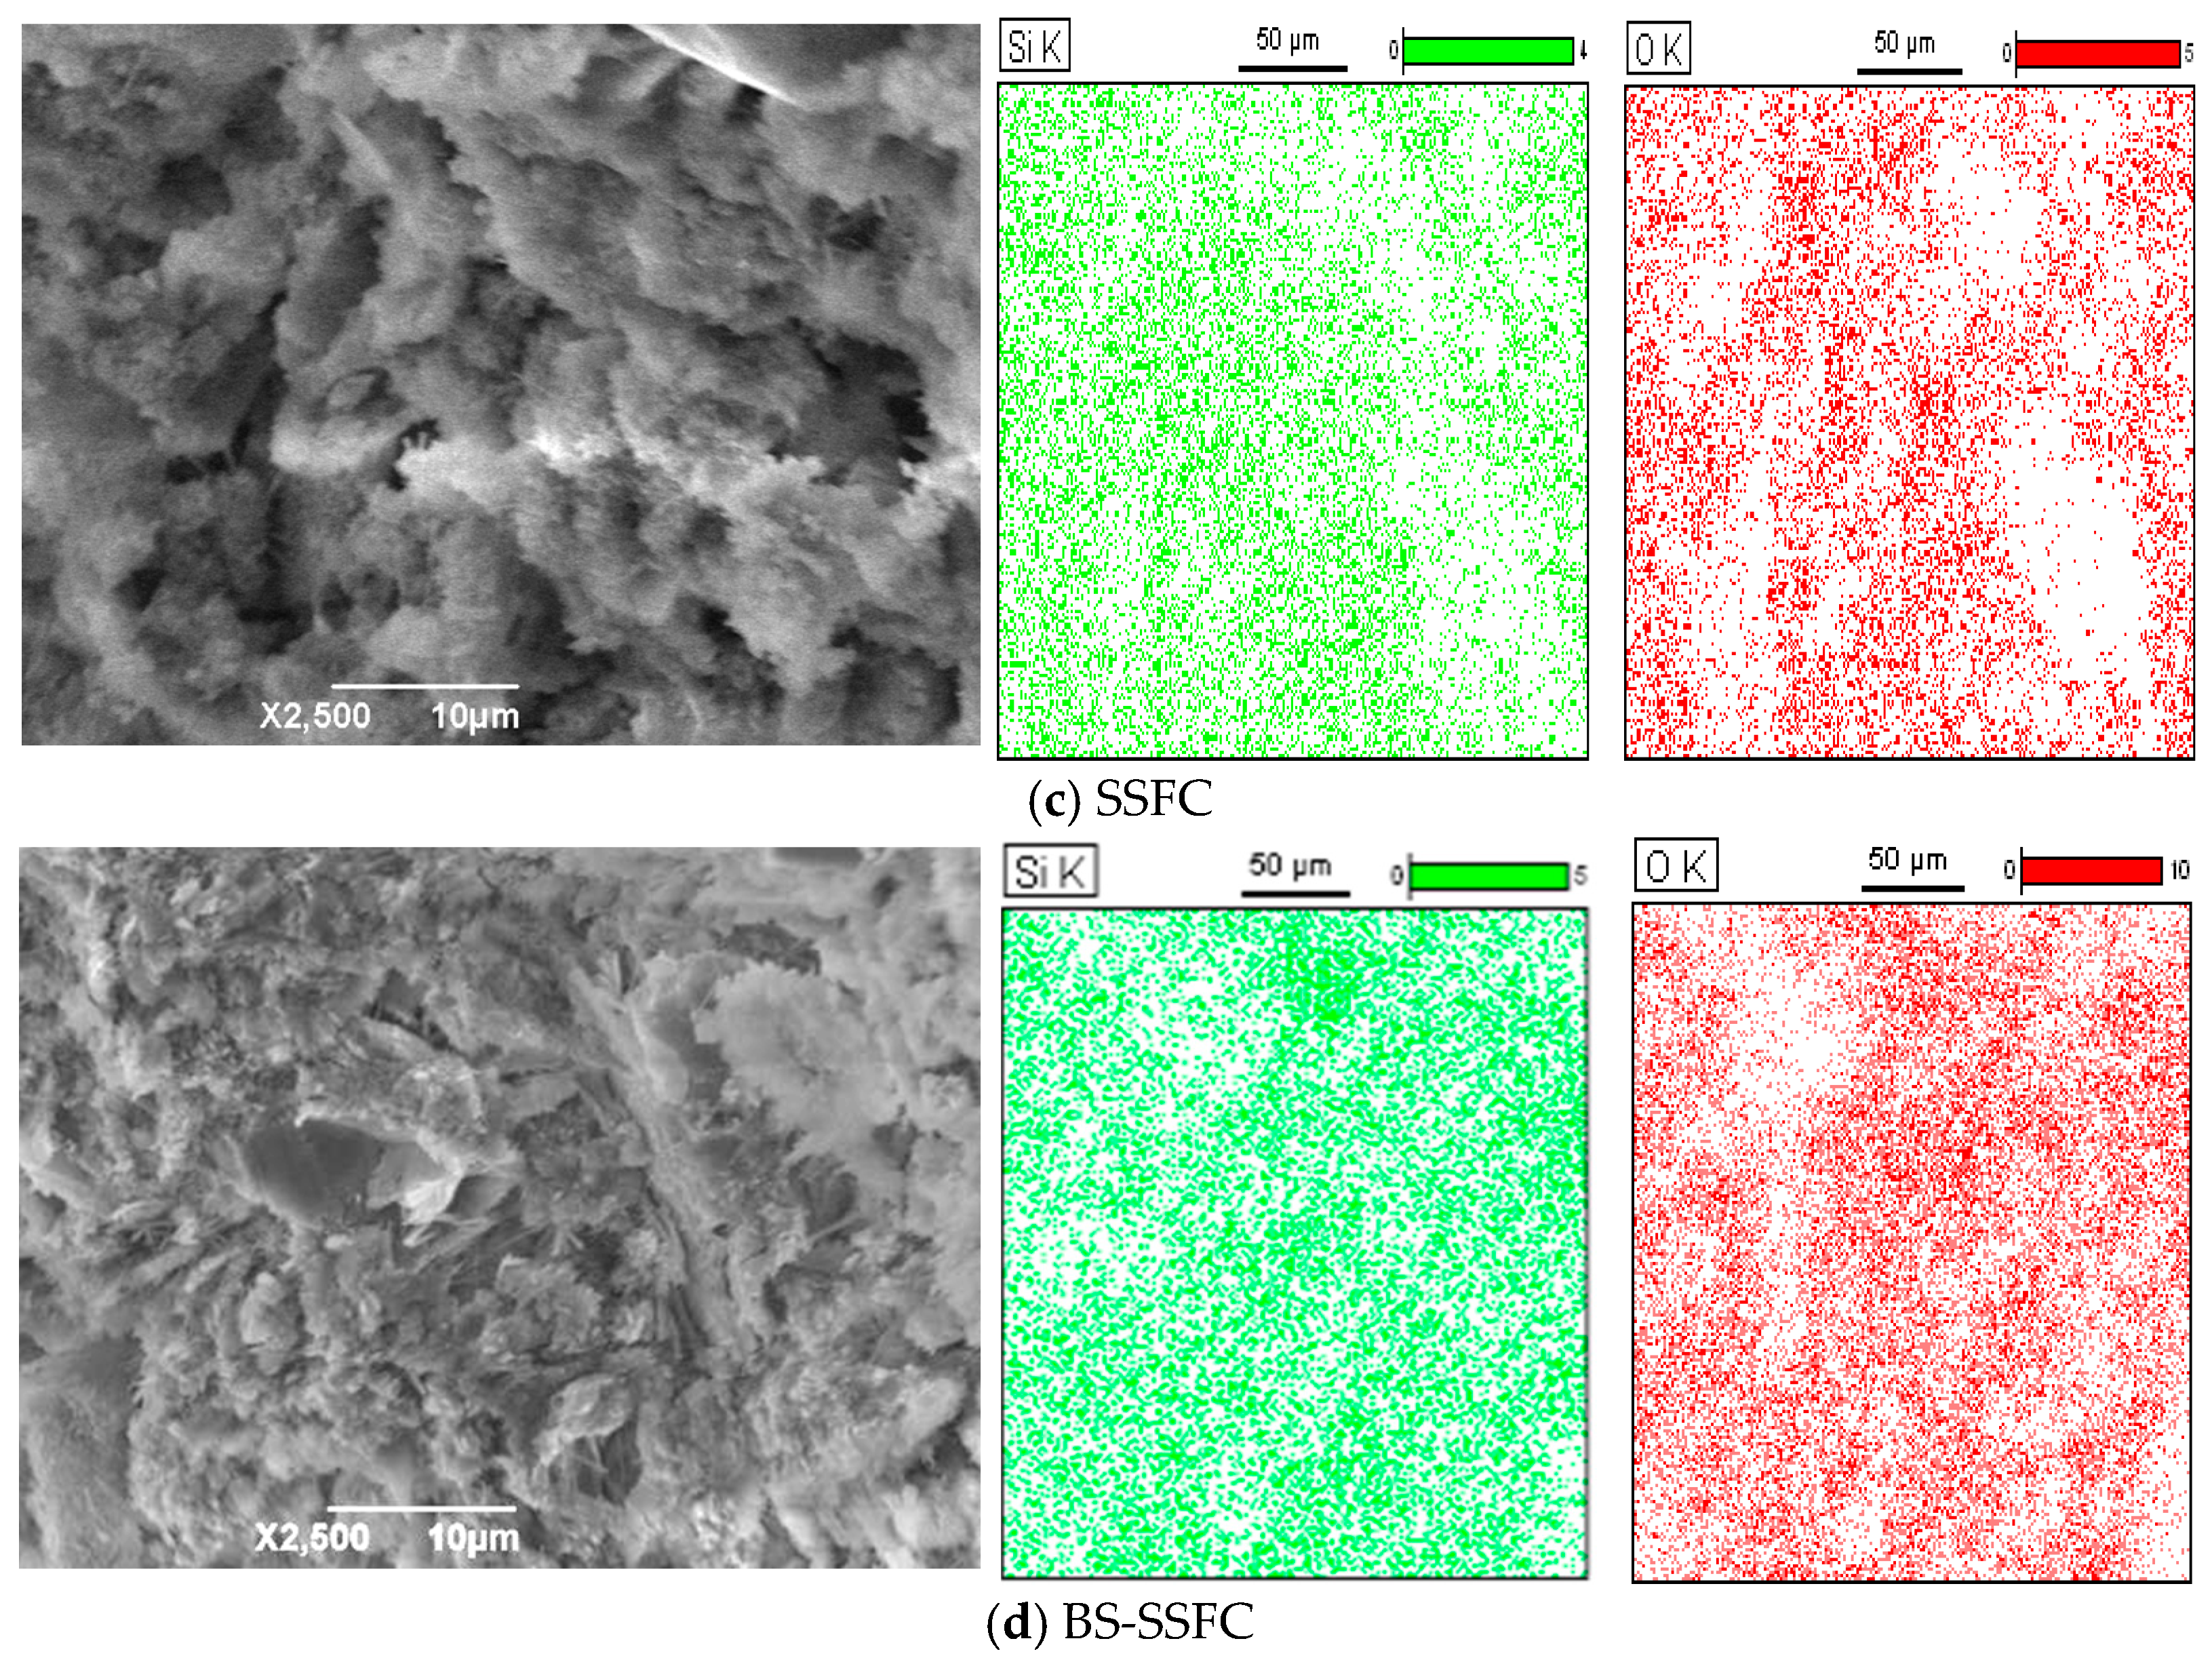
The strength of foam concrete is also closely related to the generation and distribution of its hydration products [46]. Therefore, in this experiment, an EDS analysis was conducted on the SEM images of foam concrete. Four elements, namely, O, Si, Fe, and K, were selected as representatives. Among them, O and Si are the main components of the hydration product C-S-H gel (CaO-SiO2-H2O) (O accounts for 45–50% and Si accounts for 20–25%), and their uniform distribution indicates that the C-S-H gel is adequately generated and uniformly dispersed. The Fe element comes from Fe2O3 in SS (Table 1, 14.39%), and its uniform distribution reflects the dispersion of SS particles in the matrix, avoiding local agglomeration. The K element is derived from potassium feldspar in bentonite (Figure 4 XRD secondary peak). Therefore, the distribution characteristics of these four elements can directly characterize the hydration degree and matrix compactness of FC.
Samples from the control group and the optimal mix proportion group with a dry density of 700 kg/m3 after 20 wet–dry cycles were selected for SEM experiments, and the results are shown in Figure 11 and Figure 12.
Studies have shown that SS and BS play a significant role in improving the durability of FC in different solutions, and their improvement effect is closely related to the generation and evolution of hydration products in the system. An image analysis reveals that, after 20 wet–dry cycles, the benchmark FC (without SS and BS) has a significant deficiency in the amount of hydration products, with a severe deterioration of the matrix structure and obvious development of internal cracks. In contrast, in the samples of the single-admixture groups with BS or SS, the quantity of hydration products increases, and the number of matrix cracks decreases accordingly, but the overall structure remains loose; among them, the SS single-admixture group is superior to the BS single-admixture group in improving the generation of hydration products. This is because SS particles have cementitious activity, and their incorporation can participate in and promote the hydration reaction process of the system. The generated hydrated cementitious products can effectively bond the matrix and fill microcracks under wet–dry cycle conditions, thereby improving the overall durability of the matrix. In the samples of the double-admixture group with a composite addition of SS and BS, the durability of FC is improved most significantly, which is obviously better than that of the single-admixture groups. The results of the scanning electron microscopy (SEM) observation show the following: the number of hydration products in the double-admixture system increases significantly; after the same wet–dry cycles, the matrix still maintains a relatively dense state with less crack development; the element mapping analysis shows that the cementitious products on the matrix surface are evenly distributed; typical morphological characteristics of hydrated products such as colloidal/columnar calcium silicate hydrate (C-S-H) gel and acicular ettringite (as shown in the XRD results of Figure 10, acicular ettringite is generated in BS-SSFC) can be observed. These microstructural characteristics collectively support the significant improvement of durability. The synergistic mechanism is mainly reflected in two aspects: on the one hand, after the steel slag particles are fully mixed with cement paste, they can effectively coat the surface of the foam wall, and enhance the structural strength of the foam wall, thereby reducing the breakage of foam during mixing and hardening, effectively inhibiting the mutual fusion between foams, and avoiding the formation of large-sized connected pores inside the matrix. In the corrosive environment of wet–dry cycles, this optimized pore structure can effectively block the penetration and migration of corrosive media into the matrix. Meanwhile, SS, as a fine aggregate filling the matrix, exerts the micro-aggregate skeleton effect, further strengthening the matrix structure. On the one hand, the role of bentonite slurry as a “water-retaining agent”, the additional moisture it introduces, and the huge specific surface area provided by its laminar structure promote the hydration reaction after some of the steel slag is added. On the other hand, the bentonite components in the bentonite slurry are uniformly dispersed in the foam concrete. The nanoscale montmorillonite flakes stripped off can effectively block the capillary channels and microcracks, thereby delaying the penetration path of corrosive media. In addition, the montmorillonite nanosheets formed by water absorption and expansion can closely combine with hydration products (such as C-S-H gel) to form a denser interfacial transition zone (ITZ), enhancing the toughness and deformation resistance of the matrix, and, thus, effectively inhibiting the initiation and propagation of microcracks.
In summary, under the wet–dry cycles of the two solutions, the CS of all FC specimens shows a decreasing trend. The order of the CS loss degree after wet–dry cycles in different solutions from large to small is as follows: salt solution > aqueous solution. The incorporation of bentonite slurry and steel slag improves the chemical erosion resistance of FC.

4. Prediction Model for CS Under Wet–Dry Cycles

For FC, the pore structure is closely associated with CS. Some researchers have put forward methods to predict CS based on the theoretical porosity of FC. For example, Baozhen [47] found that CS decreases as porosity increases, which aligns with the relationship depicted in the strength–porosity correlation. The empirical relationship proposed by Balshin [48] also indicates a strong correlation between the compressive strength of porous materials and their porosity. In this experiment, the relationship between the porosity and CS of BS-SSFC was investigated, as shown in the following formula [49]:
M f = M 0 ( 1 φ ) b
In the formula, Mf represents the CS of BS-SSFC, M0 denotes the CS of BS-SSFC under zero porosity, φ stands for porosity, and b is an empirical constant, calculated as b = (2X − 3D + 3)/[3(D − 3)] according to Ref. [49], where D refers to the fractal dimension of the foamed concrete. X is the skeletal fractal dimension, defined as X = D − 1 = D1, with D1 being the two-dimensional fractal dimension determined via the box-counting method described below.
The box-counting method employed in this study followed the standard procedure outlined by Chen and Xu [50]. The process was implemented using ImageJ (version 1.53t, National Institutes of Health, Bethesda, MD, USA), involving image binarization (Otsu’s method) and the application of a gradient of box sizes (ε = 1, 2, 4, …, 32 pixels). The reliability of the method was verified by applying it to a standard fractal image (Sierpinski triangle), which yielded a calculation error of less than 2%. The fractal dimension D of FC can be derived through a fractal analysis of the SEM images using the box-counting approach. In line with the fractal theory, the Otsu algorithm is applied to binarize the SEM images, and squares with a side length of ε (generally ε = 1, 2, 4, …, 2i) are utilized to completely cover the SEM images without overlapping. Let 1 correspond to black and 0 to white, where a is the box side length, and N(ε) is the count of boxes corresponding to the two colors (black and white). Usually, the box side length is set to pixel sizes of ε = 1, 2, 4, …, 2i. As ε approaches 0, the formula for calculating the fractal dimension under the box dimension method is as follows:
D 1 = lin ε 0 ln N ( ε ) ln ε
From the above formula, it can be inferred that, the smaller the ε value, the more precise the calculation of the fractal dimension. Nevertheless, ε has a lower limit, which equals the length of a single pixel. Given that the pixel size δ = image length L divided by the number of pixels in a column of the image, the side length of the square box is a = εδ (where ε = 1, 2, 4, …, 2i). By fitting different ε values with their corresponding N(ε) and employing the least squares method, the following formula is obtained:
ln N ( ε ) = D 1 * ln ε + h
In the formula, D1 denotes the fractal dimension in a two-dimensional plane, and the slope of the fitted straight line corresponds to the fractal dimension of the target image. Given that the slope in the image is negative, the fractal dimension D1 is the absolute value of the slope of this straight line. The relationship between the three-dimensional fractal dimension and the two-dimensional fractal dimension D1 is referred to in Reference [43]:
D = D 1 + 1
This approximation remains reasonable provided that the following conditions are met: (1) the material structure exhibits no significant stratification or strong anisotropy in three dimensions; (2) the selected two-dimensional cross-section is representative and reflects the scale-invariant characteristics of the overall pore structure; and (3) the fractal properties observed in the two-dimensional section are consistent across multiple randomly selected sections. In this study, the stability of D1 across samples was verified through a two-dimensional fractal analysis performed on at least three specimens for each mix proportion. Hence, within the constraints of the experimental conditions, it is feasible to adopt the relation D = D1 + 1 as a reasonable estimation.
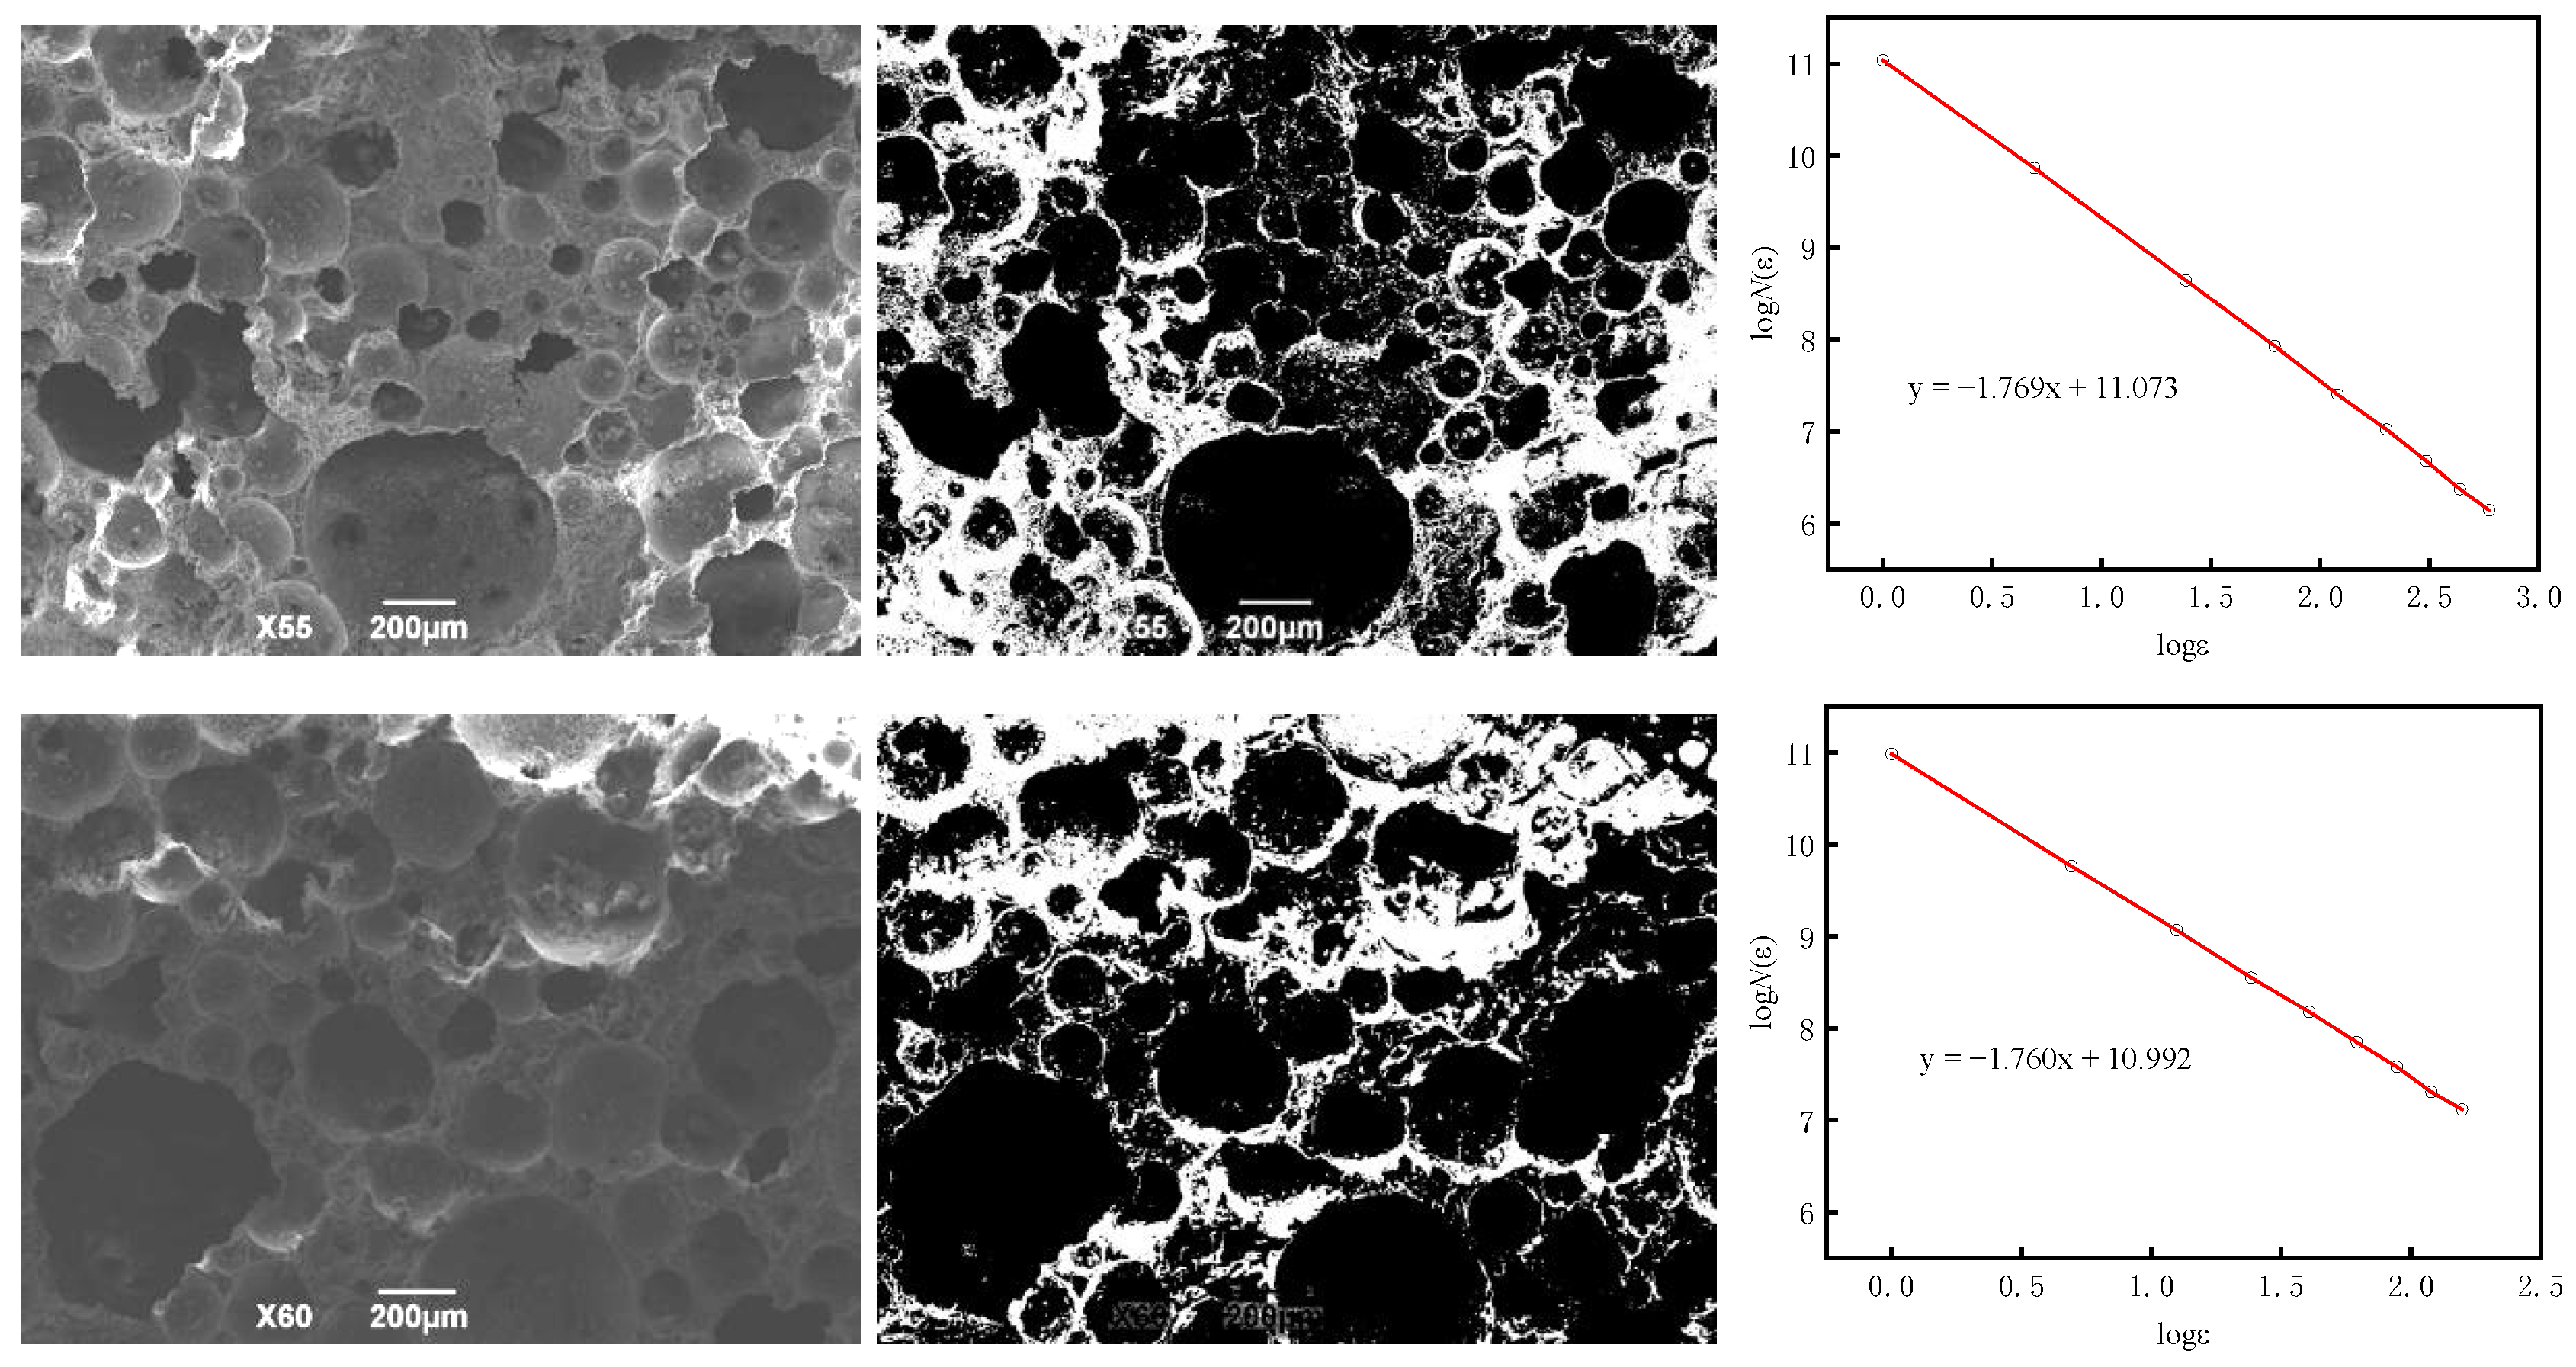
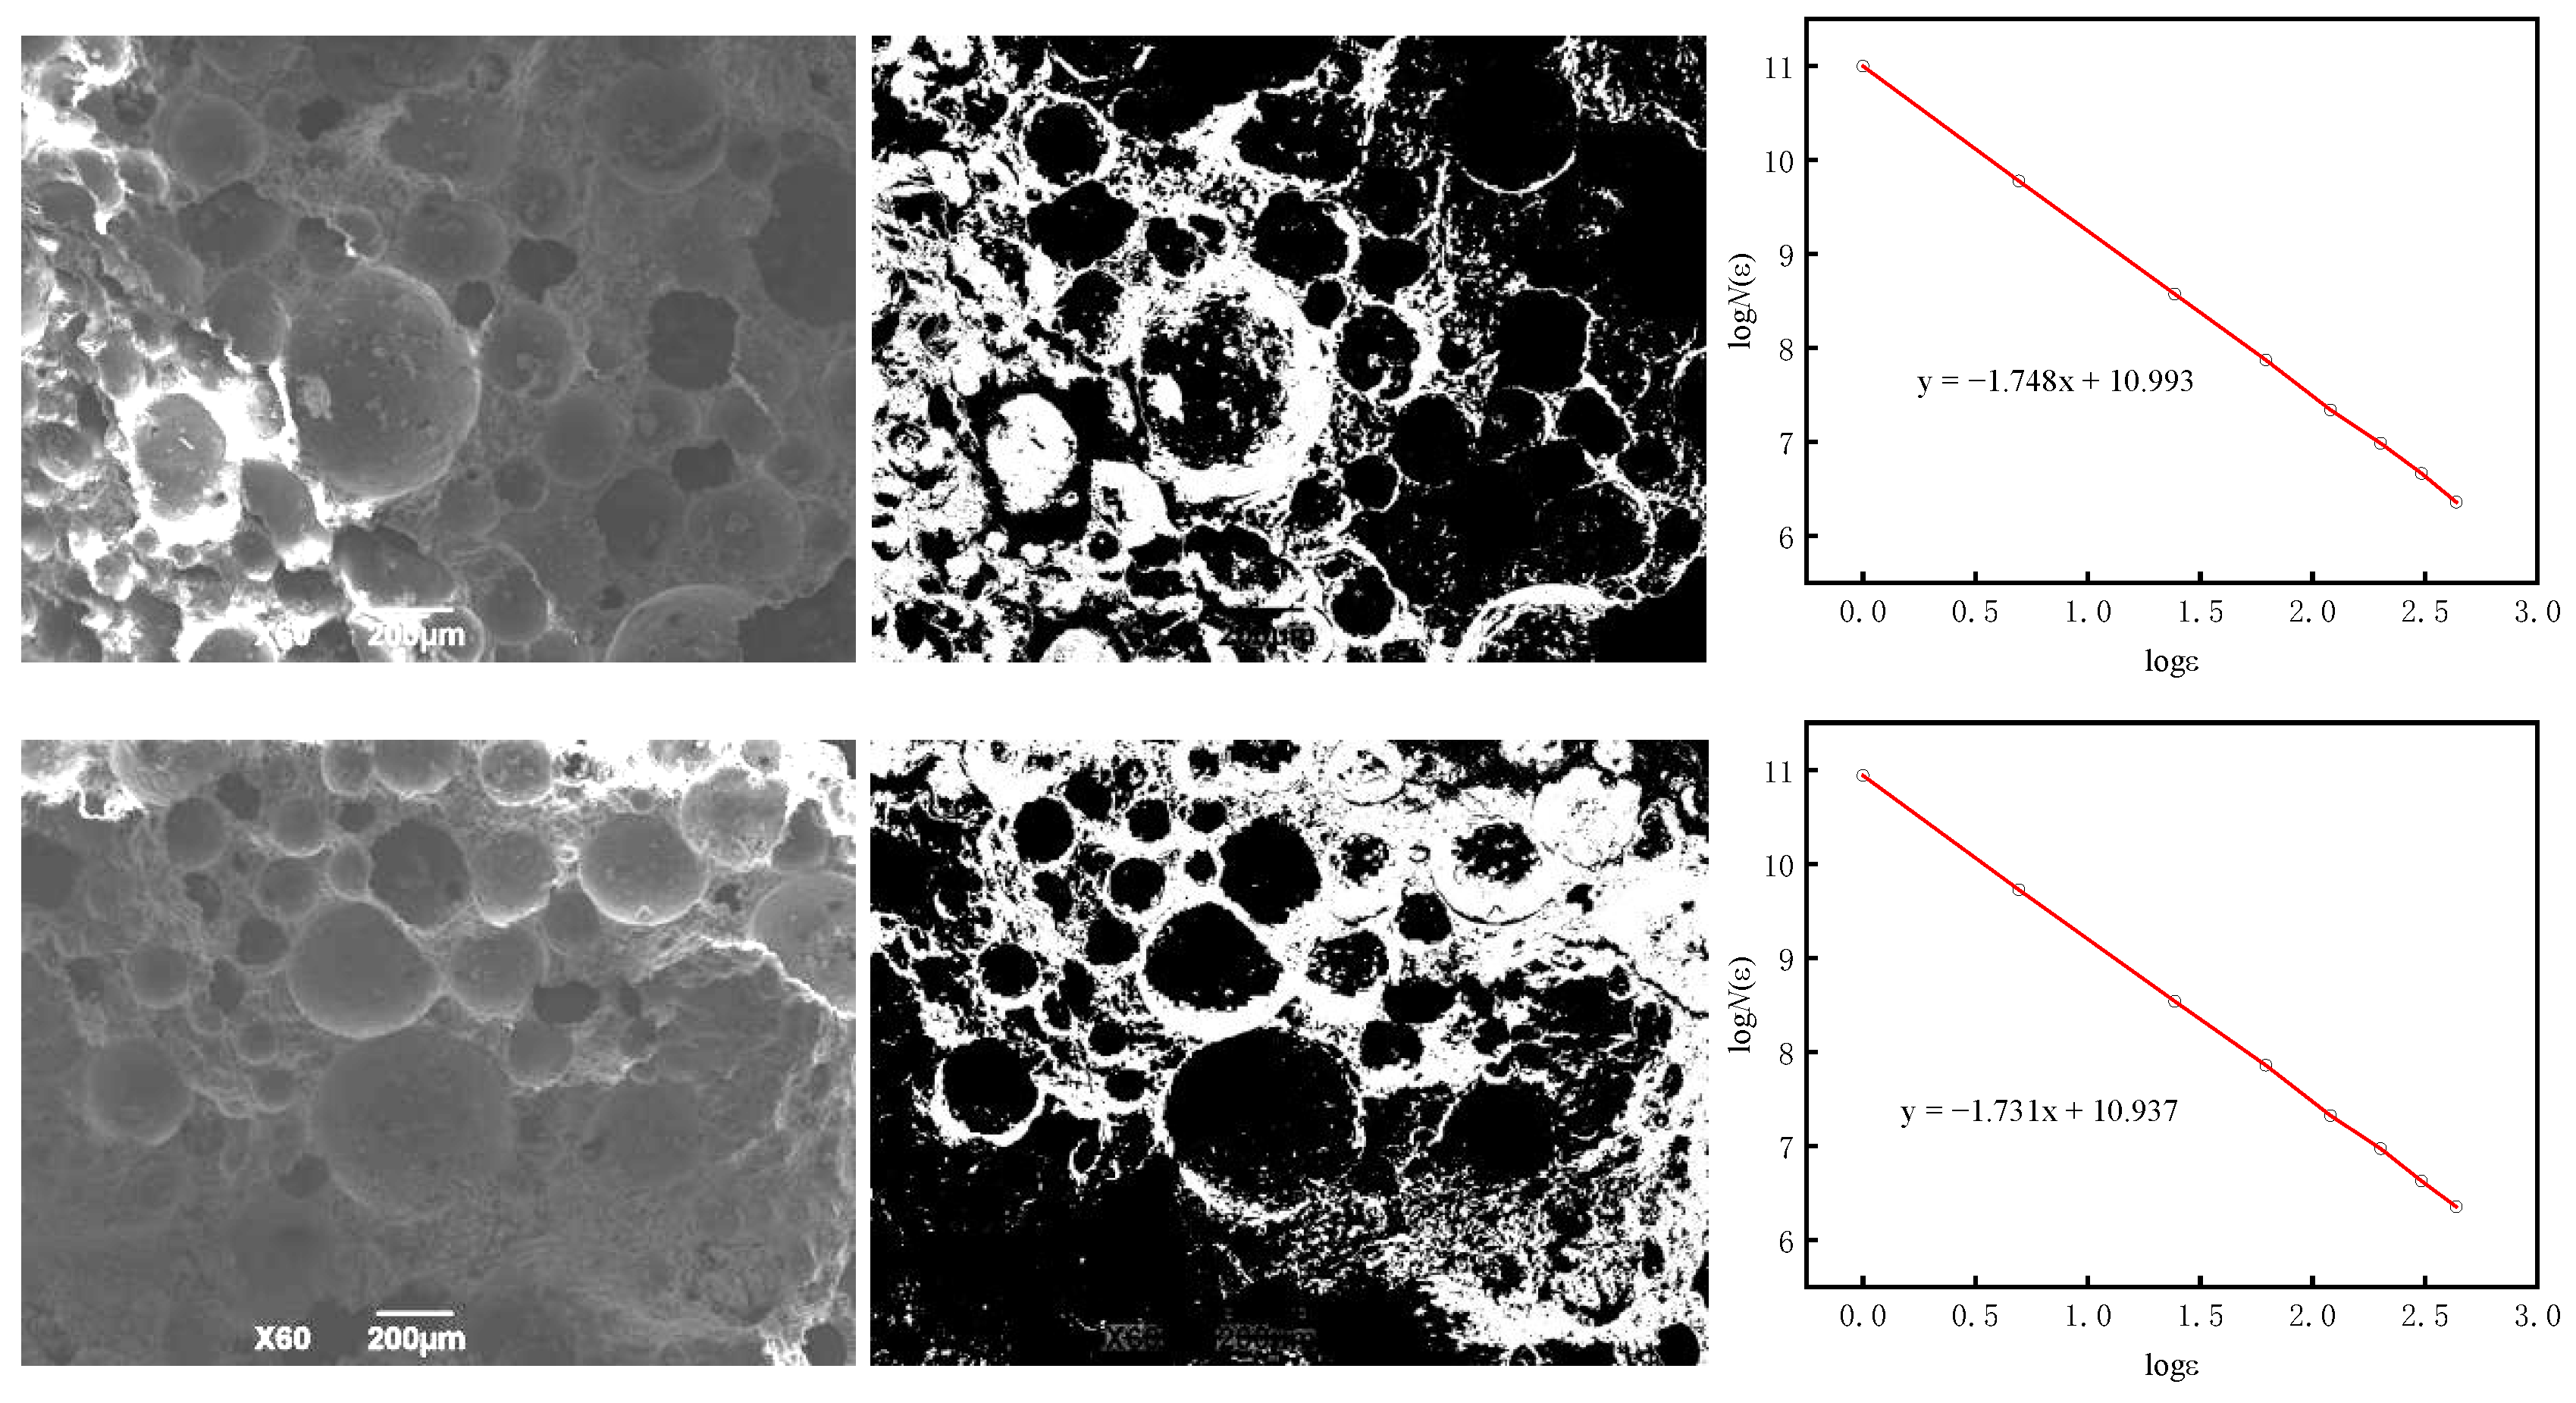
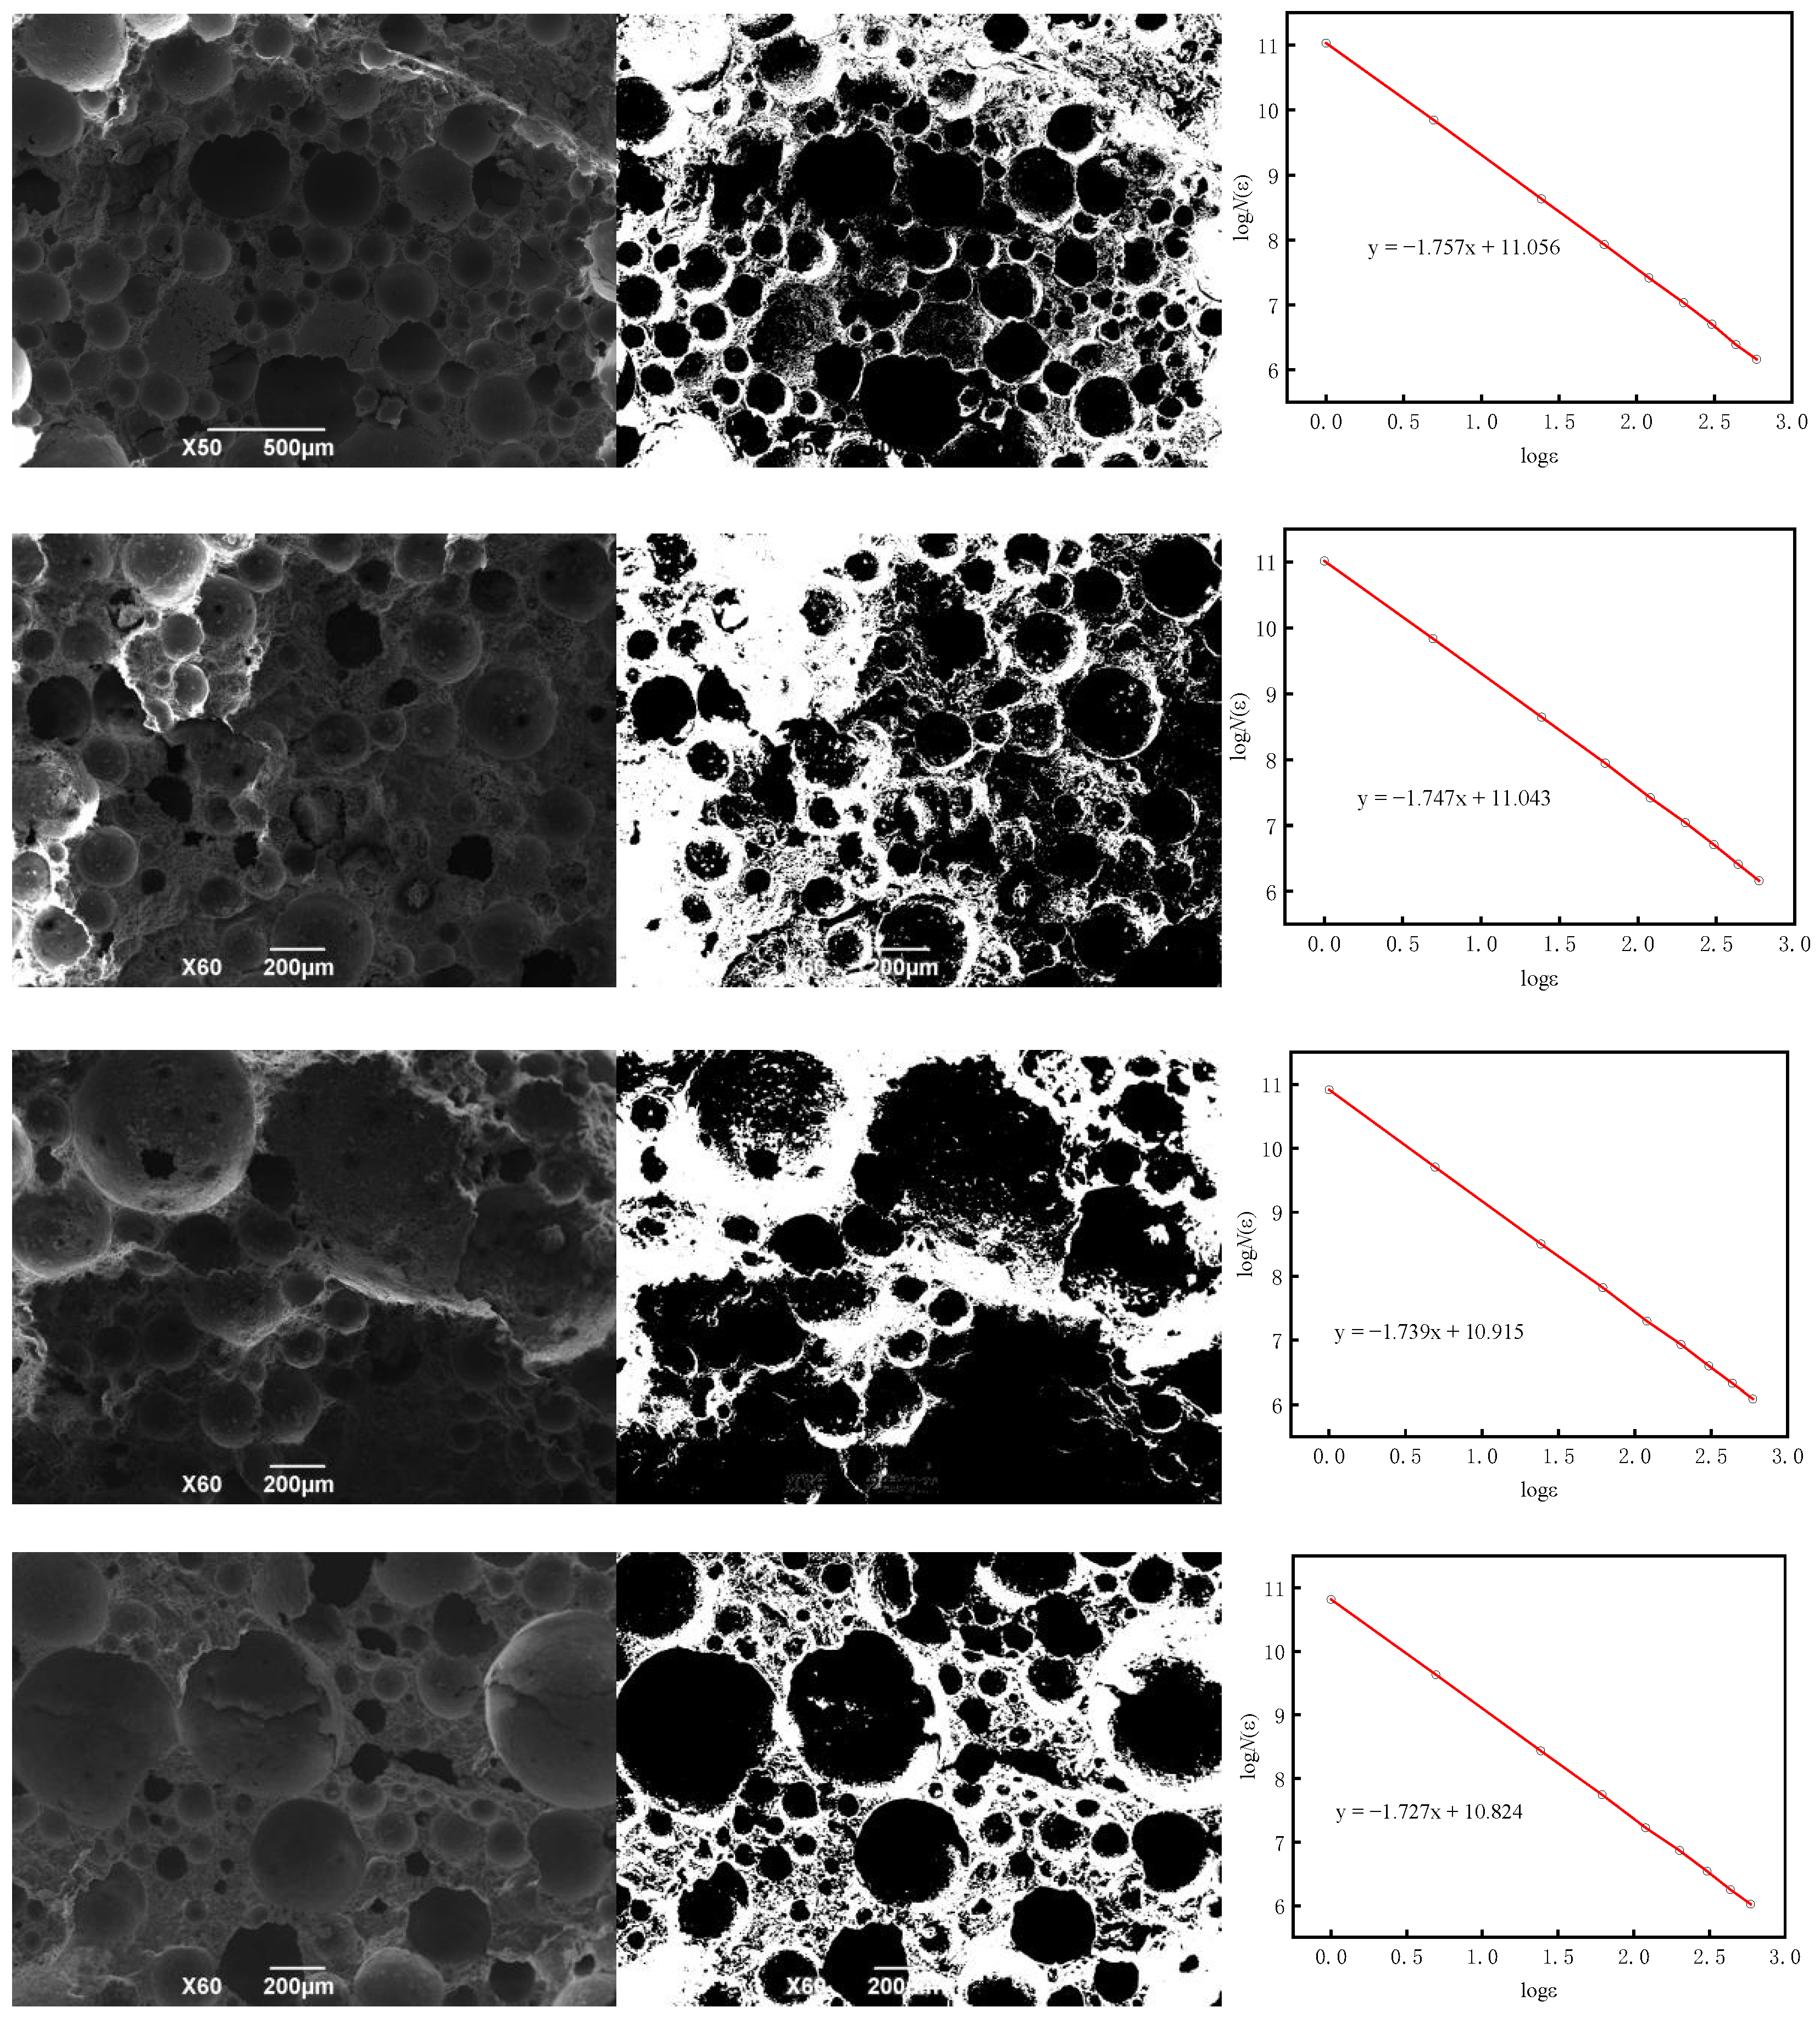
Figure 13 and Figure 14 presents the fractal dimension results calculated after processing SEM images using ImageJ and the fractal dimensions after 20 wet–dry cycles in different solutions are listed in Table 3 and Table 4.
The fractal dimension is reported to three decimal places as the output accuracy of the calculation software. The actual measurement uncertainty is ±0.004 (the coefficient of variation based on three repeated measurements is less than 1%), which meets the industry accuracy requirements for fractal analysis. Based on the above analysis, under the wet–dry cycles of water and salt solutions, the fractal dimension of BS-SSFC shows a slight decrease as the number of cycles increases. A linear regression analysis confirmed that the decreasing trend in the fractal dimension was statistically significant (p < 0.05). This phenomenon is primarily attributed to the gradual merging of small pores in FC into larger ones during the cycling process, which makes the pore structure more uniform and the overall structure simpler—factors that result in a reduction in the fractal dimension.
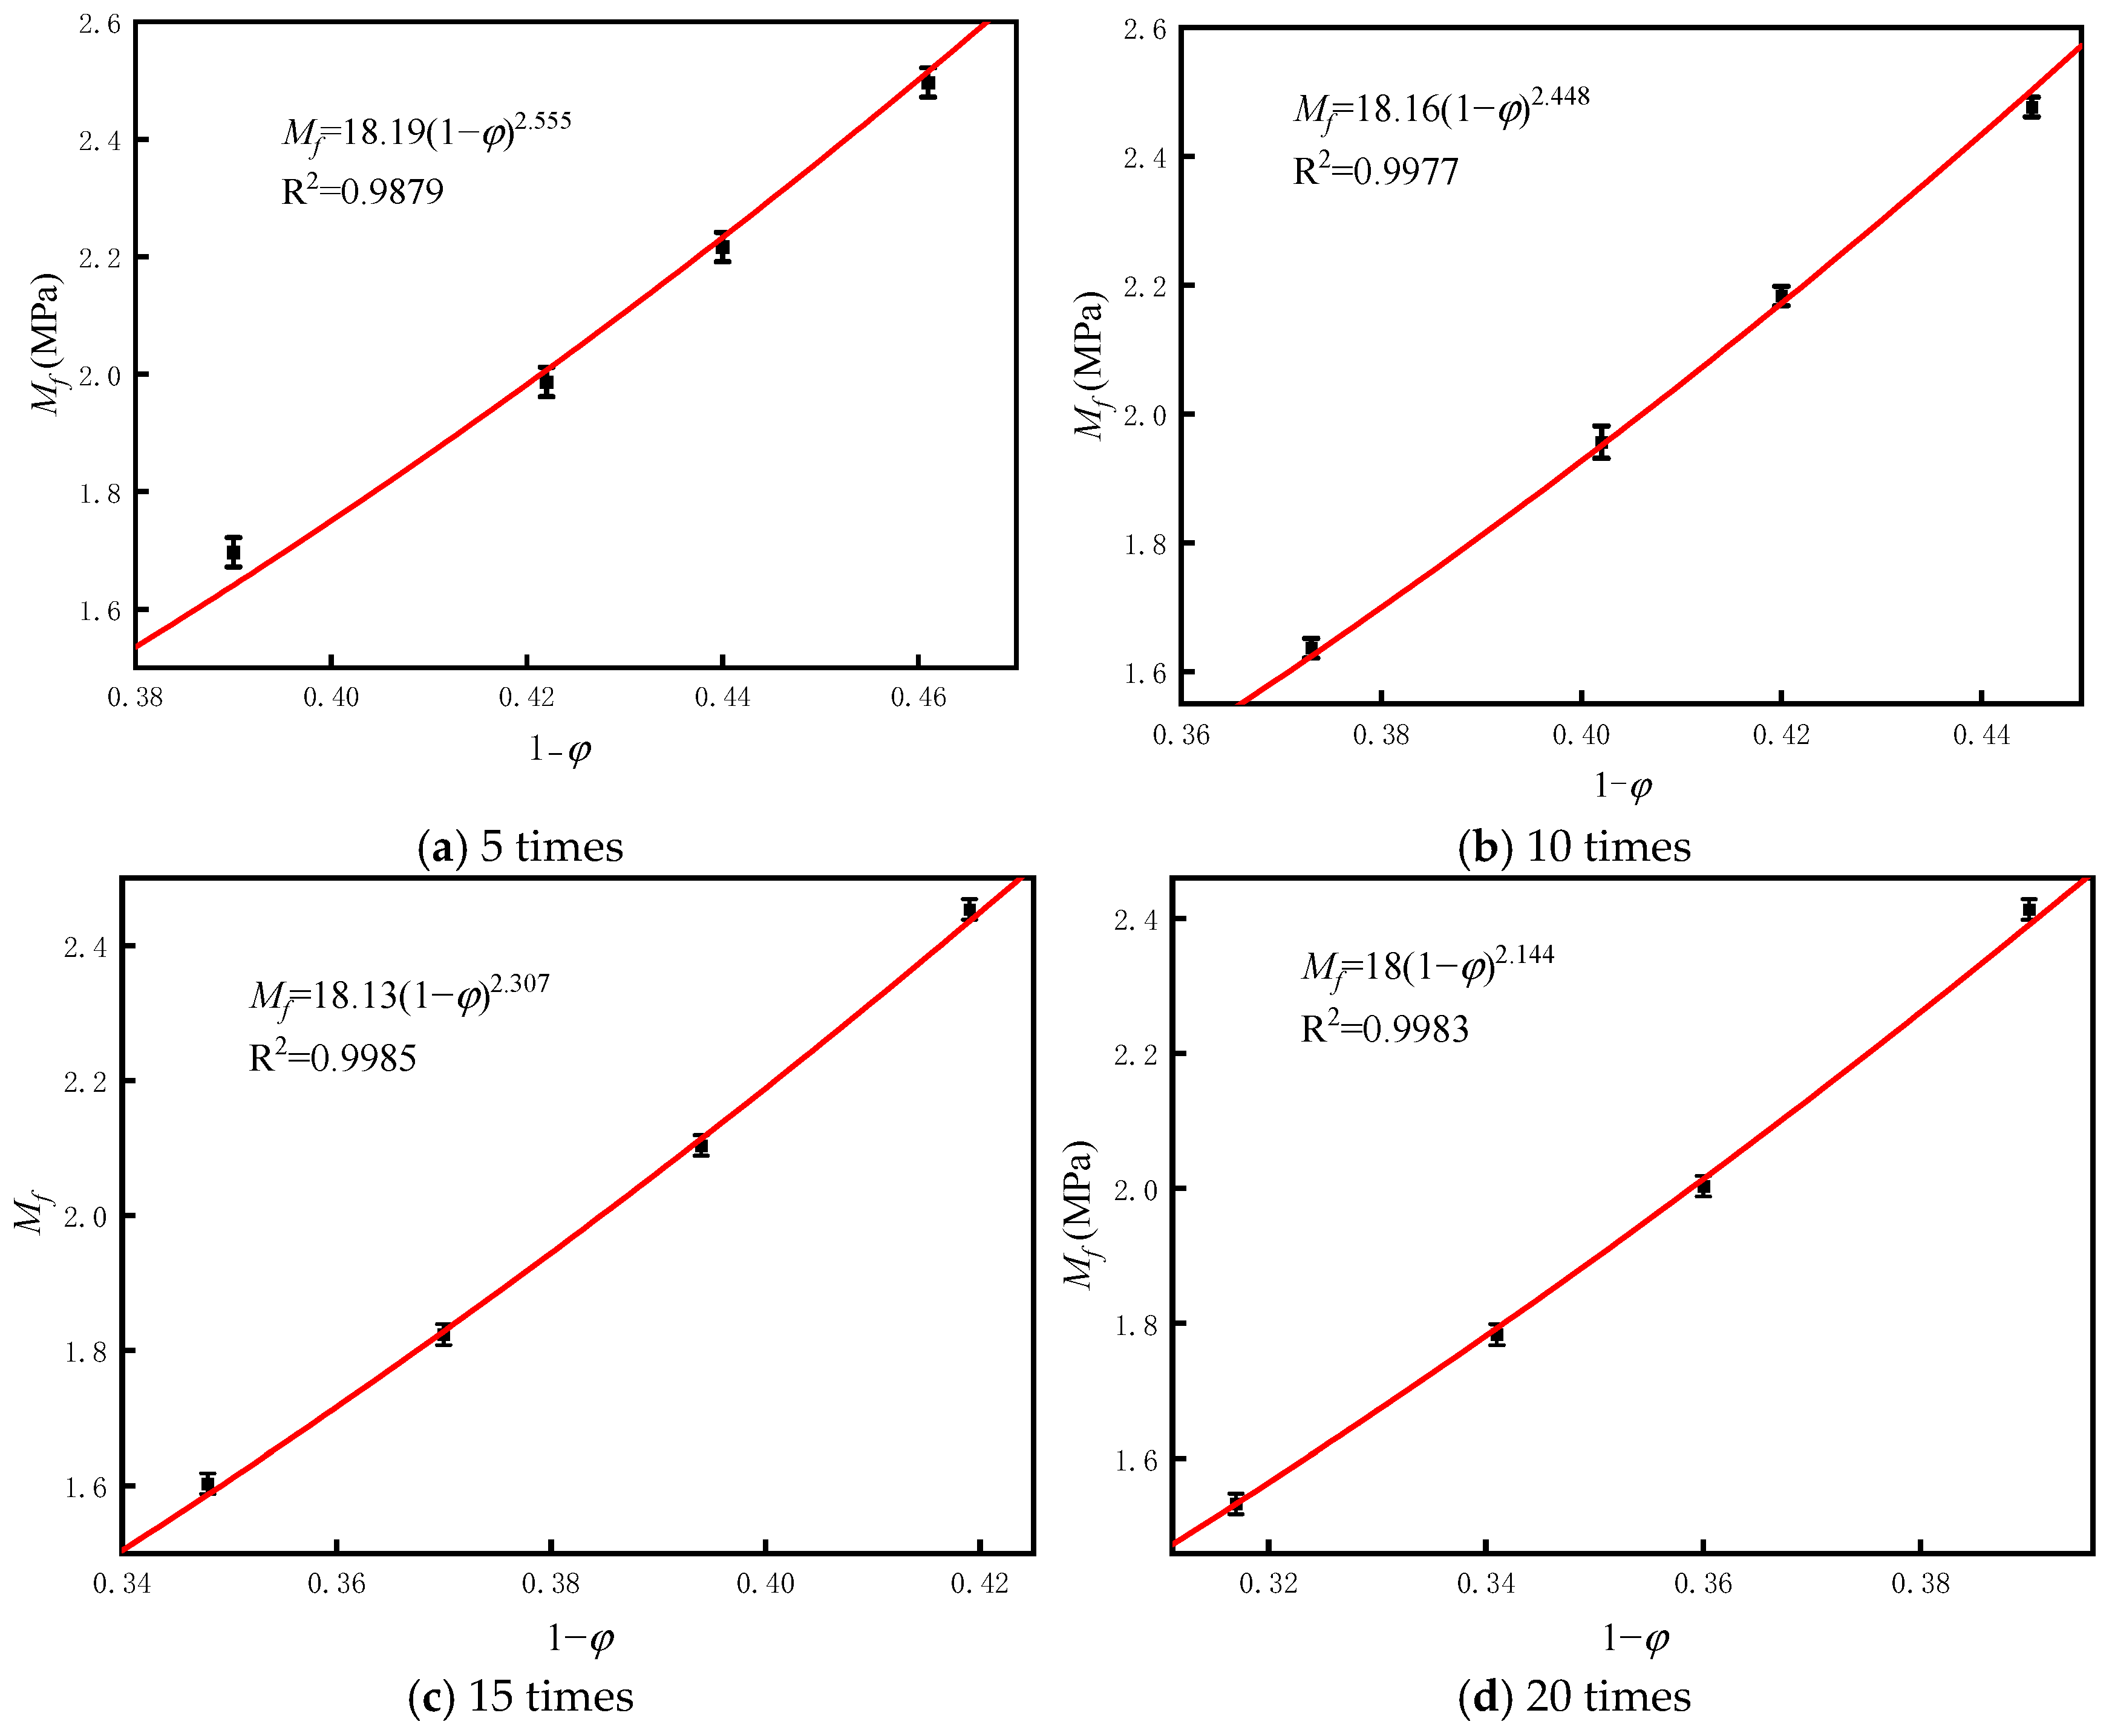
The b value is computed from the fractal dimension measured using the box-counting method. Using the zero-porosity CS obtained experimentally under different cycle counts in water and salt solutions, the porosity of specimens with different dry densities after varying numbers of wet–dry cycles was measured using the Archimedes method. For each group, three replicate specimens were tested, and the results were averaged. The corresponding parameters were then substituted into Equation (1) to establish the relationship between the compressive strength and porosity; the relationship between the CS and porosity of BS-SSFC under varying wet–dry cycle durations in water and salt solutions is ultimately presented in Table 5. The CS prediction formulae of BS-SSFC under different wet–dry cycle times in water and salt solutions were compared with the measured values: the porosities of BS-SSFC with dry densities of 600 kg/m3, 700 kg/m3, 800 kg/m3, and 900 kg/m3 after wet–dry cycles were tested by the weighing method, and the comparison results between their CS prediction values and the measured values in this experiment are shown in Figure 15 and Figure 16. The results indicate that the CS of BS-SSFC decreases nonlinearly with the increase in porosity. The scatter points in the figures are the measured CS of BS-SSFC under different porosities, and the curves are the predicted values under different porosities. It can be seen from the comparison that the predicted CS of BS-SSFC is in good agreement with the measured values in this experiment, indicating that this empirical formula has a certain reliability. However, it should be noted that the correlation between the fractal dimension and strength is not always strong. This indicates that, in addition to the total porosity and fractal characteristics, other factors—such as pore connectivity, pore shape, and the intrinsic strength of the paste matrix—also significantly influence the macroscopic mechanical properties. The proposed model primarily reveals a general relationship between the fractal characteristics of the pore structure and the compressive strength.
The proposed model shares the same form as the Balshin model (Mf = M0(1 − φ)b), but differs in the physical meaning of exponent b. By linking exponent b to the fractal dimension, this study establishes a bridge between the macroscopic and microscopic properties, resulting in a model with enhanced applicability and improved accuracy in predicting compressive strength.
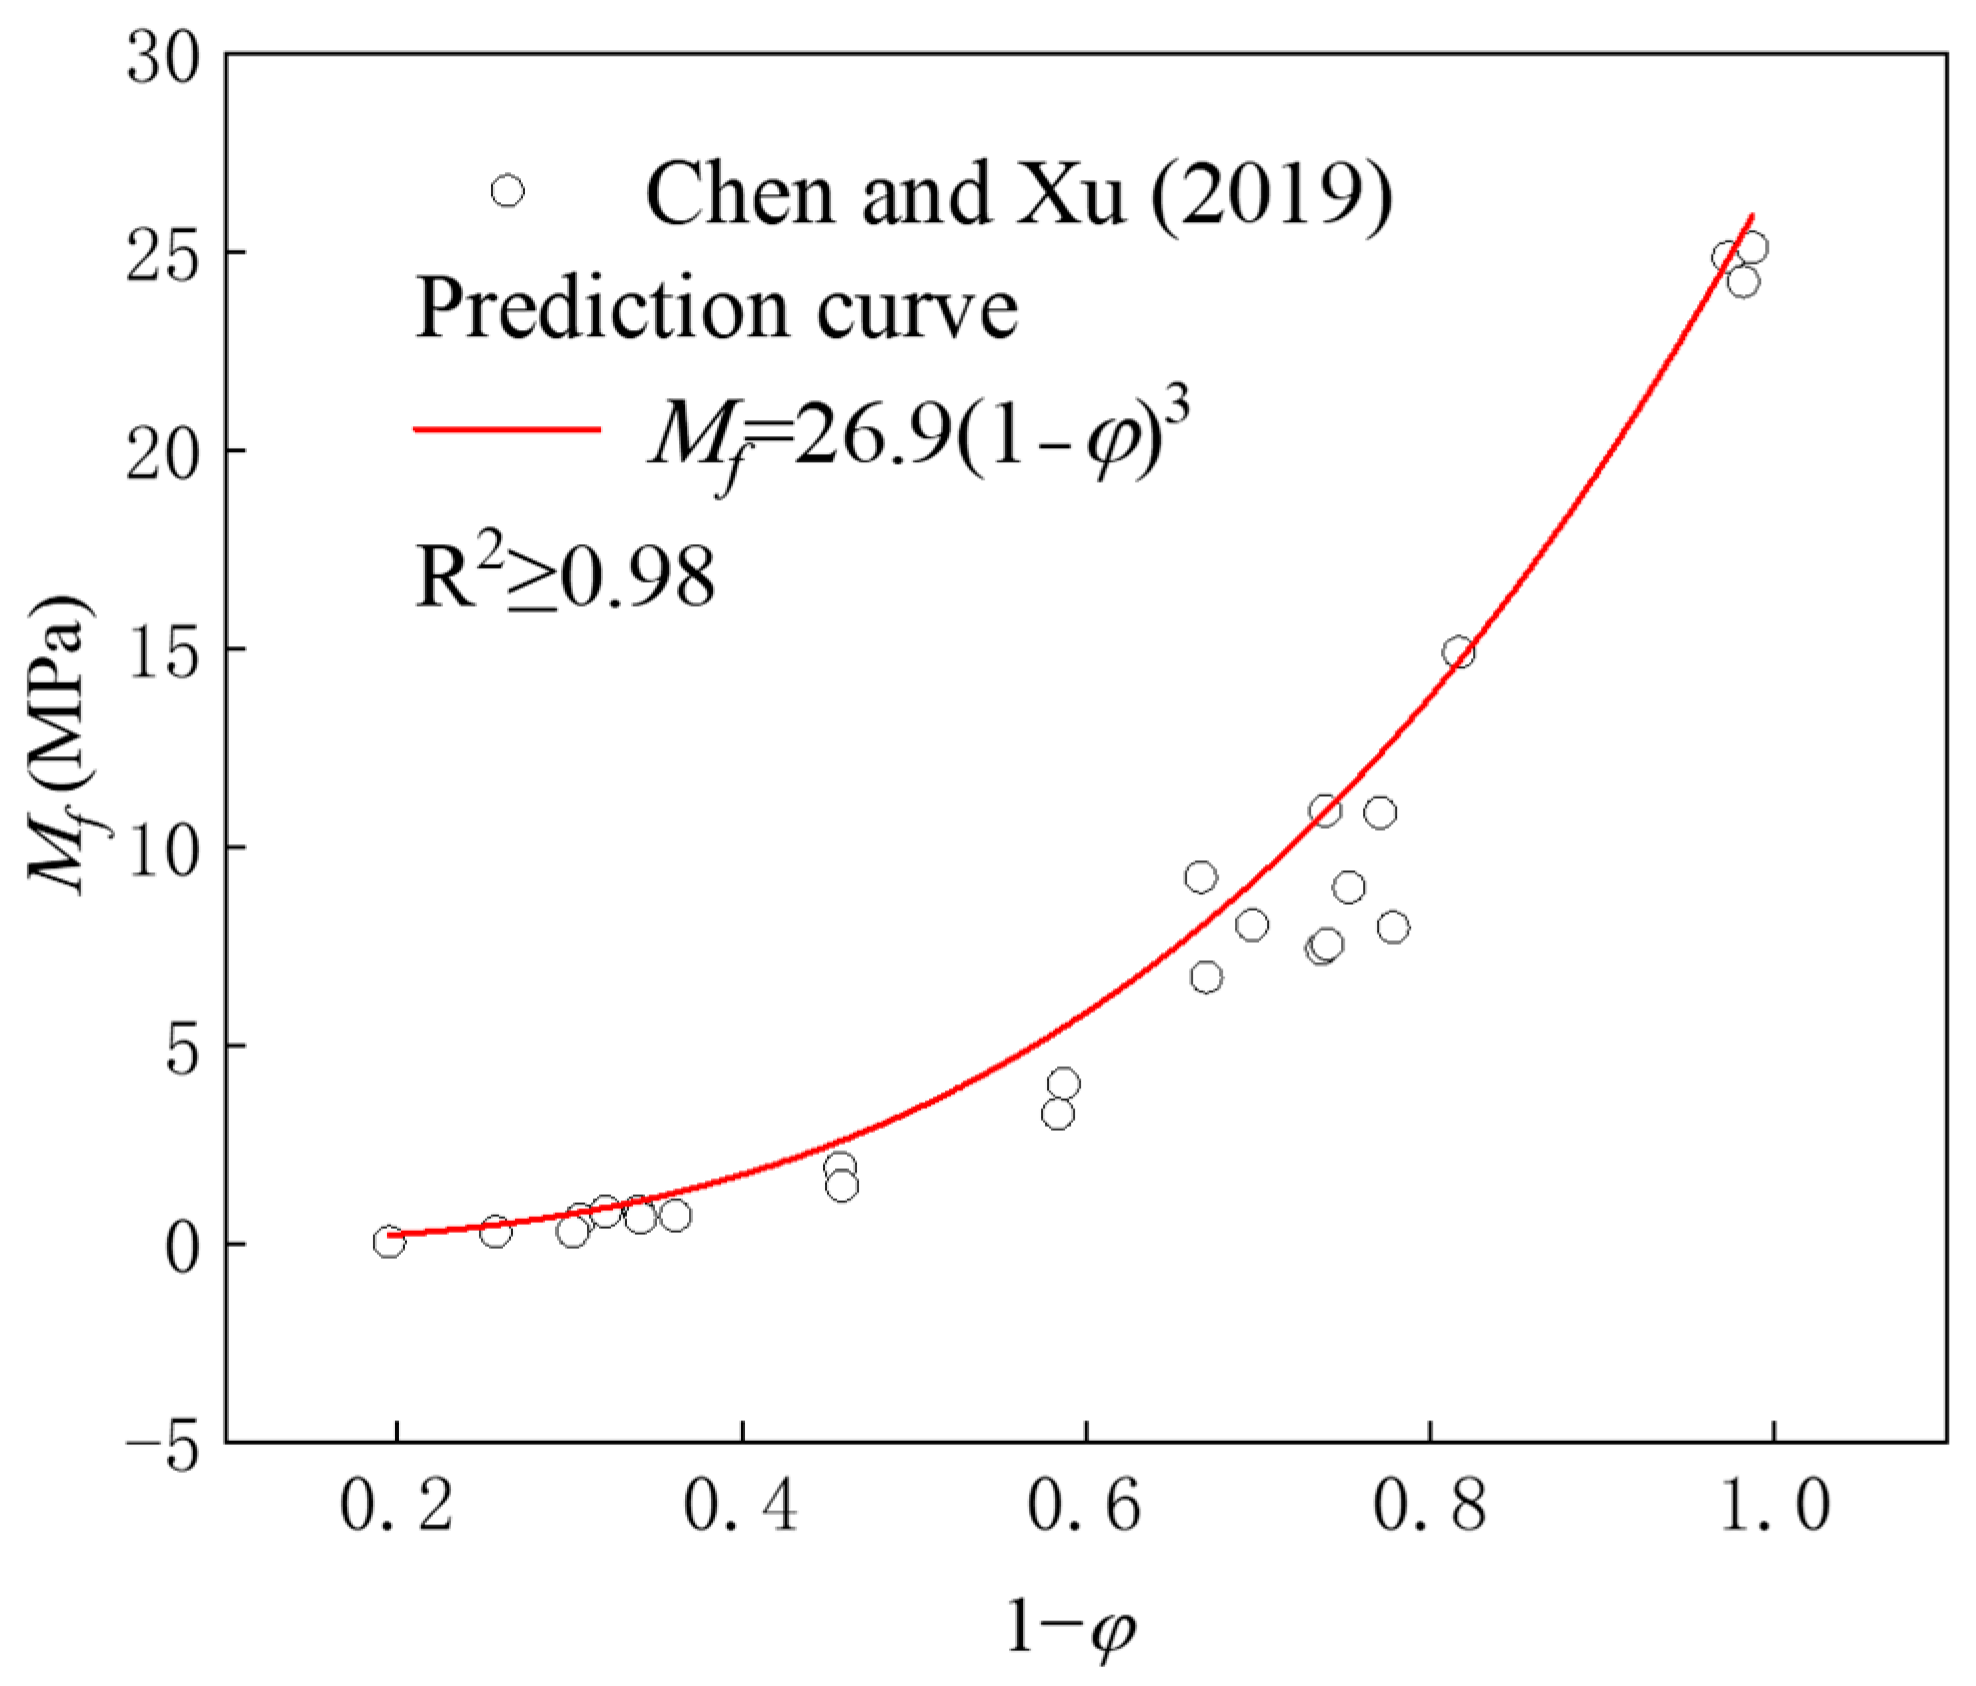
To validate the model’s applicability, data from Ref. [50] were used for verification. As shown in Figure 17, the predicted curve exhibits a good fit with the literature data, with a correlation coefficient R2 ≥ 0.98, demonstrating the strong applicability of the proposed model.
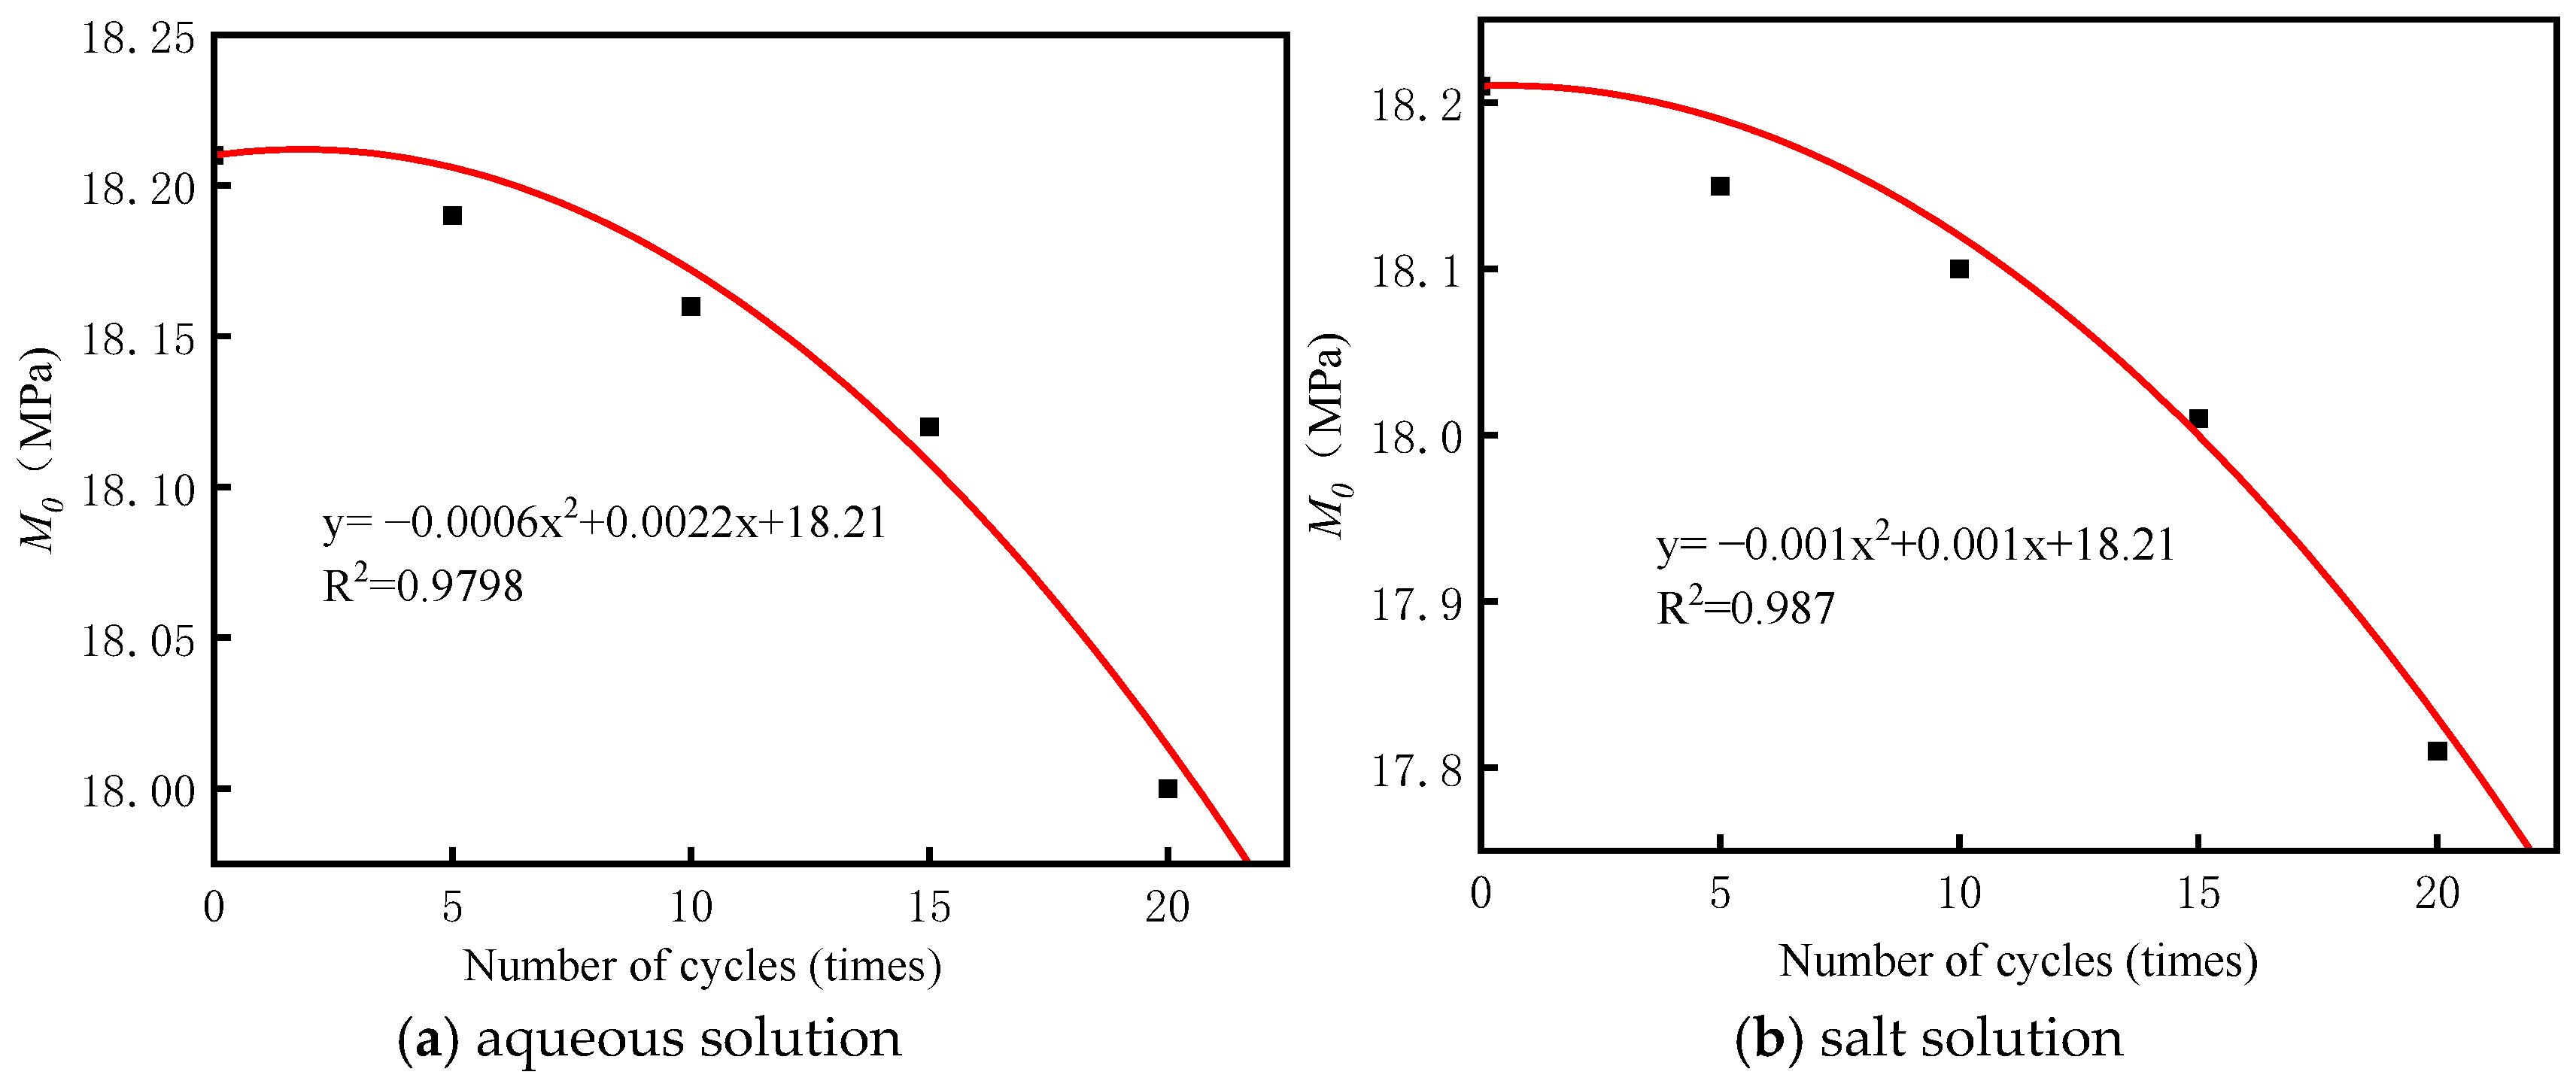
Based on the CS of BS-SSFC at zero porosity under different cycle times obtained from the above experiment, the relationship between the compressive strength (M0) of BS-SSFC at zero porosity and the number of cycles in different wet–dry cycle solutions was established, with the results shown in Figure 18. The fitting relationship between M0 and cycle number n is as follows:
M 0 = α n 2 + β n + γ
where α and β are coefficients related to wet–dry cycle conditions and solution types, whose values are determined by fitting the equation to experimental data and γ is the strength of dense concrete without wet–dry cycle action.
An analysis reveals that the zero-porosity CS of BS-SSFC diminishes steadily as the cycle count rises, with the magnitude of this strength reduction growing more pronounced as the number of cycles increases. This phenomenon arises because, when the cycle count is low, the solution erodes the ideally zero-porosity BS-SSFC only on the specimen surface, causing a minor drop in strength. With the further increase in the number of cycles, the surface of BS-SSFC is eroded and peeled off, the solution erodes into the interior of the sample, and pore cracks occur in the matrix, thereby gradually expanding the degree of strength reduction.
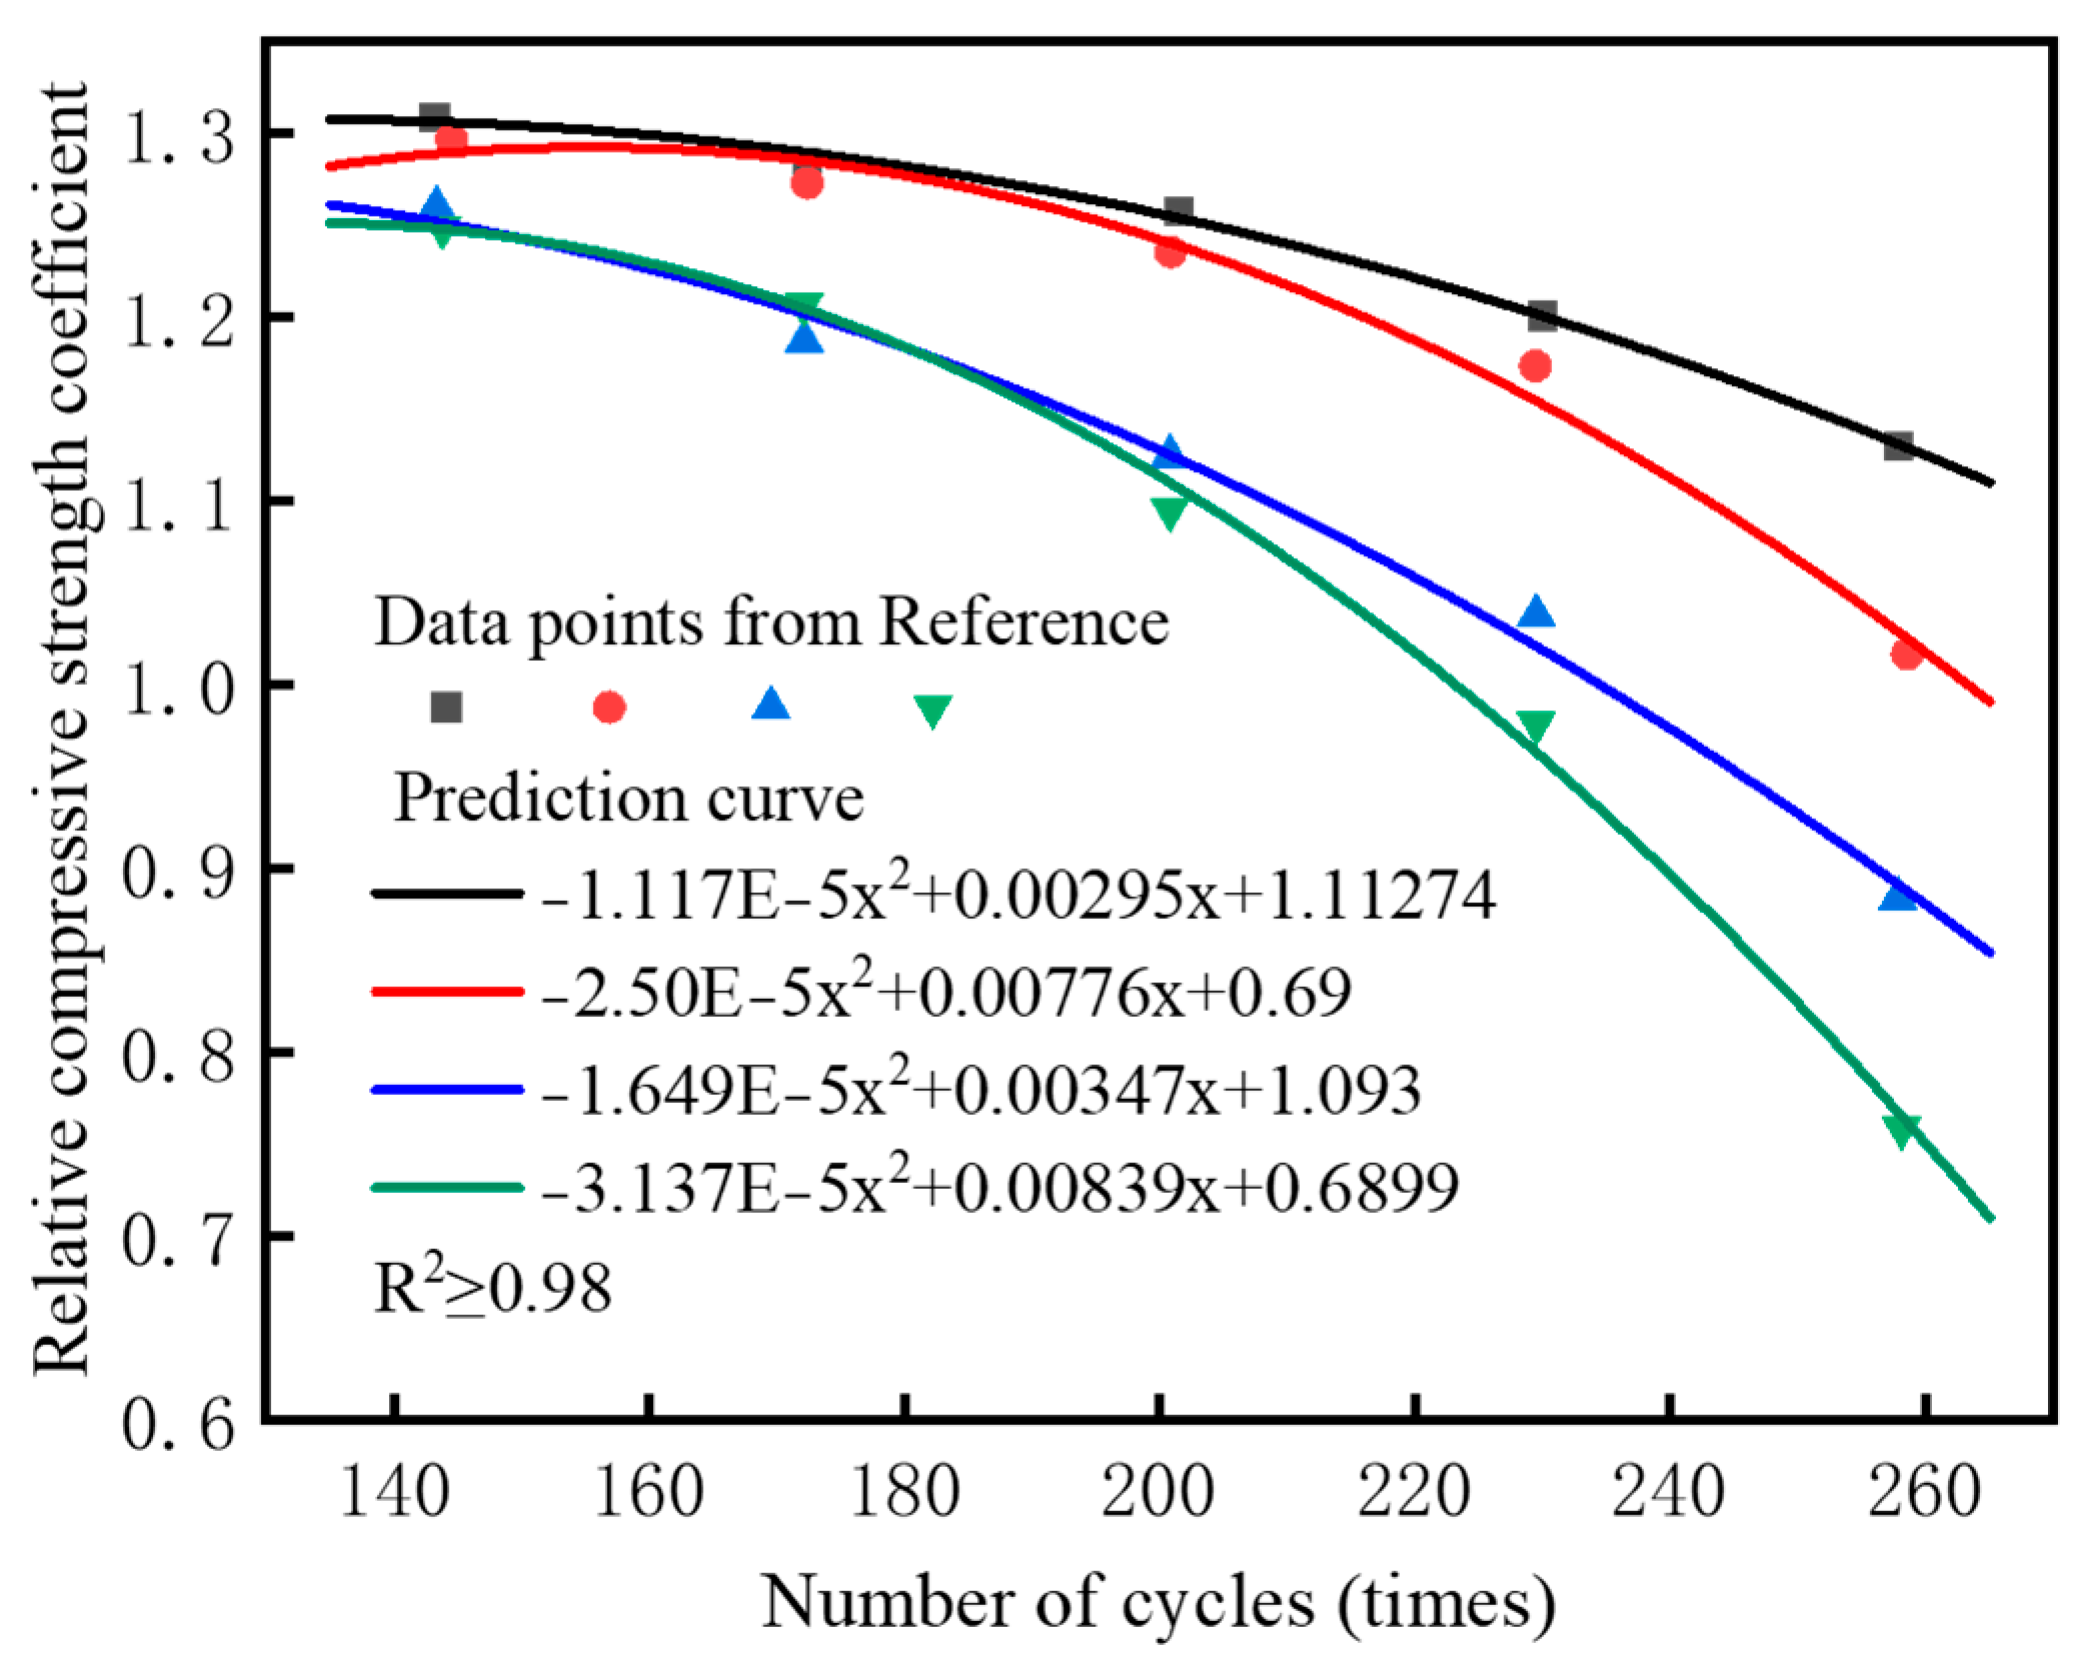
To verify the scientific validity of the above-fitted relationship, data from Reference [51] were subjected to fitting analysis. As shown in Figure 19, which illustrates the relationship between the relative CS of concrete and the number of cycles under different wet–dry ratios, it can be observed that the two present a quadratic polynomial relationship, which is consistent with the relationship fitted in this study. Therefore, the above relationship has a certain scientific validity and applicability.

5. Economic and Environmental Benefit Assessment

This section presents a comparative sustainability assessment between the proposed BS-SSFC and traditional additive-free FC, both with a target dry density of 700 kg/m3. The BS-SSFC mix considered is the optimal proportion identified in this study: 10% steel slag, and 5% bentonite slurry (with a bentonite-to-water ratio of 1:15). Based on 2024 Chinese market prices and standard construction quotas, the material cost for BS-SSFC was calculated to be 167.75 CNY/m3. The substitution of 10% cement with steel slag, a low-cost by-product, resulted in a 6.8% reduction in unit cost compared to the traditional FC benchmark. It is projected that the further optimization of transport logistics in large-scale applications could increase this cost reduction to approximately 8.3%.
A cradle-to-gate life cycle assessment (LCA) was conducted, focusing on the core stages of raw material production, transportation, and mixing. Using carbon emission factors from the IPCC and Chinese national standards (GB/T 32150-2015 [52]), the carbon footprint of BS-SSFC was estimated at 230.60 kg CO2/m3. This represents a significant reduction of 9.9% compared to traditional FC. Scaling these results to an annual production volume of 100,000 m3, the use of BS-SSFC would lead to an annual carbon emission reduction of approximately 2540 metric tons of CO2. Concurrently, this production scale would facilitate the utilization of about 7000 metric tons of steel slag, promoting industrial solid waste valorization.
In summary, BS-SSFC demonstrates a superior sustainability profile. Beyond the performance enhancement of an 8.4% lower strength loss rate after 20 salt-solution wet–dry cycles, it achieves a synergistic optimization of economic savings, reduced environmental impact, and waste resource recovery. These advantages strongly align with the strategic “Dual Carbon” goals and the ongoing pursuit of low-carbon, sustainable development in civil engineering materials.

6. Conclusions

This study aims to “enhance the environmental durability of foam concrete”. Bentonite slurry–steel slag composite foam concrete was prepared by the physical foaming method. After determining the optimal mix ratio based on the 7-day unconfined compressive strength, combined with a water/salt solution dry-wet cycle test, MIP test, XRD test, scanning electron microscope observation test, and fractal dimension analysis, we systematically explore the synergistic modification mechanism of steel slag and bentonite slurry, as well as the relationship between the compressive strength of BS-SSFC and porosity and the number of cycles. The results show that this composite modification scheme effectively overcomes the limitations of a single modification—the skeletal filling of steel slag and the interface densification of bentonite slurry work together to optimize the pore structure, inhibit crack initiation, significantly enhance the resistance of foam concrete to water and salt solution erosion, and successfully alleviate the durability degradation problem caused by dry–wet cycles. Based on this, this study draws the following specific conclusions:
(1)
Under wet–dry cycling conditions, the strength of BS-SSFC with different dry densities gradually decreases as the number of cycles increases; the higher the dry density, the greater the strength retention rate. After wet–dry cycles in different solutions, the order of the CS loss from largest to smallest is as follows: salt solution > aqueous solution.
(2)
Incorporating BS and SS into FC can effectively improve its resistance to chemical erosion: as the number of cycles increases, SS can continuously participate in hydration reactions, thereby enhancing the material’s strength; the addition of BS improves the plasticity of the material, enabling it to maintain a high strength retention rate after wet–dry cycles.
(3)
The fractal dimension of BS-SSFC in different solutions decreases slightly with the increase in the number of wet–dry cycles. By calculating the fractal dimensions under different cycle times using the box-counting method and based on fractal theory, it is found that, in water and salt solutions, the relationship between the compressive strength and porosity of BS-SSFC under different wet–dry cycle times conforms to a specific regularity; meanwhile, the compressive strength at zero porosity has a specific correlation with the number of cycles (n). This regularity is also verified by the experimental data of other researchers.

7. Research Deficiencies and Prospects

This study reveals the durability improvement mechanism of BS-SSFC under dry and wet cycles, but there are still limitations. The number of cycles (20 times) is limited and fails to reveal the long-term performance evolution and the steady-state degradation critical point. The environmental factors are relatively simple and do not take into account the coupling effects of multiple factors such as carbonization and freeze–thaw. Future research can (1) conduct more than 50 long-term tests and establish a life prediction model in combination with damage mechanics; and (2) conduct multi-factor coupling tests such as dry–wet, carbonization, and freeze–thaw to more accurately assess its durability in complex environments.

Author Contributions

Conceptualization, G.X. and F.S.; methodology, G.X., H.Z. and Y.L.; validation, F.S., Y.B. and Y.F.; funding acquisition, H.Z. and Y.F.; writing—original draft preparation, F.S., Y.B., L.L. and Y.M.; writing—review and editing, G.X., H.Z. and Y.F.; data curation, L.L. and Y.M.; software, Y.B. and Y.L. All authors have read and agreed to the published version of the manuscript.

Funding

This research was funded by the Guangxi Science and Technology Program (Guike ZY24212023), Guangxi Key Research and Development Program (Guike AB23026071), and the University Synergy Innovation Program of Anhui Province (No. GXXT-2023-061).

Data Availability Statement

The data presented in this study are available on request from the corresponding author on reasonable request. The data are not publicly available due to privacy policies.

Conflicts of Interest

Authors Hongri Zhang and Youjun Li were employed by the company Guangxi Transportation Science & Technology Group Co., Ltd. The remaining authors declare that the research was conducted in the absence of any commercial or financial relationships that could be construed as a potential conflict of interest.

References

  1. Raj, A.; Sathyan, D.; Mini, K.M. Physical and functional characteristics of foam concrete: A review. Constr. Build. Mater. 2019, 221, 787–799. [Google Scholar] [CrossRef]
  2. Ramamurthy, K.; Kunhanandan Nambiar, E.K.; Indu Siva Ranjani, G. A classification of studies on properties of foam concrete. Cem. Concr. Compos. 2009, 31, 388–396. [Google Scholar] [CrossRef]
  3. Lu, J.-X. Recent advances in high strength lightweight concrete: From development strategies to practical applications. Constr. Build. Mater. 2023, 400, 132905. [Google Scholar] [CrossRef]
  4. Wang, R.; Zhang, Q.; Li, Y. Deterioration of concrete under the coupling effects of freeze–thaw cycles and other actions: A review. Constr. Build. Mater. 2022, 319, 126045. [Google Scholar] [CrossRef]
  5. Zhou, G.; Su, R.K.L. A Review on Durability of Foam Concrete. Buildings 2023, 13, 1880. [Google Scholar] [CrossRef]
  6. Shi, X.; Huang, J.; Su, Q. Experimental and numerical analyses of lightweight foamed concrete as filler for widening embankment. Constr. Build. Mater. 2020, 250, 118897. [Google Scholar] [CrossRef]
  7. Bader, M.A. Performance of concrete in a coastal environment. Cem. Concr. Compos. 2003, 25, 539–548. [Google Scholar] [CrossRef]
  8. Choe, G.; Kim, G.; Yoon, M.; Hwang, E.; Nam, J.; Guncunski, N. Effect of moisture migration and water vapor pressure build-up with the heating rate on concrete spalling type. Cem. Concr. Res. 2019, 116, 1–10. [Google Scholar] [CrossRef]
  9. Mohr, B.J.; Nanko, H.; Kurtis, K.E. Durability of kraft pulp fiber–cement composites to wet/dry cycling. Cem. Concr. Compos. 2005, 27, 435–448. [Google Scholar] [CrossRef]
  10. Liu, F.; Zhang, T.; Luo, T.; Zhou, M.; Zhang, K.; Ma, W. Study on the Deterioration of Concrete under Dry–Wet Cycle and Sulfate Attack. Materials 2020, 13, 4095. [Google Scholar] [CrossRef] [PubMed]
  11. Mahzabin, M.S.; Hock, L.J.; Hossain, M.S.; Kang, L.S. The influence of addition of treated kenaf fibre in the production and properties of fibre reinforced foamed composite. Constr. Build. Mater. 2018, 178, 518–528. [Google Scholar] [CrossRef]
  12. Tang, R.; Wei, Q.; Zhang, K.; Jiang, S.; Shen, Z.; Zhang, Y.; Chow, C.W.K. Preparation and performance analysis of recycled PET fiber reinforced recycled foamed concrete. J. Build. Eng. 2022, 57, 104948. [Google Scholar] [CrossRef]
  13. Zhou, D.; Gao, H.; Liao, H.; Fang, L.; Cheng, F. Enhancing the performance of foam concrete containing fly ash and steel slag via a pressure foaming process. J. Clean. Prod. 2021, 329, 129664. [Google Scholar] [CrossRef]
  14. Şeker, B.Ş.; Gökçe, M.; Toklu, K. Investigation of the effect of silica fume and synthetic foam additive on cell structure in ultra-low density foam concrete. Case Stud. Constr. Mater. 2022, 16, e01062. [Google Scholar] [CrossRef]
  15. Zhang, X.; Lu, J.-X.; Poon, C.S. Enhanced performance and sustainability of foam concrete through shale aggregate integration. Constr. Build. Mater. 2025, 479, 141442. [Google Scholar] [CrossRef]
  16. Ying, L.; Yu, P.; Wang, F.; Jiang, P. Evaluation of Integral and Surface Hydrophobic Modification on Permeation Resistance of Foam Concrete. Coatings 2025, 15, 854. [Google Scholar] [CrossRef]
  17. Wu, S.; Zhang, W.; Zhang, Y.; Wang, C. Arresting properties of polypropylene fiber-reinforced foamed concrete under wet-dry cycles. Constr. Build. Mater. 2024, 427, 136233. [Google Scholar] [CrossRef]
  18. Othuman Mydin, M.A.; Jagadesh, P.; Bahrami, A.; Dulaimi, A.; Onuralp Özkılıç, Y.; Omar, R. Enhanced fresh and hardened properties of foamed concrete modified with nano-silica. Heliyon 2024, 10, e25858. [Google Scholar] [CrossRef]
  19. Othuman Mydin, M.A.; Mohd Nawi, M.N.; Mohamed, O.; Sari, M.W. Mechanical Properties of Lightweight Foamed Concrete Modified with Magnetite (Fe3O4) Nanoparticles. Materials 2022, 15, 5911. [Google Scholar] [CrossRef] [PubMed]
  20. Alani, S.; Hassan, M.S.; Jaber, A.A.; Ali, I.M. Effects of elevated temperatures on strength and microstructure of mortar containing nano-calcined montmorillonite clay. Constr. Build. Mater. 2020, 263, 120895. [Google Scholar] [CrossRef]
  21. Khankhaje, E.; Kim, T.; Jang, H.; Kim, C.-S.; Kim, J.; Rafieizonooz, M. A review of utilization of industrial waste materials as cement replacement in pervious concrete: An alternative approach to sustainable pervious concrete production. Heliyon 2024, 10, e26188. [Google Scholar] [CrossRef]
  22. Yang, P.; Qi, Y.; Chen, R. Preparation of High-Performance Cementitious Materials from Industrial Solid Wastes. Eng. Proc. 2023, 38, 50. [Google Scholar] [CrossRef]
  23. Liu, X.; Ni, C.; Meng, K.; Zhang, L.; Liu, D.; Sun, L. Strengthening mechanism of lightweight cellular concrete filled with fly ash. Constr. Build. Mater. 2020, 251, 118954. [Google Scholar] [CrossRef]
  24. Cai, X.; Cao, Z.; Sun, J.; Wang, H.; Wu, S. Influence of Steel Slag on Properties of Cement-Based Materials: A Review. Buildings 2024, 14, 2985. [Google Scholar] [CrossRef]
  25. Devi, V.S.; Gnanavel, B.K. Properties of Concrete Manufactured Using Steel Slag. Procedia Eng. 2014, 97, 95–104. [Google Scholar] [CrossRef]
  26. Andrade, H.D.; de Carvalho, J.M.F.; Costa, L.C.B.; Elói, F.P.d.F.; e Silva, K.D.D.C.; Peixoto, R.A.F. Mechanical performance and resistance to carbonation of steel slag reinforced concrete. Constr. Build. Mater. 2021, 298, 123910. [Google Scholar] [CrossRef]
  27. Yi, H.; Xu, G.; Cheng, H.; Wang, J.; Wan, Y.; Chen, H. An Overview of Utilization of Steel Slag. Procedia Environ. Sci. 2012, 16, 791–801. [Google Scholar] [CrossRef]
  28. Jing, W.; Jiang, J.; Ding, S.; Duan, P. Hydration and Microstructure of Steel Slag as Cementitious Material and Fine Aggregate in Mortar. Molecules 2020, 25, 4456. [Google Scholar] [CrossRef]
  29. Shi, C. Steel Slag—Its Production, Processing, Characteristics, and Cementitious Properties. J. Mater. Civ. Eng. 2004, 16, 230–236. [Google Scholar] [CrossRef]
  30. Luo, Z.; He, F.; Zhang, W.; Xiao, Y.; Xie, J.; Sun, R.; Xie, M. Effects of fluoride content on structure and properties of steel slag glass-ceramics. Mater. Chem. Phys. 2020, 242, 122531. [Google Scholar] [CrossRef]
  31. Jiang, L.; Bao, Y.; Yang, Q.; Chen, Y.; Liu, G.; Han, F.; Wei, J.; Engström, F.; Deng, J. Formation of Spinel Phases in Oxidized BOF Slag under Different Cooling Conditions. Steel Res. Int. 2017, 88, 1700066. [Google Scholar] [CrossRef]
  32. Lima-Guerra, D.J.; Mello, I.; Resende, R.; Silva, R. Use of Bentonite and Organobentonite as Alternatives of Partial Substitution of Cement in Concrete Manufacturing. Int. J. Concr. Struct. Mater. 2014, 8, 15–26. [Google Scholar] [CrossRef]
  33. Ashraf, M.; Iqbal, M.F.; Rauf, M.; Ashraf, M.U.; Ulhaq, A.; Muhammad, H.; Liu, Q. Developing a sustainable concrete incorporating bentonite clay and silica fume: Mechanical and durability performance. J. Clean. Prod. 2022, 337, 130315. [Google Scholar] [CrossRef]
  34. Ahmad, J.; Kontoleon, K.J.; Al-Mulali, M.Z.; Shaik, S.; Hechmi El Ouni, M.; El-Shorbagy, M.A. Partial Substitution of Binding Material by Bentonite Clay (BC) in Concrete: A Review. Buildings 2022, 12, 634. [Google Scholar] [CrossRef]
  35. Memon, S.A.; Arsalan, R.; Khan, S.; Lo, T.Y. Utilization of Pakistani bentonite as partial replacement of cement in concrete. Constr. Build. Mater. 2012, 30, 237–242. [Google Scholar] [CrossRef]
  36. Masood, B.; Elahi, A.; Barbhuiya, S.; Ali, B. Mechanical and durability performance of recycled aggregate concrete incorporating low calcium bentonite. Constr. Build. Mater. 2020, 237, 117760. [Google Scholar] [CrossRef]
  37. Keke, L.; Yong, L.; Liuliu, X.; Junjie, Z.; Kangning, L.; Dingqiang, F.; Rui, Y. Rheological characteristics of Ultra-High performance concrete (UHPC) incorporating bentonite. Constr. Build. Mater. 2022, 349, 128793. [Google Scholar] [CrossRef]
  38. Xie, Y.; Li, J.; Lu, Z.; Jiang, J.; Niu, Y. Effects of bentonite slurry on air-void structure and properties of foamed concrete. Constr. Build. Mater. 2018, 179, 207–219. [Google Scholar] [CrossRef]
  39. Fernández, R.; Ruiz, A.I.; Cuevas, J. Formation of C-A-S-H phases from the interaction between concrete or cement and bentonite. Clay Miner. 2016, 51, 223–235. [Google Scholar] [CrossRef]
  40. GB/T 175-2023; Common Portland Cement. China Building Materials Industry Press: Beijing, China, 2023.
  41. GB/T 17671-2020; Test Method for Strength of Cement Mortar (ISO Method). China Building Materials Industry Press: Beijing, China, 2020.
  42. YB/T 4328-2012; Methods for Chemical Analysis of Steel Slag. Metallurgical Industry Press: Beijing, China, 2012.
  43. GB/T 24763-2009; Steel Slag Used in Cement. China Building Materials Industry Press: Beijing, China, 2009.
  44. JGJ 63-2006; Standard for Water of Concrete. China Architecture & Building Press: Beijing, China, 2006.
  45. JG/T 266-2011; Foamed Concrete. China Architecture & Building Press: Beijing, China, 2011.
  46. Yang, X.; Xu, S.; Zhao, Z.; Lv, Y. Strength, Durability, and Microstructure of Foamed Concrete Prepared Using Special Soil and Slag. Sustainability 2022, 14, 14952. [Google Scholar] [CrossRef]
  47. Baozhen, S.; Erda, S. Relation between properties of aerated concrete and its porosity and hydrates. In Pore Structure and Construction Materials Properties, Proceedings of the 1st RILEM International Conference on Mineral Carbonation for Cement and Concrete, Aachen, Germany, 16–17 April 2024; Chapman and Hall Press: London, UK; Versailles, France, 1987; pp. 232–237. [Google Scholar]
  48. Balshin, M.Y. Relation of mechanical properties of powder metals and their porosity and ultimate properties of porous metal-ceramic materials. Dokl. Akad. Nauk. 1949, 67, 831–834. [Google Scholar]
  49. Xiang, G.; Song, D.; Li, H.; Jalal, F.E.; Wang, H.; Zhou, Y. Investigation on Preparation and Compressive Strength Model of Steel Slag Foam Concrete. J. Build. Eng. 2023, 72, 106548. [Google Scholar] [CrossRef]
  50. Chen, Y.; Xu, Y.F. Compressive Strength of Fractal-Textured Foamed Concrete. Fractals 2019, 27, 1940003. [Google Scholar] [CrossRef]
  51. Guo, J.-J.; Wang, K.; Guo, T.; Yang, Z.-Y.; Zhang, P. Effect of Dry–Wet Ratio on Properties of Concrete Under Sulfate Attack. Materials 2019, 12, 2755. [Google Scholar] [CrossRef] [PubMed]
  52. GB/T 32150-2015; Industrial Enterprises Greenhouse Gas Emissions Accounting and Reporting Guideline. Standards Press of China: Beijing, China, 2015.
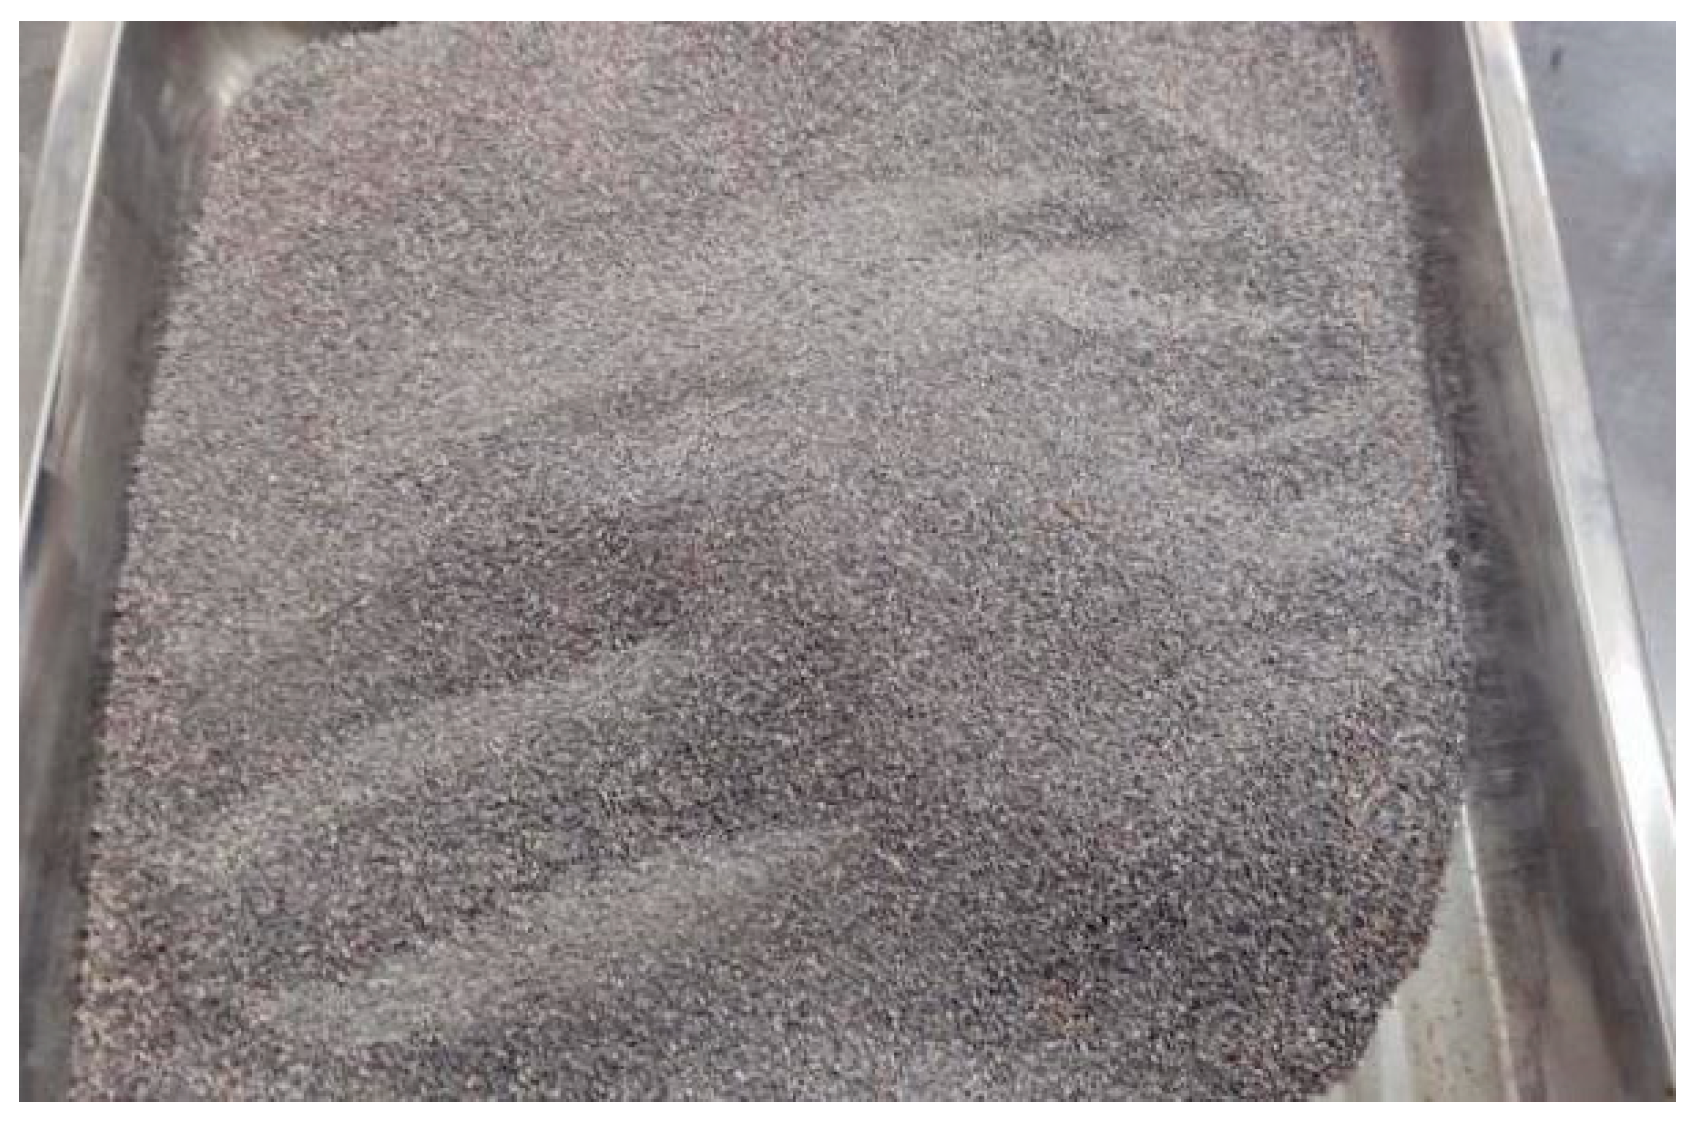
Figure 1. Steel slag.
Buildings 15 03550 g001
Figure 2. Bentonite slurry.
Buildings 15 03550 g002
Figure 3. Bentonite used in this test.
Buildings 15 03550 g003
Figure 4. XRD pattern of bentonite (S—montmorillonite, C—cristobalite, M—mica, Z—zeolite, and Q—quartz).
Buildings 15 03550 g004
Figure 5. Preparation process of BS-SSFC.
Buildings 15 03550 g005
Figure 6. Compressive strength of BS-SSFC at different ages and mix proportions. (Data points are shown as the mean ± standard deviation (n = 3)).
Buildings 15 03550 g006
Figure 7. The variation law of CS of BS-SSFC under dry–wet cycles of water and salt solutions with different dry densities (data points are shown as the mean ± standard deviation (n = 3)).
Buildings 15 03550 g007
Figure 8. Diagram of the variation law of the optimal mix ratio of water and salt solution under a dry density of 700 kg/m3 and the CS of the control group with the number of cycles (data points are shown as the mean ± standard deviation (n = 3)).
Buildings 15 03550 g008
Figure 9. The pore size distribution of BS-SSFC after standard curing for 7 days and the control sample.
Buildings 15 03550 g009
Figure 10. XRD results of BS-SSFC and the control group.
Buildings 15 03550 g010
Figure 11. SEM comparison between experimental group and control group under aqueous solution wet–dry cycles.
Buildings 15 03550 g011aBuildings 15 03550 g011b
Figure 12. SEM comparison between experimental group and control group under salt solution wet–dry cycles.
Buildings 15 03550 g012aBuildings 15 03550 g012b
Figure 13. Wet–dry cycles in aqueous solution.
Buildings 15 03550 g013aBuildings 15 03550 g013b
Figure 14. Wet–dry cycles in salt solution.
Buildings 15 03550 g014
Figure 15. The relationship between the CS and porosity of BS-SSFC under different cycle times of aqueous solution circulation conditions (data points are shown as the mean ± standard deviation (n = 3)). (The points in the figure represent the measured data).
Buildings 15 03550 g015
Figure 16. The relationship between the CS and porosity of BS-SSFC under different cycle times of salt solution circulation conditions (data points are shown as the mean ± standard deviation (n = 3)). (The points in the figure represent the measured data).
Buildings 15 03550 g016
Figure 17. Comparison between literature data [50] and the fitted curve.
Buildings 15 03550 g017
Figure 18. The relationship between the CS of BS-SSFC with 0 porosity under different solution cycles and the number of cycles. (The points in the figure represent the measured data).
Buildings 15 03550 g018
Figure 19. Data fitting of literature papers [51].
Buildings 15 03550 g019
Table 1. Chemical composition of cement and SS.
MaterialCaOSiO2Al2O3Fe2O3MgOTiO2SO3K2OP2O5MnOOther
Cement57.2123.546.124.572.510.612.310.85--2.28
Steel slag58.8512.85.2114.392.630.920.31-1.512.21.18
Table 2. Cement performance indicators *.
CementViscosityInitial
Coagulation/min
Final
Condensation/min
Compressive Strength/MPaFlexural Strength/MPa
3d28d3d28d
P.O.42.526.815024827.155.35.58.6
* The performance indicators of cement used in this research (test standards: GB/T 175-2023 [40], GB/T 17671-2020 [41]).
Table 3. Relationship between cycle times and fractal dimensions in aqueous solution.
Number of Dry–Wet Cycles5101520
Two-dimensional fractal dimension (D1)1.769 ± 0.0021.760 ± 0.0021.748 ± 0.0021.731 ± 0.002
Three-dimensional fractal dimension D2.7692.7602.7482.731
Table 4. Relationship between cycle times and fractal dimensions in salt solution.
Number of Dry–Wet Cycles5101520
Two-dimensional fractal dimension (D1)1.757 ± 0.0031.747 ± 0.0021.739 ± 0.0021.727 ± 0.001
Three-dimensional fractal dimension (D)2.7572.7472.7392.727
Table 5. Relationships between CS and porosity under different cycle times.
SolutionNumber of Cycles/TimesM0/MPaFractal Dimension (D)bMf-φ Relation
Aqueous solution518.192.7692.555Mf = 18.19(1 − φ)2.555
1018.162.7602.448Mf = 18.16(1 − φ)2.448
1518.122.7482.307Mf = 18.12(1 − φ)2.307
2018.002.7312.144Mf = 18.00(1 − φ)2.144
Salt solution518.152.7572.414Mf = 18.15(1 − φ)2.414
1018.12.7472.306Mf = 18.1(1 − φ)2.306
1518.012.7392.219Mf = 18.01(1 − φ)2.219
2017.812.7272.110Mf = 17.81(1 − φ)2.110
Disclaimer/Publisher’s Note: The statements, opinions and data contained in all publications are solely those of the individual author(s) and contributor(s) and not of MDPI and/or the editor(s). MDPI and/or the editor(s) disclaim responsibility for any injury to people or property resulting from any ideas, methods, instructions or products referred to in the content.