Article

A Transformer-Based Multi-Scale Semantic Extraction Change Detection Network for Building Change Application

School of Geomatics and Urban Spatial Informatics, Beijing University of Civil Engineering and Architecture, Beijing 102616, China
*
Author to whom correspondence should be addressed.
Buildings 2025, 15(19), 3549; https://doi.org/10.3390/buildings15193549
Submission received: 18 August 2025 / Revised: 18 September 2025 / Accepted: 25 September 2025 / Published: 2 October 2025
(This article belongs to the Special Issue Big Data and Machine/Deep Learning in Construction)

Abstract

Building change detection involves identifying areas where buildings have changed by comparing multi-temporal remote sensing imagery of the same geographical region. Recent advances in Transformer-based methods have significantly improved remote sensing change detection. However, current Transformer models still exhibit persistent limitations in effectively extracting multi-scale semantic features within complex scenarios. To more effectively extract multi-scale semantic features in complex scenes, we propose a novel model, which is the Transformer-based Multi-Scale Semantic Extraction Change Detection Network (MSSE-CDNet). The model employs a Siamese network architecture to enable precise change recognition. MSSE-CDNet comprises four parts, which together contain five modules: (1) a CNN feature extraction module, (2) a multi-scale semantic extraction module, (3) a Transformer encoder and decoder module, and (4) a prediction module. Comprehensive experiments on the standard LEVIR-CD benchmark for building change detection demonstrate our approach’s superiority over state-of-the-art methods. Compared to existing models such as FC-Siam-Di, FC-Siam-Conc, DTCTSCN, BIT, and SNUNet, MSSE-CDNet achieves significant and consistent gains in performance metrics, with F1 scores improved by 4.22%, 6.84%, 2.86%, 1.22%, and 2.37%, respectively, and Intersection over Union (IoU) improved by 6.78%, 10.74%, 4.65%, 2.02%, and 3.87%, respectively. These results robustly substantiate the effectiveness of our framework on an established benchmark dataset.

1. Introduction

Change detection is a technique that analyzes multi-temporal images of the same geographical area to detect regional changes and identify differences in the state of specific objects or phenomena [1,2]. This technology has significant application value and is widely used in various fields, including land cover change monitoring and utilization optimization [3,4], urban structure and expansion [5,6], natural disaster assessment and monitoring [7,8], and urbanization.
The accurate dynamic monitoring of buildings is an essential approach for enhancing land management and ensuring sustainable urban development. Consequently, building change detection has become a prominent research focus within the change detection domain, providing crucial information for land use monitoring, regional environmental impact assessment, and emergency decision-making [9]. Although traditional building change investigation methods such as visual interpretation and field verification offer high accuracy, their time-consuming and labor-intensive nature struggles to meet the timeliness requirements of current applications [10].
As multiple distinct entities within a region, accurate building change detection using deep learning methods necessitates input images with exceptionally high edge sharpness. Current change detection models face the following challenges in capturing building edge information within complex land cover distribution scenarios: (1) buildings frequently exhibit color characteristics similar to their surrounding areas, complicating the identification of changed building edges; (2) prevalent shadow interference impedes precise edge localization; and (3) partial occlusion by objects such as trees frequently causes building edges to fragment or disappear entirely in obscured regions (as shown in Figure 1) [11]. These factors jointly compromise existing neural networks’ capacity to accurately delineate building edges. Furthermore, advancing highly automated and robust methods for building change detection continues to be a crucial research direction that warrants increased focus and exploration [12]. With recent advancements in artificial intelligence (AI) theories and technologies, deep learning methods have gradually been applied to change detection, enhancing its prospects and potential [13]. Deep learning techniques possess exceptional feature extraction and representation capabilities, enabling them to fully exploit deep feature information within remote sensing imagery. Compared to traditional change detection methods constrained by manually designed features, deep learning algorithms can better represent complex ground conditions in images, leading to more accurate change detection results.
However, with the development of high-spatial-resolution imagery, current deep learning approaches exhibit certain limitations when confronted with rich spatial feature information, diverse scales of ground objects, and massive volumes of remote sensing data [14]. Therefore, it is critical to address existing algorithmic deficiencies in neural networks—such as the insufficient capability to detect false changes, inadequate multi-scale feature extraction, omission of small objects, incomplete detection of changed regions, insufficient extraction of semantic information, and inadequate representation of image differences. This paper proposes a Siamese network to enhance feature representation capability via multi-scale semantic extraction and adaptive fusion. The primary contributions are summarized as follows:
(1)
We propose a Transformer-based change detection network (MSSE-CDNet) for detecting changed building areas in urban environments. The network demonstrates significantly enhanced semantic information extraction capability in complex environments compared to other models.
(2)
A multi-scale feature extraction mechanism is proposed to select different building feature extraction approaches across varying scene complexities. Unlike traditional single-scale extraction methods, this approach employs multi-scale building feature extraction in complex scenarios to enhance the detail of local features.
(3)
We formulate an adaptive feature fusion mechanism to interpolate and enhance features across different scales. This mechanism integrates multi-scale building features in complex environments, and the fused features serve as input for subsequent feature analysis.
(4)
Validation experiments on the LEVIR-CD dataset demonstrate that the proposed building change detection model outperforms existing methods in prediction accuracy.

2. Related Work

The advancement of deep learning and big data technologies has led to significant progress in remote sensing image change detection for fields such as computer vision. Leveraging deep learning-based methods, it is now possible to directly learn change features from bi-temporal, multi-temporal, or time-series remote sensing images and generate change maps through image segmentation. These features exhibit strong robustness. Compared to traditional approaches, deep learning methods not only can eliminate the impact of reliance on change difference maps but also effectively process remote sensing data acquired from different sensors, demonstrating strong generalization capabilities, and these change detection models are applied in multiple fields for monitoring, such as land use and land cover change detection, and building change detection.
In 2017, Vaswani et al. first proposed the Transformer architecture, achieving strong performance in natural language processing tasks [15]. In recent years, Transformer has achieved remarkable success in fields such as natural language processing, object detection, and image segmentation, becoming an emerging research hotspot. Scholars have applied the latest Transformer research achievements to remote sensing image change detection, leading to the continuous emergence of various new methods and a steady improvement in detection performance. In 2021, Chen et al. pioneered the use of Transformer for remote sensing image change detection tasks, proposing the Bitemporal Image Transformer (BIT), which achieved state-of-the-art detection performance at the time [16]. Since then, various Transformer-based remote sensing image change detection methods have continuously emerged, progressively improving detection performance and becoming the mainstream approach. In 2022, Guo et al. proposed a parallel convolution structure and, based on this, introduced a multi-scale Siamese network using self-attention mechanisms to fuse features from different times [17]. Ke et al. proposed a hybrid Transformer structure based on a token aggregation strategy, named H-TransCD [18]. Bandara et al. proposed ChangeFormer, one of the most representative pure Transformer-based methods for remote sensing image change detection, although it consumes significant memory and computational resources [19]. To reduce model complexity, Zhang et al. combined Swin Transformer with UNet in 2022, proposing SwinSUNet [20]. This model, with its lower parameter count, can more effectively handle the problem of drastic scale variations in changed regions. In 2023, Feng et al. proposed a Segmented Multi-Branch Change detection network, named SMBCNet, which innovatively transformed the change detection task into a semantic segmentation problem [21]. Teng et al. proposed a new remote sensing image change detection method named SFCD [22]. During the decoding process, they designed a foreground-aware fusion module to prune and fuse the obtained features. Feng et al. [23] proposed a dual-branch multi-layer cross-time network, utilizing a cross-time joint attention module to interactively encode bi-temporal features extracted by ResNet18 networks. Xu et al. proposed a Transformer-based context information aggregation network [24]. This network uses two weight-shared ResNet18 networks to extract multi-scale feature representations from input images at different levels and employs a progressively sampled ViT to obtain global semantic information, generating rich contextual representations for each temporal image [25]. Currently, remote sensing image change detection methods based on Transformer can be primarily categorized into two types: pure Transformer-based methods and CNN+Transformer hybrid architecture-based methods. The former mainly improves detection accuracy through strategies such as feature expression optimization, model structure simplification, training data augmentation, feature aggregation refinement, and the introduction of innovative attention mechanisms. The latter enhances recognition performance primarily by deepening the interaction of bi-temporal features, strengthening multi-scale feature fusion, and optimizing attention mechanisms.
In current research, although Transformer-based remote sensing change detection methods effectively capture intrinsic image correlations, long-range dependencies, and global contextual information, they suffer from high computational complexity. The quadratic complexity growth with sequence length leads to low computational efficiency and high memory consumption, significantly limiting their practical deployment [26]. Furthermore, existing change detection models perform semantic extraction at a fixed scale, especially the building feature extraction. This resulting in the loss of fine-grained details. To address these limitations, we introduce a Transformer-based Multi-Scale Semantic Extraction Change Detection Network (MSSE-CDNet) for building change detection with enhanced detail preservation.

3. Methodology

We aimed to address the prevalent limitations in current building change detection models—including inadequate semantic information extraction, the loss of multi-scale detail features, incomplete boundaries, and compromised internal structural fidelity in detection results. This paper proposes a Transformer-based building change detection model integrating multi-scale semantic extraction, adaptive fusion mechanisms, and a Transformer framework. The model comprises four core components: a Convolutional Neural Network (CNN) feature extraction module, a multi-scale semantic extractor module, Transformer encoder and decoder module, and a prediction head module. The proposed model employs a unified Siamese architecture throughout its entire pipeline, encompassing both the CNN-based feature extraction module and the Transformer encoder–decoder components. This refinement process generates discriminative and information-rich feature maps, effectively overcoming the shortcomings of traditional methods in semantic understanding, multi-scale feature preservation, and boundary integrity. The structure of the proposed MSSE-CDNet is depicted in Figure 2.

3.1. CNN Feature Extraction Module

The CNN Feature Extraction Module serves as the foundational feature extractor. Leveraging the intrinsic advantages of Convolutional Neural Networks, which are local receptive fields and spatial translation invariance, this module concurrently processes bi-temporal input images to extract hierarchical spatial–spectral features spanning shallow to intermediate levels. Its primary objective is the robust capture of low-level image characteristics (e.g., edges, textures, local structures) and local contextual cues, forming the essential building blocks for subsequent processing stages. The core of the dual-stream temporal feature extraction module employs ResNet18, whose fundamental architecture resembles VGG networks but incorporates fewer convolutional kernels and lower computational complexity [27]. ResNet18 has 34 layers organized into 5 stages, with downsampling between stages. It begins with a 7 × 7 convolutional layer and mostly uses 3 × 3 kernels. The network ends with global average pooling and a 1000-way fully connected layer for classification. Input images are reduced through stages to a 1D feature vector, which is classified by the fully connected layer. The structure is shown in Figure 3.
The bi-temporal images are processed through a CNN feature extraction module, yielding a feature vector, F, with dimensions [B,C,H,W], where B denotes batch size, C represents the number of channels, H is height, and W is width. At this stage, our proposed module is applied for multi-scale extraction. The features are first fed through an adaptive judgment network to obtain an adaptive score. The structure of the network is shown in Figure 4.

3.2. Multi-Scale Semantic Extraction Module

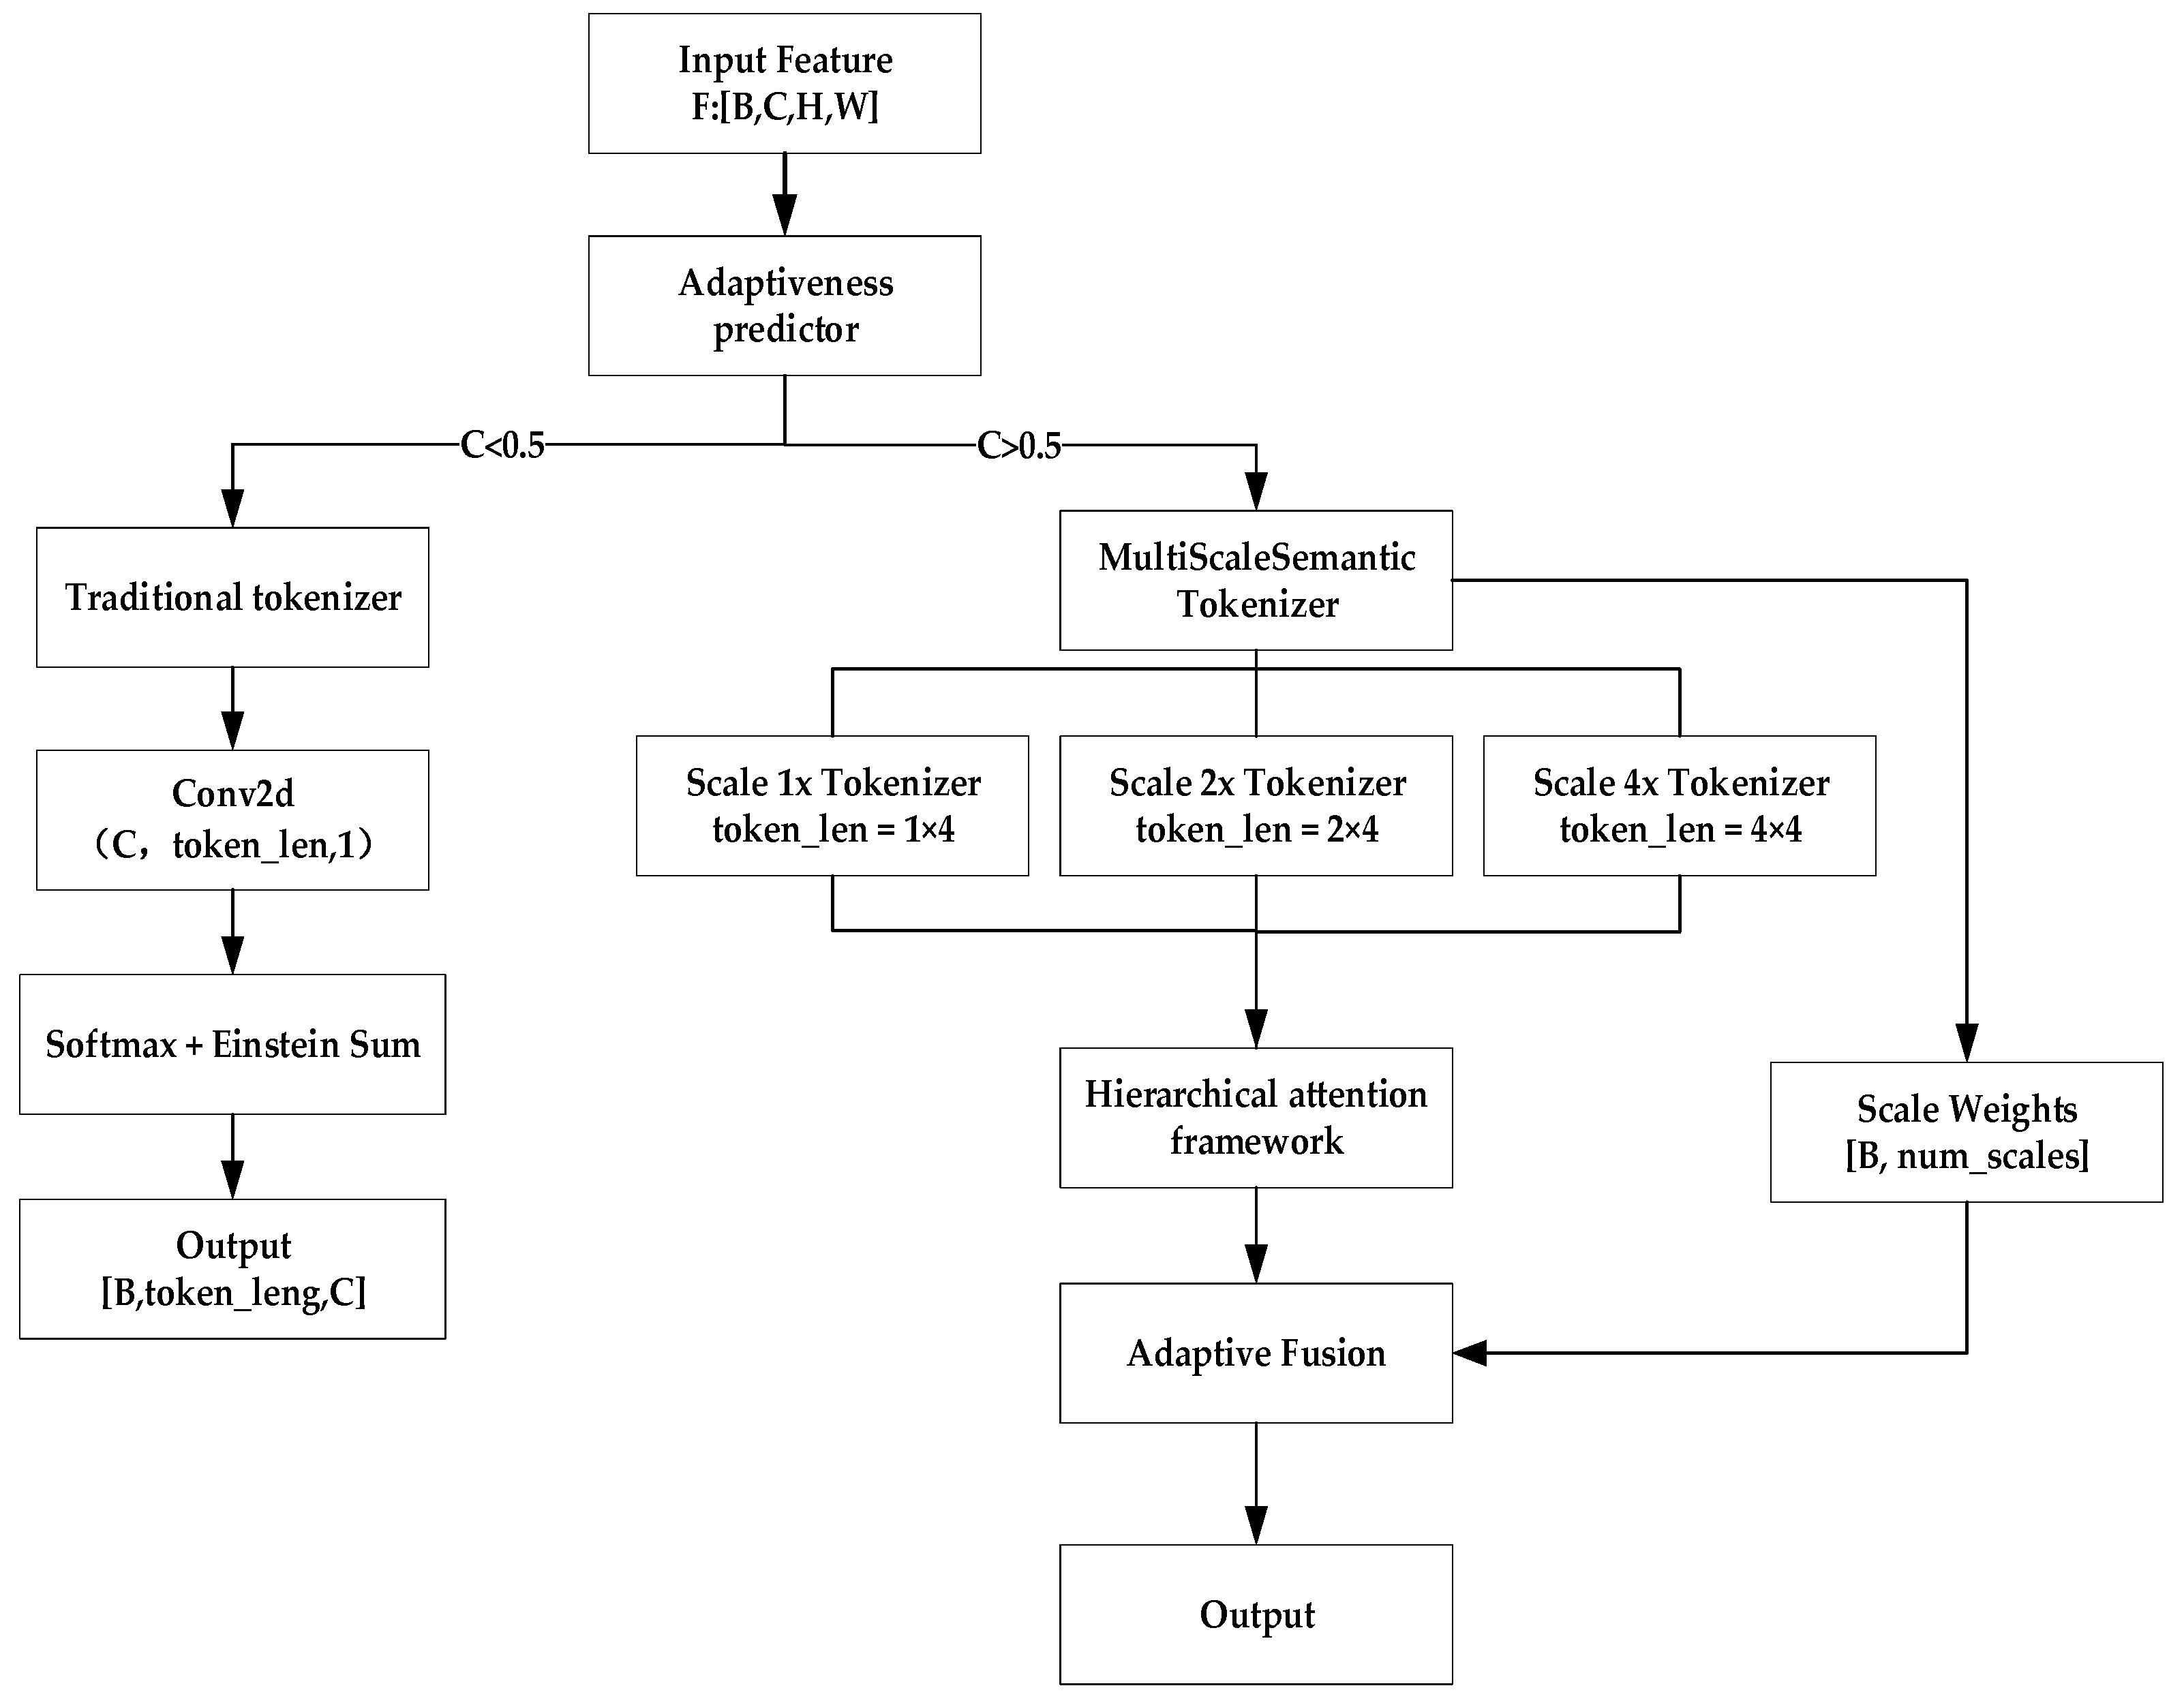
Due to the requirement for semantic representations of varying granularity across different scenarios, traditional building change detection models typically fix the token length at four tokens, which inherently limits their expressive power and lacks the ability to adapt to varying scene complexities. To address this limitation, this study introduces a Multi-Scale Adaptive Semantic Token Extraction Mechanism, enhanced via a lightweight module, to reinforce semantic token representation. Multi-scale representation learning theory posits that different semantic information resides at different spatial scales. The conventional approach of using a fixed token length of four lacks sufficient flexibility and fails to adapt to the complexity demands of diverse scenes. Consequently, we design an adaptive fusion mechanism to dynamically adjust the granularity of token representations based on scene characteristics, as clearly illustrated in the main workflow diagram. The semantic information extraction process can be conceptualized as a two-stage procedure: first, performing multi-scale extraction on feature vectors to obtain tokens at different scales, followed by fusing these tokens through our proposed adaptive fusion mechanism. The process is shown in Figure 5.

3.2.1. Multi-Scale Extraction

The feature vector, F, first undergoes adaptive average pooling to compress its global representation, reducing the spatial dimensions from H × W to 1 × 1. Subsequently, the 4-dimensional vector is reshaped into a 2D matrix, retaining only the batch (B) and channel (C) dimensions. This matrix is then processed by a fully connected layer to compute feature importance scores. Finally, a sigmoid activation function normalizes these raw scores to the range [0, 1]. We establish a threshold of 0.5: scenes with scores exceeding 0.5 are classified as complex scenes, while those below or equal to 0.5 are categorized as simple scenes.
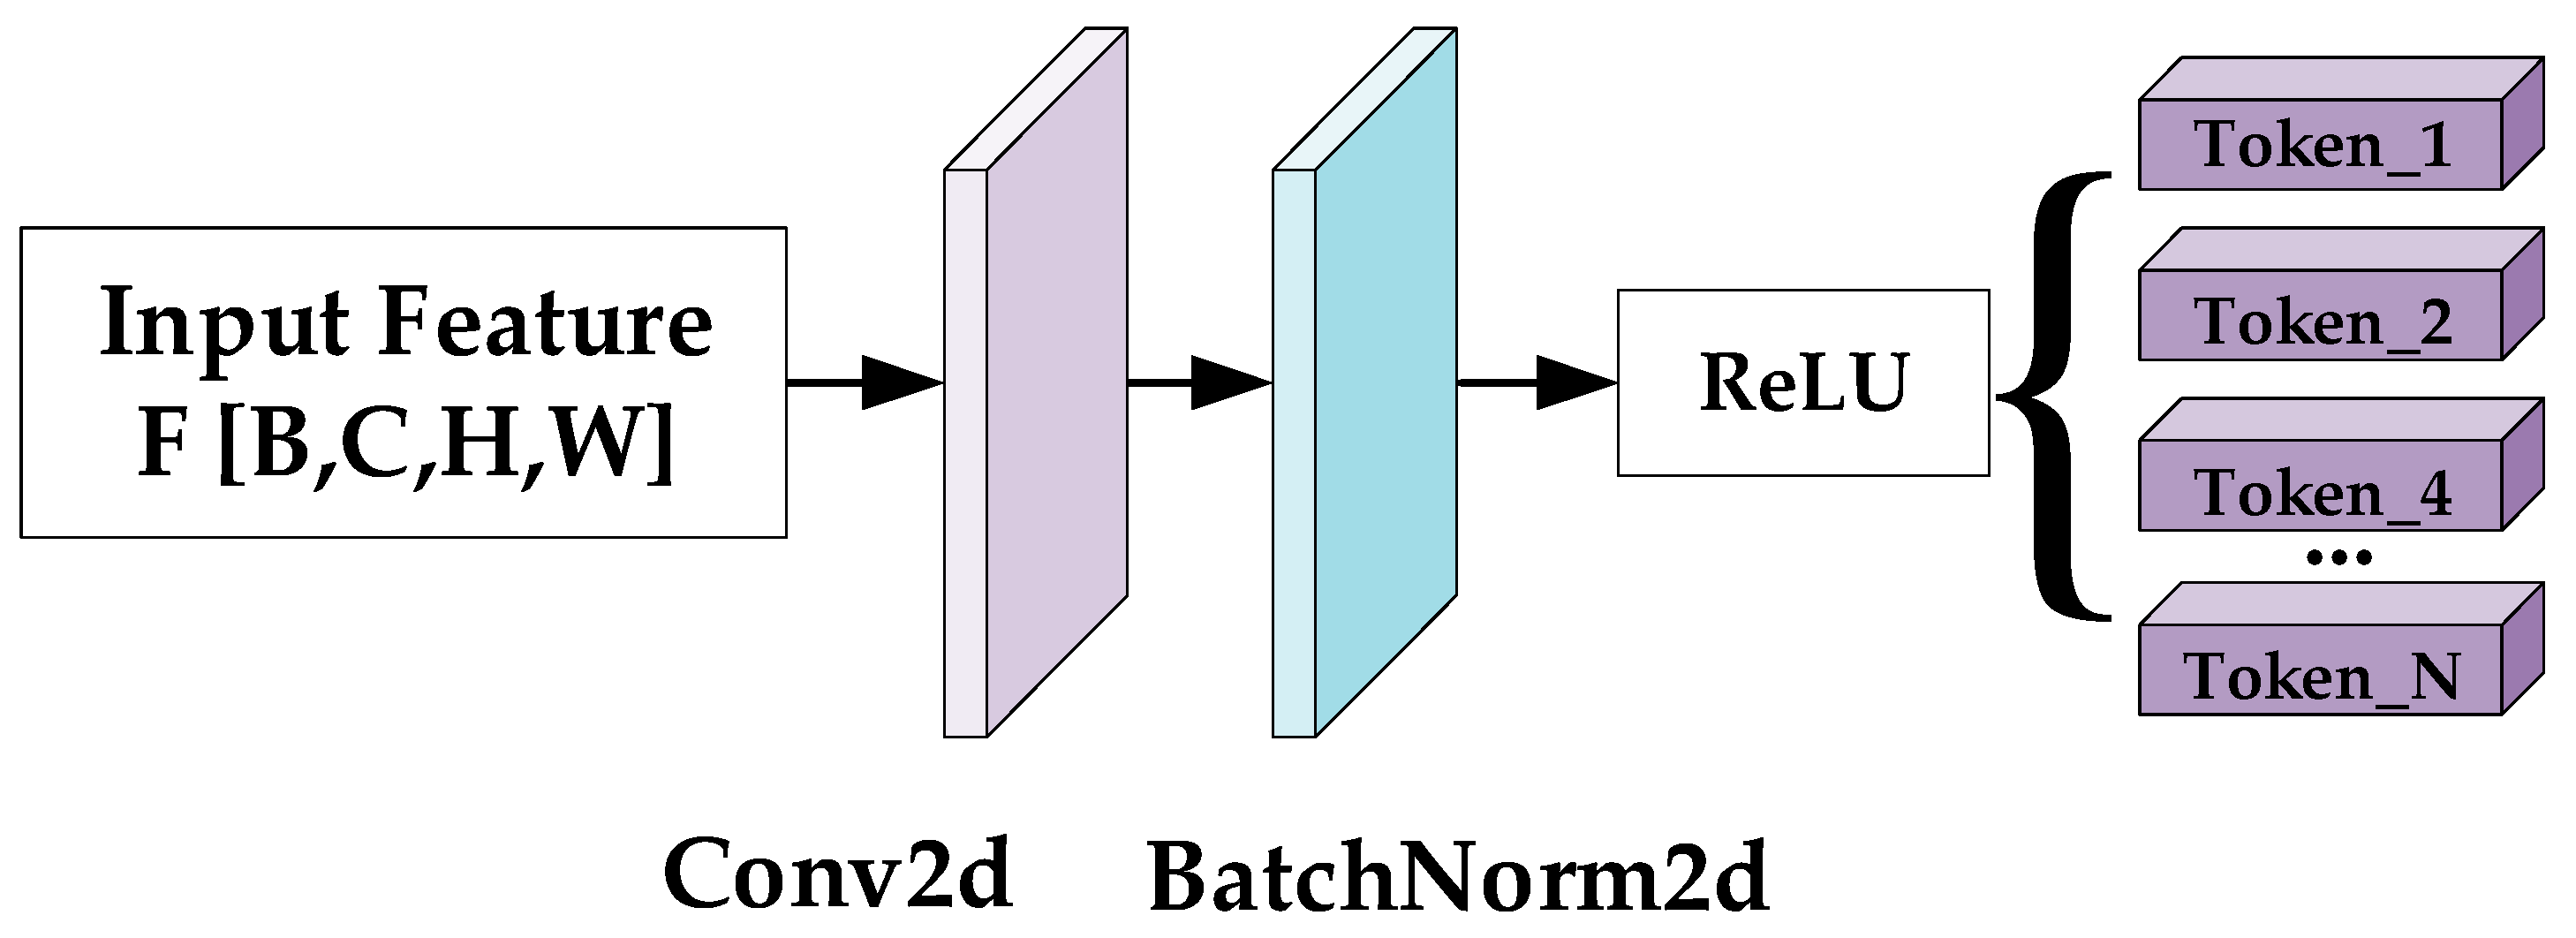
Simple scenes are processed via the conventional token extraction method [16], while complex scenes necessitate the proposed Multi-Scale Semantic Extraction Module. The structure of this module is illustrated in Figure 6.
The input feature, F, is first processed by a convolutional layer. The output of this convolution is then normalized to ensure each feature map has zero mean and unit variance. Prior to token extraction, scale partitioning is performed. Defining N = [1, 2, 4, …] as the scale factors, the token length for scale N is set to 4 × N, thereby generating tokens of varying lengths. The token extraction process is mathematically represented as follows:
T F = r e s h a p e F , B × C × N R B × C × N
where N = H·W represents the number of flattened spatial positions, and spatial attention enhancement is subsequently applied to the tokens. T F represents the token extracted from feature F.

3.2.2. Adaptive Fusion

Due to varying extraction scales, the obtained tokens exhibit heterogeneous lengths. The adaptive fusion of these multi-scale tokens is necessitated prior to subsequent processing. This fusion comprises two stages: Stage 1 employs a feature analysis network to generate spatial attention maps and feature weights, which enhance tokens through weighted refinement. Stage 2 introduces a hierarchical attention framework encompassing intra-scale attention enhancement and cross-scale attention reinforcement processes. This dual-stage attention mechanism enables deep interaction across multi-scale features, substantially enhancing discriminative power and robustness.
In Stage 1, the multi-scale feature group, X N , put into the feature analysis network first undergoes scale-specific enhancement. For features at each scale, independent linear transformations generate queries Q N = W q N X N , keys K N = W k N X N , and values V N = W v N X N . Following multi-head reorganization, within-scale self-attention is computed as follows:
X N i n t r a = A t t n ( Q i , K i ) = s o f t m a x ( Q i K i T d k )
In this formula, Q i and K i represent the query vector and key vector obtained after linear transformation of the i-th input element, respectively. K i T denotes the transposed matrix of the key vector, which is used to compute the similarity between vectors. d k indicates the dimension of the key vector. The output feature, X N i n t r a , preserves the original spatial resolution while enhancing intra-scale semantic coherence. This process enables each spatial position to model long-range dependencies within the same scale, thereby establishing a foundation for cross-scale interactions.
Stage 2 introduces an adaptive fusion mechanism to enable deep interaction among multi-scale features. First, scale discrepancies are removed by a dynamic dimension alignment strategy. The maximum sequence length, M m a x , across all scales is taken as the common length. Each scale-specific feature X i i n t r a is then resampled to this length through one-dimensional linear interpolation I 1 D , yielding a unified representation. The specific process can be expressed by the following formula:
X ^ i i n t r a = I 1 D ( X i i n t r a , M m a x ) R B × M m a x × D
In the formula, X ^ i i n t r a represents the feature after interpolation to a unified length.
Then, the features with unified lengths are stacked into a tensor Xstacked, and inter-scale attention is computed through a multi-head attention module:
A i n t e r = M u l t i h e a d A t t e n t i o n X s t a c k e d , X s t a c k e d , X s t a c k e d
A i n t e r refers to inter-scale attention.
This step builds a global cross-scale interaction field, allowing each spatial token to attend to semantic counterparts across all scales and enabling bidirectional flow between fine-grained local details and coarse-grained global semantics. Finally, the features are restored to their original dimensions by inverse interpolation I 1 D 1 and then linearly projected.
O u t p u t i = W o · [ I 1 D 1 ( A i n t e r ( i ) , M i ) ]
Here, W o R D × D is a learnable linear transformation. A i n t e r ( i ) refers to the inter-scale attention of the i-th feature, I 1 D 1 denotes inverse interpolation, and M i represents the original size of the i-th token.
During the token extraction stage preceding Stage 1, the network outputs not only the tokens required later but also a scale weight for each scale α i . These scale weights are combined with the outputs of the two subsequent stages through weighted summation, yielding the final input for downstream tasks.
T f i n a l = i = 1 n O u t p u t i α i
Here, denotes the weighted combination and α i represents the per-scale weight.

3.3. Transformer Encoder and Decoder Module

The next step following semantic extraction is to obtain pixel-level features. This task can be accomplished through the modeling of context and refinement of image features at each time point using encoders and decoders [15]. The encoder receives the processed dual-temporal token sequences and utilizes multi-head self-attention to obtain context-rich tokens. These tokens are then refined by the decoder based on the relationships between each pixel and the set of tokens, T f i n a l i , thereby revealing the change information within the data. The specific process can be expressed in the following formula:
T f i n a l i = T r a n s f o r m e r _ E n c o d e r ( T f i n a l i )
F i = T r a n s f o r m e r _ D e c o d e r F i , T f i n a l i *
Here, i takes the values of 1 and 2, representing the two temporal points.

3.4. Prediction Head Module

The structure of the prediction head is relatively simple. It uses CNN modules and semantically encoded features via a Transformer, employing a very shallow Fully Convolutional Network (FCN) for change discrimination. Given the two upsampled feature maps F 1 and F 2 outputted from the previous step, the absolute difference between the two feature sets is computed. This result is then passed through a classifier, followed by a softmax function to generate the predicted change probability map P, which is given by the following equation.
P = s o f t m a x g ( F 1 F 2 )
To comprehensively evaluate the performance of the building change detection model, this study employs five well-established quantitative metrics: Precision (Prec), Recall (Rec), Overall Accuracy (OA), F1-score (F1), and Intersection over Union (IoU). The specific formulations are presented as follows:
A c c u r a c y O A = T P + T N T P + F P + T N + F N
I O U = T P T P + F P + F N
P r e c i s i o n = T P T P + F P
R e c a l l = T P T P + F N
F 1 S c o r e = 2 × P r e c i s i o n × R e c a l l P r e c i s i o n + R e c a l l

4. Experiment

4.1. Model Accuracy Comparison

4.1.1. Dataset

The LEVIR-CD [28] dataset, designed for remote sensing image building change detection, is a large-scale dataset with broad applications, such as building change identification and urban expansion monitoring. It consists of 637 pairs of high-resolution satellite images spanning 5 to 14 years across various cities. Each image is 1024 × 1024 pixels with a 0.5 m spatial resolution, capturing detailed ground features. Pixel-level binary masks mark changes like building construction and demolition, covering over 30,000 instances in diverse scenarios such as residential, industrial, and agricultural areas. The dataset is divided into training (445 pairs), validation (64 pairs), and testing (128 pairs) sets in a 7:1:2 ratio. Its features include high resolution and detailed annotations for pixel-level detection, a reasonable time span covering seasonal and long-term changes, and diverse scenes to reduce overfitting risks.
The LEVIR-CD dataset consists of image patches measuring 1024 × 1024 pixels. For change detection models, such large images can lead to an increase in the number of parameters and a decrease in processing efficiency when input directly into the models. To optimize compatibility with model architectures, these images are cropped into smaller patches. This approach not only aligns better with the structural requirements of the models but also significantly reduces memory usage and computational overhead during training. Consequently, training becomes more efficient, and the risk of memory overflow is minimized. Therefore, this study utilizes cropped image patches of 256 × 256 pixels for conducting experiments.

4.1.2. Evaluation Metrics

Within the rigorous evaluation framework for building change detection algorithms, the fundamental constituents of the confusion matrix are precisely delineated as follows: True Positive (TP) quantifies the number of samples accurately classified as the positive class (representing actual changed pixels), thereby directly reflecting the model’s detection capability and its proficiency in identifying authentic alterations within the imagery. False Positive (FP), conversely, enumerates instances where pixels belonging to the negative class (unchanged regions) are erroneously assigned to the positive class. This metric serves as a critical indicator of the model’s propensity for spurious change reporting or commission errors, signifying the erroneous identification of non-existent changes. False Negative (FN) captures the critical failure scenario wherein pixels containing genuine change events are incorrectly classified as negative, representing omission errors that reveal deficiencies in the model’s sensitivity to actual alterations. True Negative (TN), complementarily, counts the samples correctly identified as belonging to the negative class (unchanged areas), providing a measure of the model’s discriminative power in recognizing regions of stability.
In remote sensing change detection, Overall Accuracy (OA) measures the proportion of correctly classified pixels but can be misleading in cases of class imbalance, such as when changed pixels are scarce. The F1-score, however, provides a more balanced evaluation by considering both Precision and Recall, thus offering a better assessment of model performance in imbalanced settings. Recall specifically indicates the model’s ability to detect true changes, highlighting its effectiveness in identifying actual alterations. Finally, the IoU serves as a core segmentation metric. It is computed as the ratio of the area of overlap between the predicted change map and the ground truth change map to the area of their union. IoU delivers a strict assessment of spatial congruence, inherently sensitive to boundary localization errors and fragmentation, making it an indispensable measure for evaluating the geometric fidelity of detected change regions, especially critical in high-resolution remote sensing applications.
Given the low proportion of change areas and complex boundaries in building change detection, we need to adopt more effective methods to improve detection performance. This study focuses on F1 and IoU to avoid OA’s sensitivity to class imbalance. It also analyzes specific error patterns like FP (e.g., shadows misclassified as building changes) and FN (e.g., local roof repairs overlooked) using Precision and Recall. Experimental results are averaged over three random training runs to minimize the impact of initialization variance.

4.1.3. Comparison of Experimental Results

This study employs an end-to-end training strategy based on a multi-scale semantic token extraction Transformer architecture for building change detection. The experiments utilize remote sensing imagery in PNG format with a resolution of 256 × 256 pixels. The experimental image data were divided into training and validation sets in an 8:2 ratio. Data augmentation techniques, including random scaling and cropping, are implemented during the training process. The training utilizes the Adam optimizer in conjunction with a cosine annealing learning rate scheduler, beginning with an initial learning rate of 0.0005 and a minimum learning rate of 0.000005. A global batch size of 8 is employed, and the training is conducted over 350 epochs. The implementation is executed using Python 3.9 and the PyTorch 2.0.0 framework on an NVIDIA GeForce RTX 4060 GPU (8 GB VRAM) with CUDA acceleration. A balanced weighted cross-entropy loss function is utilized. To ensure reproducibility, all experiments fix the random seed to 11 and are conducted in a single-GPU environment.
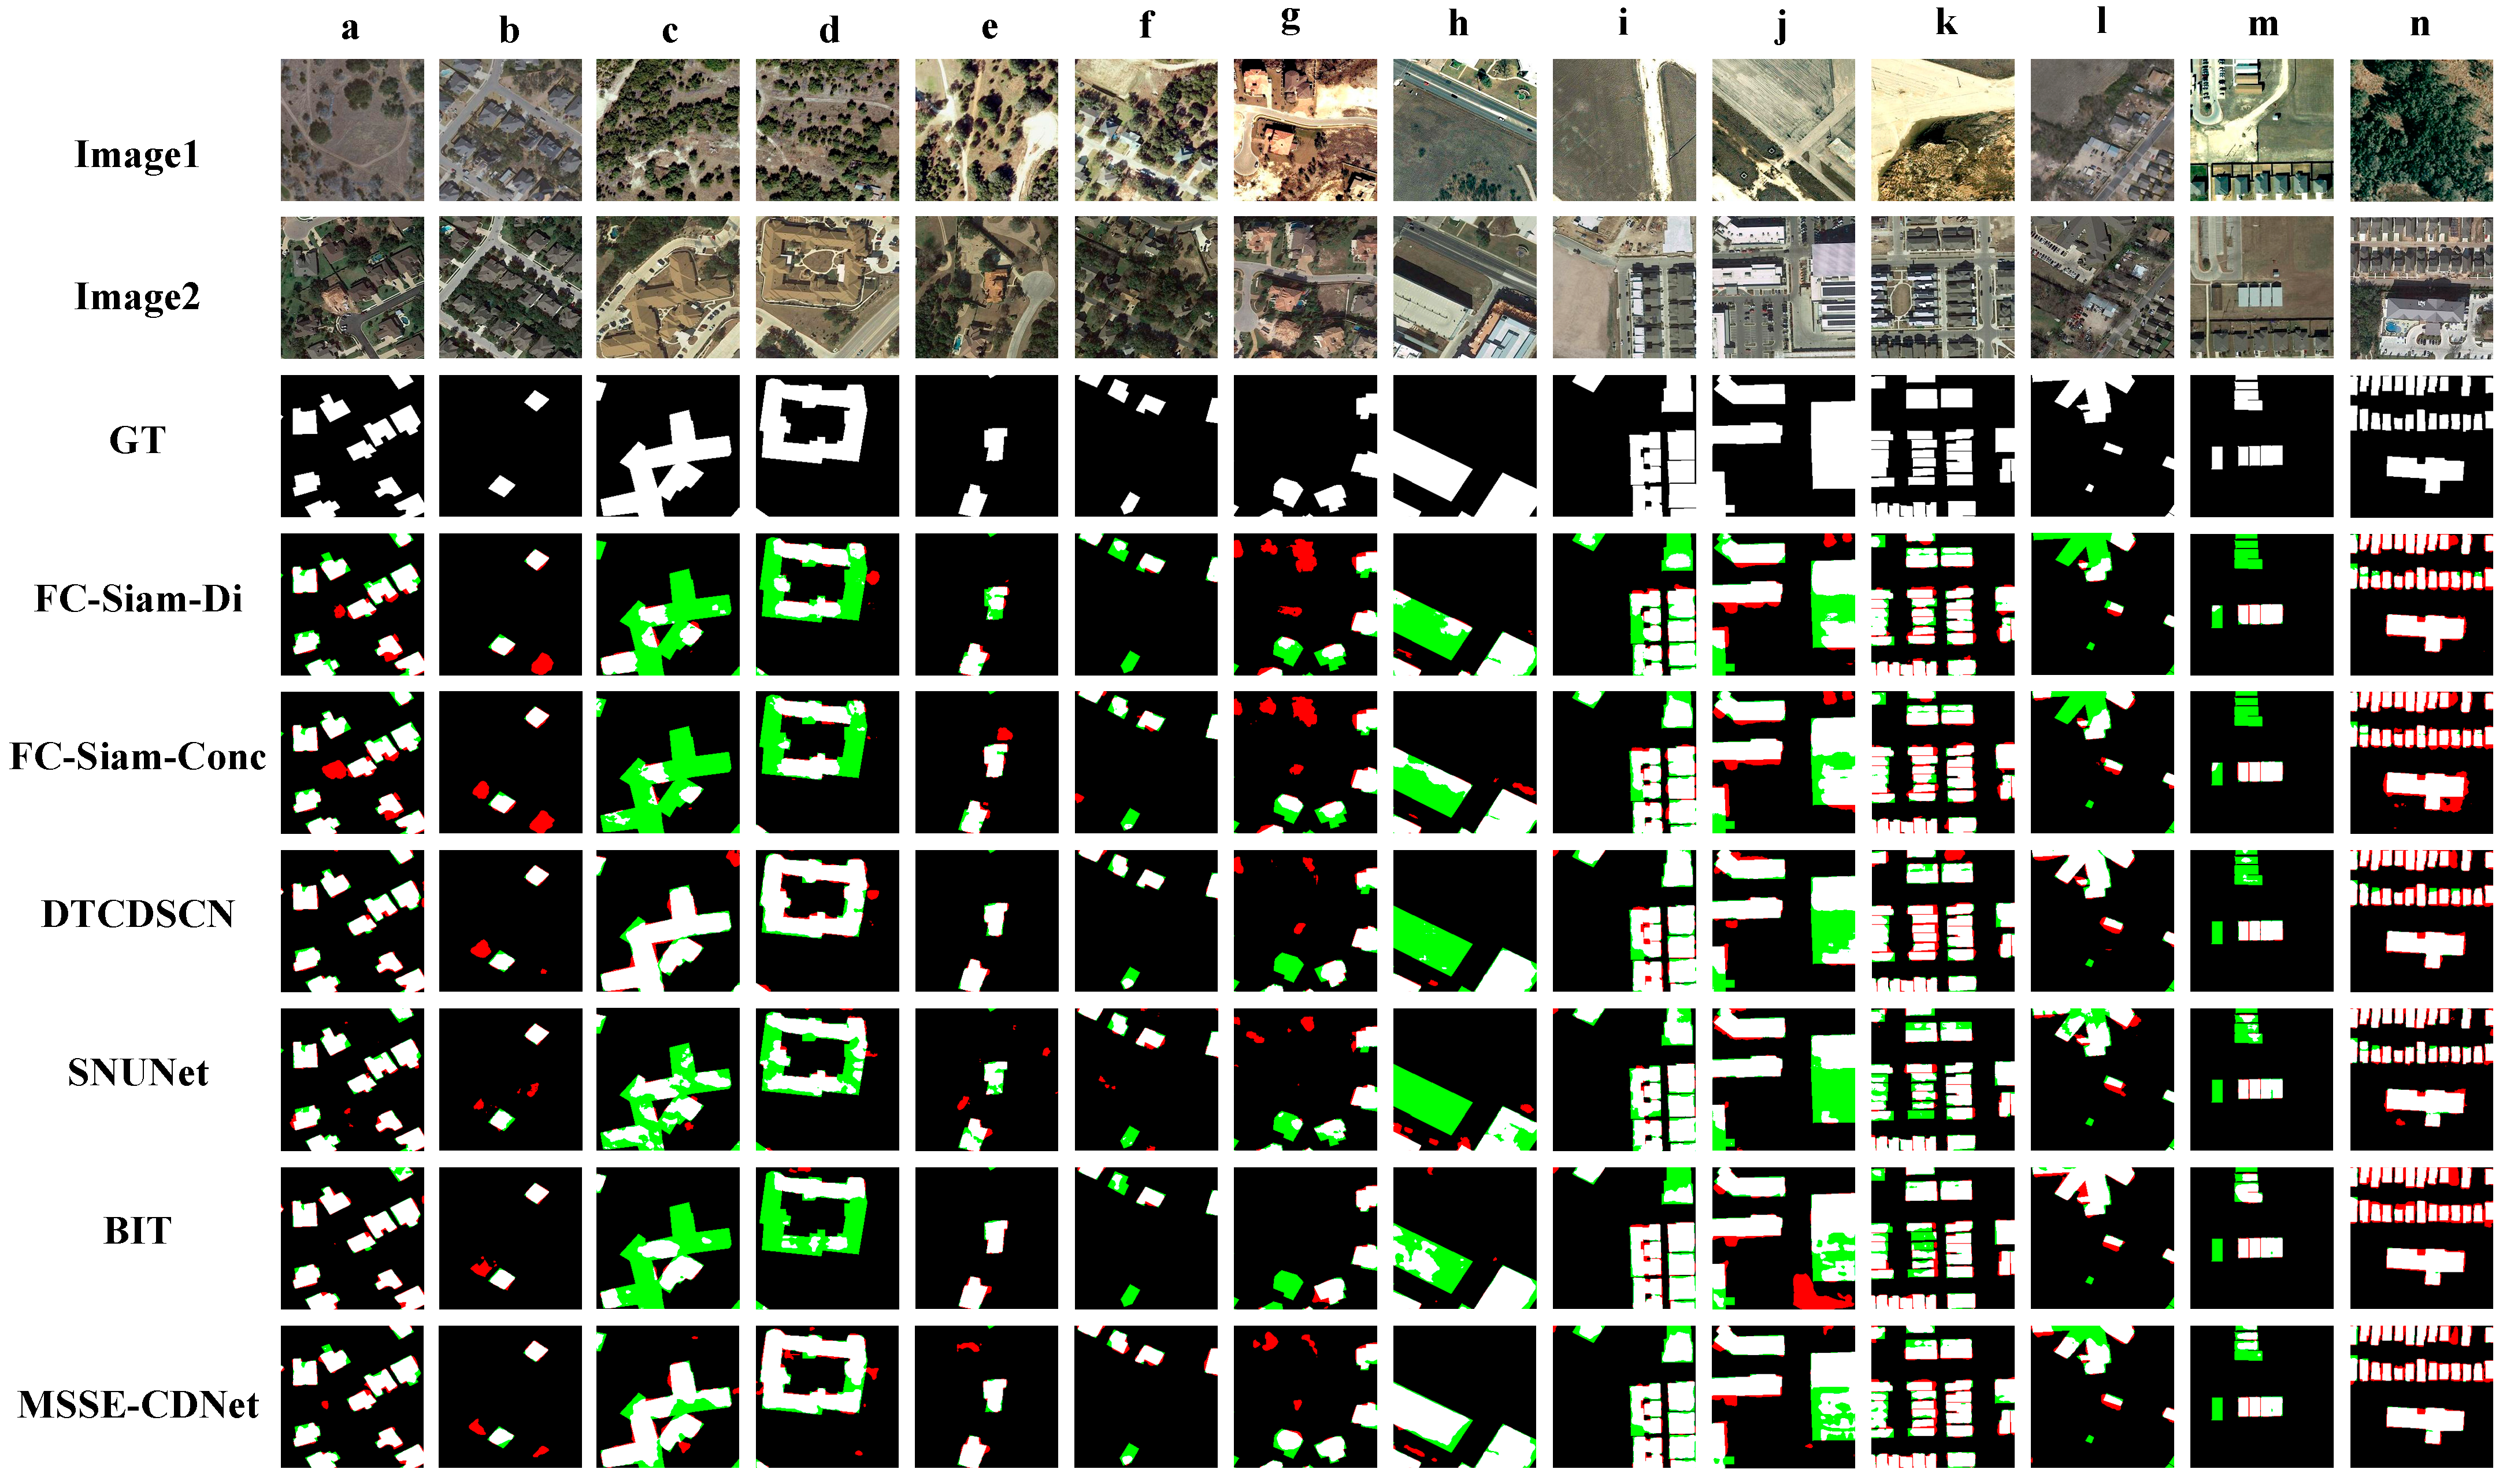
A comparative analysis is performed on the publicly available LEVIR-CD dataset (as introduced in Section 3.2), with quantitative evaluation metrics for various models presented in Table 1. Qualitative comparisons of the building change detection results on the test set are visualized in Figure 7.
Table 1 presents a performance comparison of the proposed model and other benchmark models across five accuracy evaluation metrics. The proposed model achieves a Recall of 89.83%, an F1 score of 90.53%, and an IoU of 82.70%. It can be observed that, except for a slightly lower Precision value in the second column compared to the FC-Siam-Conc model (a difference of 0.74 percentage points), the proposed model outperforms all other benchmark models across the remaining metrics. This means that the model not only effectively identifies actual positive samples, thereby reducing false negatives, but also ensures accuracy in its predictions. It excels in capturing relevant objects and is more precise in predicting the spatial location and contours of objects. The values in the OA (Overall Accuracy) column are all very high, approaching 100%. This is due to the high-resolution nature of implicit change regions in the LEVIR-CD dataset.
Figure 7 provides a comprehensive visual comparison delineating the building change detection performance of diverse deep learning models evaluated on the publicly available LEVIR-CD dataset. This dataset is recognized as a benchmark for assessing algorithms tasked with identifying alterations in urban environments over time. The visualization employs a color-coded scheme to rigorously analyze prediction accuracy relative to ground truth annotations: Regions rendered in white (TP) correspond to true positives, accurately identifying locations where change has occurred. Black regions (TN) denote true negatives, correctly recognizing areas exhibiting no change. Green regions (FN), critically representing false negatives or omission errors, highlight genuine change events present in the ground truth that were missed by the model’s prediction. Conversely, red regions (FP) signify false positives or commission errors, indicating areas spuriously flagged as changed in the prediction despite the absence of actual change in the reference data.
An analysis of the results presented in Figure 7 reveals a pronounced deficiency in the building change detection capability exhibited by the FC-series networks. Their performance is demonstrably suboptimal across the evaluated scenarios. This observed limitation can be primarily attributed to the inherent architectural simplicity of these models. Specifically, FC-series networks typically employ a relatively rudimentary encoder–decoder structure characterized by limited representational capacity. Furthermore, a significant drawback is the omission of attention mechanisms, which are crucial for selectively focusing computational resources on salient image regions and modeling long-range dependencies essential for accurate change identification. Consequently, these models suffer from substantial rates of both false positives (commission errors) and false negatives (omission errors), manifesting as extensive green and red areas in the results, respectively. This indicates poor localization accuracy and unreliable change mapping.
In contrast, comparative models DTCDSCN and BIT achieve significantly superior performance on the LEVIR-CD dataset. Their enhanced efficacy is visually evident through significantly reduced areas of red and green (FN/FP) and correspondingly larger coherent areas of white (TP) and black (TN), reflecting more precise change boundaries and fewer spurious detections. This performance advantage likely stems from their more sophisticated architectures, which potentially incorporate multi-scale feature extraction, advanced temporal modeling strategies (in the case of BIT), or dedicated modules designed for effective feature representation learning and refinement critical for the challenging task of bi-temporal building change detection. The results of DTCDSCN, BIT, and SNUNet on the LEVIR-CD dataset were better. Among them, the BIT model achieved the best performance. Compared with BIT, the proposed MSSE-CDNet improved Recall, F1-score, and Intersection over Union (IoU) by 0.46%, 1.22%, and 2.02%, respectively, on public datasets, demonstrating its superior capability.
Quantitative analysis demonstrates the superior performance of the proposed building change detection model over comparative methods on the LEVIR-CD benchmark dataset. Qualitatively, visual comparisons in Figure 7 reveal a pronounced reduction in both omission errors (indicated by green regions, FN) and commission errors (denoted by red regions, FP) across the proposed model’s outputs. This advantage is particularly evident in Figure 7c,d,h,l, which depict scenarios characterized by homogeneous change patterns, low environmental complexity, large contiguous change areas, and few change targets.

4.2. Model Efficiency and Effectiveness

To compare the efficiency of the model proposed in this paper with other models, we tested various models on the LEVIR-CD dataset, with an input image size of 256 × 256 × 3. The results are summarized in Table 2. In this study, we conducted a thorough analysis of the parameter count (Params.) and the number of floating-point operations per second (FLOPs) of the proposed model.
The model has a parameter count of 3.521 million and achieves an FLOP value of 1.0727 billion. Our model’s parameter count is in the mid-range compared to other models. This positioning allows for faster training and inference in resource-constrained environments compared to models with larger parameter counts. However, in scenarios where minimizing parameters is crucial, it may not be the top choice compared to models with smaller parameter sizes. The computational load of the model is moderate, but for tasks aiming for the lowest computational load, MSSE-CDNet might not be the optimal solution.
Based on the above analysis, we believe that this model demonstrates competitive efficiency and can provide high-performance solutions for practical applications, all while maintaining low complexity. Future work could further optimize the model’s computational efficiency, allowing it to demonstrate greater potential across various application scenarios.

5. Discussion

From our experiments, we found that the introduction of multi-scale semantic extraction and adaptive fusion mechanisms significantly enhances the model’s ability to capture various contextual features, particularly in scenarios where the proportion of change areas is low and the boundaries are complex. The model is capable of generating richer and more discriminative feature maps, which contributes to its robustness in identifying subtle changes that traditional methods often overlook. Compared to traditional methods that extract semantic information at a single scale, our proposed multi-scale semantic extraction building change detection network effectively addresses the challenge of semantic information extraction in complex scenarios. The substantial improvements in metrics such as F1 score, Intersection over Union (IoU), and Recall further underscore the effectiveness of our architecture in enhancing detection performance. As shown in Figure 7, in the detection results of various models across multiple complex scenarios, it can be observed from columns (c), (d), (h), and (j) that the proportion of green areas is relatively high. This is mainly because the color of building surfaces closely resembles the surrounding environment, leading to some building areas being misidentified as background by the model, resulting in missed detections. This situation can be more clearly seen in Figure 8. From columns (a), (k), and (n), we can see that the buildings are densely distributed in the images. In such scenarios, the shadows of buildings easily overlap with other buildings. For instance, the shadow of one building projected onto another can alter the color characteristics of the building surface in the image, causing both false positives and missed detections. This effect is clearly apparent in Figure 9. Notably, the model maintains robust detection capability under challenging conditions with significant vegetation occlusion, as demonstrated in Figure 10a–c. Additionally, due to the large temporal span in the acquisition of the LEVIR-CD dataset, some areas (such as columns (e) and (f)) have significant differences in imaging times, resulting in noticeable brightness differences between images, which can also lead to false positives and missed detections. Despite these complex conditions, the model proposed in this paper still demonstrates superior performance in change detection compared to other benchmark models. As can be seen from the results in the bottommost row, the green and red areas are significantly fewer than those of other models, showcasing stronger generalization capability and adaptability to complex scenes.
While our model has achieved significant performance enhancements, further research is needed to optimize the adaptive fusion techniques and explore the integration of additional contextual information. Future work may consider incorporating temporal information over longer durations, which could potentially capture gradual changes that are difficult to detect within shorter time frames.

6. Conclusions

This paper proposes a novel building change detection model integrating multi-scale semantic extraction with a Transformer framework. It demonstrates superior performance in capturing subtle changes and complex boundaries in high-resolution imagery by effectively combining local and global features. Critically, this study has limitations. The model is validated only on building change detection, not on other domains like land or forests. Furthermore, it performs binary change identification without classifying the specific change type. Future work will therefore focus on applying the model to broader domains and advancing beyond binary classification to detailed change categorization.

Author Contributions

L.H. proposed the core novel idea and conceptual framework. S.D. developed and implemented the computational model and conducted rigorous comparative experiments to validate the idea’s effectiveness. Y.L. performed the formal analysis. Z.W. conducted the investigation. All authors have read and agreed to the published version of the manuscript.

Funding

The project is supported by the Horizontal Project of Beijing University of Civil Engineering and Architecture under Grant No. H24147.

Data Availability Statement

The original data presented in the study are openly available at https://justchenhao.github.io/LEVIR/ (accessed on 2 April 2025).

Conflicts of Interest

The authors declare no conflicts of interest.

References

  1. Salah, H.S.; Goldin, S.E.; Rezgui, A.; El Islam, B.N.; Ait-Aoudia, S. What Is a Remote Sensing Change Detection Technique? Towards a Conceptual Framework. Int. J. Remote Sens. 2020, 41, 1788–1812. [Google Scholar] [CrossRef]
  2. Zhang, H.; Wang, M.; Wang, F.; Yang, G.; Zhang, Y.; Jia, J.; Wang, S. A Novel Squeeze-and-Excitation W-Net for 2d and 3d Building Change Detection with Multi-Source and Multi-Feature Remote Sensing Data. Remote Sens. 2021, 13, 440. [Google Scholar] [CrossRef]
  3. Zhu, Z.; Woodcock, C.E. Continuous Change Detection and Classification of Land Cover Using All Available Landsat Data. Remote Sens. Environ. 2014, 144, 152–171. [Google Scholar] [CrossRef]
  4. Lv, Z.; Wang, F.; Cui, G.; Benediktsson, J.A.; Lei, T.; Sun, W. Spatial–Spectral Attention Network Guided with Change Magnitude Image for Land Cover Change Detection Using Remote Sensing Images. IEEE Trans. Geosci. Remote Sens. 2022, 60, 1–12. [Google Scholar] [CrossRef]
  5. Luo, H.; Liu, C.; Wu, C.; Guo, X. Urban Change Detection Based on Dempster–Shafer Theory for Multitemporal Very High-Resolution Imagery. Remote Sens. 2018, 10, 980. [Google Scholar] [CrossRef]
  6. He, C.; Zhao, Y.; Dong, J.; Xiang, Y. Use of Gan to Help Networks to Detect Urban Change Accurately. Remote Sens. 2022, 14, 5448. [Google Scholar] [CrossRef]
  7. Wang, L.; Zhang, M.; Shen, X.; Shi, W. Landslide Mapping Using Multilevel-Feature-Enhancement Change Detection Network. IEEE J. Sel. Top. Appl. Earth Obs. Remote Sens. 2023, 16, 3599–3610. [Google Scholar] [CrossRef]
  8. Liu, S.; Zheng, Y.; Dalponte, M.; Tong, X. A Novel Fire Index-Based Burned Area Change Detection Approach Using Landsat-8 Oli Data. Eur. J. Remote Sens. 2020, 53, 104–112. [Google Scholar] [CrossRef]
  9. Gao, F.; Liu, X.; Dong, J.; Zhong, G.; Jian, M. Change Detection in Sar Images Based on Deep Semi-Nmf and Svd Networks. Remote Sens. 2017, 9, 435. [Google Scholar] [CrossRef]
  10. Shi, J.; Liu, W.; Yin, P.; Cao, Z.; Wang, Y.; Shan, H.; Zhang, Z. Vector Boundary Constrained Land Use Vector Polygon Change Detection Method based on Deep Learning and High-resolution Remote Sensing Images. Remote Sens. Technol. Appl. 2024, 39, 753–763. [Google Scholar]
  11. Yang, M.; Zhou, Y.; Feng, Y.; Huo, S. Edge-Guided Hierarchical Network for Building Change Detection in Remote Sensing Images. Appl. Sci. 2024, 14, 5415. [Google Scholar] [CrossRef]
  12. Jiang, K.; Zhao, Z.; Ma, L.; Ma, C. A Review of Development on Changing Detection Methods of Remote Sensing Images Based on Deep Learning. Radio Eng. 2025, 55, 343–356. [Google Scholar]
  13. Shafique, A.; Cao, G.; Khan, Z.; Asad, M.; Aslam, M. Deep Learning-Based Change Detection in Remote Sensing Images: A Review. Remote Sens. 2022, 14, 871. [Google Scholar] [CrossRef]
  14. Wang, L.; Zhang, M.; Gao, X.; Shi, W. Advances and Challenges in Deep Learning-Based Change Detection for Remote Sensing Images: A Review through Various Learning Paradigms. Remote Sens. 2024, 16, 804. [Google Scholar] [CrossRef]
  15. Vaswani, A.; Shazeer, N.; Parmar, N.; Uszkoreit, J.; Jones, L.; Gomez, A.N.; Kaiser, Ł.; Polosukhin, I. Attention Is All You Need. In Proceedings of the 31st International Conference on Neural Information Processing Systems, Long Beach, CA, USA, 4–9 December 2017; Curran Associates Inc.: Long Beach, CA, USA, 2017; pp. 6000–6010. [Google Scholar]
  16. Chen, H.; Qi, Z.; Shi, Z. Remote Sensing Image Change Detection with Transformers. IEEE Trans. Geosci. Remote Sens. 2022, 60, 1–14. [Google Scholar] [CrossRef]
  17. Guo, Q.; Zhang, J.; Zhu, S.; Zhong, C.; Zhang, Y. Deep Multiscale Siamese Network with Parallel Convolutional Structure and Self-Attention for Change Detection. IEEE Trans. Geosci. Remote Sens. 2022, 60, 1–12. [Google Scholar] [CrossRef]
  18. Ke, Q.; Zhang, P. Hybrid-Transcd: A Hybrid Transformer Remote Sensing Image Change Detection Network Via Token Aggregation. ISPRS Int. J. Geo-Inf. 2022, 11, 263. [Google Scholar] [CrossRef]
  19. Bandara, W.G.C.; Patel, V.M. A Transformer-Based Siamese Network for Change Detection. In Proceedings of the IGARSS 2022–2022 IEEE International Geoscience and Remote Sensing Symposium, Kuala Lumpur, Malaysia, 17–22 July 2022. [Google Scholar]
  20. Zhang, C.; Wang, L.; Cheng, S.; Li, Y. Swinsunet: Pure Transformer Network for Remote Sensing Image Change Detection. IEEE Trans. Geosci. Remote Sens. 2022, 60, 1–13. [Google Scholar] [CrossRef]
  21. Feng, J.; Yang, X.; Gu, Z.; Zeng, M.; Zheng, W. Smbcnet: A Transformer-Based Approach for Change Detection in Remote Sensing Images through Semantic Segmentation. Remote Sens. 2023, 15, 3566. [Google Scholar] [CrossRef]
  22. Teng, Y.; Liu, S.; Sun, W.; Yang, H.; Wang, B.; Jia, J. A Vhr Bi-Temporal Remote-Sensing Image Change Detection Network Based on Swin Transformer. Remote Sens. 2023, 15, 2645. [Google Scholar] [CrossRef]
  23. Feng, Y.; Jiang, J.; Xu, H.; Zheng, J. Change Detection on Remote Sensing Images Using Dual-Branch Multilevel Intertemporal Network. IEEE Trans. Geosci. Remote Sens. 2023, 61, 1–15. [Google Scholar] [CrossRef]
  24. Xu, X.; Li, J.; Chen, Z.; Hua, Z. Tcianet: Transformer-Based Context Information Aggregation Network for Remote Sensing Image Change Detection. IEEE J. Sel. Top. Appl. Earth Obs. Remote Sens. 2023, 16, 1951–1971. [Google Scholar] [CrossRef]
  25. Yang, K.; Xia, G.-S.; Liu, Z.; Du, B.; Yang, W.; Pelillo, M.; Zhang, L. Asymmetric Siamese Networks for Semantic Change Detection in Aerial Images. IEEE Trans. Geosci. Remote Sens. 2022, 60, 1–18. [Google Scholar] [CrossRef]
  26. Zhuo, L.; Yu, W.; Jia, T.; Li, J. Research Progress of Transformer-based Remote Sensing Image Change Detection. J. Beijing Univ. Technol. 2025, 51, 851–866. [Google Scholar]
  27. He, K.; Zhang, X.; Ren, S.; Sun, J. Deep Residual Learning for Image Recognition. In Proceedings of the 2016 IEEE Conference on Computer Vision and Pattern Recognition (CVPR), Las Vegas, NV, USA, 27–30 June 2016. [Google Scholar]
  28. Chen, H.; Shi, Z. A Spatial-Temporal Attention-Based Method and a New Dataset for Remote Sensing Image Change Detection. Remote Sens. 2020, 12, 1662. [Google Scholar] [CrossRef]
  29. Wang, Z.; Peng, C.; Zhang, Y.; Wang, N.; Luo, L. Fully Convolutional Siamese Networks Based Change Detection for Optical Aerial Images with Focal Contrastive Loss. Neurocomputing 2021, 457, 155–167. [Google Scholar] [CrossRef]
  30. Liu, Y.; Pang, C.; Zhan, Z.; Zhang, X.; Yang, X. Building Change Detection for Remote Sensing Images Using a Dual-Task Constrained Deep Siamese Convolutional Network Model. IEEE Geosci. Remote Sens. Lett. 2021, 18, 811–815. [Google Scholar] [CrossRef]
  31. Fang, S.; Li, K.; Shao, J.; Li, Z. Snunet-Cd: A Densely Connected Siamese Network for Change Detection of Vhr Images. IEEE Geosci. Remote Sens. Lett. 2022, 19, 1–5. [Google Scholar] [CrossRef]
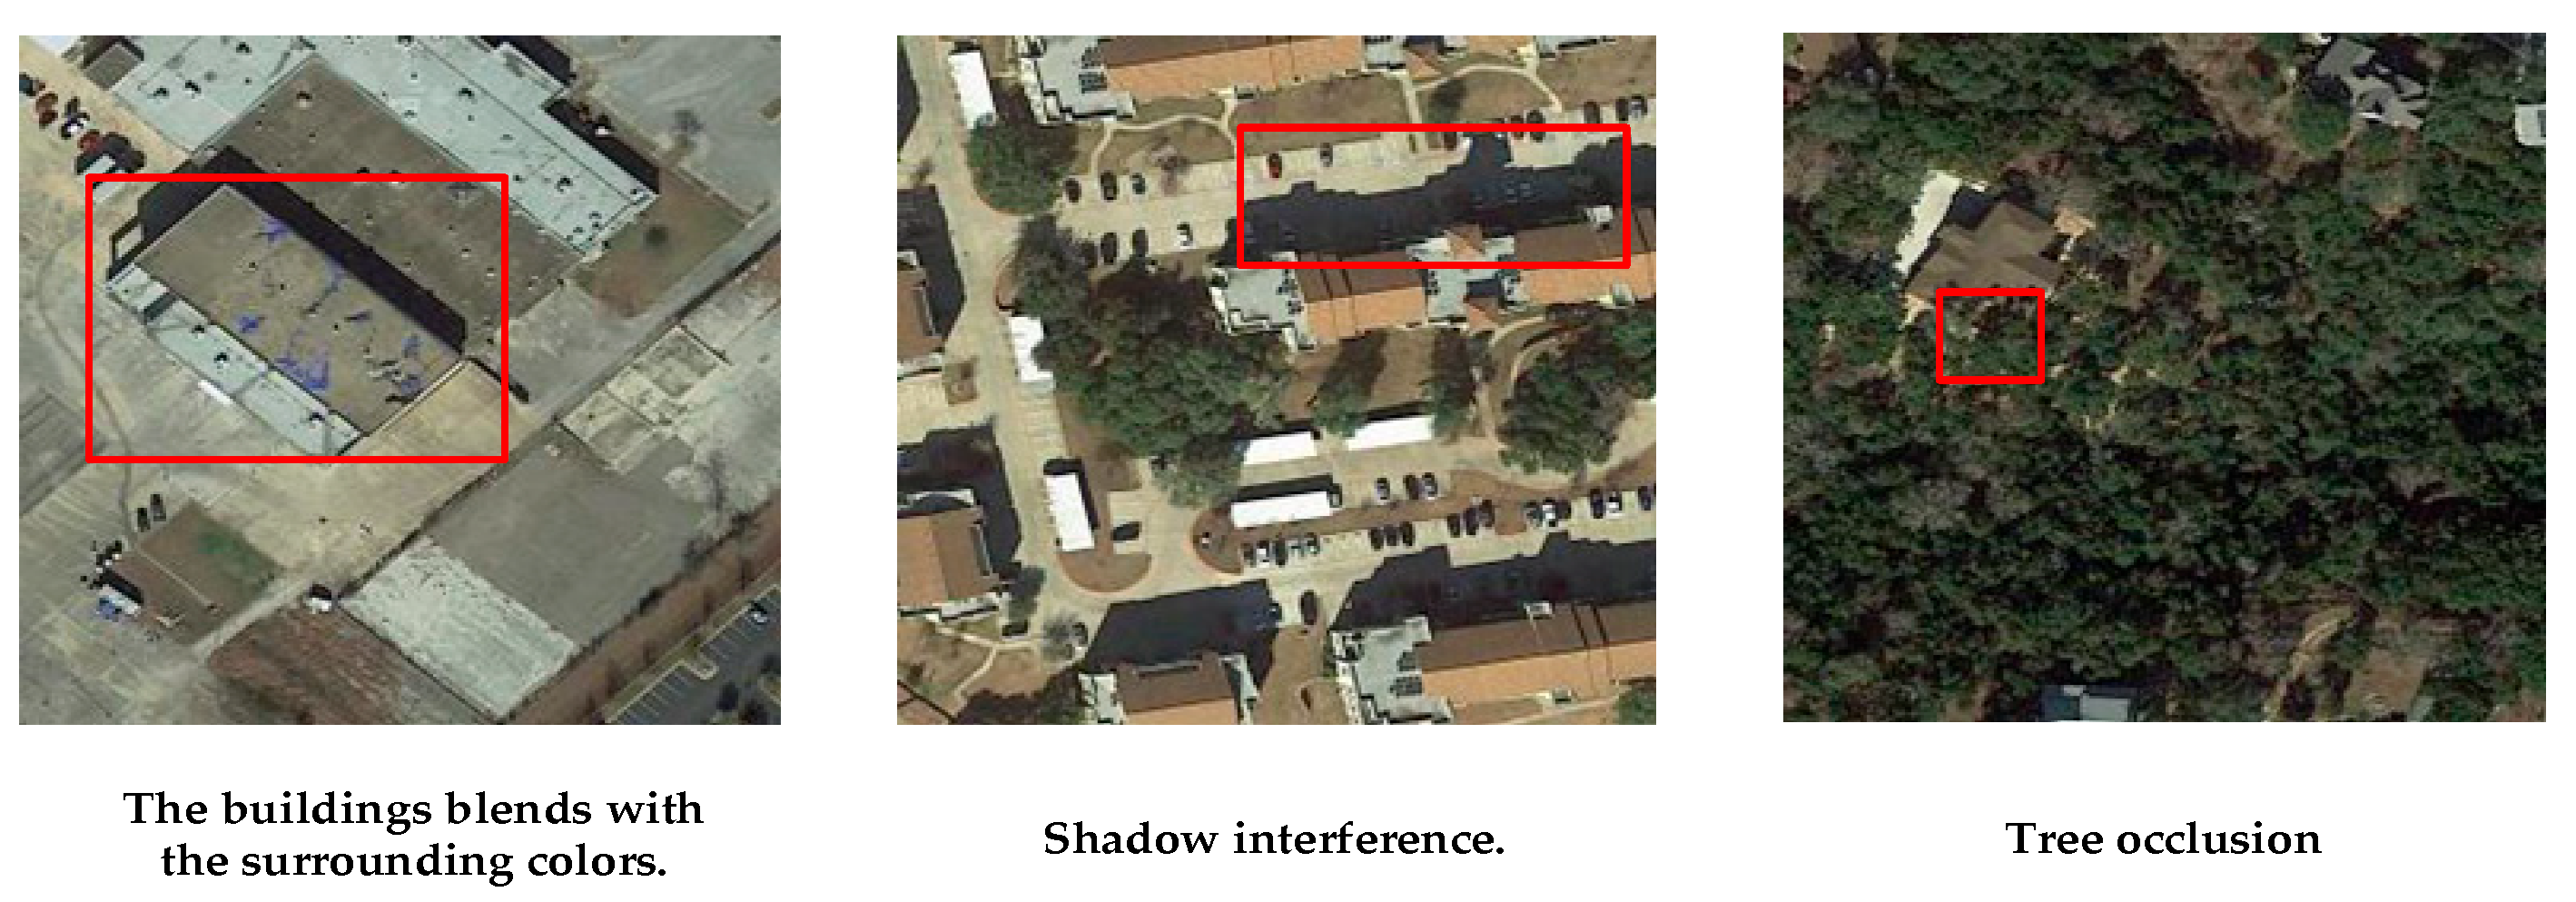
Figure 1. Challenges in detecting building edges in complex environments.
Buildings 15 03549 g001
Figure 2. The schematic diagram of MSSE-CDNet.
Buildings 15 03549 g002
Figure 3. The structure of the CNN feature extraction module.
Buildings 15 03549 g003
Figure 4. The structure of the adaptive judgment network.
Buildings 15 03549 g004
Figure 5. The process of multi-scale semantic extraction and adaptive fusion.
Buildings 15 03549 g005
Figure 6. The structure of the multi-scale semantic token extractor.
Buildings 15 03549 g006
Figure 7. Visualization results of different models on the LEVIR-CD dataset. The first and second rows represent remote sensing images at two time points, T1 and T2, where am represent the images of different regions. The third row, GT, stands for Ground Truth, which represents manually annotated data. The letters (an) serve as designations for representative samples selected from the experimental results.
Buildings 15 03549 g007
Figure 8. The result of the building detection when the structure’s color is similar to that of the surrounding environment. The letters (ad) serve as designations for representative samples selected from the experimental results.
Buildings 15 03549 g008
Figure 9. The result obtained under the interference of shadows. The letters (ac) serve as designations for representative samples selected from the experimental results.
Buildings 15 03549 g009
Figure 10. Results under vegetation occlusion. The letters (ac) serve as designations for representative samples selected from the experimental results.
Buildings 15 03549 g010
Table 1. Evaluation results of each model in the public dataset LEVIR-CD.
ModelsPreRecF1IoUOA
FC-Siam-Di [29]89.5383.3186.3175.9298.67
FC-Siam-Conc [29]91.9976.7783.6971.9698.49
DTCTSCN [30]88.5386.8387.6778.0598.77
BIT [16]89.2489.3789.3180.6898.92
SNUNet [31]89.1887.1788.1678.8398.82
MSSE-CDNet91.2589.8390.5382.7098.97
Table 2. Comparison of the efficiency of different models on the LEVIR-CD dataset.
ModelsParameters (M)FLOPs (G)
FC-Siam-Di [29]1.3519.47
FC-Siam-Conc [29]1.5417.06
DTCTSCN [30]41.077.21
BIT [16]3.50210.673
SNUNet [31]12.0327.44
MSSE-CDNet3.52110.727
Disclaimer/Publisher’s Note: The statements, opinions and data contained in all publications are solely those of the individual author(s) and contributor(s) and not of MDPI and/or the editor(s). MDPI and/or the editor(s) disclaim responsibility for any injury to people or property resulting from any ideas, methods, instructions or products referred to in the content.