Article

A Comparative Experimental Study on Seismic Retrofitting Techniques for RC Frames: RC Jacketing, Steel Jacketing, and Base Isolation

College of Civil and Transportation Engineering, Shenzhen University, Shenzhen 518060, China
*
Author to whom correspondence should be addressed.
Buildings 2025, 15(19), 3539; https://doi.org/10.3390/buildings15193539
Submission received: 4 September 2025 / Revised: 20 September 2025 / Accepted: 30 September 2025 / Published: 1 October 2025

Abstract

Earthquakes can cause significant damage to structures, resulting in considerable financial and social losses. Enhancing the seismic capacity of existing structures through retrofitting is essential. Traditional seismic retrofitting techniques, such as reinforced concrete (RC) jacketing and steel jacketing, primarily aim to increase structural resistance. But RC jacketing is intrusive and increases mass and stiffness, steel jacketing increases cost and demands careful detailing and both approaches are often inadequate for addressing the dynamic complexities of seismic loading. As an alternative, base isolation systems provide a promising solution by concentrating deformation and energy dissipation within isolation bearings, thereby protecting the superstructure from seismic forces. This study evaluates the effectiveness of base isolation compared with conventional retrofitting methods in enhancing the seismic performance of existing structures. The experimental program included cyclic testing of four RC frame structures: one control specimen and three others retrofitted with RC jacketing, steel jacketing, and lead rubber bearings (LRB). The results indicate that the base-isolated specimen demonstrates superior energy dissipation capacity due to the favorable deformation characteristics of the LRB. Moreover, structural damage is redirected from the original columns to the newly installed transition beams, effectively preserving the integrity of the primary structure. These findings highlight the advantages of base isolation in improving seismic performance and provide valuable experimental evidence supporting its application in the retrofitting of existing structures.

1. Introduction

Earthquakes are among the most destructive natural hazards, consistently posing serious threats to human life and built infrastructure. A significant proportion of earthquake-related casualties and economic losses result from the severe damage or collapse of structures. As the service life of existing structures increases, their performance deteriorates due to material degradation, gradually rendering them noncompliant with current seismic design standards. Therefore, to ensure the continued usability and safety of structures after long-term service, seismic retrofitting has become essential. Professionals and researchers have been compelled to develop innovative procedures and methods to upgrade these structures and protect them from the destructive effects of dynamic loading [1,2,3,4]. To ensure sufficient seismic performance of existing buildings during earthquakes, past studies have investigated various strengthening methods [5,6,7,8]. Three widely adopted retrofitting techniques are reinforced concrete (RC), steel, and fiber-reinforced polymer jacketing [9,10,11,12].
Due to practicality and reliability, RC jacketing is widely applied in retrofitting RC frame structures, with numerous experimental studies validating its effectiveness in increasing the flexural and shear capacity of structural members while also enhancing their ductility [13,14]. In recent years, fiber-reinforced polymers (FRPs) have emerged as an attractive alternative to traditional retrofitting methods, prompting extensive international research on their applications [15,16,17,18]. In parallel, hybrid jacketing, which combines the advantages of multiple retrofitting materials and techniques, has gained popularity and become a major focus of current studies. More recently, the use of engineered cementitious composites (ECC) in combination with other strengthening materials, such as steel meshes, plates, and FRPs, has shown significant potential for restoring or improving the performance of deteriorated structures [6,19,20,21]. Additionally, models for seismic vulnerability assessment of RC structures have also been improved significantly [22,23,24,25]. Likewise, performance-based assessments now emphasize not only strength and stiffness but also failure probabilities, performance levels, and functional recovery, offering a probabilistic framework for evaluating retrofit strategies.
The aforementioned strengthening techniques, i.e., RC, steel, FRP and ECC retrofitting enhance seismic capacity primarily by increasing lateral stiffness, enabling the structure to resist earthquake forces directly. However, this may also attract larger inertial forces, potentially failing to protect critical nonstructural components. In contrast, seismic base isolation reduces seismic demand on the structure by decoupling it from the ground motion. This decoupling reduces base shear and interstory drifts while lengthening the fundamental period of vibration. Numerous studies have confirmed its effectiveness in mitigating seismic responses [26,27,28,29,30,31]. Among available devices, lead rubber bearings (LRBs) are especially popular because of their substantial energy dissipation capacity, ease of installation, tolerance to installation inaccuracies, and minimal maintenance requirements. Advanced analytical models have been developed to simulate the nonlinear, hysteretic, and rate-dependent behavior of LRBs under seismic loading [32].
Past studies confirm the significant effectiveness of LRBs in a variety of buildings. Ziraoui et al. [33] found significant seismic response reduction in mid-rise RC structures (eight and ten stories) with LRBs systems, while Fakih et al. [34] reported that based isolation in a 48-story high rise in Beirut reduced displacement, interstory drift, base shear and acceleration. Other studies also address more complex configurations, with Mahamied et al. [35] highlighting the effects of vertical irregularity and pulse-like ground motions on low-rise buildings. Faiella et al. [36] proposed a retrofitting strategy using interstory isolation for masonry buildings. The properties of base isolators are also significant, as Li et al. [37] showed that lower stiffness can improve isolation efficiency. Furthermore, Khan et al. [38] demonstrated that performance varies with isolator type and earthquake source, noting that some systems could perform worse than un-isolated structures under specific conditions. It is summarized that although numerous studies have investigated base isolation, most have focused on its application in new construction. By contrast, relatively few studies address the specific complexities and challenges associated with retrofitting existing structures.
Meanwhile, to date to the best of authors knowledge, there are no direct comparisons of the use of base isolation with traditional strengthening techniques to identical RC frame specimens under consistent testing conditions. The proposed study addresses this gap by investigating the retrofitting performance of LRBs for existing identical RC frame structures under consistent testing conditions and further comparing the results with that of RC jacketing and steel jacketing retrofitting techniques. The seismic behavior of four RC frame specimens was experimentally evaluated using cyclic loading tests. The test specimens included a control specimen and three specimens retrofitted with RC jacketing, steel jacketing, and LRBs. Experimental discussions covered the failure pattern, load–displacement hysteretic behavior, strain demand of steel reinforcement, stiffness degradation, and energy dissipation. This study investigated the effectiveness of the LRB isolation system in improving the seismic capacity of RC structures, and the results will help decision-making for retrofitting existing structures in earthquake-prone areas.

2. Experimental Program

2.1. Specimen Details

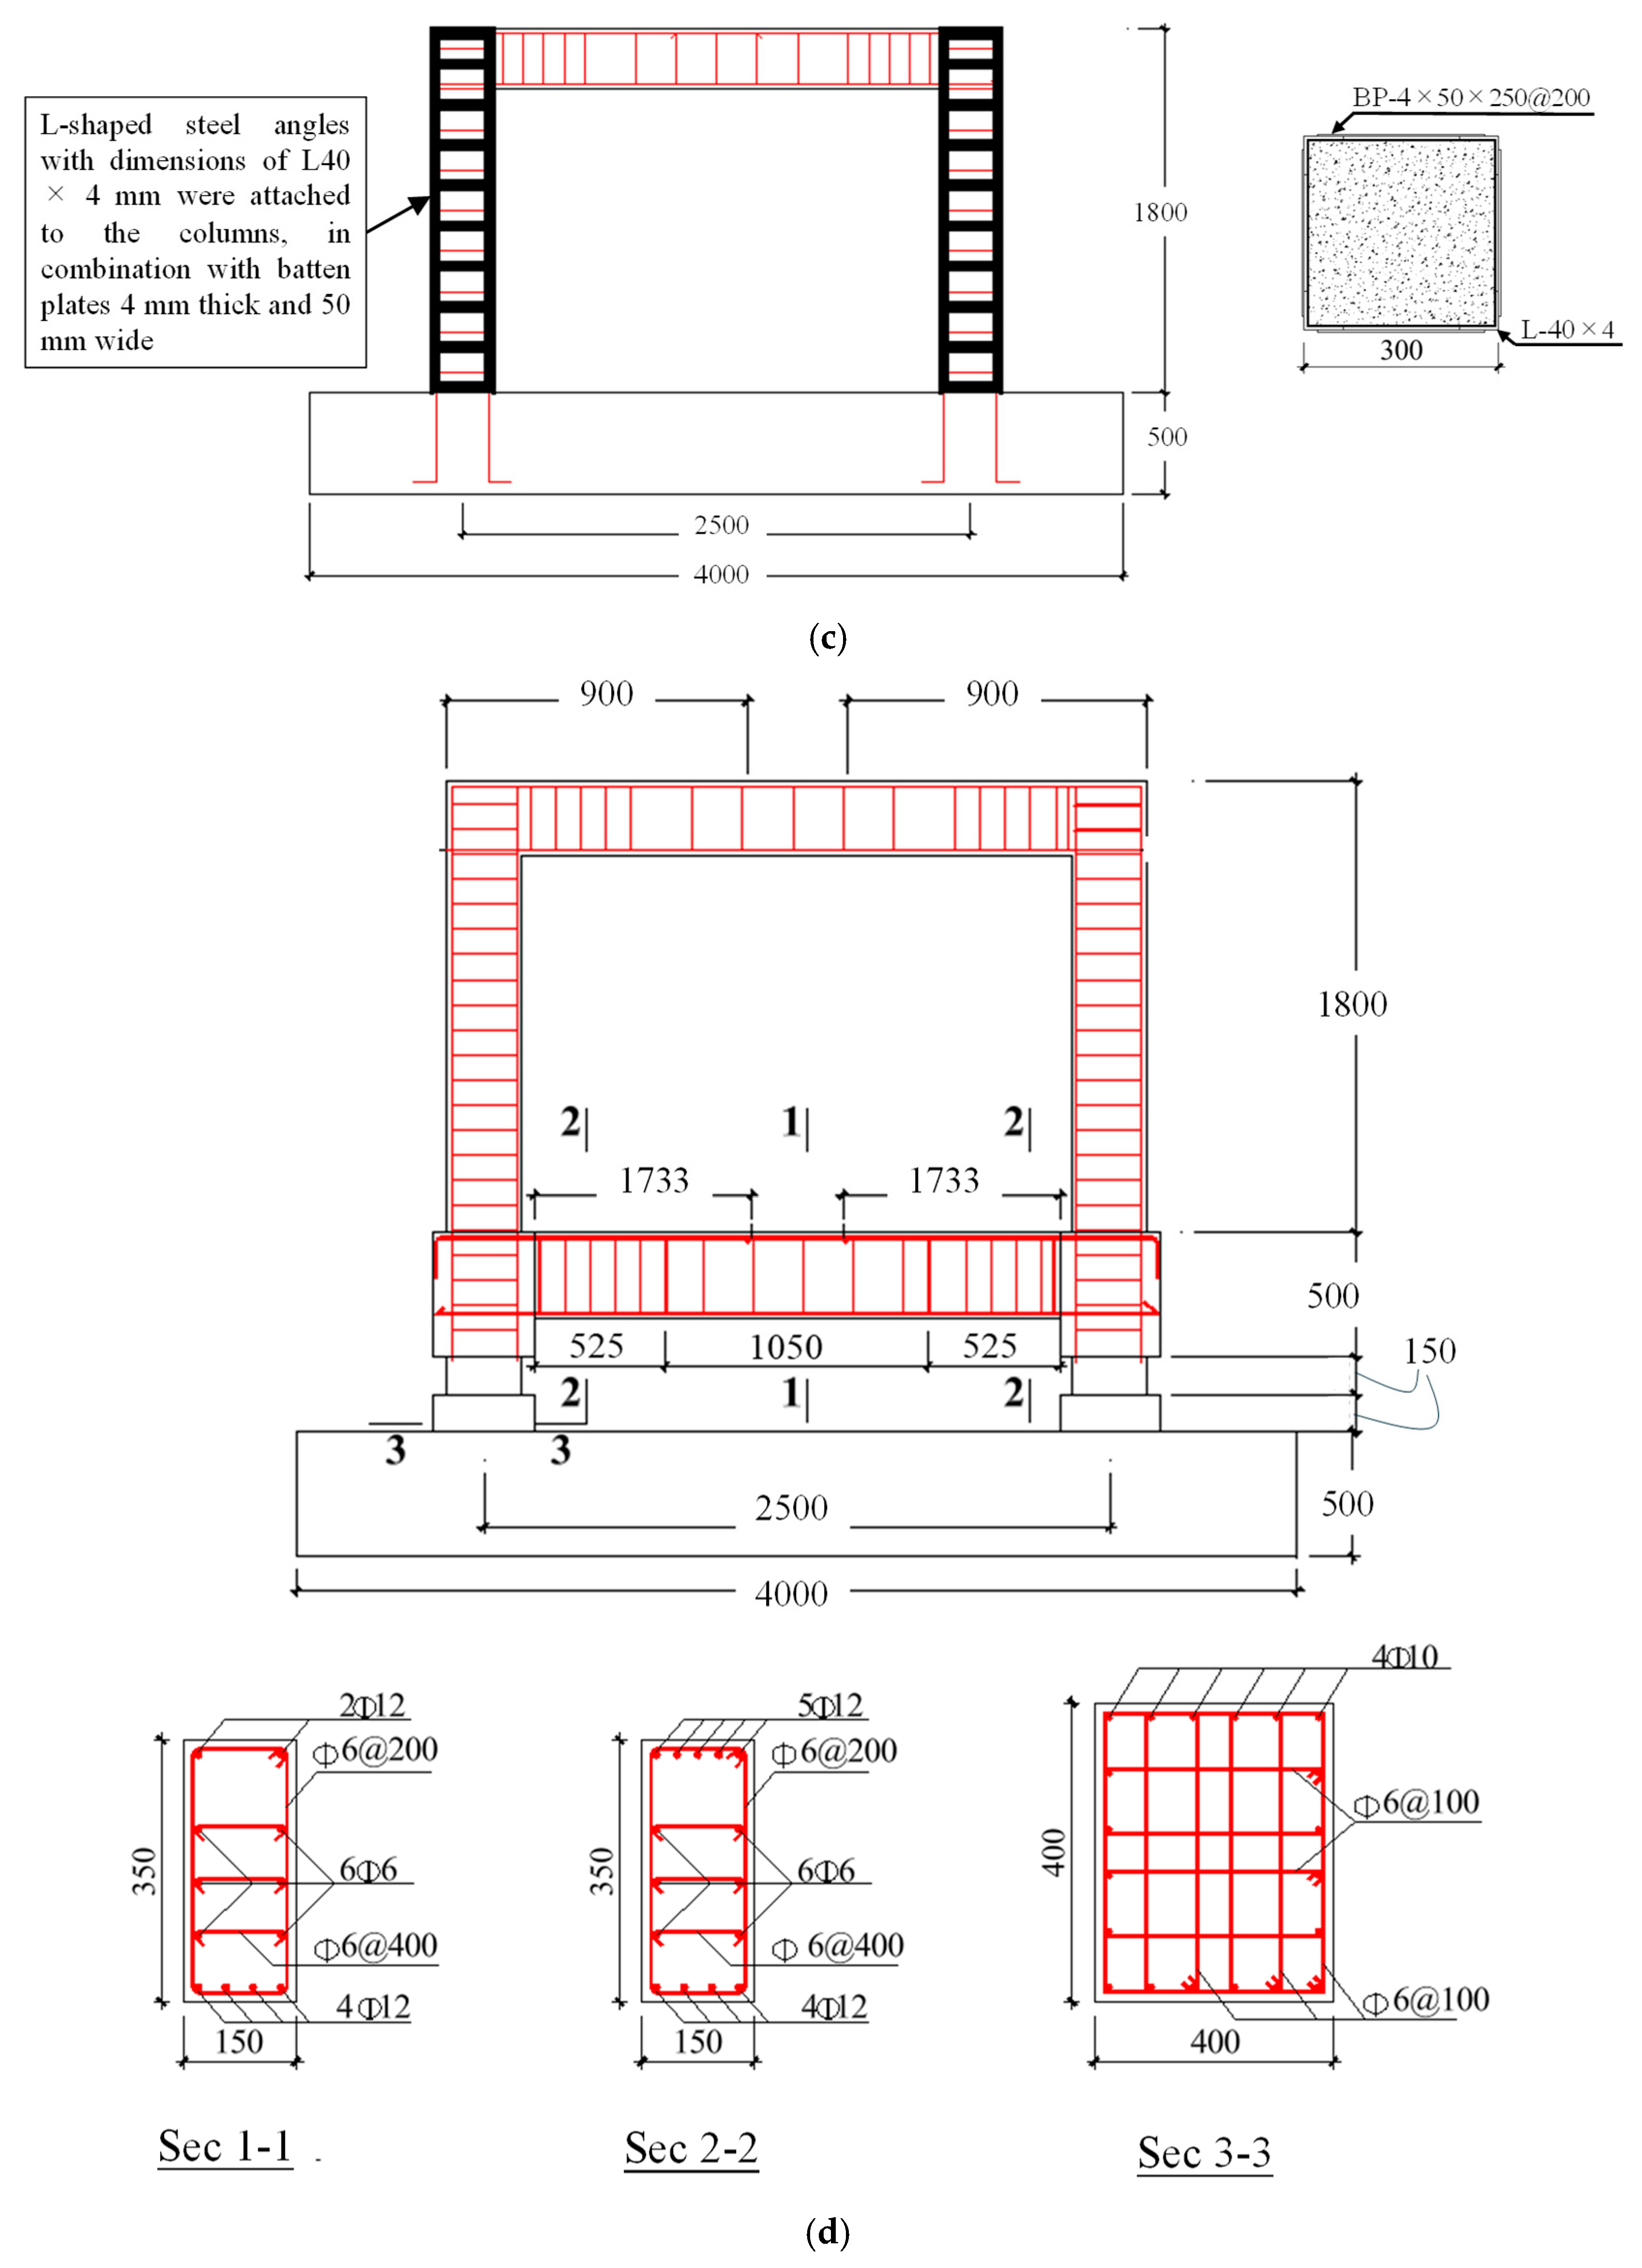
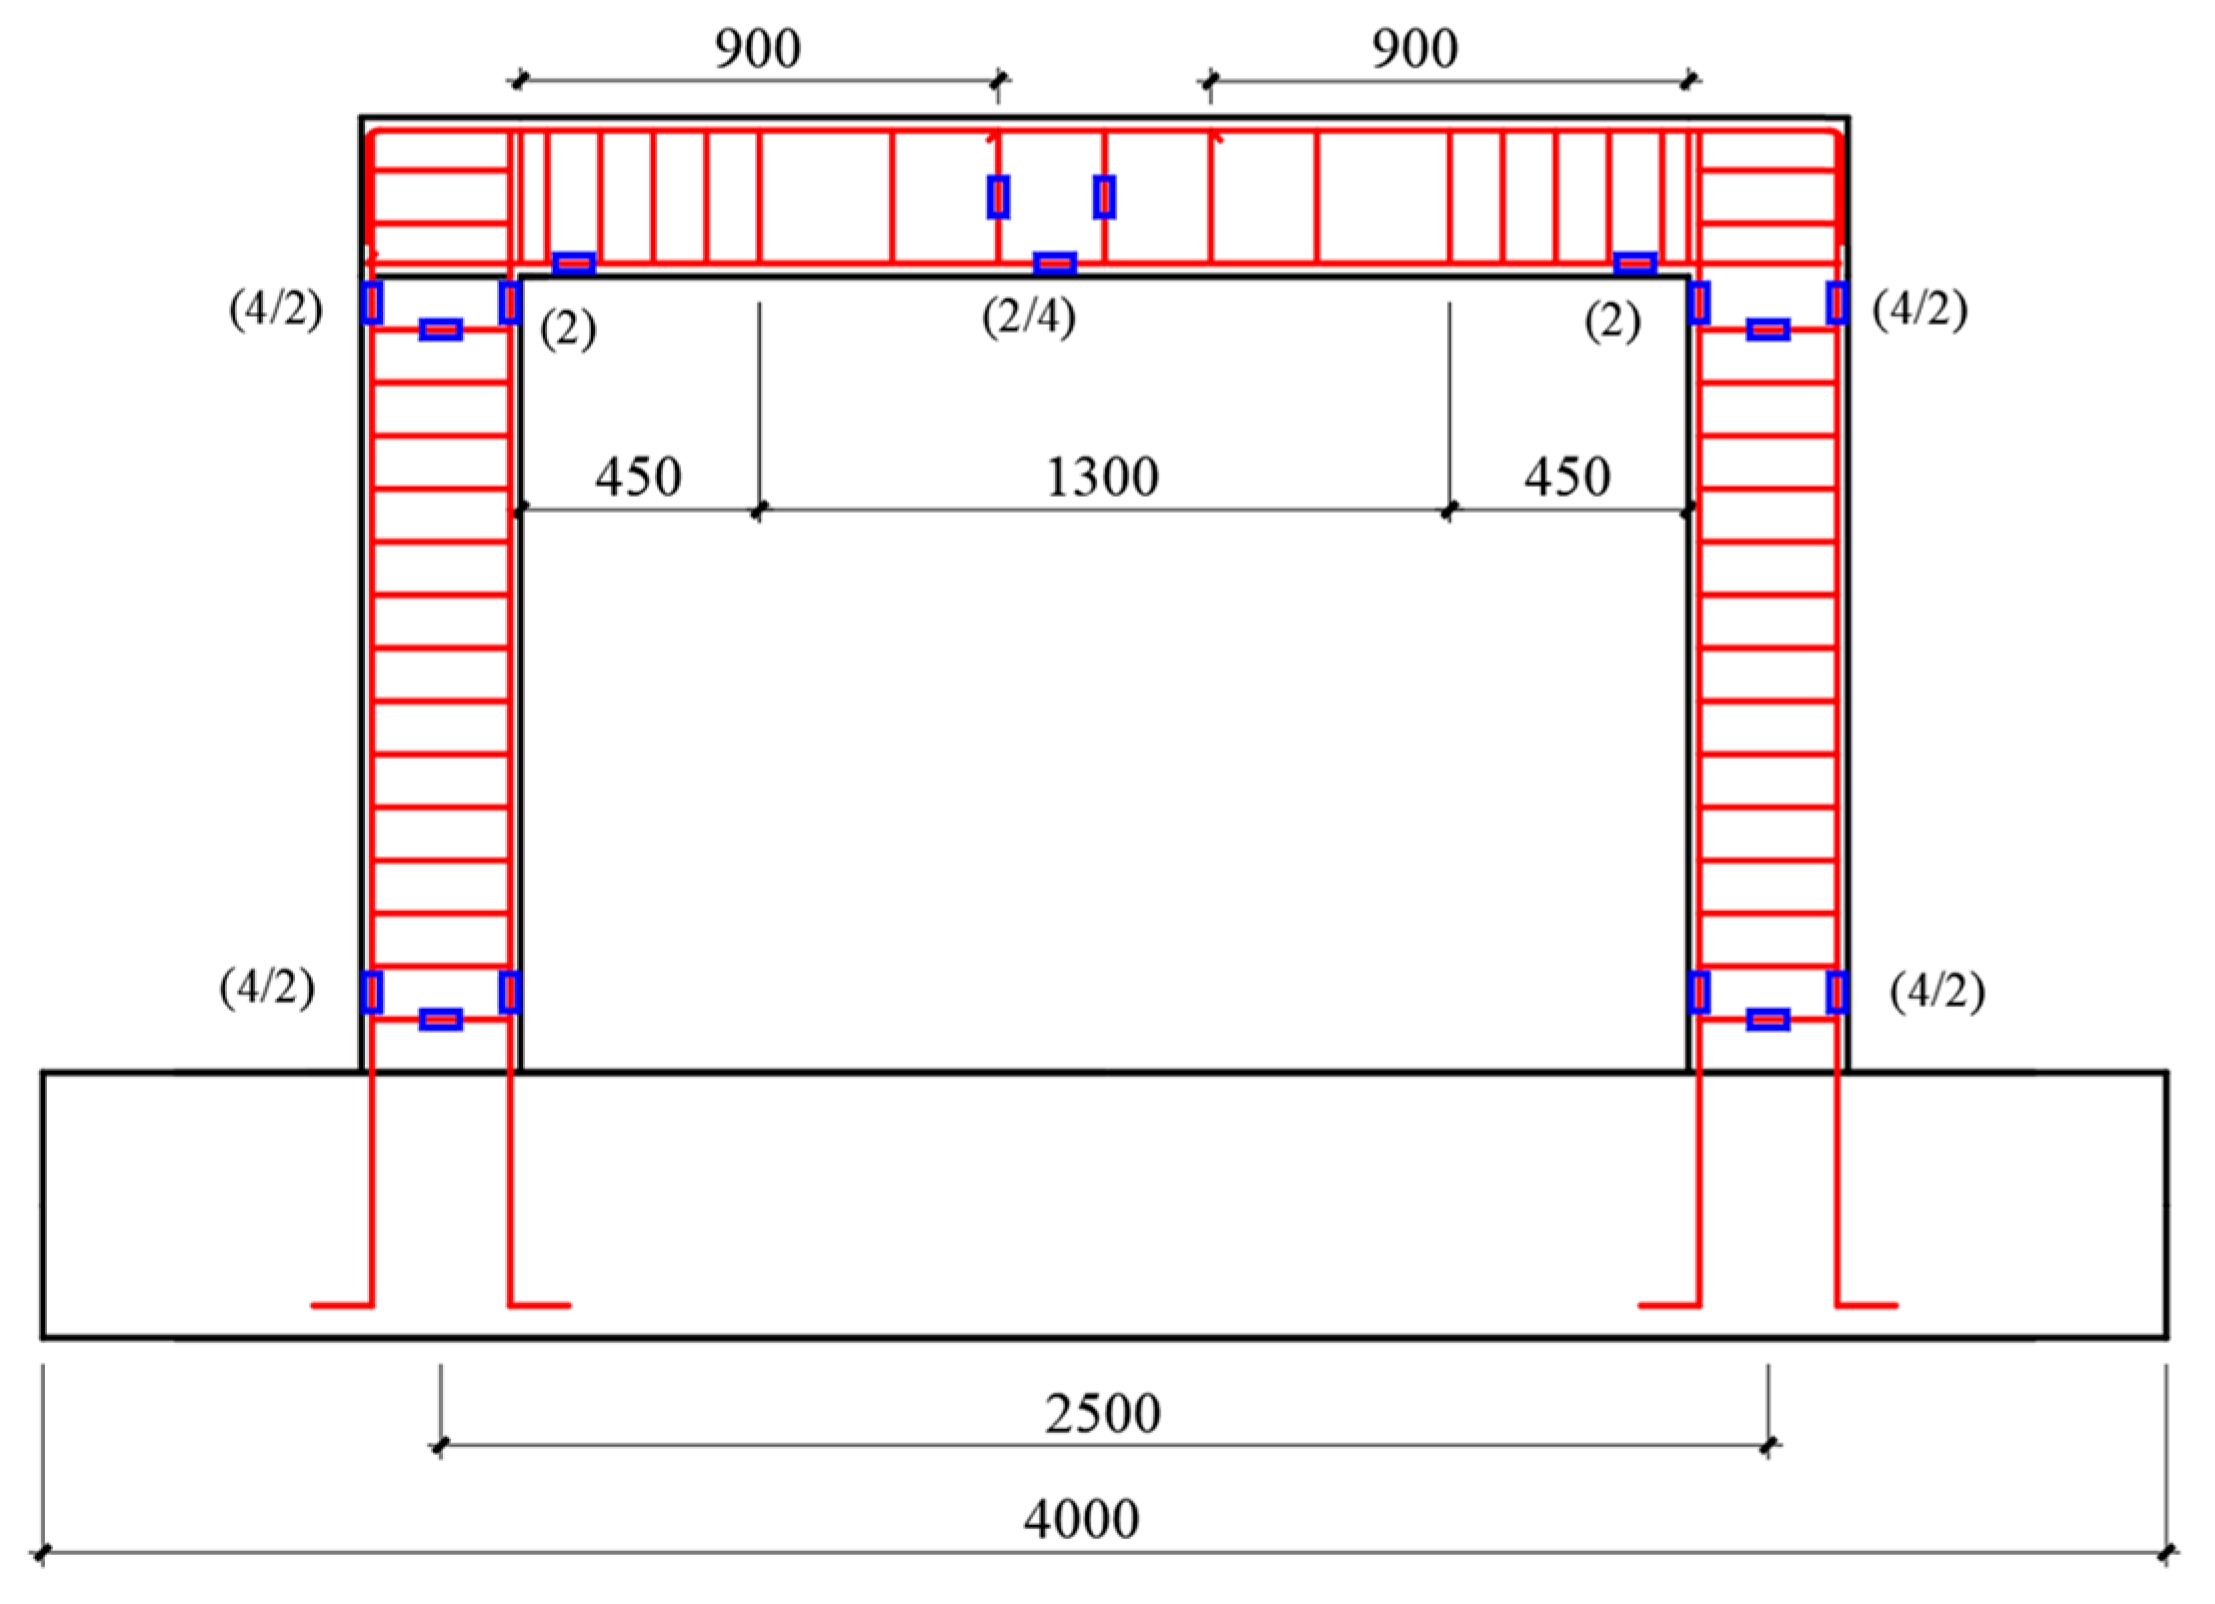
In this paper, four RC frame specimens were designed: one un-retrofitted RC frame, one frame retrofitted with RC jacketing, one frame retrofitted with steel jacketing; and one frame retrofitted with base isolation using LRBs. The specimens were designated F1, F2, F3, and F4, where F1 represents the un-retrofitted RC frame; F2 represents the frame retrofitted with an RC jacket; F3 represents the frame retrofitted with a steel jacket; and F4 represents the frame retrofitted with base isolation. Figure 1a shows the specimen design of the un-retrofitted RC frame, F1. The specimen was a half-scale frame representing the first floor of an actual five-story building. The column had a cross-sectional size of 300 mm × 300 mm and a height of 1800 mm. It was longitudinally reinforced with twelve HRB 400 bars, each 10 mm in diameter. The beam dimensions were 150 mm in width, 300 mm in height, and 2500 mm in length. The beam included five HRB 400 longitudinal bars, each 10 mm in diameter (two on the top and three on the bottom). In the RC and steel jacketing cases (i.e., specimens F2 and F3), only the columns were strengthened, and no additional strengthening was applied to the beams. Figure 1b,c show the details of the retrofitted specimens F2 and F3. For the specimen retrofitted with an RC jacket, the cross-sectional dimensions of each frame column were increased from the original 300 × 300 mm to 400 × 400 mm. For the specimen retrofitted with a steel jacket, L-shaped steel angles with dimensions of L40 × 4 mm were attached to the columns, in combination with batten plates 4 mm thick and 50 mm wide, spaced at 200 mm intervals.
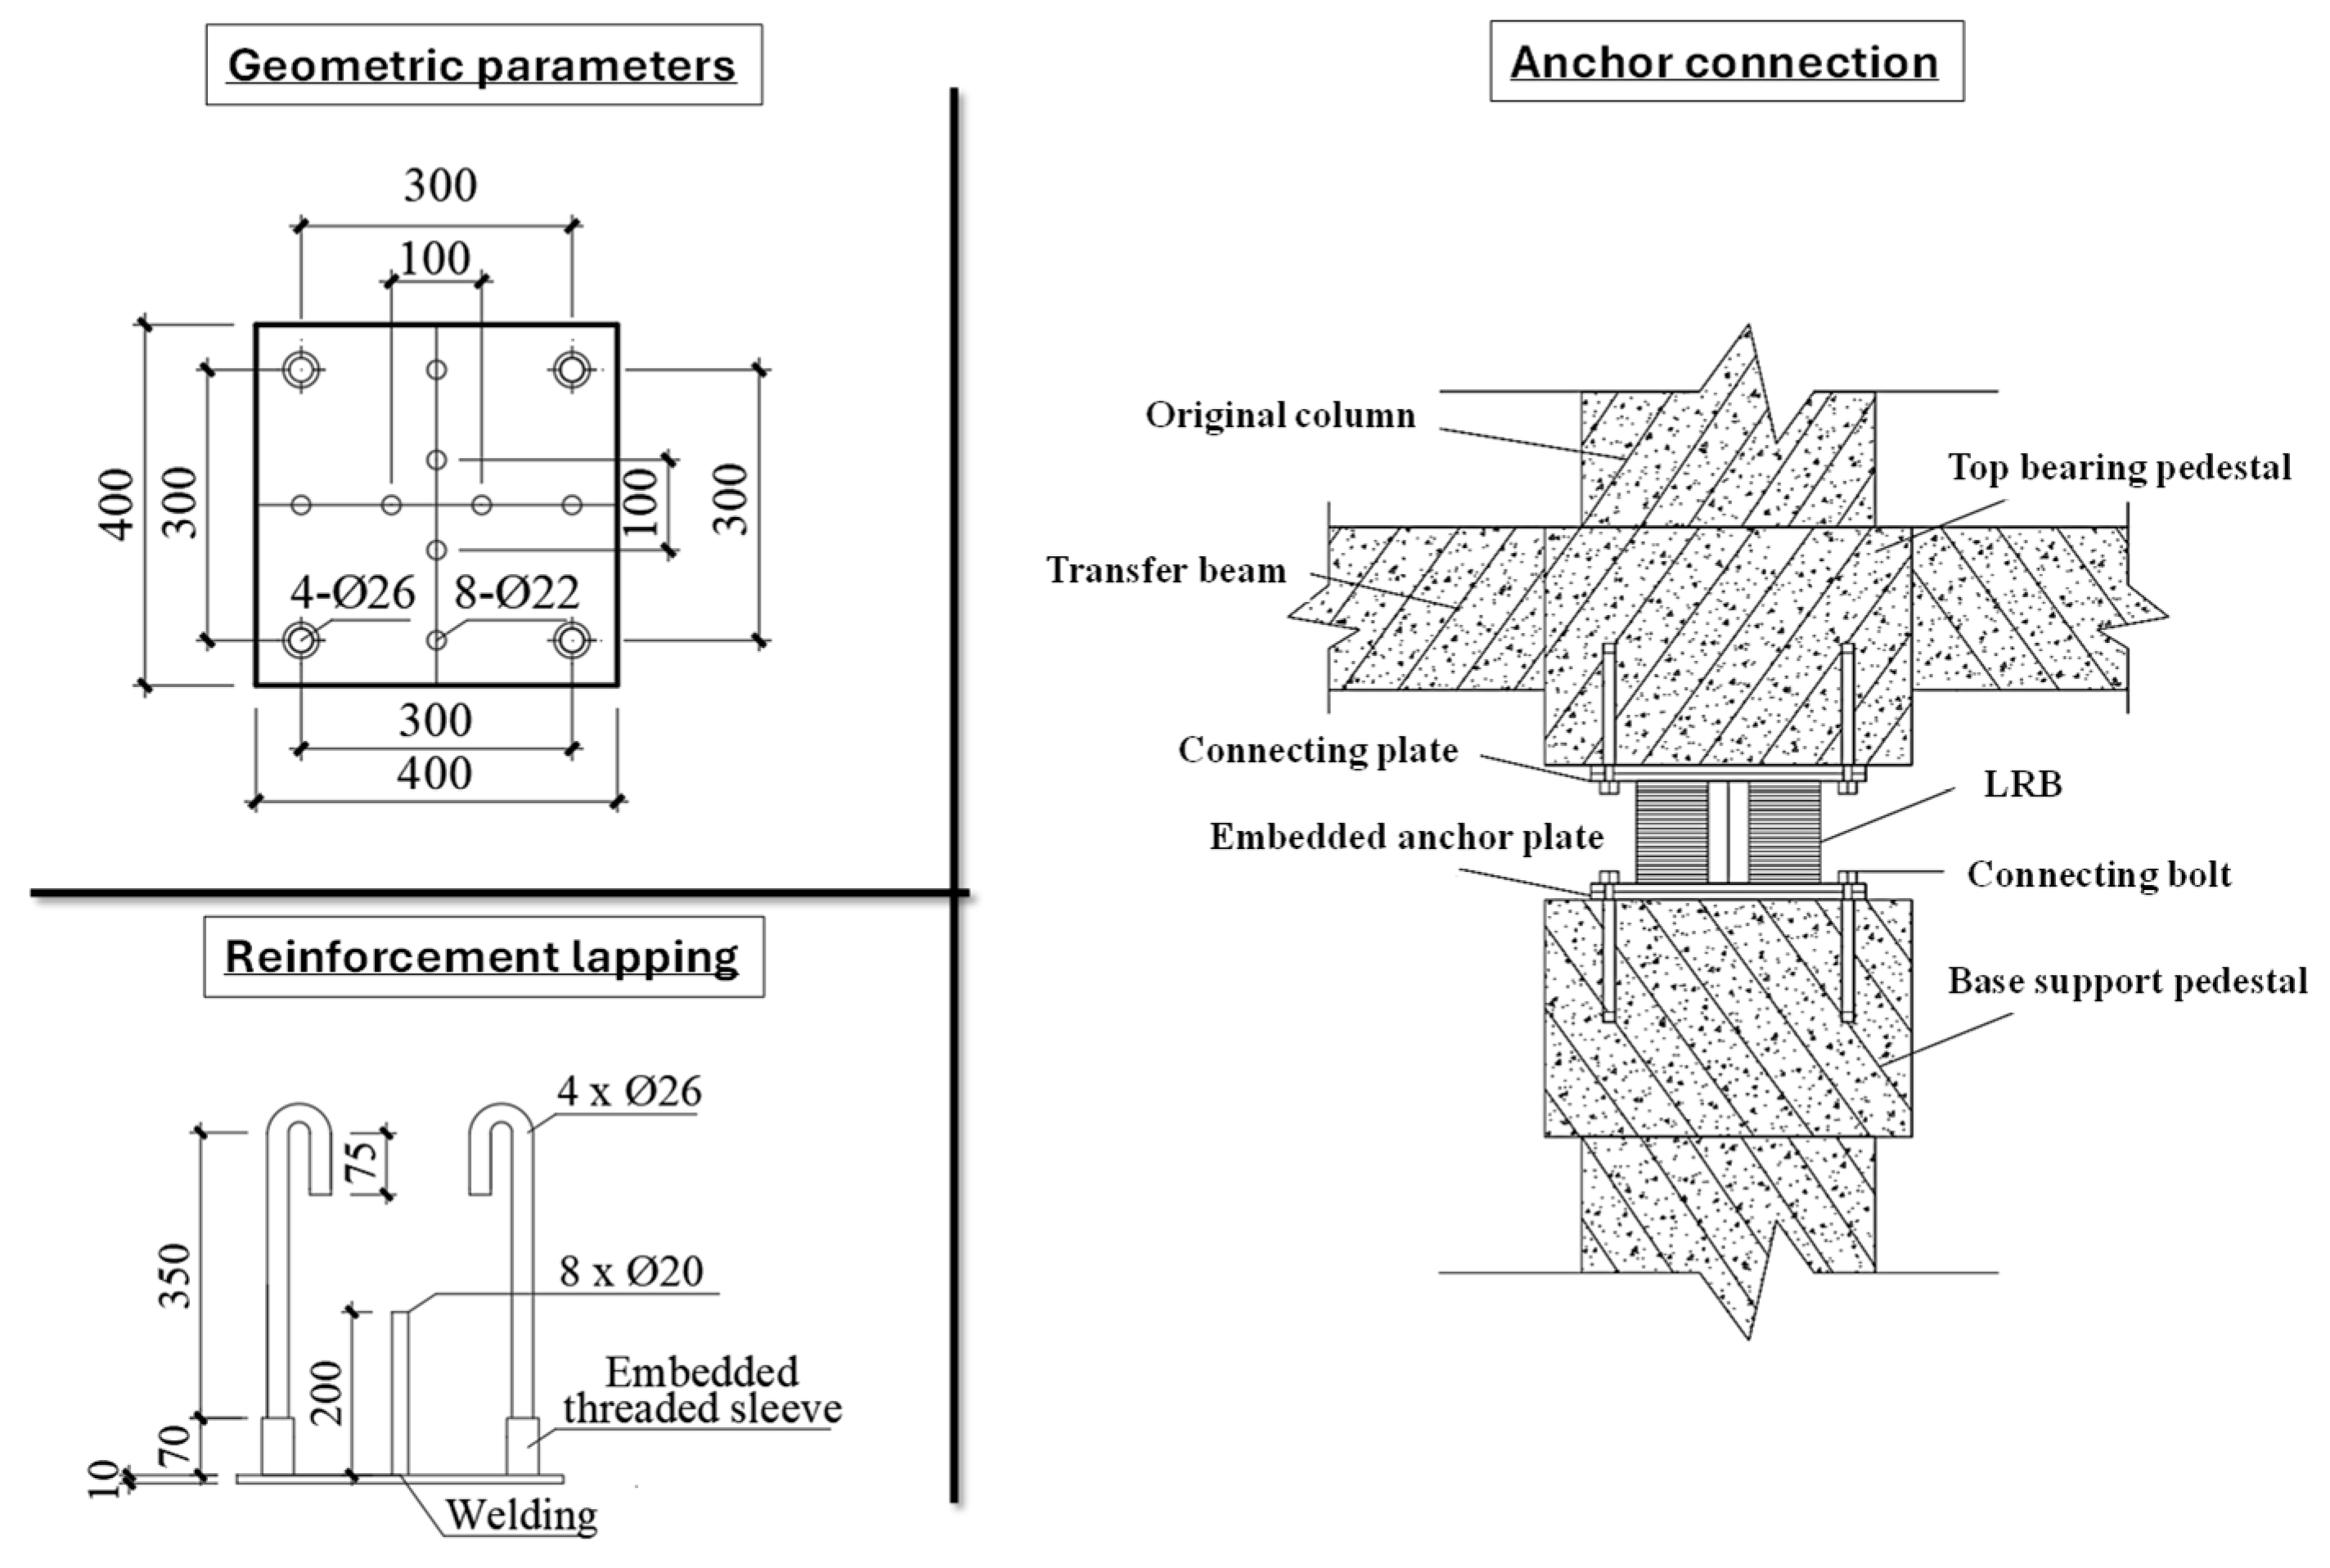
For the specimen retrofitted with base isolation (specimen F4) shown in Figure 1d, it should be noted that the connection between the LRBs and the structure needed to be integral during testing to prevent separation between the superstructure and substructure. Therefore, a dedicated connection system was designed. The geometry of the pre-embedded anchorage plate and the LRB connection configuration is shown in Figure 2. The construction process of F4 specimen involved casting the frame columns separately and subsequently anchored to the foundation by pedestals. This anchorage of columns to pedestals includes setting the upper pedestals under the column bases and the lower pedestal at the top of the foundation and embedding steel plates within the column reinforcement. The pedestals were then cast to improve the anchorage between the steel plates and the column concrete. Additionally, a transfer beam was cast between the two upper pedestals. After the concrete reached its design strength at 28 days, high-strength bolts were used to connect the LRBs to the pre- embedded steel plates in the columns, completing the assembly of the foundation, LRBs, and superstructure. It is noted that the LRBs were anchored to reinforced concrete pedestals monolithically connected to the foundation slab, while the transfer beams were fixed to the isolator top using steel baseplates and high-strength bolts. This anchorage detail was designed to replicate the boundary conditions between the foundation and superstructure in practice, consistent with typical installation procedures for base-isolated buildings. It is pertinent to mention that the base-isolated specimen included additional transfer beams to accommodate the isolators while the RC and steel jacketing strengthened only the columns. This design difference may influence the comparison of retrofit strategies, but this study reflects the practical requirements of base isolation in real applications. The results emphasize relative performance trends under realistic retrofit configurations.
It is noted that only one specimen was tested for each retrofitting technique, which is a common limitation in large-scale structural experiments due to cost and resource constraints. Additionally, it is noted that all the specimens were designed at a 1:2 geometric scale to accommodate laboratory space and loading system capacity. Similitude principles were followed in terms of geometric proportions and reinforcement ratios, ensuring that the primary failure mechanisms and relative performance trends are representative of full-scale structures. Although full dynamic similitude in material properties could not be strictly achieved, the comparative nature of the study evaluating different retrofitting strategies under consistent conditions remains valid.

2.2. Material Properties

All specimens were cast using same batch of commercial concrete with a design strength grade of C30. In accordance with GB/T 50081-2019 [39], three standard concrete cubes with dimensions of 150 × 150 × 150 mm were prepared and tested at 28 days to determine the average compressive strength. The measured compressive strength of the concrete was 34.3 MPa. The Q235 structural steel angles and batten plates were used from a single production lot, and the reinforcement bars were also used from single production lot. Longitudinal reinforcement consisted of HRB400 steel bars with diameters of 6 mm, 10 mm, and 12 mm, while stirrups were fabricated from HPB300 steel bars. Tensile tests were conducted in accordance with GB/T 228.1-2021 [40]. The mechanical properties of the reinforcement are summarized in Table 1.

2.3. LRB Performance Parameters

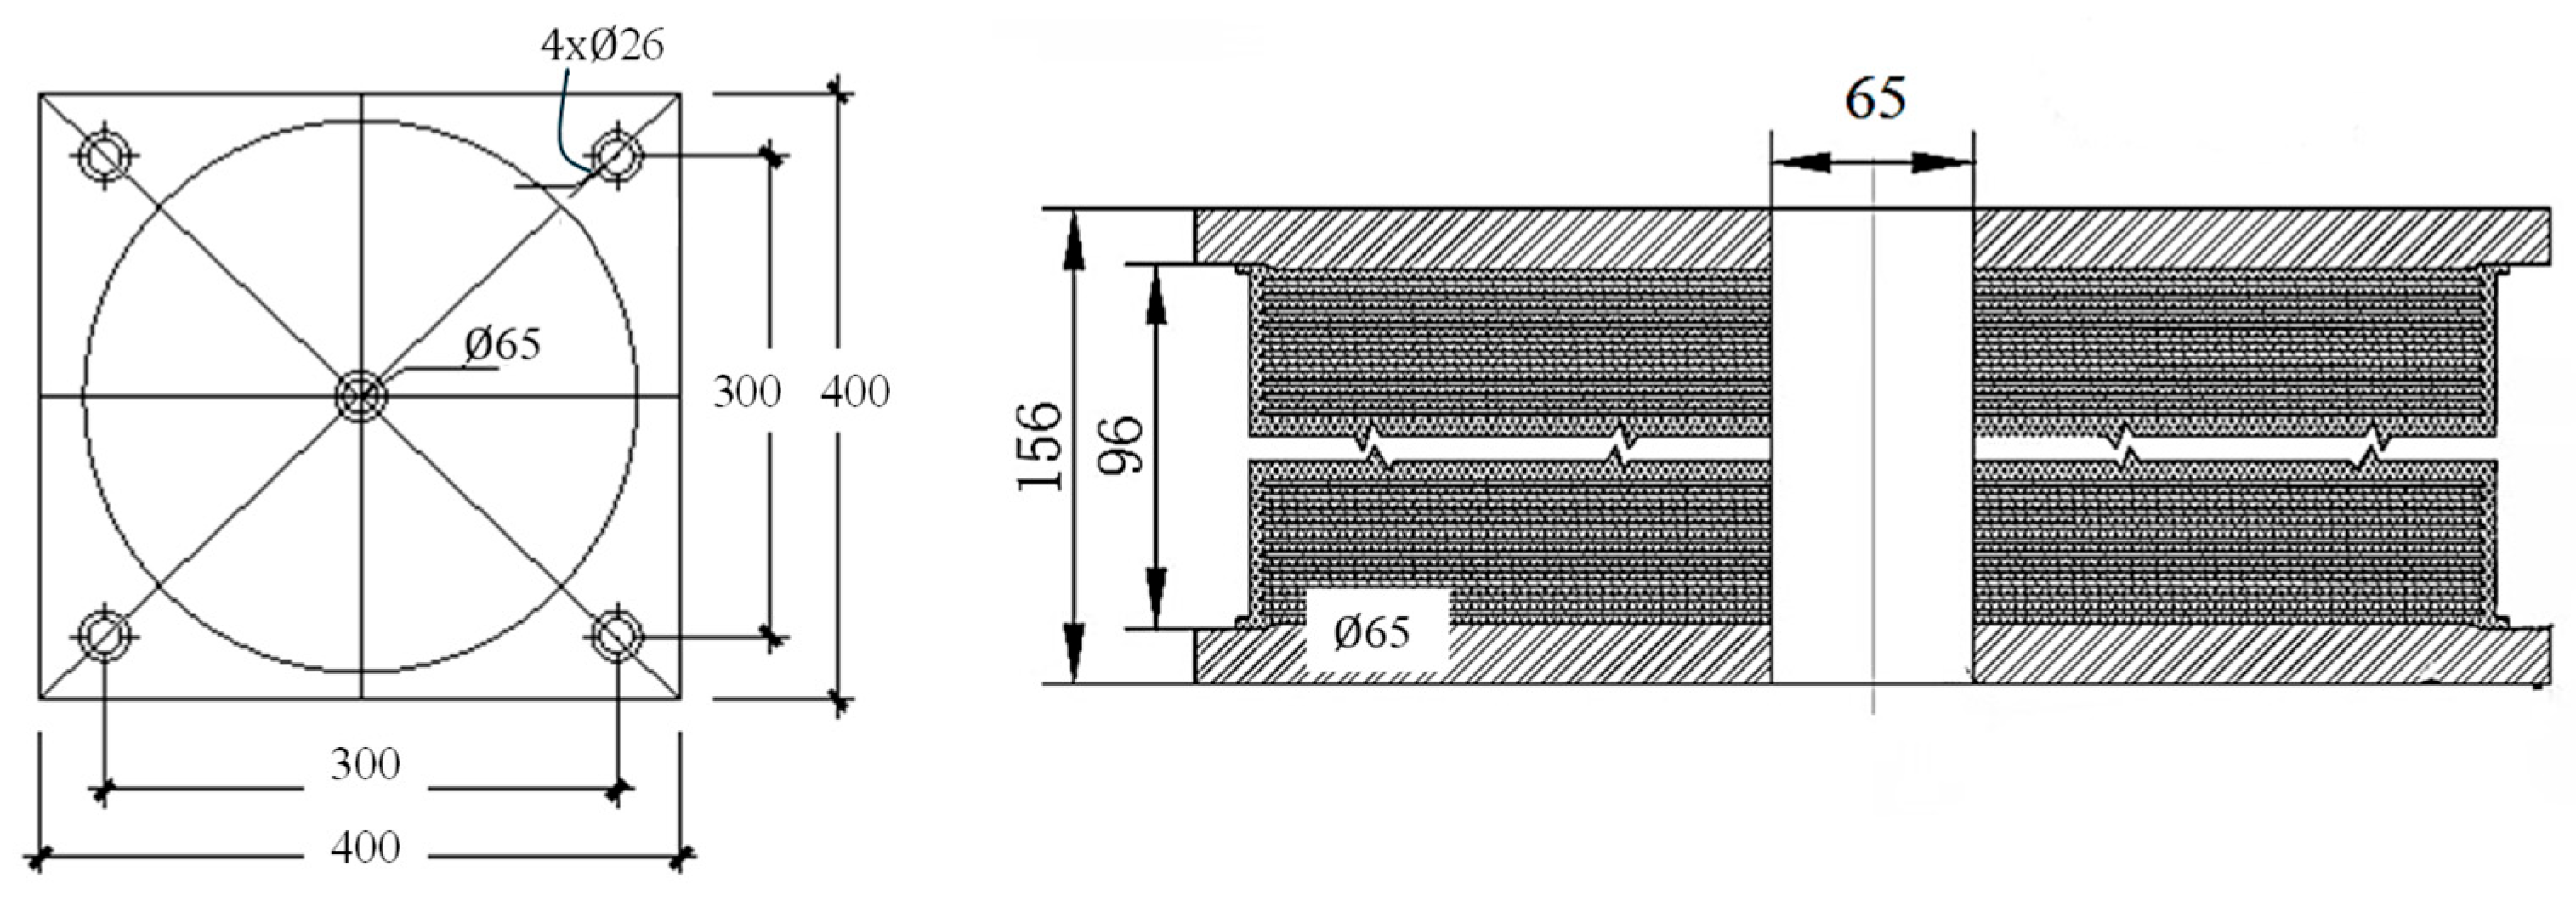
Two LRBs were used in the base isolation specimen. The design configuration of the LRBs is shown in Figure 3. The performance parameters of LRB are presented in Table 2. Each bearing was circular in cross-section and consisted of 20 layers of rubber. The diameter of each rubber layer was 300 mm. Both the top and bottom steel plates had a thickness of 30 mm, and the overall plate size was 400 × 400 mm. A lead core with a diameter of 65 mm was embedded at the center of each bearing. The first shape factor was calculated as S1 = (Dd)/4tr, and the second shape factor as S2 = D/(ntr), where D is the rubber layer diameter, d is the lead core diameter, tr is the thickness of a single rubber layer, and n is the number of rubber layers. The first and second shape factors were 20.26 and 5.17, respectively.

2.4. Loading Protocol

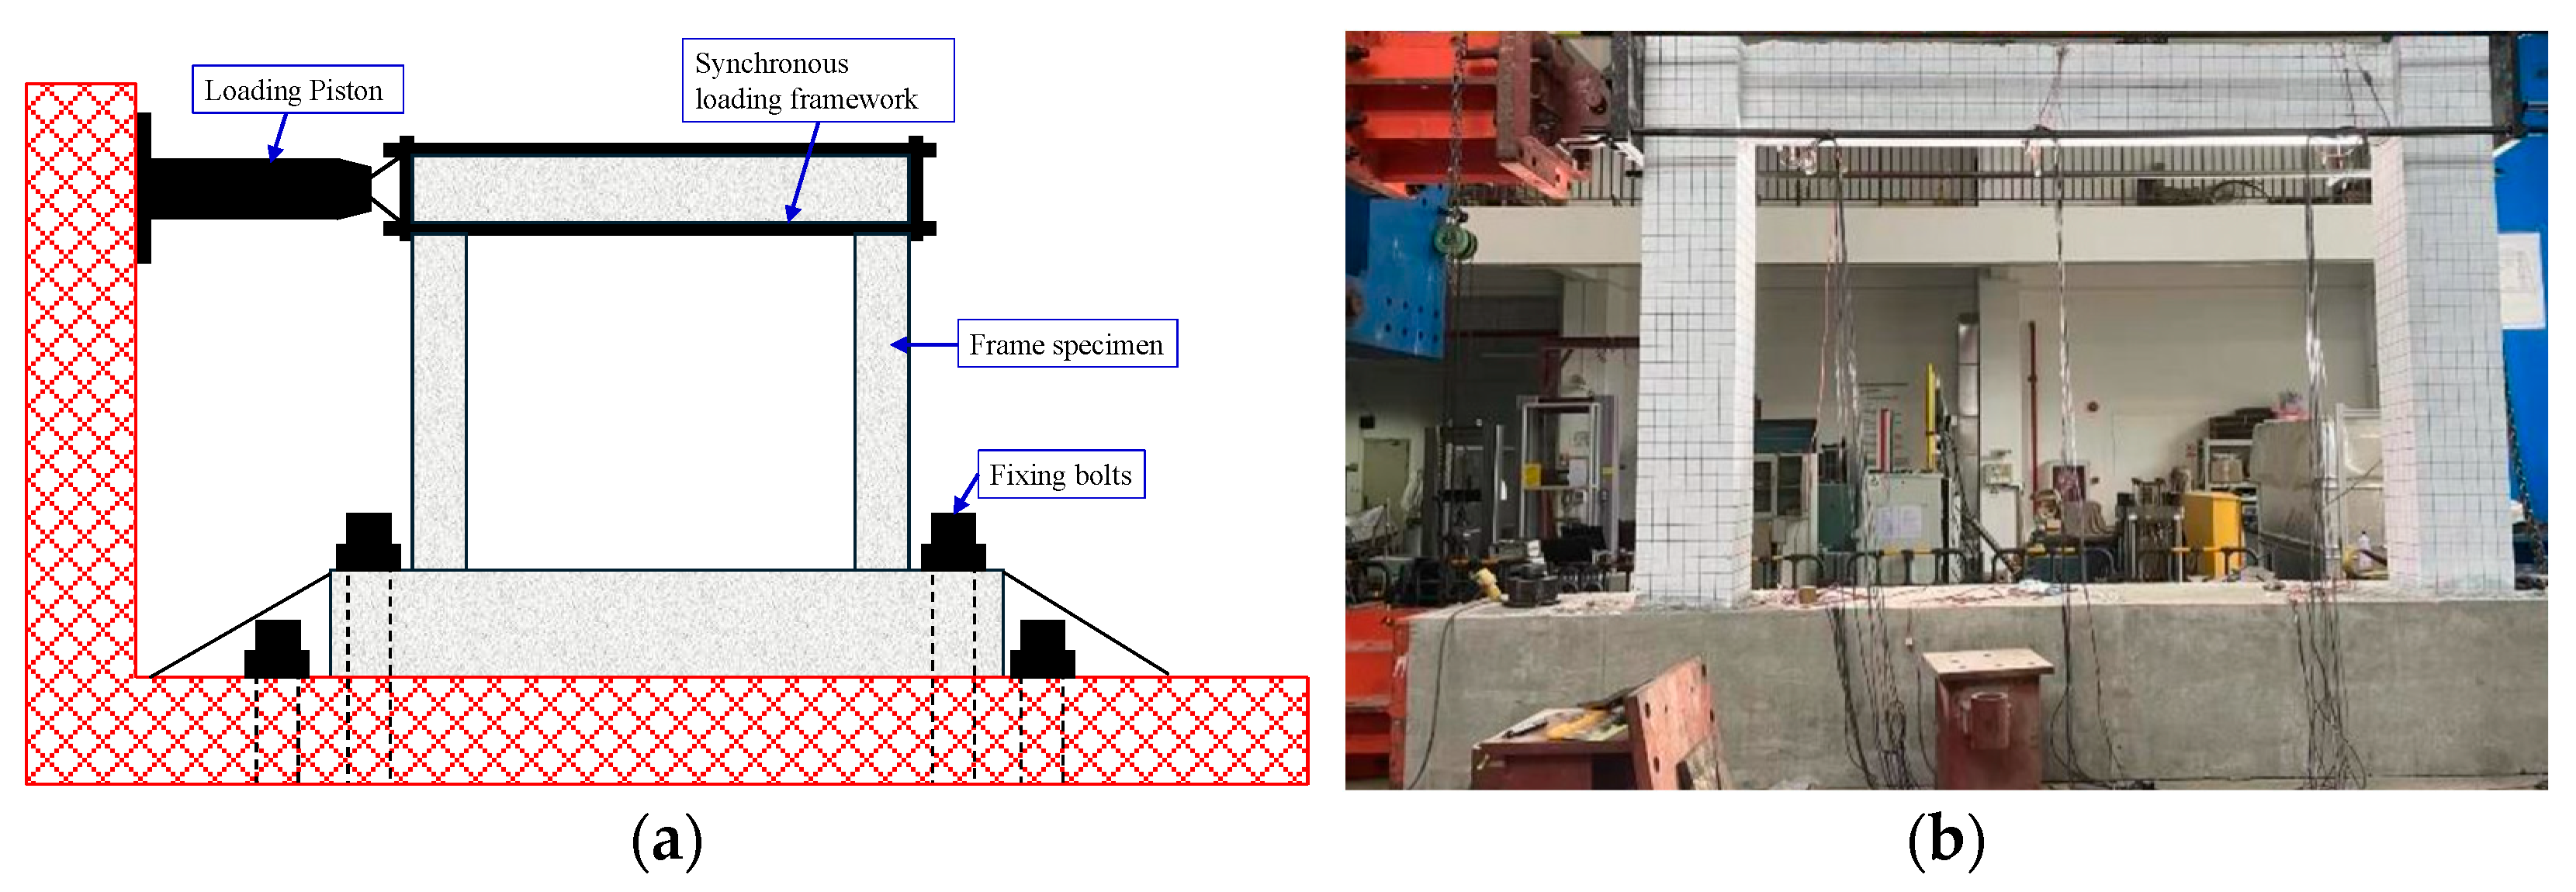
The lateral cyclic loading on the frame was applied by a loading system, as shown in Figure 4. The test adopted was displacement control. The complete loading protocol his-tory is shown in Figure 5.
The lateral loading direction was classified into positive and negative directions, denoted by + and −, respectively. For the non-base isolation specimens, the initial loading step was 1 mm until the specimen reached the yield displacement. After that, the incremental displacement was changed to 0.4Δy, with three cycles performed at each level. For the base isolation specimen, the initial step was 2.5 mm, which was increased to 5 mm after the displacement reached 15 mm. When the bearing deformation became large, the step was further adjusted to 15 mm, with loading carried out in two cycles. It should be noted that the loading protocol for the isolated specimen (F4) was slightly modified relative to the fixed-base specimens in order to accommodate the much larger displacement capacity of the isolation system. This adjustment reduced the number of low-amplitude cycles, avoiding an excessively long test duration while still capturing the essential nonlinear behavior of the isolators.

2.5. Strain Gauge Arrangement and Loading Measurement

To accurately capture the stress state of each specimen during testing, strain gauges were installed on the longitudinal and stirrup reinforcement at the top and bottom of the columns, as well as at the beam ends and mid-spans at critical locations. For the base-isolated specimen, which included an additional transfer beam, strain gauges were also installed on the longitudinal reinforcement at the transfer beam ends and at the bottom of the mid-span. The layout of the strain gauge measurement points is shown in Figure 6.
Lateral forces and displacements were recorded using the force-displacement transducers integrated into the loading system, with an additional linear variable differential transformer (LVDT) installed at the end of the frame beam for calibration. In the base-isolated specimen, an LVDT was positioned at the upper pedestal locations to record the LRB displacements. At each load step, visible cracks were marked on the surface of the structure, and load and strain data were recorded using a data acquisition system. This provided a detailed account of crack propagation and deformation behavior throughout the loading process up to ultimate failure. Data collection for load and strain began once formal loading began.

3. Experimental Results and Discussion

3.1. Cracking and Failure Patterns

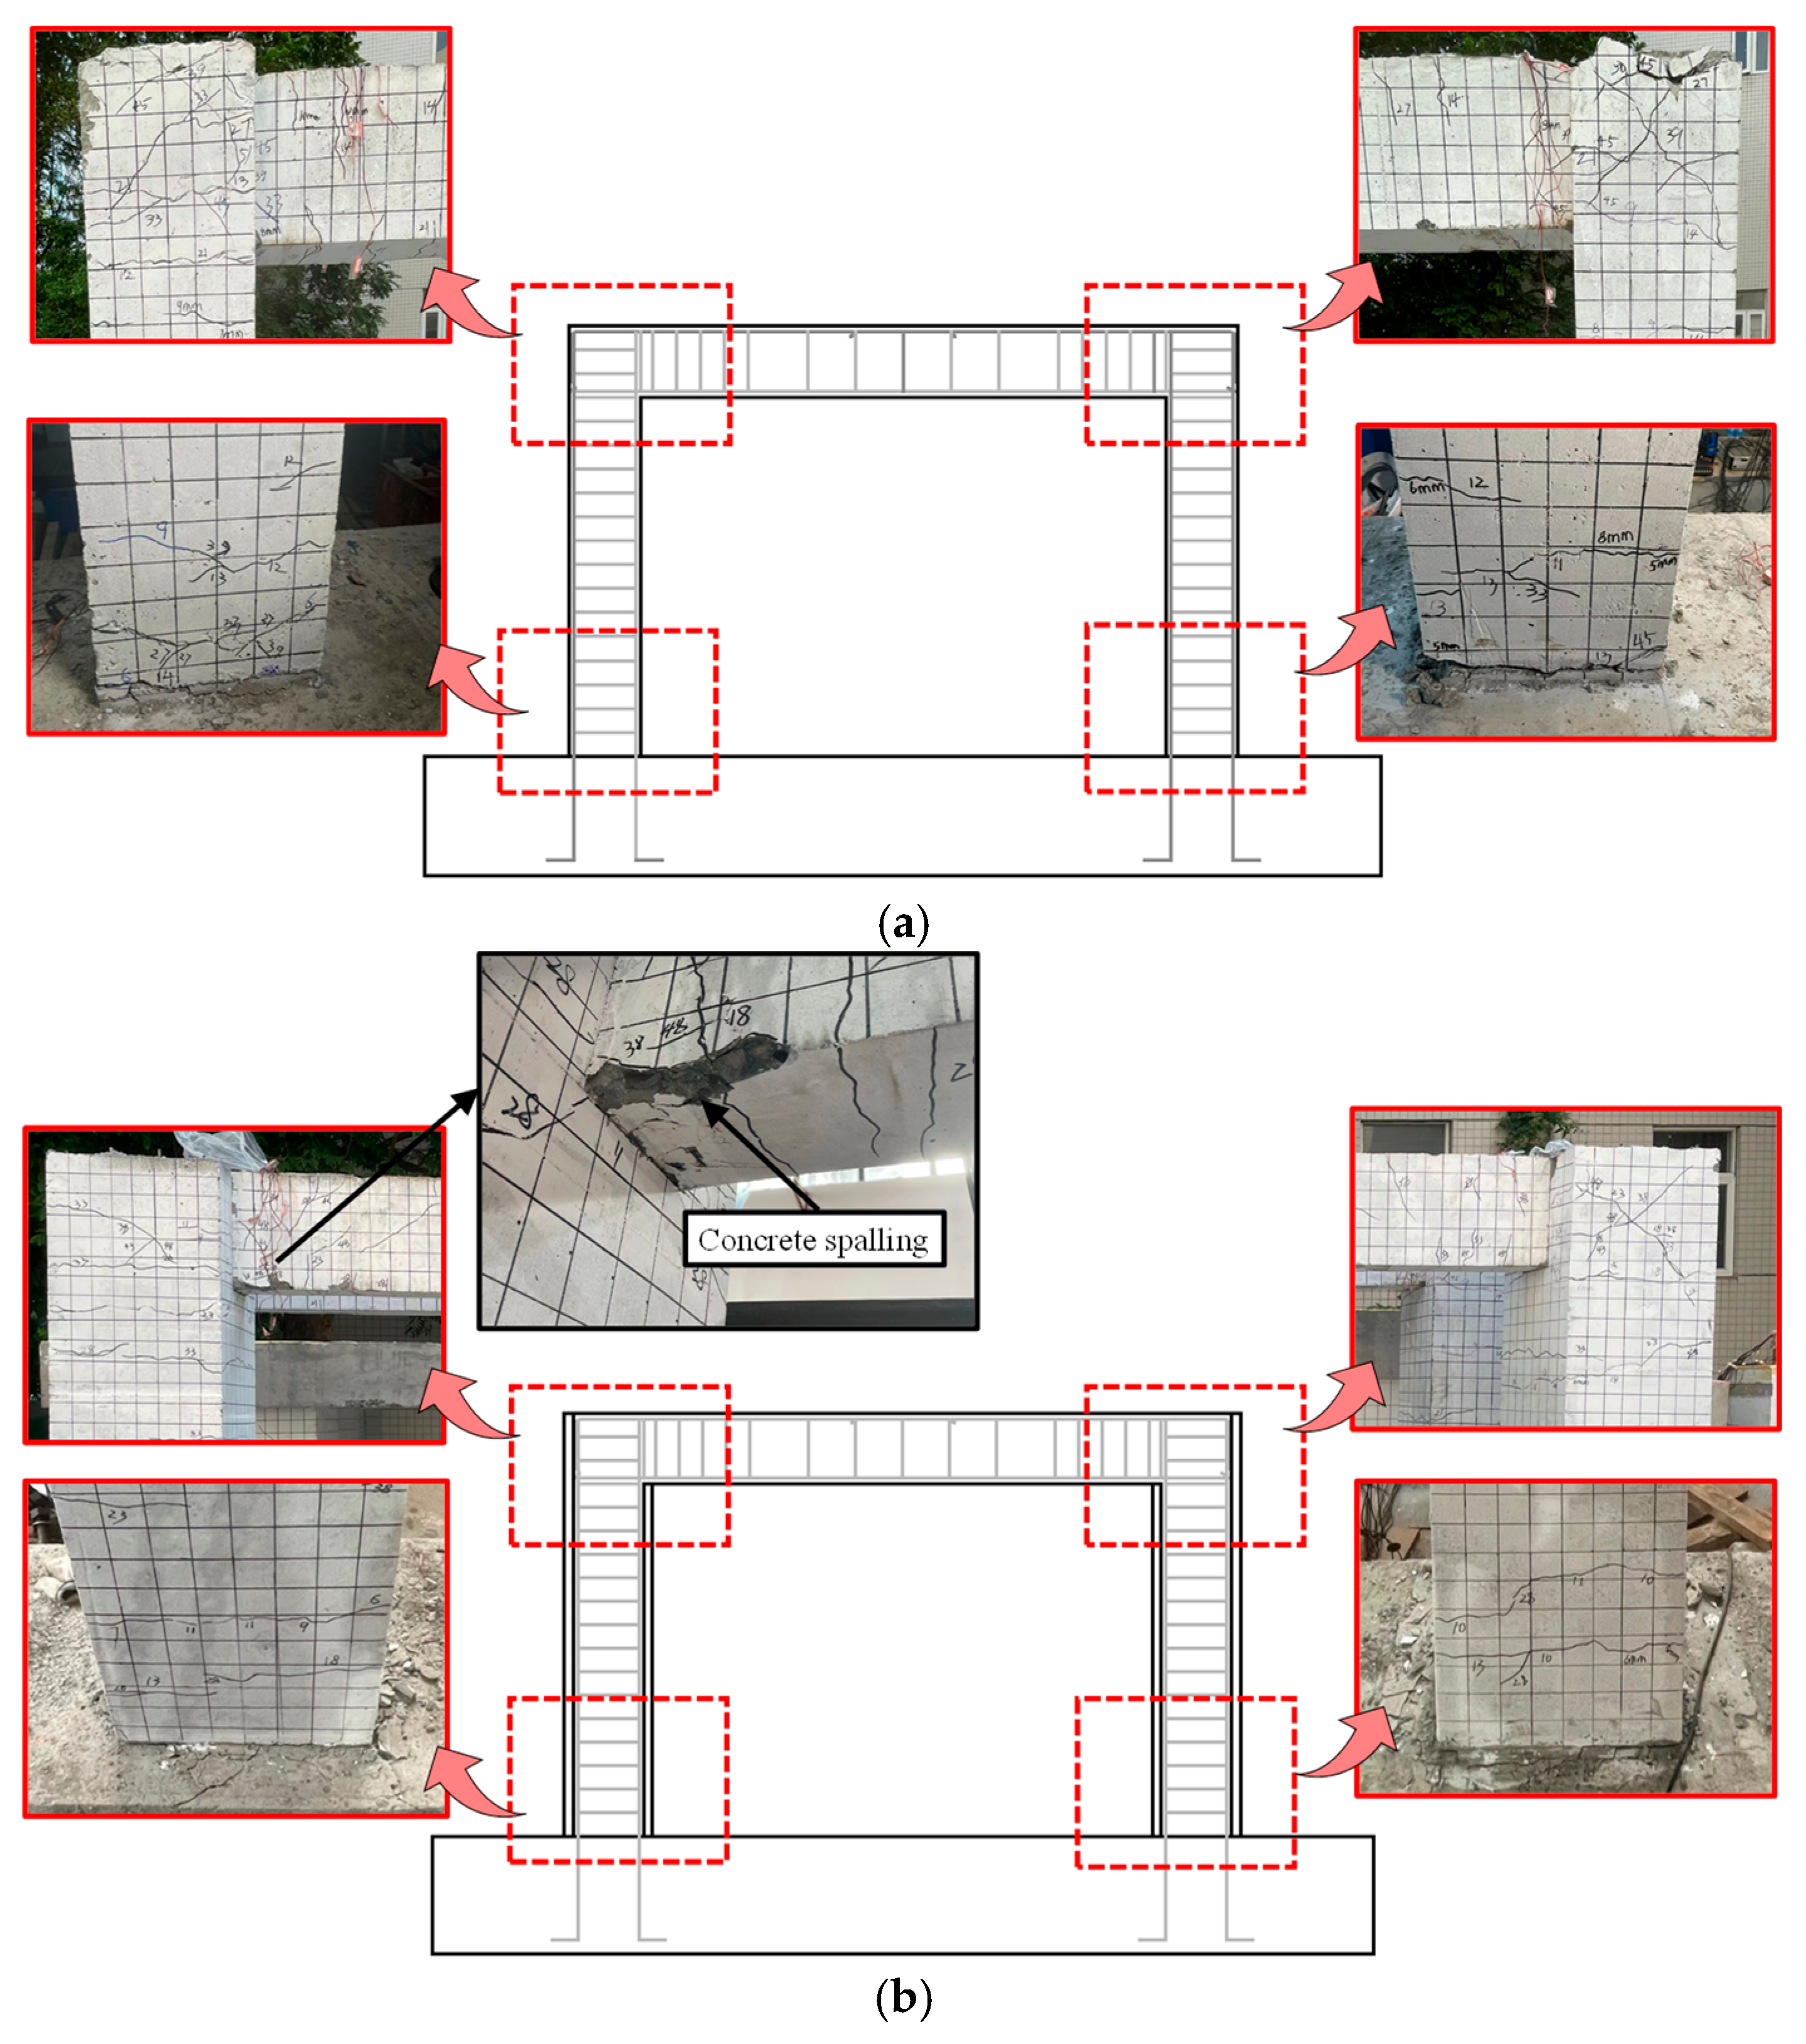
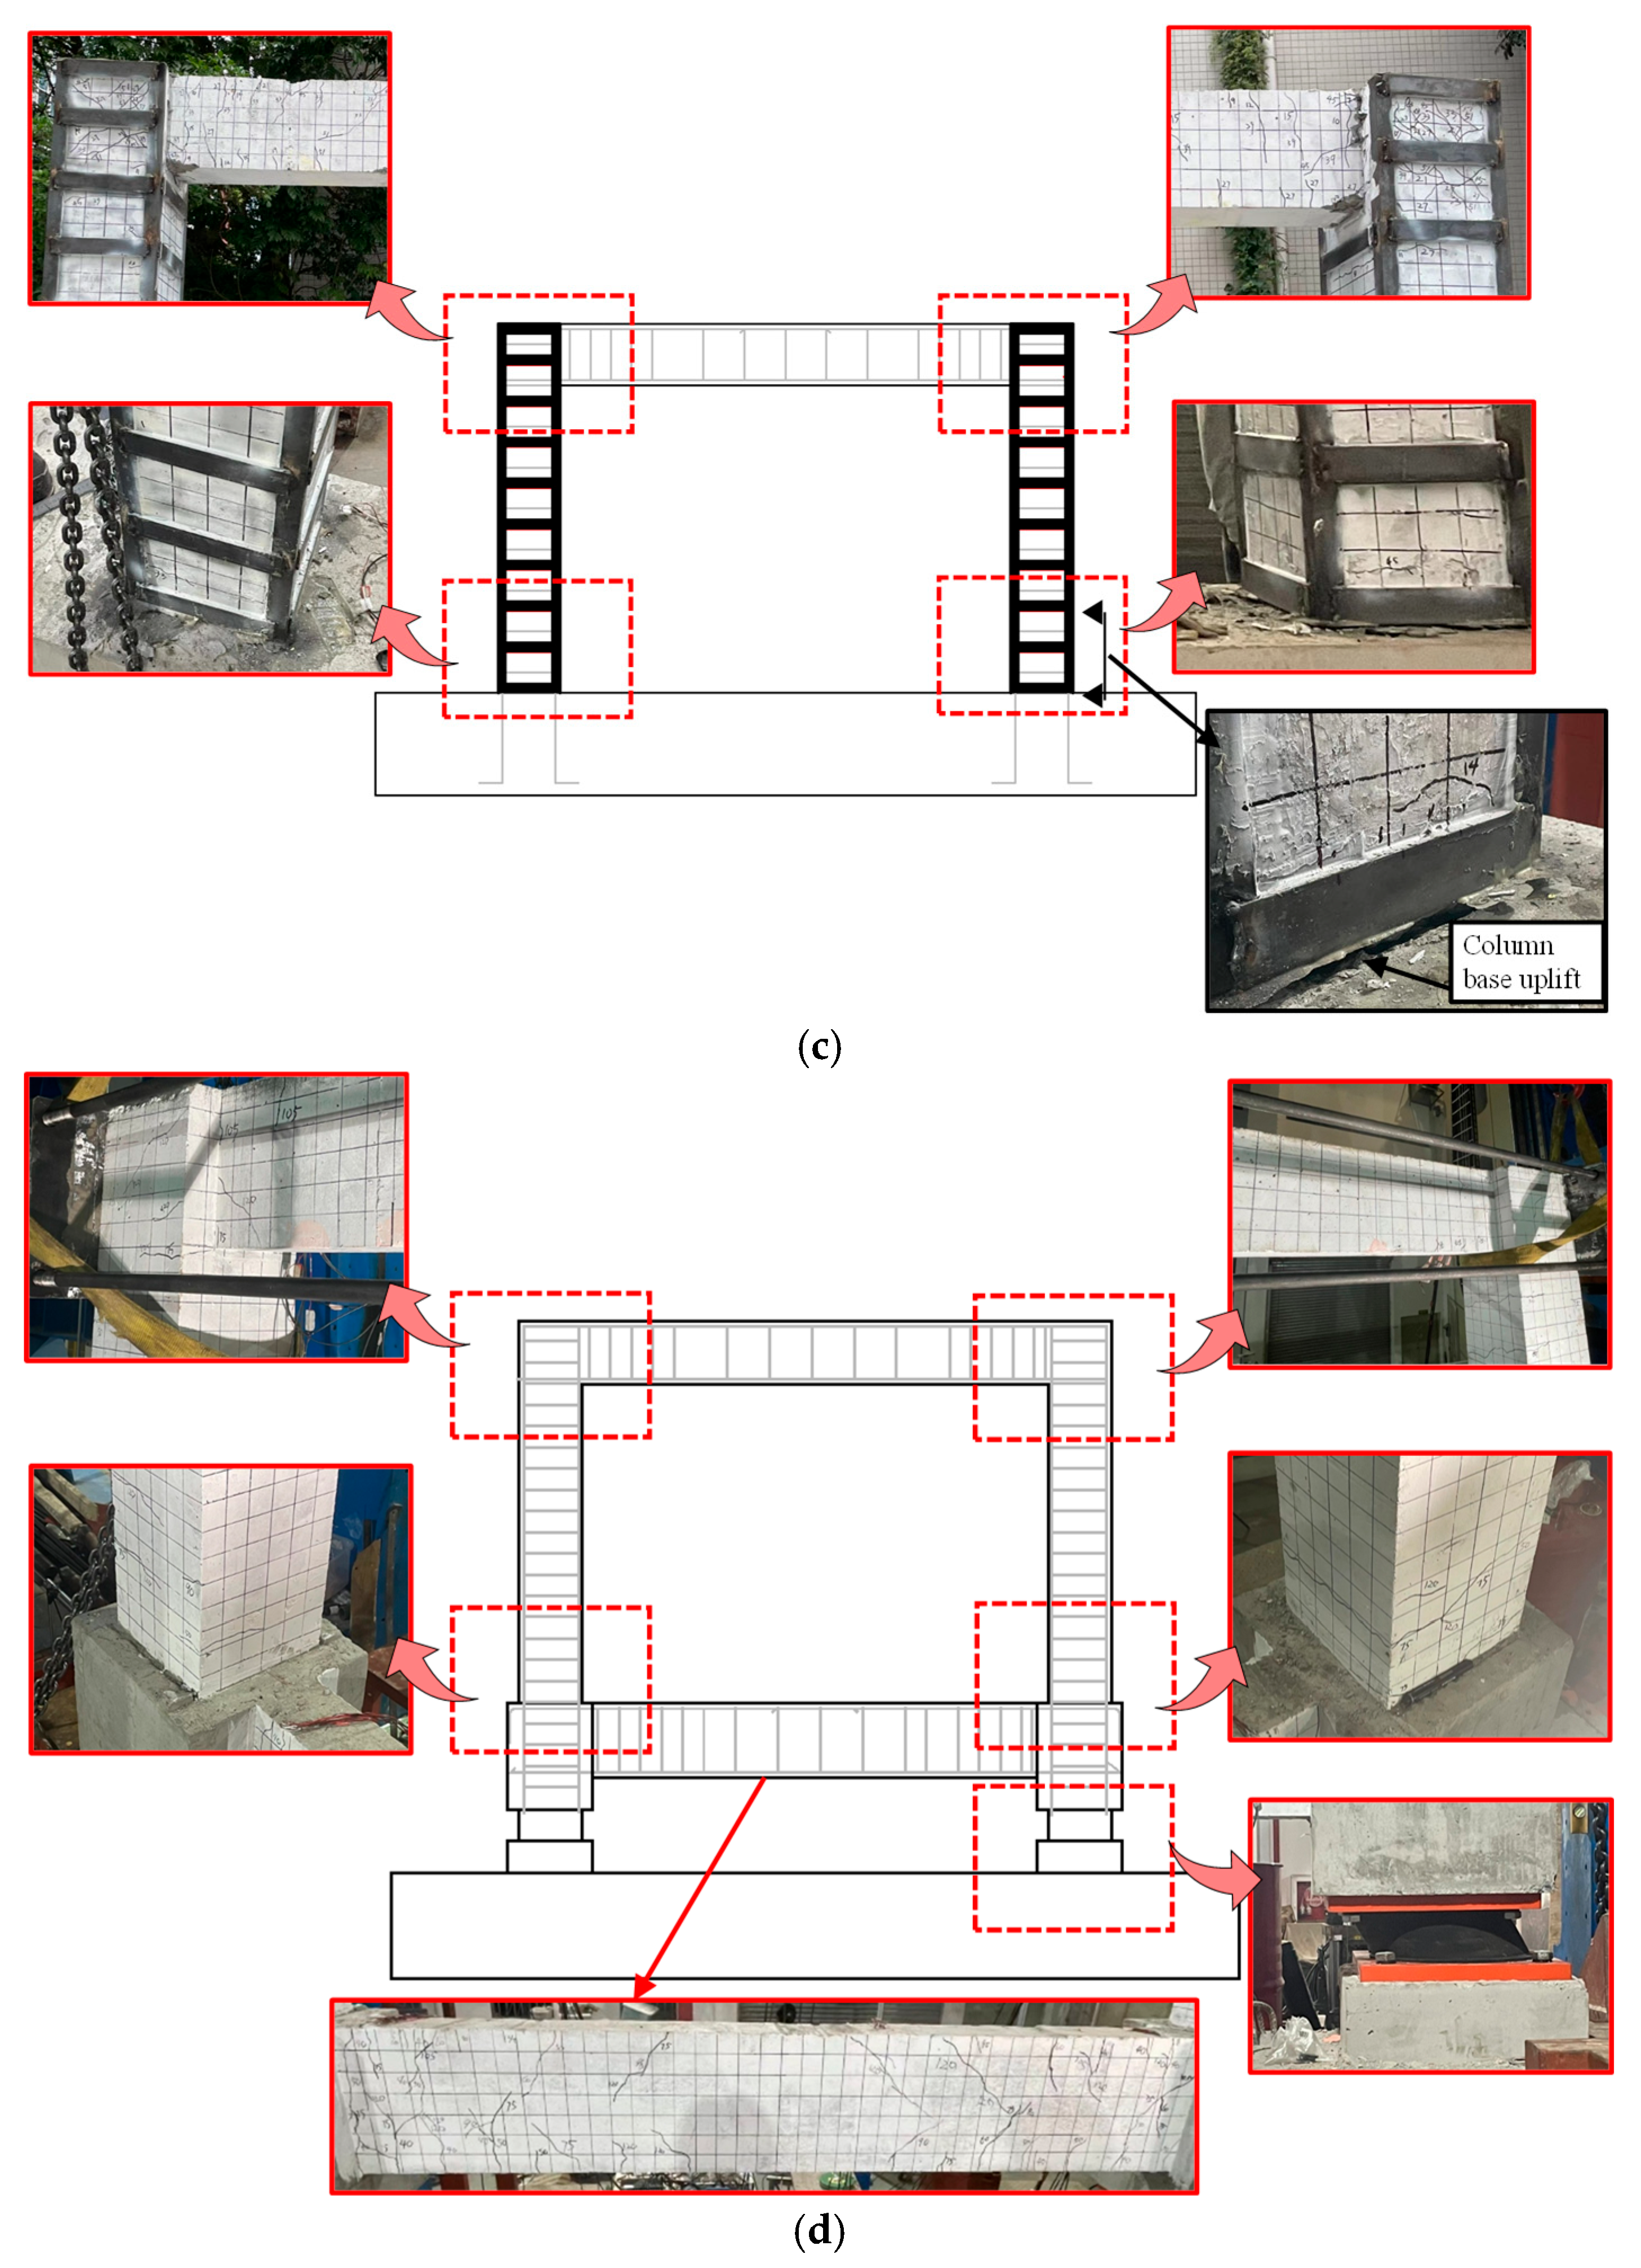
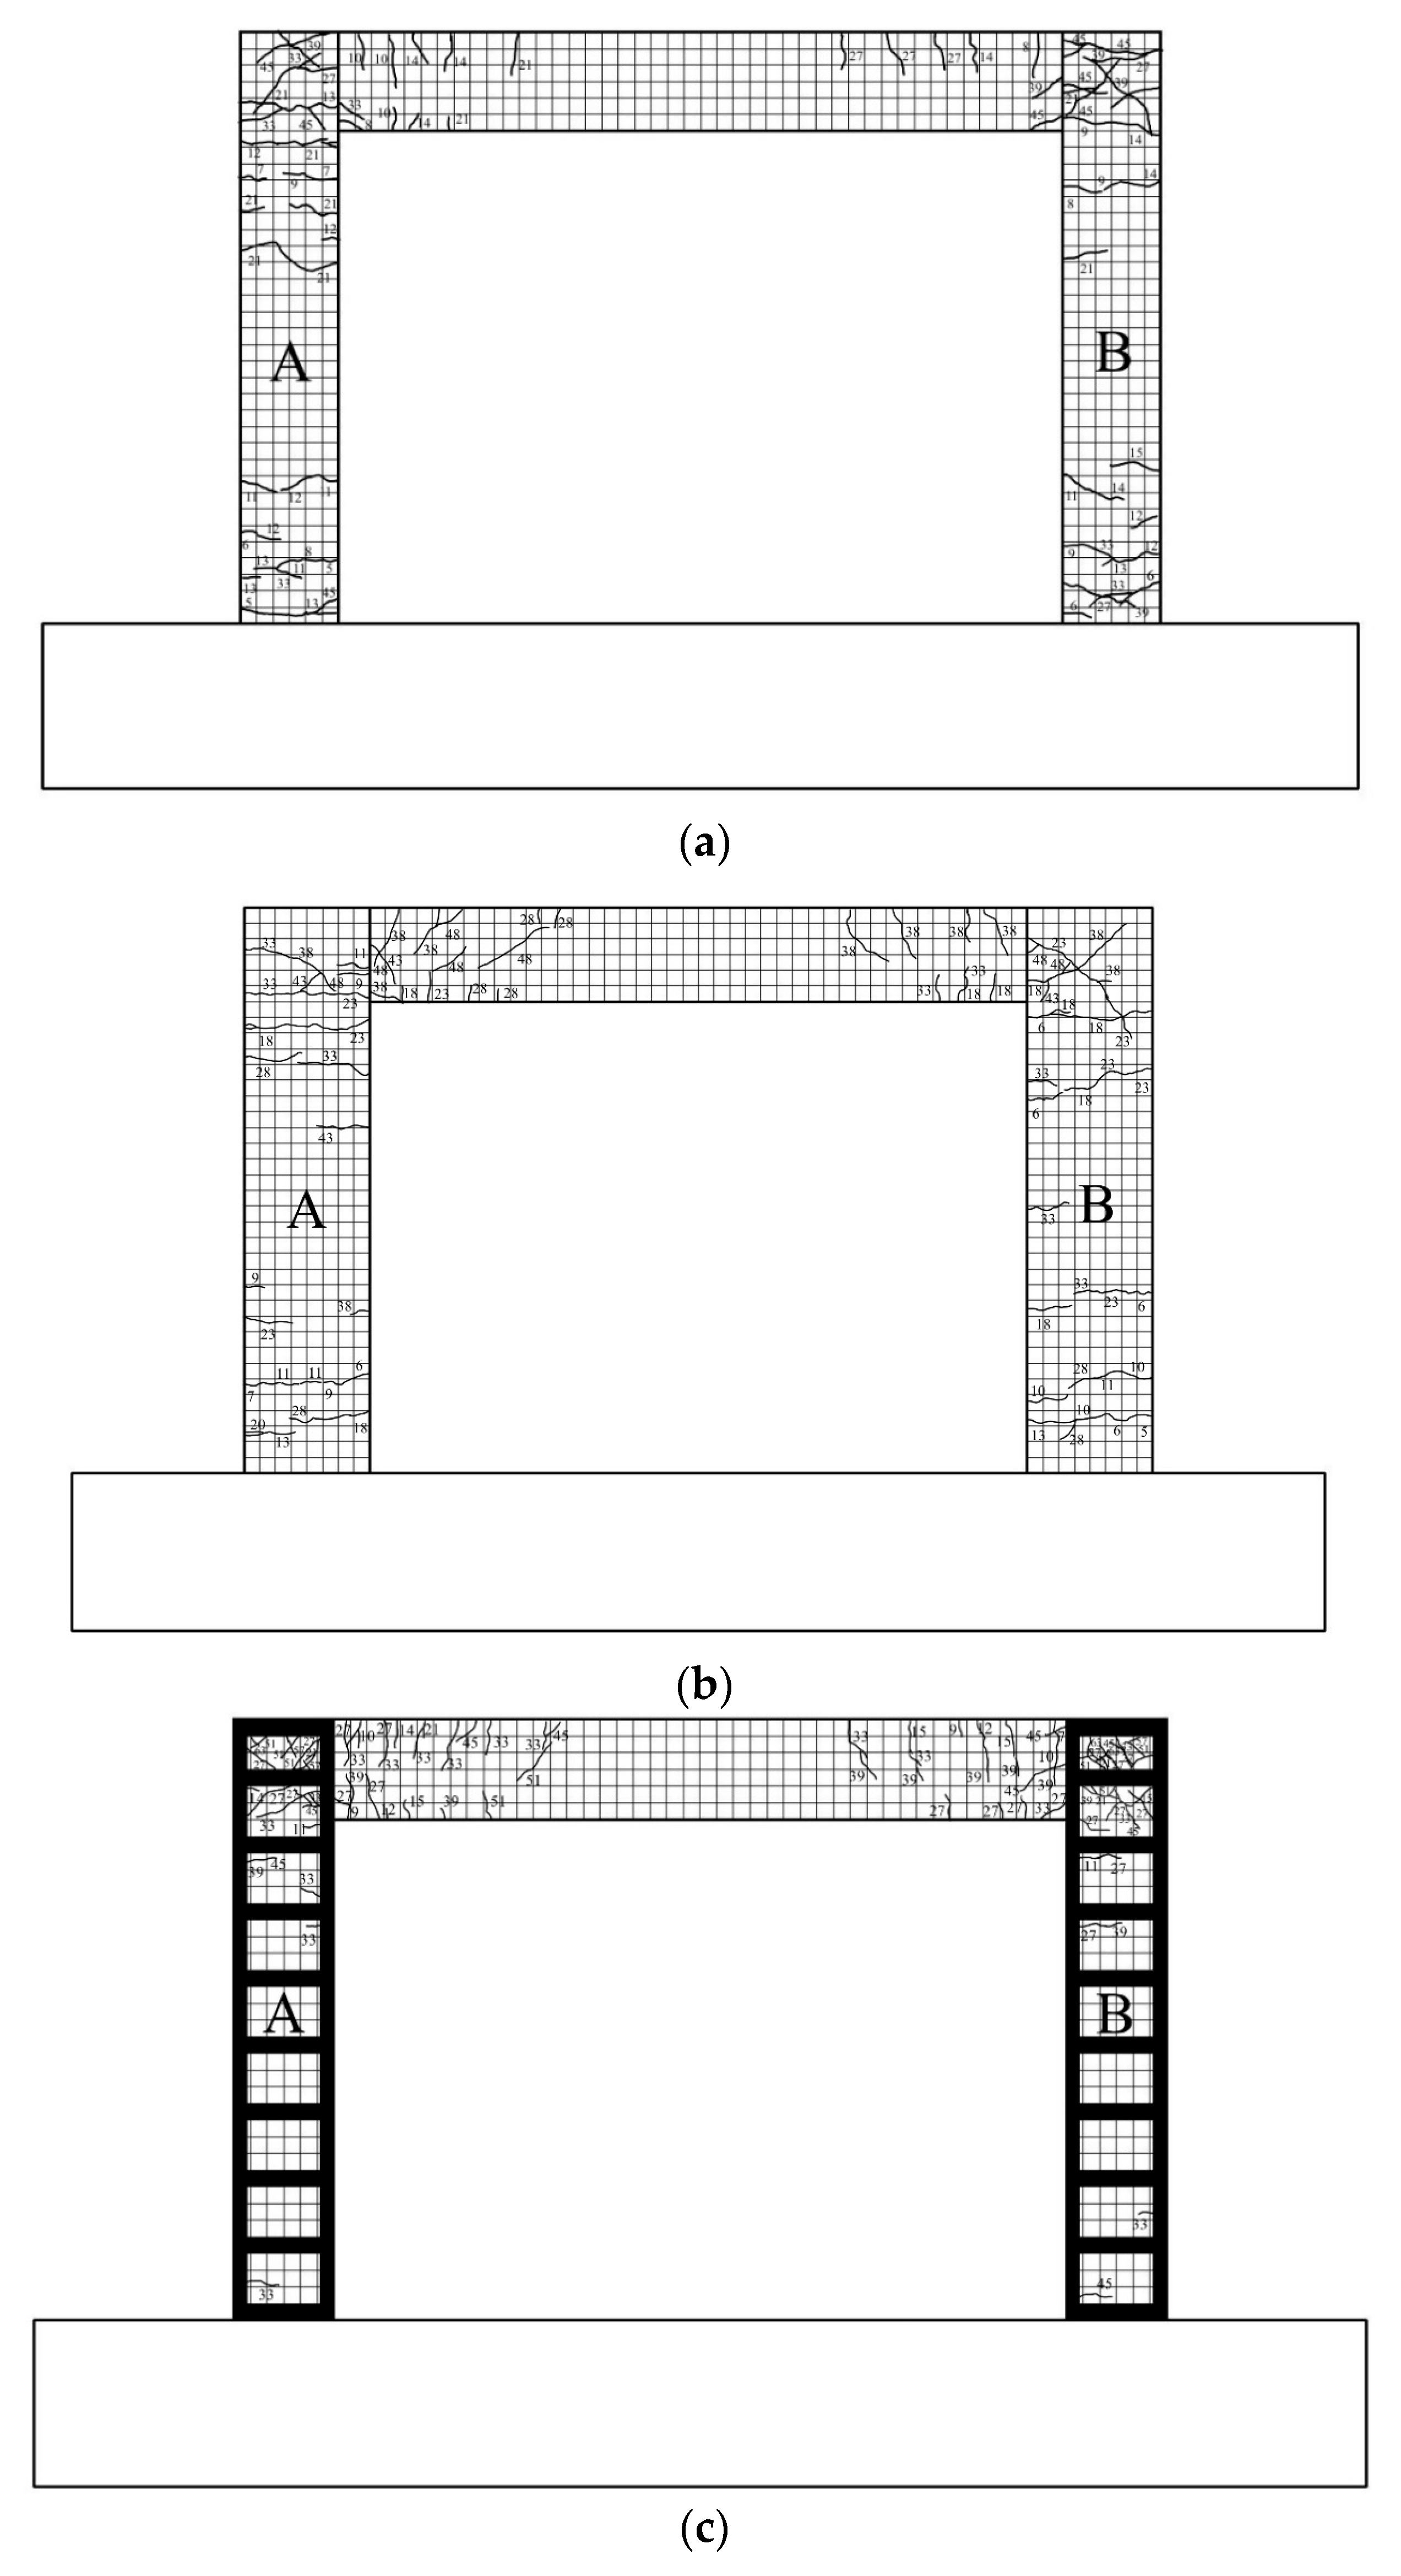
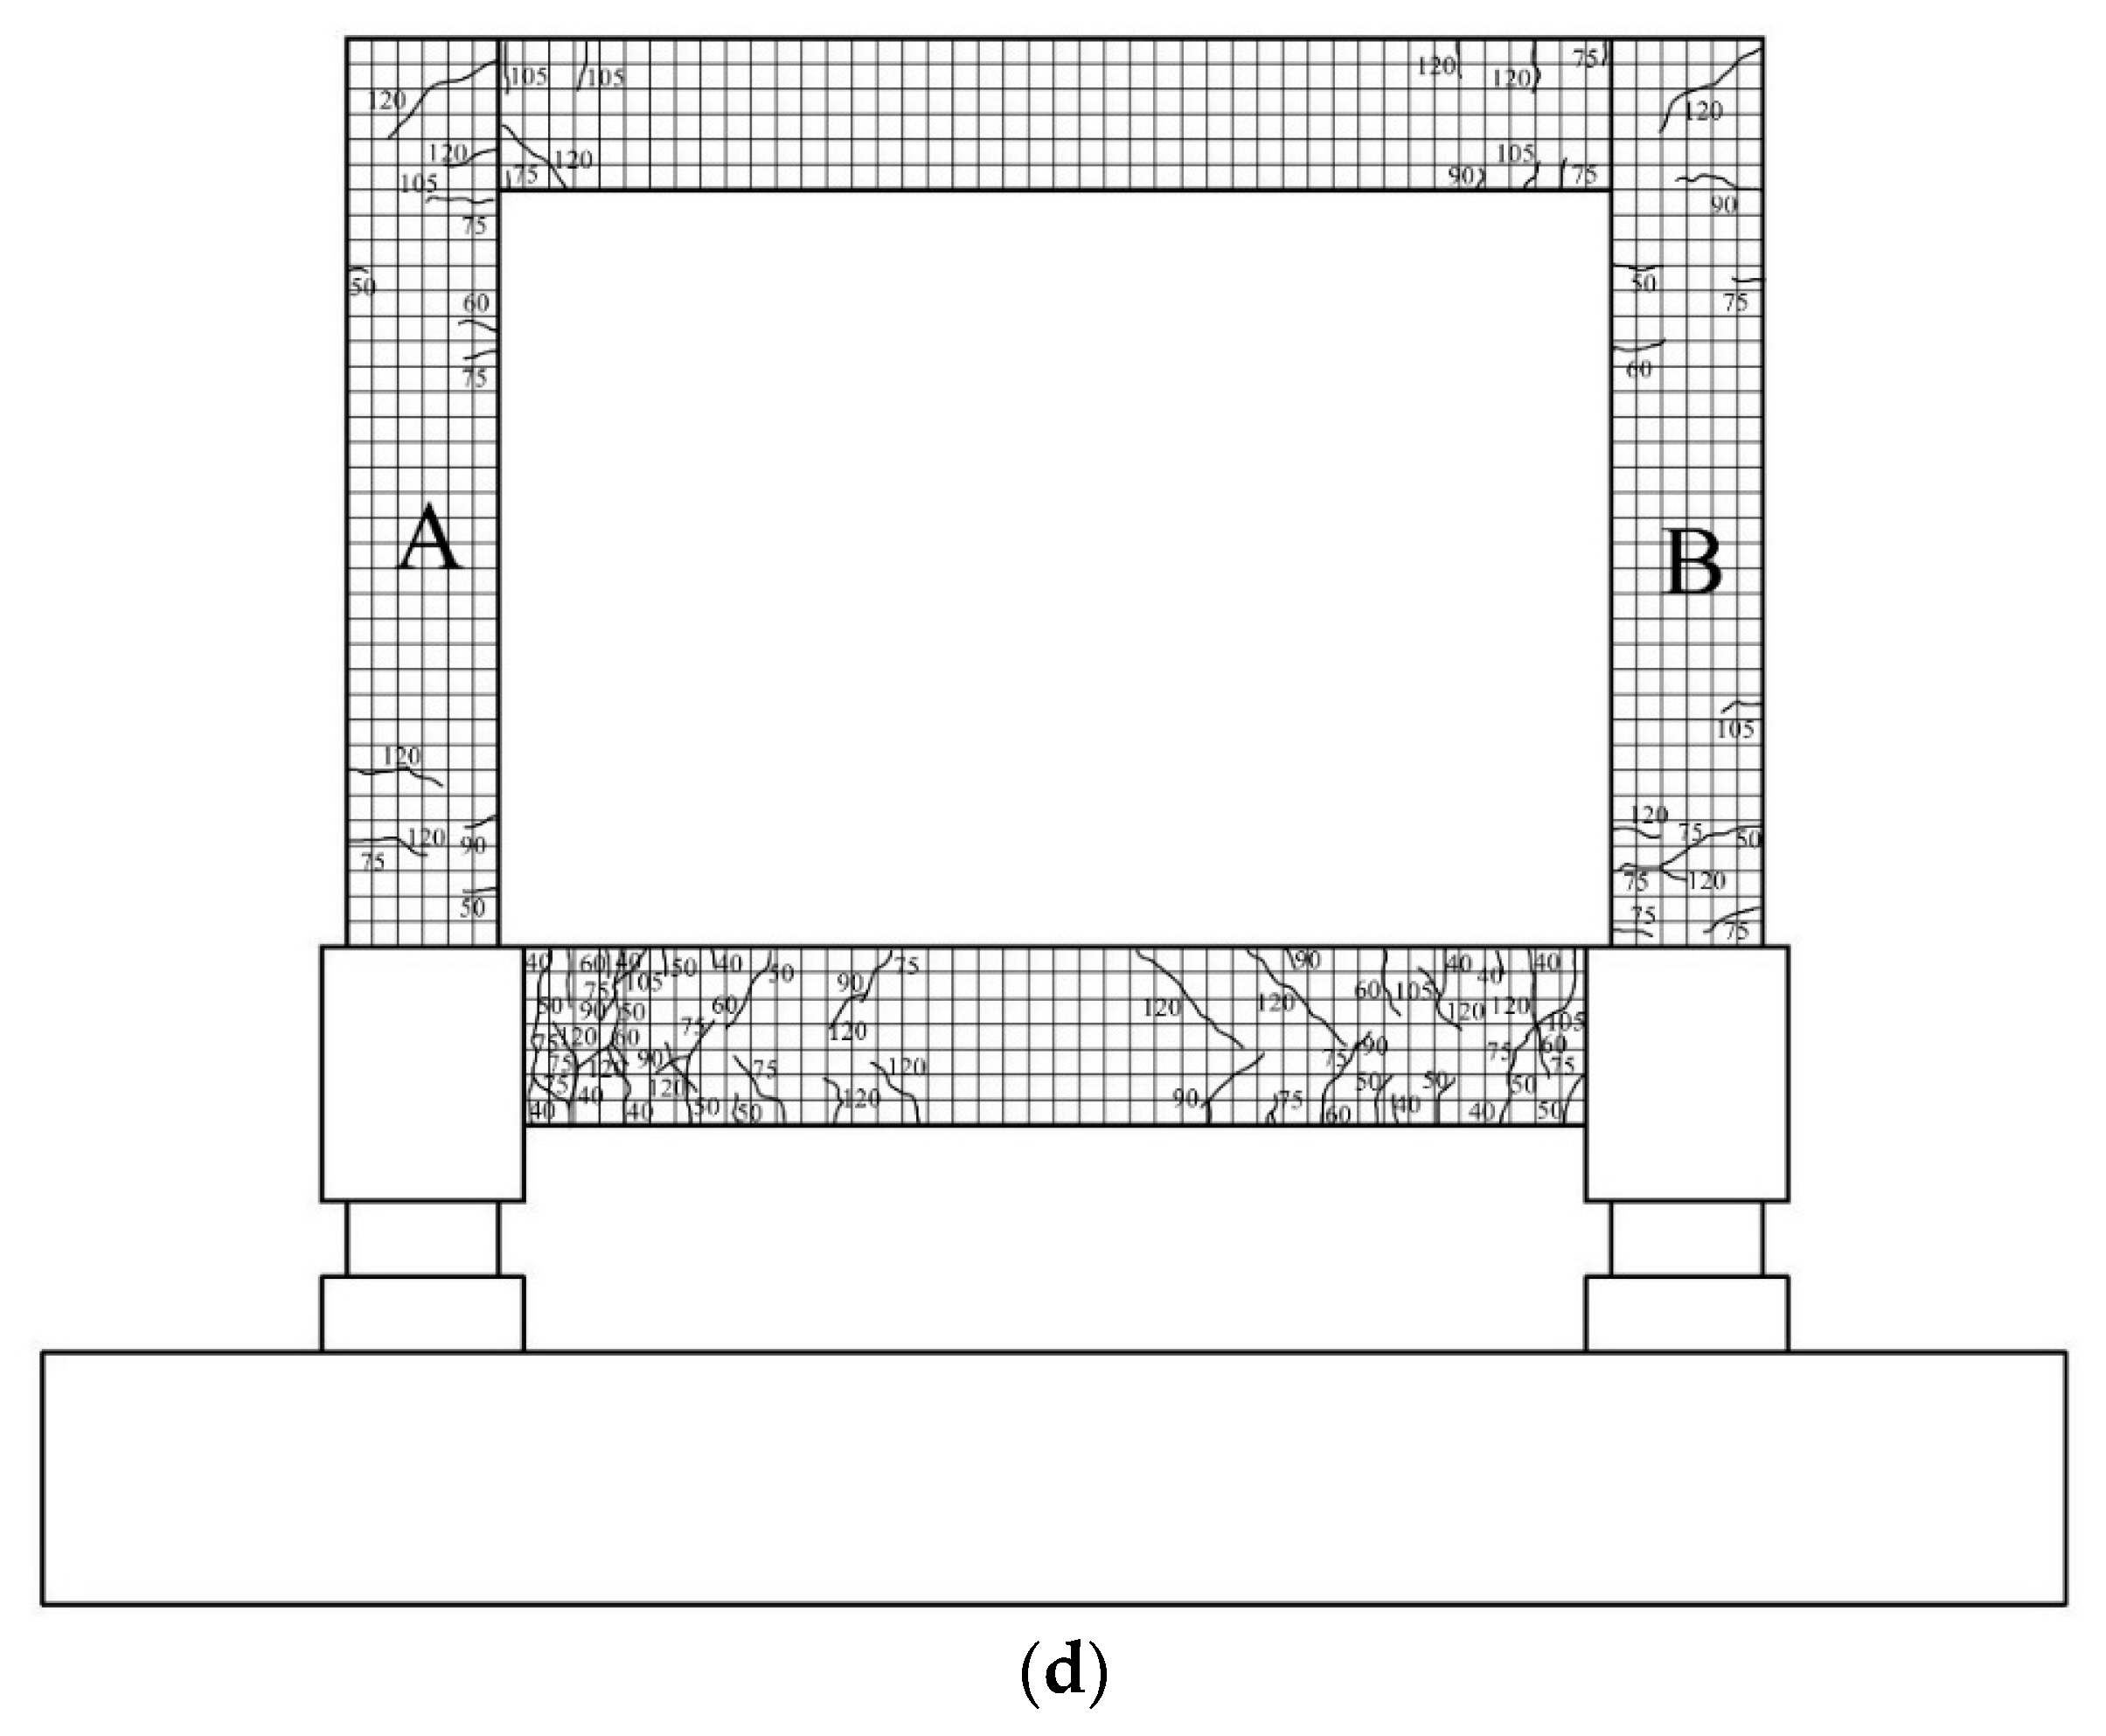
Figure 7 and Figure 8 present the final damage states of the four specimens at the end of testing and drawn crack patterns, respectively. Differences in damage patterns and failure modes among specimens were evident due to the varying retrofit techniques.
For specimen F1, during the loading process, initial cracking occurred at the column bases at a displacement of 5 mm, followed by small cracks at the column tops at 7 mm, as shown in Figure 7a and Figure 8a. At a displacement of 8 mm, cracks formed at the beam ends, and at 10 mm, cracks continued to develop at both the beam-column joints and the beam ends. When the displacement reached 12 mm, column base cracks developed into through-cracks, and cracks at the beam ends and column connections extended laterally. At a displacement of 15 mm, the load increase slowed, indicating the onset of yielding. When the displacement reached 27 mm, new cracks appeared at the column tops, vertical cracks developed on the upper beams, and diagonal cracks were observed at the beam-column joints. The peak load of specimen F1 occurred at a displacement of 33 mm, accompanied by concrete spalling at the column bases. At 45 mm, additional diagonal cracks formed at the beam-column joints. Specimen F1 ultimately failed at a displacement of 63 mm, with existing cracks widening and further concrete spalling at the column bases. The failure pattern of specimen F1 was identified as flexural failure.
For specimen F2, tiny cracks were first observed at the beam-column joints and column base at a displacement of 5 mm, and by 6 mm, cracks had also formed at both column bases and at the top of the right column, as shown in Figure 7b and Figure 8b. At a displacement of 11 mm, cracks appeared at the beam-column joints, along with through-cracks at the column bases. Subsequent loading produced beam-end cracks at 18 mm, and the peak load of specimen F2 occurred at a displacement of 23 mm, accompanied by diagonal shear cracks at the column tops and fractures at the column base. After the peak load, diagonal cracks at the beam ends and horizontal cracks at the column tops developed rapidly, accompanied by concrete spalling at the beam ends. At a displacement of 53 mm, penetrating cracks formed around the beam ends and adjacent surfaces, indicating beam flexural-shear failure.
For specimen F3, steel jacketing primarily protected the columns, while severe damage was concentrated in the beams, as shown in Figure 7c and Figure 8c. Tiny cracks first appeared at the beam ends at a displacement of 7 mm, followed by cracking at the column tops at 11 mm. With further loading, beam-end cracks propagated, and at 15 mm, the rate of load increase slowed, marking the onset of yielding. After yielding, fractures developed at the column-foundation interface, accompanied by column base uplift at a displacement of 21 mm. At 27 mm, cracks at the column tops began extending diagonally at approximately 45°, evolving into shear cracks with widening openings. At a displacement of 45 mm, specimen F3 reached its peak load, accompanied by further shear crack development at the column tops, diagonal cracks at the beam ends, and concrete spalling from the beam-end soffits. After the peak load, irregular diagonal cracks spread at the column tops, with concrete spalling and exposed reinforcement observed at the beam ends at 51 mm. By a displacement of 69 mm, the specimen failed with severe concrete spalling at the beam ends and widening shear cracks. The observed failure mode was beam flexural-shear failure.
Specimen F4 showed no reduction in load capacity at the termination of loading, and the superstructure remained undamaged throughout the test, as shown in Figure 7d and Figure 8d. Up to a displacement of 15 mm, no frame damage was observed, with deformations primarily absorbed by the LRBs. With a 5 mm increment, loading continued to a displacement of 30 mm without significant frame cracking. At a displacement of 40 mm, cracks formed at the transfer beam ends, followed by cracks at the column bases and tops at 50 mm. At 60 mm, cracks in the transfer beam propagated toward the mid-span, tending toward diagonal cracks. The increment was then increased to 15 mm with two cycles per level. At a displacement of 75 mm, diagonal cracks in the transfer beam intensified, column base cracks developed into through-cracks, and fine cracks appeared at the beam ends. At a displacement of 90 mm, transfer beam cracks widened, some becoming through-cracks, with additional diagonal cracks forming. The frame’s load capacity continued to rise, and at a displacement of 105 mm, new cracks appeared at the column tops and beam ends. At a displacement of 120 mm, column base cracks evolved into diagonal cracks, accompanied by additional cracking in the beams and transfer beams. At this stage, LRB displacement reached 87 mm approximately 150% of its shear deformation capacity after which testing was terminated. This threshold of 150% was determined with reference to the manufacturer’s specification of the maximum design displacement of the isolator. Although the superstructure did not show a clear reduction in load capacity, the isolators had already experienced significant inelastic deformation and through-cracks had formed in the transfer beam. Further loading was considered likely to compromise bearing stability and test safety; therefore, this state was defined as the ultimate condition of the system.
To clarify the beam-governed failure and crack propagation in F2 (RC jacket) and F3 (steel jacket), Figure 8b,c present the drawn crack patterns with respect to displacement. For F2, small cracks first appeared at beam column joints and column base; with increasing displacement, beam-end cracks were developed, followed by diagonal shear cracks and concrete spalling at the beam ends near descending stages, ultimately culminating in a beam flexural-shear failure. For F3, damage concentrated in the beams: early beam-end cracking was followed by diagonal cracking and bottom surface spalling at the beam ends; the specimen ultimately failed in beam flexural-shear. These patterns indicate that strengthening the columns alone relocated the plastic hinges to the beams. It is stated that no Digital Image Correlation Method (DICM) was used during the experiment to investigate the crack propagation. In future studies, for detailed investigation of crack propagation and failure behavior transition, DICM will be used.
The retrofitting measures effectively shifted major damage away from the original structure’s column bases to other components, thereby protecting the key load-bearing elements and enhancing the overall load capacity. In specimen F4, the incorporation of the transfer beam redirected the primary damage zone from the original column bases to the ends of the transfer beam, concentrating damage within the newly added members. This approach significantly mitigated damage to the original structural elements. Overall, the results demonstrate that base isolation outperformed both RC jacketing and steel jacketing in preserving the integrity of the original structure while also reducing the complexity and duration of post-earthquake repairs.

3.2. Load–Displacement Hysteretic Results

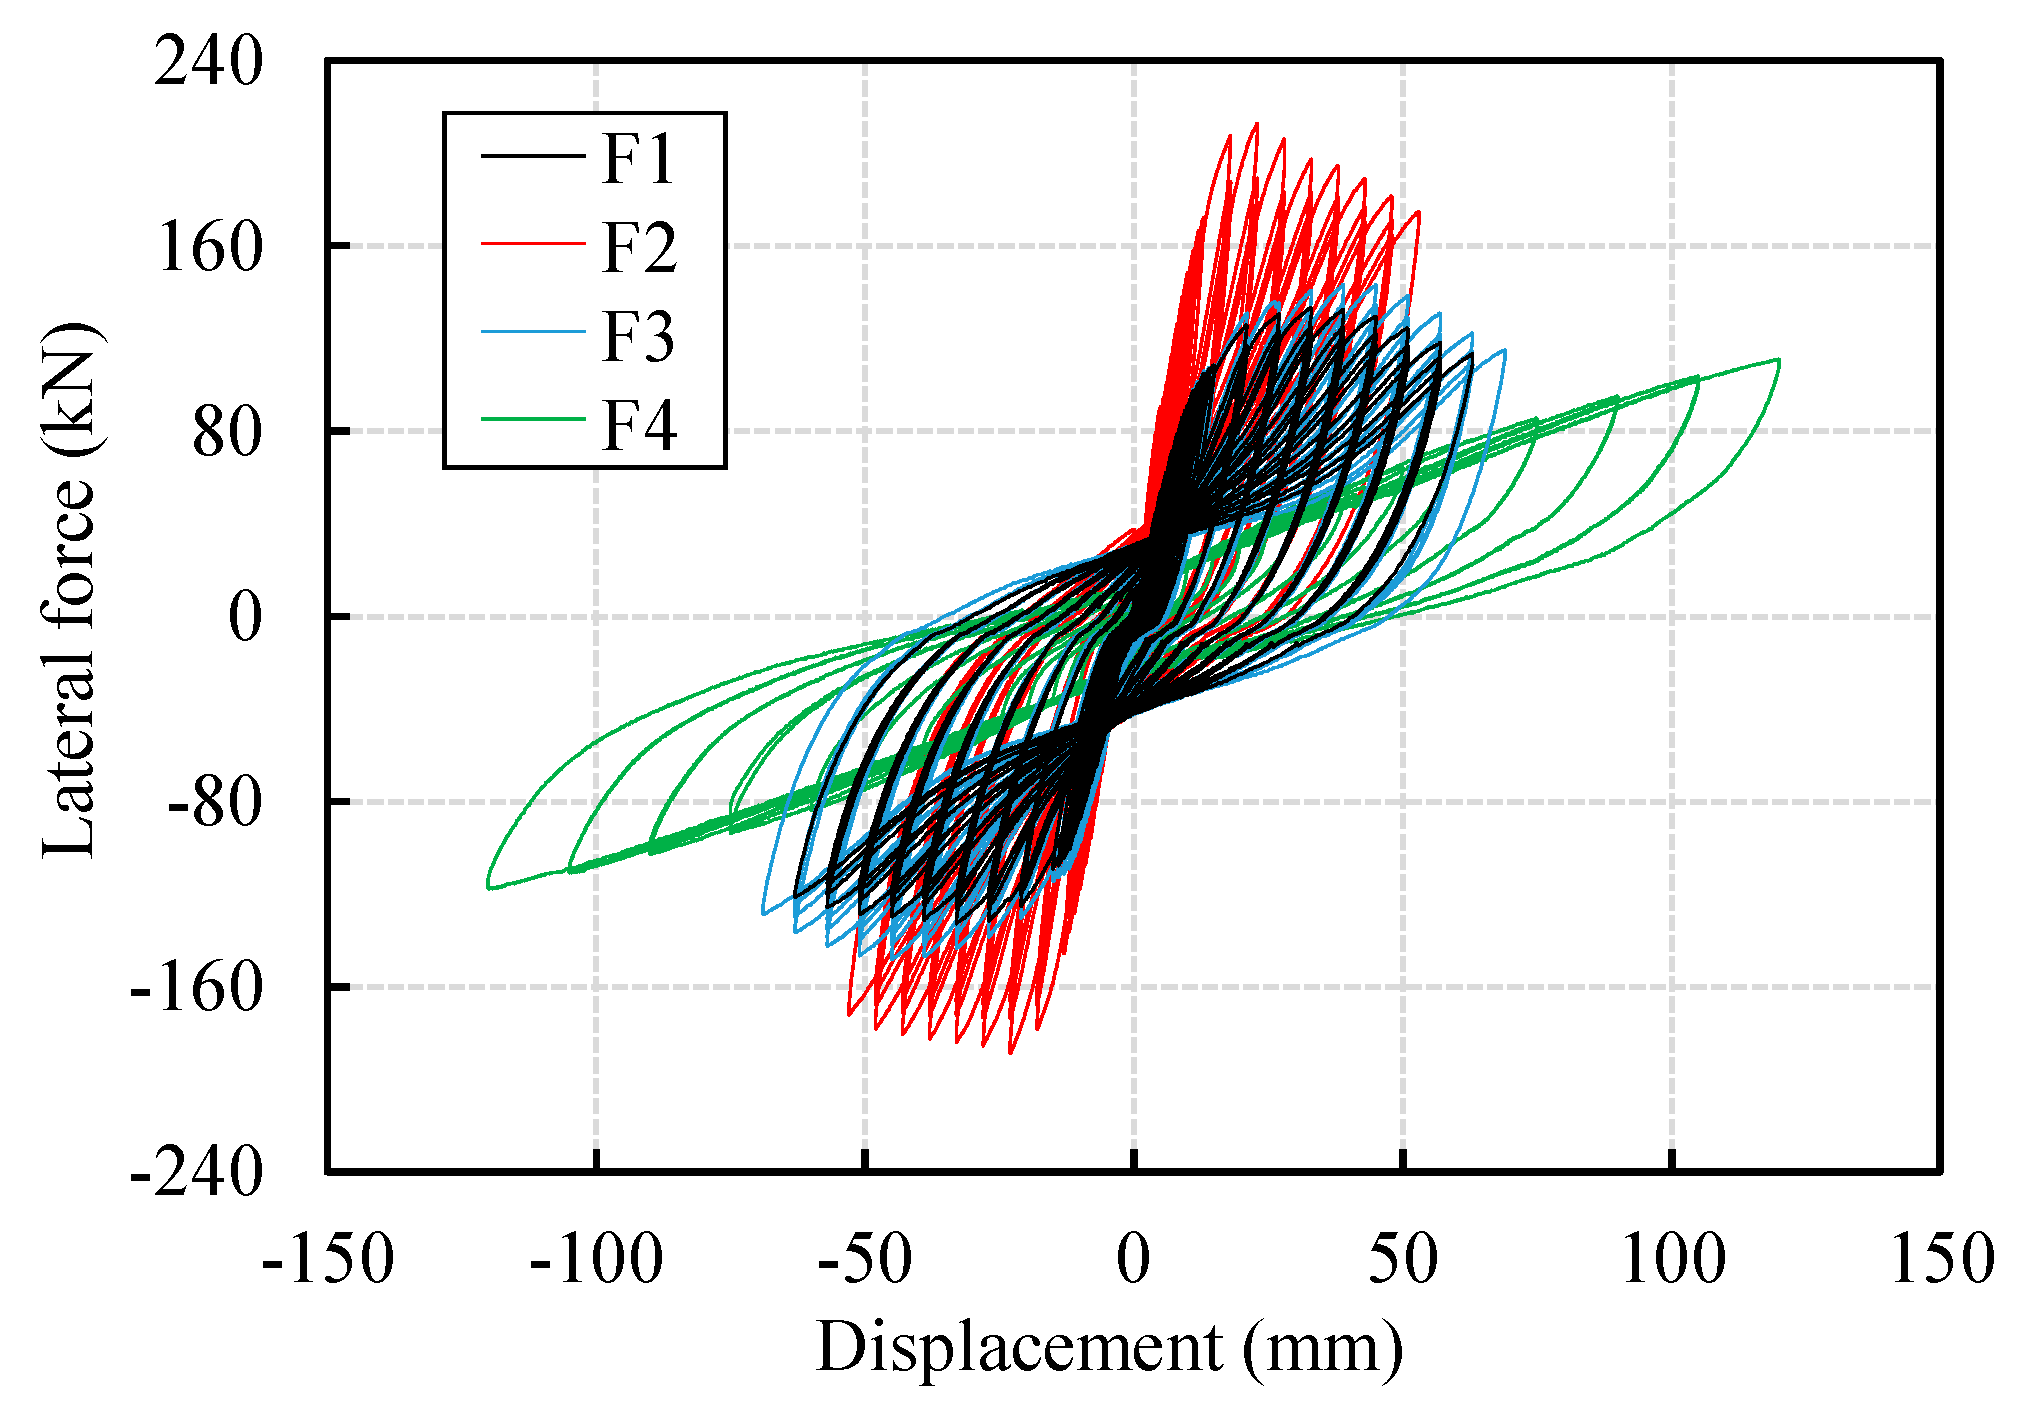
Figure 9 shows the load–displacement hysteretic loops obtained during the loading tests of the un-retrofitted specimen and their comparison with the three retrofitted specimens.
As seen in Figure 9, specimens F1, F2, and F3 exhibited similar bow-shaped hysteresis loops with slight pinching, indicating moderate stiffness degradation and stable but limited energy dissipation capacity. The hysteretic loops of the retrofitted specimens did not show significant pinching, owing to improved energy dissipation mechanisms, and the area enclosed by the loops increased with the applied displacement. Compared with the un-retrofitted specimen, RC jacketing (specimen F2) and steel jacketing (specimen F3) increased the maximum lateral strength in the positive direction by 59.86% and 7.56%, respectively. However, both retrofitted specimens experienced earlier stiffness degradation due to concentrated damage in the beams, which in turn reduced their cumulative energy dissipation at larger displacements. In contrast, the LRB-retrofitted specimen (F4) exhibited a full, shuttle-shaped hysteresis loop without noticeable pinching throughout the test. The superstructure remained undamaged, and the load-carrying capacity continued to increase even at larger displacements, owing to the isolation mechanism. It is noted that the observed performance trends provide comparative insights into different retrofitting strategies; however, variability in concrete properties, workmanship, and material imperfections may lead to differences in actual structural behavior.
As shown in Figure 10, most seismic energy was dissipated through the shear deformation of the LRBs, thereby delaying the onset of structural damage and preserving the stiffness of the frame. The equivalent viscous damping ratio of F4 remained significantly higher than that of the other specimens across all displacement levels, confirming the superior energy dissipation performance of the base-isolated system.

3.3. Skeleton Curve and Ductility Coefficient

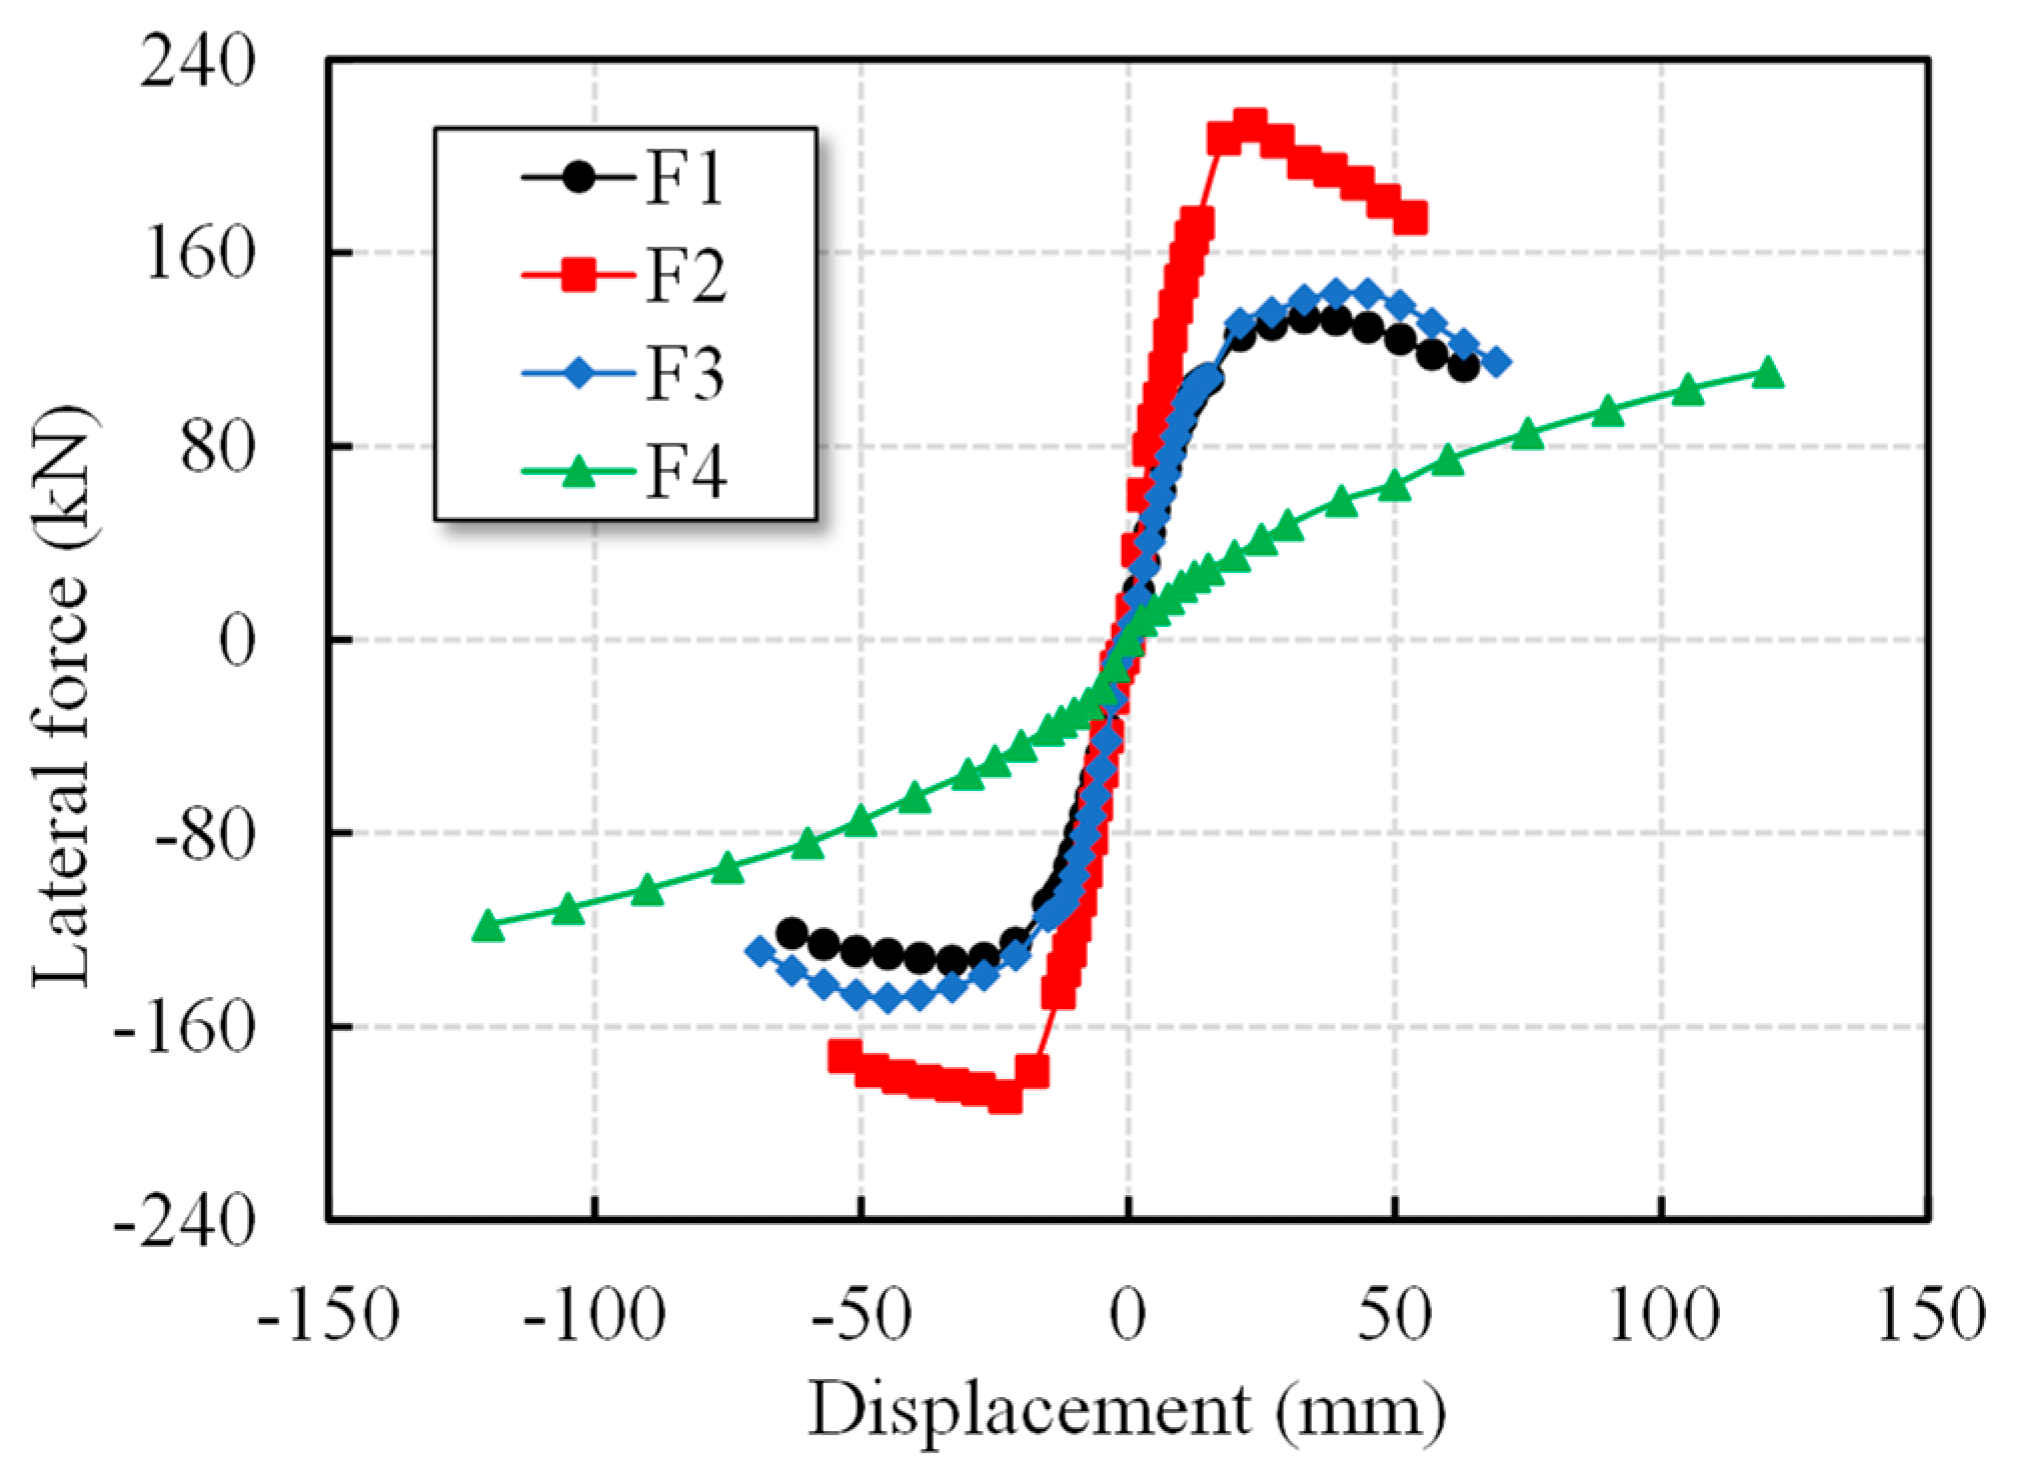
Skeleton curves, obtained by connecting the peak loads at each displacement level in both positive and negative directions, highlight the differences in load-carrying capacity and ductility. Figure 11 shows the skeleton curves of all specimens, and Table 3 summarizes the corresponding key parameters for positive loading direction. These parameters include yielding load (Fy), yielding displacement (Dy), peak load (Fmax), peak displacement (Dmax), ultimate load (Fu), and ultimate displacement (Du). The yielding load and displacement were determined based on the principle of equivalent energy. It should be noted that for specimen F4, Fu and Du correspond to the maximum positive load and displacement of the skeleton curve (i.e., Fmax = Fu and Dmax = Du). However, because the skeleton curve of specimen F4 did not exhibit a descending section, the energy equivalence method could not be used to determine the yield point. Determining the yield load Fy can be obtained by using Equation (1) [41], substituting the last hysteresis loop of specimen F4 into the calculation using the maximum displacements and corresponding half-displacement loads, followed by obtaining the corresponding yield displacement Dy according to the skeleton curve.
Q d = X 2 Q 3 X 1 Q 6 X 2 X 1 X 2 Q 4 X 1 Q 5 X 2 X 1 / 2
where Qd is the yield load of LRB; X1, X2 are the positive and negative maximum displacements; Q3, Q4 are the positive and negative loads corresponding to the X1/2; Q5, Q6 are the loads corresponding to X2/2.
The ductility coefficient μ is the ratio of Du and Dy, and only the positive Du and Dy are taken here for calculation.
μ = D u D y
Based on the skeleton curves of specimens F1, F2, and F3, the seismic performance of traditional retrofit methods for existing frames was evaluated. The load-bearing capacity and ductility of the retrofitted specimens were enhanced significantly compared to the un-retrofitted specimen, especially for specimen F2. All three specimens exhibited S-shaped skeleton curves, indicating progression through elastic, elastoplastic, and failure stages during loading. For specimen F2, retrofitted with RC jacketing, the ultimate load capacity of the frame increased significantly. Specimen F2 achieved a positive peak load increase of 59.86% and a negative increase of 42.16%, but ultimate deformation decreased by 23.17% and ductility by 10.38%. In the elastic stage, the load–displacement relationship was linear, showing a rapid rise in load. After yielding, the slope of the skeleton curve decreased, reflecting a marked reduction in stiffness. Once the ultimate load was reached, concrete spalling occurred at the beam ends, causing a rapid stiffness decline. The skeleton curve of specimen F3 was similar to that of the un-retrofitted specimen F1, but with a delayed yielding point. The strength increase for F3 was modest: positive and negative peak loads rose by only 7.56% and 11.61%, respectively, while ductility decreased by 10.93%. The steel jacketing method improved the yielding displacement of the overall frame. However, as displacement increased, concrete spalling developed at the beam ends, and severe beam damage led to a loss of load capacity, limiting improvements in ductility. For specimens F2 and F3, the results indicate that increasing column stiffness enhances load capacity but reduces deformation capacity. In contrast, for specimen F4 retrofitted with base isolation, the frame’s load-bearing capacity did not decrease during cyclic loading. Specimen F4 exhibited only pre-yield and post-yield stages. Before the LRBs yielded, load capacity increased rapidly. After yielding, the rate of increase slowed, indicating that the shear performance of the isolation layer primarily governed capacity growth. Compared with specimen F1, specimen F4 benefited from the LRB’s high plastic shear deformation capacity, with ultimate deformation improved by 90.63% and ductility by 82.79%. Overall, the RC jacketing method provided the most significant improvement in load capacity, followed by steel jacketing. However, because the latter only strengthened the concrete columns, beam damage occurred in the later loading stages, resulting in limited capacity enhancement. In contrast to traditional methods that improve frame load capacity, base isolation retrofitting reduced the frame’s load capacity, indicating that the isolation system effectively mitigated damage to the superstructure.

3.4. Stiffness Degradation

Stiffness degradation is a critical indicator of structural seismic performance, resulting from increased loading displacement and the accumulation of damage through repeated cycles. In the initial stage of cyclic loading, the specimen behaved elastically, and stiffness remained nearly unchanged. Once the structure entered the elastoplastic stage, concrete cracking and reinforcement yielding caused a rapid drop in stiffness. Toward the end of the loading period, residual stresses within the specimen slowed the rate of further stiffness reduction. The equivalent stiffness of the specimens is calculated as follows:
K i = + P i , m a x + P i , m a x + i , m a x + i , m a x
where Pi,max and Δi are the maximum load and corresponding displacement of the i-th cycle, respectively, and “+” and “−” are positive and reverse loading directions.
The stiffness degradation curves of each specimen are shown in Figure 12. Compared with the un-retrofitted specimen F1, the retrofitted specimens demonstrated varying levels of improvement. Specimen F2 exhibited the greatest increase in initial stiffness of 45.9%, and its degradation rate slowed noticeably, confirming the effectiveness of section enlargement in enhancing both stiffness and strength. The initial stiffnesses of F1 and F3 were nearly the same. However, specimen F3 achieved improved stiffness due to the lateral confinement provided by steel jacketing, which reduced the degradation rate compared with F1. In contrast, specimen F4 exhibited the lowest initial stiffness, at only 38% of specimen F1, because the isolation bearings primarily deform in shear. However, its stiffness degraded more gradually at larger displacement levels, underscoring the superior ductility and energy dissipation capacity of the base-isolated frame. Overall, the results indicate that RC jacketing is most effective in improving initial stiffness, while steel jacketing enhances stiffness retention during cyclic loading. Base isolation, although reducing the initial stiffness, provided the best performance in mitigating stiffness degradation at large deformations, thereby minimizing structural damage.

3.5. Energy Dissipation Capacity

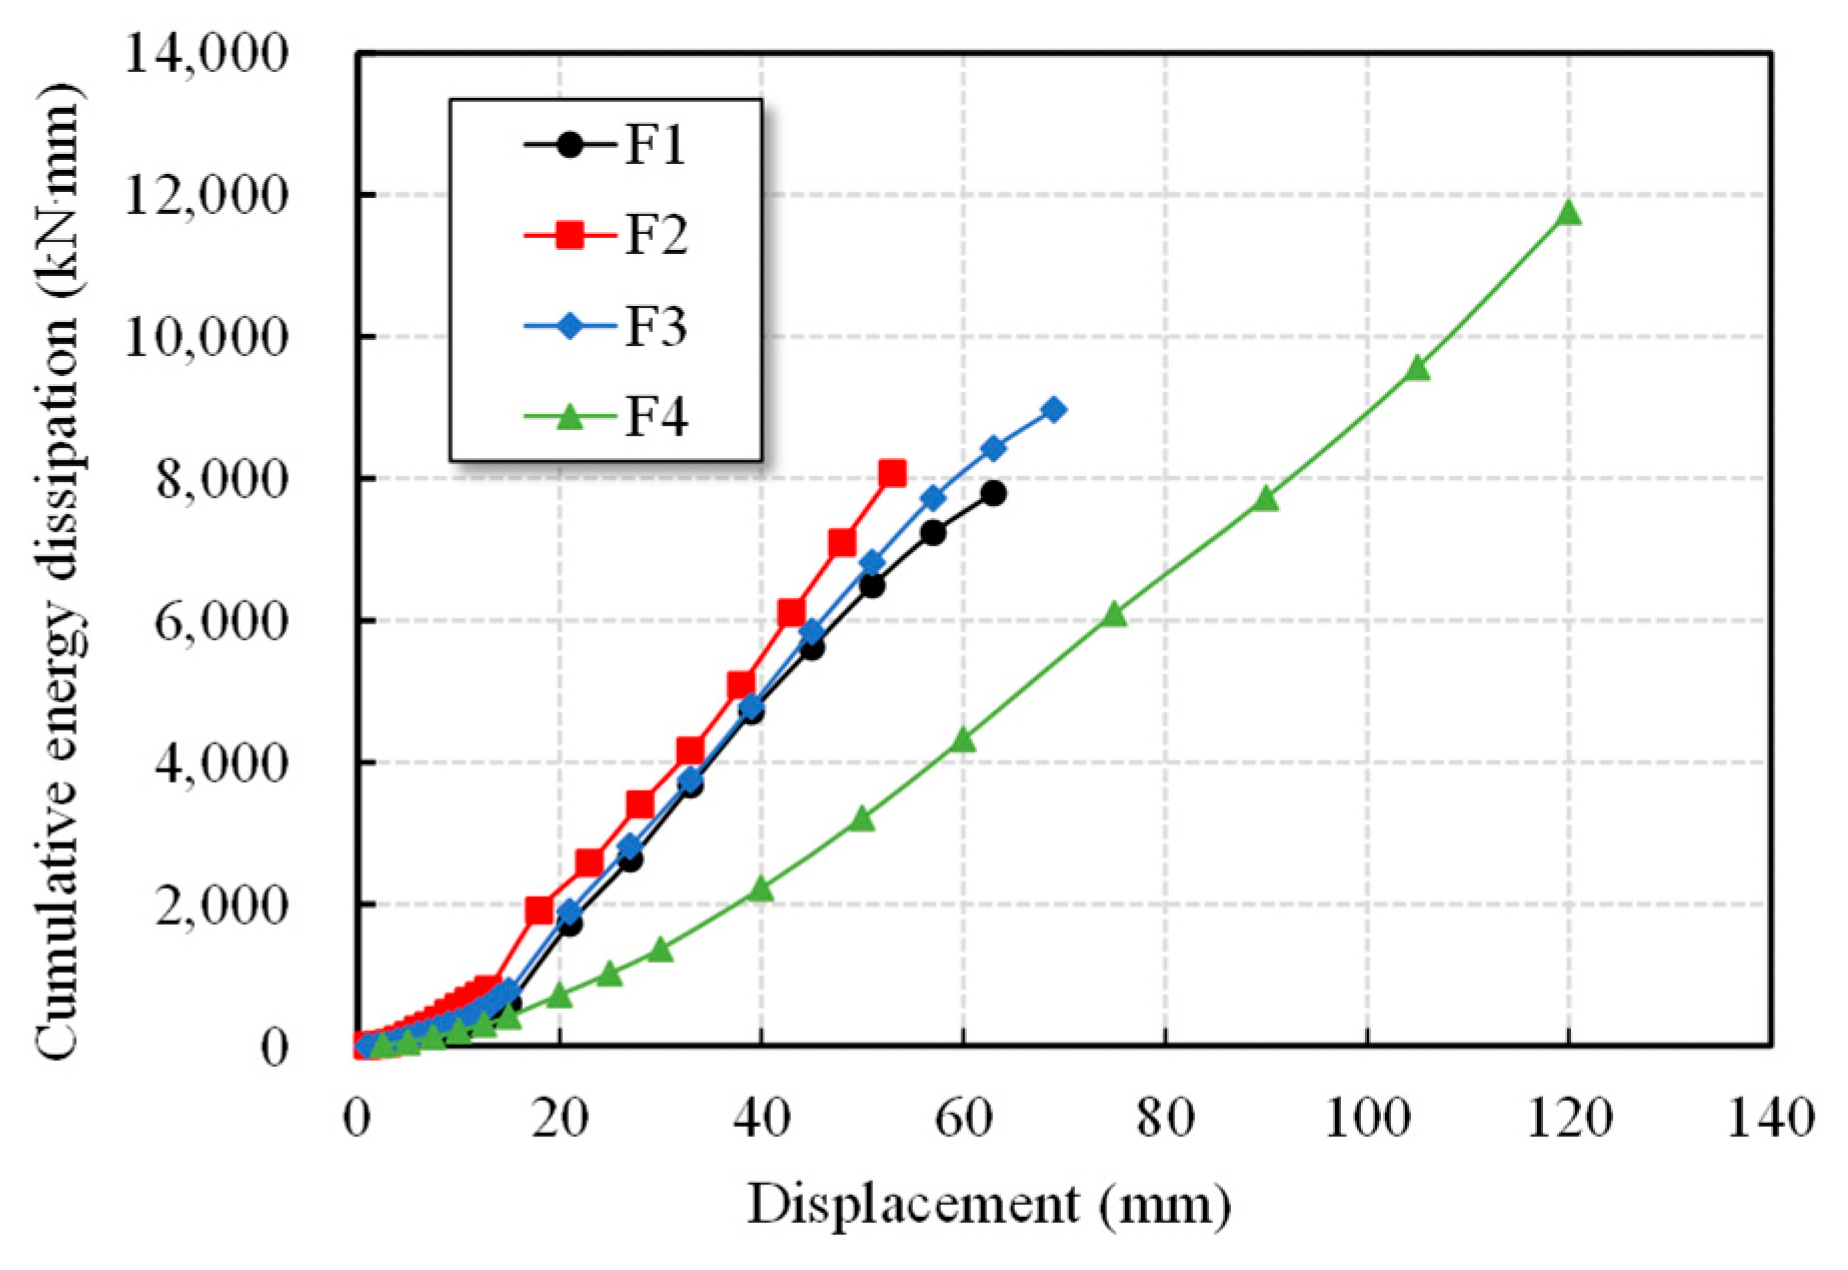
The energy dissipation-displacement relationships of the specimens are presented in Figure 13. It can be seen that the energy dissipation improved with the increase in the loading displacement. At the early loading stage, the energy dissipation of F1, F2, and F3 increased slowly with comparable values. Once the displacement reached the yield point, their dissipation capacities rose rapidly at similar rates. In the later loading stage, the growth rate of F1 and F3 declined due to stiffness degradation and damage accumulation. In contrast, F4 exhibited a slower rate of energy dissipation growth throughout loading. However, owing to the large deformation capacity of the LRB and its ability to absorb energy effectively, F4 achieved the highest energy dissipation at the end of the loading step. Compared with F1, the hysteretic energy dissipation of F2, F3, and F4 increased by 3.52%, 15.03%, and 50.78%, respectively. These results confirm that base isolation provides superior energy dissipation capacity compared with RC jacketing and steel jacketing.
It is found that despite this clear difference in energy dissipation, the equivalent viscous damping ratios at maximum displacement of F2 specimen were 28.23% for F1, 23.70% for F2, 21.68% for F3 and 10.62% for F4 specimens. This small reduction found in F2 shows that increase in stiffness of F2 reduced the equivalent damping ratio although RC jacketing enhanced the energy dissipation. Similar trend is found in F3 specimen. But it is noted that F4 specimen exhibited highest increase in hysteretic energy dissipation, but its damping ratio observed is smaller. This is due to the redistribution of energy dissipation through the isolator, which permits large, full-system oscillations at a lower force level, effectively increasing the area under the force-displacement hysteresis loop (energy dissipated) without requiring a higher damping ratio at a given displacement. Additionally, at each maximum displacement, the equivalent viscous damping ratios were found approximately similar, i.e., 26.75% for F1, 23.70% for F2, 26.22% for F3, and 27.06% for F4.
It is noted that the present study primarily evaluated displacement and ductility at the frame level rather than interstory drift ratios, but the results can be interpreted in the context of performance-based design. According to FEMA 356 [42], the Life Safety performance level generally corresponds to drift limits of about 1–2%, while Collapse Prevention may allow up to 4%. The observed displacement capacities of the specimens, when normalized by the story height, indicate that the unretrofitted frame (F1) exceeded Life Safety limits, while the retrofitted specimens (F2 and F3) achieved improved capacity but still approached the upper range of Life Safety. In contrast, the base-isolated frame (F4) maintained deformation demands equivalent to drifts below 1%, consistent with Immediate Occupancy or enhanced Life Safety performance. This highlights the practical implications of the retrofitting strategies in meeting performance-based design criteria.

3.6. Strain Analysis

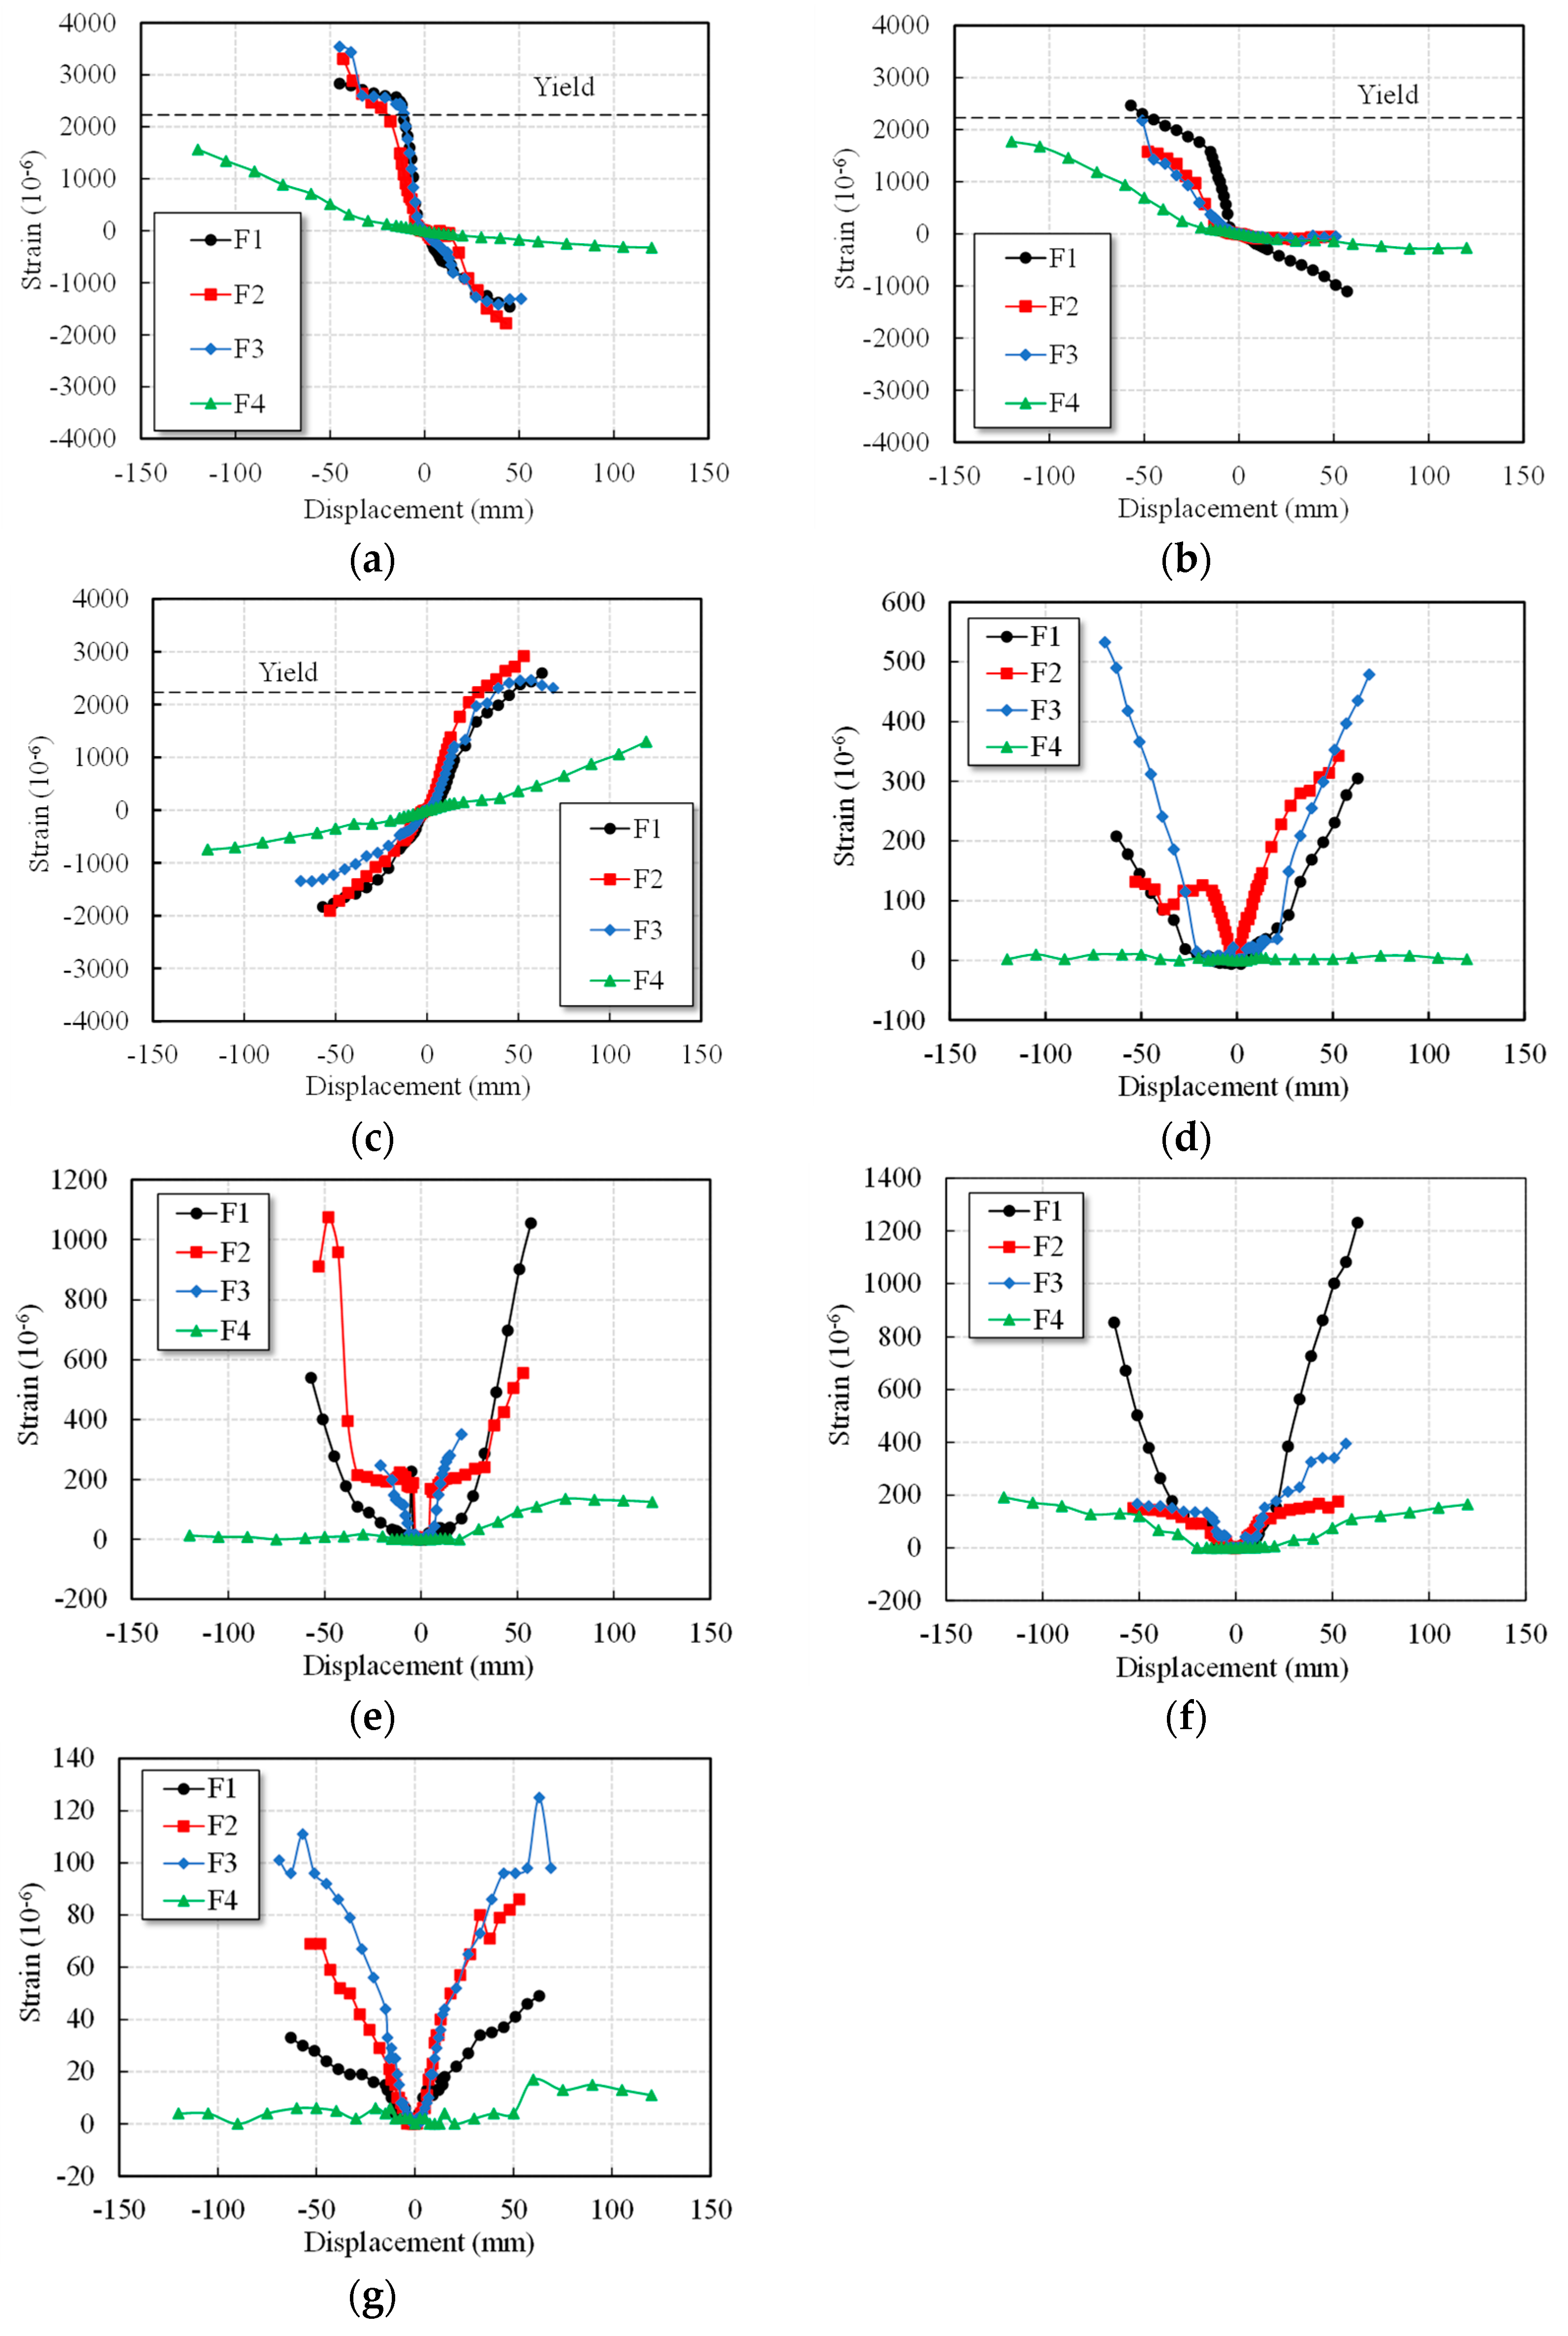
Strain measurements are fundamental for analyzing the response of retrofitted structures, as they reveal the local behavior of critical components. The strains of the longitudinal reinforcement and stirrups in the specimens were recorded during cyclic loading. Figure 14 presents the reinforcement strains of the specimens at each loading stage. As shown in Figure 14, RC and steel jacketing slightly delayed the yielding of longitudinal bars, but their strain histories were largely similar to that of specimen F1. In contrast, specimen F4 significantly reduced strains, with no reinforcement yielding observed throughout the test. At the column tops, yielding occurred only in specimen F1, while all retrofitted specimens effectively limited strain transfer upward. It is noted that for specimen F1, the maximum tensile strains reached 2832 με at the column bottom and 2465 με at the column top, both exceeding the yield strain of about 2000 με. In contrast, for specimens F2 and F3, the maximum tensile strains at the column top were restrained to about 1578 με and 2177 με, respectively, remaining below or close to yield, while at the column bottom the peak values reached 3308 με, 3544 με, respectively, indicating localized yielding. For specimen F4, the strains in both the top and bottom longitudinal bars remained below 2000 με (i.e., at column bottom was 1567 με and column top was 1772 με) far from yielding. These results quantitatively confirm that base isolation effectively prevented yielding of the original columns.
For stirrups, RC and steel jacketing produced larger strains at the column bases during the early stage, whereas F4 consistently exhibited the lowest values. At the column tops, the retrofitted specimens ultimately developed smaller stirrup strains than the un-retrofitted specimens.
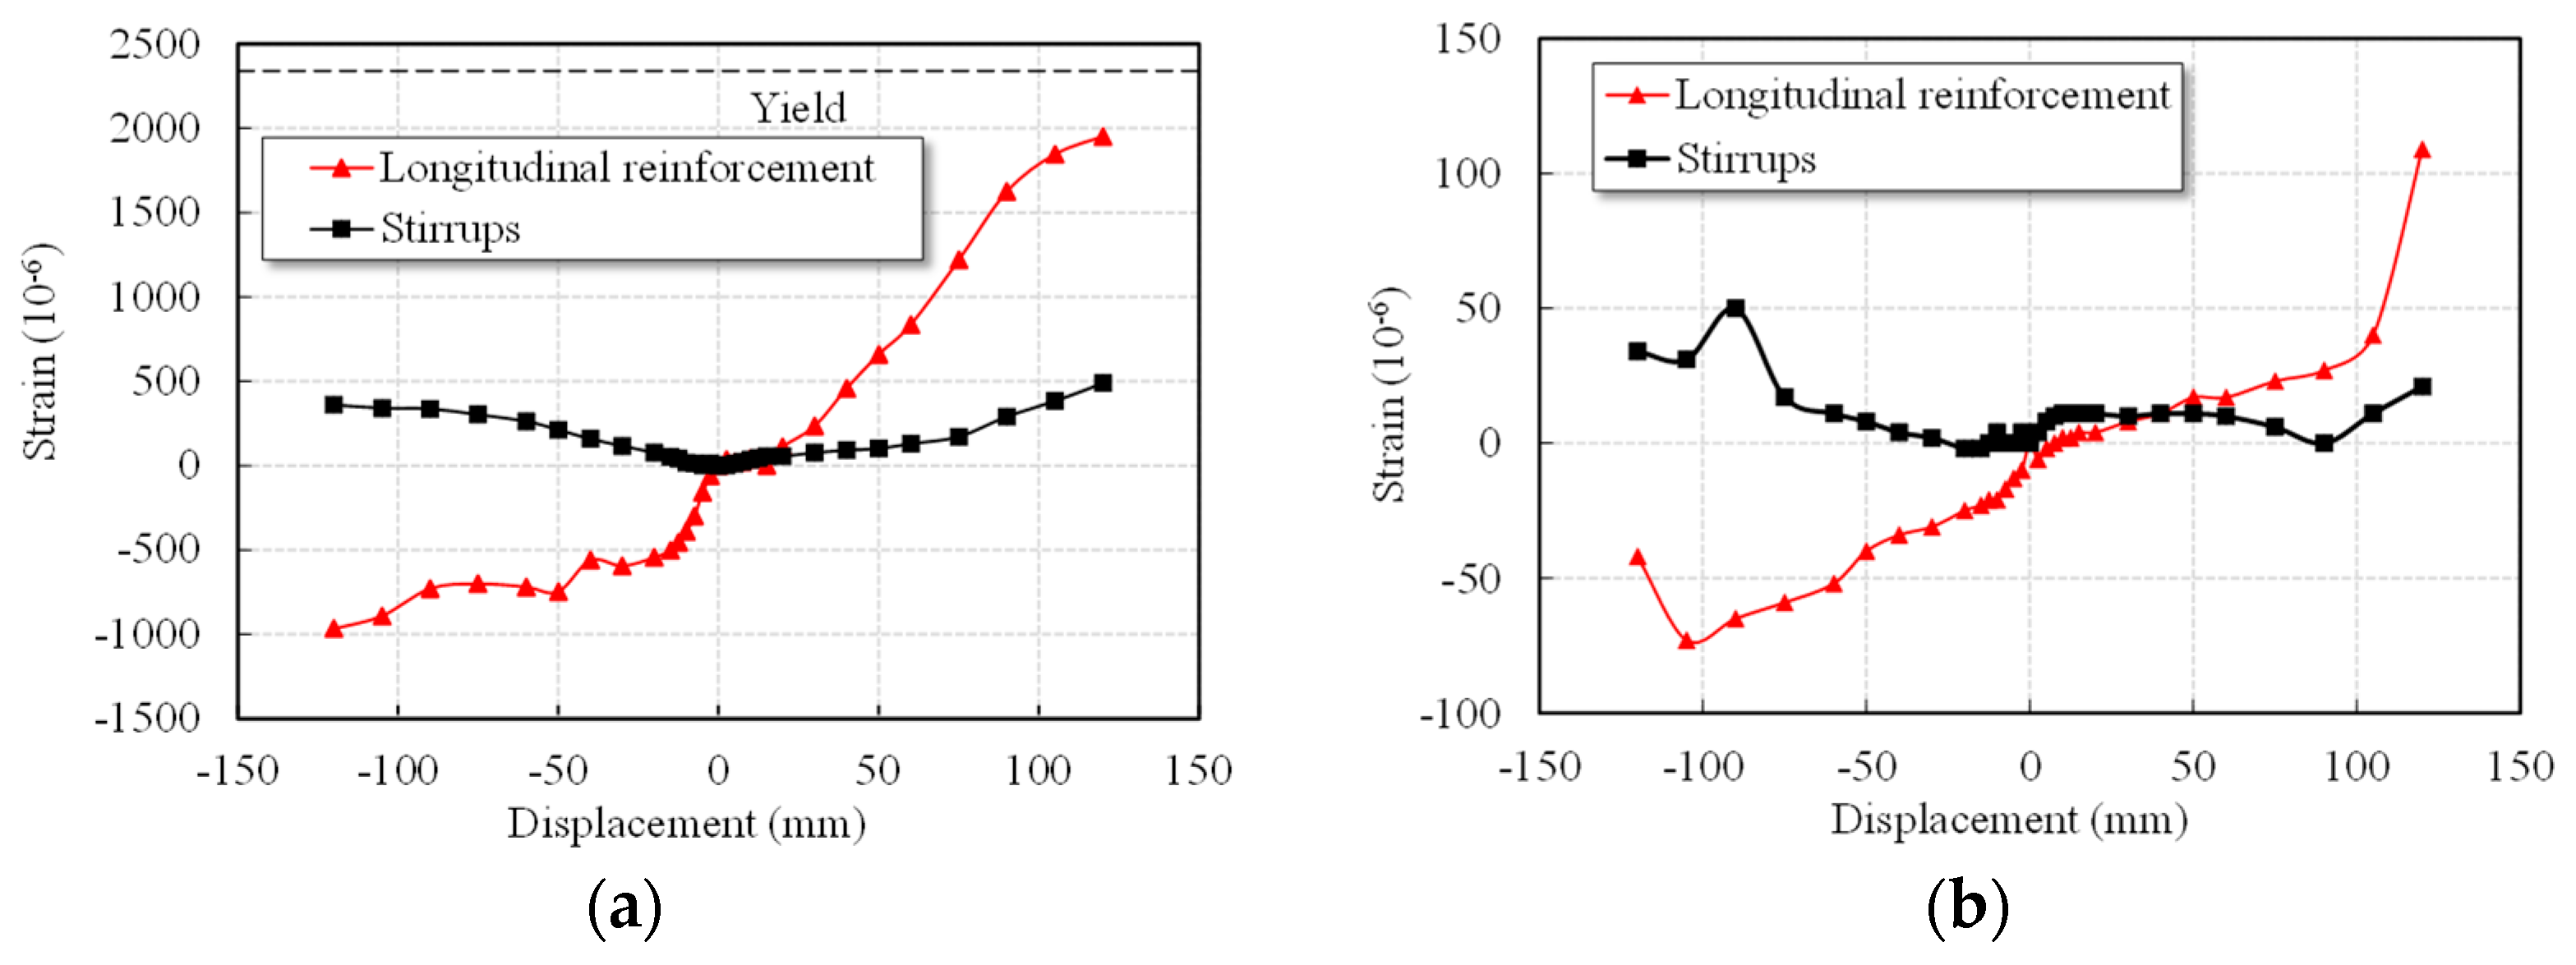
Beam reinforcement responses further highlighted the limitations of column-only strengthening (i.e., specimens F2 and F3). RC and steel jacketing accelerated yielding at the beam ends and increased mid-span reinforcement strains, which intensified cracking of concrete. Their beam stirrup strains also developed more rapidly than in the un-retrofitted specimen. By contrast, base isolation prevented beam reinforcement yielding, reduced both longitudinal and stirrup strains, and mitigated beam damage. Figure 15 shows the strain of the reinforcement in the transfer beam in specimen F4. As shown in Figure 15, transfer beam strains were concentrated at the beam ends, with almost yielding observed near failure. Specimen F4 exhibited high strains in the transfer beams, consistent with the observed sequence in which secondary members failed first a desirable mechanism for protecting primary components.
The reinforcement strain results indicate that RC and steel jacketing improved column behavior by successfully preventing the column yielding but shifted plastic hinge formation to the beams. This redistribution is consistent with the ‘strong column-weak beam’ concept and may be regarded as favorable for global stability. Additionally, the base isolation provided a more effective and balanced improvement by limiting reinforcement strains across the structure, and the earlier destruction of sacrificial members compared to the original structural members was favorable for protecting the original structure.

4. Conclusions

In this study, three retrofitting techniques, i.e., RC jacketing, steel jacketing, and base isolation, were compared through cyclic loading tests to evaluate their effects on seismic performance and to clarify the advantages of base isolation for existing frame structures. The main conclusions can be drawn as follows:
  • All retrofitting methods changed the damage mechanism. RC and steel jacketing shifted the plastic hinge from the column base to the beam ends. In contrast, base isolation transferred it to the transfer beam, thereby providing better protection for the original structural elements.
  • RC jacketing increased the peak lateral bearing capacity by 59.86% and the initial stiffness by 45.9% compared with the un-retrofitted specimen, while steel jacketing achieved increases of 7.5% in peak lateral bearing capacity and 2.1% increase in initial stiffness, respectively. In contrast, base isolation showed a slight decrease of 16.6% in lateral load capacity, indicating the significant reduction in the seismic force demand on the superstructure and reflecting its role in reducing seismic energy transfer rather than strengthening the superstructure.
  • The ductility coefficient decreased slightly under RC jacketing by 10.4% and under steel jacketing by 10.9%, indicating restricted plastic deformation. Conversely, base isolation improved ductility significantly, extending the ultimate deformation capacity by 90.6% compared with the un-retrofitted specimen. The hysteretic energy dissipation increased by 3.5% for RC jacketing, 15.0% for steel jacketing, and 50.8% for base isolation, compared with the un-retrofitted specimen. This confirms the superior capacity of base isolation to absorb seismic energy.
  • Although RC and steel jacketing enhance strength and stiffness, they slightly compromise ductility. On the other hand, base isolation achieves the best balance by significantly enhancing ductility and energy dissipation, thereby offering the most effective improvement in overall seismic performance.
This study is limited by the fact that only one specimen was tested for each retrofitting method. As a result, the findings cannot fully capture the potential variability arising from material properties, construction tolerances, or imperfections. The valuable findings of this study provide comparative insights but should be generalized with caution. Future studies with multiple specimens having parametric variations are required to validate the findings. Additionally, it is noted that beyond structural performance, each retrofitting technique carries practical implications and limitations. RC jacketing is intrusive and increases mass and stiffness, potentially disrupting use during construction. Steel jacketing can be installed more rapidly with less disruption, though corrosion protection and cost are concerns. Base isolation substantially reduces seismic demand most effectively, but its application is limited by practical constraints. Installation requires sufficient seismic gaps and access to the foundation, which may not be feasible in existing buildings with basements or in densely built environments. Therefore, these limitations should be considered when selecting retrofit strategies.

Author Contributions

Conceptualization, W.W. and M.Z.; methodology, M.X.; validation, J.L. and M.X.; formal analysis, W.W.; investigation, Z.X. and M.X.; writing—original draft preparation, W.W.; writing—review and editing, M.X., M.A. and M.Z.; visualization, M.X. and M.A.; supervision, W.W. and M.Z.; project administration, W.W.; funding acquisition, W.W. and M.Z. All authors have read and agreed to the published version of the manuscript.

Funding

The authors get the financial support from the National Natural Science Foundation of China (Grant No. 52208197), Guangdong Basic and Applied Basic Research Foundation (Grant No. 2025A1515010872), and Shenzhen Municipal Center for Transport Infrastructure Construction Research Project (Eastern Transit Expressway Connection Project “Research and Application of Key Technologies for the Durability of Tunnel Concrete Structures”).

Data Availability Statement

The original contributions presented in the study are included in the article, further inquiries can be directed to the corresponding author.

Conflicts of Interest

The authors declare no conflicts of interest.

References

  1. Gkournelos, P.D.; Triantafillou, T.C.; Bournas, D.A. Seismic Upgrading of Existing Reinforced Concrete Buildings: A State-of-the-Art Review. Eng. Struct. 2021, 240, 112273. [Google Scholar] [CrossRef]
  2. Baek, E.; Pohoryles, D.A.; Kallioras, S.; Bournas, D.A.; Choi, H.; Kim, T. Innovative Seismic and Energy Retrofitting of Wall Envelopes Using Prefabricated Textile-Reinforced Concrete Panels with an Embedded Capillary Tube System. Eng. Struct. 2022, 265, 114453. [Google Scholar] [CrossRef]
  3. Cosgun, T.; Sayin, B.; Gunes, B.; Mangir, A. Retrofitting Technique Effectiveness and Seismic Performance of Multi-Rise RC Buildings: A Case Study. Case Stud. Constr. Mater. 2022, 16, e00931. [Google Scholar] [CrossRef]
  4. Cao, X.-Y.; Shen, D.; Feng, D.-C.; Wang, C.-L.; Qu, Z.; Wu, G. Seismic Retrofitting of Existing Frame Buildings through Externally Attached Sub-Structures: State of the Art Review and Future Perspectives. J. Build. Eng. 2022, 57, 104904. [Google Scholar] [CrossRef]
  5. Thermou, G.E.; Elnashai, A.S. Seismic Retrofit Schemes for RC Structures and Local-global Consequences. Prog. Struct. Eng. Mater. 2006, 8, 1–15. [Google Scholar] [CrossRef]
  6. Hung, C.-C.; Hsiao, H.-J.; Shao, Y.; Yen, C.-H. A Comparative Study on the Seismic Performance of RC Beam-Column Joints Retrofitted by ECC, FRP, and Concrete Jacketing Methods. J. Build. Eng. 2023, 64, 105691. [Google Scholar] [CrossRef]
  7. Truong, G.T.; Kim, J.-C.; Choi, K.-K. Seismic Performance of Reinforced Concrete Columns Retrofitted by Various Methods. Eng. Struct. 2017, 134, 217–235. [Google Scholar] [CrossRef]
  8. Furtado, A.; Rodrigues, H.; Varum, H.; Costa, A. Evaluation of Different Strengthening Techniques’ Efficiency for a Soft Storey Building. Eur. J. Environ. Civ. Eng. 2017, 21, 371–388. [Google Scholar] [CrossRef]
  9. Mugahed Amran, Y.H.; Alyousef, R.; Rashid, R.S.M.; Alabduljabbar, H.; Hung, C.-C. Properties and Applications of FRP in Strengthening RC Structures: A Review. Structures 2018, 16, 208–238. [Google Scholar] [CrossRef]
  10. Chang, S.-Y.; Chen, T.-W.; Tran, N.-C.; Liao, W.-I. Seismic Retroftting of RC Columns with RC Jackets and Wing Walls with Different Structural Details. Earthq. Eng. Eng. Vib. 2014, 13, 279–292. [Google Scholar] [CrossRef]
  11. Ma, C.-K.; Apandi, N.M.; Sofrie, C.S.Y.; Ng, J.H.; Lo, W.H.; Awang, A.Z.; Omar, W. Repair and Rehabilitation of Concrete Structures Using Confinement: A Review. Constr. Build. Mater. 2017, 133, 502–515. [Google Scholar] [CrossRef]
  12. Shin, J.; Jeon, J.-S. Seismic Damage Mitigation Strategy Using an FRP Column Jacketing System in Gravity-Designed Reinforced Concrete Building Frames. Compos. Struct. 2022, 279, 114700. [Google Scholar] [CrossRef]
  13. Kim, M.S.; Lee, Y.H. Seismic Performance of Reinforced Concrete Columns Retrofitted with Hybrid Concrete Jackets Subjected to Combined Loadings. Materials 2022, 15, 6213. [Google Scholar] [CrossRef] [PubMed]
  14. Olmos Navarrete, B.A.; Jara Guerrero, J.M.; Gómez Soberón, M.D.L.C.T.J.; Jara Díaz, M. Influence of RC Jacketing on the Seismic Vulnerability of RC Bridges. Eng. Struct. 2016, 123, 236–246. [Google Scholar] [CrossRef]
  15. Zhou, Y.; Wang, X.; Hu, B.; Sui, L.; Yuan, F. Seismic Retrofit of Nonuniformly Corroded Coastal Bridge Piers with FRP and Engineered Cementitious Composite Overlays. J. Compos. Constr. 2023, 27, 04022088. [Google Scholar] [CrossRef]
  16. Zhang, Y.; Cheng, X.; Diao, M.; Li, Y.; Guan, H.; Sun, H. FRP Retrofit for RC Frame Substructures against Progressive Collapse: Scheme Optimisation and Resistance Calculation. Eng. Struct. 2023, 289, 116289. [Google Scholar] [CrossRef]
  17. Pan, J.; Wang, X.; Wu, F. Strengthening of Precast RC Frame to Mitigate Progressive Collapse by Externally Bonded CFRP Sheets Anchored with HFRP Anchors. Adv. Civ. Eng. 2018, 2018, 8098242. [Google Scholar] [CrossRef]
  18. Ozcan, O.; Binici, B.; Ozcebe, G. Seismic Strengthening of Rectangular Reinforced Concrete Columns Using Fiber Reinforced Polymers. Eng. Struct. 2010, 32, 964–973. [Google Scholar] [CrossRef]
  19. Zhang, C.; Wu, L.; Elchalakani, M.; Cai, J. Cyclic Loading Test for Reinforced Concrete Columns Strengthened with High-Strength Engineered Cementitious Composite Jacket. Eng. Struct. 2023, 278, 115571. [Google Scholar] [CrossRef]
  20. Shao, Y.; Tich, K.L.; Boaro, S.B.; Billington, S.L. Impact of Fiber Distribution and Cyclic Loading on the Bond Behavior of Steel-Reinforced UHPC. Cem. Concr. Compos. 2022, 126, 104338. [Google Scholar] [CrossRef]
  21. Deng, M.; Zhang, Y.; Li, Q. Shear Strengthening of RC Short Columns with ECC Jacket: Cyclic Behavior Tests. Eng. Struct. 2018, 160, 535–545. [Google Scholar] [CrossRef]
  22. Gondaliya, K.M.; Vasanwala, S.A.; Desai, A.K.; Amin, J.A.; Bhaiya, V. Machine Learning-Based Approach for Assessing the Seismic Vulnerability of Reinforced Concrete Frame Buildings. J. Build. Eng. 2024, 97, 110785. [Google Scholar] [CrossRef]
  23. Kazemi, F.; Asgarkhani, N.; Jankowski, R. Machine Learning-Based Seismic Fragility and Seismic Vulnerability Assessment of Reinforced Concrete Structures. Soil Dyn. Earthq. Eng. 2023, 166, 107761. [Google Scholar] [CrossRef]
  24. Couto, R.; Requena-García-Cruz, M.V.; Bento, R.; Morales-Esteban, A. Seismic Vulnerability Assessment of RC Structures: Research and Practice at Building Level. In Seismic Vulnerability Assessment of RC Buildings Considering the Implications of Ageing Effects; Couto, R., Ed.; Elsevier: Amsterdam, The Netherlands, 2022. [Google Scholar] [CrossRef]
  25. Samuel, M.A.; Xiong, E.; Haris, M.; Lekeufack, B.C.; Xie, Y.; Han, Y. Assessing Seismic Vulnerability Methods for RC-Frame Buildings Pre- and Post-Earthquake. Sustainability 2024, 16, 10392. [Google Scholar] [CrossRef]
  26. Yang, Y.; Li, T.; Dai, K.; Wu, M. Evaluation of Ground Motion Intensity Measures for Base-Isolated Steel Frame Buildings with Lead Rubber Bearings. Eng. Struct. 2025, 327, 119609. [Google Scholar] [CrossRef]
  27. Kanyilmaz, A.; Castiglioni, C.A. Reducing the Seismic Vulnerability of Existing Elevated Silos by Means of Base Isolation Devices. Eng. Struct. 2017, 143, 477–497. [Google Scholar] [CrossRef]
  28. Ghafar, W.A.; Zhong, T.; Lai, Z.; Pingle, Z.; Yang, Y.; Hasan, M.M. Seismic Isolation for Existing Structures: A Review of Retrofitting Techniques, Case Studies, and Trends. Discov. Civ. Eng. 2025, 2, 137. [Google Scholar] [CrossRef]
  29. Chen, P.; Lu, Y.; Wang, B.; Zhuang, P.; Dai, K. Enhancing Seismic Resilience in Base-Isolated Structures: A Performance-Based Comparison of HDRB and LRB Isolation Systems. Eng. Struct. 2025, 342, 120945. [Google Scholar] [CrossRef]
  30. Hu, G.-J.; Ye, K.; Tang, Z.-Y. Design and Analysis of LRB Base-Isolated Building Structure for Multilevel Performance Targets. Structures 2023, 57, 105236. [Google Scholar] [CrossRef]
  31. Matsagar, V.A.; Jangid, R.S. Base Isolation for Seismic Retrofitting of Structures. Pract. Period. Struct. Des. Constr. 2008, 13, 175–185. [Google Scholar] [CrossRef]
  32. Aghaeidoost, V.; Billah, A.H.M.M. An Advanced Rate-dependent Analytical Model of Lead Rubber Bearing. Earthq. Eng. Struct. Dyn. 2024, 53, 1961–1981. [Google Scholar] [CrossRef]
  33. Ziraoui, A.; Kissi, B.; Aaya, H.; Azdine, I. Seismic Behavior of Base-Isolated Building Structures with Lead Rubber Bearings (LRBs). Procedia Struct. Integr. 2024, 61, 171–179. [Google Scholar] [CrossRef]
  34. Fakih, M.; Hallal, J.; Darwich, H.; Damerji, H. Effect of Lead-Rubber Bearing Isolators in Reducing Seismic Damage for a High-Rise Building in Comparison with Normal Shear Wall System. Struct. Durab. Health Monit. 2021, 15, 247–260. [Google Scholar] [CrossRef]
  35. Mahamied, A.; Yasin, A.A.; Alzubi, Y.; Adwan, J.A.; Mahamied, I. Influence of Vertical Irregularity on the Seismic Behavior of Base Isolated RC Structures with Lead Rubber Bearings under Pulse-Like Earthquakes. Struct. Durab. Health Monit. 2023, 17, 501–519. [Google Scholar] [CrossRef]
  36. Faiella, D.; Calderoni, B.; Mele, E. Seismic Retrofit of Existing Masonry Buildings through Inter-Story Isolation System: A Case Study and General Design Criteria. J. Earthq. Eng. 2022, 26, 2051–2087. [Google Scholar] [CrossRef]
  37. Li, T.; Yang, Y.; Dai, K.; Ge, Q.; Wang, J. Influence of Ground Motion Duration on Seismic Performance of RC Frame Isolated by High Damping Rubber Bearings. Eng. Struct. 2022, 262, 114398. [Google Scholar] [CrossRef]
  38. Khan, B.L.; Azeem, M.; Usman, M.; Farooq, S.H.; Hanif, A.; Fawad, M. Effect of near and Far Field Earthquakes on Performance of Various Base Isolation Systems. Procedia Struct. Integr. 2019, 18, 108–118. [Google Scholar] [CrossRef]
  39. GB/T 50081-2019; Standard for Test Methods of Concrete Physical and Mechanical Properties. China Architecture & Building Press: Beijing, China, 2019.
  40. GB/T 228.1-2021; Metallic Materials—Tensile Testing—Part 1: Method of Test at Room Temperature. China Standards Press: Beijing, China, 2021.
  41. GB/T 20688.1-2007; Rubber Bearings—Part 1: Seismic-Protection Isolators Test Methods. China Standards Press: Beijing, China, 2007.
  42. FEMA 356; Prestandard and Commentary for the Seismic Rehabilitation of Buildings. Federal Emergency Management Agency: Washington, DC, USA, 2000.
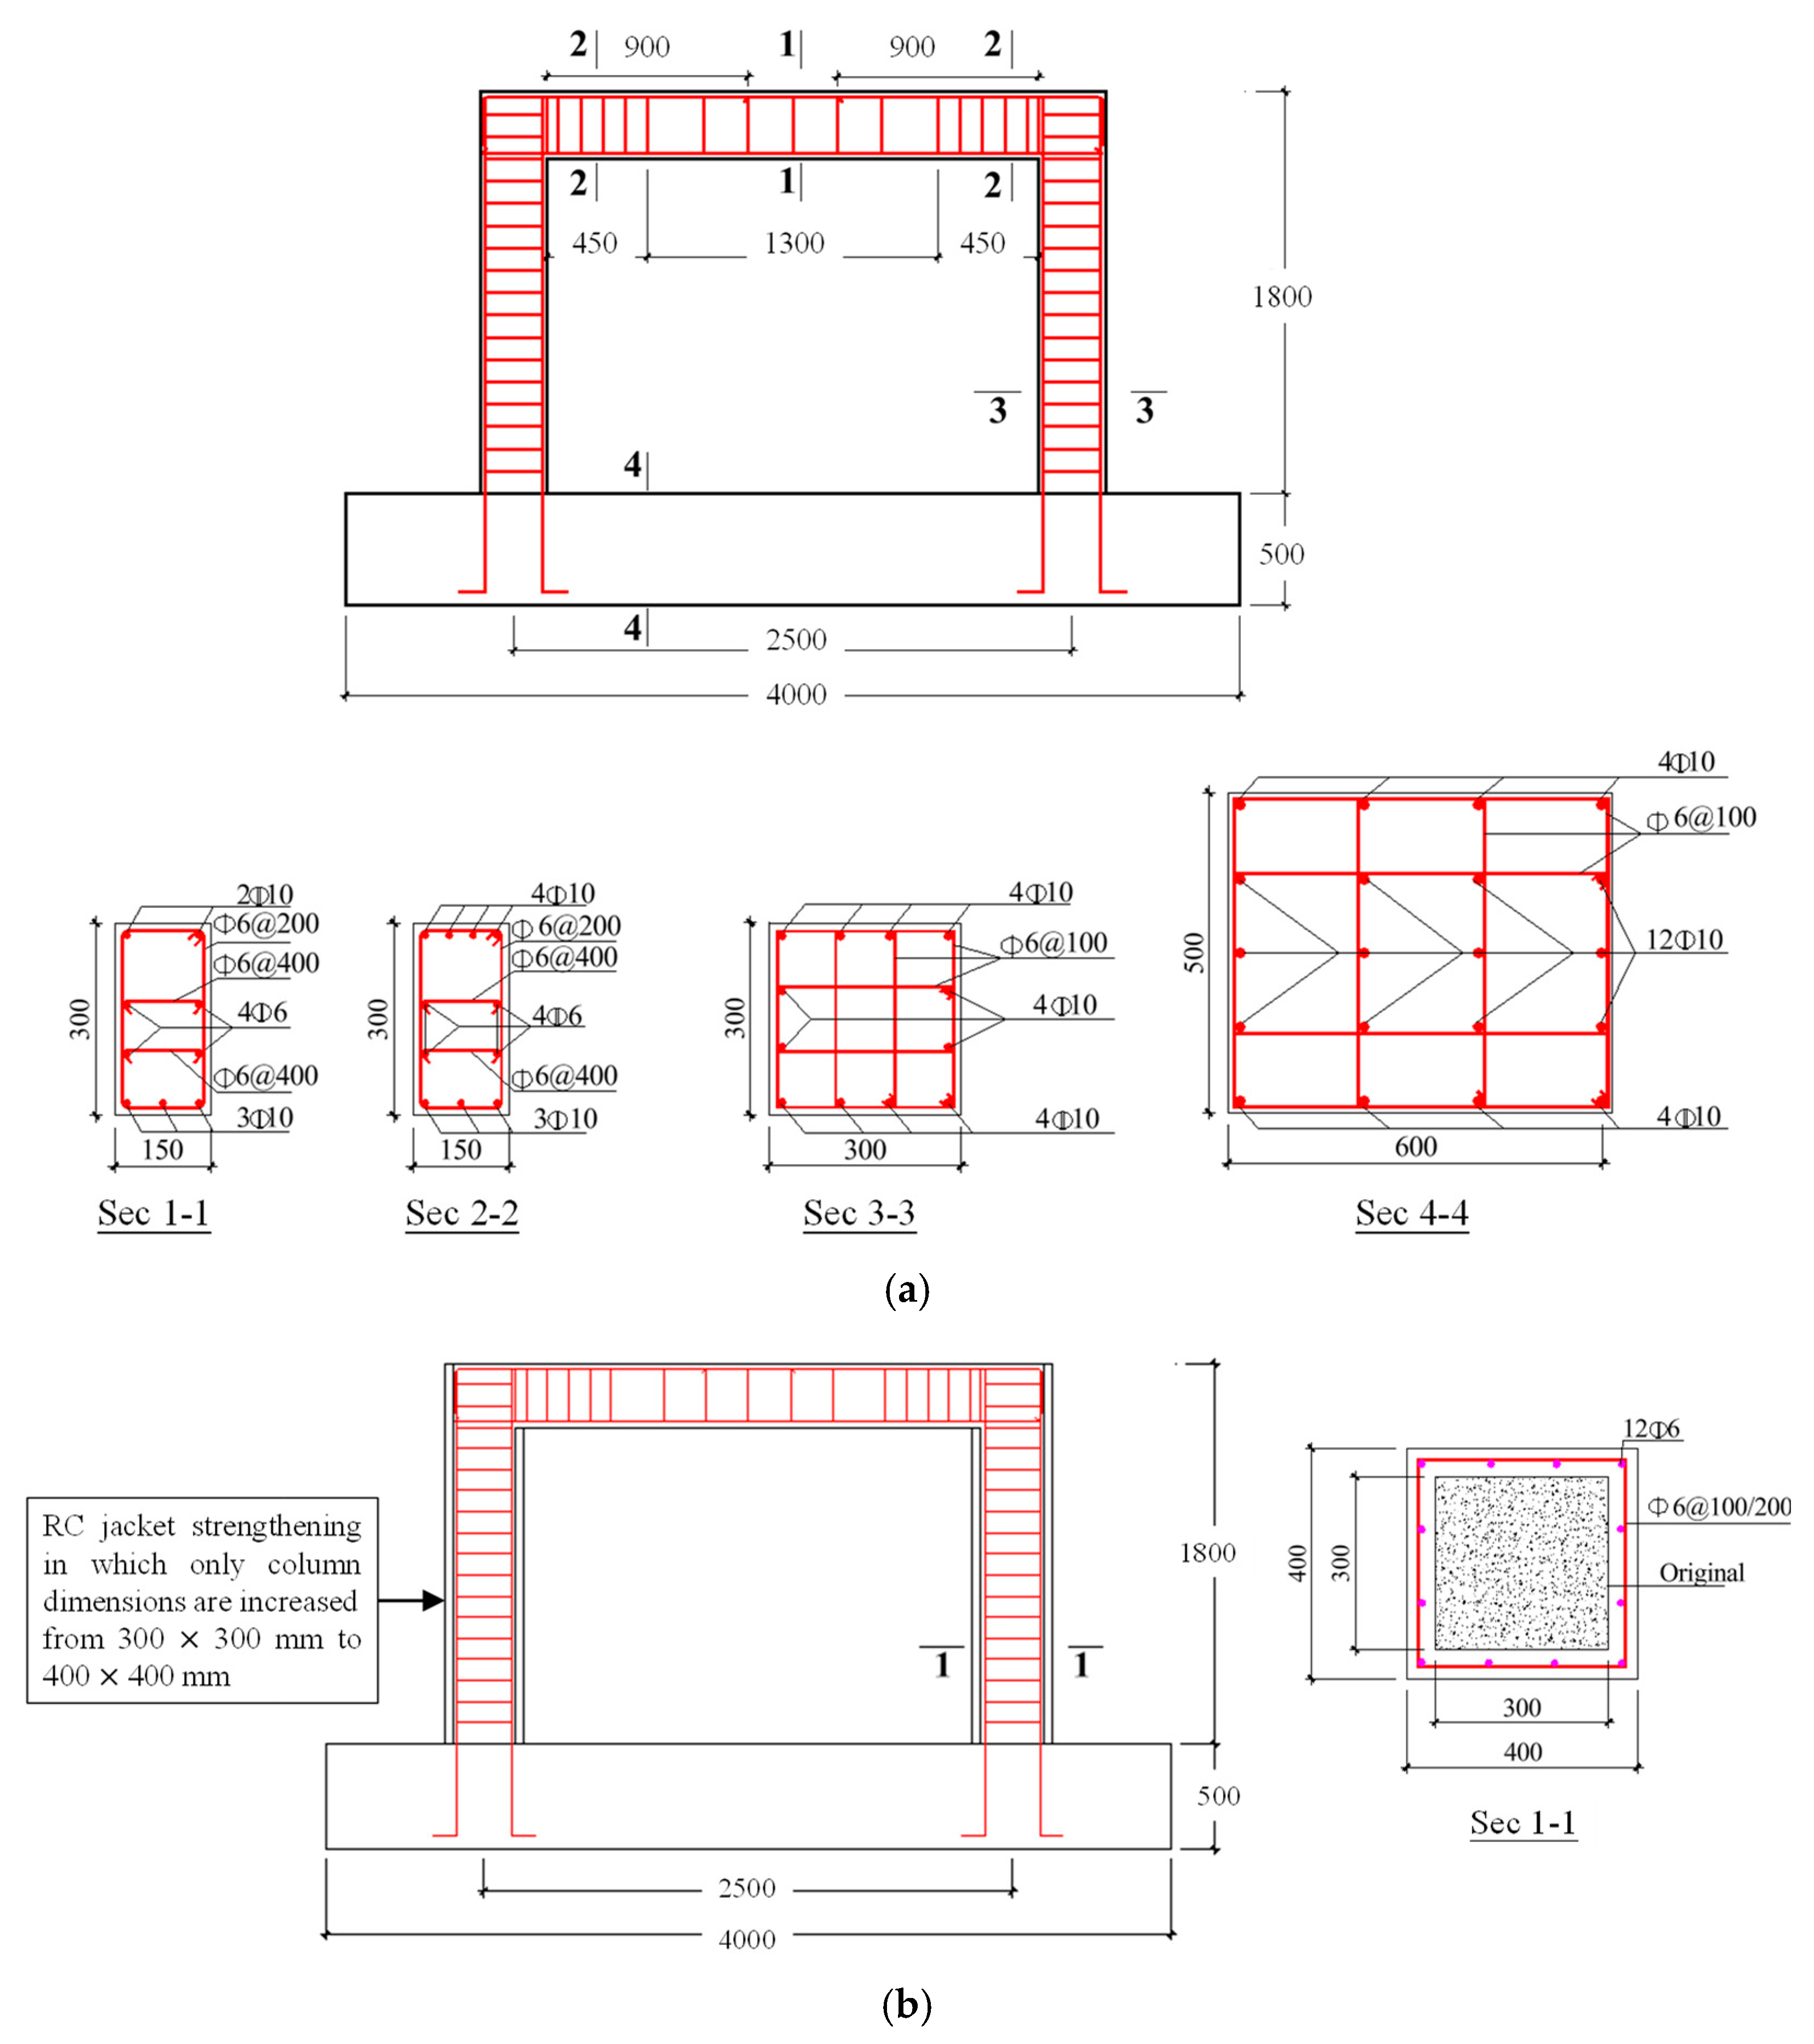
Figure 1. Detailed design of specimens. (a) Specimen F1; (b) Specimen F2; (c) Specimen F3; (d) Specimen F4 (Unit: mm).
Buildings 15 03539 g001aBuildings 15 03539 g001b
Figure 2. Geometry of the pre-embedded anchorage plate and the LRB connection configuration (Unit: mm).
Buildings 15 03539 g002
Figure 3. Design of LRB and bearing pad (Unit: mm).
Buildings 15 03539 g003
Figure 4. Test setup. (a) Schematic diagram; (b) Photo.
Buildings 15 03539 g004
Figure 5. Loading protocol adopted in the tests. (a) For specimens F1, F2, and F3; (b) For specimen F4.
Buildings 15 03539 g005
Figure 6. Strain gauge measurement points.
Buildings 15 03539 g006
Figure 7. Final damage state of the specimens at different locations. (a) Specimen F1; (b) Specimen F2; (c) Specimen F3; (d) Specimen F4.
Buildings 15 03539 g007aBuildings 15 03539 g007b
Figure 8. Drawn crack patterns of the specimens with respect to displacement (a) Specimen F1; (b) Specimen F2; (c) Specimen F3; (d) Specimen F4; (Note: A and B represent two columns of RC frames).
Buildings 15 03539 g008aBuildings 15 03539 g008b
Figure 9. Load–displacement hysteretic loops obtained during the loading tests.
Buildings 15 03539 g009
Figure 10. Hysteretic behavior of all parts for specimen F4.
Buildings 15 03539 g010
Figure 11. Skeleton curves.
Buildings 15 03539 g011
Figure 12. Stiffness degradation curves.
Buildings 15 03539 g012
Figure 13. Energy dissipation-displacement relationships of the specimens.
Buildings 15 03539 g013
Figure 14. Rebar strains. (a) Longitudinal reinforcement at the bottom end of column; (b) Longitudinal reinforcement at the top end of column; (c) Longitudinal reinforcement at the end of beam; (d) Longitudinal reinforcement at the mid-span of beam; (e) Stirrups at the bottom end of column; (f) Stirrups at the top end of column; (g) Stirrups at the mid-span of beam.
Buildings 15 03539 g014
Figure 15. Reinforcement strains. (a) At the end of the transfer beam; (b) At the mid-span of the transfer beam.
Buildings 15 03539 g015
Table 1. Mechanical properties of reinforcement.
Reinforcement Graded/mmfy/MPafu/MPaE × 105/MPa
HPB30063894652.1
6476589
HRB400104465732.0
12468534
Table 2. Parameters of LRB.
ParameterUnitValue
Effective diametermm300
Section aream20.071
First shape factor/20.26
Second shape factor/5.17
Vertical stiffnesskN/mm822
Yield forcekN26.54
Post yield stiffnesskN/mm0.449
Horizontal equivalent stiffnesskN/mm0.90
Total height of LRBmm156
Table 3. Strength and ductility coefficients.
SchemeFy (kN)Dy (mm)Fmax (kN)Dmax (mm)Fu (kN)Du (mm)μ
F1114.6417.18133.1933113.2162.953.66
F2184.4514.73212.9223180.9848.363.28
F3125.1719.47143.2645121.7763.433.26
F432.5117.93111.06120111.06120.006.69
Disclaimer/Publisher’s Note: The statements, opinions and data contained in all publications are solely those of the individual author(s) and contributor(s) and not of MDPI and/or the editor(s). MDPI and/or the editor(s) disclaim responsibility for any injury to people or property resulting from any ideas, methods, instructions or products referred to in the content.