1. Introduction
Construction waste is generally classified into two main types: physical waste and non-physical waste. Physical waste consists of material waste resulting from activities such as construction, demolition, and renovation, which include land excavation and roadwork, while some of these materials can be recycled or reused [
1]. On the other hand, non-physical waste arises during the construction phase due to design mistakes, delays, waiting time, and tasks that increase time and costs without contributing value [
2]. Waste factors can add over 10% to the total project cost; therefore, it is essential to focus on reducing these factors as a key strategy for enhancing construction performance [
3].
Lean principles and concepts are derived from the foundational principles of the Toyota Production System [
4]. Lean construction originated from lean manufacturing. Researchers have presented different explanations of LC [
5]. There are two primary interpretations of this concept: one perspective proposes that lean construction involves applying lean production techniques to the construction sector, while the other argues that lean production theory has been modified to develop a distinct model tailored specifically for the construction sector, known as lean construction [
6]. LC is not merely a new methodology but represents a transformative philosophy aimed at optimizing construction processes by minimizing waste and enhancing efficiency. Lean construction focuses on streamlining workflows, improving project delivery times, and maximizing value generation in construction projects [
7]. There are five main lean principles, namely define value, map the value stream, ensure flow, implement pull, and strive for perfection [
8]. Lean construction can be implemented in construction projects using various techniques, including Last Planner System (LPS), 5S, Value stream mapping (VSM), Poka-Joke, Six Sigma, Just-in-Time (JIT), Kanban, Push & Pull Strategy, A3 Reports, Improvement culture (Kaizen), Benchmarking, Total Quality Management (TQM), and Work standardization and Visual management [
9]. Lean principles and practices have been implemented in various construction areas, including enhancing collaboration among project stakeholders and supporting the implementation of technologies like Building Information Modeling (BIM) [
10]. A study has demonstrated that implementing lean construction can lead to time savings of approximately 20% to 30% and improve productivity [
11].
As the Sustainable Development Goals (SDGs) gain international prominence. The synergy between lean construction and sustainable buildings (SBs) has been studied by many researchers [
12]. Sustainability focuses on achieving a balance among environmental, economic, and social aspects, commonly known as the ‘triple bottom line’. Through the construction phase, the economic aspect of sustainability aims to optimize project budgets by reducing operational and maintenance costs. The environmental aspect concentrates on decreasing resource consumption and minimizing material and energy waste generated by construction activities. Meanwhile, the social aspect seeks to enhance workers’ health, safety, working conditions, and overall well-being [
13]. Both sustainable buildings and lean construction prioritize the safety and health of on-site workers. Sustainable building not only focuses on protecting natural resources but also emphasizes the well-being of construction workers, recognizing their importance. Similarly, lean construction values the human aspect as well [
14]. Lean practices, including VSM, Kaizen, 5S, and Kaikaku, can enhance the welfare of those involved by promoting health and safety and ensuring clean and organized work environments [
15]. A study highlighted several benefits of integrating these two approaches, including waste reduction, continuous improvement, reduced environmental impacts, prioritizing human well-being, optimizing resource management, maximizing value, improving safety and health, enhancing quality management, and reducing costs and lead times [
16,
17]. Lean emphasizes the short-term and focuses on enhancement and streamlining procedures. On the other hand, sustainability involves a broad and long-term perspective on reducing waste and enhancing overall society and environmental well-being, rather than just focusing on specific processes [
18]. Do Melo et al. (2023) [
19] outlined several benefits that arise from the integration of lean construction and LEED certification. These include improvements in management at construction sites, cost reductions, and enhanced logistics of materials, which are particularly relevant for improving efficiency in construction processes. Another study highlighted how implementing lean manufacturing practices can significantly enhance the performance of green sustainability, like reducing waste, conserving energy, and improving processes, which contribute to a reduced environmental impact for companies [
20]. Lean construction and sustainable building have shared several goals that promote economic sustainability. SB objectives work well with LC goals that focus on meeting customer demands for quality and cost [
21].
In their study, Senanayake et al. (2024) [
22] identified 19 lean tools for plumbing waste reduction in high-rise construction, including JIT, 5S, VSM, LPS, TQM, A total of 30 causes and 41 sub-causes of plumbing waste were identified. The study emphasized the importance of collaboration among stakeholders and the integration of BIM for real-time monitoring and waste reduction in plumbing operations. Another study introduced various lean tools designed to enhance construction project management, with particular emphasis on the last planner system. The study found that applying LPS and Integrated Project Delivery (IPD) significantly improved project scheduling reliability and facilitated on-time delivery of construction projects [
7]. Another study discussed lean construction’s implementation in a five-story residential building. The study showed that applying Lean Construction to the installation of electrical kits in a residential building significantly optimized workflow, reduced waste, and improved overall productivity, leading to a smoother and more efficient construction process [
23]. A study examined the Integration of lean construction with digital tools that enhance the reliability of planning for design tasks, particularly in two French projects. These tools result in avoiding design delay, optimizing processes, improving quality, and minimizing waste [
24]. Xing et al. (2021) [
25] identified and categorized the specific lean techniques used in a lean construction project in China, including LPS, Just-In-Time delivery, Kanban system, and the integration of digital technologies and the Internet of Things. The study shows that the implementation of lean principles led to substantial enhancements in project performance, such as minimizing waiting times and defects, enhanced workflow, and increased productivity and quality. Quiroz-Flores et al. (2023) [
26] proposed a lean management model based on LPS to enhance project delivery in the construction industry. Implementing LPS reduced late project delivery by 8%, increased plan reliability with a 22% rise in completed tasks, and decreased rework causes by 36%. Task completion also improved significantly, rising from 11% in the first four weeks to an average of 84%, aproaching the 90% target.
Lean principles and concepts are derived from the foundational principles of the Toyota Production System [
4]. Lean construction originated from lean manufacturing. Researchers have presented different explanations of LC [
5]. There are two primary interpretations of this concept: one perspective proposes that lean construction involves applying lean production techniques to the construction sector, while the other argues that lean production theory has been modified to develop a distinct model tailored specifically for the construction sector, known as lean construction [
6]. LC is not merely a new methodology but represents a transformative philosophy aimed at optimizing construction processes by minimizing waste and enhancing efficiency. There are five main lean principles, namely define value, map the value stream, ensure flow, implement pull, and strive for perfection [
8]. Lean construction can be implemented in construction projects using various techniques, including LPS, 5S, VSM, Poka-Joke, Just-in-Time (JIT), Kanban, Improvement culture (Kaizen), Benchmarking, Total Quality Management (TQM), Work standardization and Visual management [
9]. Lean tools such as QFD, LPS, VSM, and 5S have proven to be highly effective in improving construction project efficiency and promoting sustainability, which aligns well with the objectives of green building practices.
1.1. Quality Function Deployment
QFD is defined as an organized planning tool that systematically converts customer requirements into appropriate technical criteria throughout all phases of product development and production [
27]. Quality Function Deployment originated in Japan in the late 1960s within the manufacturing industry, as part of the broader Total Quality Control movement [
27]. Utilizing QFD facilitates more precise decision-making by concentrating on various aspects and criteria aligned with client needs. The implementation of QFD leads to shorter cycle times for redesign and communication, as project teams have a clear understanding of their deliverables from the outset [
28]. QFD was utilized in diverse sectors such as manufacturing, transportation, electronics, construction, education, and service. Incorporating QFD into construction and building design management has proven to be beneficial, and that can be observed in two distinct stages of project development: the early design phase and the detailed design phase [
29]. QFD has been utilized in Egypt to support decision-makers in choosing the most suitable structural system for multi-story buildings by considering factors such as project duration, cost, building purpose, material availability, and environmental requirements [
30]. In Malaysia, a study integrated QFD with risk management tools to create a model aimed at enhancing quality and controlling risks in construction projects [
31].
1.2. Last Planner System
The LPS is a lean tool that aims to enhance project delivery by improving workflow, increasing predictability of the project, promoting collaboration, and minimizing waste [
32]. It highlights the role of ‘last planners’ or individuals responsible for planning for actual work participants, such as architects, designers, subcontractors, and workers, allowing them more direct control over planning and decision-making processes [
33]. Key actions within the LPS process involve managing handoffs among teams, ensuring that commitments and promises are made and fulfilled effectively [
34]. The Last Planner System involves four key planning stages: master scheduling, phase scheduling, look-ahead planning, and weekly work planning [
35]. LPS has been implemented in the construction of a health center, involving training 50 field workers, resulting in a 90% success rate in identifying short and medium-term constraints [
36]. A study showed that applying LPS resulted in the elimination of 43 restrictions and an 82.5% increase in completed activities. Additionally, 90% of the activities were carried out safely, and 80% met quality standards [
37]. Another study indicated that housing units constructed using LPS were completed in 65 to 72 days, significantly faster than those built using traditional methods, which took at least 120 days [
38].
1.3. Value Stream Mapping
Value Stream Mapping was initially introduced by Toyota Motor Company in the second half of the twentieth century [
39]. VSM analyses the current state of processes and aims to enhance productivity by implementing three strategies: modifying processes, eliminating unnecessary activities, and improving activities [
40]. The process of value stream mapping consists of six main steps: (1) determine the process needing enhancement; (2) create a map of the current process state; (3) choose an appropriate metric for enhancement; (4) develop a map of the future process state; (5) determine methods for improvement to move from current to future state effectively meeting the selected metric; (6) carry out the improvements [
41]. A study highlighted that removing tasks by using VSM led to a significant reduction in project duration, equating to 30% savings in expected completion time [
42]. Another study indicated that implementing VSM could reduce time by 30.7% and decrease costs by 20.8% when comparing the current states with future states [
43]. Espinoza et al. (2021) [
41] conducted a study applying VSM to the basement construction process of a high-rise building in Peru. The project achieved a 44% reduction in lead time and a 24% reduction in total cycle time.
1.4. 5S
5S is a lean tool originated from five Japanese terms: Seri (Sort) refers to eliminating unneeded or unwanted items, Seiton (Set in order) focuses on arranging items systematically to enhance workflow efficiency, Seiso (Shine) emphasizes maintaining cleanliness in the workplace, Seiketsu (Standardize) involves establishing consistent standards for organizing the workspace, and Shitsuke (Sustain) encourages self-discipline to uphold and regularly review the established standards over time [
44]. 5S fosters a cleaner and more organized work environment, which directly correlates with increased efficiency and reduced search times for materials [
45]. The implementation of 5S in the construction sector can increase productivity by 24.64%, efficiency by 16.51%, and effectiveness by 15.63% [
46]. Furthermore, implementing 5S has been shown to enhance safety climates in workplaces, as evidenced by a study where its application led to a 16.6% reduction in cycle time and improved safety perceptions among workers [
47]. The implementation of the 5S in organizations significantly decreased motion, searching, and transportation waste by 93%, while also improving space utilization by 42% [
48]. A study combined the 5S methodology with situational awareness, resulting in a 24.07% increase in labor productivity, 88.46% improved flow efficiency, and 11.54% enhanced resource efficiency [
49].
1.5. Fuzzy Logic
Fuzzy logic, converting human expert knowledge into an equation that can be processed by a computer. Fuzzy logic can create a smooth output surface for all input sets without the need for a defined process model by encoding human expertise into decision-making rules [
50]. Fuzzy inference involves constructing a mapping between input and output variables using fuzzy logic, thereby facilitating decision-making and pattern recognition within complex or uncertain systems. There are various types of fuzzy inference systems (FIS). Among these, the two most widely recognized types of FIS are Mamdani-type and Sugeno-type [
51]. Fuzzy logic can effectively manage ambiguous datasets, including those containing non-statistical uncertainties [
52]. It evaluate the performance of green buildings by creating a fuzzy model that incorporates expert knowledge. Fuzzy logic is utilized in lean construction to enhance decision-making by evaluating multiple criteria and ranking alternatives [
53]. U. H. Issa & Alqurashi (2020) [
54] proposed a two-level model using fuzzy logic to evaluate causes of waste and lean implementation in construction projects. A fuzzy-based multi-criteria decision-making methodology was developed in Egypt to assess project risks, resulting in reductions in cost losses and time-related delays [
55].
A few previous models related to LC have been developed, but most do not address LC evaluation [
54,
56,
57,
58]. Many studies have concentrated on developing models that utilize lean tools in various sectors, including manufacturing, production, and construction, while limited evaluation models have investigated the impact of lean techniques in the construction buildings [
59,
60,
61]. Most existing studies do not assess the impact of each lean tool individually or conduct comparative analyses to differentiate the effects of the various tools [
4,
58,
62]. Despite the shared objectives of lean construction and green building, such as minimizing costs and reducing waste, there are still limited studies focused on the application of lean models in GB projects [
63,
64,
65]. Up to the author’s knowledge, no study has thoroughly investigated the impact of lean tools on the causes of waste in GB projects. In addition, no previous study has determined the level of improvement in the causes of waste due to using lean techniques in GB projects. To fill these gaps, a lean model is needed to analyze the impact of lean tools on the causes of waste in GB projects. The importance of waste is represented by the green building waste, which reflects the combined impact of environmental, economic, and social objectives [
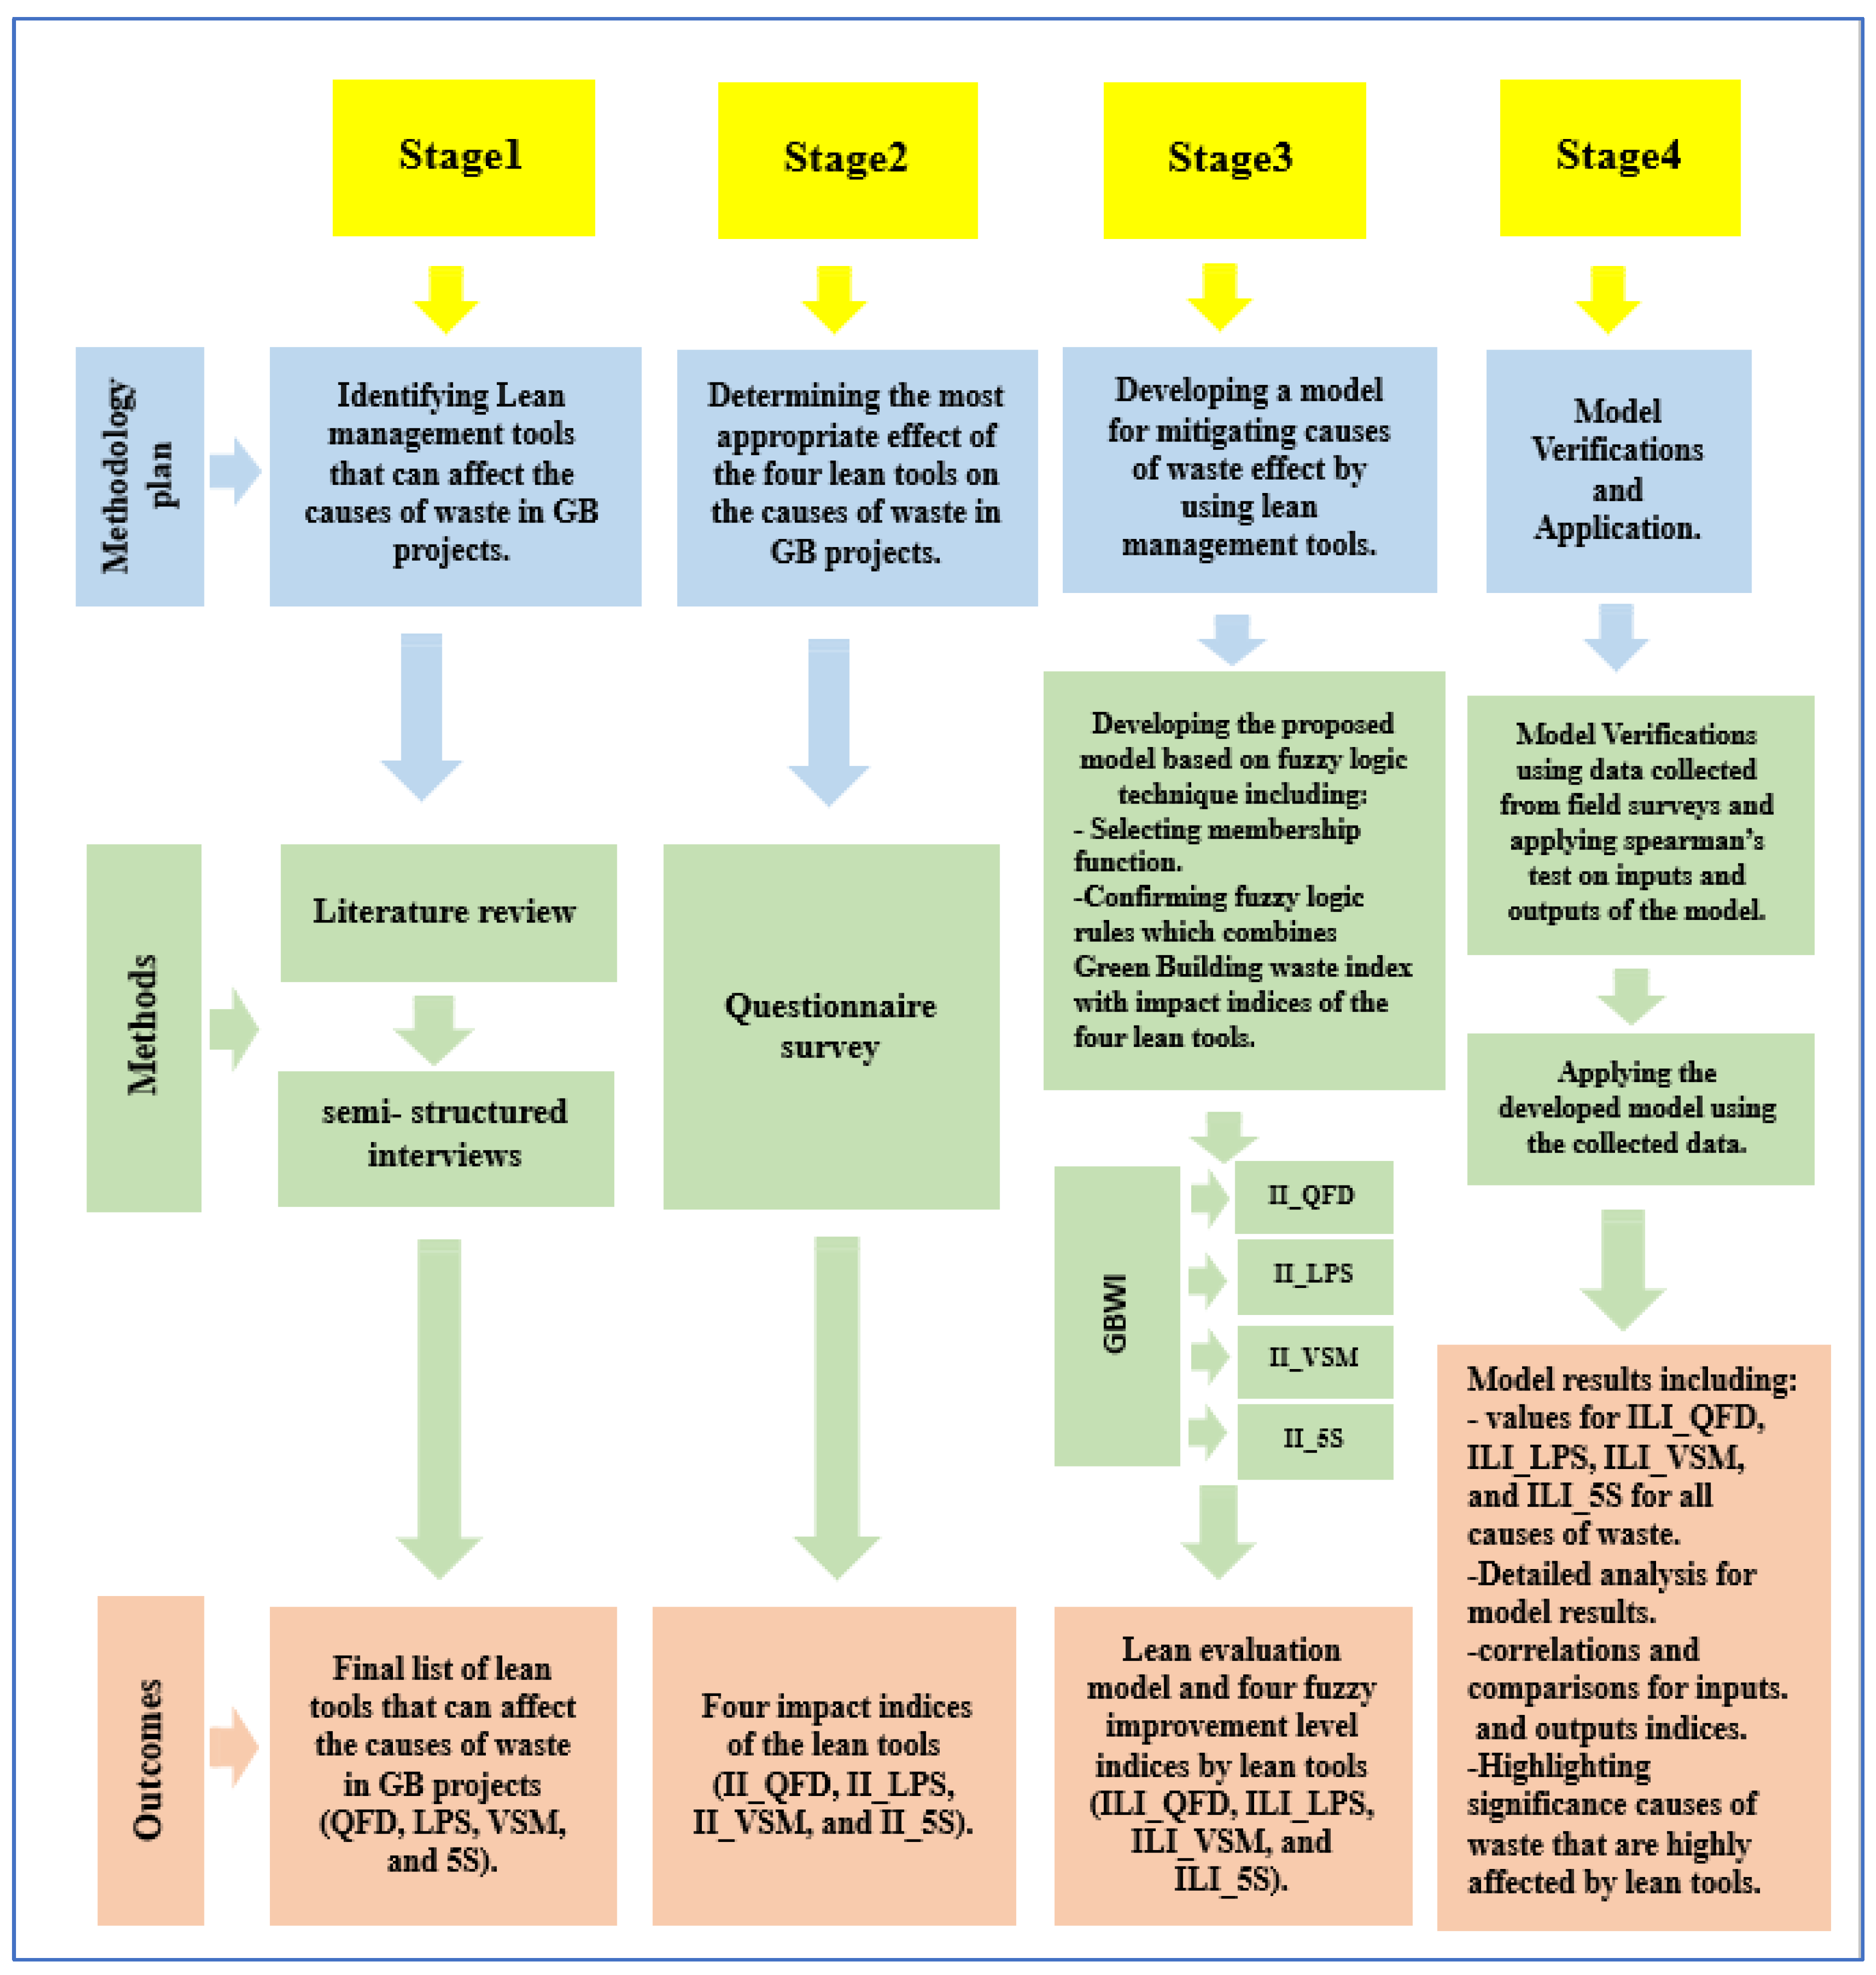
66]. In this study, a comprehensive literature review and field survey are conducted to select the most appropriate lean tools that can effectively affect the causes of waste in GB projects. The main contribution of the current study is to develop and implement a model utilizing the fuzzy logic technique to evaluate lean tools affecting causes of waste in GB projects, as well as their effectiveness in mitigating these causes.
The main objectives of this study can be outlined as follows:
To determine the most appropriate lean tools that can positively affect the causes of waste in GB projects through an extensive literature review and semi-structured interviews with experts in the field of project management.
To evaluate the impacts of selected lean tools, which are quality function deployment (QFD), last planner system (LPS), value stream mapping (VSM), and 5S on the causes of waste in GB projects through field surveys.
To design and develop a lean model utilizing fuzzy logic technique to determine the improvement level by QFD, LPS, VSM, and 5S through combining green building waste with the impact of four lean tools on the causes of waste.
To apply and verify the lean model utilizing the gathered data on lean tools in the context of three countries in the Middle East region as a case study (Egypt, Saudi Arabia, and United Arab Emirates).
To highlight the significant causes of waste that are highly affected by lean tools, as well as the causes that have high improvement level values through the four lean tools. In addition, provide a detailed analysis of the impact of the four lean tools on several waste groups in GB projects, and determine the most appropriate lean tool for each waste group based on the improvement level by each lean tool. Moreover, to identify which lean tool has the highest improvement level over all causes of waste and which has the lowest.
This study can help decision makers to utilize these lean tools to reduce the impact of the causes of waste in GB projects and to meet the accreditation standards of various green building rating systems.
3. Lean Model for Mitigating Causes of Waste Effect (LMMCWE) in GB Projects
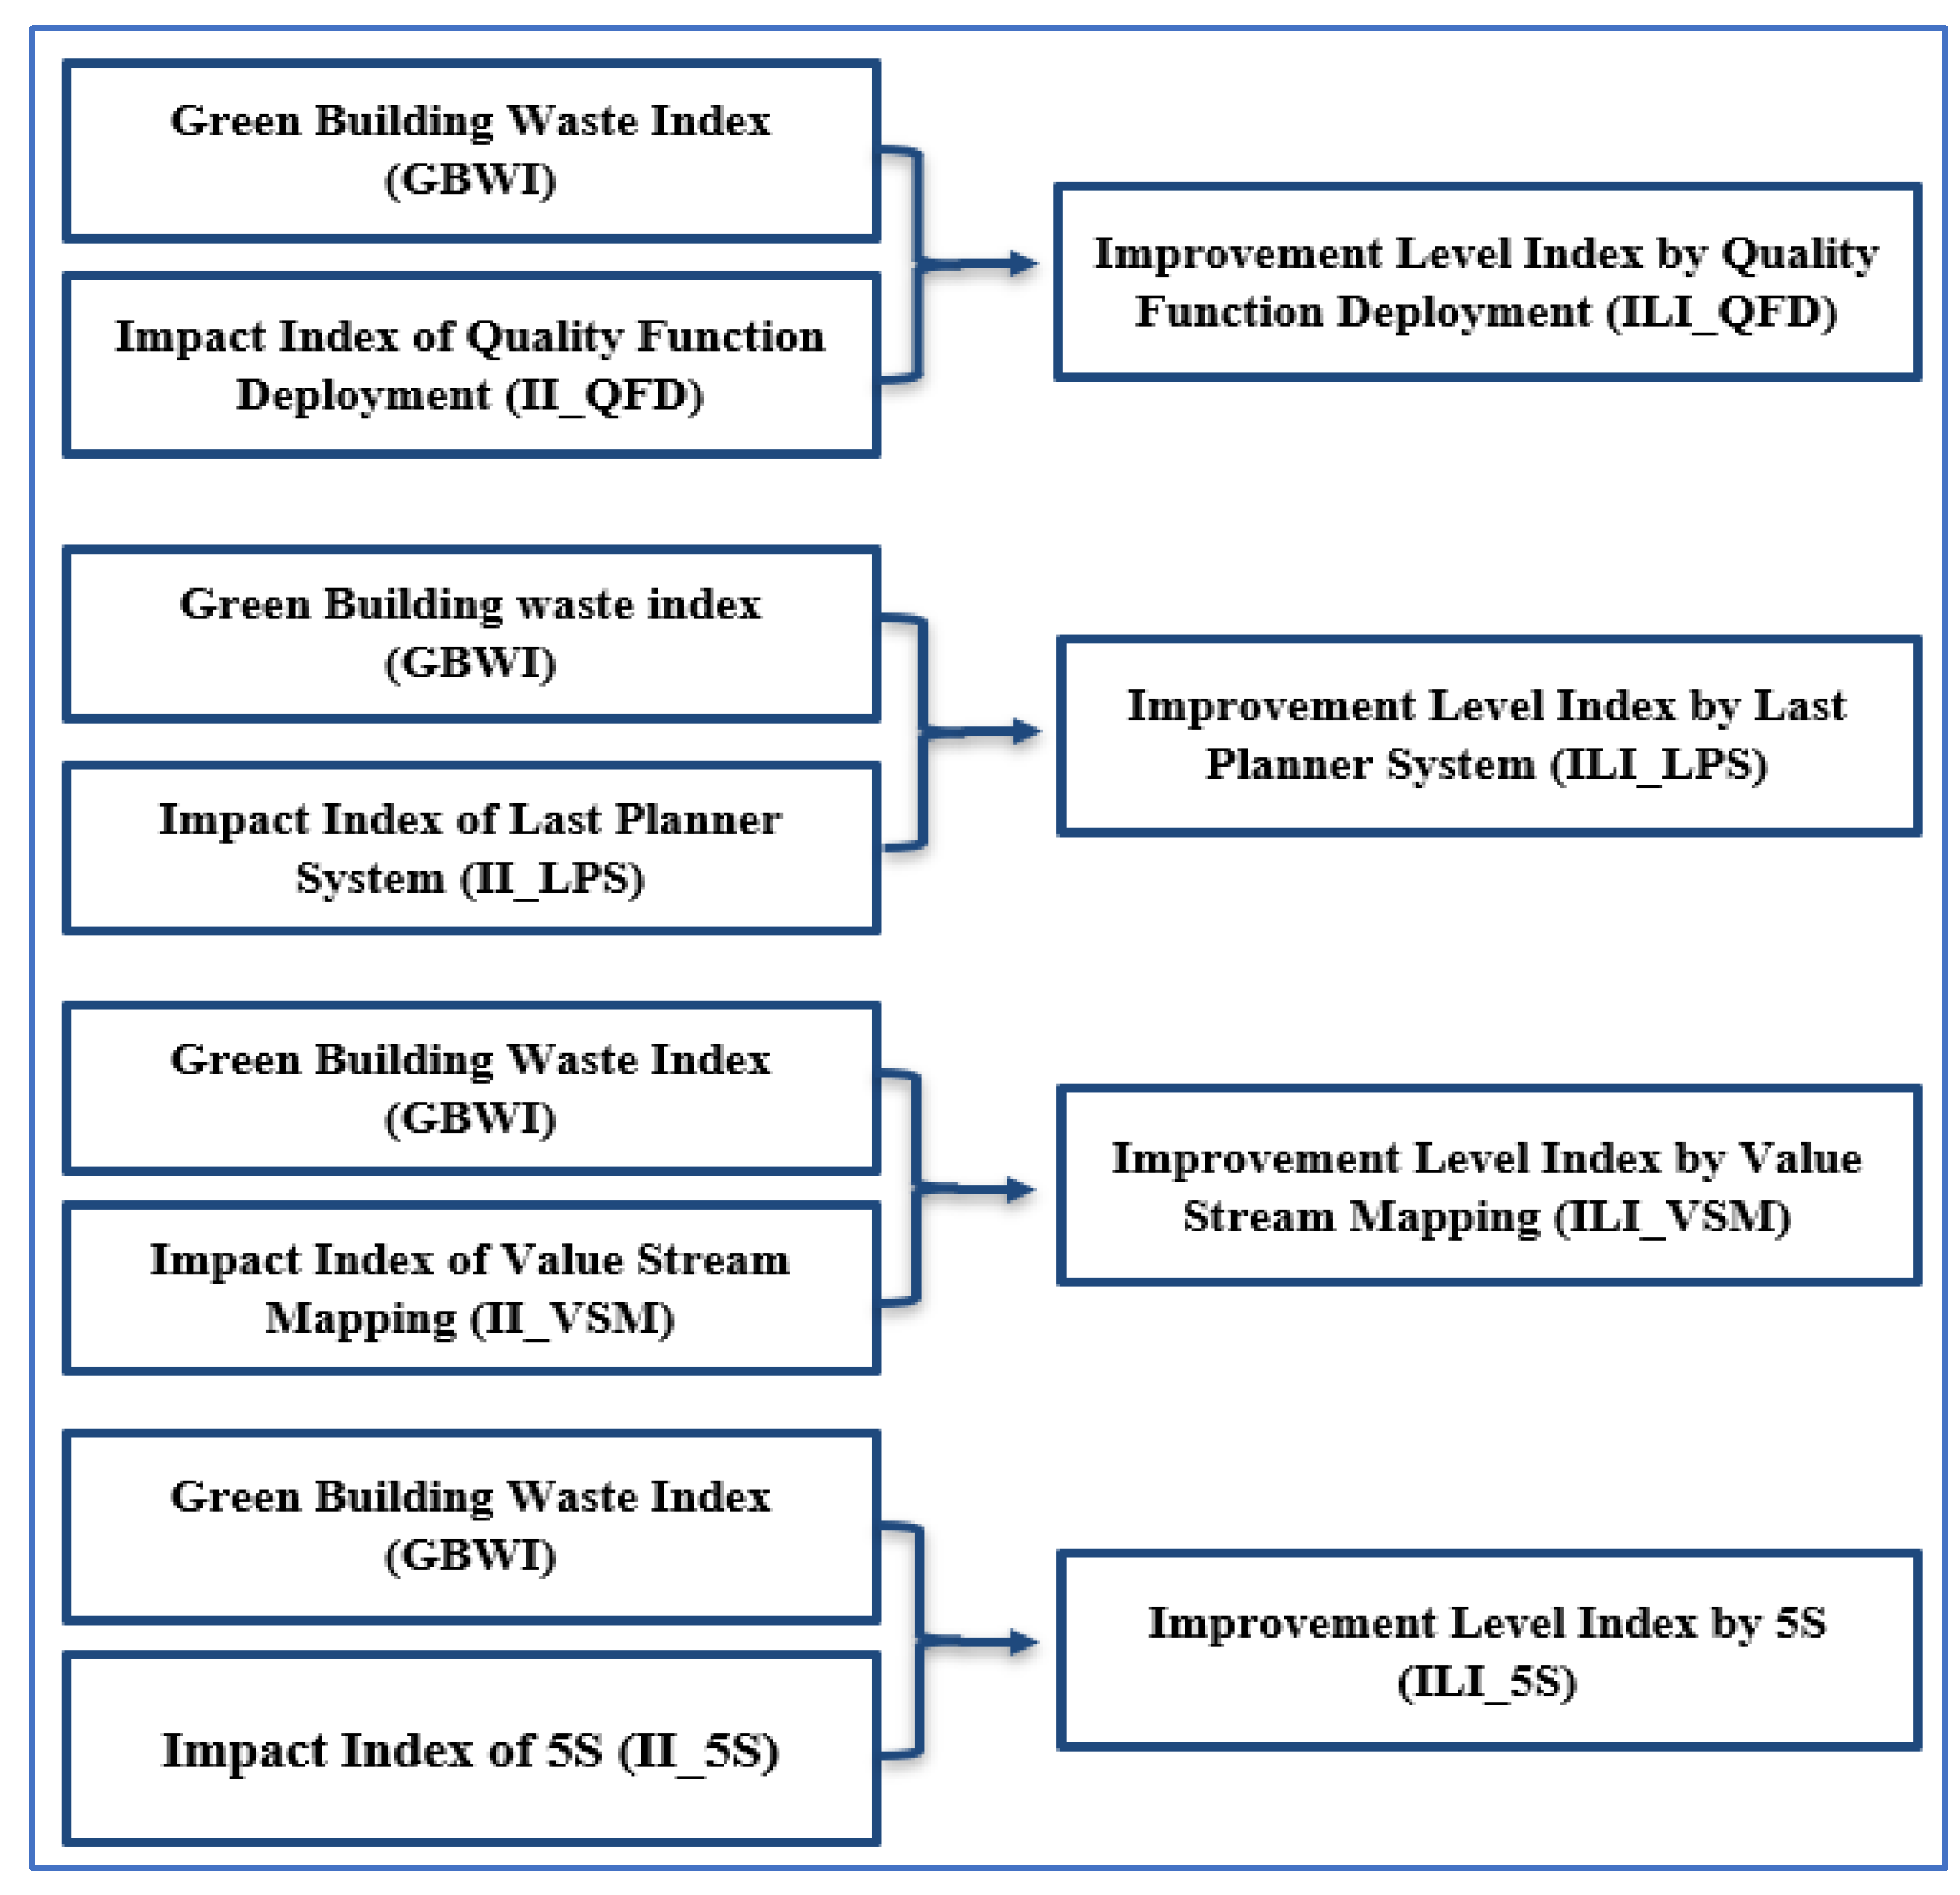
The main objective of the proposed model in this study is to qualitatively assess the impact of selected lean tools (QFD, LPS, VSM, and 5S) on the causes of waste in GB projects using the fuzzy logic technique. This model is developed in three steps: selecting the suitable fuzzy membership function, determining the fuzzy rule base, and identifying the fuzzy inference mechanism. The crisp inputs in the current fuzzy logic model consist of five indices: Green Building Waste Index (GBWI), Impact Index of Quality Function Deployment (II_QFD), Impact Index of Last Planner System (II_LPS), Impact Index of Value Stream Mapping (II_VSM), and finally, Impact Index of 5S (II_5S). For evaluating the effect of the selected lean tools on the causes of waste in GB projects, four new indices are suggested to represent the Improvement level for lean tools as the model outputs. The Improvement level Index by Quality Function Deployment (ILI_QFD) is the output for combining GBWI and II_QFD. The Improvement Level Index by Last Planner System (ILI_LPS) is the outcome resulting from GBWI and II_LPS. On the other hand, the Improvement Level Index by Value Stream Mapping (ILI_VSM) is the outcome that resulted in combining GBWI and II_VSM. Lastly, the Improvement Level Index by 5S (ILI_5S) is the outcome of GBWI and II_5S.
Figure 3 shows the layout for the proposed model. The identified causes of waste include various factors that occur during the design and construction phases. These encompass, among others, waste factors related to the construction process, techniques, and equipment (e.g., damage to materials due to improper handling or insufficient treatment of green materials). Such causes are incorporated into the fuzzy evaluation as model inputs, ensuring that process and equipment-related aspects are addressed along with other categories.
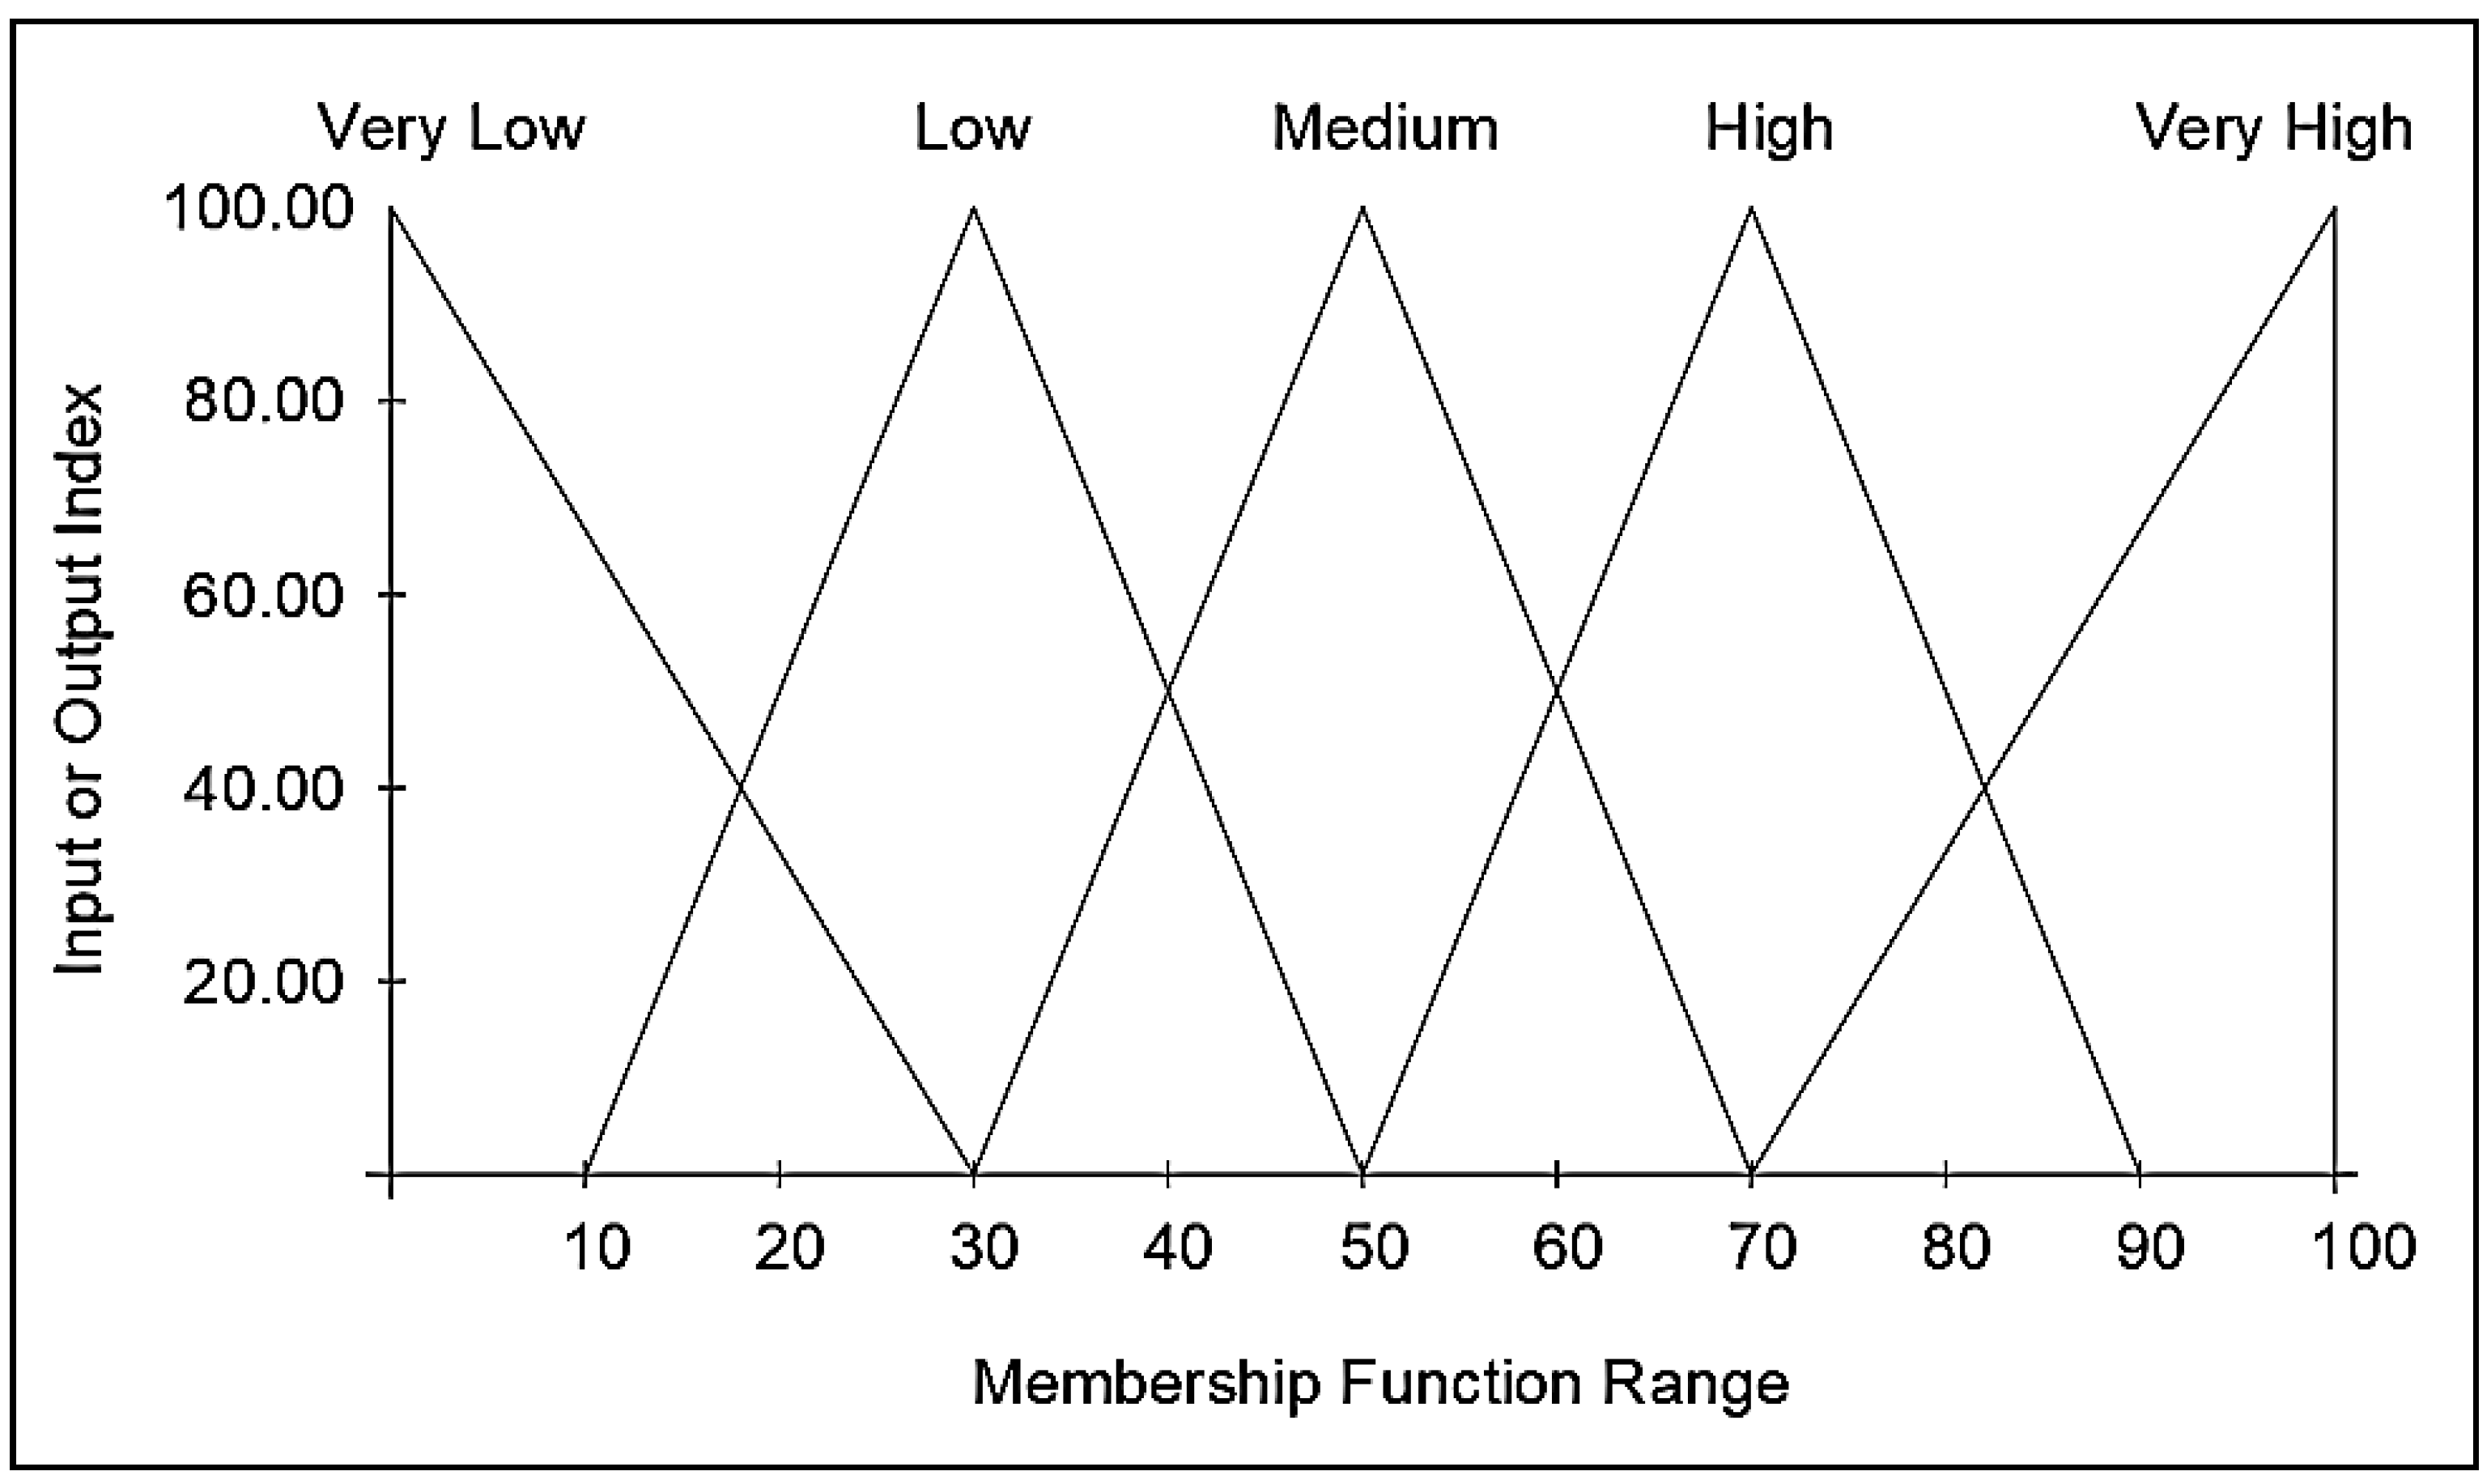
There are two inputs and one output for each case of QFD, LPS, VSM, and 5S. To represent both the inputs and outputs, five linguistic terms are utilized: very low, low, medium, high, and very high. These linguistic variables represent the Green Building Waste Index and impact index of the four lean tools. The relationship between inputs and outputs is determined by utilizing 25 fuzzy logical rules, structured using Fuzzy Associative Memories (FAMs), as illustrated in
Table 2.
The logical rules in the suggested model can be established according to the assumption of correlating the five input parameters (GBWI, II_QFD, II_VSM, II_LPS, and II_5S) to each cause of waste. Additionally, the model output represents the improvement level by four lean tools as a result of combining Green Building Waste Index and the impact index of lean tools. Twenty-five fuzzy logical rules are proposed in this research and validated by previous studies similar to the current study [
54,
67,
68]. Two examples of the proposed logical rules are provided as follows:
Example 1. If Green Building Waste Index is low, and the impact of lean tool is high, then the Improvement level by the lean tool is medium.
Example 2. If Green Building Waste Index is medium, and the impact of lean tool is very high, then the Improvement level by the lean tool is high.
After establishing the logical rules, it is necessary to choose the membership function that defines the fuzziness degree of the linguistic variables by assigning a numeric value to each level of the linguistic variables [
69]. Membership functions are used to specify the domain of input or output values associated with each label. Numerous studies on construction applications have demonstrated that the triangular shape is the most appropriate for scenarios similar to the presented study [
67]. This triangular membership function has been utilized by ref. [
70] to evaluate municipal waste treatment systems based on regression analyses and expert opinions, providing a balance between simplicity and effectiveness in modeling linguistic variables. The same triangle membership function is also used by ref. [
54] in evaluating the causes of waste in construction projects, besides implementing lean construction in a suitable method. Hsieh et al. [
71] applied triangular membership functions in the evaluation process for selecting planning and design options in public office buildings. Several agreement tests have been conducted to prove that the triangle shape is the most appropriate in similar cases to that of the current study [
69]. Hence, the proposed model in this study uses the triangular membership function for all the input and output variables as indicated in
Figure 4.
3.1. Model Application
Forty-five causes of waste are recently identified and classified into five groups in GB projects, as well as the Green Building Waste Index (GBWI), which represents the significance of causes of waste, are presented in the first three columns in
Table 3 [
66] Based on the tools identified in the methodology, the selected lean techniques (QFD, LPS, VSM, and 5S) were applied to the collected data to evaluate their effectiveness in mitigating the causes of waste effect. To assess the impact of the proposed four lean tools on the causes of waste in GB projects, the participants are asked to respond to the questionnaire to assess the values of impact of lean tools in terms of (II_QFD, II_VSM, II_LPS, and II_5S). Five linguistic variables are used—very low, low, medium, high, and very high—to assess the impact weight for each lean tool. These linguistic responses were converted into corresponding numerical weights of 0.10, 0.30, 0.50, 0.70, and 0.90, respectively, as shown in Equations (1)–(4). This transformation is consistent with previous studies [
72,
73,
74], providing a normalized and reliable quantitative scale for capturing expert judgments. The inputs of the model are GBWI, II_QFD, II_LPS, II_VSM, and finally, II_5S, and are determined as shown in
Table 2. II_QFD, II_VSM, II_LPS, and II_5S are calculated using Equation (1), Equation (2), Equation (3), and Equation (4), respectively. To enhance and ensure reliable and accurate results, the relevant years of experience were incorporated into the formulas as an experience factor (E.F.), which was determined using Equation (5). The EF weights were adopted from previous studies [
73,
74,
75], where expert experience levels were integrated into the weighting schemes. These weights represent the increasing impact of participant experience on the evaluation process. On the other hand, the four model outputs (ILI_QFD, ILI_VSM, ILI_LPS, and ILI_5S) are determined and presented in
Table 4. All factors are also ranked in the same table according to the four model outputs.
where
II_QFD represents the Impact Index of Quality Function Deployment.
Iiqfdi represents the impact weight of quality function deployment assigned to option (i).
Ni represents the number of participants who responded to option (i).
Ki represents the number of participants in each EF category i
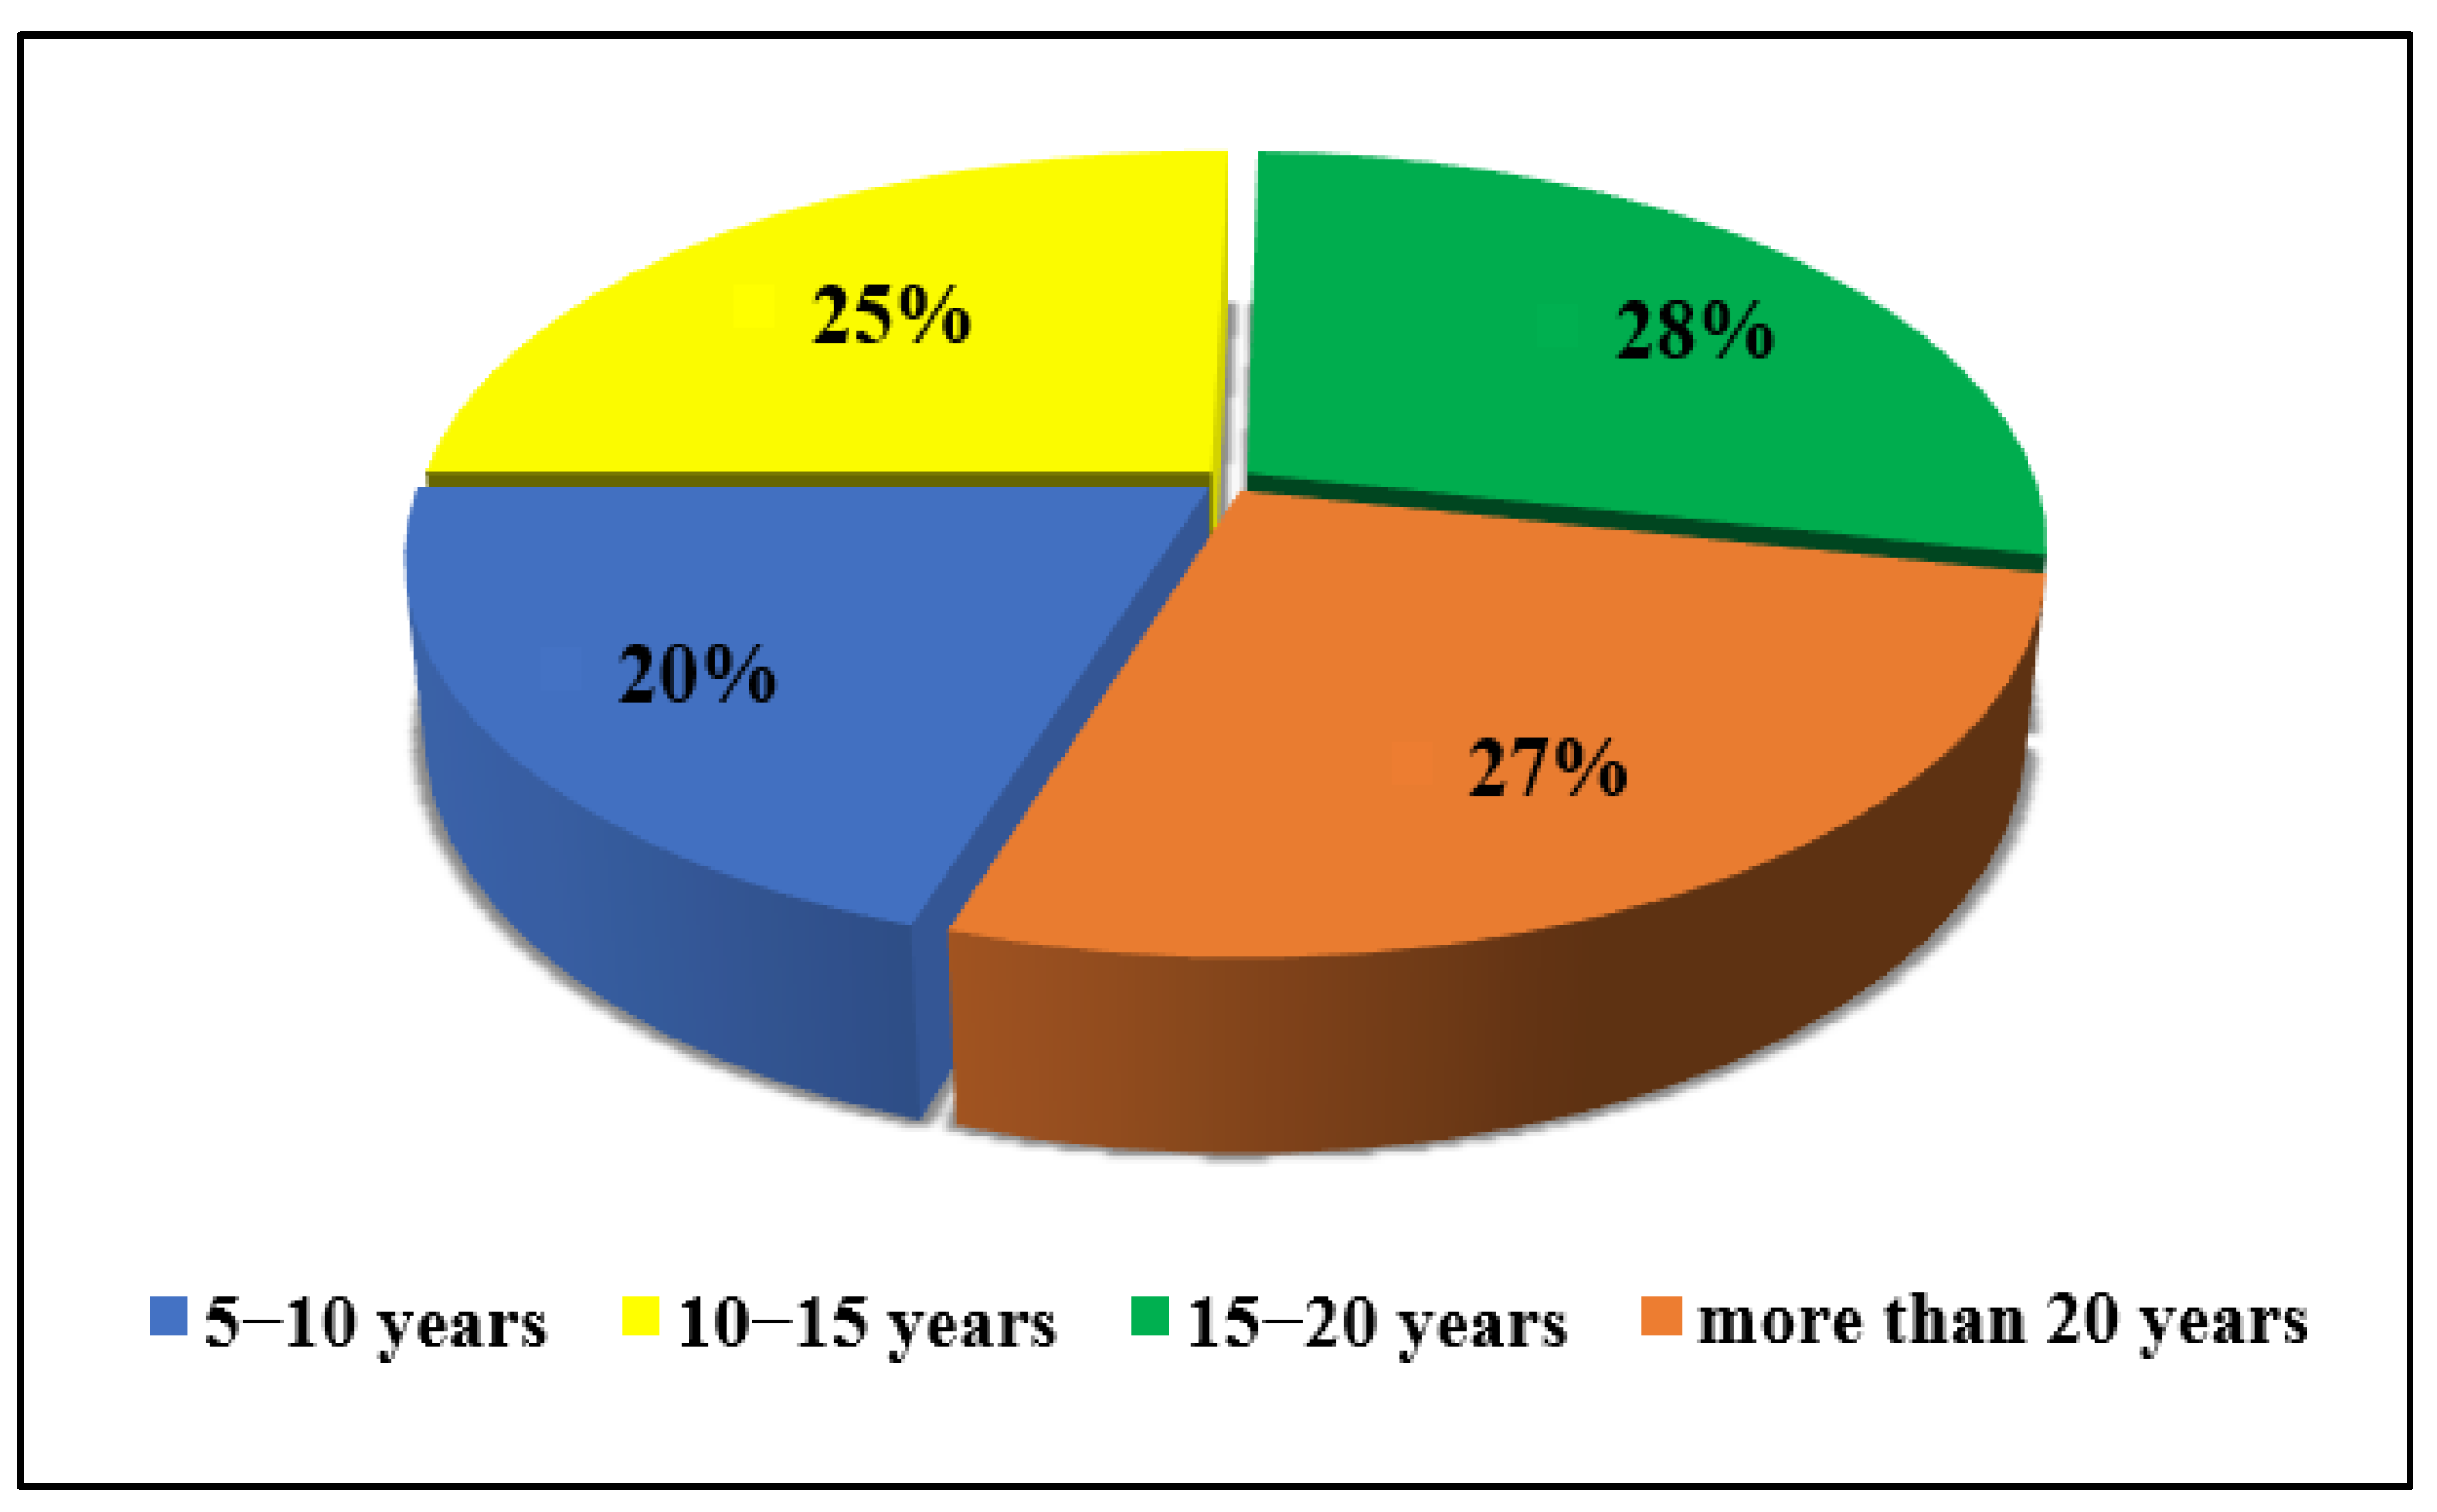
EF represents the experience factor (EF1 = 1 for 5–10 years, EF2 = 1.6 for 10–15 years, EF3 = 2.3 for 15–20 years, and EF4 = 3 for above 20 years).
Y represents the total number of respondents after adding the EF weights.
II_LPS represents the Impact Index of Last Planner System.
Iilpsi represents the impact weight of last planner system assigned to option (i).
II_VSM represents the Impact Index of Value Stream Mapping.
Iivsmi represents the impact weight of value stream mapping assigned to option (i).
II_5S represents the Impact index of 5S.
Ii5si represents the impact weight of 5S to option (i).
The weight of Iiqfdi, Iilpsi, Iivsmi, and Ii5si was represented by the values 0.10, 0.30, 0.50, 0.70, and 0.90 for (i = 1, 2, 3, 4, and 5, respectively).
Table 3.
Causes of waste in GB projects and input indices values for LMMCWE model.
Table 3.
Causes of waste in GB projects and input indices values for LMMCWE model.
| | | Model Inputs |
|---|
| | | GBWI | II_QFD | II_LPS | II_VSM | II_5S |
|---|
| Group01 (green materials) | |
| CW01 | Selecting materials that have very high embodied energy and have a negative impact on the environment, such as concrete and steel | 0.422 | 0.687 | 0.465 | 0.531 | 0.318 |
| CW02 | Shortage of treatment of green building materials before and after construction can result in some problems, for example, swelling in bamboo or shrinkage in concrete | 0.379 | 0.619 | 0.517 | 0.462 | 0.355 |
| CW03 | Not providing a construction waste management plan to recycle or reuse materials | 0.498 | 0.554 | 0.627 | 0.645 | 0.586 |
| CW04 | Damage to green building materials during construction due to improper handling (such as damage to foam sheets) | 0.395 | 0.548 | 0.482 | 0.557 | 0.710 |
| CW05 | The difficulty of using local building materials can lead to increased emissions from transportation and increased fuel consumption | 0.349 | 0.629 | 0.427 | 0.548 | 0.338 |
| CW06 | High cost of green building materials. | 0.388 | 0.580 | 0.373 | 0.391 | 0.249 |
| CW07 | Insufficient testing of green building materials, for example, insulation materials) | 0.312 | 0.692 | 0.536 | 0.554 | 0.312 |
| CW08 | Improper storage of green building materials | 0.322 | 0.573 | 0.504 | 0.629 | 0.738 |
| CW09 | Poor quality of green building materials | 0.318 | 0.704 | 0.458 | 0.483 | 0.301 |
| CW10 | Damage to green building materials during transportation | 0.286 | 0.521 | 0.445 | 0.562 | 0.633 |
| CW11 | Delayed supply of green building materials to the construction site | 0.272 | 0.606 | 0.681 | 0.584 | 0.287 |
| Group02 (green building design) | |
| CW12 | Incorrect positioning and orientation of openings can negatively impact the amount of solar radiation entering the building | 0.406 | 0.630 | 0.428 | 0.461 | 0.261 |
| CW13 | Insufficient site studies can result in a design that does not achieve the required ventilation and natural lighting for the building | 0.498 | 0.626 | 0.481 | 0.519 | 0.248 |
| CW14 | The design does not consider passive heating strategies, including thermal mass, orientation, building shape, and operable external shading | 0.429 | 0.635 | 0.423 | 0.458 | 0.227 |
| CW15 | The design does not incorporate strategies to reduce the heat island effect, such as utilizing hardscape materials with high reflectivity, reducing development footprints, or using open grid pavement | 0.423 | 0.642 | 0.415 | 0.493 | 0.237 |
| CW16 | The use of roofing materials with a solar reflectance index (SRI) is not compatible with the building’s roof slope. White paints have SRI = 1, and black paints have SRI = 0 | 0.338 | 0.639 | 0.502 | 0.423 | 0.253 |
| CW17 | Insufficient experience among designers and consultants in the field of green building design | 0.434 | 0.609 | 0.521 | 0.482 | 0.241 |
| CW18 | Design modifications or changes in work details during the building construction process | 0.385 | 0.647 | 0.624 | 0.571 | 0.265 |
| CW19 | Design does not meet the owner’s requirements | 0.264 | 0.771 | 0.563 | 0.395 | 0.223 |
| CW20 | Delays caused by prolonged design reviews and incomplete drawings | 0.291 | 0.617 | 0.695 | 0.588 | 0.229 |
| CW21 | Poor communication with the design team | 0.283 | 0.604 | 0.758 | 0.505 | 0.294 |
| CW22 | The drawing details are insufficient and unclear | 0.338 | 0.721 | 0.586 | 0.506 | 0.209 |
| Group03 (sustainable site) | |
| CW23 | Poor assessment of site conditions before design, including hydrology, topography, soil, climate, and vegetation | 0.529 | 0.667 | 0.718 | 0.595 | 0.410 |
| CW24 | Loss of topsoil during construction due to equipment movement, rain, and wind, without preparing effective soil erosion control strategies | 0.331 | 0.536 | 0.572 | 0.574 | 0.447 |
| CW25 | Air pollution due to dust generated by construction activities, and the lack of suitable precautionary measures to reduce it | 0.447 | 0.405 | 0.534 | 0.589 | 0.574 |
| CW26 | Not providing alternative routes for the movement of vehicles and machines when the main routes are crowded | 0.331 | 0.411 | 0.618 | 0.622 | 0.521 |
| CW27 | Leaving waste materials in areas that might obstruct the movement of equipment and workers | 0.402 | 0.372 | 0.623 | 0.636 | 0.762 |
| CW28 | Weather fluctuations like rainfall or high temperatures during site construction can lead to many problems, such as causing damage to building materials before they are used | 0.345 | 0.398 | 0.596 | 0.538 | 0.715 |
| Group04 (green building technologies (GBTs)) | |
| CW29 | High costs of green building technologies (GBTs) | 0.381 | 0.637 | 0.405 | 0.409 | 0.196 |
| CW30 | Problems in executing renewable energy technologies (for example, changing the direction of wind turbines during installation, or incorrectly installing solar panels) | 0.353 | 0.628 | 0.671 | 0.566 | 0.387 |
| CW31 | Lack of available and reliable green building technology suppliers | 0.402 | 0.465 | 0.644 | 0.572 | 0.246 |
| CW32 | Difficulty meeting the certification requirements for different green building rating systems | 0.296 | 0.578 | 0.535 | 0.470 | 0.368 |
| CW33 | Lack of databases and information related to green building technologies | 0.383 | 0.439 | 0.602 | 0.485 | 0.233 |
| CW34 | Lack of interviews with green building technology specialists | 0.249 | 0.552 | 0.735 | 0.433 | 0.282 |
| Group 05 (green building stakeholders) | | | | | |
| CW35 | Poor collaboration among stakeholders to achieve green building objectives | 0.377 | 0.581 | 0.774 | 0.496 | 0.362 |
| CW36 | Lack of expertise among green building contractors, subcontractors, designers, and suppliers in implementing GB projects | 0.501 | 0.607 | 0.572 | 0.387 | 0.306 |
| CW37 | Slow decision-making by the owner | 0.326 | 0.728 | 0.657 | 0.551 | 0.277 |
| CW38 | Delays by the owner, such as late payment of invoices to the contractor, and late handover of the site to the contractor | 0.407 | 0.680 | 0.714 | 0.562 | 0.281 |
| CW39 | Changes in specifications by the owner | 0.431 | 0.742 | 0.626 | 0.449 | 0.245 |
| CW40 | Delays by the consultant, such as delays in responding to contractor inquiries, delays in approving material samples, or delays in approving shop drawings | 0.362 | 0.624 | 0.729 | 0.568 | 0.284 |
| CW41 | Poor site management and supervision by low-experience contractors | 0.467 | 0.700 | 0.542 | 0.488 | 0.300 |
| CW42 | Poor communication, coordination, and conflicting views between the contractor, the consultant, and other parties | 0.379 | 0.608 | 0.764 | 0.543 | 0.359 |
| CW43 | Contractors and subcontractors lack knowledge of green building specifications and requirements | 0.405 | 0.663 | 0.608 | 0.536 | 0.317 |
| CW44 | Lack of experience and skills among green building workers | 0.423 | 0.675 | 0.594 | 0.477 | 0.384 |
| CW45 | Rework due to workers’ mistakes | 0.394 | 0.643 | 0.662 | 0.583 | 0.517 |
Table 4.
The model output index values and ranking the causes of waste according to improvement level indices.
Table 4.
The model output index values and ranking the causes of waste according to improvement level indices.
| | Model Outputs | Ranking Model Outputs |
|---|
| | ILI_QFD | ILI_LPS | ILI_VSM | ILI_5S | ILI_QFD | ILI_LPS | ILI_VSM | ILI_5S |
|---|
| CW01 | 0.479 | 0.418 | 0.418 | 0.328 | 11 | 22 | 13 | 19 |
| CW02 | 0.415 | 0.383 | 0.383 | 0.367 | 27 | 35 | 29 | 13 |
| CW03 | 0.497 | 0.497 | 0.497 | 0.496 | 8 | 7 | 2 | 5 |
| CW04 | 0.396 | 0.396 | 0.396 | 0.512 | 34 | 32 | 19 | 4 |
| CW05 | 0.424 | 0.361 | 0.357 | 0.347 | 22 | 39 | 37 | 15 |
| CW06 | 0.390 | 0.382 | 0.391 | 0.272 | 35 | 36 | 21 | 36 |
| CW07 | 0.489 | 0.344 | 0.362 | 0.317 | 10 | 41 | 35 | 20 |
| CW08 | 0.378 | 0.329 | 0.424 | 0.530 | 40 | 43 | 8 | 2 |
| CW09 | 0.504 | 0.325 | 0.324 | 0.301 | 5 | 44 | 41 | 22 |
| CW10 | 0.328 | 0.293 | 0.369 | 0.427 | 45 | 45 | 34 | 7 |
| CW11 | 0.405 | 0.474 | 0.387 | 0.287 | 30 | 11 | 26 | 30 |
| CW12 | 0.418 | 0.405 | 0.405 | 0.278 | 26 | 29 | 16 | 32 |
| CW13 | 0.497 | 0.475 | 0.497 | 0.299 | 9 | 10 | 3 | 24 |
| CW14 | 0.428 | 0.419 | 0.424 | 0.263 | 18 | 21 | 9 | 42 |
| CW15 | 0.431 | 0.412 | 0.419 | 0.267 | 17 | 27 | 11 | 39 |
| CW16 | 0.432 | 0.346 | 0.351 | 0.278 | 16 | 40 | 39 | 33 |
| CW17 | 0.422 | 0.428 | 0.428 | 0.271 | 24 | 18 | 6 | 37 |
| CW18 | 0.433 | 0.417 | 0.388 | 0.281 | 15 | 23 | 24 | 31 |
| CW19 | 0.426 | 0.370 | 0.279 | 0.261 | 21 | 38 | 44 | 43 |
| CW20 | 0.414 | 0.491 | 0.390 | 0.264 | 28 | 8 | 22 | 41 |
| CW21 | 0.403 | 0.483 | 0.307 | 0.292 | 32 | 9 | 42 | 27 |
| CW22 | 0.520 | 0.389 | 0.346 | 0.251 | 4 | 33 | 40 | 44 |
| CW23 | 0.537 | 0.549 | 0.545 | 0.408 | 2 | 3 | 1 | 8 |
| CW24 | 0.344 | 0.377 | 0.379 | 0.341 | 44 | 37 | 31 | 16 |
| CW25 | 0.404 | 0.439 | 0.432 | 0.436 | 31 | 17 | 5 | 6 |
| CW26 | 0.346 | 0.414 | 0.418 | 0.339 | 43 | 25 | 14 | 17 |
| CW27 | 0.385 | 0.412 | 0.421 | 0.560 | 38 | 26 | 10 | 1 |
| CW28 | 0.363 | 0.397 | 0.353 | 0.515 | 41 | 31 | 38 | 3 |
| CW29 | 0.427 | 0.389 | 0.388 | 0.242 | 20 | 34 | 25 | 45 |
| CW30 | 0.423 | 0.461 | 0.372 | 0.367 | 23 | 12 | 33 | 14 |
| CW31 | 0.402 | 0.427 | 0.402 | 0.269 | 33 | 19 | 18 | 38 |
| CW32 | 0.382 | 0.343 | 0.298 | 0.298 | 39 | 42 | 43 | 25 |
| CW33 | 0.386 | 0.402 | 0.386 | 0.265 | 36 | 30 | 27 | 40 |
| CW34 | 0.360 | 0.457 | 0.274 | 0.276 | 42 | 14 | 45 | 34 |
| CW35 | 0.385 | 0.562 | 0.381 | 0.372 | 37 | 1 | 30 | 11 |
| CW36 | 0.502 | 0.502 | 0.390 | 0.309 | 6 | 6 | 23 | 21 |
| CW37 | 0.525 | 0.449 | 0.359 | 0.289 | 3 | 15 | 36 | 29 |
| CW38 | 0.467 | 0.517 | 0.406 | 0.289 | 12 | 5 | 15 | 28 |
| CW39 | 0.539 | 0.424 | 0.425 | 0.272 | 1 | 20 | 7 | 35 |
| CW40 | 0.419 | 0.528 | 0.374 | 0.292 | 25 | 4 | 32 | 26 |
| CW41 | 0.500 | 0.458 | 0.459 | 0.300 | 7 | 13 | 4 | 23 |
| CW42 | 0.406 | 0.556 | 0.383 | 0.370 | 29 | 2 | 28 | 12 |
| CW43 | 0.446 | 0.405 | 0.404 | 0.329 | 14 | 28 | 17 | 18 |
| CW44 | 0.463 | 0.414 | 0.419 | 0.387 | 13 | 24 | 12 | 10 |
| CW45 | 0.427 | 0.445 | 0.395 | 0.395 | 19 | 16 | 20 | 9 |
3.2. Model Verification
The model of this study is verified utilizing the method used in previous similar studies [
54,
67,
68]. In this study, the lean effectiveness on each cause of waste can be determined simply by multiplying GBWI by impact index for lean tools. To determine this relation, the following equations can be applied:
where LE_QFD, LE_LPS, LE_VSM, and LE_5S are the lean effectiveness indices for quality function deployment, last planner system, value stream mapping, and 5S, respectively. The model is applied to all the causes of waste affecting GB projects in Egypt, Saudi Arabia, and United Arab Emirates, resulting in ILI_QFD, ILI_LPS, ILI_VSM, and ILI_5S. Spearman’s test is conducted to determine the correlation coefficient, which is used to rank the causes of waste according to the four model outputs. This statistical test assesses both the direction and strength of the relationship between any ordinal or continuous variables. A key advantage of Spearman’s test is that it does not require assumptions of normality or homogeneity of variance. Medians and means can be compared, and if the data contain two or fewer outliers, their effect can be neglected. The rank correlation coefficient (R) varies from −1 to +1. R value of +1 shows complete agreement, with ranks increasing in the same direction. Conversely, an R value of −1 signifies complete agreement but in the opposite direction, where ranks decrease in reverse order. If R equals 0, it implies no relationship between the variables [
76]. To further strengthen the validation process, an additional external validation was conducted. Specifically, three independent experts with over 15 years of professional experience in lean construction and GB projects, who were not involved in the original survey, were consulted. The experts received the model results, including the calculated impact indices and their rankings. They were asked to evaluate whether these results were consistent with their practical experience and professional judgment. The experts unanimously confirmed that the ranking of the indices reflected realistic priorities in lean–green integration within construction projects. Their assessment supported the robustness and reliability of the proposed model. Therefore, the external expert validation reinforced the statistical findings and provided additional evidence of the model’s applicability in real-world project management contexts. A summary of the correlation coefficients is indicated in
Table 5, indicating that all values are positive and higher than 79%, thereby confirming the verification of the model’s results.
4. Results and Discussion
4.1. Model Inputs and Outputs Correlations
In this study, a Spearman’s correlation test is conducted to assess the relationships between Green Building Waste Index and the impact indices of lean tools, between the impact indices and each other (model inputs), and between the improvement level by lean tools (model outputs).
Figure 5 shows the heatmap of Spearman correlation coefficient values for the model input indices. The correlation coefficient among Green Building Waste Index and impact indices for lean tools ranges from −0.156 to 0.116. A positive relationship is observed with the impact index for Quality Function Deployment, whereas negative relationship is observed with the impact index for the Last Planner System. In contrast, there is no relationship between Green Building Waste Index and the impact index for Value Stream Mapping and 5S. Conversely, the correlation coefficient among the impact indices of lean tools ranges from −0.454 to 0.551. The weakest correlation is observed between the Last Planner System and 5S indices, whereas the strongest correlation exists between the Value Stream Mapping and 5S indices. There is an adverse relationship between Quality Function Deployment and other impact indices for lean tools, with the highest negative relationship observed with 5S, followed by Value Stream Mapping.
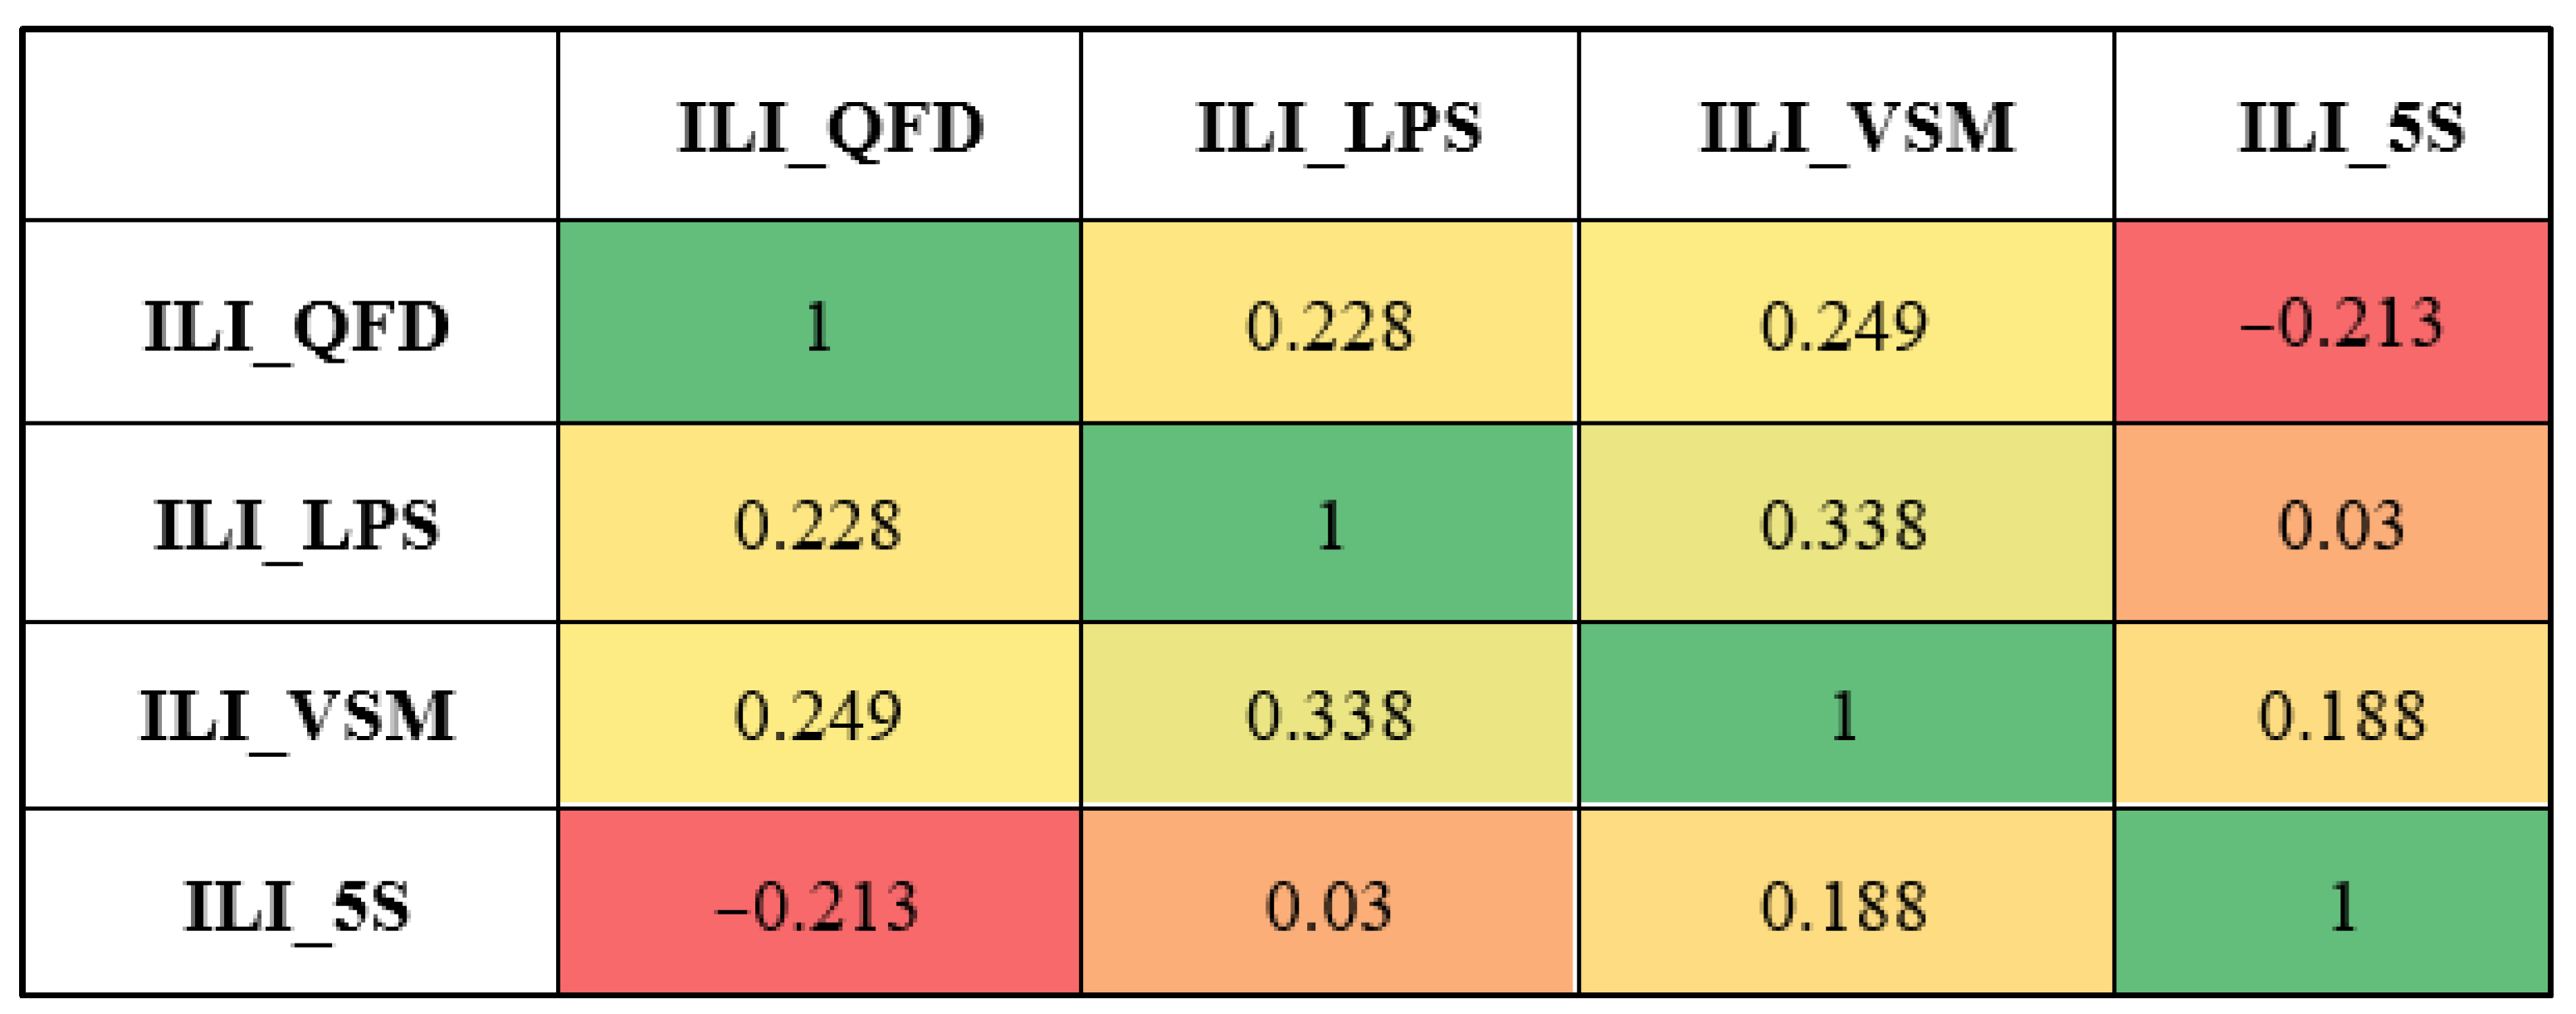
Figure 6 shows the heatmap of Spearman correlation coefficient values for the model output indices. It has been observed that there is a negative relationship between the improvement level by Quality Function Deployment and the improvement level by 5S. The improvement level by LPS and VSM has the highest relationship with a coefficient of 0.338, while there is no relation between the improvement level by the Last Planner System and 5S.
4.2. Model Inputs and Outputs Boxplots
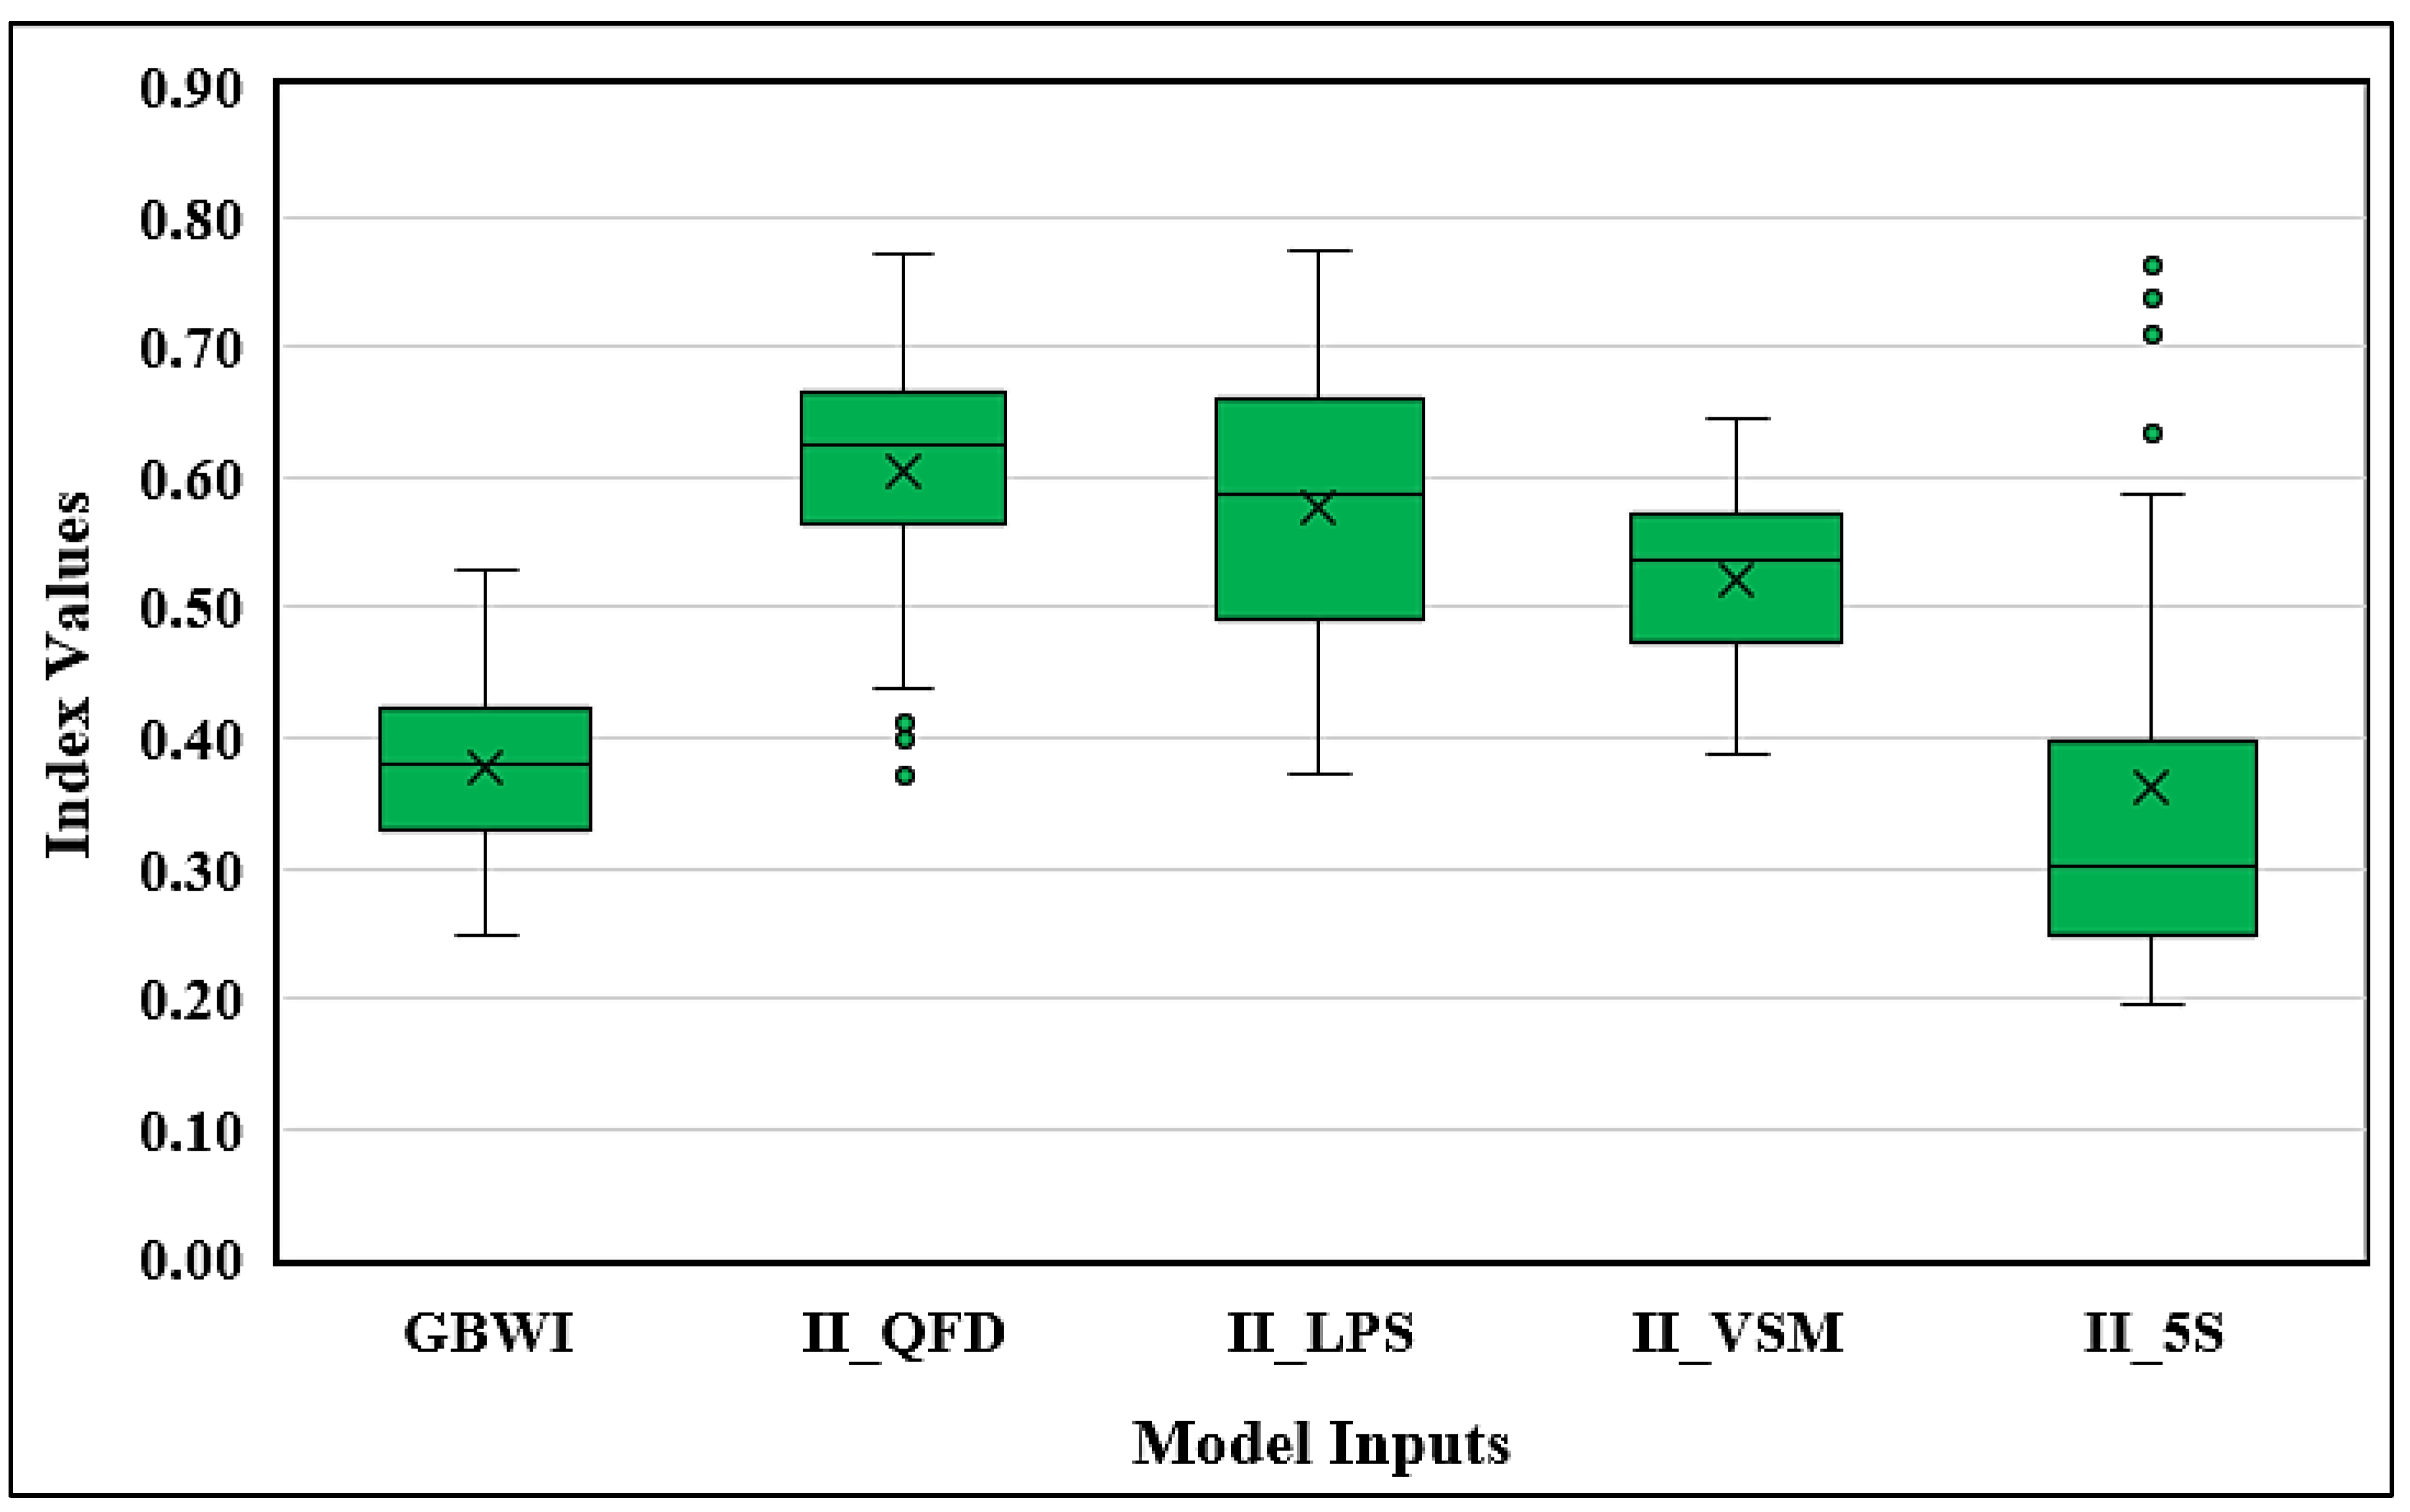
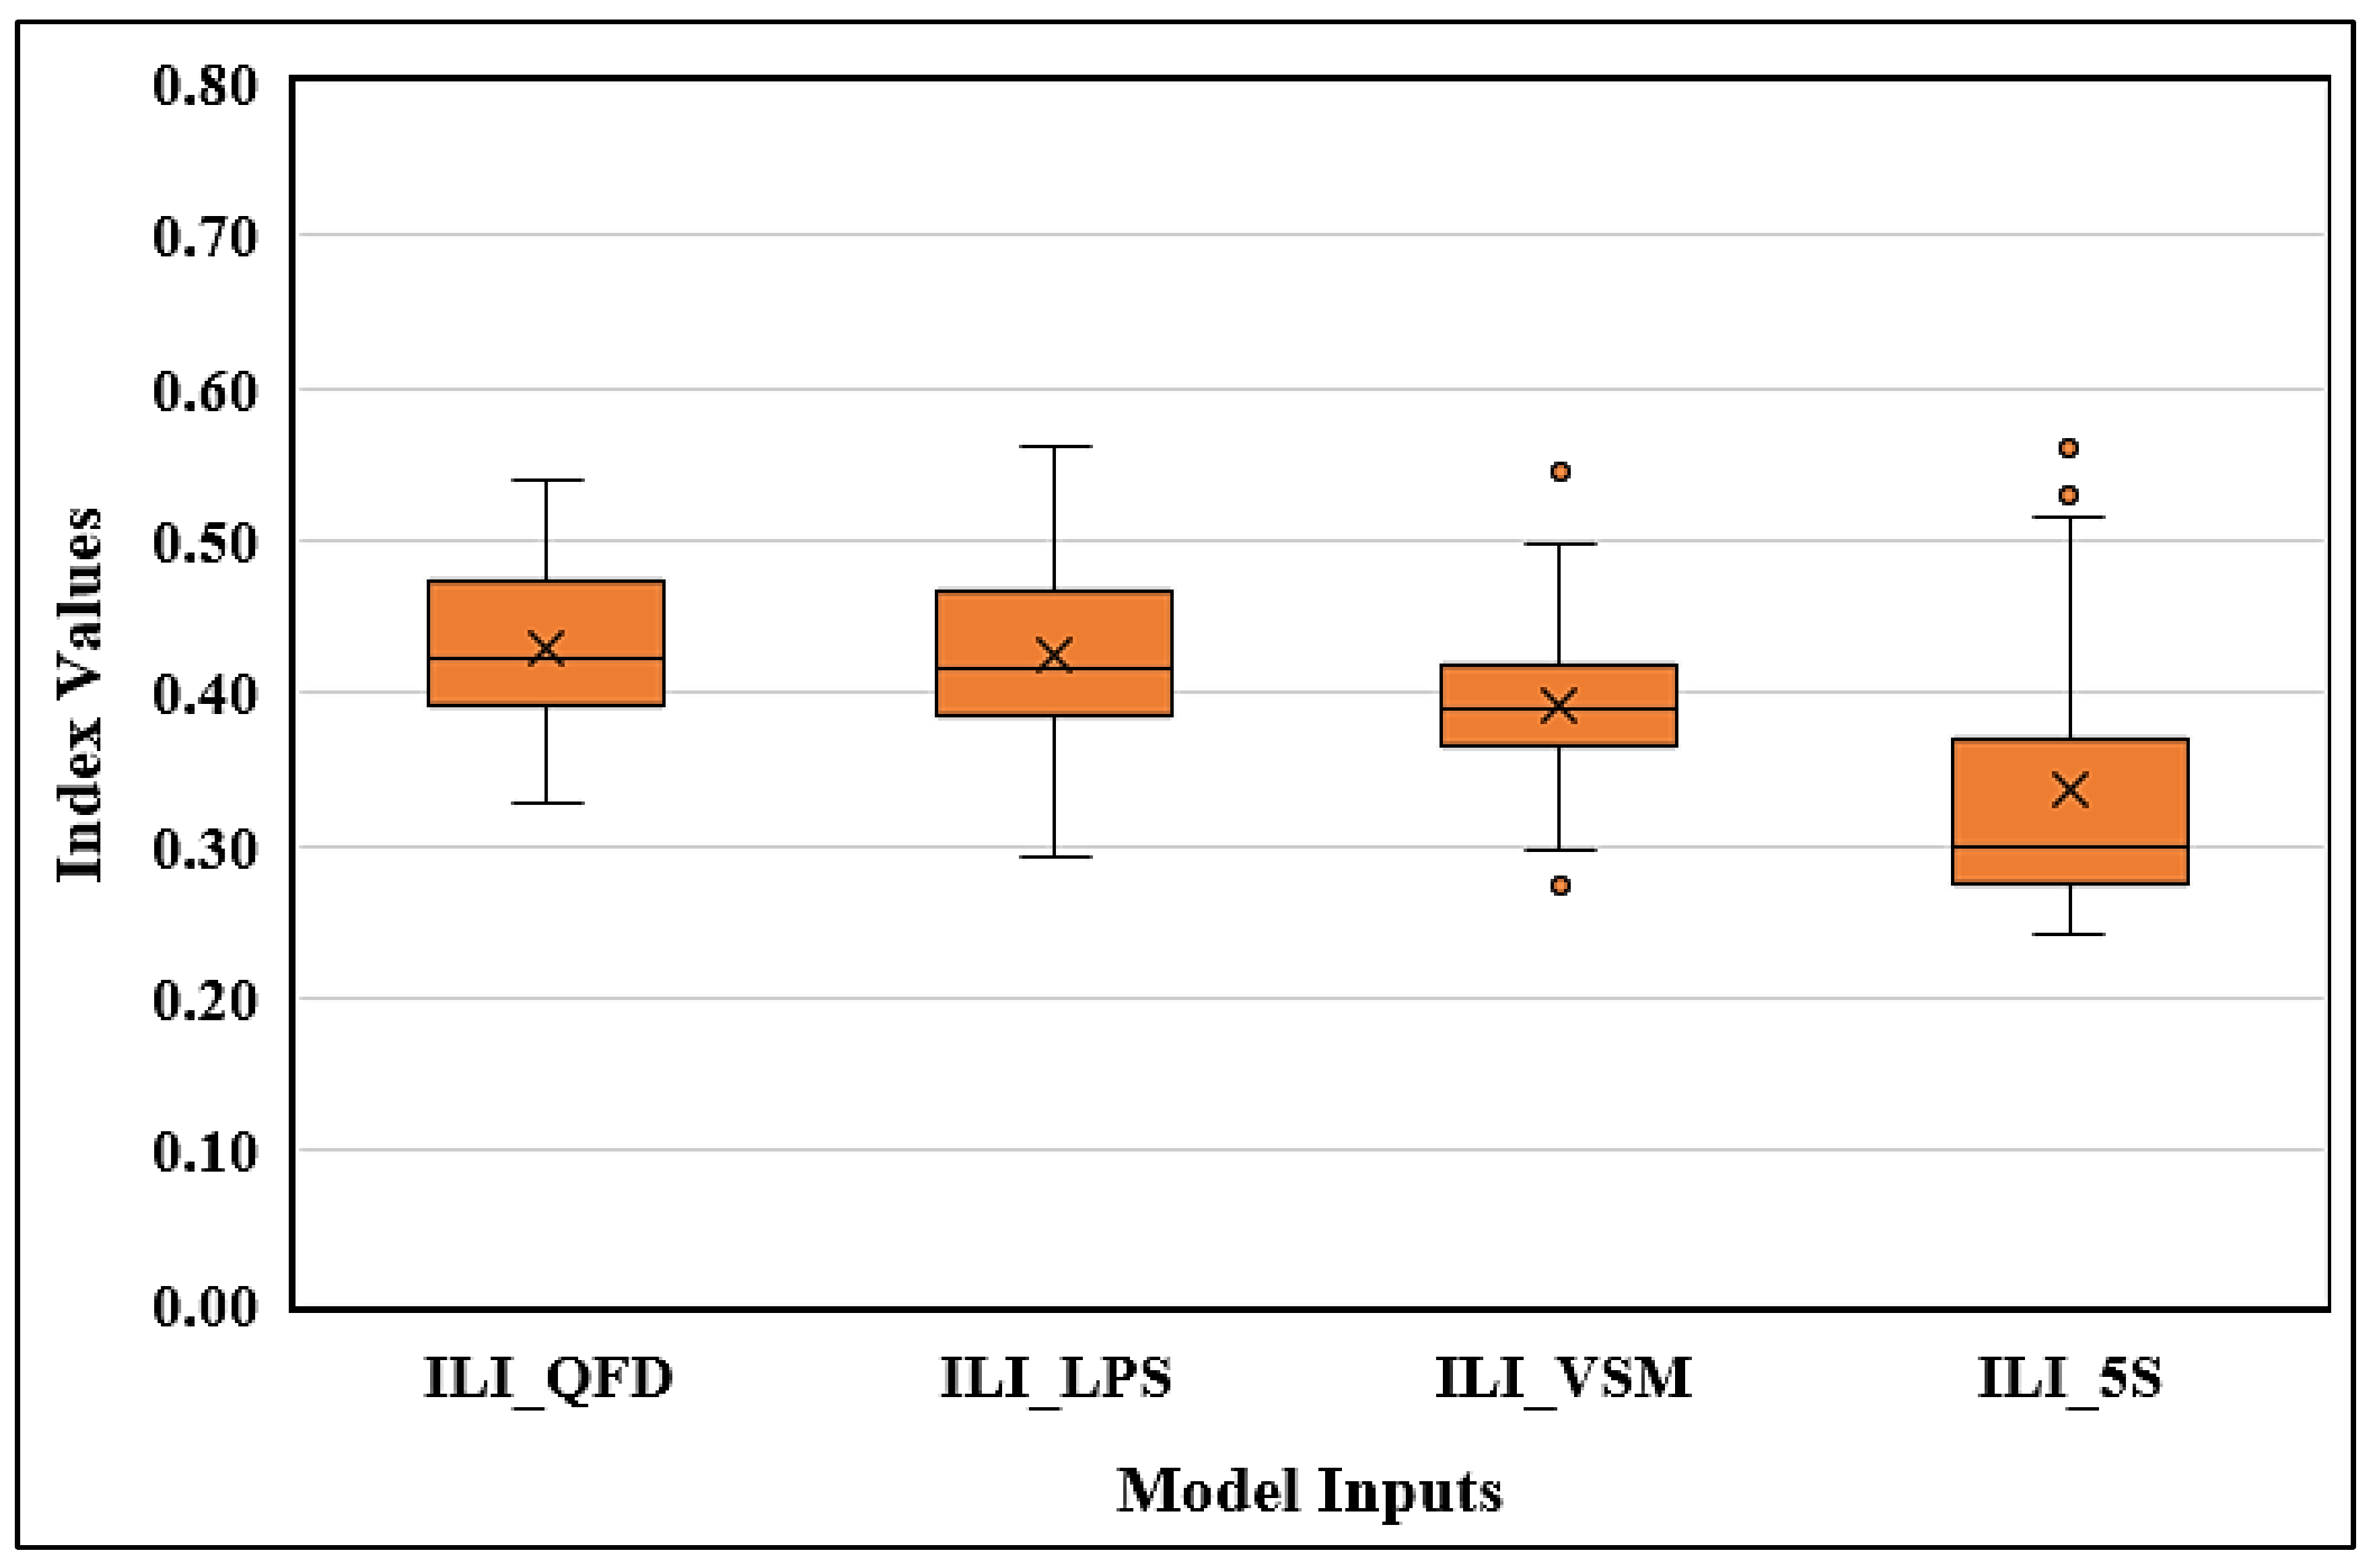
The boxplot is widely recognized as an efficient graphical tool for summarizing several statistical characteristics, including center, range, and outlier points, which show as small circles positioned below or above the range. The box represents 50% of the investigated data, with the lower boundary representing the 25th percentile or the first quartile (Q1), and the upper boundary representing the 75th percentile or the third quartile (Q3). The median is denoted by a line positioned at the center of the box [
77].
Figure 7 compares the inputs indices of the model (GBWI, II_QFD, II_LPS, II_VSM, II_5S). The 5S index has the widest distribution range among the other indices, with the lowest values and the lowest lower limit value. The value stream mapping index has the narrowest range (0.387 to 0.645). There are five outlier waste factors in the case of 5S, two of which, CW27 and CW28, are also recognized as outlier factors for the quality function deployment index. The quality function deployment and the last planner system indices have values close to the upper limit; the distribution ranges of these indices are quite similar, with only slight differences in their upper and lower limits. It has been observed that CW35 (poor collaboration among stakeholders to achieve green building objectives) has the highest value for the last planner system index (II_LPS = 0.774). There are no outliers for GBWI, LPS, and VSM indices, and the values converge near the median.
Figure 8 compares the output indices of the model (ILI_QFD, ILI_LPS, ILI_VSM, ILI_5S). The improvement level by 5S index has the widest distribution range with the lowest minimum value, while the improvement level by QFD index has the shortest distribution range compared to other indices. The difference in the distribution of these indices refers to the differences in their lower limit values, while the improvement level indices are generally close to their upper limits. The LPS and VSM indices have similar distribution ranges, with only minor differences in their upper and lower limits. Notably, the LPS index has the highest upper limit. CW23 (poor assessment of site conditions before design, including hydrology, topography, soil, climate, and vegetation) and CW34 are observed as outlier factors in the improvement level for VSM index, while CW08 and CW27 are noted as outliers in the improvement level by 5S index.
4.3. Analysis of Model Inputs Based on Impact Indices of Lean Tools
Figure 9 presents a summary of the Impact index values for lean tools on the cause of waste in group 01 (green materials). It has been observed that QFD has the highest impact on the causes of waste compared to other lean tools in group 01. The causes of wastes that are highly affected by QFD include CW09 (poor quality of green building materials) (II_QFD = 0.704), CW07 (II_QFD = 0.692), and CW01 (II_QFD = 0.687). On the other hand, the causes of waste that are highly affected by LPS are CW11 (delayed supply of green building materials to the construction site) (II_LPS = 0.681), and CW03 (not providing a construction waste management plan to recycle or reuse materials) (II_LPS = 0.627). The VSM has a high effect on CW03 (II_VSM = 0.645) and CW08 (improper storage of green building materials) (II_VSM = 0.629). CW08, CW04 and CW10 are highly affected by 5S (II_5S = 0.738), (II_5S = 0.710), (II_5S = 0.633) respectively. The cause of waste that is weakly affected by Lean techniques (LPS, VSM, and 5S) is CW06 (increase in prices of green building materials), while CW10 is weakly affected by QFD.
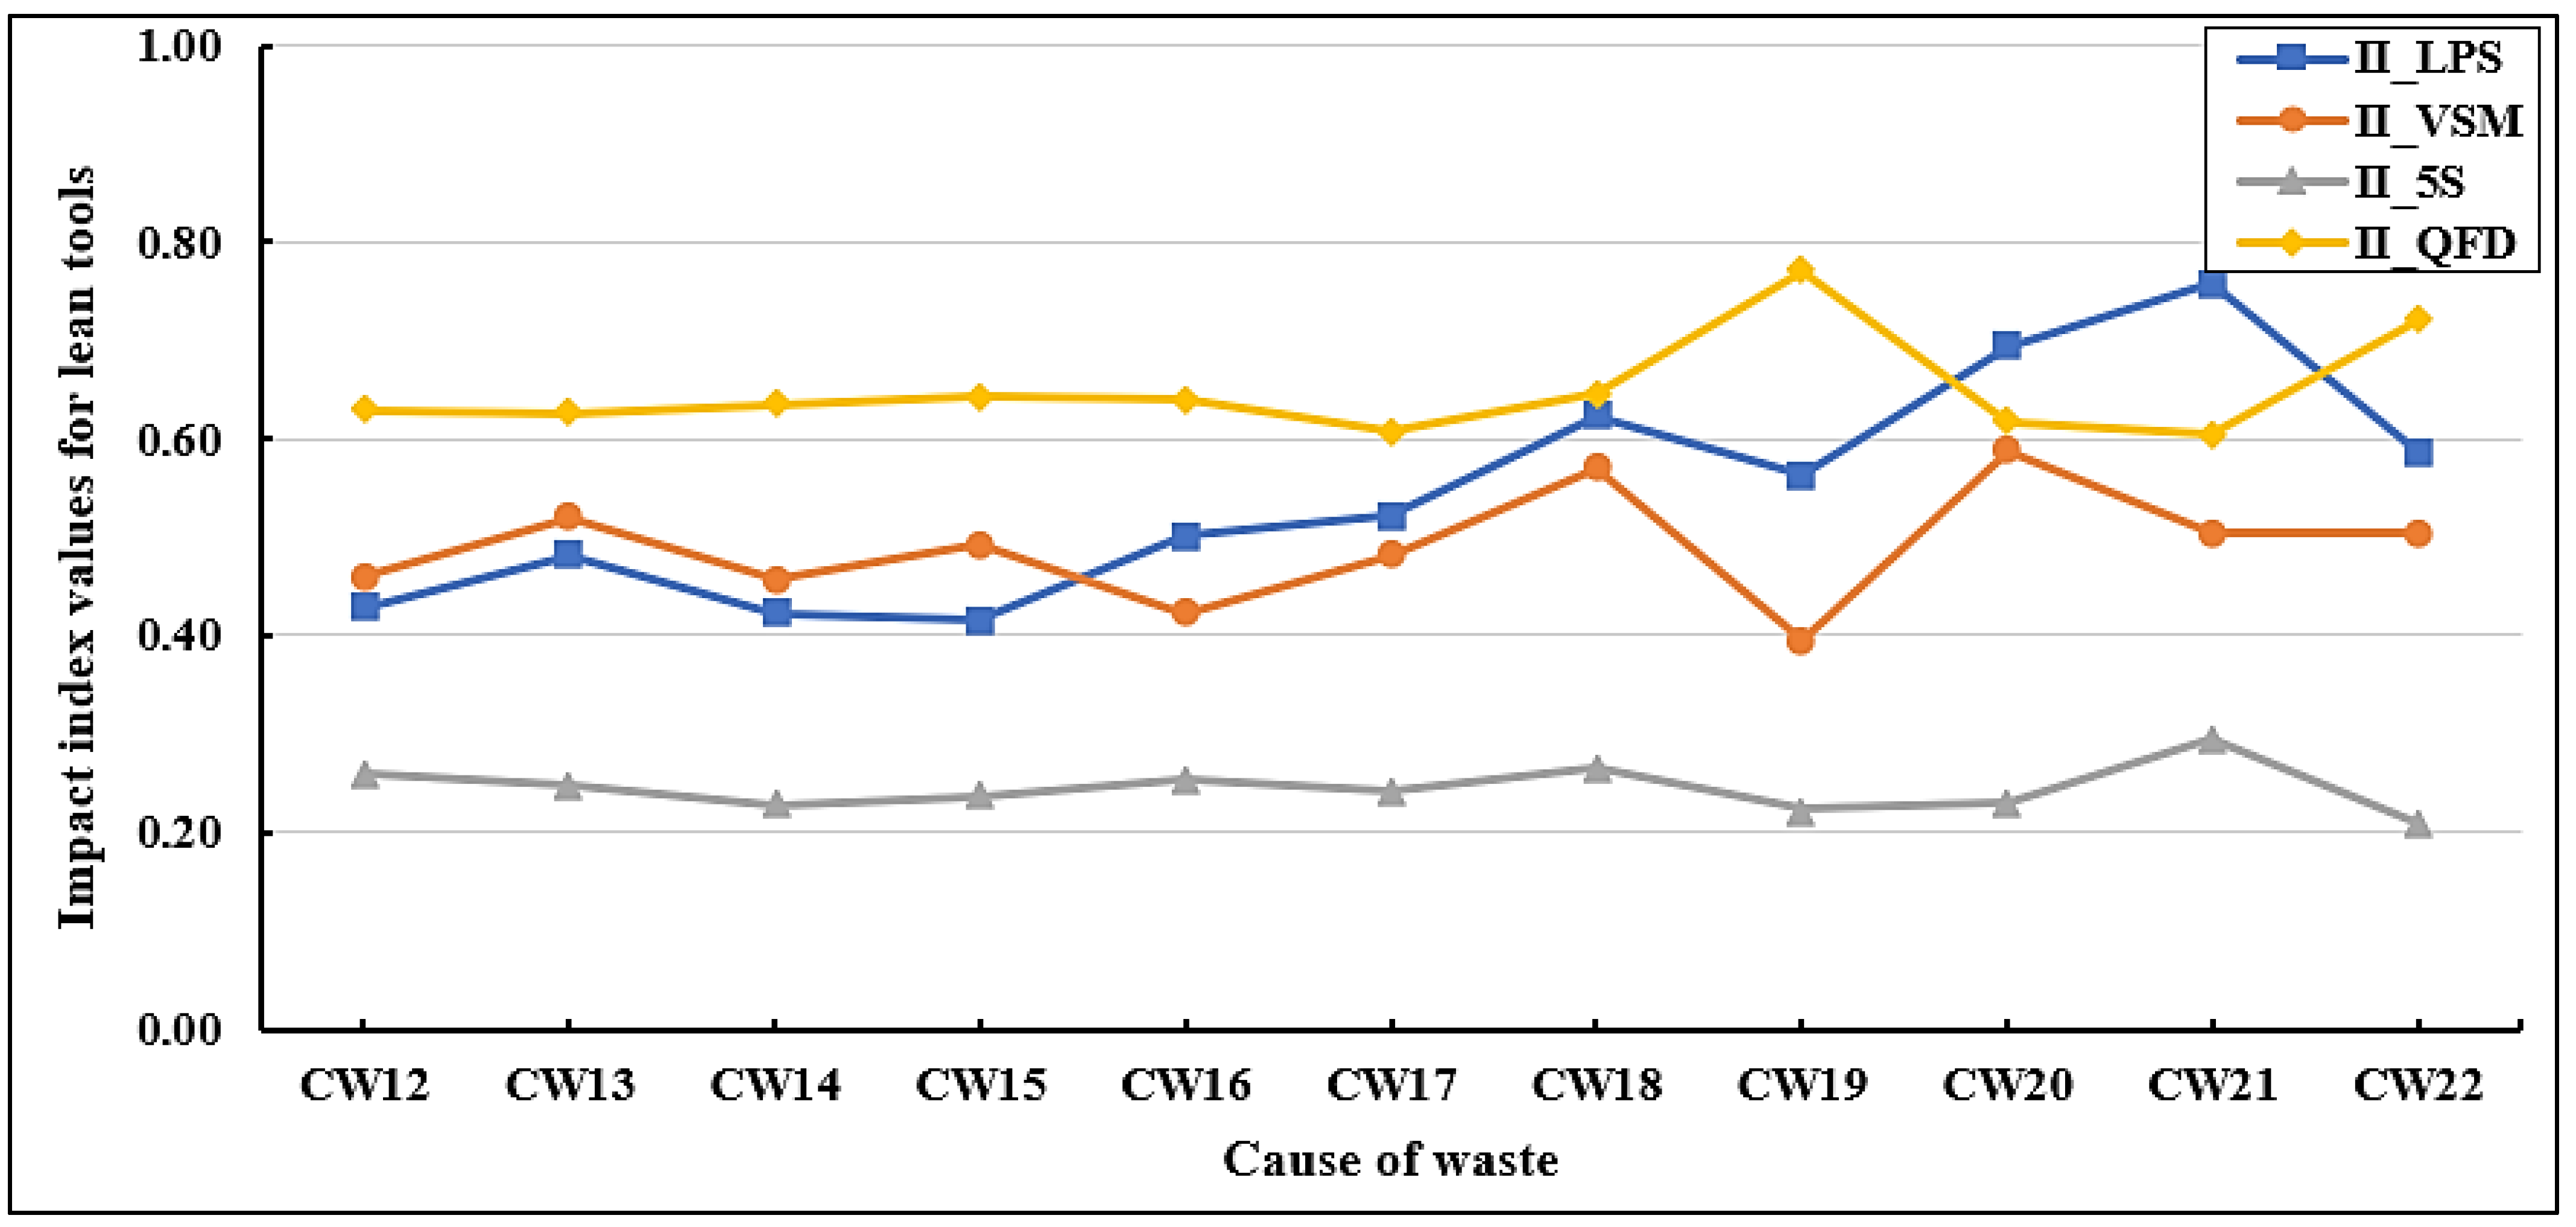
Figure 10 shows a summary of the impact index values of lean tools on the cause of waste in group 02 (green building design). It can be observed that QFD has a strong influence on the causes of waste in this group, while 5S has a minimal effect on these causes compared to other lean tools. The causes of wastes that are highly affected by QFD, but at the same time weakly affected by 5S are CW19 (design does not meet the owner’s requirements) (II_QFD = 0.771), (II_5S = 0.223), and CW22 (II_QFD = 0.721) (II_5S = 0.209). CW21 (poor communication with the design team) and CW20 (delays caused by prolonged design reviews and incomplete drawings) are highly affected by LPS (II_LPS = 0.758), (II_LPS = 0.695), respectively. The causes of wastes that are highly affected by VSM are CW20 with an II_VSM of 0.588, and CW18 with an II_VSM of 0.571. It is observed that LPS has a low impact on CW15 (II_LPS = 0.415), while VSM has a minor effect on CW19 (II_VSM = 0.395) and CW16 (II_VSM = 0.423). As group 02 is related to ‘green building design’, the results confirm that QFD is an approach that effectively identifies customer requirements and translates them into specifications that result in the production of design features that meet those requirements.
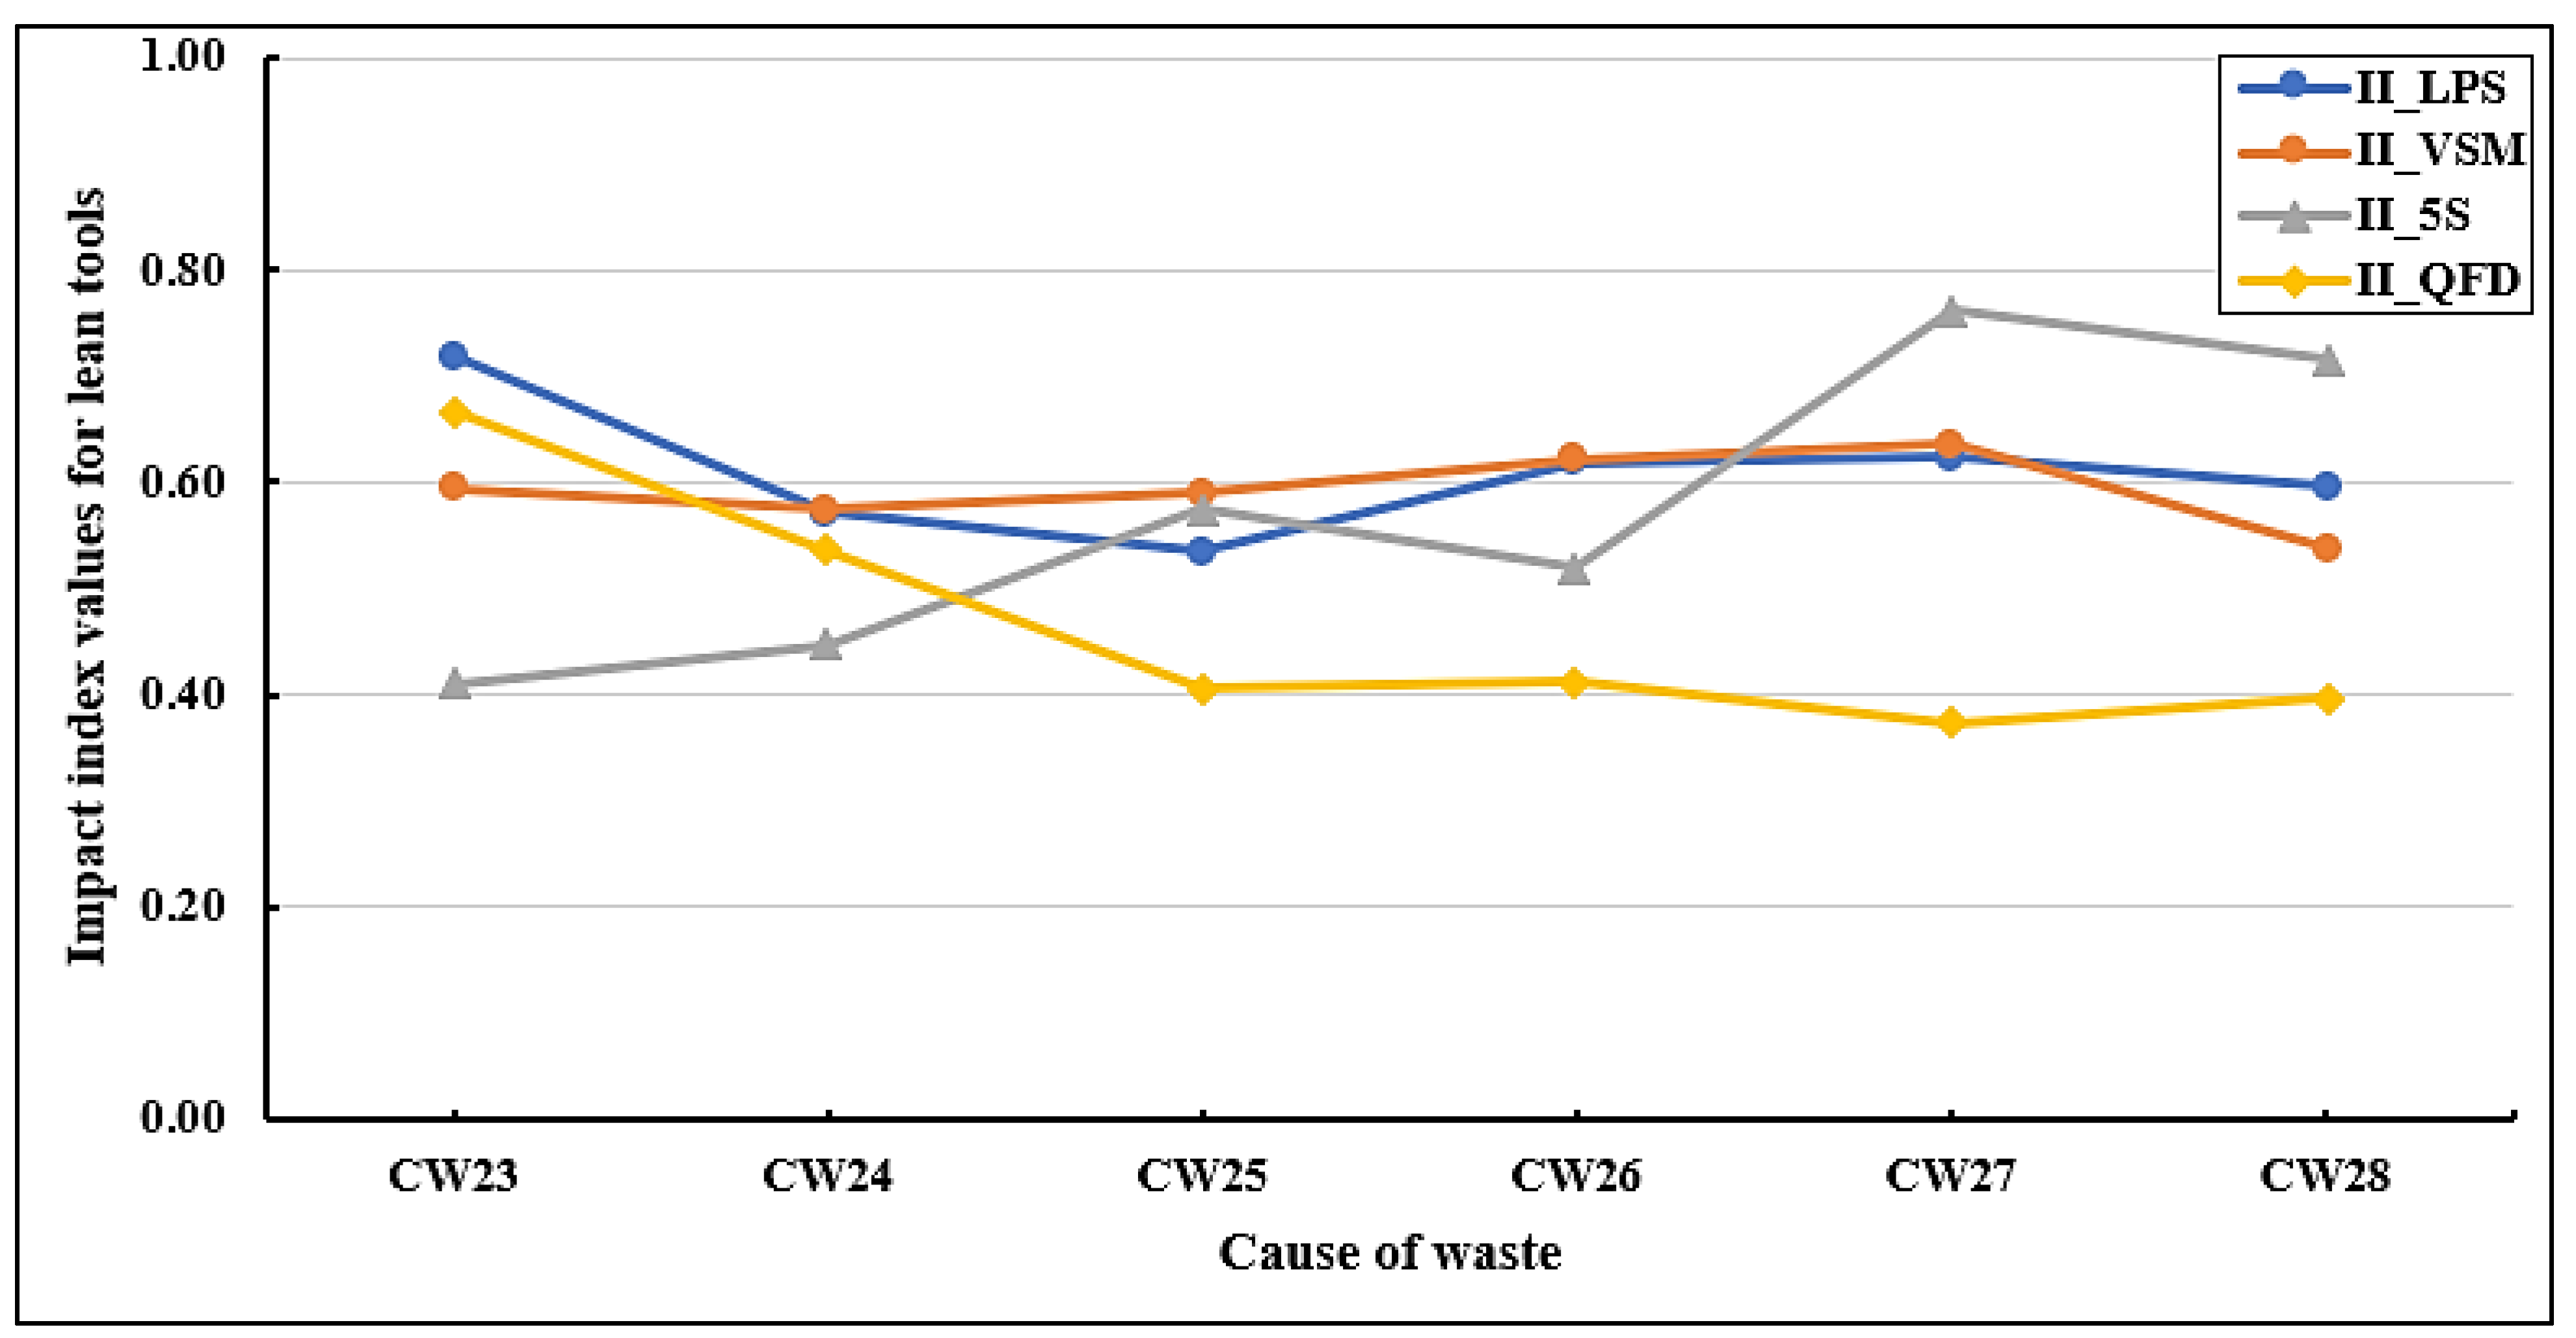
Figure 11 presents a summary of the impact index values of lean tools on the cause of waste in group 03 (sustainable site). It has been noticed that LPS and VSM have similar effects on the causes of waste in group 03, while QFD has a low influence on these causes compared to other lean tools. The cause of waste that is highly affected by QFD and LPS is CW23 (poor assessment of site conditions before design, including hydrology, topography, soil, climate, and vegetation) (II_QFD = 0.667) (II_LPS = 0.718). The VSM has a strong impact on CW27 (leaving waste materials in areas that might obstruct the movement of equipment and workers) (II_VSM = 0.636) and CW26 (II_VSM = 0.622). On the other hand, CW27 and CW28 are highly affected by 5S (II_5S = 0.762) (II_5S = 0.715), respectively. CW28 is ranked last according to VSM (II_VSM = 0.538) and second-to-last according to QFD (II_QFD = 0.398). The cause of waste that is weakly affected by LPS is CW25 (air pollution due to dust generated by construction activities and not providing suitable precautions to reduce it) (II_LPS = 0.534), while CW23 and CW24 are weakly affected by 5S.
Figure 12 presents a summary of the impact index values of lean tools on the cause of waste in group 04 (green building technologies (GBTs)). It has been observed that LPS has the highest impact on the causes of waste, and 5S has the lowest impact compared to other lean tools in group 05. The highest effect by QFD is found on CW29 (high costs of green building technologies (GBTs)) (II_QFD = 0.637), and the lowest impact by QFD is found on CW33 (II_QFD = 0.439). The causes of wastes that are highly affected by LPS include CW34 (lack of interviews with green building technology specialists) (II_LPS = 0.735) and CW30 (II_LPS = 0.671). The VSM has a high impact on CW31 (lack of available and reliable green building technology suppliers) (II_VSM = 0.572). The cause of waste that is weakly affected by LPS, VSM, and 5S is CW29 (II_LPS = 0.405), (II_VSM = 0.409), (II_5S = 0.196), while CW33 is weakly affected by QFD (II_QFD = 0.439).
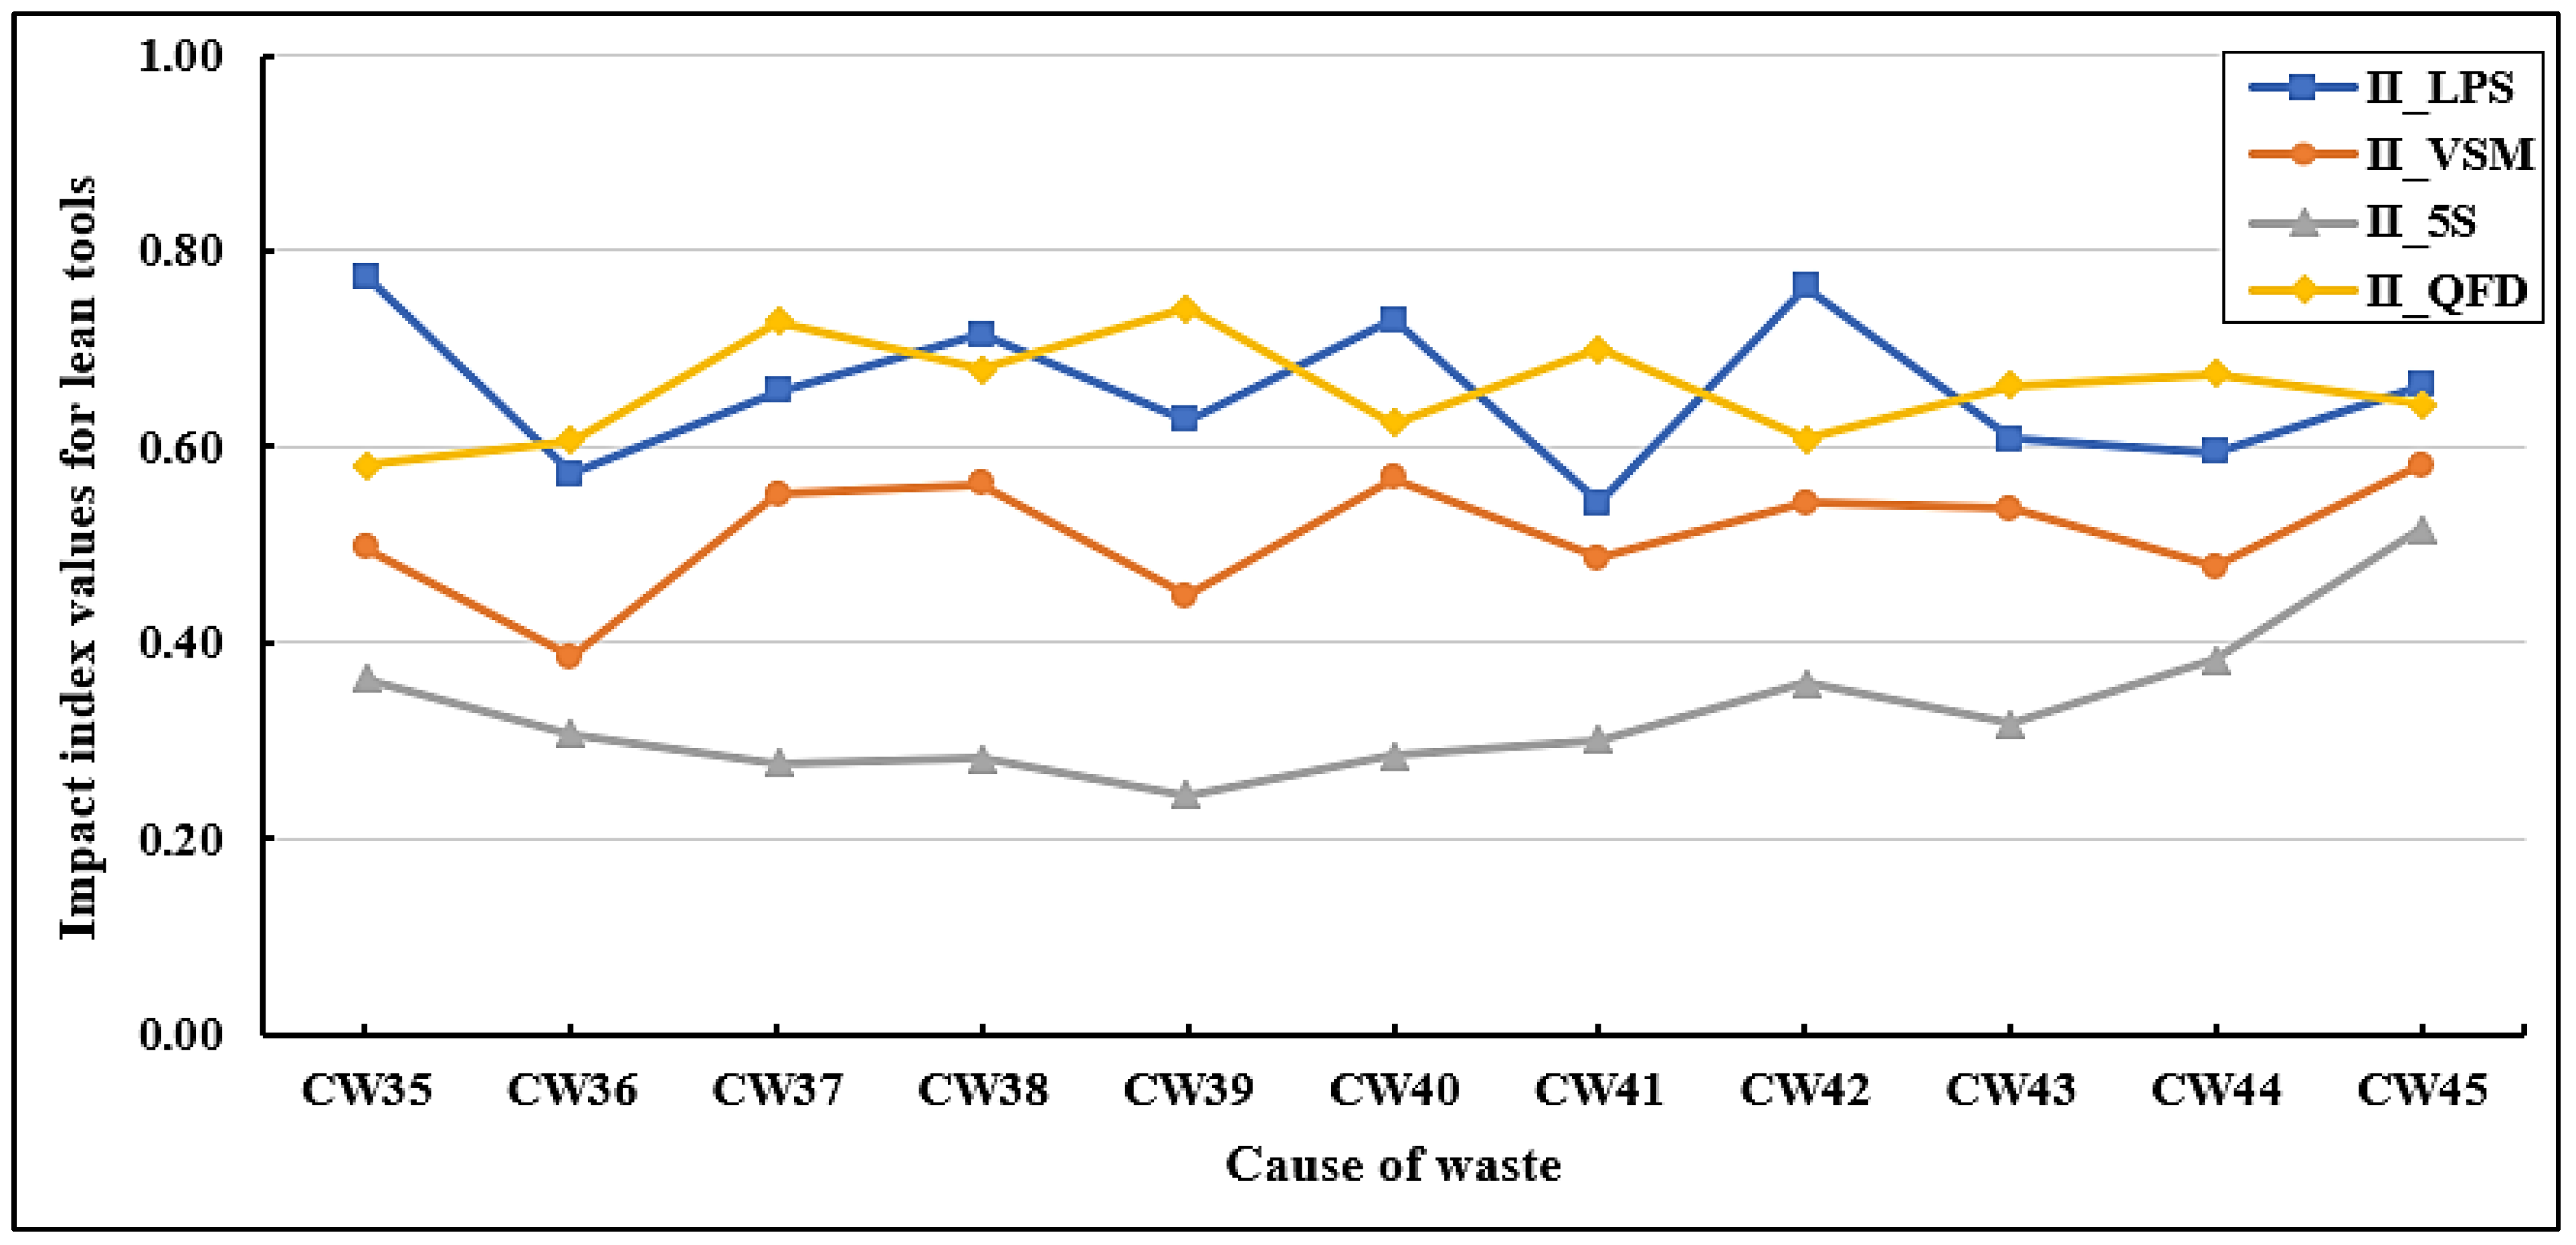
Figure 13 indicates a summary of the impact index values of lean tools on the cause of waste in group 05 (green building stakeholders). It has been observed that QFD and LPS have a high effect on the causes of waste in this group, while 5S has a minor impact on these causes compared to other lean tools. It has been observed that QFD has a high effect on CW39 (changes in specifications by the owner) (II_QFD = 0.742), and CW37 (II_QFD = 0.728). The causes of wastes that are highly affected by LPS are CW35 (poor collaboration among stakeholders to achieve green building objectives) (II_LPS = 0.774), CW42 (II_LPS = 0.764), and CW40 (II_LPS = 0.729). CW45 (rework due to workers’ mistakes) and CW40 are highly affected by VSM (II_VSM = 0.583), (II_VSM = 0.568), respectively. It is observed that VSM has a low impact on CW36 (lack of expertise among green building contractors, subcontractors, designers, and suppliers in implementing GB projects) (II_VSM = 0.387), whereas the lowest impact by 5S is found on CW39 (II_5S = 0.245). As group 05 is related to ‘green building stakeholders’, the results confirm that LPS is an effective tool used by workers, subcontractors, and architects, allowing them more direct control over planning and decision-making processes.
4.4. Analysis of Model Inputs According to Average Weight of Each Group
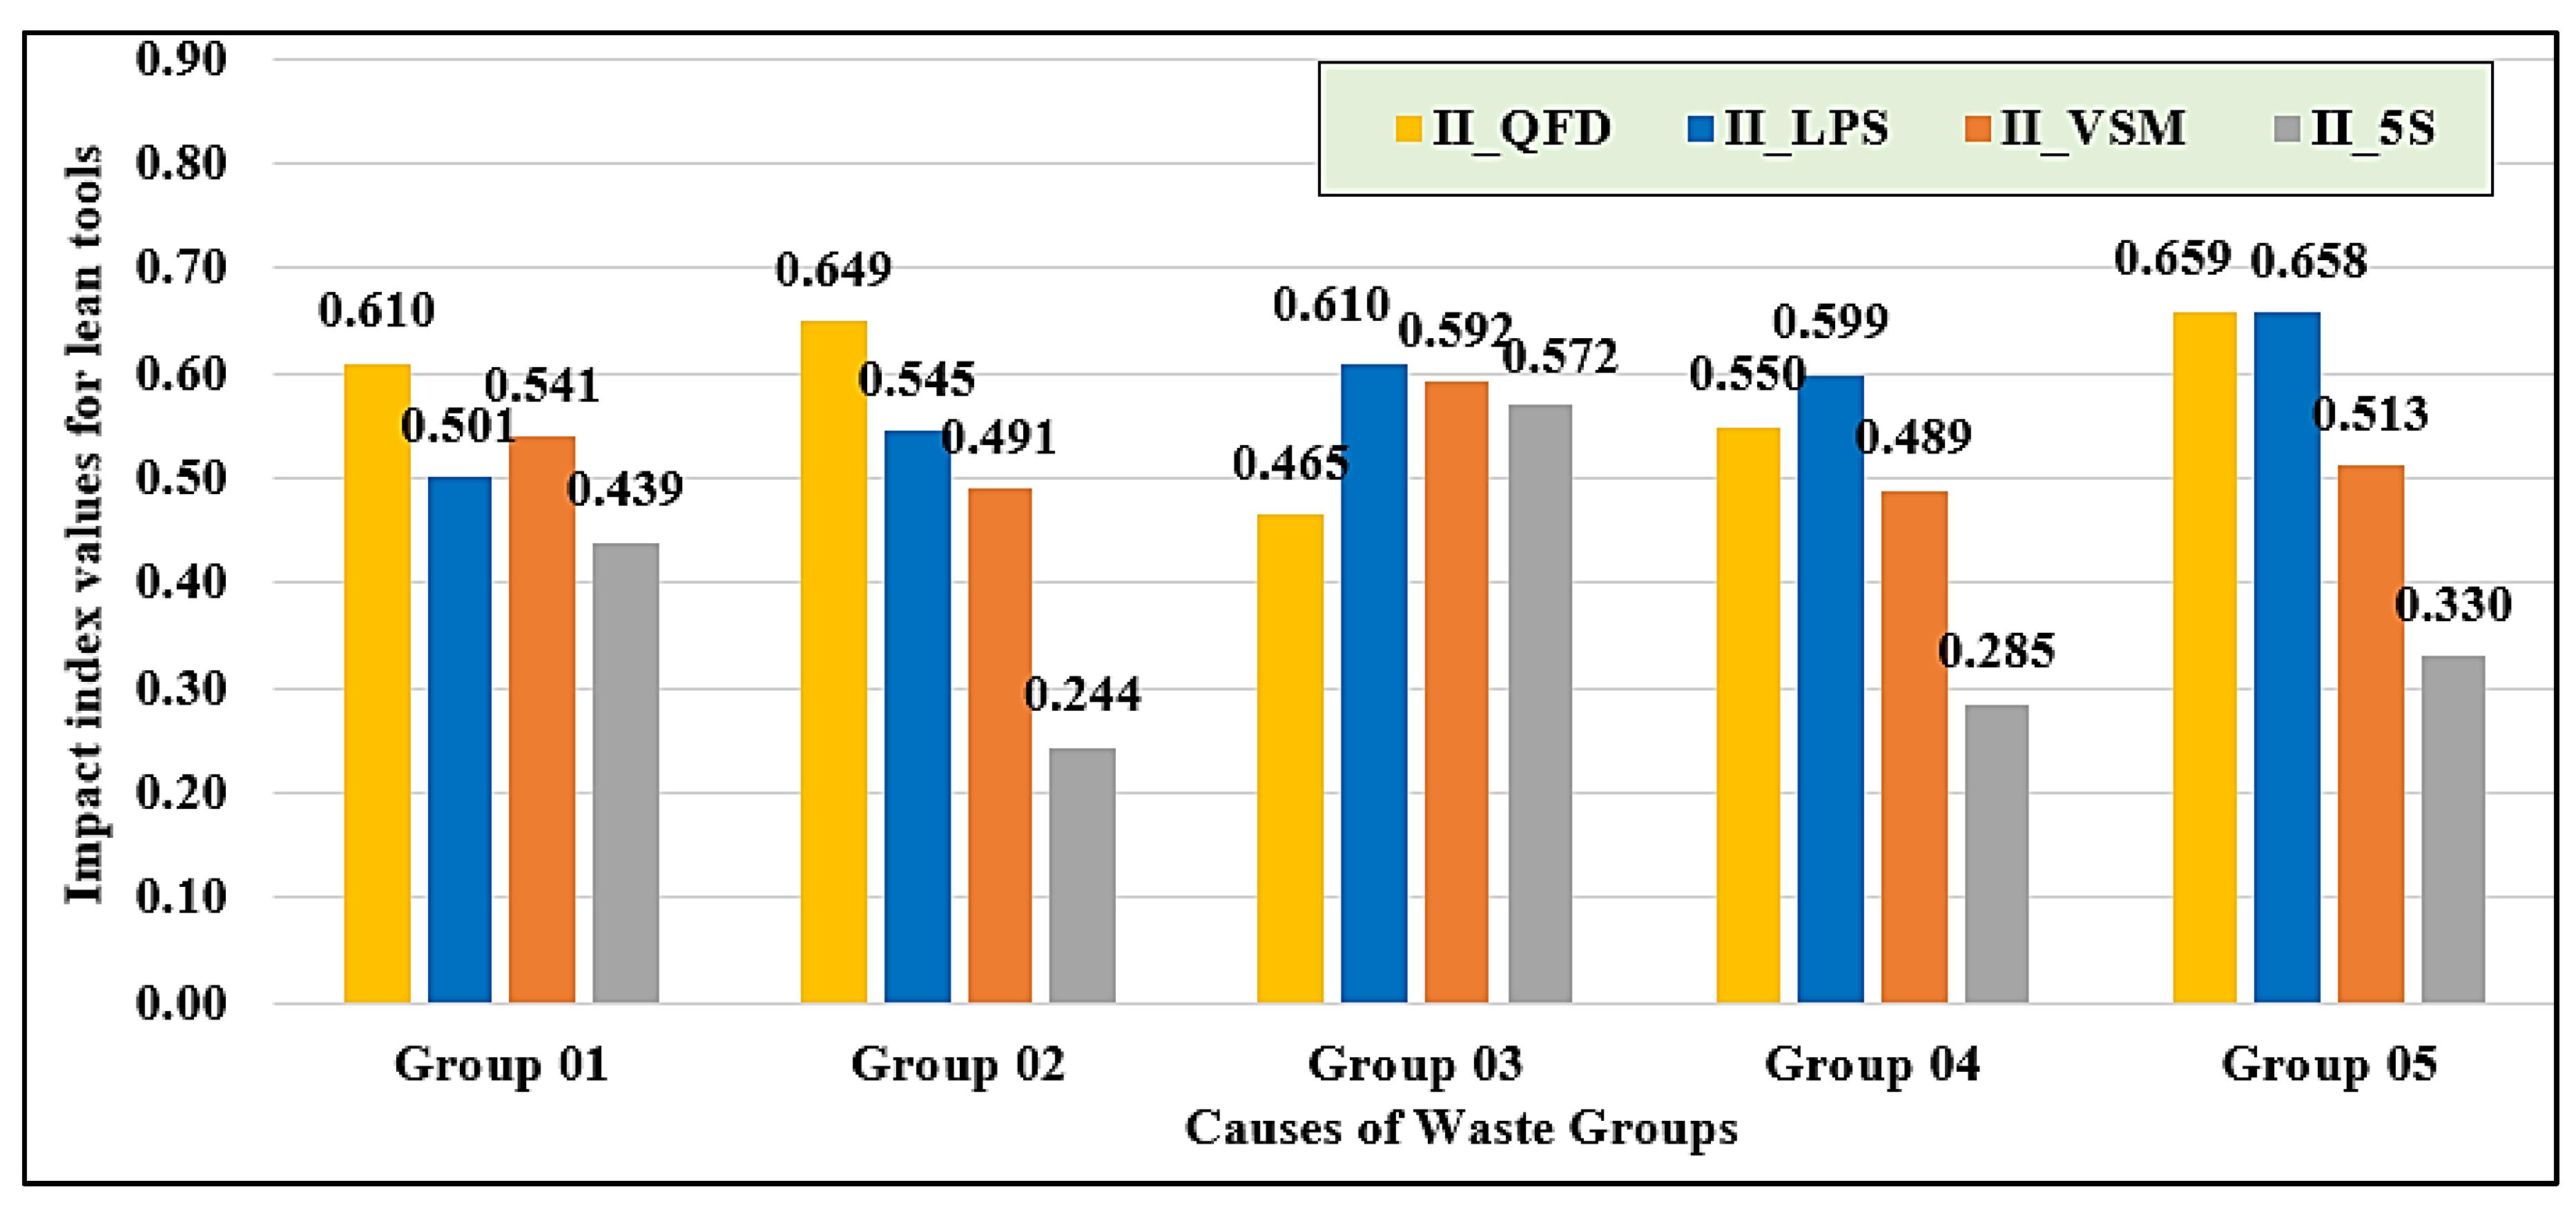
Figure 14 presents the average weight of each group based on the impact of lean tools. It is observed that the impact of lean tools on the causes of waste varies across the five groups, with QFD and LPS generally demonstrating higher effects compared to VSM and 5S. In group 01, QFD exhibits the highest impact on the causes of waste (II_QFD = 0.610), followed by VSM (II_VSM = 0.541), while 5S shows the lowest impact (II_5S = 0.439). For Group 02, it has been observed that QFD again has the highest impact (II_QFD = 0.649), followed by LPS (II_LPS = 0.545), while 5S has the least impact (II_5S = 0.244). Regarding Group 03, LPS shows the most significant impact (II_LPS = 0.610), closely followed by VSM (II_VSM = 0.592), while QFD has the least impact (II_QFD = 0.465). In Group 04, LPS has a strong influence on the causes of waste in this group (II_LPS = 0.599), followed by QFD (II_QFD = 0.550), and 5S records the lowest impact (0.285). Finally, in Group 05, QFD and LPS demonstrate almost equal values (0.659) and the highest impacts, whereas 5S has the lowest influence (II_5S = 0.330). These results highlight that QFD and LPS are the most influential lean tools in mitigating the causes of waste in GB projects, while 5S shows the lowest impact.
4.5. Analysis of Model Outputs According to Improvement Level Indices by Lean Tools
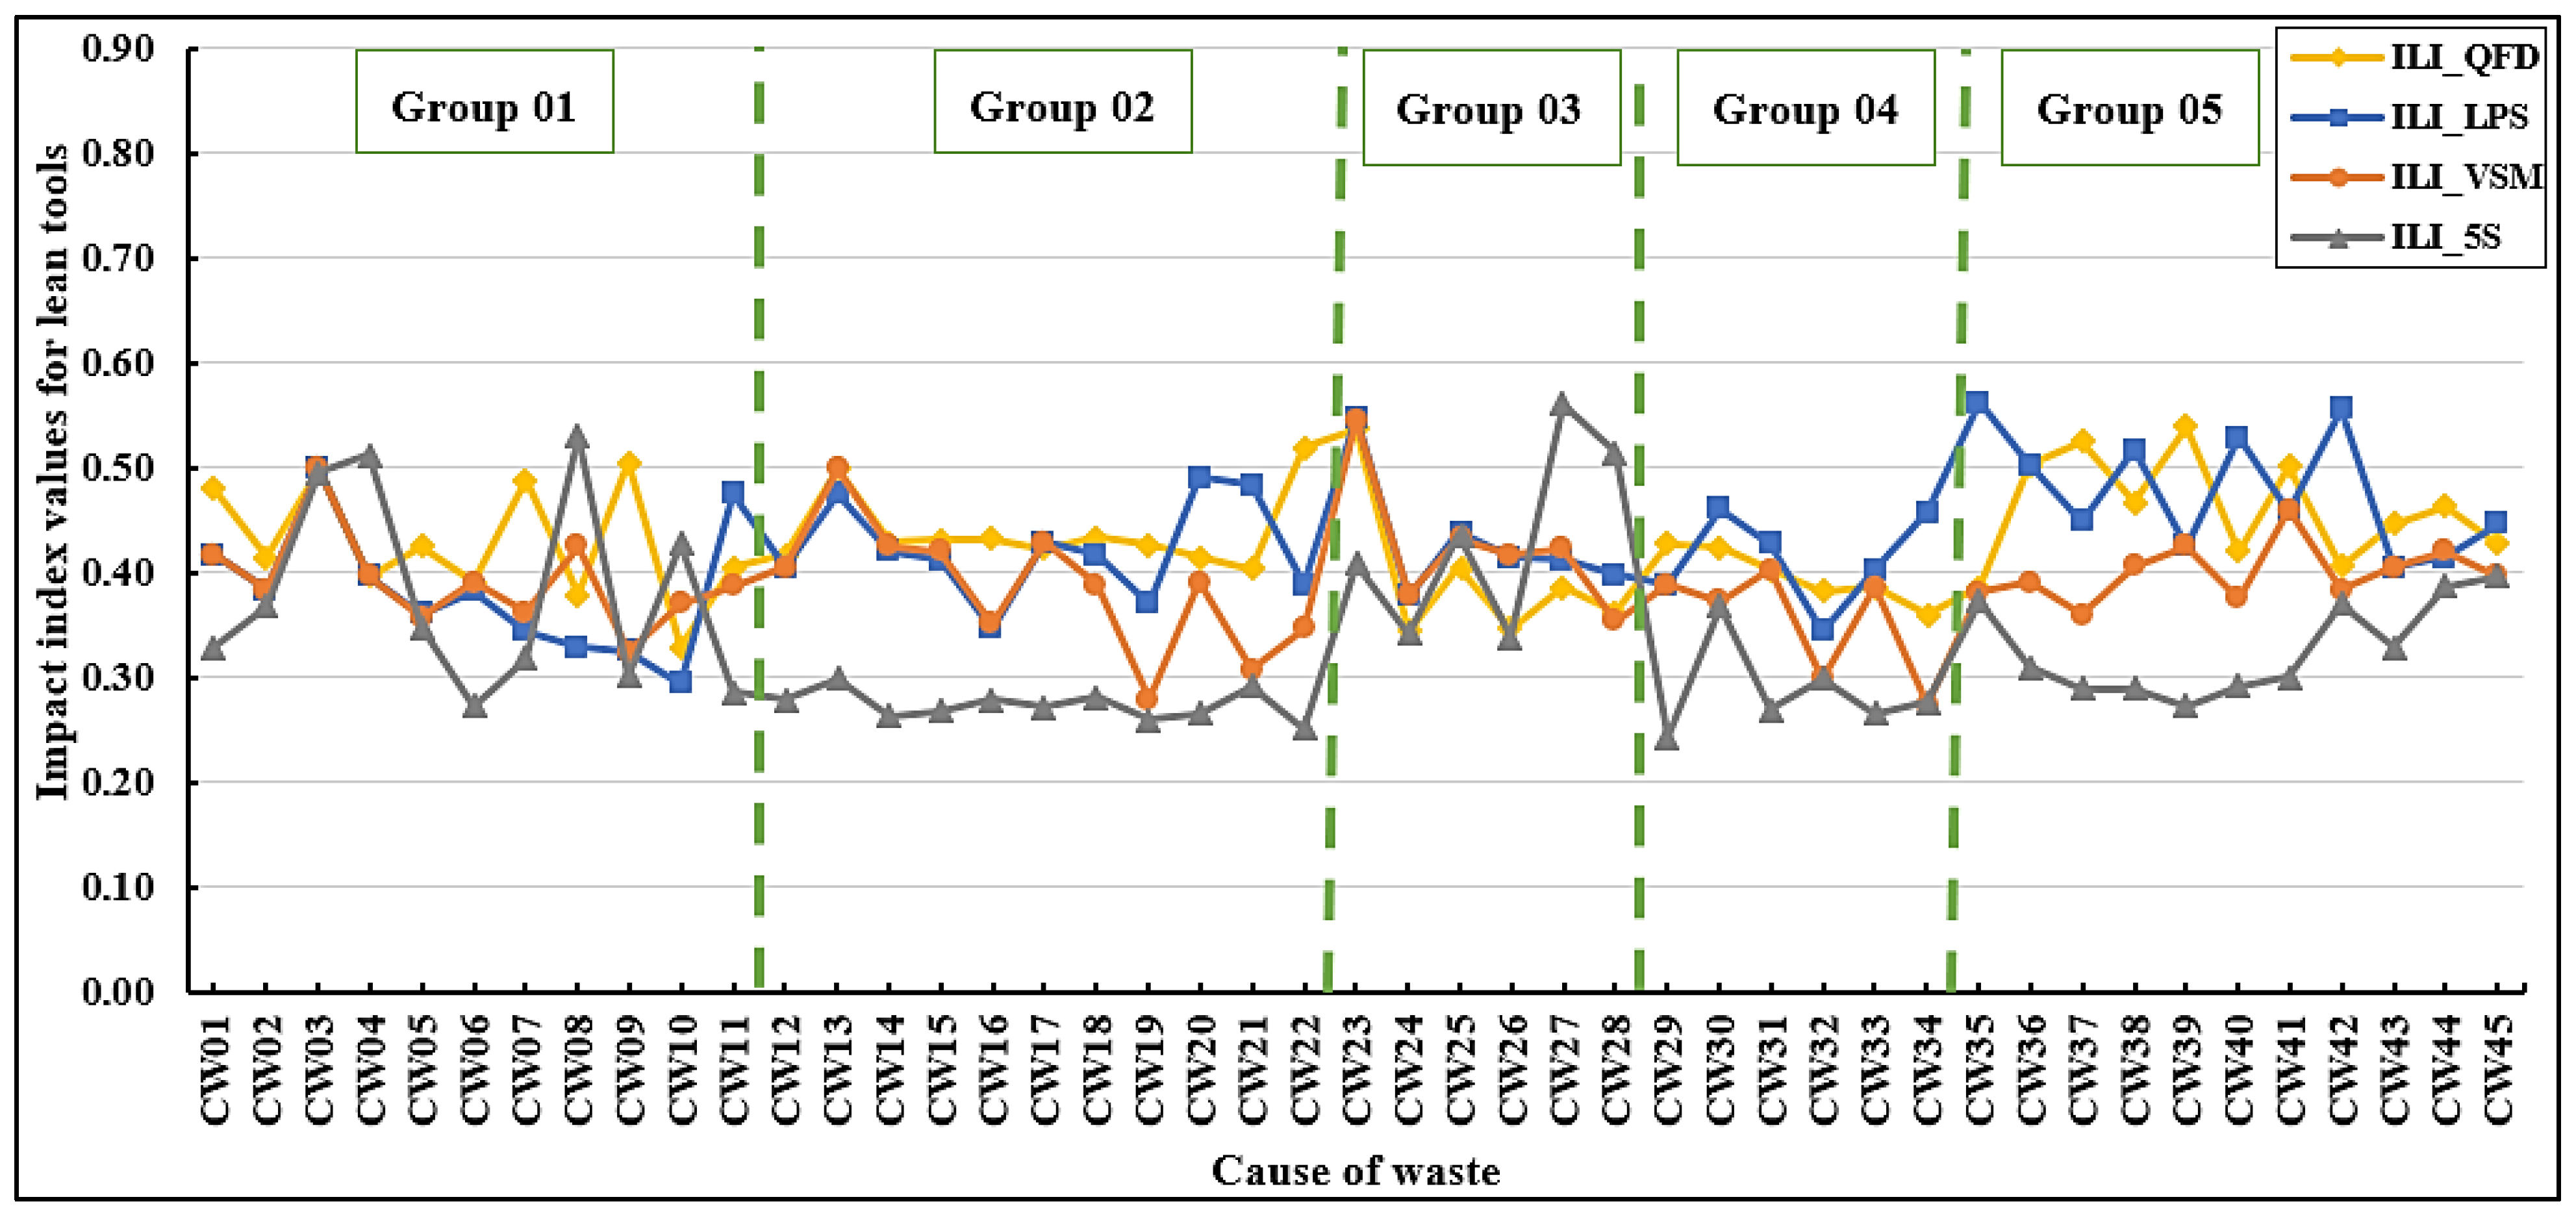
Figure 15 presents improvement level indices for all lean tools across all causes of waste. It has been observed that the improvement level index by quality function deployment (ILI_QFD) shows high values for several key causes of waste. Specifically, CW39 has the highest ILI_QFD value of 0.539, followed closely by CW23 with an ILI_QFD of 0.537. Other notable causes include CW37 with an ILI_QFD of 0.525, CW22 (ILI_QFD = 0.520), CW09 (ILI_QFD = 0.504), and CW36 (ILI_QFD = 0.502). These high ILI_QFD values indicate that the Green Building Waste Index for these causes is high, and QFD strongly impacts these causes. On the other hand, ILI_QFD shows relatively lower values for specific causes of waste. Precisely, CW10 (damage of green building materials during transportation) has the lowest ILI_QFD value at 0.328, followed by CW24 (loss of topsoil during construction due to equipment movement, rain, and wind, without preparing effective soil erosion control strategies) (ILI_QFD = 0.344). Other contributing factors include CW26 with an ILI_QFD value of 0.346 and CW34 with an ILI_QFD value of 0.360.
The improvement level index by last planner system (ILI_LPS) has been found to exhibit high values for numerous major causes of waste. CW35 has the highest ILI_LPS value at 0.562, followed closely by CW42 (poor communication, coordination, and conflicting views between the contractor, the consultant, and other parties) with an ILI_LPS value of 0.556. Additional significant causes of waste include CW23 with an ILI_LPS value of 0.549, CW40 (ILI_LPS = 0.528), and CW38 (ILI_LPS = 0.517). Furthermore, it is observed that Group 05 (green building stakeholders) demonstrates higher ILI_LPS values compared to other groups. These findings reinforce the effectiveness of the LPS as a valuable tool for workers, contractors, designers, and supervisors, enabling them more direct control over planning and decision-making processes to mitigate stakeholder-related waste in GB projects. Conversely, ILI_LPS values are relatively lower for certain causes of waste. Specifically, CW10 has the lowest ILI_LPS value at 0.293, followed by CW09 at 0.325. Other contributing factors with lower ILI_LPS values include CW08 with an ILI_LPS value of 0.329 and CW32 with an ILI_LPS value of 0.343.
It has been noted that the improvement level index by value stream mapping (ILI_VSM) has shown elevated values for many key causes of waste. Precisely, CW23 holds the highest ILI_VSM value of 0.545, followed by CW03 (ILI_VSM = 0.497). Other significant causes include CW13 with an ILI_VSM of 0.497, CW41 with an ILI_VSM of 0.459, and CW25 (ILI_VSM = 0.432). The high values of ILI_VSM indicate that the Green Building Waste Index for these causes is high, and QFD has a high impact on these causes. On the other hand, ILI_VSM shows relatively lower values for certain causes of waste. Specifically, CW34 has the lowest ILI_VSM value at 0.274, followed by CW19 (ILI_VSM = 0.279). Other contributing causes of waste include CW32 with an ILI_VSM of 0.298 and CW21 with an ILI_VSM of 0.307.
The improvement level index by 5S (ILI_5S) is found to be high for several key causes of waste. Among these, CW27 exhibits the highest ILI_5S value at 0. 560, followed closely by CW08 at 0.530. Other notable causes of waste include CW28 with an ILI_5S of 0.515, CW04 (ILI_5S = 0.512), and CW03, which registers an ILI_5S value of 0.496. Conversely, ILI_5S values are relatively lower for some causes of waste. Specifically, CW29 has the lowest ILI_5S value at 0.242, followed by CW22 with an ILI_5S of 0.251. Other contributing causes include CW19 with an ILI_5S of 0.261, and CW14 (ILI_5S = 0.263). The low ILI_5S values indicate that the Green Building Waste Index for these causes is low, and 5S weakly impacts these causes.
4.6. Analysis of Model Outputs According to Average Weight of Each Group
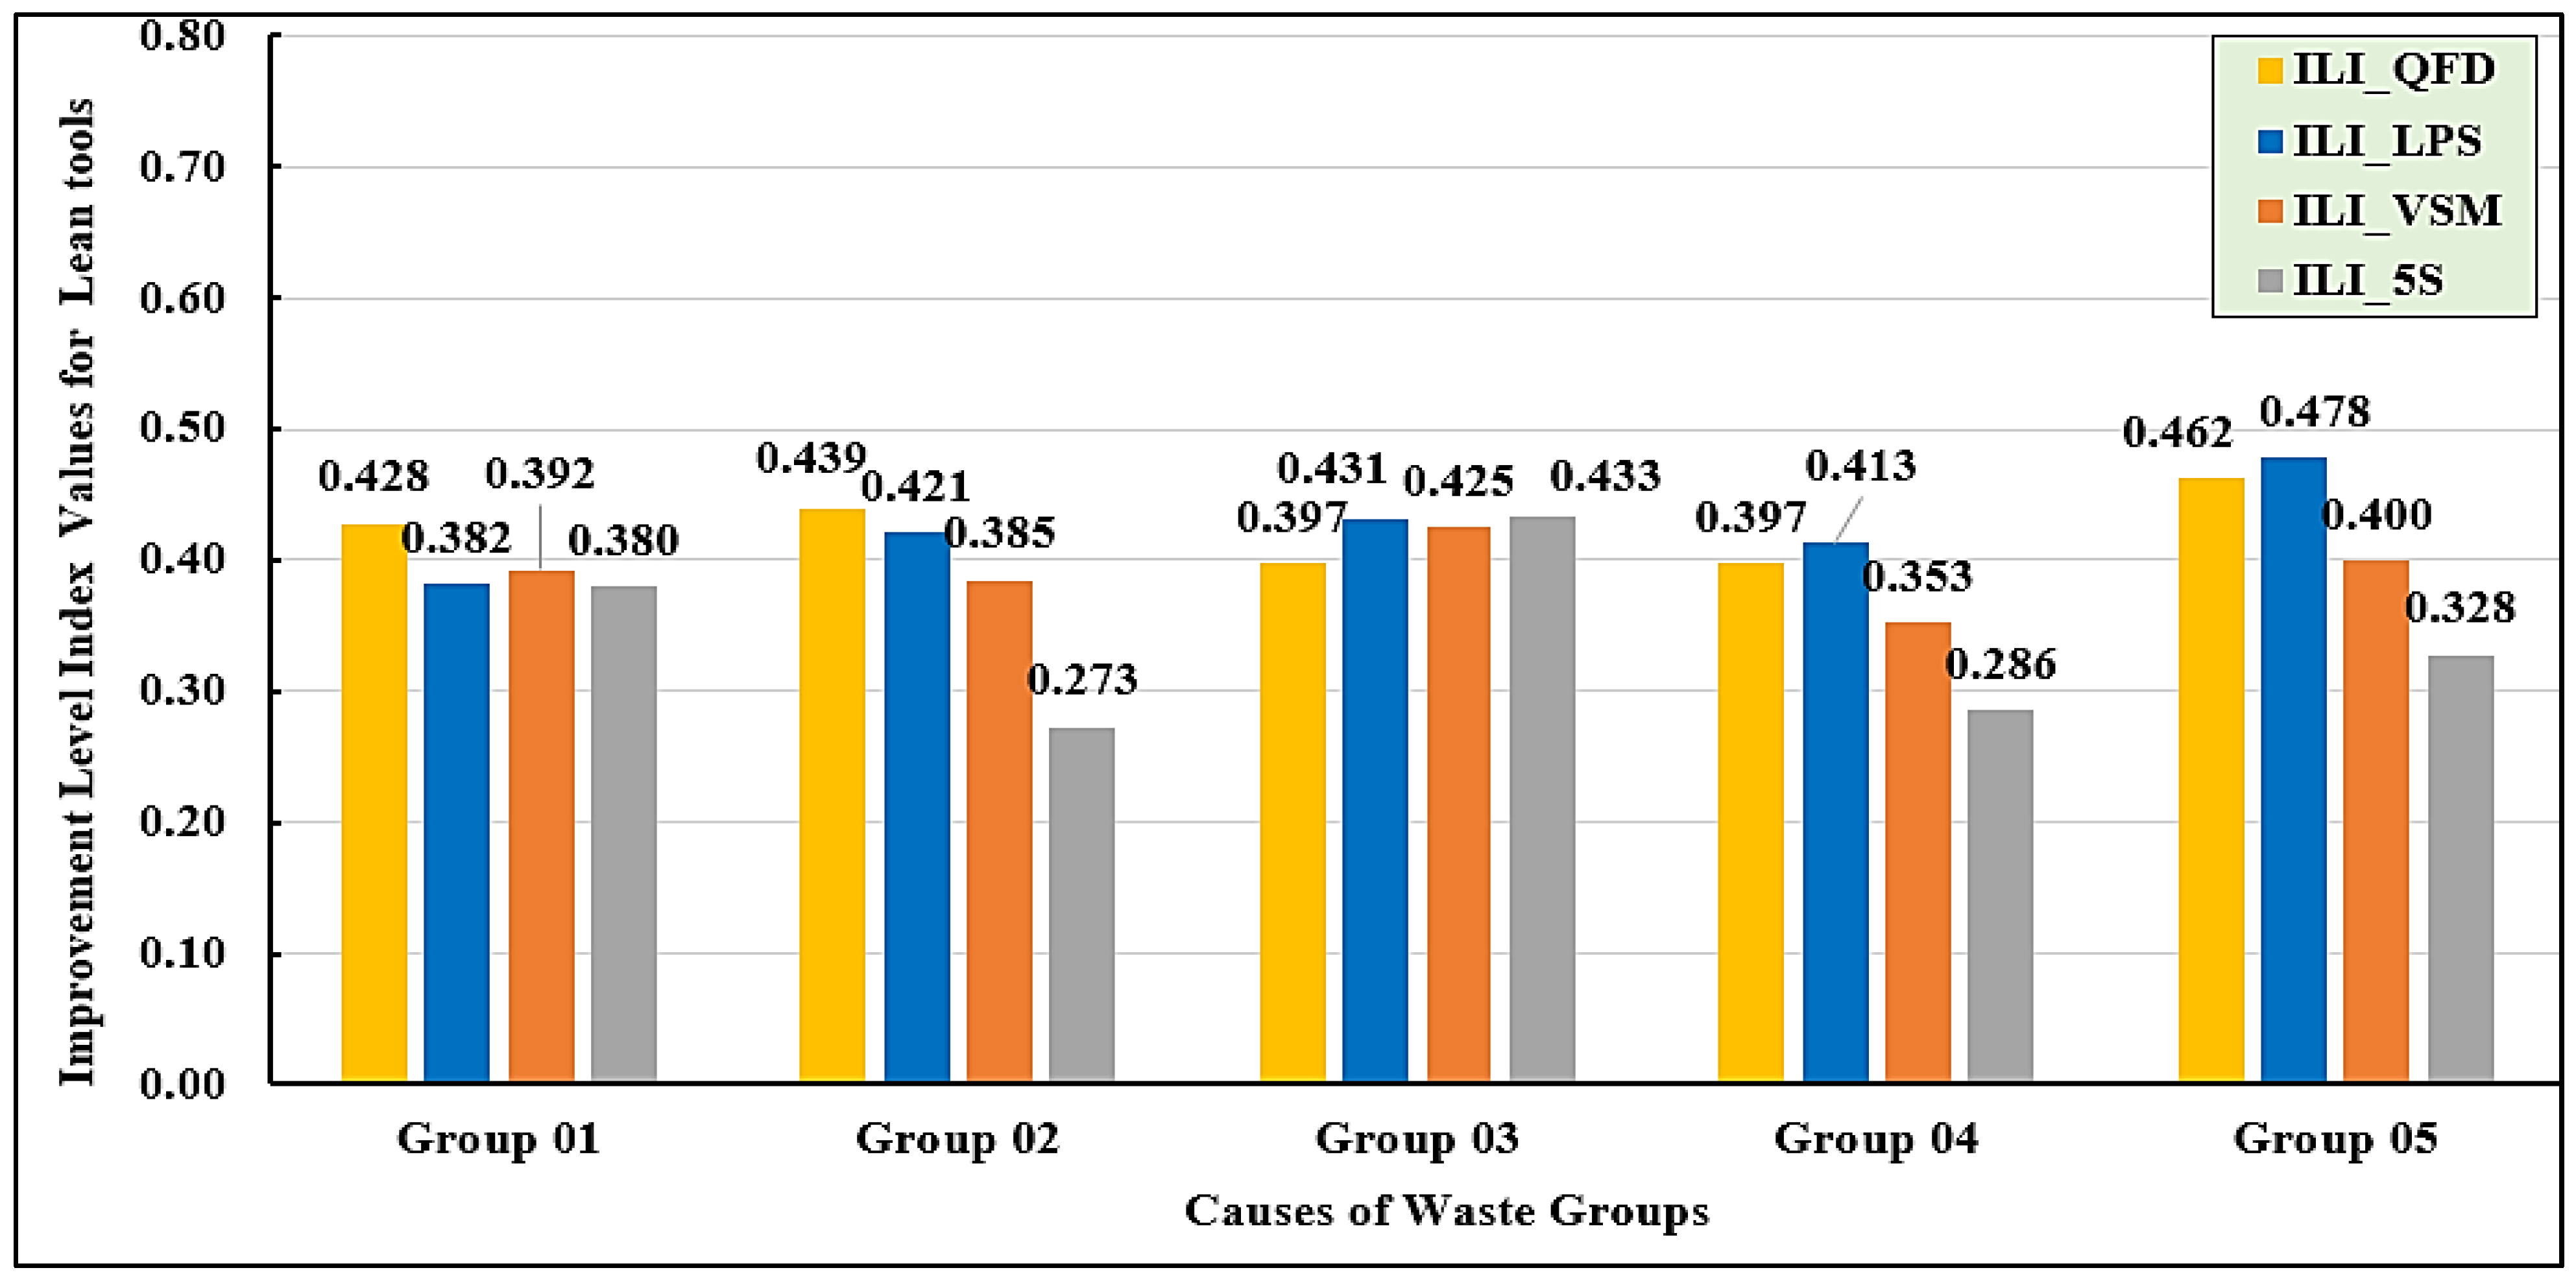
Figure 16 illustrates the average improvement level indices for each group across the four lean tools. Among the five groups, LPS and QFD consistently demonstrate higher improvement level indices compared to VSM and 5S. In Group 01, QFD emerges as the most effective tool, achieving the highest improvement level (ILI_QFD = 0.428), whereas 5S records the lowest (ILI_5S = 0.380). Similarly, in Group 02, QFD shows the highest improvement (ILI_QFD = 0.439), indicating its strong suitability for this group, while 5S again registers the lowest improvement level (ILI_5S = 0.273). For Group 03, both LPS and 5S achieve the highest scores (ILI_LPS = 0.431 and ILI_5S = 0.433, respectively), whereas QFD records the lowest value (ILI_QFD = 0.397). In Groups 04 and Groups 05, LPS demonstrates the highest improvement, highlighting its strong applicability within these groups, while 5S shows the least impact.
4.7. Analysis of Model Outputs According to Overall Average Improvement Level Indices
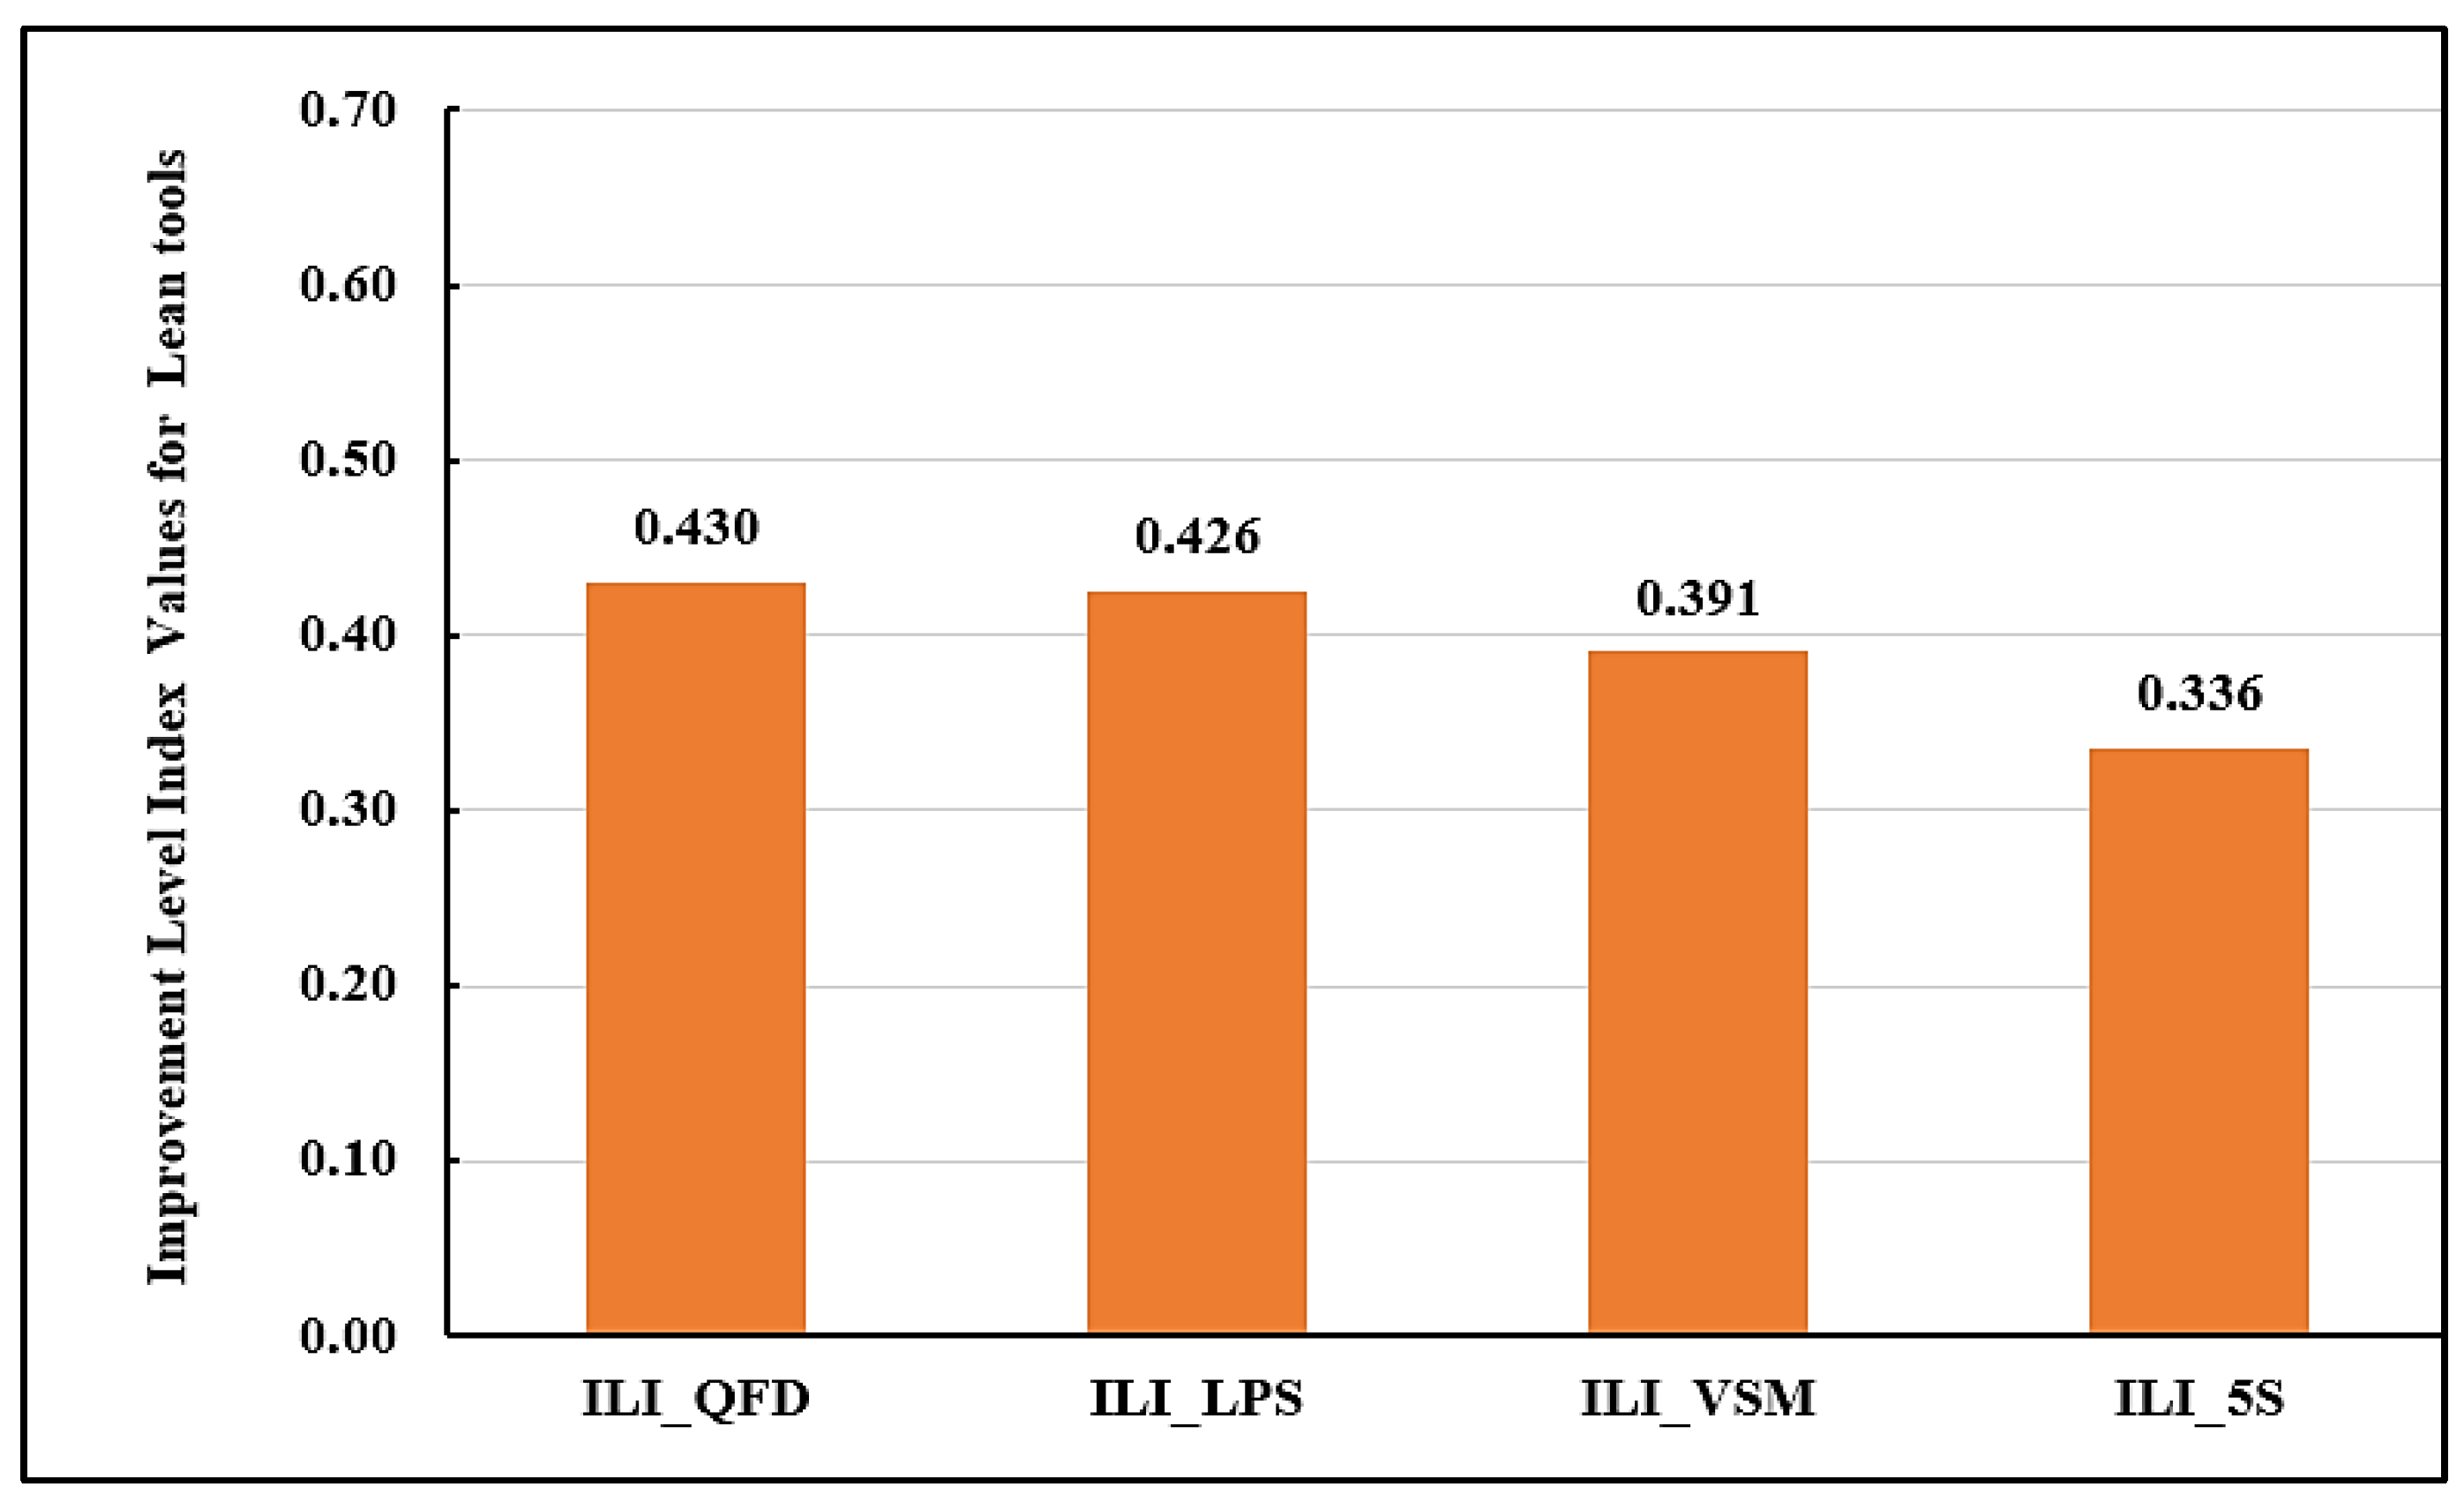
Figure 17 presents the overall average improvement level indices for each lean tool. QFD ranks highest (ILI_QFD = 0.430), closely followed by LPS (ILI_LPS = 0.426). In contrast, 5S records the lowest average improvement level (ILI_5S = 0.336).
Table 6 shows the percentage of improvements of each lean tool relative to the others. It has been observed that the improvement using QFD increases by 1.1% compared to LPS, 10% compared to VSM, and 28.20% compared to 5S. LPS demonstrates an improvement of 8.90% over VSM and 26.80% over 5S, while VSM outperforms 5S by 16.50%. These findings indicate that QFD and LPS are the most effective lean tools for minimizing causes of waste in GB projects, while 5S appears to have a limited impact and may be considered less applicable in this context.
4.8. Significant Causes of Waste
Table 7 shows the ranking of the top 10 most significant causes of waste according to the improvement level by lean tools. An analysis of the table reveals that approximately 38% of the selected causes of waste belong to Group 05 (green building stakeholders), highlighting the significance of this waste group. It has been observed that group 04 does not contain any of these significant causes of waste. There is a strong relationship between the improvement level by QFD and VSM, as they share five causes of waste. CW23 (poor assessment of site conditions before design, including hydrology, topography, soil, climate, and vegetation) is the most significant cause of waste, as it comes in the first rank with ILI_VSM, the second rank with ILI_QFD, and the third rank with ILI_LPS. Also, CW03 is considered a significant cause of waste as it occupies the second rank for ILI_VSM and the fifth rank for ILI_5S. It has been observed that CW13 is repeated with all indices except 5S index. Three causes of waste are repeated in both VSM and 5S indices, including CW08, CW25, and CW27. Two causes of waste are repeated with QFD and VSM indices, which are CW39 and CW41.
By comparing the results of the current study with a previous study conducted by the authors of this research [
66]. It can be observed that 9 out of 10 critical causes of waste according to GBWI, form the top 10 registers for all indices in this study.
Figure 18 shows a summary of the improvement level indices for the crucial causes of waste according to GBWI. The improvement level for these causes is found to be high when using QFD followed by LPS compared to other lean tools. It has been observed that the improvement level indices by LPS and VSM have a close impact on all the causes of waste, while the improvement level for 5S is quite low compared to other lean tools. CW23 is noted to have high value across all lean indices, excluding 5S tool. The improvement level indices by the four lean tools are found to be equal in CW03. This result signifies the importance of applying this model to mitigate the effect of the causes of waste in GB project in the Middle East.
The LMMCWE model evaluates the impact of lean tools on the identified causes of waste independently of certification level (e.g., LEED Silver, Gold, Platinum), and the indices (GBWI, II_QFD, II_LPS, II_VSM, II_5S, ILI_QFD, ILI_LPS, ILI_VSM, and ILI_5S) are therefore not directly sensitive to certification type. Nevertheless, the model outputs show that critical waste factors, such as those related to site assessment and waste management planning, and particularly the stakeholder group (Group 05), can be significantly improved through QFD and LPS. Although independent of certification grading in the analysis, the observed improvements correspond to areas emphasized in LEED criteria (e.g., site sustainability, waste management, and green building design). Thus, applying lean tools can strengthen waste management performance and, in practice, enhance project performance in ways that align with certification criteria, thereby increasing the likelihood of attaining higher-level green building certification.
Identifying poor assessment of site conditions as the most critical cause of waste reinforces existing findings emphasizing the importance of thorough site evaluation. For instance, Park et al. (2017) [
78] considers site assessment a key criterion in green building design, noting its influence on aspects like reuse potential and cost efficiency under the ‘sustainable site’ category. CW03, which refers to lacking a structured waste management plan, also aligns with recent literature. Salah et al. (2025) [
79] highlight that inadequate on-site waste planning, material accumulation, and insufficient worker training are among the leading drivers of construction waste. The result that stakeholder-related causes of waste account for 38% of key waste factors is well-aligned with the literature emphasizing the pivotal role of stakeholders in construction waste management. Islam et al. (2024) [
80] reviewed barriers to sustainable Construction and demolition (C&D) waste management, identifying ineffective stakeholder engagement as a major hindrance. Zhao (2021) [
81] identified predominant stakeholder-influenced drivers—such as regulatory context and attitudes that significantly shape waste outcomes in C&D. Furthermore, Shahid and Ali (2025) [
82] highlighted stakeholders’ crucial role within the circular economy frameworks for reducing construction waste. By linking the model’s outputs to these well-established insights, its validity is strengthened, showing that targeting site assessment, waste planning, and stakeholder engagement through lean tools such as QFD, LPS, VSM, and 5S is both validated and supported by prior research. Additionally, the Improvement Level Indices (ILI) provide a direct decision-support system, allowing project managers to prioritize mitigation actions based on the most critical waste factors.
