Article

Bridging the Cold Divide: Mapping and Mitigating Undercooling Inequities in Southern China’s Rural Homes

1
School of Architecture, South China University of Technology, Guangzhou 510641, China
2
School of Biological Science and Biotechnology, Minnan Normal University, Zhangzhou 363000, China
3
School of Architecture and Urban Planning, Guangzhou University, Guangzhou 510006, China
*
Author to whom correspondence should be addressed.
These authors contributed equally to this work.
Buildings 2025, 15(19), 3531; https://doi.org/10.3390/buildings15193531
Submission received: 22 August 2025 / Revised: 19 September 2025 / Accepted: 28 September 2025 / Published: 1 October 2025

Abstract

The risk of indoor undercooling during winter in rural southern China poses a significant challenge to health and equity, with substantial spatial disparities driven by climatic variation and the absence of heating infrastructure. This study quantifies undercooling risk and spatial inequity across 78 rural regions using Typical Meteorological Year (TMY), simulation-based analyses, with the Indoor Undercooling Hour (IUH), Indoor Undercooling Degree (IUD) and the Gini coefficient as key indicators. Results show that indoor undercooling in self-built rural dwellings is widespread, with the lower and middle reaches of the Yangtze River, the Yangtze River Delta, and high-altitude south-western regions being particularly affected. Marked inequities are observed, reflected by Gini values for IUH and IUD of 0.46 and 0.58, respectively. Pronounced disparities exist across regions in both undercooling risk and socio-economic and demographic conditions, with south-western regions experiencing heavier health inequities due to smaller populations and weaker economies. Passive retrofit strategies can substantially reduce undercooling; however, exclusive reliance on them may exacerbate inequity among regions. Accordingly, active measures, such as centralized heating, are recommended in high-risk areas to promote health and equity.

1. Introduction

Extreme climate events have become increasingly frequent worldwide against the backdrop of climate change [1]. Global studies indicate that prolonged exposure to extreme temperatures can overwhelm the human thermoregulatory and circulatory systems [2], exacerbating conditions such as cardiovascular diseases and cold-induced respiratory illnesses. A significant portion of temperature-related mortality is attributed to the contribution of cold [3]. Several studies have demonstrated the health risks of low temperatures across various climates and regions worldwide [4,5,6,7]. Furthermore, rural areas in developing countries face a heightened risk of cold-related health issues due to the combined effects of energy poverty [8] and lower thermal comfort standards [9].
Since the 1950s, China has provided centralized heating in northern regions, with the Qinling–Huaihe Line serving as the boundary between the north and south. The availability of centralized heating in the north may explain why temperature-related mortality rates are higher in southern China compared to the north [10]. Additionally, compared to urban housing, rural self-built houses in southern China exhibit poorer thermal stability during winter, resulting in lower indoor temperatures and higher humidity levels [11]. The combination of cold, damp climates and the lack of heating systems [12,13] leads to significant undercooling risks in the winter, posing considerable challenges to both public health and social equity.
Rural self-built houses are typically constructed using local materials, with no standardized building materials or construction methods, and lack insulation and heating systems [14]. As a result, their thermal performance and design standards are generally lower than those of urban buildings or buildings that adhere to residential thermal design codes. Key parameters, such as the thermal transmittance and air permeability of the building envelope often fail to meet thermal design standards, resulting in poor insulation and increased indoor undercooling risks. The climate in southern China is highly variable, spanning multiple climate zones. For instance, while temperatures in northeastern Sichuan are not as cold as in the north, the high humidity intensifies the perceived cold stress [15]. Guangzhou, a typical hot-humid region, often overlooks undercooling risks, which notably impact vulnerable groups during cold waves [16]. The lower and middle reaches of the Yangtze River experience lower temperatures and longer durations, making undercooling risks particularly pronounced. Moreover, under similar climatic conditions, the health risks to populations vary according to economic status, with high-income areas benefiting from better health awareness, healthcare access, and greater resources to improve indoor thermal environments, thereby reducing health risks [17]. The disparity in undercooling risks across southern rural households highlights the urgent need to quantify and mitigate differences in cold exposure.
Existing research on building energy simulations and thermal comfort in humid climates has established a foundational understanding [18,19,20]. For instance, D. Xia et al. analyzed thermo-moisture-coupled transfer in building envelopes under various boundary conditions and its effects on indoor comfort and energy use in hot-humid climates [21].These studies have examined the effects of humid climates on building energy consumption simulations and thermal comfort from multiple perspectives. However, the simulations primarily focus on urban areas and summer thermal comfort, with limited attention to winter undercooling in rural southern China. For example, E. Mushtaha demonstrated the impact of natural ventilation, shading devices, and insulation on improving building thermal environments [22]. However, these studies often focus on improving the thermal environment of regional buildings while neglecting the analysis of regional inequities.
Although global equity frameworks, such as the Gini coefficient have been widely applied in urban environmental studies, including areas such as transportation, public green spaces, and healthcare conditions, their application in rural cold exposure studies remains limited. For example, H. Yang et al. utilized this method to evaluate the spatial inequality of green spaces in megacities [23]; A. Raza et al. used it to study public transportation accessibility equity [24]; D. Liu et al. used it to measure inequality in primary healthcare accessibility under the 15 min city framework [25]. However, such frameworks have seen little application in the context of rural cold exposure. This gap necessitates large-scale simulations to assess the spatial disparities and the impact of interventions.
Despite its foundational contributions, current research offers limited systematic analysis of winter indoor undercooling risks and their associated inequities in rural areas of southern China, especially within the context of climate change. Most studies focus on urban environments, neglecting the climatic diversity, unique rural housing characteristics, and regional socioeconomic disparities in southern China. As a result, there is a lack of targeted analysis of risk variations across different rural areas. Additionally, existing work mainly emphasizes average indicators such as energy consumption and indoor temperature, often overlooking issues of social equity in cold exposure. The application of global equity frameworks to rural cold exposure remains scarce, which hampers effective identification and assessment of risks faced by vulnerable populations.
Therefore, current research lacks regional comparative analyses of undercooling risk in rural housing in southern China, effective evaluations of passive retrofitting measures for improving equity in rural cold exposure, and the practical application of global equity frameworks to rural cold exposure research. This study aims to address these gaps by employing large-scale simulations to quantify the spatial distribution of undercooling risk and its inequity in rural southern China. It will also assess the effectiveness of passive retrofitting strategies, such as improving insulation, airtightness, and window performance, in mitigating this inequity. The ultimate goal is to provide a basis for developing more targeted and equitable policies, thereby shifting the focus of research in this area from reducing average risk levels to prioritizing the protection of vulnerable populations and enhancing overall social equity.

2. Methods

This section details the methodology employed to assess undercooling risk and inequality in non-centrally heated rural areas of southern China. It also describes the proposed renovation strategies. The overall workflow of the study is illustrated in Figure 1. The research collated meteorological, economic, and demographic data for 78 non-centrally heated rural regions. A typical self-built house model, representative of these areas, was established. Three distinct renovation strategies were formulated as reference standards for comparison. A simulation model was developed using the Grasshopper parametric modeling platform, integrated with the Ladybug and Honeybee building performance simulation tools. The Standard Effective Temperature (SET) was adopted as the primary metric for undercooling risk, with Indoor Undercooling Hour (IUH) and Indoor Undercooling Degree (IUD) serving as specific risk indicators. The Gini coefficient was used to quantify equity. These measures were applied to evaluate the disparities in undercooling risk and equity before and after the implementation of the renovation strategies.

2.1. Study Area and Its Meteorological Characteristic

The study area covers non-centralized heating regions in southern China, including East China, South China, Southwest China, and the central-southern part of China, south of the Qinling–Huaihe Line (with the western Sichuan region excluded due to the higher prevalence of individual heating systems). The climate within the study area exhibits significant regional differences. Meteorological data were sourced from the Chinese Standard Weather Data (CSWD) set, which is generated from the Typical Meteorological Year (TMY) dataset [26]. The CSWD data are compiled from over a decade of reliable observations by the China Meteorological Administration.
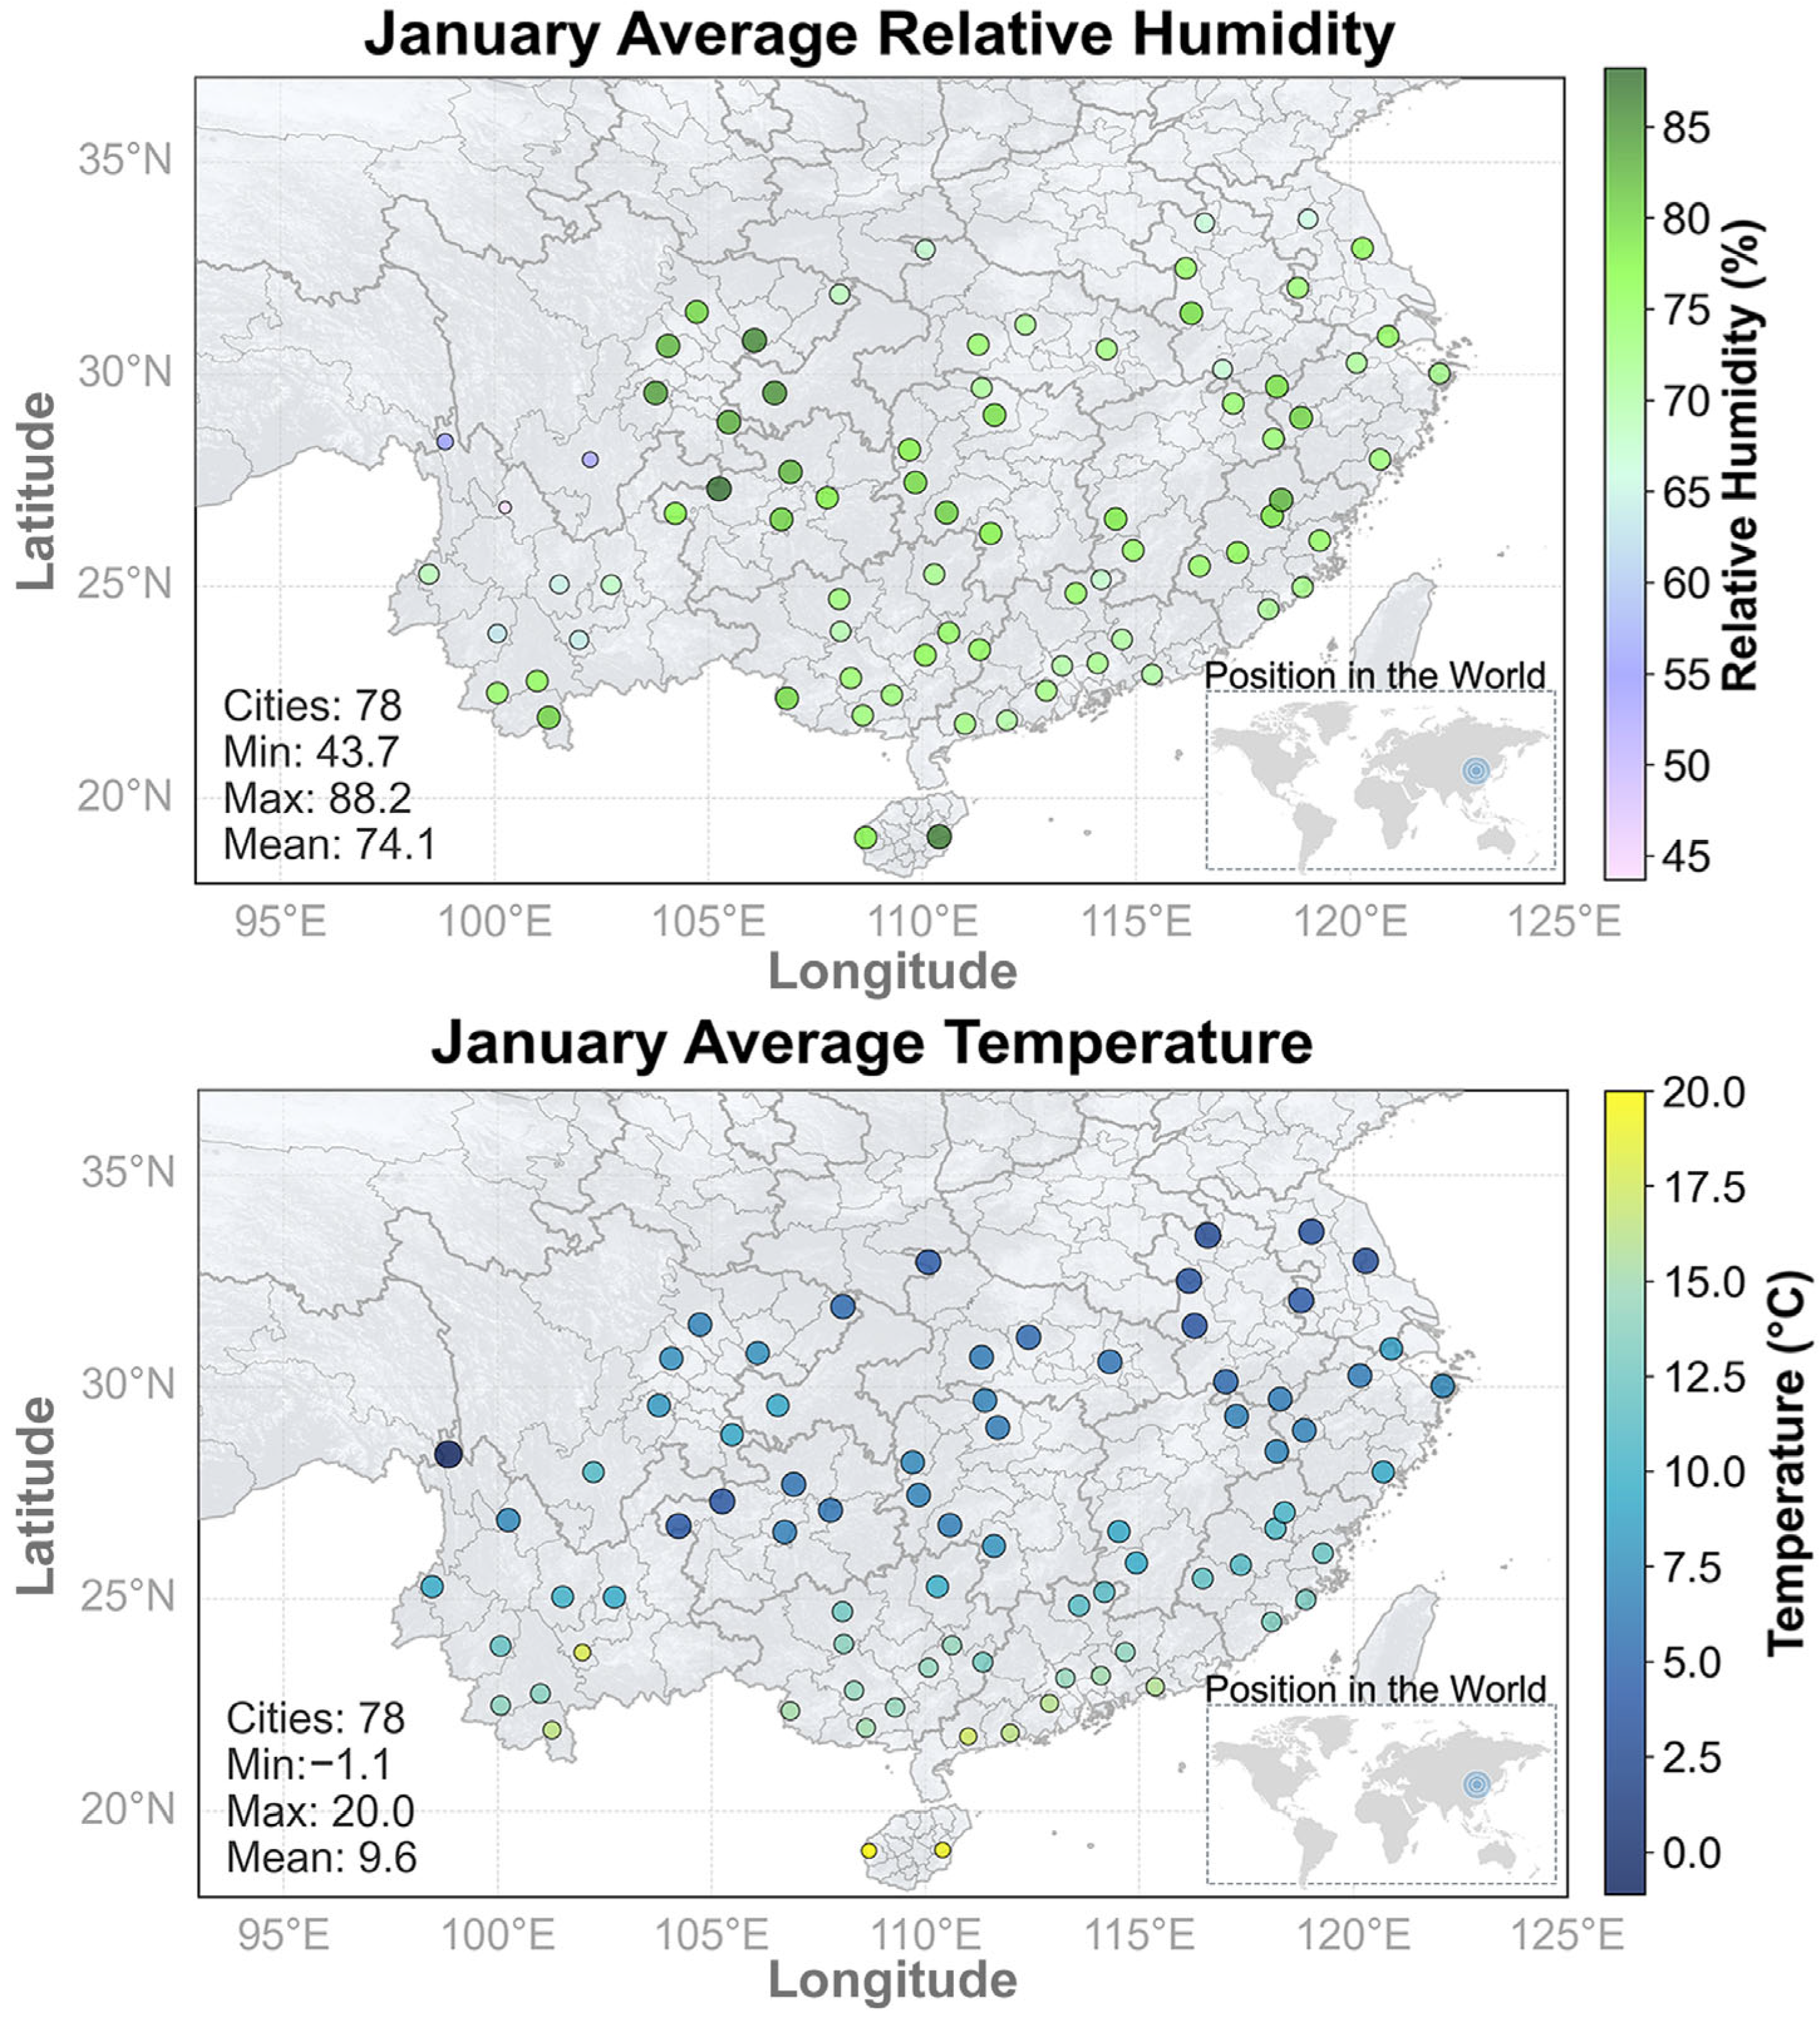
As depicted in Figure 2, the temperature in southern China’s non-centrally heated regions generally decreases from south to north, with a wide variation (–1 °C to 19 °C) and consistently high relative humidity. Barring a few extreme values, the relative humidity predominantly remains within the 70–80% range. In the southern coastal areas, the average temperature in January (the coldest month) is comparatively high, often exceeding 10 °C; however, the high relative humidity exacerbates the sensation of cold [27]. The Southwest region experiences generally lower temperatures, and due to its transition from basin to plateau, the terrain varies significantly, leading to drastic fluctuations in both temperature and humidity. As a result, the undercooling risk during winter is unevenly distributed. In the middle and lower reaches of the Yangtze River and the delta region, the latitude is higher, and the temperature is lower, typically remaining below 5 °C, with humidity around 70%, resulting in a high undercooling risk.
Furthermore, the study area is susceptible to extreme cold weather events. Even in regions generally considered warmer, such as Guangzhou, the minimum temperature dropped below 2 °C in 2014, 2016, and 2018 [28]. The eastern regions are more severely impacted by cold waves [29]. For instance, in Shanghai, between 2016 and 2020, there were 12 cold waves during which the temperature fell below 2.6 °C and persisted for more than two days, accumulating to a total of 41 days [30]. Given these significant climatic differences, applying a uniform building design standard for non-heated buildings could lead to considerable inequities in undercooling risk.

2.2. Economy and Population

Under similar climatic conditions, population size reflects the total demand for thermal resources, while economic status indicates the capacity to access these resources [31]. By integrating these two factors with undercooling indicators, it is possible to better identify the most vulnerable areas and understand the regional inequality of undercooling. This approach also helps to gauge the level of resource investment required for improvement. Therefore, data on rural permanent population and per capita disposable income were sourced from local government platforms. Per capita disposable income, which includes both cash and in-kind income, represents the total income available to rural households for final consumption and savings. Rural permanent population is defined as individuals residing in rural areas for six months or longer. Both are standard indicators for measuring regional demographic and economic conditions.

2.3. Typical Rural Residential Building

Rural self-built houses in the study area typically exhibit lower thermal performance than that mandated by national energy-saving standards, a result of economic constraints and local thermal adaptation practices [32]. These dwellings generally lack mechanical ventilation and air conditioning systems, with their indoor environments relying primarily on natural ventilation [33,34]. Moreover, in the humid southern regions, design focus is often placed on mitigating summer overheating risk [35], while the undercooling risk during cold waves receives insufficient attention [36]. According to surveys of rural residences in various locations, the main rooms of southern rural buildings mostly face south, employing traditional construction techniques and lacking modern insulation and thermal barrier designs [37]. The thermal insulation of the building envelope is typically poor; walls are mostly constructed from solid bricks with high thermal conductivity. Furthermore, the window-to-wall ratio is often large, frequently exceeding 50%. Windows are usually single-glazed, with frames primarily made of aluminum and wood. In addition, noticeable gaps around door and window frames lead to high rates of air infiltration [38]. The high humidity of southern winters can cause condensation on the building envelope, resulting in indoor temperatures that frequently fall below the comfort threshold [39]. During cold waves, these rural self-built houses are generally ill-equipped to provide adequate thermal protection, posing health risks to residents [16,40].
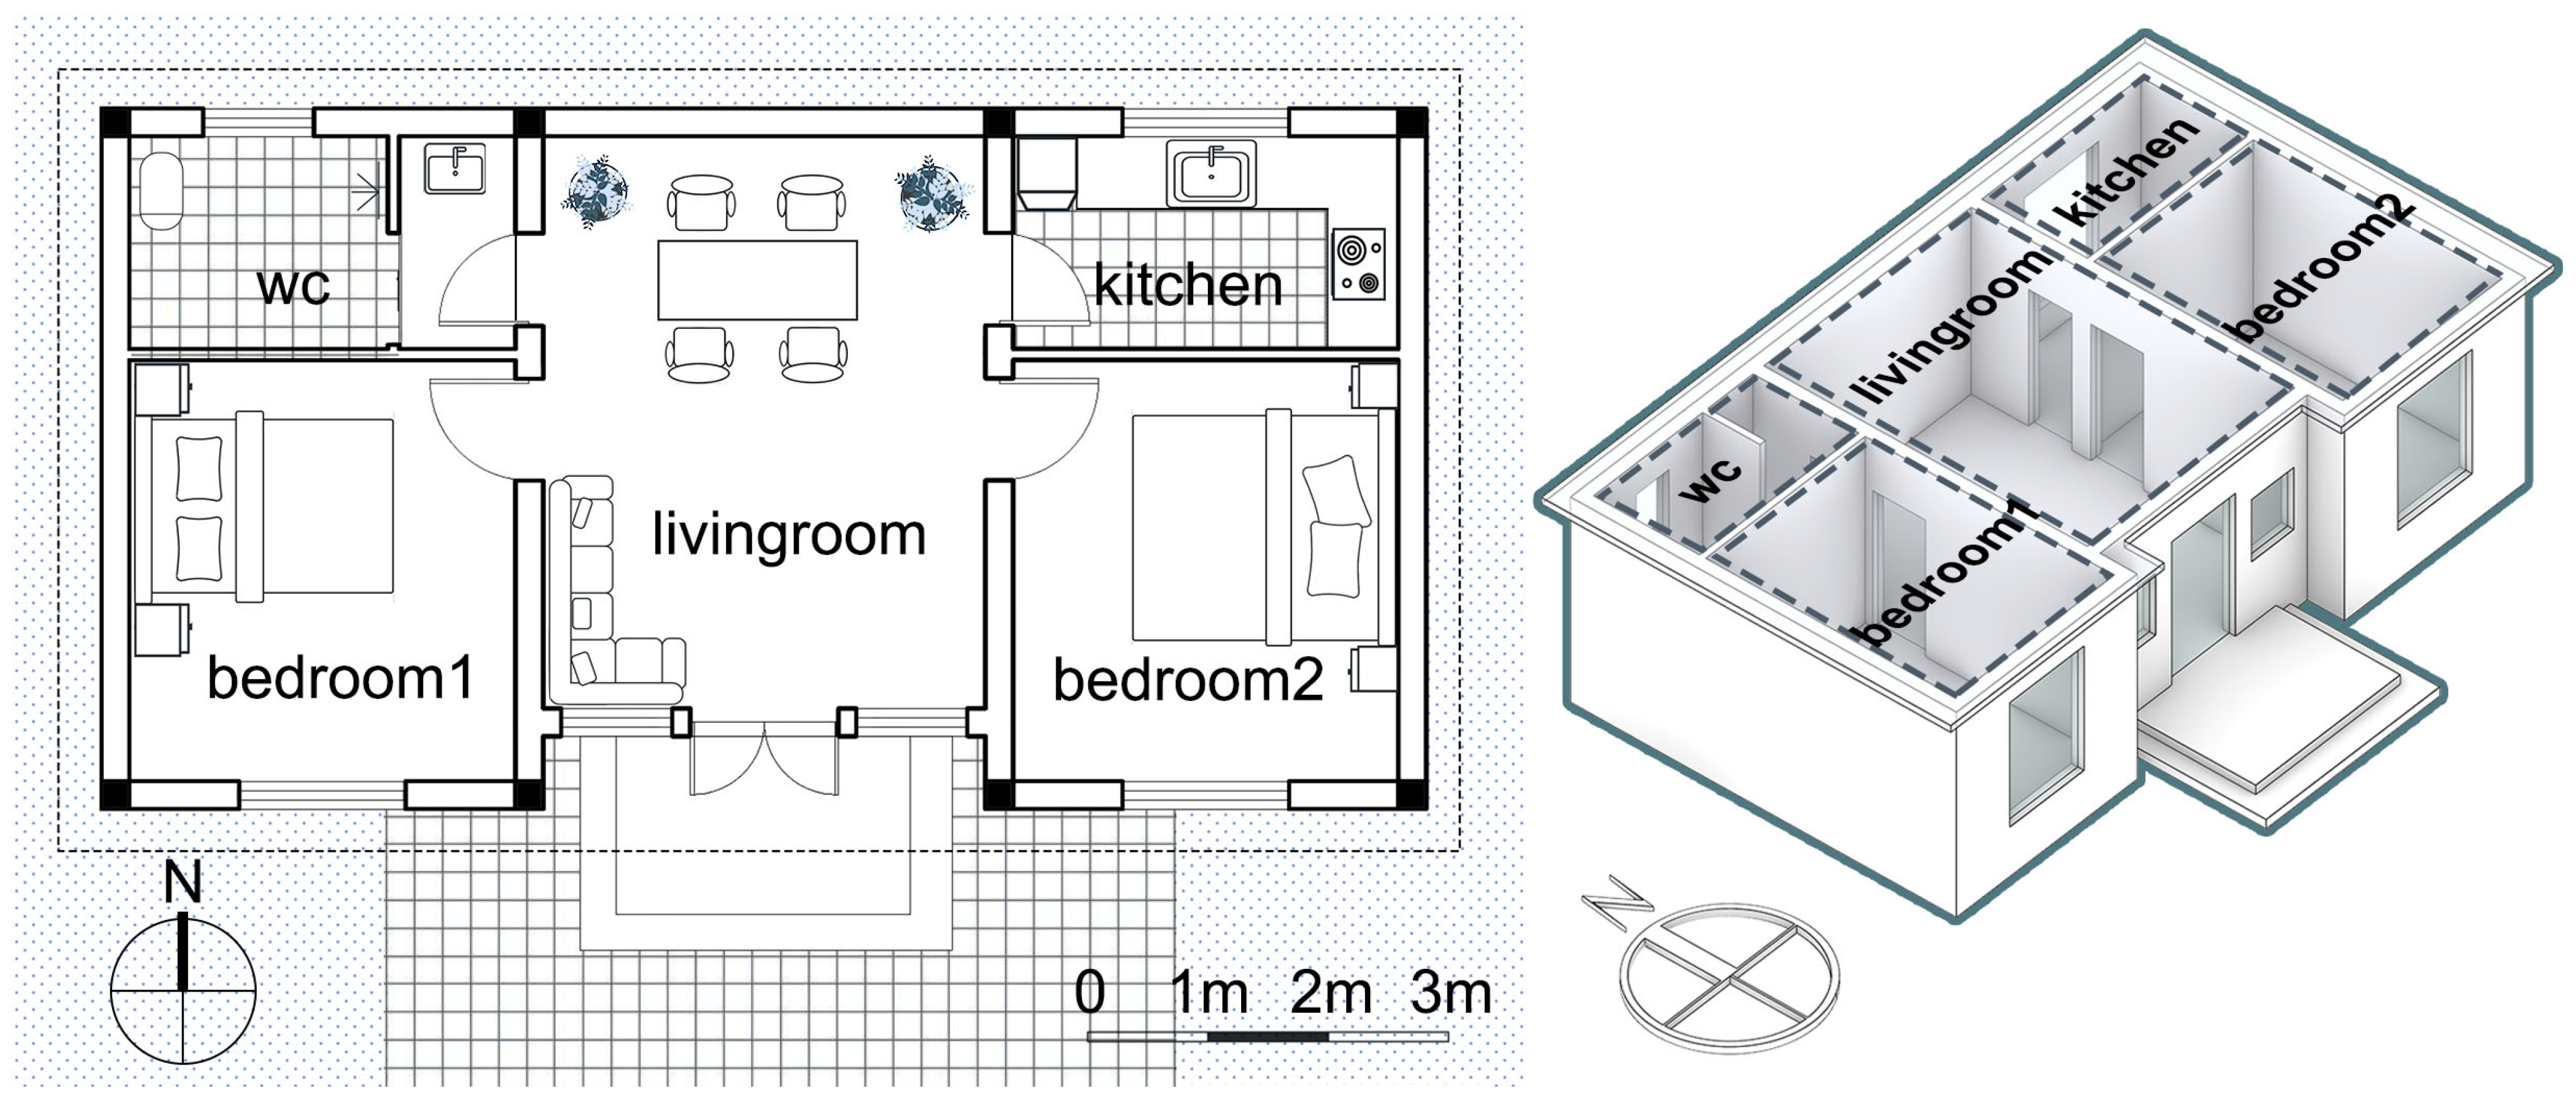
To accurately represent these conditions, the building simulation was conducted assuming natural ventilation and no active heating. The building prototype represents a common, modern type of rural self-built house in southern China, based on a review of relevant literature. While this prototype does not capture the full diversity of rural housing types, particularly older, traditional homes, focusing on this modern prototype is justified because it represents a growing trend in rural housing construction. A typical southern Chinese self-built house model was developed (Figure 3), with its dimensions and thermal parameters based on the Code for Thermal Design of Civil Buildings (GB 50176-2016) [41] and findings from field surveys in rural areas. The two bedrooms have equal areas. The areas of the kitchen, bathroom, bedroom, and living room are 6.8 m2, 6.8 m2, 12.24 m2, and 21.84 m2, respectively. The thermal parameters of the building envelope are uniform: walls are 240 mm thick concrete brick (U-value = 2.5 W/m2∙K), and windows are 6 mm single-glazed ordinary transparent glass with metal frames (U-value = 5.7 W/m2K; Solar Heat Gain Coefficient (SHGC) = 0.6), with fifty percent operable area. The occupancy schedules used in the simulation were based on surveys of rural residents’ time use, which indirectly reflects some cultural practices.
After all necessary parameters were collected, the simulation model was constructed using the Grasshopper parametric modeling platform in Rhino 7. The simulation was executed using the Ladybug and Honeybee tools [42] along with the simulation engine EnergyPlus [43]. The CSWD data from the 78 different regions were input into the model to compare the thermal environment differences across these areas.

2.4. Retrofit Strategies

A primary cause of winter undercooling in southern rural self-built houses is the lack of insulation and inadequate thermal resilience against cold waves [44]. Based on the characteristics of the building envelope, such as high thermal conductivity, high permeability, and poor window performance, we propose targeted improvements. A moderate retrofit strategy was designed in accordance with the Code for Thermal Design of Civil Buildings (GB 50176-2016), balancing performance improvement with economic feasibility. For the building envelope, a 30 mm thick extruded polystyrene (XPS) foam board layer (thermal conductivity = 0.030 W/m2∙K) was added for insulation. The original single-glazed windows were replaced with double-glazed units, consisting of two 6 mm layers of ordinary transparent glass with a 12 mm air gap. To improve airtightness, doors and windows were upgraded to achieve a technical grade of Level 7, reducing the air infiltration rate (q2) to 2 m3/(m2∙h). These measures were intended to enhance the self-built house’s adaptation to winter undercooling.

2.5. Key Indicators

2.5.1. Undercooling Criteria

To comprehensively assess the undercooling risk in rural self-built houses, it is necessary to consider both the frequency and severity of undercooling events [45].
Thermal resilience in buildings is defined as the capacity to withstand, adapt to, and recover from extreme weather events, thereby ensuring safe and comfortable indoor conditions for occupants [46]. In this study, Standard Effective Temperature (SET) [47], a key indicator of thermal resilience for both hot and cold events, was chosen as the measure of undercooling risk. SET integrates indoor dry-bulb temperature, relative humidity, mean radiant temperature, air velocity, occupant metabolic rate, and clothing level. It is a long-standing component of the ASHRAE Thermal Comfort Standard 55 [36] and is widely used to assess thermal resilience performance during extreme events [33,48]. According to the LEED V4.1 standard for passive survivability and backup power during power outages [49], “extreme cold” is defined by an SET below 12.2 °C (54 °F). This value was therefore adopted as the lower comfort temperature threshold for evaluating indoor undercooling risk.
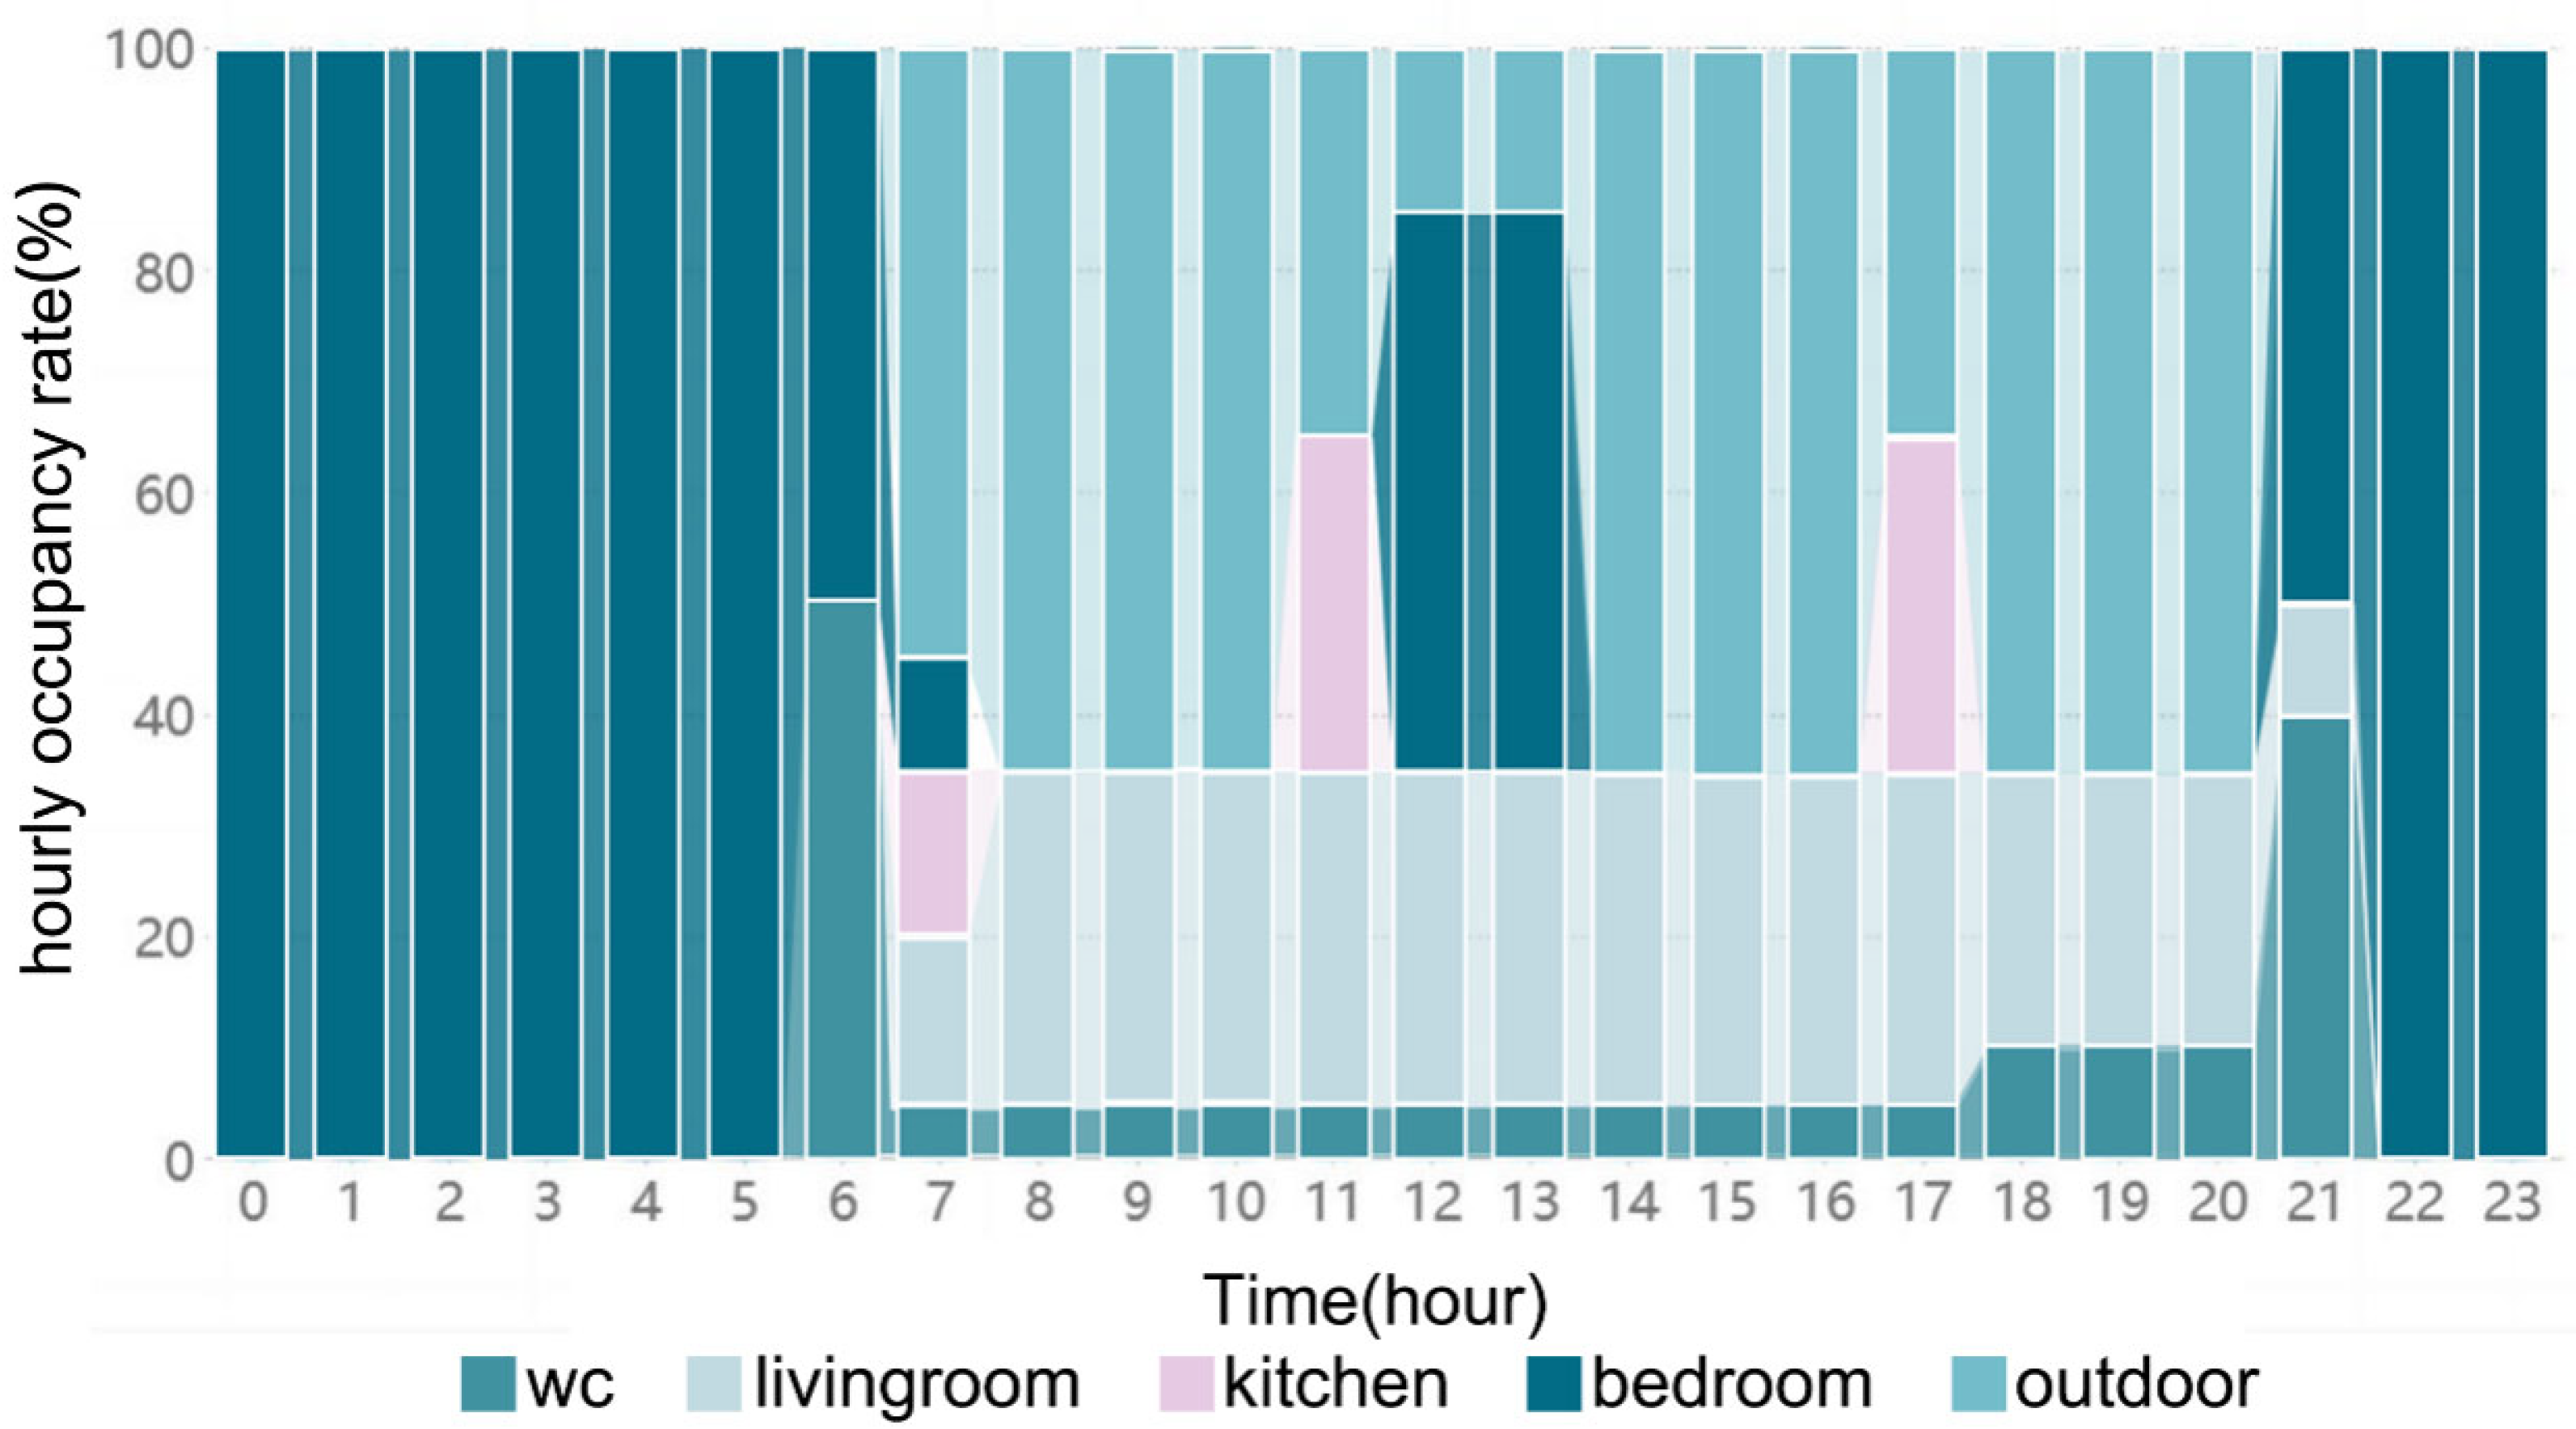
Based on the Communique on China’s Third National Time Use Survey [50,51], the primary activity durations and participation rates of rural residents were used to estimate room occupancy rates. Considering that people tend to gather indoors during cold events, activities were allocated across different rooms. The bedroom is primarily for sleep, accounting for approximately 10 h per day. The living room accommodates leisure, family care, and most dining activities, for an estimated 6.15 h. The kitchen is used for food preparation and some dining for about 1.25 h, while the bathroom is used for personal hygiene for around 1.15 h. A further 5.5 h are allocated to outdoor activities such as work or study. The detailed hourly occupancy rates are shown in Figure 4.
To quantify the duration of indoor undercooling, this study introduces the Indoor Undercooling Hour (IUH), analogous to the widely used Indoor Overheating Hour (IOH) metric [52]. IUH measures the cumulative time annually when the indoor SET falls below the safety threshold. The criteria and calculation logic for IUH are as follows:
I U H = z = 1 Z i = 1 N O C C Z u h × t i , z
u h = 1 , Max T L S E T , i , z S E T i , z , 0 > 0 0 , else
While the IUH indicator assesses the frequency of undercooling, it does not capture its severity. To address this, the study proposes the Indoor Undercooling Degree (IUD), conceptually similar to the Indoor Overheating Degree (IOD) [43] developed by Hamdi et al. IUD quantifies the cumulative magnitude by which the SET drops below the 12.2 °C threshold. The criteria and calculation logic for IUD are as follows:
I U D = z = 1 Z i = 1 N O C C Z T L S E T , i , z S E T i , z + s · t i , z
The key variables are shown in Table 1.

2.5.2. Gini Coefficient

The Gini coefficient [53] was originally developed as an indicator to measure the fairness of income distribution among the residents of a country or region [54]. Compared to other inequality indicators (such as the Theil index or coefficient of variation), the Gini coefficient’s advantage lies in its relative simplicity and ease of interpretation. It is particularly well-suited for assessing relative inequality, as it focuses on the distribution of resources across the entire population. It is now commonly applied in diverse fields such as transport [55], healthcare [56], and ecological green spaces [57]. The Gini coefficient calculation is based on the Lorenz curve [56], with values ranging from 0 to 1. A value of 0 signifies absolute equality, whereas a value of 1 indicates absolute inequality. Referring to relevant research in the energy sector, a Gini coefficient above 0.4 is often considered indicative of significant inequity [58], with values above 0.5 representing substantial inequity. In this study, the horizontal axis of the Lorenz curve represents the cumulative percentage of the population, while the vertical axis represents the cumulative percentage of undercooling duration (IUH) and undercooling degree (IUD). The calculation logic is as follows:
G i n i H = 1 i 1 n P i P i 1 × H i + H i 1
G i n i D = 1 i 1 n P i P i 1 × D i + D i 1
The key parameters are shown in Table 2.

3. Results

3.1. Indoor Undercooling Risk in Rural Areas of Southern China

The assessment of indoor undercooling risk and its associated inequity in rural, self-built houses across the non-centralized heating areas of southern China commenced with the SET. By integrating room occupancy data, the IUH and IUD were quantified to measure this risk. To clearly illustrate the distribution of undercooling temperatures and durations, data points from 78 regions were ordered by ascending IUH and categorized into four quartiles (Low, Medium, High, Highest). The geographical distribution and corresponding IUH/IUD values for each group are presented in Figure 5.
The spatial distribution of IUH reveals a clear latitudinal gradient, with undercooling risk generally increasing from south to north (Figure 5). This trend aligns with the expected decrease in winter temperatures at higher latitudes. However, the southwest region exhibits significant localized variations, likely due to the complex topography and microclimates of the area. The ‘Highest’ risk group is concentrated near the Qinling–Huaihe Line, the traditional dividing line between heated and unheated regions in China. This highlights the potential need for transitional policies. The disproportionate increase in IUD as IUH rises suggests that colder regions not only experience longer durations of undercooling but also more severe temperature deficits, potentially exacerbating health risks
Hourly undercooling analysis, based on the median city of each group (Figure 6), identifies the period between 18:00 and 06:00 as the most vulnerable. During these hours, residents are typically indoors, primarily in bedrooms and living rooms. The risk is lower between 12:00 and 18:00, when outdoor activities are more common. This underscores the necessity of addressing undercooling in bedrooms and living rooms.
The severity and timing of undercooling vary markedly by location. From Guangzhou to Jingzhou, the frequency and duration increase, with the lowest recorded SETs falling from 7 °C to 5 °C. In Guangzhou, undercooling spans late November to early March, concentrated in January. In Leshan, the period extends to late March, while in Xiangxi it is more pronounced, lasting from late October to late April. Jingzhou experiences the most acute undercooling, lasting from early October to mid-May. There, from December to March, multiple monthly occurrences of all-day undercooling are common, and nighttime temperatures are predominantly below the threshold.

3.2. Economy, Rural Population, and Undercooling Situation

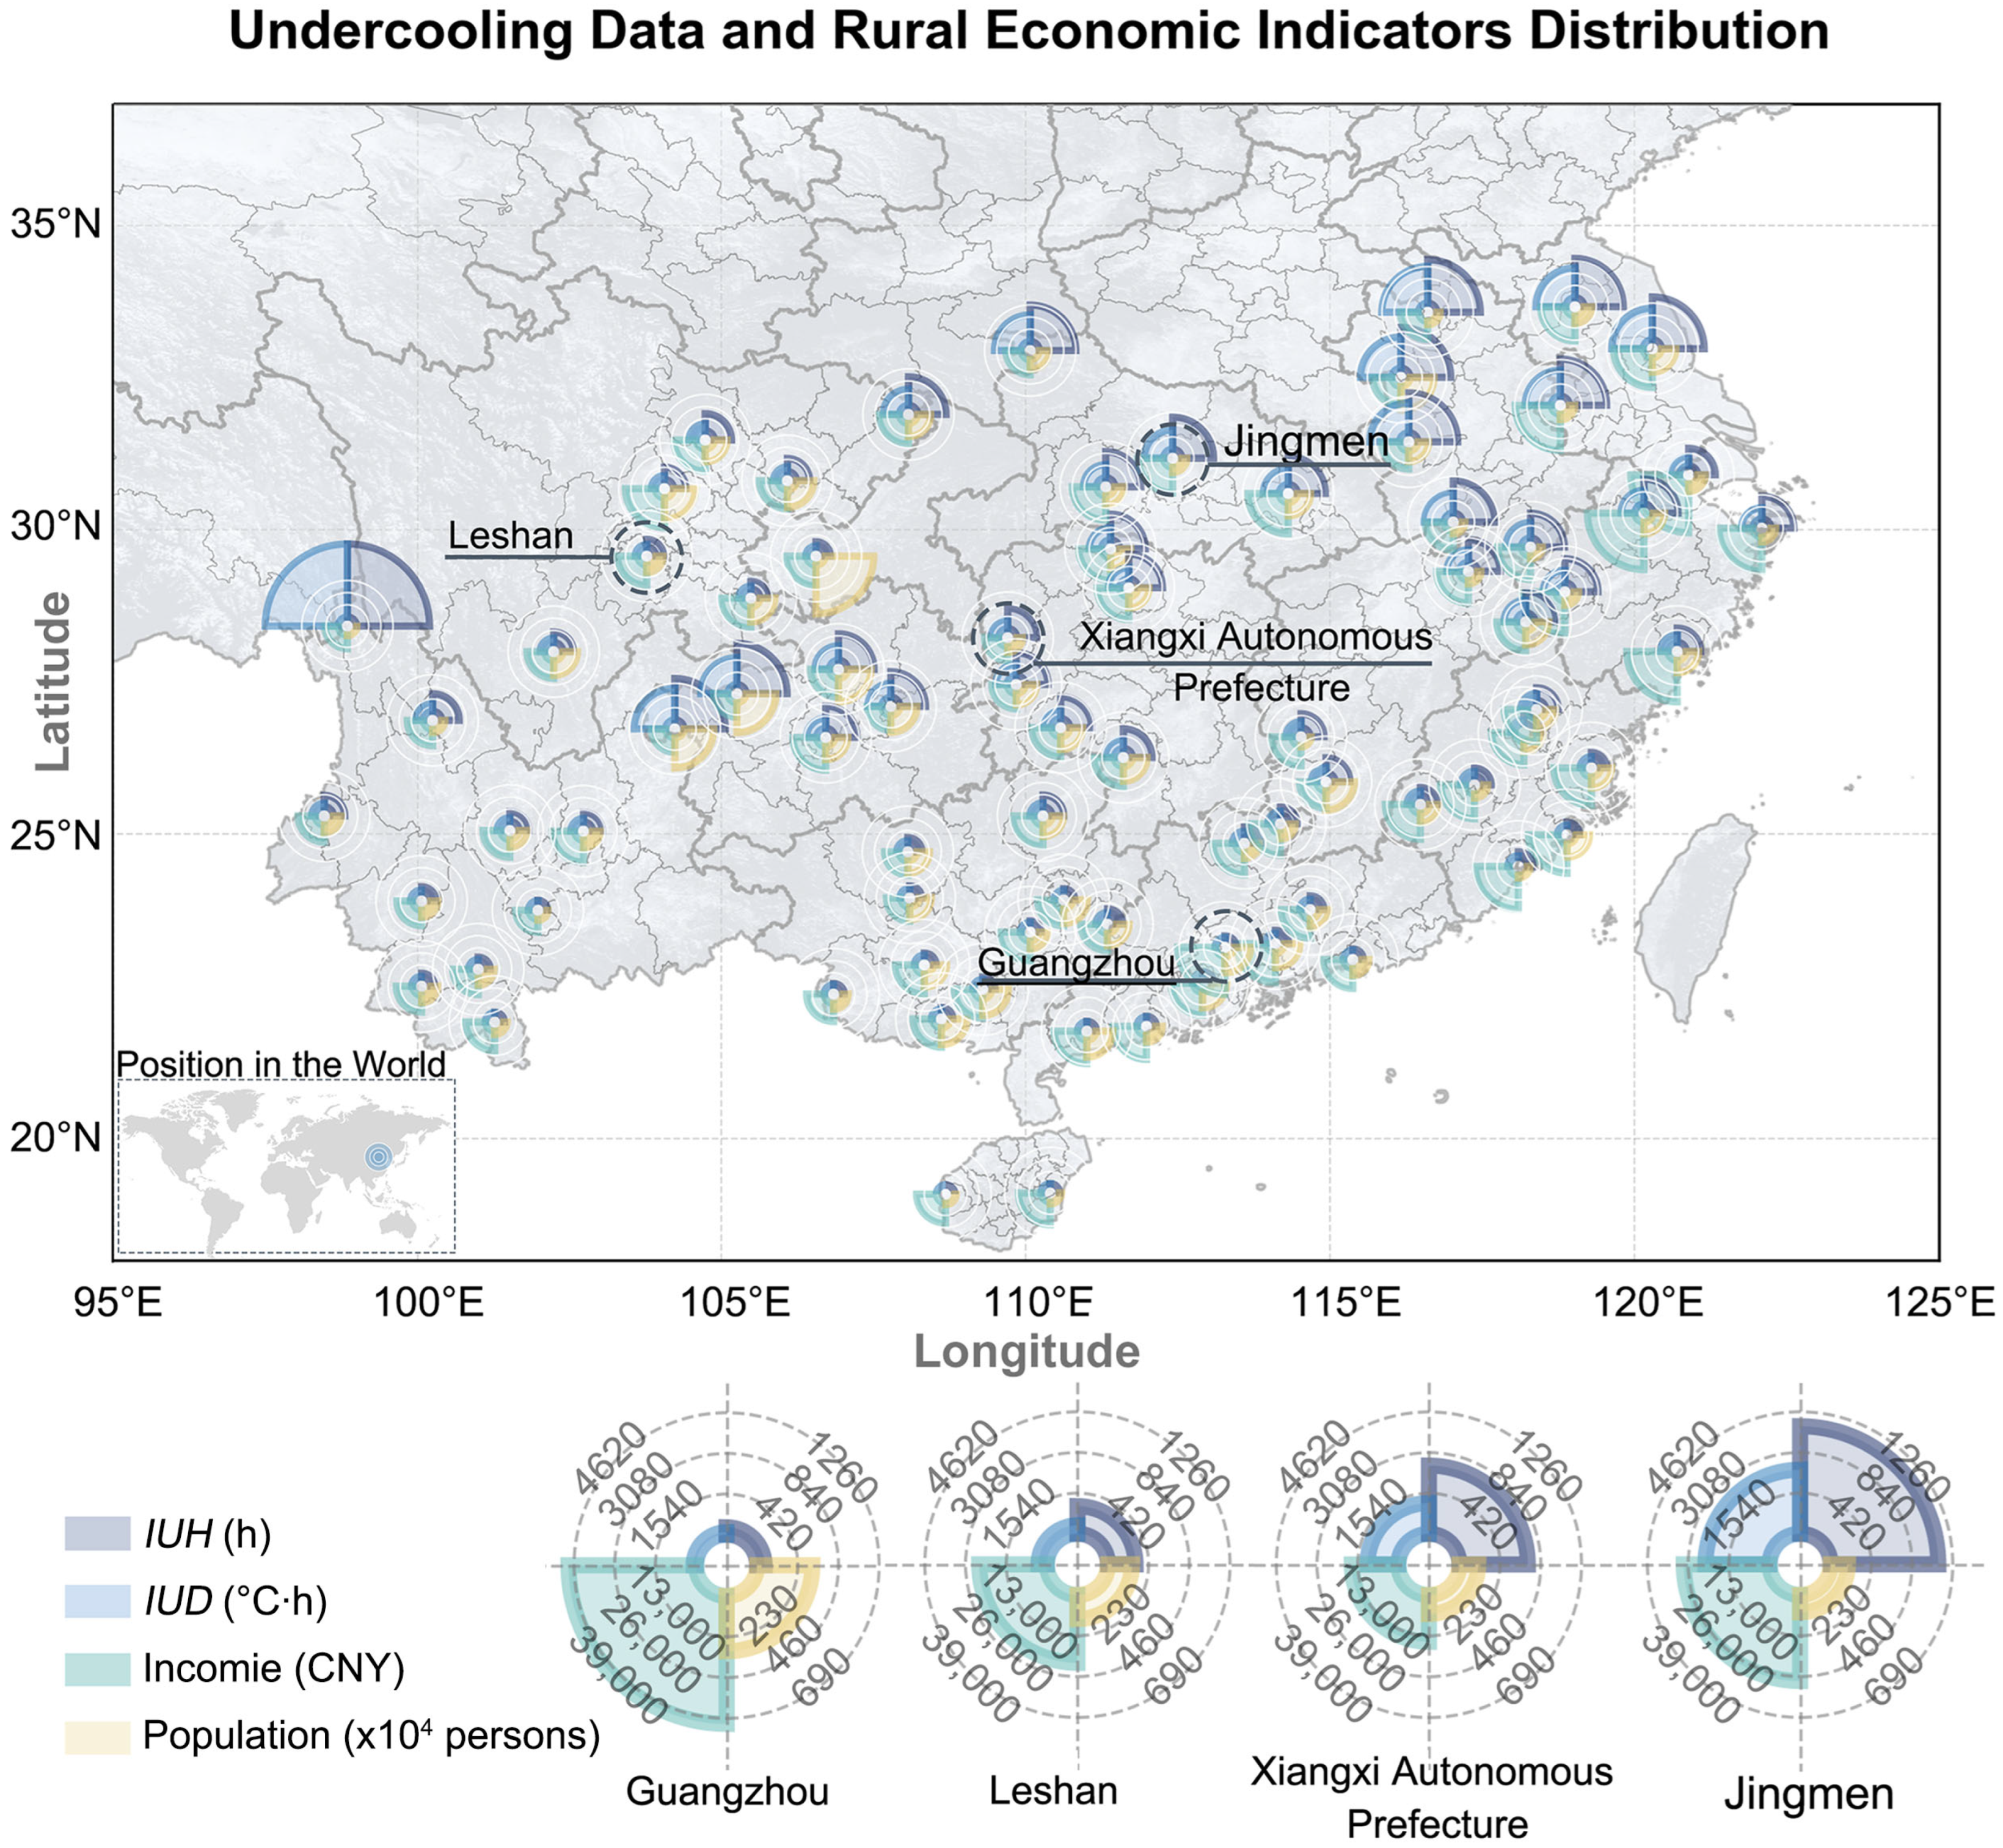
A comparison of rural permanent population, per capita disposable income, and undercooling indicators across different regions is shown in Figure 7. Jiaxing, Zhejiang, has the highest per capita disposable income, reaching 52,200 RMB, while Diqing Tibetan Autonomous Prefecture in Yunnan has the smallest rural population and the lowest per capita disposable income, which is just 14,500 RMB. Despite these differences, Diqing has the highest IUH (2506 h) and IUD (9263 °C·h), with the most severe undercooling risk in the region. This highlights the vulnerability of economically disadvantaged communities to climate-related risks.
In eastern regions, undercooling risk and economic conditions change in a relatively uniform manner. Although winter temperatures decrease northward, higher average incomes provide a greater capacity for residents to adapt their indoor thermal environments, partially mitigating the risk. In contrast, western regions exhibit greater variability in climate, population distribution, and economic status, leading to higher vulnerability. While areas like eastern Sichuan and most of Yunnan have relatively low undercooling risk, the high-altitude central areas face a dual burden of severe undercooling and poor economic conditions, which hinders adaptation and exacerbates inequity.
Detailed analysis of Guangzhou, Leshan, Xiangxi Autonomous Prefecture, and Jingzhou reveals significant disparities in both economic conditions, population, and undercooling risks, resulting in highly uneven levels of undercooling inequity. Guangzhou, as a prosperous capital city with a per capita disposable income exceeding 40,000 RMB and a rural population of over 3 million, exhibits minimal undercooling risk, reflected in low IUH and IUD values, largely due to its strong economic capacity for climate adaptation. On the other hand, Xiangxi Autonomous Prefecture and Jingzhou, with much lower per capita disposable incomes, face more severe undercooling risks, with undercooling durations over 700 h and degrees exceeding 1000 °C∙h. The combination of low economic status and significant undercooling exposure exacerbates the risk. These areas face significant undercooling inequity, where lower incomes limit the ability to mitigate these risks, intensifying the disparity in thermal comfort across regions.
In conclusion, a fundamental imbalance exists between regional economic conditions, population distributions, and undercooling severity. A key pattern is the east–west divide: wealthier eastern regions can largely mitigate temperature risks through economic means, while western regions often cannot. Geographically, undercooling risk intensifies northward and is particularly acute in the high-altitude areas of the west and regions approaching the Qinling–Huaihe Line. Ultimately, this creates a landscape of significant inequity, where poorer economic conditions in the most climate-vulnerable inland regions severely hinder adaptation, exacerbating the disparities in thermal comfort and well-being.

3.3. Equity Assessment

To assess the inequity in undercooling risk within rural, non-heating regions of Southern China, we employed Lorenz curves and Gini coefficients to analyze the distribution of key undercooling indicators. As illustrated in Figure 8, the degree to which the Lorenz curve deviates from the line of perfect equality directly reflects the inequity in the distribution of undercooling risk [59].
The Lorenz curves demonstrate a significant inequity in the distribution of undercooling risk. The G i n i H (0.4602) indicates a considerable level of inequality, with the highest-risk 10% of the population bearing 50% of the total undercooling hours. This disparity suggests that certain segments of the rural population are disproportionately exposed to the health burdens associated with undercooling.
The inequity is even more pronounced for IUD. Its curve displays a deeper concavity, and its Gini coefficient of 0.5843 falls within the highly inequitable range, signaling severe inequity. Analysis shows that the lowest risk 40% of the population is exposed to a mere 6% of the total undercooling degree, while the highest risk 10% bears an overwhelming 60%.
In summary, both the Lorenz curves and Gini coefficients unequivocally demonstrate that the burden of undercooling in these rural regions is distributed with significant inequity across the population. Furthermore, this analysis highlights that the inequity in IUD is substantially more severe than that in IUH.

3.4. Post-Renovation Undercooling Indicators and Fairness

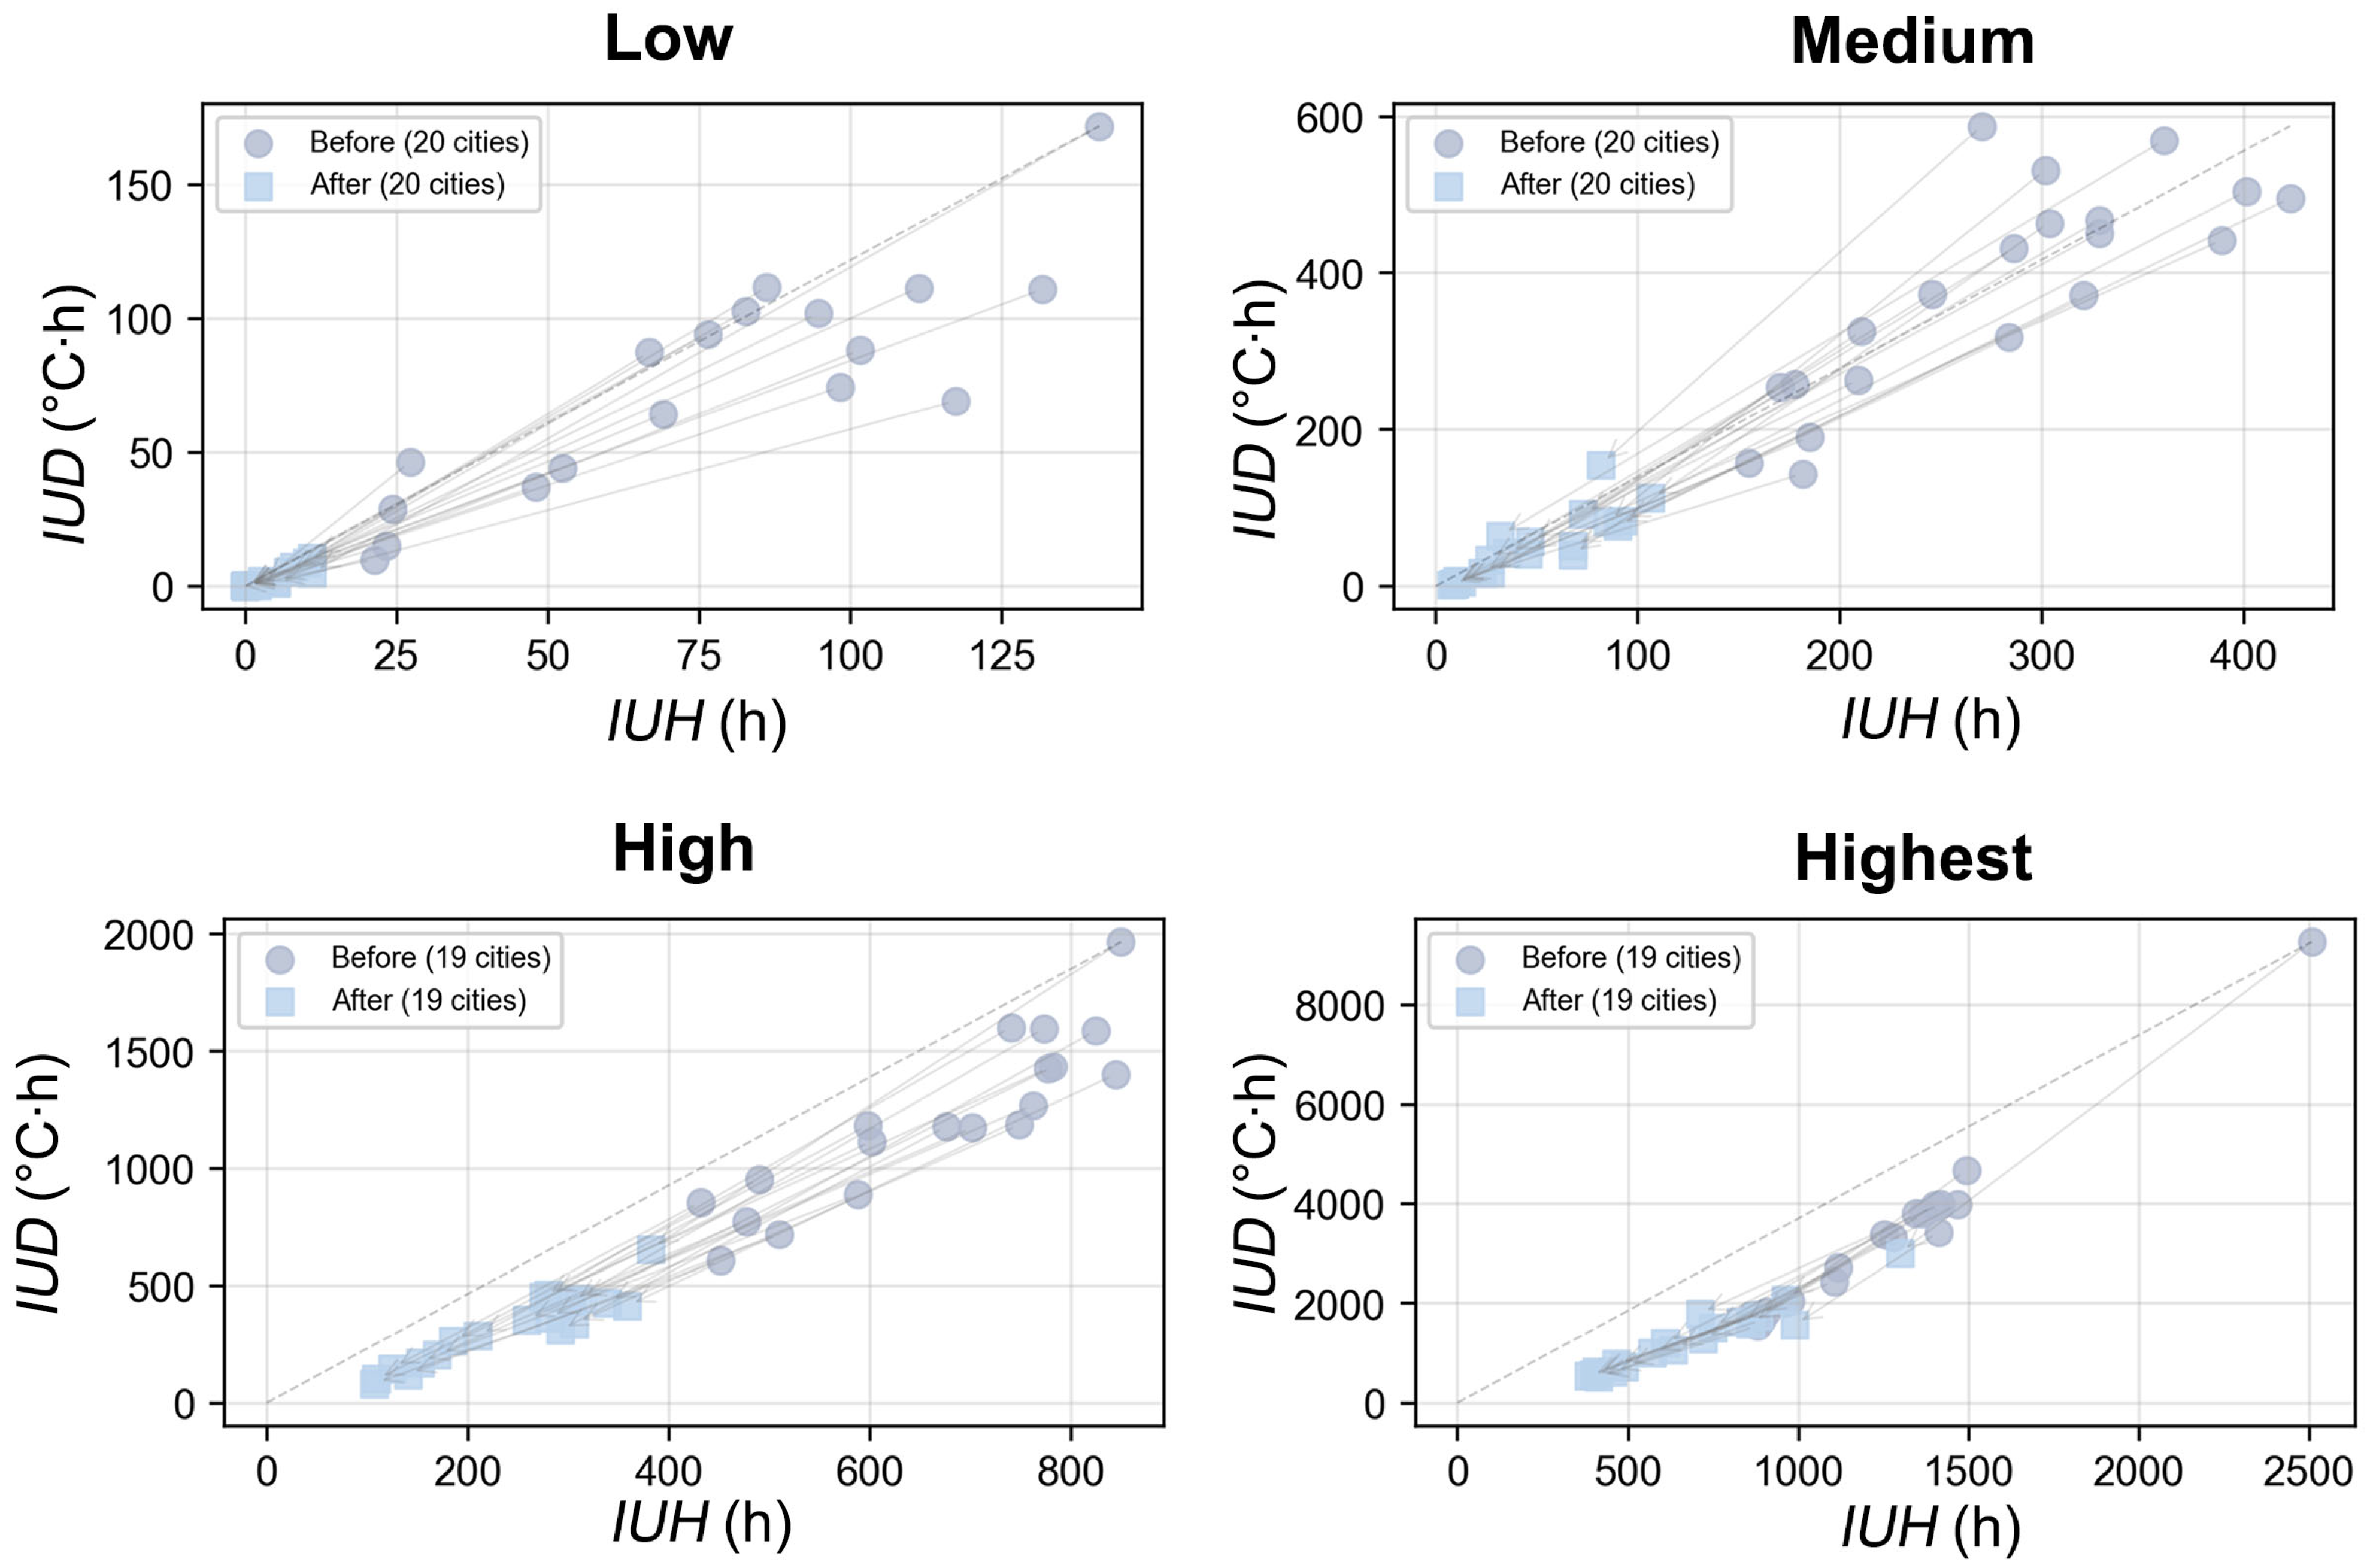
To explore strategies for mitigating undercooling risk and enhancing thermal equity in these rural homes, we conducted renovation simulations from three dimensions: improving building envelope insulation, upgrading window and door performance, and reducing air permeability. Following a similar methodology, we stratified the 78 regional data points into quartiles based on their pre-retrofit undercooling hours. Figure 9 presents the results for these regions, detailing the IUH and IUD both before and after the simulated interventions. Figure 10 shows the differences in improvement ratios across various regions before and after renovation.
The results clearly indicate a substantial reduction in undercooling risk post-retrofit. The efficacy of the interventions was most pronounced in regions with lower initial risk; the quartile with the lowest pre-retrofit hours saw its risk virtually eliminated. Even in the highest-risk quartile, the retrofits proved highly effective, slashing both IUH and IUD by approximately half. Notably, the reduction in IUD was even more significant than the reduction in duration. This implies a substantial increase in the SET during cold periods, leading to a more tangible improvement in thermal comfort. However, a critical limitation emerges: the retrofits’ effectiveness diminishes as the initial undercooling severity increases. While the improvement rate drops from nearly 100% in the mildest quartile to approximately 50% in the most severe, a significant residual risk persists in the coldest regions (those exceeding 1300 h and 3000 °C∙h). This finding underscores that for the most vulnerable areas, passive retrofitting alone may be insufficient to resolve the challenge of severe undercooling.
To evaluate the impact of the retrofits on thermal inequity, we applied the Lorenz curve and Gini coefficient analysis to the data from after the retrofit, with the results presented in Figure 11.
While the passive retrofit strategy reduced overall undercooling risk, it paradoxically increased the inequity in its distribution. The G i n i H rose significantly from 0.4602 to 0.6441, and the G i n i D rose significantly from 0.5843 to 0.7079, indicating a more polarized distribution. This suggests that the standardized retrofit was more effective in low-risk areas, effectively eliminating undercooling for some, but less effective in high-risk areas, leading to a concentration of the remaining burden on the most vulnerable households. This outcome highlights the limitations of a one-size-fits-all approach and the need for targeted interventions that address the specific needs of high-risk communities.
In conclusion, both metrics unequivocally show that while the uniform passive retrofits reduced overall risk, they paradoxically exacerbated the inequity of its distribution. The interventions were sufficient to eliminate risk in the houses with the best performance but inadequate for the houses with the worst performance, thereby widening the gap in thermal comfort and concentrating the remaining burden on the most vulnerable households.

4. Discussion

This study investigates the indoor undercooling risk in rural self-built houses across southern China, quantifying its spatial heterogeneity across more than 70 regions through model simulations using TMY data. The study also evaluates the feasibility of a passive retrofitting strategy in mitigating this risk and enhancing equity.
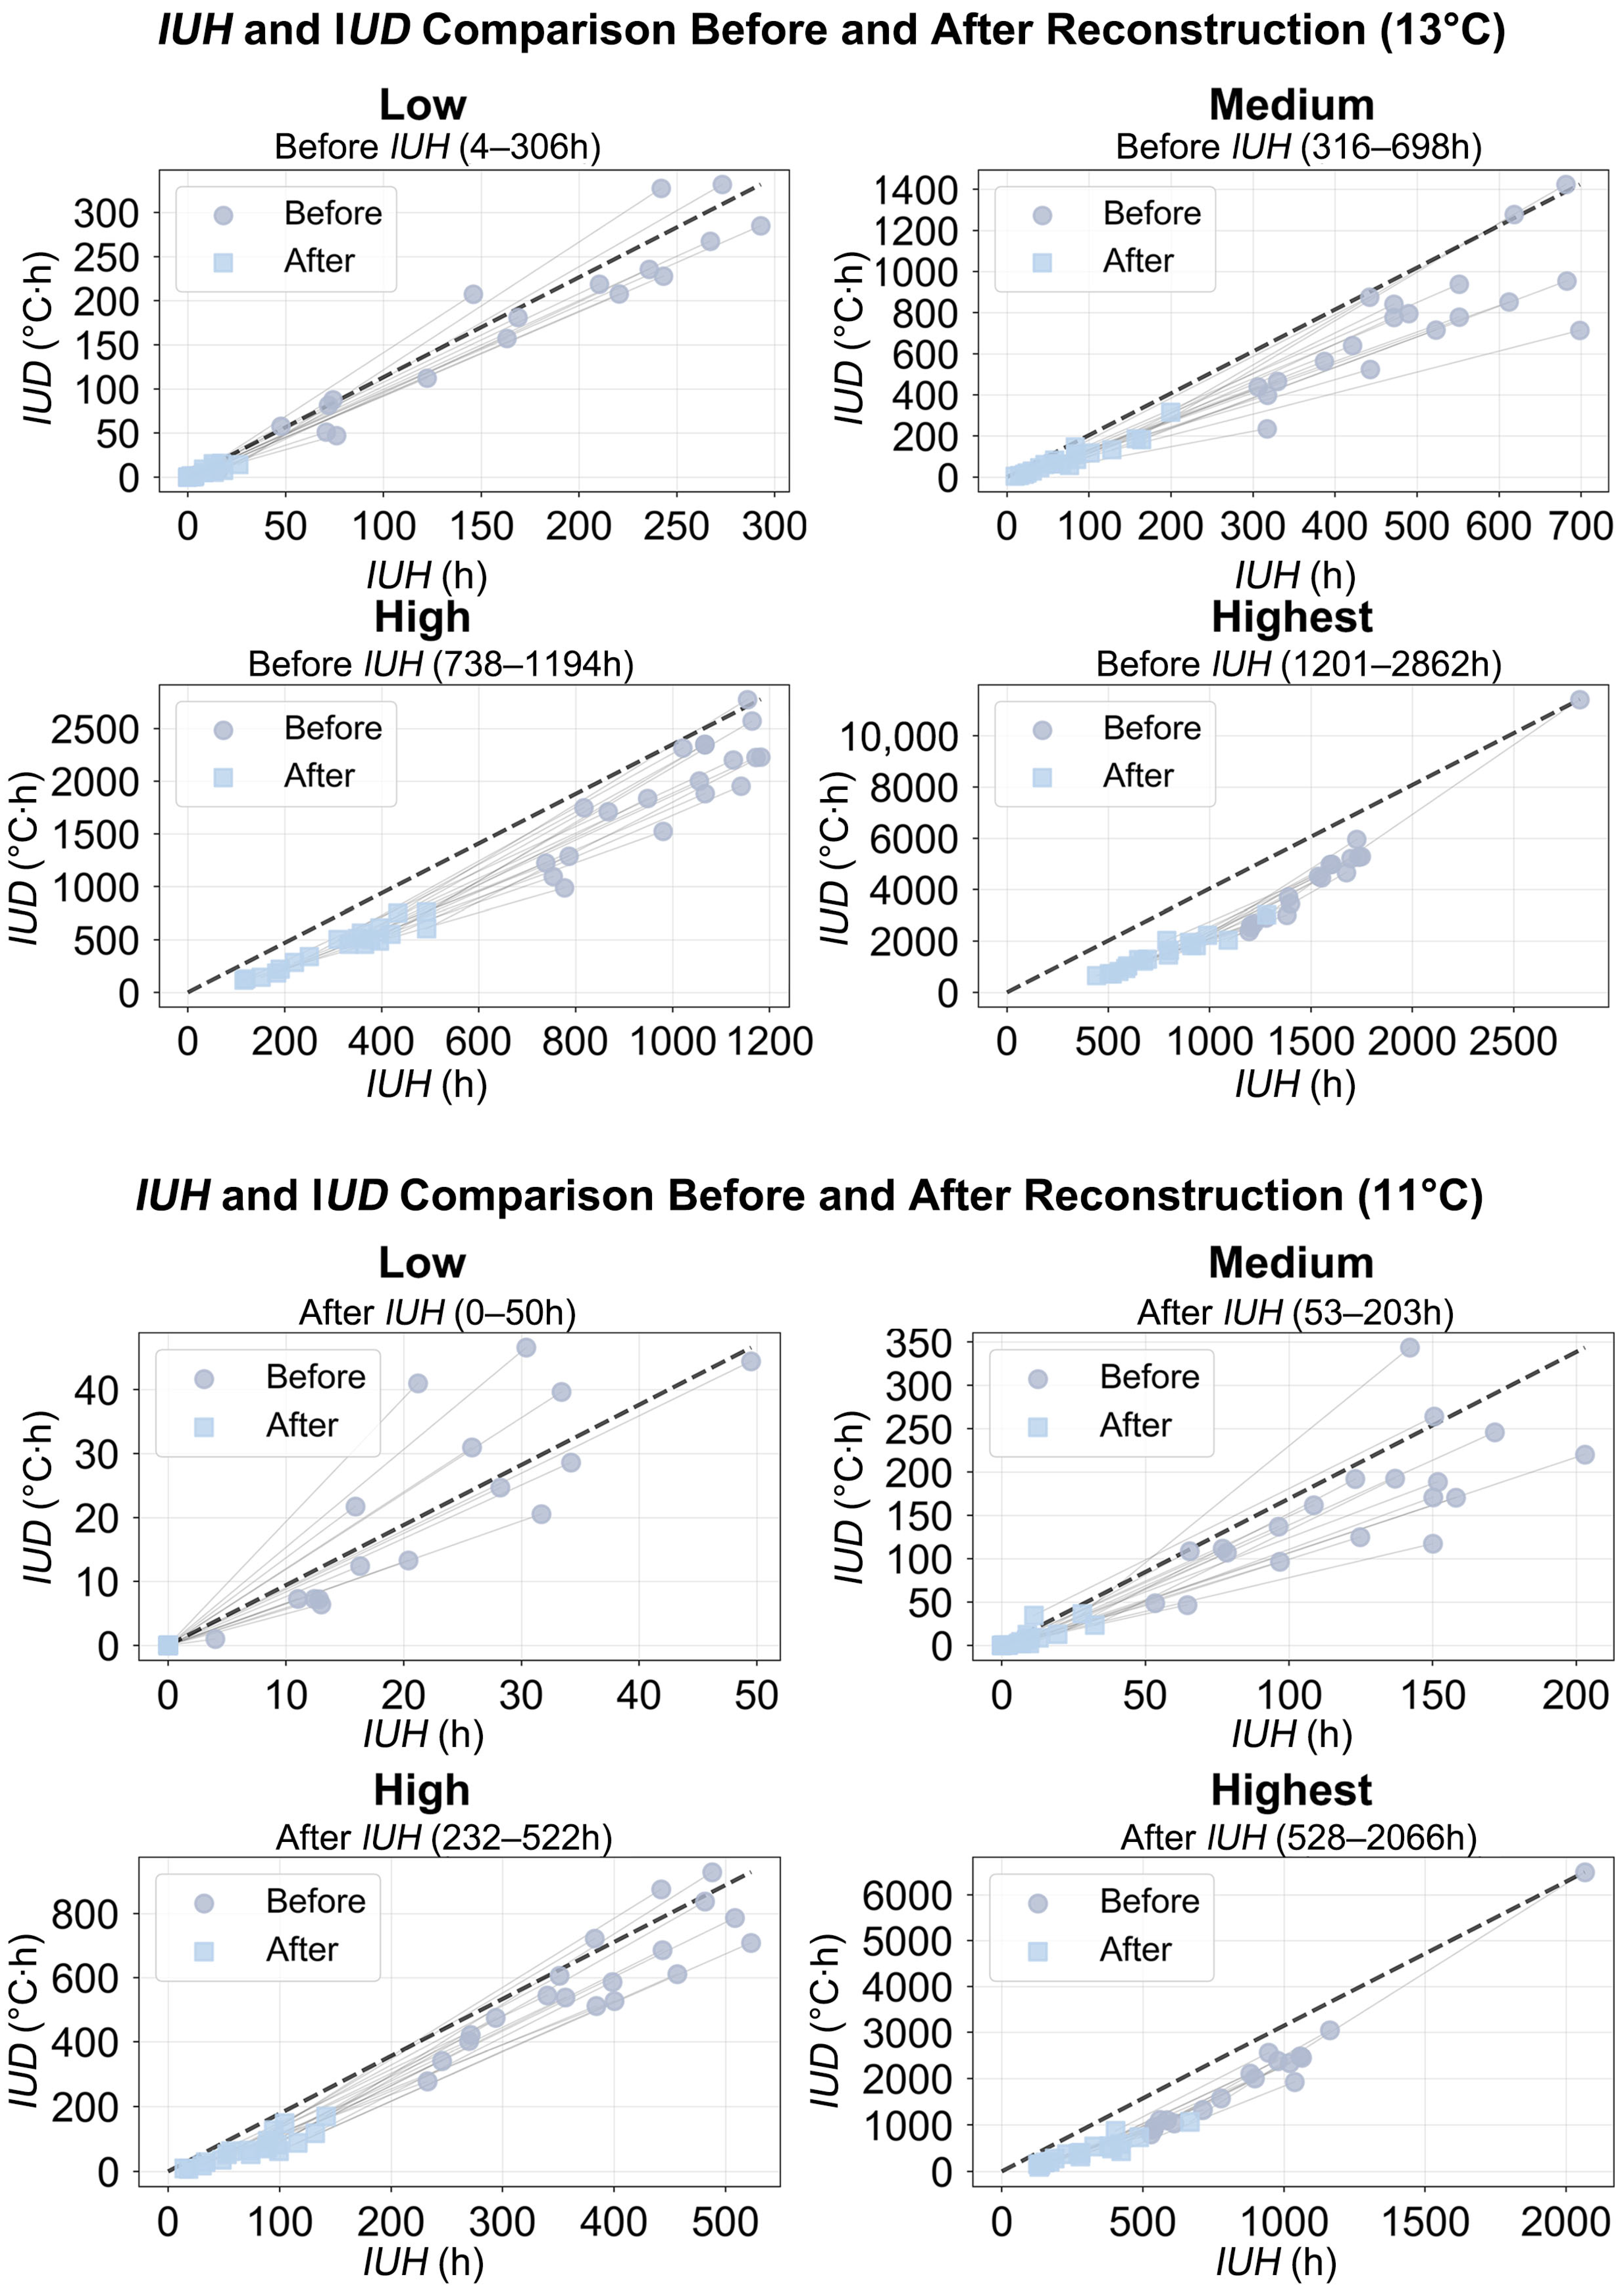
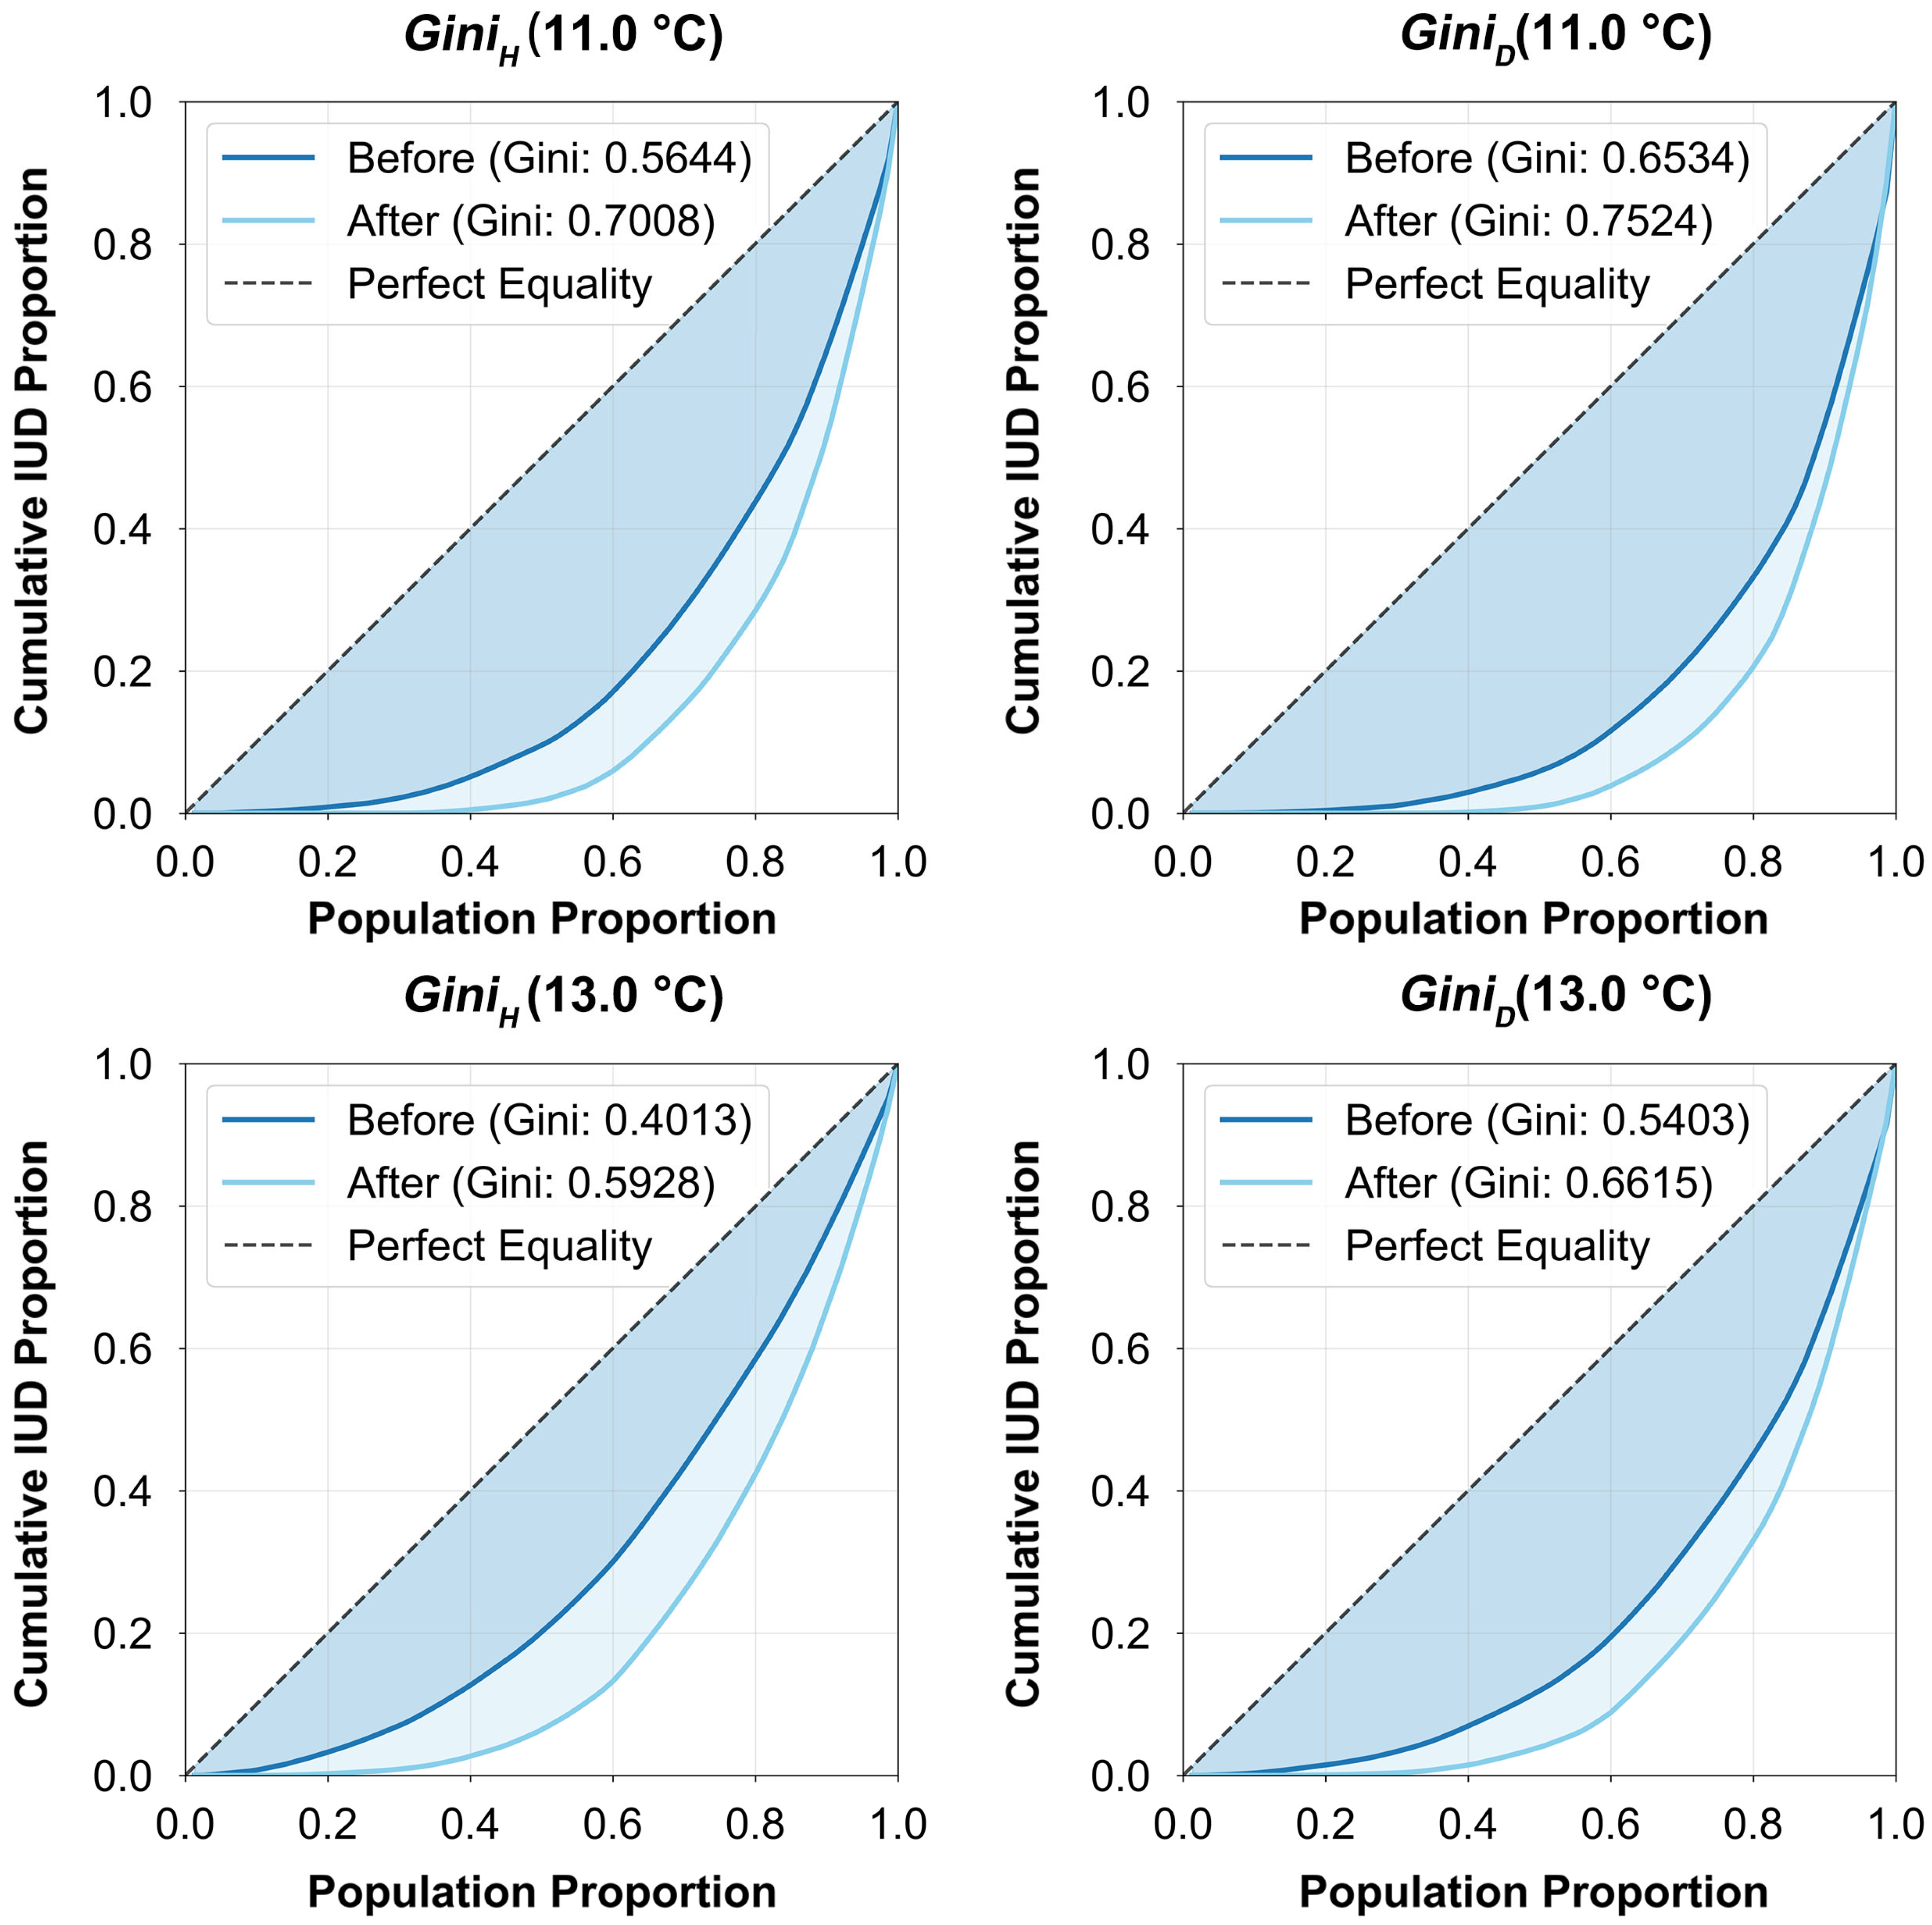
The findings reveal that indoor undercooling is a prevalent issue in the region. For the robustness consideration of the key indicator SET12.2, we selected SET13 and SET11 for verification. The results are presented in Appendix A Figure A1 and Figure A2. The key conclusions—the widespread occurrence of undercooling and inequity in rural areas of southern China and the exacerbation of inequity after renovation—remain unchanged, which confirms the rationality of selecting this indicator.

4.1. Pre-Retrofit Status Research

In general, the middle and lower Yangtze River regions and the Yangtze River Delta endure prolonged and intense undercooling. The unique topography of the southwest region creates localized areas of severe risk, while southern China, despite lower overall risk, is not immune to this challenge. These findings corroborate the research of T. Liu et al., who identified high undercooling-related mortality rates in central China [60]. The Gini coefficient analysis reveals a significant inequity in undercooling risks, with Gini coefficients for undercooling duration and degree at 0.46 and 0.58. The substantial differences in economic conditions and population across regions exacerbate this inequality [61]. The Yangtze River Delta, with better economic conditions and a smaller rural population, has more resources to adapt its indoor thermal environment. In contrast, the high-altitude areas of the southwest region, with poor economic conditions and fewer people, experience more severe undercooling risks, potentially leading to higher health risks due to prolonged exposure to cold.

4.2. Post-Retrofit Equity Assessment

Improving the thermal performance of the building envelope, windows, and airtightness can effectively mitigate indoor undercooling risk. The transformation effect of each specific method is shown in Table A1 of Appendix A. However, the efficacy of this intervention diminishes as the baseline risk level increases. In the lowest-risk quartile, the hybrid retrofit virtually eliminates undercooling (with IUH less than 15 h and IUD less than 15 °C∙h). By contrast, in the high-altitude areas of Yunnan, the post-retrofit IUH and IUD still exceed 1500 h and 3000 °C∙h, respectively, highlighting a profound disparity in the retrofit’s impact.
Furthermore, the comparison of the Gini coefficients before and after the renovations shows a notable increase in inequity. The G i n i H and G i n i D rose from 0.46 and 0.58 to 0.63 and 0.69, respectively. This indicates that while the passive renovation methods improve the overall undercooling risk, they also exacerbate the inequality in undercooling risks between regions, which contradicts the expectation of promoting fairness through passive renovation. This counterintuitive result arises because the standardized retrofit was sufficient to effectively zero out the risk in low-risk areas. As a result, the residual, hard-to-abate risk became statistically more concentrated in the few most climatically challenged regions, thus driving up the Gini coefficient. Moreover, differences in housing types, construction methods, and residents’ economic conditions in actual retrofitting practices may lead to some households benefiting more from retrofits, further widening the gap in thermal comfort. To mitigate these unintended consequences, policymakers should consider implementing differentiated retrofit standards tailored to the specific characteristics of each region and housing type.

4.3. Policy Recommendations

Considering the pre- and post-retrofit assessments of undercooling equity, as well as the significant regional economic disparities across rural southern China, targeted and differentiated interventions are urgently needed to address undercooling inequities. When selecting between passive retrofit and active heating solutions, policymakers should carefully evaluate cost-effectiveness, fairness, and sustainability. Specifically, for areas with moderate undercooling risk, passive measures that improve building airtightness and insulation should be prioritized to enhance energy efficiency. Conversely, in regions facing extremely high risks, active heating systems should be promoted, especially where economic conditions permit, to ensure basic thermal comfort for residents. In high-risk areas such as the southwestern high-altitude regions, the middle and lower reaches of the Yangtze River, and the Yangtze River Delta, the priority should be to implement active heating measures based on green energy technologies, thereby ensuring basic thermal comfort for residents while simultaneously promoting a green transition in the regional energy structure.
Policy standards should be differentiated accordingly: areas with low risk (IUH below 150 h) can adopt more lenient retrofit standards, focusing on sealing and insulation improvements; high-risk areas require more rigorous measures, including high-performance materials and energy-efficient windows. Special attention must be given to low-income households, particularly in the southwestern high-altitude regions, by providing targeted financial subsidies to reduce economic barriers for retrofit and heating improvements, ensuring their basic thermal comfort.
In summary, implementing targeted, region-specific policies, coupled with energy structure optimization and financial support, can effectively mitigate undercooling inequities in rural southern China, fostering an equitable, healthy, and livable environment for all residents.

4.4. Limitations

Understanding the undercooling risks and fairness in rural self-built houses in southern China is of great significance. However, this study has several limitations. To investigate the most prevalent situations in various regions of southern China, this study relied on the TMY dataset, which does not account for the impacts of climate change [20,62,63] or extreme weather events [64]. However, the impact of extreme climates is relatively controllable, and the impact of extreme cold is far less than the long-term mild but uninhabitable impact. The undercooling situation was assessed based on historical data, which may differ from current and future conditions [65]. While the use of TMY data provides a representative snapshot of typical weather conditions, it may underestimate the severity and frequency of underheating events during extreme cold waves or prolonged periods of low temperatures. This is because TMY data is based on averages of historical weather data, which smooths the peaks and troughs of extreme weather events. Therefore, the IUH and IUD estimates presented in this study may be lower than those observed under actual extreme weather conditions. Furthermore, the TMY dataset does not consider the effects of future climate change, where global warming may lead to an increase in overall winter temperatures, reducing undercooling risk overall, but perhaps with greater inequity.
Second, the study does not account for the habitual adaptation of occupants to local thermal environments [66]. Different regional populations may have varying thermal comfort zones, and a uniform evaluation standard might over or underestimate thermal stress. Generally speaking, the colder the climate, the stronger the residents’ tolerance to cold weather, and the lower the acceptable temperature. Local adaptation behaviors, such as the frequency of using heating equipment, wearing warm clothing, opening windows for ventilation, or different spatial zoning, affect the actual SET. This may overestimate the IUH and IUD in colder regions, thereby overestimating undercooling inequity.
Finally, a uniform building prototype was used, which does not capture the rich diversity of rural housing typologies across southern China, where designs and materials vary based on local economic, cultural, and climatic factors [67,68,69]. Variables such as building orientation, window-to-wall ratio, and envelope materials all influence thermal performance. This simplification may lead to an overestimation or underestimation of the benefits of retrofitting in some areas, depending on how representative the prototype is of the actual housing stock. Retrofit strategies may be less effective in areas with a higher proportion of traditional rammed-earth houses than in areas using more modern construction methods.
Future research should consider the impact of climate change and extreme weather to make the results more consistent with future and actual conditions; incorporate behavioral models to explain these adaptation strategies and their impact on thermal comfort and energy consumption; and incorporate a wider range of housing types to better capture the diversity of rural housing in southern China.

5. Conclusions

The indoor undercooling of rural, self-built houses in southern China poses a significant challenge to public health and climate equity. This study simulated this risk across 78 regions, quantified its magnitude and inequity using thermal and socio-economic metrics, and evaluated the impact of a standardized passive retrofit strategy. The core conclusions are as follows:
  • Indoor undercooling is a prevalent and spatially heterogeneous risk in rural housing across southern China.
  • The distribution of this risk is markedly inequitable, with G i n i H and G i n i D at 0.46 and 0.58, respectively.
  • The undercooling risks and economic and population conditions differ across regions, with the southwestern highlands facing severe undercooling risks due to poor economic conditions and low population density.
  • While a standardized passive retrofit strategy can lower the overall risk, it can paradoxically amplify the relative inequity of the remaining risk distribution. For the most severely affected regions, passive measures alone are likely insufficient, necessitating integrated interventions that may include active heating.
The growing focus on undercooling risks in southern China highlights the significance of addressing this issue. While the region is generally known for its humid heat, the presence of undercooling risks remains a concern. Scientifically quantifying indoor undercooling risk and its associated inequity is fundamental to developing evidence-based policies aimed at creating healthy, comfortable, and equitable rural living environments.

Author Contributions

Conceptualization, Y.Z.; Methodology, Y.Z.; Software, L.Y.; Formal analysis, L.Y. and Z.C.; Data curation, L.Y.; Writing—original draft, L.Y. and Z.C. All authors have read and agreed to the published version of the manuscript.

Funding

This research was funded by the National Natural Science Foundation of China, grant number 52308016.

Data Availability Statement

The original contributions presented in the study are included in the article, further inquiries can be directed to the corresponding author.

Conflicts of Interest

The authors declare no conflicts of interest.

Abbreviations

The following abbreviations are used in this manuscript:
SETStandard Effective Temperature
TMYTypical Meteorological Year
CSWDChinese Standard Weather Data
IUHIndoor Undercooling Hour
IUDIndoor Undercooling Degree
IOHIndoor Overheating Hour
IODIndoor Overheating Degree

Appendix A

Table A1. Building renovation scenario comparison.
GroupBefore RenovationWall InsulationWindow PerformancePermeabilityHybrid Renovation
IUHIUDIUHIUDIUHIUDIUHIUDIUHIUD
°C∙hh°C∙hh°C∙hh°C∙hh°C∙hh
Low
Min0 0 0 0 0 0 0 0 0 0
Max132 112 38 27 87 77 37 38 11 11
Mean65 63 10 6 36 31 17 13 3 2
Improvement %--87 92 53 60 74 82 96 98
Medium
Min141 143 38 24 100 90 25 27 8 1
Max389 587 236 384 331 528 212 267 90 155
Mean255 356 124 143 207 315 116 127 40 42
Improvement %--53 62 22 24 56 67 85 89
High
Min401 495 263 298 309 441 157 157 92 81
Max825 1601 649 1161 702 1441 500 691 339 461
Mean619 1080 480 736 550 931 351 439 212 271
Improvement %--23 32 11 12 44 61 67 76
Highest
Min844 1400 641 810 713 918 447 500 358 412
Max1419 3986 1245 3147 1379 3817 1159 2443 989 1791
Mean1096 2597 939 1996 1020 2268 782 1323 582 1008
Improvement %--14 24 7 13 30 51 48 62
Figure A1. Sensitivity analysis with different thresholds (IUH and IUD).
Buildings 15 03531 g0a1
Figure A2. Sensitivity analysis with different thresholds (Gini coefficient).
Buildings 15 03531 g0a2

References

  1. Wang, Y.; Zhao, N.; Wu, C.; Quan, J.; Chen, M. Future population exposure to heatwaves in 83 global megacities. Sci. Total Environ. 2023, 888, 164142. [Google Scholar] [CrossRef] [PubMed]
  2. Dasgupta, P.; Dayal, V.; Dasgupta, R.; Ebi, K.L.; Heaviside, C.; Joe, W.; Kolli, R.K.; Mehra, M.K.; Mishra, A.; Raghav, P. Responding to heat-related health risks: The urgency of an equipoise between emergency and equity. Lancet Planet. Health 2024, 8, e933–e936. [Google Scholar] [CrossRef] [PubMed]
  3. Gasparrini, A.; Guo, Y.; Hashizume, M.; Lavigne, E.; Zanobetti, A.; Schwartz, J.; Tobias, A.; Tong, S.; Rocklöv, J.; Forsberg, B.; et al. Mortality risk attributable to high and low ambient temperature: A multicountry observational study. Lancet 2015, 386, 369–375. [Google Scholar] [CrossRef] [PubMed]
  4. Xiong, K.; He, B.-J. Wintertime outdoor thermal sensations and comfort in cold-humid environments of Chongqing China. Sustain. Cities Soc. 2022, 87, 104203. [Google Scholar] [CrossRef]
  5. Gómez-Acebo, I.; Llorca, J.; Dierssen, T. Cold-related mortality due to cardiovascular diseases, respiratory diseases and cancer: A case-crossover study. Public Health 2013, 127, 252–258. [Google Scholar] [CrossRef]
  6. Huang, Y.; Li, C.; Liu, D.L.; Yang, J. Projection of temperature-related mortality among the elderly under advanced aging and climate change scenario. npj Clim. Atmos. Sci. 2023, 6, 153. [Google Scholar] [CrossRef]
  7. Jiang, Y.; Hu, J.; Peng, L.; Li, H.; Ji, J.S.; Fang, W.; Yan, H.; Chen, J.; Wang, W.; Xiang, D.; et al. Non-optimum temperature increases risk and burden of acute myocardial infarction onSET: A nationwide case-crossover study at hourly level in 324 Chinese cities. eClinicalMedicine 2022, 50, 101501. [Google Scholar] [CrossRef]
  8. González-Eguino, M. Energy poverty: An overview. Renew. Sustain. Energy Rev. 2015, 47, 377–385. [Google Scholar] [CrossRef]
  9. Hernández, H.; Molina, C. Analyzing energy poverty and carbon emissions in a social housing complex due to changes in thermal standards. Energy Sustain. Dev. 2023, 77, 101347. [Google Scholar] [CrossRef]
  10. Thomson, H.; Thomas, S.; Sellstrom, E.; Petticrew, M. Housing improvements for health and associated socio-economic outcomes. Cochrane Database Syst. Rev. 2013, 28, CD008657. [Google Scholar] [CrossRef]
  11. Han, J.; Yang, W.; Zhou, J.; Zhang, G.; Zhang, Q.; Moschandreas, D.J. A comparative analysis of urban and rural residential thermal comfort under natural ventilation environment. Energy Build. 2009, 41, 139–145. [Google Scholar] [CrossRef]
  12. Xiong, Y.; Liu, J.; Kim, J. Understanding differences in thermal comfort between urban and rural residents in hot summer and cold winter climate. Build. Environ. 2019, 165, 106393. [Google Scholar] [CrossRef]
  13. Zhang, J.; Lu, J.; Deng, W.; Beccarelli, P.; Lun, I.Y.F. Thermal comfort investigation of rural houses in China: A review. Build. Environ. 2023, 235, 110208. [Google Scholar] [CrossRef]
  14. Gong, X.; Lai, S.; Meng, Q.; Santamouris, M.; Yu, Y.; Zhang, L. Comparison of indoor thermal comfort of the elderly in urban, suburban rural and mountainous rural areas in South China karst. Build. Environ. 2025, 282, 113260. [Google Scholar] [CrossRef]
  15. Hou, C.; Gao, W.; Gao, Y. Winter indoor thermal environment and livability analysis of traditional residential houses in northeast Sichuan, China. Case Stud. Therm. Eng. 2024, 60, 104636. [Google Scholar] [CrossRef]
  16. Zhou, H.; Yu, W.; Wei, S.; Zhao, K.; Shan, H.; Zheng, S.; Guo, L.; Zhang, Y. Variability in thermal comfort and behavior of elderly individuals with different levels of frailty in residential buildings during winter. Build. Environ. 2025, 267, 112290. [Google Scholar] [CrossRef]
  17. Sejo, C.; Mehta, N.; Wilairat, S.; Barry, M.; Odden, M.C.; Chang, A.Y. Extreme heat and cardiovascular mortality among structurally marginalized populations in the United States: A scoping review. J. Clim. Change Health 2024, 20, 100343. [Google Scholar] [CrossRef]
  18. Zou, Y.; Zhan, Q.; Xiang, K. A comprehensive method for optimizing the design of a regular architectural space to improve building performance. Energy Rep. 2021, 7, 981–996. [Google Scholar] [CrossRef]
  19. Baydil, B.; de la Peña, V.H.; Zou, H.; Yao, H. Unbiased estimation of the Gini coefficient. Stat. Probab. Lett. 2025, 222, 110376. [Google Scholar] [CrossRef]
  20. Zou, Y.; Deng, Y.; Xia, D.; Lou, S.; Yang, X.; Huang, Y.; Guo, J.; Zhong, Z. Comprehensive analysis on the energy resilience performance of urban residential sector in hot-humid area of China under climate change. Sustain. Cities Soc. 2023, 88, 104233. [Google Scholar] [CrossRef]
  21. Xia, D.; Zhong, Z.; Huang, Y.; Zou, Y.; Lou, S.; Zhan, Q.; Guo, J.; Yang, J.; Guo, T. Impact of coupled heat and moisture transfer on indoor comfort and energy demand for residential buildings in hot-humid regions. Energy Build. 2023, 288, 113029. [Google Scholar] [CrossRef]
  22. Mushtaha, E.; Salameh, T.; Kharrufa, S.; Mori, T.; Aldawoud, A.; Hamad, R.; Nemer, T. The impact of passive design strategies on cooling loads of buildings in temperate climate. Case Stud. Therm. Eng. 2021, 28, 101588. [Google Scholar] [CrossRef]
  23. Yang, H.; Jin, C.; Li, T. Megacity urban green space equity evaluation and its driving factors from supply and demand perspective: A case study of Tianjin. J. Clean. Prod. 2024, 474, 143583. [Google Scholar] [CrossRef]
  24. Raza, A.; Zhong, M.; Akuh, R.; Safdar, M. Public transport equity with the concept of time-dependent accessibility using Geostatistics methods, Lorenz curves, and Gini coefficients. Case Stud. Transp. Policy 2023, 11, 100956. [Google Scholar] [CrossRef]
  25. Gu, Z.; Luo, X.; Tang, M.; Liu, X. Does the edge effect impact the healthcare equity? An examination of the equity in hospitals accessibility in the edge city in multi-scale. J. Transp. Geogr. 2023, 106, 103513. [Google Scholar] [CrossRef]
  26. Li, H.; Huo, Y.; Fu, Y.; Yang, Y.; Yang, L. Improvement of methods of obtaining urban TMY and application for building energy consumption simulation. Energy Build. 2023, 295, 113300. [Google Scholar] [CrossRef]
  27. Kong, D.; Liu, H.; Wu, Y.; Li, B.; Wei, S.; Yuan, M. Effects of indoor humidity on building occupants’ thermal comfort and evidence in terms of climate adaptation. Build. Environ. 2019, 155, 298–307. [Google Scholar] [CrossRef]
  28. Guo, J.; Xia, D.; Zhang, L.; Zou, Y.; Guo, G.; Chen, Z.; Xie, W. Assessing the winter indoor environment with different comfort metrics in self-built houses of hot-humid areas: Does undercooling matter for the elderly? Build. Environ. 2024, 263, 111871. [Google Scholar] [CrossRef]
  29. Song, L.; Wu, R. Impacts of MJO convection over the maritime continent on eastern China cold temperatures. J. Clim. 2019, 32, 3429–3449. [Google Scholar] [CrossRef]
  30. Jin, S.; Bi, X.; Wu, C.; Fang, B.; Li, Q.; Wang, C.; Song, C.; Li, J. The associations of cold spells with human mortality in Shanghai, China. Urban Clim. 2024, 58, 102175. [Google Scholar] [CrossRef]
  31. Jia, H.; Lin, B. Who wants to use it most? Exploring public willingness to pay for district heating in hotly debated southern Chinese cities. Energy Policy 2024, 192, 114236. [Google Scholar] [CrossRef]
  32. Malik, J.; Bardhan, R.; Hong, T.; Piette, M.A. Developing occupant archetypes within urban low-income housing: A case study in Mumbai, India. Build. Simul. 2022, 15, 1661–1683. [Google Scholar] [CrossRef]
  33. Sánchez-García, D.; Rubio-Bellido, C.; Tristancho, M.; Marrero, M. A comparative study on energy demand through the adaptive thermal comfort approach considering climate change in office buildings of Spain. Build. Simul. 2020, 13, 51–63. [Google Scholar] [CrossRef]
  34. Xie, X.; Luo, Z.; Grimmond, S.; Sun, T. Impact of building density on natural ventilation potential and cooling energy saving across Chinese climate zones. Build. Environ. 2023, 244, 110621. [Google Scholar] [CrossRef]
  35. Guo, J.; Xia, D.; Zhang, L.; Zou, Y.; Yang, X.; Xie, W.; Zhong, Z. Future indoor overheating risk for urban village housing in subtropical region of China under long-term changing climate. Build. Environ. 2023, 246, 110978. [Google Scholar] [CrossRef]
  36. Guo, M.; Yu, W.; Zhang, Y.; Li, B.; Zhou, H.; Du, C. Associations of household dampness and cold exposure with cardiovascular disease and symptoms among elderly people in Chongqing and Beijing. Build. Environ. 2023, 233, 110079. [Google Scholar] [CrossRef]
  37. He, B.-j.; Yang, L.; Ye, M.; Mou, B.; Zhou, Y. Overview of rural building energy efficiency in China. Energy Policy 2014, 69, 385–396. [Google Scholar] [CrossRef]
  38. Zhang, N.; Liu, G.; Man, X.; Wang, Q. Climate and resource characteristics-based zoning of heat source retrofit for heating systems and implications for heat consumption of urban SETtlements in cold regions of China. Energy 2025, 314, 134261. [Google Scholar] [CrossRef]
  39. Shu, Z.; Qing, S.; Yang, X.; Ma, P.; Wu, Y.; Li, B.; Fang, F.; Yao, R. A molecular toxicological study to explore potential health risks associated with ultrafine particle exposure in cold and humid indoor environments. Ecotoxicol. Environ. Saf. 2025, 289, 117638. [Google Scholar] [CrossRef]
  40. Wong, E.L.-Y.; Qiu, H. Cold temperature-related attributable risk for emergency circulatory hospitalizations, length of stay, and healthcare costs in Hong Kong. Ecotoxicol. Environ. Saf. 2025, 291, 117827. [Google Scholar] [CrossRef]
  41. GB 50176-2016; Code for Thermal Design of Civil Building. Ministry of Housing and Urban-Rural Development of the China: Beijing, China, 2016.
  42. Hoseinzadeh, P.; Khalaji Assadi, M.; Heidari, S.; Khalatbari, M.; Saidur, R.; Haghighat nejad, K.; Sangin, H. Energy performance of building integrated photovoltaic high-rise building: Case study, Tehran, Iran. Energy Build. 2021, 235, 110707. [Google Scholar] [CrossRef]
  43. Gamero-Salinas, J.; Monge-Barrio, A.; Kishnani, N.; López-Fidalgo, J.; Sánchez-Ostiz, A. Passive cooling design strategies as adaptation measures for lowering the indoor overheating risk in tropical climates. Energy Build. 2021, 252, 111417. [Google Scholar] [CrossRef]
  44. Neto, A.H.; Durante, L.C.; Callejas, I.J.A.; da Guarda, E.L.A.; Moreira, J.V.R. The challenges on operating a zero net energy building facing global warming conditions. Build. Simul. 2022, 15, 435–451. [Google Scholar] [CrossRef]
  45. Calama-González, C.M.; Symonds, P.; León-Rodríguez, Á.L.; Suárez, R. Optimal retrofit solutions considering thermal comfort and intervention costs for the Mediterranean social housing stock. Energy Build. 2022, 259, 111915. [Google Scholar] [CrossRef]
  46. Roostaie, S.; Kouhirostami, M.; Sam, M.; Kibert, C.J. Resilience coverage of global sustainability assessment frameworks: A systematic review. J. Green Build. 2021, 16, 23–53. [Google Scholar] [CrossRef]
  47. ASHRAE Standard 55; Thermal Environmental Conditions for Human Occupancy. American Society of Heating, Refrigerating and Air-Conditioning Engineers: Atlanta, GA, USA, 2017.
  48. Ismail, N.; Ouahrani, D.; Al Touma, A. Quantifying thermal resilience of office buildings during power outages: Development of a simplified model metric and validation through experimentation. J. Build. Eng. 2023, 72, 106564. [Google Scholar] [CrossRef]
  49. Sheng, M.; Reiner, M.; Sun, K.; Hong, T. Assessing thermal resilience of an assisted living facility during heat waves and cold snaps with power outages. Build. Environ. 2023, 230, 110001. [Google Scholar] [CrossRef]
  50. National Bureau of Statistics of China. Communiqué on China’s Third National Time Use Survey (No. 2)—Overview of National Residents’ Time Use by Primary Activity Domains and Major Activity Categories; National Bureau of Statistics of China: Beijing, China, 2024.
  51. National Bureau of Statistics of China. Communiqué on China’s Third National Time Use Survey (No. 3)—Time Use of Participants by Urban and Rural Areas, Gender, and Age Group in Primary Activity Domains; National Bureau of Statistics of China: Beijing, China, 2024.
  52. Dino, I.G.; Meral Akgül, C. Impact of climate change on the existing residential building stock in Turkey: An analysis on energy use, greenhouse gas emissions and occupant comfort. Renew. Energy 2019, 141, 828–846. [Google Scholar] [CrossRef]
  53. Ceriani, L.; Verme, P. The origins of the Gini index: Extracts from Variabilità e Mutabilità (1912) by Corrado Gini. J. Econ. Inequal. 2012, 10, 421–443. [Google Scholar] [CrossRef]
  54. Cowell, F.A.; Flachaire, E. Chapter 6—Statistical Methods for Distributional Analysis. In Handbook of Income Distribution; Atkinson, A.B., Bourguignon, F., Eds.; Elsevier: Amsterdam, The Netherlands, 2015; Volume 2, pp. 359–465. [Google Scholar]
  55. Karam, S.; Ryerson, M.S. Operating at the individual level: A review of literature and a research agenda to support needs-forward models of transport resource allocation. Transp. Res. Interdiscip. Perspect. 2023, 21, 100887. [Google Scholar] [CrossRef]
  56. Wildman, J.; Shen, J. Impact of Income Inequality on Health. In Encyclopedia of Health Economics; Culyer, A.J., Ed.; Elsevier: San Diego, CA, USA, 2014; pp. 10–14. [Google Scholar]
  57. Wüstemann, H.; Kalisch, D.; Kolbe, J. Access to urban green space and environmental inequalities in Germany. Landsc. Urban Plan. 2017, 164, 124–131. [Google Scholar] [CrossRef]
  58. Qin, M.; Duan, K.; Ma, Z.; Li, Z.; Ju, X.; Sun, H. What makes the provincial inequality of natural gas consumption in China? Evidence from Gini-coefficient approach. Energy Convers. Manag. X 2024, 22, 100601. [Google Scholar] [CrossRef]
  59. Li, C.-E.; Lin, Z.-H.; Hsu, Y.-Y.; Kuo, N.-W. Lessons from COVID-19 pandemic: Analysis of unequal access to food stores using the Gini coefficient. Cities 2023, 135, 104217. [Google Scholar] [CrossRef] [PubMed]
  60. Liu, T.; Zhou, C.; Zhang, H.; Huang, B.; Xu, Y.; Lin, L.; Wang, L.; Hu, R.; Hou, Z.; Xiao, Y.; et al. Ambient Temperature and Years of Life Lost: A National Study in China. Innovation 2021, 2, 100072. [Google Scholar] [CrossRef]
  61. Lee, J.S.; Han, A.T. Heat vulnerability and spatial equity of cooling center: Planning implications from the Korean case. Urban Clim. 2024, 55, 101869. [Google Scholar] [CrossRef]
  62. Chen, R.; Samuelson, H.; Zou, Y.; Zheng, X.; Cao, Y. Improving building resilience in the face of future climate uncertainty: A comprehensive framework for enhancing building life cycle performance. Energy Build. 2024, 302, 113761. [Google Scholar] [CrossRef]
  63. Zou, Y.; Xiang, K.; Zhan, Q.; Li, Z. A simulation-based method to predict the life cycle energy performance of residential buildings in different climate zones of China. Build. Environ. 2021, 193, 107663. [Google Scholar] [CrossRef]
  64. Howe, P.D. Extreme weather experience and climate change opinion. Curr. Opin. Behav. Sci. 2021, 42, 127–131. [Google Scholar] [CrossRef]
  65. Siu, C.Y.; Liao, Z. Is building energy simulation based on TMY representative: A comparative simulation study on doe reference buildings in Toronto with typical year and historical year type weather files. Energy Build. 2020, 211, 109760. [Google Scholar] [CrossRef]
  66. Yang, Z.; Zhang, W.; Qin, M.; Liu, H. Comparative study of indoor thermal environment and human thermal comfort in residential buildings among cities, towns, and rural areas in arid regions of China. Energy Build. 2022, 273, 112373. [Google Scholar] [CrossRef]
  67. Li, S.; Wang, M.; Shen, P.; Cui, X.; Bu, L.; Wei, R.; Zhang, L.; Wu, C. Energy Saving and Thermal Comfort Performance of Passive Retrofitting Measures for Traditional Rammed Earth House in Lingnan, China. Buildings 2022, 12, 1716. [Google Scholar] [CrossRef]
  68. Zhao, M.; Mehra, S.-R.; Künzel, H.M. Energy-saving potential of deeply retrofitting building enclosures of traditional courtyard houses—A case study in the Chinese Hot-Summer-Cold-Winter zone. Build. Environ. 2022, 217, 109106. [Google Scholar] [CrossRef]
  69. Parracha, J.L.; Lima, J.; Freire, M.T.; Ferreira, M.; Faria, P. Vernacular earthen buildings from Leiria, Portugal—Architectural survey towards their conservation and retrofitting. J. Build. Eng. 2021, 35, 102115. [Google Scholar] [CrossRef]
Figure 1. The workflow of this study.
Buildings 15 03531 g001
Figure 2. The January temperature and relative humidity of 78 cities.
Buildings 15 03531 g002
Figure 3. The plan and photo of the simulated rooms in the self-built houses.
Buildings 15 03531 g003
Figure 4. The hourly occupancy rate of each room.
Buildings 15 03531 g004
Figure 5. Violin plot of IUH versus IUD. The data are categorized into 4 groups based on the number of IUH in ascending order. Corresponding locations are shown in the map, with scatter color indicating groups and radius representing IUH magnitude (larger radius for greater hours).
Buildings 15 03531 g005
Figure 6. Hourly supercooling temperature undercooling SET diagram, with the time range from October to the following May (no IUH from June to September), only showing cases where SET is lower than the acceptable temperature. The abscissa represents the date, the ordinate represents the hour, and the color depth indicates the SET level.
Buildings 15 03531 g006
Figure 7. Comparison chart of IUH, IUD, rural disposable income, and rural permanent population. Each sector’s color indicates the data type, and the radius represents the value magnitude. The rings in the radar chart on the map share the same meaning as those in the enlarged radar chart.
Buildings 15 03531 g007
Figure 8. Gini coefficient plot of IUH and IUD.
Buildings 15 03531 g008
Figure 9. Comparison chart of IUH and IUD before and after renovation. The abscissa represents IUH, and the ordinate represents IUD. The data are divided into four groups (low, medium, high, and highest) in ascending order based on the IUH values before renovation.
Buildings 15 03531 g009
Figure 10. Comparison Chart of Improvement Before and After Building Renovation. IUH Improvement Rate: (IUHpre—IUHpost)/IUHpre; IUH Residual Rate: IUHpost/IUHpre; IUD Improvement Rate: (IUDpre—IUDpost)/IUDpre; IUD Residual Rate: IUDpost/IUDpre.
Buildings 15 03531 g010
Figure 11. Gini coefficient plot of IUH and IUD after renovation.
Buildings 15 03531 g011
Table 1. Key parameters of IUH and IUD.
Parameter SymbolParameter NameUnitDescription
zBuilding thermal zone index-Index identifier for building thermal zones, included Bedroom 1, the kitchen, the toilet, and the living room.
iOccupied hour index-Index for occupied time hours
t i , z Time stephSET to 1 h to ensure consistent temporal granularity,
ZTotal number of zones-Total number of thermal zones in the building
N O C C Z Total occupied hours for zone zhTotal number of occupied hours for zone z over the simulation period
S E T i , z Standard Effective Temperature°CSET value in zone z at hour i
T L S E T , i , z Lower limit of SET comfort temperature°CLower limit of SET comfort temperature in zone z at hour i
Table 2. Key parameters of Gini.
Parameter SymbolParameter NameDescription
G i n i H Gini coefficient for undercooling hoursMeasure of inequality in undercooling hours distribution
G i n i D Gini coefficient for undercooling degreeMeasure of inequality in undercooling degree distribution
P i Cumulative proportion of the populationProportion of population up to individual i
H i Cumulative proportion of total undercooling hoursProportion of total undercooling hours corresponding to individual i
D i Cumulative proportion of total undercooling degreeProportion of total undercooling degree for individual i
Disclaimer/Publisher’s Note: The statements, opinions and data contained in all publications are solely those of the individual author(s) and contributor(s) and not of MDPI and/or the editor(s). MDPI and/or the editor(s) disclaim responsibility for any injury to people or property resulting from any ideas, methods, instructions or products referred to in the content.