Abstract
Indoor environmental quality in offices, comprising thermal, acoustic, lighting, and air quality domains, is known to influence human comfort, yet the relative importance of their sub-factors—particularly in severe cold regions—remains unclear. This study addresses this gap by integrating objective (Criteria Importance Through Intercriteria Correlation, CRITIC) and subjective (Analytic Hierarchy Process, AHP) weighting methods, supported by field measurements and questionnaire surveys in open-plan offices in three provinces in northeastern China. Cluster analysis categorized acoustic sub-factors into outdoor traffic, outdoor entertainment, people conversation, burst sound, and people movement. Results show that temperature is the dominant thermal comfort driver (39.7% CRITIC; 45.5% AHP), exceeding air velocity and humidity, which had nearly equal influence. Indoor sound exerted greater impact than outdoor sound, with people conversation ranked highest among indoor noise sources, and burst sound and movement showing similar but slightly lower weights. Natural light outweighed artificial light in importance (54.2% CRITIC; 61.0% AHP), while air freshness and pollution were nearly equally influential. Compared to CRITIC, AHP produced more dispersed weights, reflecting subjective bias toward pronounced differences. These findings provide a quantitative basis for prioritizing environmental design interventions—such as controlling indoor conversational noise, optimizing natural lighting, and stabilizing temperature—to enhance comfort in offices in severe cold regions.
1. Introduction
As people spend most of their time inside office buildings, indoor environmental quality (IEQ) plays a crucial role in human comfort [1,2,3] and work productivity [4,5,6,7] of people in offices, which has attracted considerable attention [8,9,10,11]. IEQ consists of four basic environmental factors (i.e., thermal environment, sound environment, light environment and indoor air quality), and the relations between these four factors and human comfort were investigated in previous studies [12,13,14,15]. In addition, each environmental factor could be subdivided into multiple sub-factors, which influence aspects of thermal comfort, acoustic comfort, light comfort and the comfort of indoor air quality, and then collectively impact overall comfort [16,17,18].
However, most existing studies have focused on temperate or mild climates, and there remains a significant lack of targeted research concerning the unique IEQ challenges in severe cold regions. In these areas, extreme outdoor conditions impose distinct demands on indoor environmental systems, particularly in terms of heating efficiency, insulation performance, ventilation strategies, and window-to-wall ratio design, which may substantially alter the relative importance of IEQ sub-factors.
Although considerable research has examined the general impact of IEQ on comfort in offices, few studies have comprehensively investigated the sub-factors under such specific climatic constraints. Therefore, a careful and comprehensive analysis of these sub-factors is necessary to understand their relative contributions to comfort in severe cold regions. Such an investigation would support the development of a more nuanced comfort evaluation framework. It will also help the designers and users to implement targeted and effective measures to enhance comfort and energy efficiency in these distinctive office environments [19,20].
1.1. Objective and Subjective Weighting Methods for the Importance of IEQ
To investigate the influence of various environmental factors and sub-factors on human comfort, a series of weighting methods have been used to determine the weights of these factors based on comfort votes. These methods can be mainly classified into two categories: subjective and objective methods.
Objective weighting methods—such as multivariate linear or logistic regression, the Criteria Importance Through Intercriteria Correlation (CRITIC) method, and the Entropy method—are quantitative analyses that determine factor weights based on data information. Many studies have applied these methods to reflect the relationship between human comfort and IEQ [10,21,22]. However, although mathematical theory guarantees objectivity, these methods often ignore the preferences and experiential knowledge of decision-makers [23].
In contrast, subjective methods assign weights based on individual experience. Examples include the Analytic Hierarchy Process (AHP) and the Fuzzy Analytic Hierarchy Process (FAHP). Some research uses these methods to investigate environmental factor weights and develop comprehensive comfort assessment systems [9,21,24,25]. The main disadvantage of subjective methods is their lack of objectivity, which stems from the arbitrariness of personal judgment [26,27].
To incorporate both decision-makers’ preferences and objective statistical results, a combined approach is often adopted. Therefore, this paper uses both the CRITIC method (objective) and the AHP method (subjective) to obtain a more proper and reliable weighting scheme.
1.2. Study on the Importance of Four Environmental Factors and Their Sub-Factors
There have been multiple studies investigating the weights of key environmental factors affecting human comfort in office buildings. Guo [21] used the AHP method based on 89 questionnaires to determine the weights of thermal, acoustic, and visual environments. Li [9] integrated FAHP and Entropy methods to develop a comprehensive weighting scheme for IEQ factors in open-plan offices. Cao [12] and Ncube [19] applied multiple linear regression to questionnaire data from China and the UK, respectively, to assess the relative importance of four environmental factors. Wong [28] used logistic regression on data from 293 subjects in Hong Kong offices, while Heinzerling [29] proposed a regression model based on a database of 5732 responses. Tang [30] conducted a lab study with 8 subjects under 31 conditions, using regression to link overall satisfaction with specific environmental factors.
In contrast, research on environmental sub-factors remains limited, especially comprehensive studies comparing their importance. As summarized in Table 1 [31,32,33,34,35,36,37,38,39,40,41], thermal sub-factors—particularly temperature—have received more attention and are shown to significantly affect both thermal and overall comfort. Relative humidity and air velocity have also been examined. Chiang [31] found noise and humidity negatively impacted satisfaction in care centers. Kaushik [37] and Zhan [40] both identified temperature as the most critical parameter for comfort, while Jia [41] reported that operative temperature accounted for 50% of variation in overall comfort, compared to 19% for humidity.

Table 1.
Summary of studies on environmental sub-factors.
The research on sub-factors of acoustic environment, light environment, and indoor air quality is less extensive than that on sub-factors of thermal environment. The study of Lai [32] showed that occupants were mainly disturbed by external noise compared to indoor noise in residential buildings. Xue [33] conducted a questionnaire survey with a sample of 482 residents in high-rise residential buildings. The results suggested that illuminance level and abundance of daylight hours had significantly positive correlations with satisfaction with the luminous environment, while construction noise and human noise had significantly negative correlations with satisfaction with the acoustic environment. Kang [34] surveyed open-plan offices from 19 universities, finding that the quality of the acoustic environment had the greatest influence on the occupants’ productivity and construction, conversation, entertainment, and phone ringing were the most annoying sound sources. Buratti’s research [35] on the indoor environmental quality of university classrooms showed that natural light and artificial light had approximately the same effect on visual comfort. Yang and Moon [36] studied the subjective comfort of 60 subjects under different combinations of room temperature, sound type, sound pressure level, and illuminance, and the results showed that acoustic sub-factors had the greatest impact on indoor environmental quality, followed by temperature and illumination. Yang and Mak [38] proposed a four-layer IEQ assessment model for university classrooms. The research indicated that temperature and natural lighting quality were the most critical factors affecting the feelings of the respondents in university classrooms. Piasecki [39] developed a weighting scheme for indoor air quality models using the Multi-Attribute Decision Making (MADM) method. The weight results calculated through the CRITIC method showed that CO2 concentration and total volatile organic compounds (VOCs) had a great impact on indoor air quality.
Although these studies collectively affirmed the significance of sub-factors in IEQ, they tended to focus on research in specific areas of indoor environmental quality rather than comprehensive assessment, and insufficient consideration was given to the adaptability of occupants and environmental impact in the studies. The heterogeneity of the methods hinders the direct comparison of research results. Overall, there is a lack of quantitative weight comparisons across sub-factors within and between domains. A more comprehensive study is needed to establish a refined comfort evaluation model. Therefore, further research on the weights of multiple sub-factors across all major IEQ domains in offices is essential.
1.3. Studies in This Paper
The purpose of this paper is to investigate the weights of various environmental sub-factors under four main environmental factors (namely, thermal environment, acoustic environment, light environment, and indoor air quality) affecting corresponding human comfort in open-plan offices. Typical sub-factors under each main environmental factor were selected. The field studies and questionnaire surveys for the CRITIC method, which is a typical objective weighting method, were first conducted in 12 offices in Harbin. Based on the comfort voting results of the CRITIC method, the hierarchy cluster analysis was carried out to categorize various acoustic sub-factors, which were used in the design of the questionnaire for the AHP method, which is a typical subjective weighting method. The questionnaire surveys for the AHP were conducted in three provinces in severe cold regions in China. The weights for each environmental sub-factor for both the CRITIC method and the AHP method were analyzed. These two kinds of results for the subjective and objective weighting methods were analyzed and compared. By integrating and contrasting objective and subjective weighting approaches, this study bridges the gap between data-driven statistical weights and occupant-based subjective weights, establishing a comprehensive evaluation framework that delivers more reliable weight determinations for multiple indoor environmental sub-factors affecting human comfort in severe cold regions. The research contributes novel insights into multi-criteria comfort evaluation in occupational environments and supports the design and optimization of healthier, more comfortable open-plan office spaces in severe cold regions.
2. Research Methodology
In this study, the weights of different indoor environmental sub-factors affecting human comfort were determined using two complementary methods: the Criteria Importance Through Intercriteria Correlation (CRITIC) method and the Analytic Hierarchy Process (AHP). Both methods have been successfully applied in prior building performance and indoor environmental quality (IEQ) research. However, the combined application of these two methods remains relatively underexplored, particularly in the context of indoor environmental comfort assessment. The simultaneous application of both methods in this work allows for a more robust and comprehensive assessment by integrating both subjective judgments and objective data structures.
The CRITIC method is an objective weighting approach that quantifies the importance of criteria based on their contrast intensity and conflicting relationships. It calculates weights by evaluating both the standard deviation of each criterion (indicating variability) and the correlation coefficients between criteria (reflecting conflict). This allows for a data-driven assessment of weight allocation without relying on subjective input [45]. In this research, the CRITIC method was applied to human comfort vote data to derive sub-factor weights from inter-subject variability and correlation patterns within the same office environments.
In contrast, the AHP method is a subjective weighting technique that structures decision-making problems into a hierarchical framework. It relies on pairwise comparisons made by experts to assess the relative importance of factors, using a numerical scale to translate qualitative judgments into quantifiable priorities. The resulting weights are synthesized through eigenvalue calculation to ensure consistency in decision-maker evaluations [46]. In this study, AHP was employed to systematically compare indoor environmental sub-factors and determine their weights based on expert input.
Together, these methods provide a balanced weighting scheme that integrates both objective statistical data and expert judgment.
In this section, the field study and questionnaire survey for the CRITIC method was first conducted. Because there are many acoustic factors affecting the acoustic comfort of the subjects, the hierarchy cluster analysis was used to merge the sub-factors influencing acoustic comfort based on the results of the questionnaire survey for the CRITIC method. In the AHP method, questionnaires from subjects in three different northeastern provinces were collected online. The more refined and clear the questionnaire, the higher the quality of the responses. Therefore, to refine the questionnaire and ensure the quality of questionnaire responses, the merged sub-factors of acoustic comfort were used in the questionnaire survey for the AHP method. The above research process of this paper is shown in Figure 1.
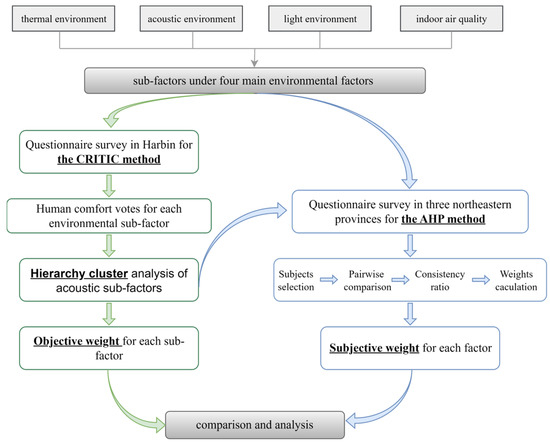
Figure 1.
Research process of this paper.
2.1. Field Study and Questionnaire Survey for the CRITIC Method
The CRITIC method is one of the objective weighting methods, which was developed by Diakoulaki in 1995 [45]. The CRITIC method utilizes the contrast intensity of indicators and the conflict degree between them to measure the weight of each indicator. Contrast intensity describes the numerical difference between the same indicator in different evaluation schemes, and it can be described by the standard deviation or other indexes reflecting data variability. The smaller the value, the less information it contains, and the smaller its weight. Conflict is the opposite of correlation. The weaker the correlation between two indicators, the stronger the conflict, the more information the indicator has, and the greater its weight.
The field measurement and questionnaire survey for the CRITIC method were conducted in Harbin, which is located in the severe cold regions of China. The subjects in this survey were 103 researchers working at 12 different open-plan offices in one building at Harbin Institute of Technology. The subjects in the same office have similar environments, but the comfort feelings of the subjects are different. The contrast intensity and the conflict degree of the comfort feelings of subjects in the same offices could be used to obtain the weights of different environmental sub-factors via the CRITIC method. Therefore, the subjects in one office were set as one group and there was a total of 12 groups. The weights of each factor for each group were calculated, and then the weighted average of the weights for each factor from 12 groups was calculated. The information of 12 offices is shown in Table 2.

Table 2.
Characteristics of 12 selected open-plan offices.
2.1.1. Field Measurement in Open-Plan Offices
To explore the indoor environmental quality of 12 offices, the point-in-time field measurements were conducted in each office every 3–4 weeks from 11 August 2018 to 19 May 2019. The Chinese standard QX/T 1 52-2012 [47] illustrated that the 5-day average outdoor air temperature was higher than 22 °C in summer and lower than 10 °C in winter, and the average temperature is between 10 °C and 22 °Cin transition seasons (autumn and spring). According to the sliding mean outdoor air temperatures of 5 days of Harbin from 11 August 2018 to 19 May 2019, the sampling period could be divided into summer, winter and transition seasons [9]. The summer spanned from 11 August 2018 to 25 August 2018, the winter spanned from 25 October 2018 to 12 April 2019, and the transition seasons were from 26 August 2018 to 24 October 2018 (autumn) and from 13 April 2019 to 19 May 2019 (spring). The field measurements covered all seasons, including two times for summer, two times for transition seasons and five times for winter. Given that summer and transition seasons are relatively short, whereas winter lasts for more than six months in severe cold regions, the number of measurements conducted in winter was greater than in summer and the transition seasons.
The recording interval for each parameter was 10 s. For the thermal environment, the indoor air temperature (°C), relative humidity (%), were measured by HOBO MX1102, and the air velocity (m/s) was measured by ST-733. Owing to the high particulate matter (PM) concentration resulting from heating, the air pollution during winter in severe cold regions is severe [48,49]. Therefore, for indoor air quality, both CO2 concentration and particulate matter (PM) were measured by HOBO MX1102 and GT-1000. For acoustic comfort, the sound level was measured by a sound analyzer (HS6288E), and for light comfort, the illuminance level of each subject’s location was measured by TES1339P. The accuracy of all devices complies with the requirements specified in ASHRAE 55–2020 [50] and EN 16798 [51]. The device for measuring the globe temperature was placed at 0.6 m. The measurement of the illuminance of each subject’s position lasted for more than 5 min and the measurements of other parameters for each office lasted for more than 1 h.
2.1.2. Questionnaire Survey
The questionnaire surveys were conducted in 12 offices after all the field measurements had already been conducted. The questionnaire surveys began with general information on subjects, including gender, age, level of education, location in the offices and body mass index (BMI). In the second part, the subjects were asked to rate their comfort feelings for sub-factors of four main indoor environmental factors of their offices during the past year. The hierarchy structure of the indoor environmental factors is shown in Figure 2, and the sub-factors of each environmental factor can be found. Three thermal factors were considered, including temperature, humidity, and air velocity. For acoustic factors, both indoor noise sources (conversation, human footsteps, chair tugging, phones ringing, door opening and closing) and outdoor noise sources (traffic noise and entertainment noise) were surveyed. The comfort evaluation of indoor air quality includes two sub-factors, which are indoor air pollution and indoor air freshness. For light comfort, the comfort feelings for natural lighting and artificial lighting were investigated. To standardize the questionnaire and reduce the response time of respondents, the seven-point scale in ANSI/ASHRAE 55-2020 [50] was used to rate the comfort feelings and the levels of disturbance of different noise sources, which is illustrated in Table 3. It should be emphasized that participants were not asked to judge the numerical values of these parameters, but rather to report how comfortable or satisfied they felt with the surrounding environmental conditions. To ensure clarity, explanatory text was provided in the questionnaire. The instructions given to participants were “The purpose of this survey is to understand your subjective comfort perception regarding each of the following environmental factors. Please rate how comfortable or satisfied you feel with these parameters (e.g., how humidity, air velocity, etc., influence your comfort).”
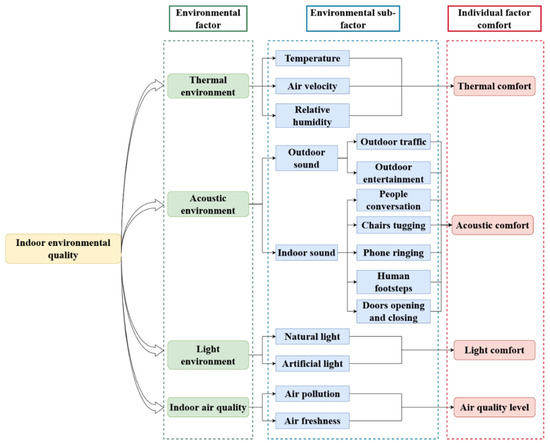
Figure 2.
Hierarchy structure of indoor environmental quality in open-plan offices considering various environmental sub-factors for the CRITIC method.

Table 3.
Comfort scales for each factor.
2.2. Hierarchy Cluster Analysis
Hierarchical cluster analysis is a statistical method used to group objects into clusters based on the objects’ characteristics [52]. A hierarchy structure of clusters should be created, which can be visualized using a dendrogram to demonstrate the composition of each factor. In this study, the clustering aimed to reduce the dimensionality of the numerous acoustic sub-factors by grouping those with statistically similar comfort disturbance ratings, thereby improving the interpretability of the AHP pairwise comparison process.
The acoustic comfort disturbance ratings were obtained from the questionnaire survey conducted for the CRITIC method. As shown in Table 4, all the sound sources were listed as clustering items and their comfort voting descriptions were calculated. Prior to clustering, the data were standardized (z-score) to eliminate scale effects. The similarity between any two acoustic sub-factors was measured using the Euclidean distance (Equation (1)), where Factor A (a1, a2, …, aj) and Factor B (b1, b2, …, bj) represent the comfort ratings from the j-th respondent (N = 103). Ward’s linkage method was applied to minimize the total within-cluster variance [53]. The SciPy library in Python 3.9.13 was used for computation.

Table 4.
Comfort voting information for 9 clustering items.
The expression of the Euclidean distance (Factor A (a1, a2, …, aj); Factor B (b1, b2, …, bj)) is as follows:
where ED is the similarity metric of sound environmental factor A and another factor B, with aj and bj denoting the comfort votes for factors A and B in the j-th questionnaire sample among 103 valid samples, The shorter the Euclidean distance, the higher the similarity of the two factors in terms of the subjective evaluation of the subjects.
The dendrogram from the hierarchical cluster analysis according to the similarity in the comfort vote is shown in Figure 3. The number of clusters was determined using the inconsistency coefficient and visual inspection of the dendrogram cut-off, following standard stopping rules for hierarchical clustering. At the first hierarchy level, the human footsteps, chairs tugging conversation, doors opening and closing, and phones ringing were clustered as the indoor noise sources, while traffic noise and entertainment noise were categorized as the outdoor noise sources. At the second hierarchy level, it is shown that doors opening and closing, and phones ringing could be categorized as cluster 1 (burst sounds), and human footsteps and chairs tugging could be classified as cluster 2 (human activity). While people talking, outdoor entertainment, and outdoor traffic are classified as cluster 3. For the outdoor noise sources, the traffic noise and entertainment noise were, respectively, classified as cluster 4 and cluster 5. This five-cluster solution was adopted for the AHP to simplify the pairwise comparisons while retaining representative acoustic categories. To ensure the robustness of the clustering results, a cophenetic correlation coefficient was computed (CCC = 0.89), indicating consistency between the dendrogram and the original distance matrix. It should be noted that the sound cluster items exhibited a coefficient of variation (CoV) exceeding 30%, The reason is that factors such as personal noise sensitivity and preference differ greatly from person to person, which leads to a widespread in comfort ratings for the same sound type. To ensure the validity of the clustering in our study, we conducted post-clustering feature mean difference analysis between clusters for each sound feature. The results indicated that the differences between clusters were statistically significant (p < 0.05), supporting the discriminative power of the clustering results.
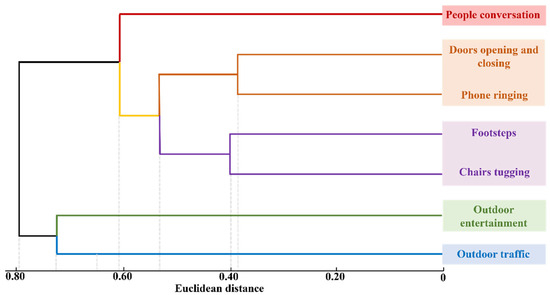
Figure 3.
Clustering Dendrogram of the acoustic environment.
2.3. Questionnaire Survey for the AHP Method
The AHP method was developed by Thomas L. Saaty in the 1970s and is valued for providing a clear, replicable methodology to support complex decision-making processes. The hierarchy of the weight system for the indoor environmental factors needed to be first constructed, and then decision-makers compare factors at each hierarchical level in pairs to judge their relative importance or preference [54,55]. Based on pairwise comparisons of different factors, the AHP method could offer an accurate description of people’s subjective judgments.
The comparison scores for the AHP method were obtained by questionnaire survey, and an online format was utilized to gather questionnaires from subjects in three northeastern provinces. To ensure the quality of questionnaire responses, the questionnaire should be thoroughly refined and clear. Thus, the merged sub-factors of acoustic comfort, derived from the hierarchy cluster analysis (Section 2.2) were used to establish the hierarchy of the indoor environmental quality for the AHP method, which is shown in Figure 4. All the selected experts were from the construction industry and they all have the experience to study in open-plan offices. To ensure the validity and accuracy of the questionnaire surveys, the working places of subjects were distributed in three different provinces in severe cold regions.
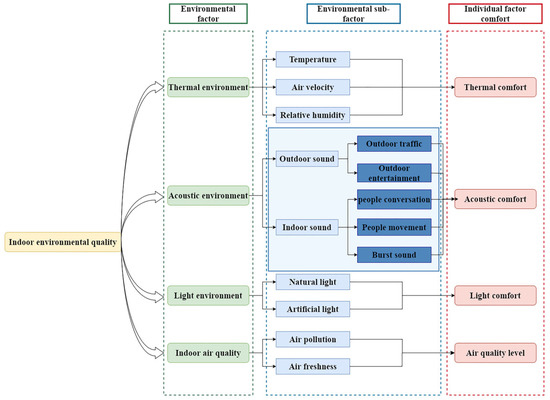
Figure 4.
Hierarchy structure of indoor environmental quality in open-plan offices considering the clustering results of acoustic environmental factors for the AHP method.
The questionnaire was designed based on ANSI/ASHRAE 55-2020 [50] and EN 16798 [51]. A 9-point numerical scale ranging from 1 to 9 was adopted, with 1 representing equal importance. This scale corresponds to the thermal sensation scale used in ASHRAE 55 for assessing thermal comfort, ensuring consistency and comparability when evaluating the relative importance of each sub-factor. The specific questionnaire settings are presented in Appendix B. The complete responses from each participant together form a pairwise comparison judgment matrix for all factors. To avoid order bias, the presentation order of the pairwise combinations was randomized to ensure the sequence in which each factor pair appeared was random. Before starting the questionnaire, clear and concise definitions were provided for each comfort factor to ensure a consistent understanding among all participants.
The questionnaire survey started with the basic data of the subjects, including gender, age, and working location. The second part presented the pairwise comparison questions, requiring subjects to evaluate each comfort factor relative to another using a specified quantity scale [56]. The quantity scale is shown in Table 5. The subjects could require clarification if they did not understand the questions well, ensuring that the questionnaire could effectively convey their thought.

Table 5.
Quantity scales and linguistic scales for the AHP method.
3. Results and Analysis
3.1. Weight System for the CRITIC Method
3.1.1. Indoor Environmental Parameters and Profile of the Sample
A total of 108 point-in-time field measurements were conducted to study the indoor environmental quality of 12 offices. The average values for the air temperature, air velocity, and relative humidity for three seasons for each office were provided in Figure 5. The mean air temperatures in summer and winter were higher than those in transition seasons, but the mean outdoor air temperature in winter was −3.5 °C, far lower than in transition seasons (15.1 °C) [9]. This phenomenon was due to overheating in Harbin in winter.
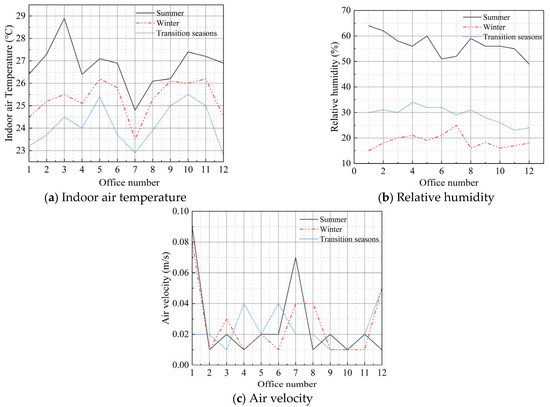
Figure 5.
Average values for thermal parameters in different offices.
The average values for PM2.5 concentration, CO2 concentrations, A-weighted sound levels and illuminance level during point-in-time studies are also shown in Table 6, and the recommended criteria in corresponding standards were also listed. For indoor air quality, the mean PM2.5 concentrations of all rooms were lower than the limit value of the 24 h average PM2.5 concentration (75 ) in GB3095 [57], but it should be noted that the PM2.5 concentrations in winter were over the limit value in several conditions. The mean CO2 concentrations of four offices slightly exceeded the limit value of 1000 ppm according to GB18883 [58], and the values of other offices were less than but close to the limit value, which revealed that the indoor air was not very fresh. The mean A-weighted sound levels of all offices in this study were around 50 dB(A), all meeting the limit value in JGJ/T 229 [59] and GB 3096 [60], which is 55 dB(A). According to GB50034-2013 [61] and EN16798 [51], the lower limit of illumination value in the open-plan offices was 500 lux, and only two offices meet this level, which indicates that the daylighting conditions in the twelve offices are suboptimal. The number of subjects in each open-plan office is shown in Figure 6, and the basic information of subjects is shown in Figure 7.

Table 6.
Average values for the PM2.5 concentration, CO2 concentration, A-weighted sound level and illuminance level for three seasons for each office.
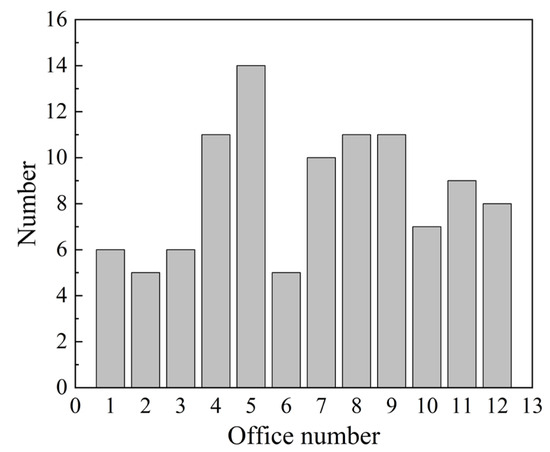
Figure 6.
Numbers of subjects for different offices.
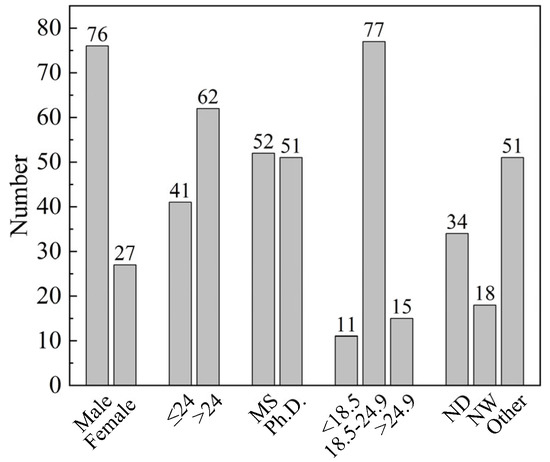
Figure 7.
Basic information of subjects. For Figure 7, “ND” means near door, “NW” means near windows, and “Other” means other positions.
3.1.2. Process of the Analysis of the CRITIC Method
The CRITIC method is a method for scientific weight assessment by considering the volatility of the data. It uses the contrast intensity and conflict between evaluation indicators to comprehensively measure the objective weight of indicators. The former refers to the difference in the value of environmental factors in different evaluation schemes, and the latter reflects the amount of similar information between different factors. By taking into account the variability of indicators while also considering their relevance, this method can avoid the problem of neglecting the connection between the data due to the subjective experience. The processes of the CRITIC method are shown in Figure A1 of the Appendix A and the steps of the CRITIC method are as follows:
Step 1. Assuming that there are m valid questionnaires, and n environmental sub-factors in a certain environmental domain are selected to analyze and evaluate their impact on corresponding human comfort. The original evaluation matrix X is established according to the value of the comfort votes from the questionnaire survey, as illustrated in Equation (2).
where xij is the comfort vote of questionnaire i concerning environmental sub-factor j.
Step 2. The comfort vote levels available in decision matrix are normalized and transformed into standard scales, which range between 0 and 1, as illustrated in Equation (3).
where aij is the normalized comfort vote of subject I for environmental sub-factor j. is the best comfort vote of environmental sub-factor j, with denoting the worst comfort vote of environmental sub-factor j.
Step 3. Calculate the contrast intensity of environmental sub-factor j, and use standard deviation as the measure of contrast intensity. The specific expression is as follows:
where σj represents the standard deviation of environmental sub-factor j, and is the mean comfort vote of environmental factor j.
Step 4. The linear correlation coefficient between environmental sub-factors j and k is calculated through the following equation:
The sum shown in Equation (6) represents the conflict between environmental factor j and other environmental factors within the same domain.
Step 5. The amount of information emitted by the j-th environmental sub-factor is determined by quantifying the contrast intensity and the conflict index through the following multiplicative aggregation Equation (7):
where Cj represents the information content of environmental sub-factor j. The higher the value Cj, the larger the amount of information transmitted by the corresponding environmental sub-factor, which reflects its relative importance for comfort feelings.
Step 6. The objective weights are obtained by normalizing Cj to unity according to the following Equation (8):
where wj is the weight of environmental sub-factor j.
3.1.3. Weight System of Thermal Comfort
The weights of four main environmental factors were investigated and described in our previous paper [9], and the weight results were cited in this study. As shown in Figure 8, the influences of the thermal and sound environment are far larger than the other factors, with weights of 31.8% and 30.1%. The third highest weighted factor is indoor air quality, with a weight of 22.4%, while the last factor is light environment, with a weight of 15.7%.
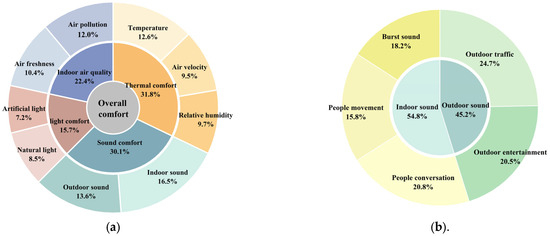
Figure 8.
Average weights by the CRITIC method. (a) Average weights of environmental sub-factors covering four main environmental domains. (b) Average weights of indoor and outdoor acoustic environmental sub-factors.
The weights of each sub-factor of each office were calculated using CRITIC method, and the average results of the weights of different environmental sub-factors were analyzed and illustrated in Figure 8. For the thermal environment, it is shown that the average weight of temperature was 39.7%, which was higher than those of air velocity and relative humidity, which were 29.9% and 30.4%, suggesting temperature has more influence on human thermal comfort. More detailed weight results can be found in Figure 9. 11 of the total 12 offices studied showed that the weight of temperature was the highest, further confirming the importance of temperature relative to air velocity and relative humidity. In addition, it can be seen that the weights of air velocity and relative humidity fluctuated within a similar range of values. Considering that the average weights of these two factors were also approximately identical, it is reasonable to assume that they have the same effect on thermal comfort.
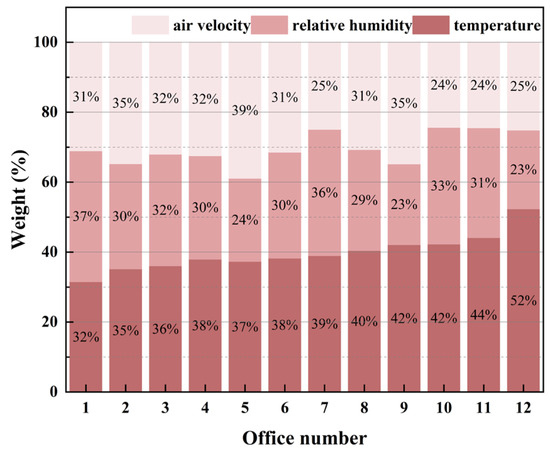
Figure 9.
Weight results of thermal environmental sub-factors by the CRITIC method.
3.1.4. Weight System of Acoustic Comfort
The comparative importance of indoor and outdoor sound on acoustic comfort in open-plan offices is summarized in Figure 8b and Figure 10. The results indicate that indoor sound had an average weight of 54.8%, compared to 45.2% for outdoor sound. Although over 80% of individual weight values assigned to indoor sound were higher than those for outdoor sound, the difference between the two was generally small—within 10% in most cases. This suggests that both indoor and outdoor acoustic environments are of considerable importance to acoustic comfort in open-plan offices.
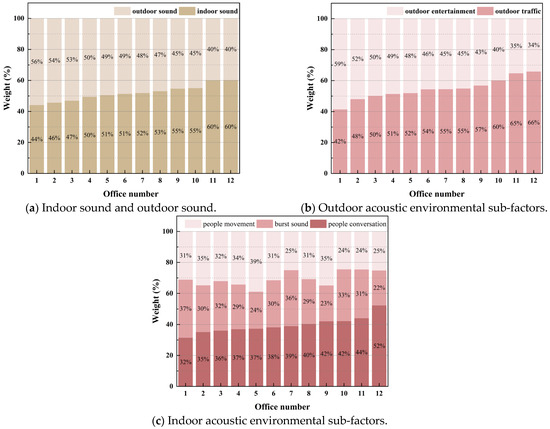
Figure 10.
Weight results of acoustic environmental sub-factors by the CRITIC method.
Further analysis of sub-factors within each category (Figure 10b,c) shows that for outdoor acoustic comfort, traffic noise received an average weight of 54.6%, slightly higher than that of outdoor entertainment noise (45.4%). In more than 75% of the cases derived from the CRITIC method, traffic noise was assigned a weight exceeding 50%, indicating a consistently but not dominantly higher influence compared to entertainment noise. It can thus be concluded that both outdoor traffic and entertainment sounds significantly affect acoustic comfort, with traffic noise having a marginally stronger impact.
Regarding indoor acoustic comfort, it can be seen from Figure 10c that the average weights of people’s conversation, burst sound and people movement were 37.9%, 33.2%, and 28.9%, respectively. 75% of the weight results of people conversation exceeded the other two indoor acoustic factors, fluctuating from 34% to 47.1%, while the weights of burst sound were the highest in the remaining 25% of the weight data, fluctuating from 36% to 43.6%. In addition, among all the weight results, half of the weights of burst sound were higher than those of people’s movement, and in 33.3% of the weight results, these two factors were nearly equal, with a difference of less than 3%. Therefore, it can be inferred that people conversation has the largest impact on indoor acoustic comfort, followed by burst sound, and people movement is slightly less influential than the above two factors.
3.1.5. Weight System of Light Comfort
For light comfort, the average weight of natural light was 54.2% due to Figure 8a, slightly higher than the average weight of artificial light, which was 45.8%. The weight results of natural light and artificial light were also depicted in Figure 11. It could be seen that two-thirds of the weights of the natural light were higher than those of artificial light, reflecting that the influence of natural light on light comfort in open-plan offices is greater than artificial light in most cases. It should also be noted that the weights of artificial light, ranging between 36.2% and 50.1%, although slightly lower than natural light, can still reach a relatively high level, indicating that artificial light is an environmental factor that cannot be ignored when considering light comfort in offices.
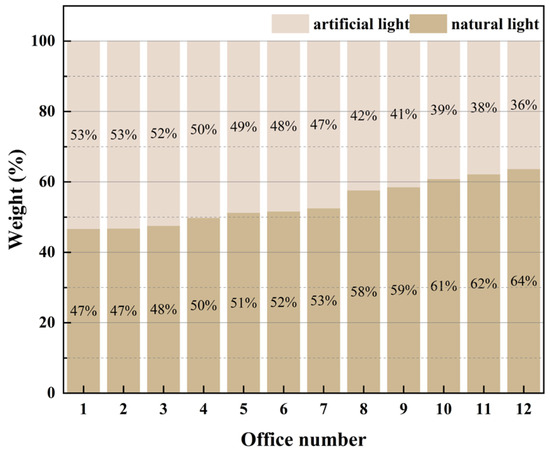
Figure 11.
Weight results of light environmental sub-factors by the CRITIC method.
3.1.6. Weight System of Comfort of Indoor Air Quality
For the indoor air quality, the weights of air freshness and air pollution were also compared and shown in Figure 12. The weight range of air pollution was 42.2–62.3%, with an average value of 53.6%, while the weight range of air freshness was 38.7–57.8%, with an average value of 46.4%. 75% of the weight results indicated that the impact of air pollution on the comfort of indoor air quality is greater than air freshness, but most of the weight differences between the two factors were not large, typically less than 10%, suggesting that both the two environmental factors need to be taken into account when evaluating the comfort feelings of air quality in open-plan offices.
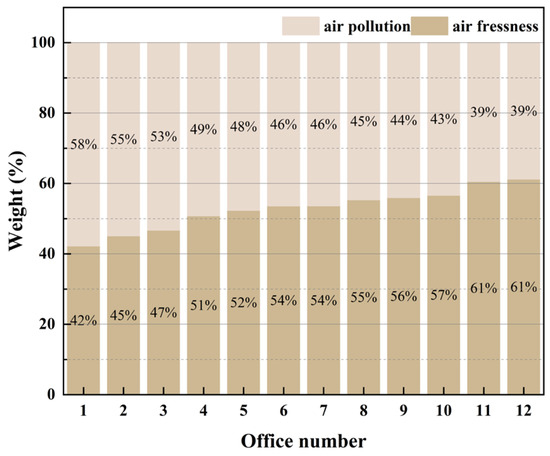
Figure 12.
Weight results of indoor air quality sub-factors by the CRITIC method.
3.2. Weight System for the AHP Method
3.2.1. Profile of the Sample
The basic information of the subjects is shown in Figure 13. A total of 230 questionnaires were collected in the three provinces of Heilongjiang, Jilin and Changchun in severe cold regions of China, which can be seen in Figure 14. All participants were from the construction industry and had experience conducting research in open-plan offices. There were roughly equal numbers of males and females, which were 94 and 86, respectively.
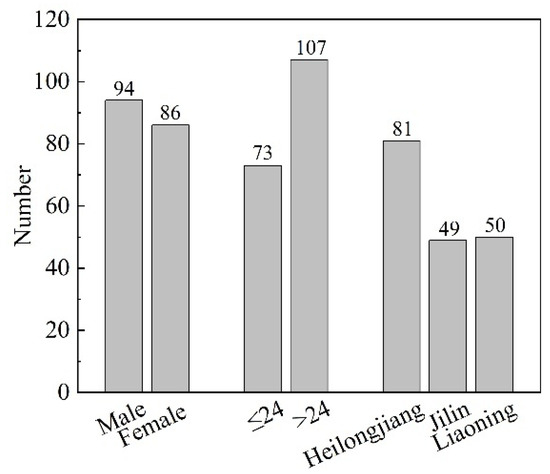
Figure 13.
Basic information of the subjects for the AHP method.
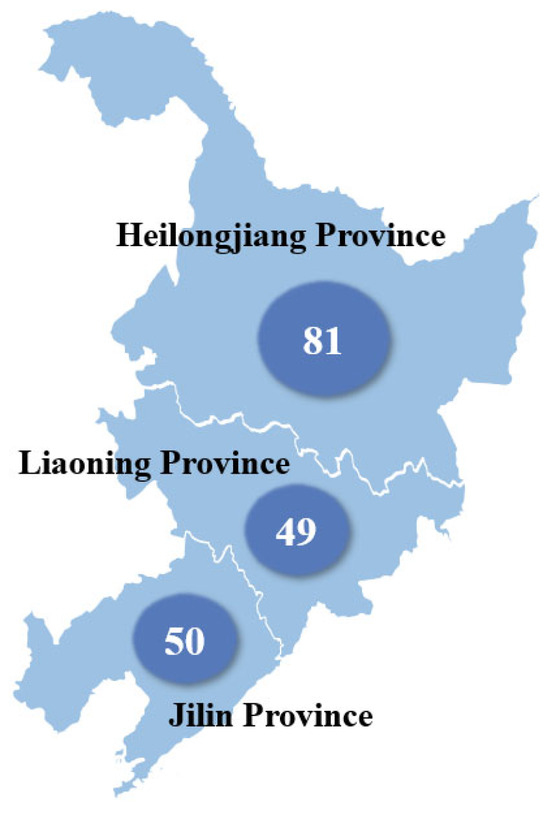
Figure 14.
Distribution of the number of questionnaires collected in three northeastern provinces.
3.2.2. Process of the Analysis of the AHP Method
Based on the human comfort votes obtained from the questionnaire survey, the AHP method, which calculates the numerical weights representing the relative importance of each environmental parameter by solving the eigenvectors of the judgment matrix, is applied. The AHP weighting evaluation relies on the concept of pairwise comparisons and it offers an accurate description of people’s subjective judgments. The processes of the AHP method is shown in Figure A2 of the Appendix A and the steps of the AHP method to obtain the subjective weights are as follows:
Step 1. A pairwise comparison judgment matrix derived from comfort votes of the questionnaire k is developed, which is shown as follows:
where aij denotes the quantitative value representing the relative importance of environmental factor i over environmental factor j, and n denotes the number of environmental sub-factors, since different sub-factors were included, the values of n for the thermal environment, acoustic environment, indoor sound, outdoor sound, visual environment, and indoor air quality were 3, 2, 3, 2, 2, and 2, respectively.
Step 2. Each column of the judgment matrix was regularized using the column vector normalization method, as expressed in Equation (10)
where is the element of column j in row i of the regularized judgment matrix.
Step 3. The subjective weights of environmental sub-factors in each environmental domain were calculated by Equation (11).
where is the weight of environmental factor i.
Step 4. The maximum eigenvalue is calculated using Equation (12).
Then, the consistency ratio CR was calculated through Equation (13).
where RI is the average random consistency index, and n represents the matrix size. For a matrix size of 3, the consistency ratio (CR) threshold was predefined, and any value for CR exceeding 0.10 was deemed unacceptable and was excluded from the final analysis [9]. This procedure ensures that the data ultimately used for calculating the weights are derived from logically consistent judgments.
If the judgment matrix passes the consistency test, the above calculation results can be used as the data source for the subjective weights of the environmental sub-factors. Using the analytic hierarchy process (AHP) and considering only data that passes the consistency test, the subjective weights of the environmental sub-factors of each valid questionnaire and the average weights can be calculated.
3.2.3. Weight System of Thermal Comfort
The average weight results of the AHP method were analyzed and shown in Figure 15, in which the relative importance of various thermal environmental factors affecting thermal comfort was presented. The average weight of 180 valid weight results of temperature was 45.4%, which was higher than those of air velocity (27.0%) and relative humidity (27.6%). In addition, as shown in Figure 16, 56.7% of the weight results of temperature were higher than the other two thermal factors and only 23.9% of the results showed that the weights of temperature were less than air velocity or relative humidity, with the remaining 19.4% of the results giving equal weight to all the three factors. Most of the weight results of temperature were in the range of 30–80%, and the distribution of weight data was relatively scattered, with 38.9% of the weights in the range of 30–50% and 40% in the range of 50–80%. Thus, it could be concluded that most subjects considered temperature as the most important factor influencing human thermal comfort in open-plan offices. For air velocity and relative humidity, apart from the fact that the average weights were extremely close, 50.4% of the weight results showed that the weight differences between these two thermal environmental factors were less than 10%. Although the weight differences were larger in the remaining 49.6% of the weight results, the distribution of the weights of air velocity and relative humidity was very similar on the whole, with the number of weight results of air velocity exceeding relative humidity approximately the same as the number of weight results of relative humidity exceeding air velocity, indicating that these two factors are equally important to thermal comfort in open-plan offices.
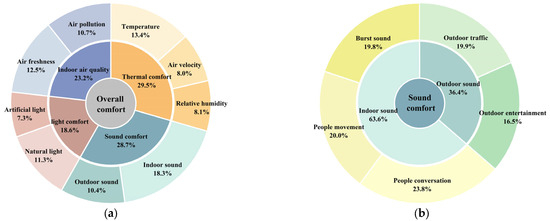
Figure 15.
Average weights by the AHP method. (a) Average weights of environmental sub-factors covering four main environmental domains. (b) Average weights of indoor and outdoor acoustic environmental sub-factors.

Figure 16.
Weight results of thermal environmental sub-factors by the AHP method.
3.2.4. Weight System of Acoustic Comfort
For acoustic environmental sub-factors, it was obvious that the average weight of indoor sound (63.6%) was higher than that of outdoor sound (36.4%), as illustrated in Figure 15b. The weights of indoor sound and outdoor sound were also shown in Figure 17. Among the total 180 weight results, 56.7% of subjects gave higher weights to indoor sound than to outdoor sound and 28.9% results gave equal weights to them. Only 14.4% of the results showed that outdoor sound outweighed indoor sound. In addition, in 45% of the weight results, the weights of indoor sound were at least 20% higher than the weights of outdoor sound. The comparison revealed that indoor sound has a more important impact on human acoustic comfort than outdoor sound, which was different from the results obtained by the CRITIC method.
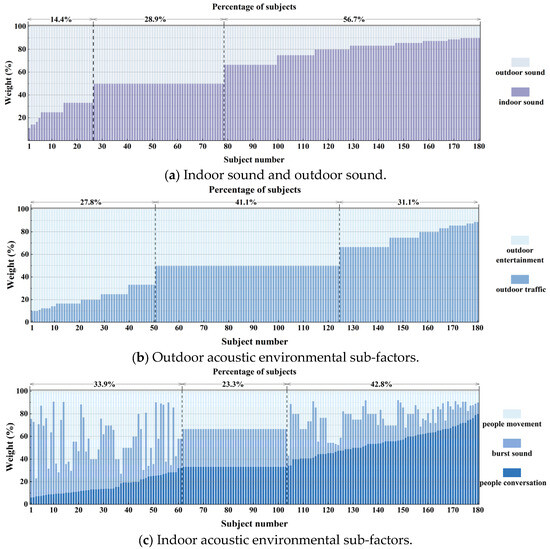
Figure 17.
Weight results of acoustic environmental sub-factors by the AHP method.
For the outdoor acoustic environmental factors, it could be observed that the average weights of outdoor traffic and outdoor entertainment were almost identical, which were 50.4% and 49.6%, respectively. The weights of the sub-factors for outdoor acoustic comfort and indoor acoustic comfort were also presented in Figure 17b,c. 41.1% of the subjects gave outdoor traffic and outdoor entertainment the same 50% weight. Although the weights of outdoor traffic and outdoor entertainment fluctuated across all 180 results, the similar distribution of values was sufficient to confirm the equal importance of both the two outdoor acoustic factors.
For indoor acoustic environmental factors, it could be seen from Figure 15b that the average weights of people conversation, burst sound, and people movement were 37.3%, 31.2%, and 31.5%, respectively. The distribution of the weights shown in Figure 17c was helpful to further compare the importance of the three indoor acoustic factors. For people conversation, 42.8% of the weight results showed that it was the most important factor influencing human indoor acoustic comfort. As for burst sound and people movement, it can be noted that except for the close average weight values, the weight distribution of these two factors was also very similar. 23.3% of weight results gave equal weights to them and in the rest of weight results. The proportion of results indicating that the impact of burst sound was greater than people movement (34.4%) was about the same as the impact of people movement was greater (35.6%). Thus, it could be concluded that burst sound and people movement have similar effects on human acoustic comfort in open-plan offices, slightly less than the impact of people communication.
3.2.5. Weight System of Light Comfort
To investigate the relative importance of natural light and artificial light on human light comfort, the weights of these two factors were analyzed and presented in Figure 15a and Figure 18. The average weight of natural light was 61%, which was significantly higher than that of artificial light, which was 39%. In addition, 51.6% of the weight results gave higher weights to natural light than to artificial light and only 16.7% of the results showed the opposite trend. The remaining 31.7% of the results showed that the two factors were equally weighted. In general, it could be concluded that natural light has more impact on human light comfort than artificial light in open-plan offices in severe cold regions.

Figure 18.
Weight results of light environmental sub-factors by the AHP method.
3.2.6. Weight System of Comfort of Indoor Air Quality
The comparison of the weights of air pollution and air freshness can be found in Figure 15a and Figure 19. The average weights of air pollution and air freshness were 53.8% and 46.2%, respectively. The weight distribution of air freshness is similar to that of air freshness. However, since the number of weight results that showed air pollution with a higher weight than air freshness accounted for 40.5%, higher than the number that showed air freshness with a higher weight than air pollution, which is 28.9%, it is reasonable to conclude that air pollution is a little more important than air freshness in affecting human perception for indoor air quality.

Figure 19.
Weight results of air quality sub-factors by the AHP method.
4. Discussion
4.1. Comparison Between the CRITIC and AHP Method for the Importance of IEQ Sub-Factors
In general, there is a good agreement between the CRITIC method and the AHP method when taking the average weights for various environmental sub-factors into consideration. This convergence between subjective and objective weighting approaches enhances the robustness and credibility of the identified priority factors. As illustrated in Figure 8 and Figure 15, both the objective method and the subjective method yielded similar thermal environmental factor weight results. The average weights of temperature, air velocity, and relative humidity by the CRITIC method were 39.7%, 29.9%, and 30.4%, while those by the AHP method were 45.5%, 27.0%, and 27.5%. These two methods are very consistent in ranking the importance of the three factors, with almost identical weights given to air velocity and relative humidity and the weight of temperature higher than the above two. Although in terms of specific values, the temperature weight calculated with the AHP method was slightly higher than that by the CRITIC method, the two methods can be mutually justified from a qualitative point of view, confirming that air velocity and relative humidity have almost identical impact on human thermal comfort and the influence of temperature is higher. More importantly, the integration of both methods provides a more nuanced understanding—objective data validates subjective perceptions, while subjective weights contextualize objective metrics, offering deeper insight into occupant comfort drivers. Moreover, the weight data distribution of thermal environmental sub-factors by the CRITIC method and the AHP method is also illustrated in Figure 20. It can be seen that although the average weights obtained by the two methods are approximate, the weight results obtained by the AHP method are more dispersed, which may be caused by the emphasis on the subjects’ experience and preference by the subjective weighting method. This dispersion reflects meaningful individual differences in comfort perception, highlighting the value of combining methods to capture both average trends and human variability.
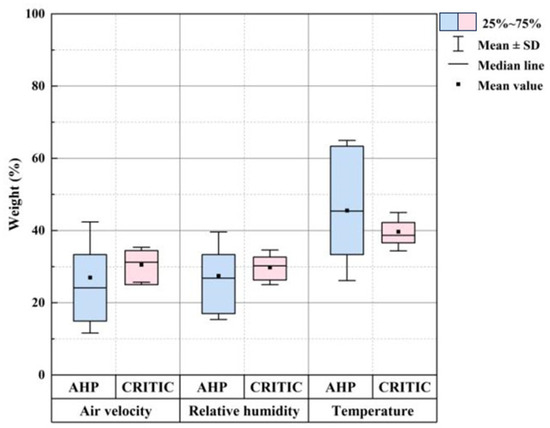
Figure 20.
Weight distribution of thermal environmental sub-factors by the CRITIC method and the AHP method.
As for the acoustic environmental sub-factors, as shown in Figure 8b and Figure 15b, the average weights of indoor sound and outdoor sound by the CRITIC method were 54.8% and 45.2%, respectively, while those by the AHP method were 63.6% and 36.4%. The weight data distribution of acoustic environmental sub-factors is also illustrated in Figure 21. Both the two methods indicate that indoor sound has more impact on human comfort than outdoor sound. However, the weight values calculated by the two methods are not very consistent. Indoor sound is more important in the CRITIC analysis than in the AHP analysis. As for the comparison between indoor sound and outdoor sound, the average weights of outdoor traffic and outdoor entertainment by the CRITIC method were 54.6% and 45.2%, while those by the AHP method were 50.4% and 49.6%. The average weight of outdoor traffic was slightly higher than that of outdoor entertainment according to the results obtained through the CRITIC method, while in the AHP analysis, the weights of the two outdoor acoustic factors were nearly equal. The difference between the two methods was relatively small, so it can be assumed that outdoor traffic and outdoor entertainment have roughly the same impact on human acoustic comfort in open-plan offices. Furthermore, the urban setting, with its characteristic external noise sources and proximity to other buildings, helps explain the significant weight participants assigned to outdoor noise sources. When it comes to the indoor acoustic environmental factors, the average weights of people conversation, burst sound, people movement by the CRITIC method were 37.9%, 33.2%, and 28.9%, respectively, while those by the AHP method were 37.3%, 31.2%, and 31.5%. The weights calculated by the two methods were very similar, which makes the results more credible. In terms of their impact on human acoustic comfort in open-plan offices, burst sound ranks in the same league as people movement and slightly below human conversation.
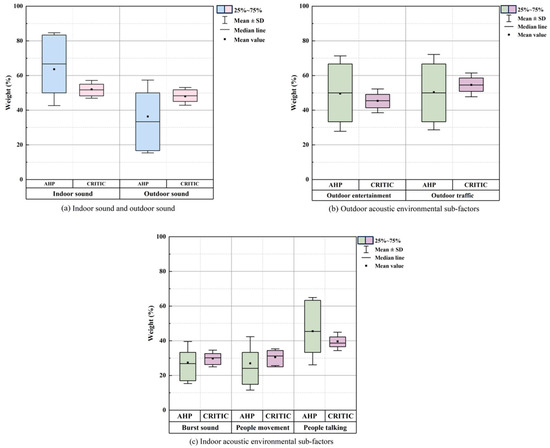
Figure 21.
Weight distribution of acoustic environmental sub-factors by the CRITIC method and the AHP method.
In terms of the light environmental sub-factors, as shown in Figure 8a and Figure 15a, the average weights of natural light and artificial light by the CRITIC method were 54.2% and 45.8%, respectively, while those by the AHP method were 61% and 39%. Figure 22 shows the weight distribution of natural light and artificial light. Both these two methods suggest that natural light is slightly more influential than artificial light in open-plan offices despite the larger weight differences between these two factors calculated by the AHP method. In addition, as shown in Figure 23, a great agreement can be observed between the weights of air pollution and air freshness obtained from the two methods. The average weights for air pollution and air freshness by the CRITIC method are 53.6% and 46.4%, respectively, while those by the AHP method are 53.8% and 46.2%. The results confirm that in severe cold regions that rely heavily on winter heating, both air freshness and air pollution have a huge impact on human perception of indoor air quality.
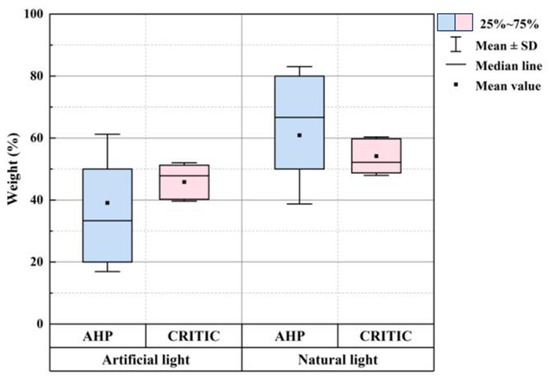
Figure 22.
Weight distribution of light environmental sub-factors by the CRITIC method and the AHP method.
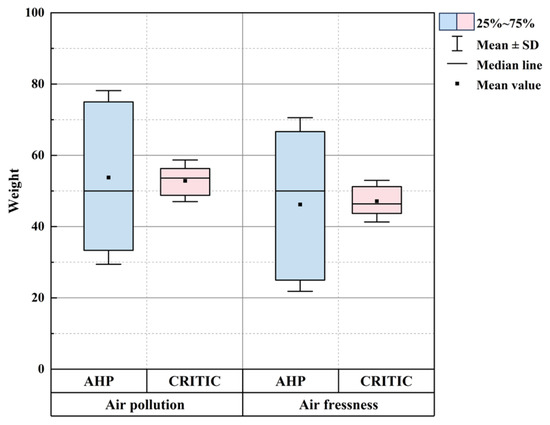
Figure 23.
Weight distribution of indoor air quality sub-factors by the CRITIC method and the AHP method.
In general, when it comes to the average weight comparison of two factors, the AHP method tends to widen the weight difference between the factors compared to the CRITIC method. In addition, the weight distribution indicates that a larger range of weight fluctuations of different subjects can be seen in the AHP method. This phenomenon may be attributed to greater emphasis on the subjective judgment of research subjects by the AHP method. However, the two weighting methods give a consistent ranking of various environmental sub-factors according to their impact on human comfort and even provide very close average weight values. The key contribution of this comparative analysis lies not in restating established factor importance, but in methodologically demonstrating how hybrid weighting approaches can reconcile objective data with human perception, thereby improving decision support for IEQ optimization in open-plan offices. This combined approach is particularly valuable for designing adaptive environmental control systems that respond to both measurable parameters and occupant preferences. The combination of subjective and objective weighting methods makes the results more reliable and is helpful to better understand the role of each environmental sub-factor on indoor environmental quality.
4.2. Analysis of the Importance of Various Environmental Sub-Factors
The weighting scheme for the four main environmental factors of open-plan offices proposed by our previous study [9] showed that the thermal environment and acoustic environment are the most crucial factors affecting indoor environmental quality, followed by indoor air quality. Although the light environment has the least weight, its influence cannot be ignored.
4.2.1. Thermal Comfort
The importance of thermal environmental factors in this study suggested that the influence of temperature on thermal comfort is greater than that of air velocity and relative humidity in open-plan offices. The study of Kaushik [37] on the indoor environmental quality of office buildings confirmed the important role of temperature compared to relative humidity. Zhan [40] and Jia [41] also conducted studies on nursing rooms and classrooms, respectively, which reached similar conclusions, indicating that temperature has a significant impact on thermal comfort in different types of buildings. In addition, the study of Xue [33] on the indoor environmental quality of high-rise residential buildings showed that the correlation between thermal comfort and air velocity is stronger than that with temperature, which is different from the conclusion of this study. This may be attributed to the differences in the use function of the buildings studied and the subject groups. The quantitative results of this paper show that although temperature, with a weight of 39.7% by the CRITIC method and a weight of 45.5% by the AHP method, has a significant effect on thermal comfort, people’s perception of the thermal environment in open-plan offices is not entirely dependent on temperature. Relative humidity and air velocity also have an undeniable impact on thermal comfort, and it should be noted that the degree of influence of these two factors is roughly the same.
4.2.2. Acoustic Comfort
For the acoustic environment, this study showed that the impact of indoor noise on the acoustic comfort of open-plan offices is slightly higher than that of outdoor noise. Kang’s study on open-plan offices [34] and Yang and Mak’s study on university classrooms [38] confirmed this conclusion, but Lai’s study on residential buildings [32] showed that outdoor noise has a greater impact on the indoor sound environment. Comparing the findings in this study with those of the above studies, it can be inferred that in classrooms, open-plan offices, and other places with high personnel density and long-term engagement in learning, research, or work tasks, indoor noise is more likely to be annoying. When it comes to various indoor noise sources, conversation is the most likely indoor noise source to cause discomfort in open-plan offices, while people movement such as footsteps, as well as burst sound such as phone ringing, is ranked second. Kang’s research on university open-plan offices [34] also gave a consistent conclusion, showing that conversation caused the highest perceived annoyance level, followed by phone ringing, human activity, doors opening and closing, and footsteps. Compared with other noises, conversation contains more information and is thus more likely to cause distraction. Therefore, a high level of speech privacy is crucial for a comfortable indoor acoustic environment in open-plan offices. The quantitative weighting results not only rank the impact of various sound environmental sub-factors but also indicate that their influence gap is not particularly large, suggesting that researchers in open-plan offices are sensitive to multiple sound sources. The results also explain why the requirements of researchers for the sound environment are higher than normal office workers and quietness is a very important criterion for researchers’ comfort feelings. By quantifying the relative annoyance of specific noise types and confirming their clustering, this study offers actionable insights for acoustic design priorities in research-intensive workspaces, highlighting the need for holistic noise management rather than single-source solutions.
4.2.3. Light Comfort
For light environment, previous studies by Kang et al. [34] and Yang et al. [38] showed that natural light has a greater effect than artificial light. In this study, both subjective and objective weighting results showed that the weight of natural light exceeded that of artificial light. However, it should be noted that compared to university classrooms, the weight difference between natural light and artificial light in open-plan offices is smaller, and the weight proportion of artificial light has increased. This indicates that reasonable artificial light conditions, including illuminance, color temperature, illumination time, etc., are particularly necessary in office settings. This finding emphasizes the importance of adaptable lighting systems in open-plan offices, contributing to more energy-efficient visual comfort solutions.
4.2.4. Comfort of Indoor Air Quality
For indoor air quality, according to the results of previous studies by Xue et al., Kaushik et al. and Piasecki et al. [33,37,39], CO2 concentration directly affects air freshness and is an important indicator of indoor air quality. This is also verified by the objective and subjective weight values of air freshness in this paper. In addition, it should be noted that the weight of air pollution is very close to that of air freshness. In severe cold areas, long-term heating in winter will lead to an increase in the content of pollutants such as PM2.5 in the air, causing discomfort and even physiological health problems. This regional characteristic can explain the almost equally important impact of air pollution and air freshness on indoor air quality in open-plan offices. The balanced weights of these sub-factors highlight a key regional indoor air quality challenge and indicate the necessity of indoor ventilation and filtration in cold climates.
The surveyed office buildings all feature a rectangular layout and are situated in dense urban areas. From a thermal comfort perspective, the elongated form of rectangular buildings may impact the distribution of solar gain and ventilation efficiency. Combined with the mid-to-high urban building density, which can restrict airflow and exacerbate urban heat island effects, these factors contribute to non-uniform thermal conditions and increased cooling or heating demands, highlighting the importance of effective HVAC system design and localized thermal control. From an acoustic standpoint, the regularity of the rectangular plan amplifies noise propagation, particularly along the longer axis. The presence of surrounding commercial or residential structures further makes external noise sources a major factor affecting indoor acoustic comfort. In terms of visual environment, although the rectangular layout facilitates the arrangement of exterior windows, natural lighting efficiency is partially compromised due to shading from adjacent buildings and the inherent depth of the floor plan, underscoring the need for strategic artificial lighting integration. The rectangular building morphology and its urban context collectively shape the multi-domain physical environmental performance. This integrated perspective not only helps explain the weighting results obtained in this study but also provides practical insights for holistic environmental design in future urban office spaces.
It should be noted that different countries, regions, and building forms may lead to differences in the perception of the same environmental sub-factors. Individual factors such as gender and age also affect sensitivity to indoor environmental quality. Nevertheless, the weight values provided in this paper can still help to provide a clearer and more accurate understanding of the impact of various environmental sub-factors on corresponding human comfort. Combined with our previous research on the quantitative relationship between the comfort level of four main environmental domains and overall comfort level, a more comprehensive and systematic understanding of the hierarchy of indoor environmental quality in open-plan offices can be achieved. Therefore, the aim of this study is to provide an effective and multi-method framework for quantifying the weights of sub-factors and to demonstrate their application in specific building types and climatic contexts. This method can achieve more targeted IEQ intervention and provide replicable approaches for future research in different environments.
4.3. Application of the Study
This study explores the potential for advancing the understanding of human comfort by integrating objective (CRITIC) and subjective (AHP) weighting methods, which enables a comparative analysis that contributes to a more reliable evaluation of sub-factor importance. The combined approach demonstrates a systematic methodology to bridge empirical measurements and subjective perception in indoor environmental quality research. The study offers a methodological framework that could support prioritizing interventions in office design and operation, based on the comparative findings. This approach could also be adopted in other regions or building types to help ensure that resources are allocated to the factors that most influence occupant comfort.
It is important to note that the data for this study were collected prior to the global COVID-19 pandemic. The pandemic may have significantly altered occupants’ subjective perceptions and expectations regarding indoor environmental quality, particularly concerning ventilation and air quality. As a result, the questionnaire-based perceptual findings reported in this study should be regarded as a pre-pandemic benchmark, providing crucial baseline data for future research investigating the long-term impact of the pandemic on IEQ perception. Furthermore, while the objective IEQ measurements offer a reliable record of indoor environmental conditions during the study period, ongoing climate change may influence building environmental performance over time. Subsequent studies are encouraged to monitor and explore these potential developments.
5. Conclusions
In this paper, the relative importance of various sub-factors covering the four main environmental domains of indoor environmental quality (thermal environment, acoustic environment, light environment, and indoor air quality) was studied using subjective–objective combined weighting method. The weight results were analyzed and compared and the findings are as follows:
1. In terms of acoustic comfort, cluster analysis revealed that sound sources can be categorized into indoor and outdoor groups. Outdoor sounds were classified into traffic and entertainment noise, while indoor sounds included conversation, burst sound, and movement noise. The consistently higher impact of indoor sounds suggests that noise control measures in open-plan offices should prioritize reducing indoor noise sources, especially conversation noise, through spatial planning and acoustic design.
2. Regarding thermal comfort, temperature was consistently identified as the most influential factor, followed by relative humidity and air velocity, which demonstrated similar weight values. This indicates that thermal comfort management should focus primarily on temperature control while maintaining adequate regulation of humidity and air movement, as these factors collectively contribute to occupants’ comfort perception.
3. For light comfort, both methods assigned greater importance to natural light over artificial lighting. This finding supports the importance of incorporating sufficient natural lighting through building design while ensuring that artificial lighting systems provide adequate supplemental illumination where needed.
4. In the context of indoor air quality, the weights for air freshness and air pollution were very close. This indicates that in severely cold climates, indoor air quality management should address both fresh air supply and pollution control simultaneously to ensure occupant comfort and health during extended heating periods.
There is still a need for more extensive questionnaire surveys with a larger and more diverse sample of subjects to enhance the robustness and generalizability of our findings. Future studies should specifically target a broader range of locations and demographic variations within cold regions of China to improve the applicability and generalizability of the results. In addition, comparative analysis with post-pandemic indoor environmental quality data should be incorporated to examine how recent changes in occupant behavior, ventilation preferences, and health awareness may have altered comfort requirements and adaptive patterns. Such comparisons would help identify evolving trends and new influencing factors in human comfort perception under different health-related conditions. In addition, more aspects of different environmental sub-factors should be taken into consideration to enable a more comprehensive and accurate quantitative analysis of their relative importance to human comfort in open-plan offices.
Author Contributions
Conceptualization, Z.L. and Q.Z.; Methodology, Z.L. and G.S.; Software, Y.L.; Validation, Z.L., G.S. and J.Y.; Formal analysis, J.Y.; Investigation, G.S.; Resources, Q.Z.; Writing—original draft, Z.L.; Writing—review & editing, Z.L., G.S., J.Y. and Y.L.; Visualization, Y.L.; Supervision, Q.Z.; Funding acquisition, Z.L., G.S. and Q.Z. All authors have read and agreed to the published version of the manuscript.
Funding
This study was financially supported by the Postdoctoral Fellowship Program of CPSF under Grant Number GZB20240966, the China Postdoctoral Science Foundation (No. 2025M774326), the Heilongjiang Postdoctoral Fund (Grant LBH-Z24141), the National Natural Science Foundation of China (Grant No. 52408170 and No. 52508181), Key Lab of Structures Dynamic Behavior and Control of the Ministry of Education, Harbin Institute of Technology (Grant No. HITCE202406), the Natural Science Foundation of Heilongjiang Province (Grant LH2024E054) and China Construction Engineering Corporation Technology R&D Program Funding (Grant CSCEC-2024-Z-14).
Institutional Review Board Statement
The study was conducted in accordance with the Declaration of Helsinki, and approved by the Institutional Review Board (or Ethics Committee) of School of Civil Engineering at Harbin Institute of technology on 30 June 2018.
Informed Consent Statement
Informed consent was obtained from all subjects involved in the study.
Data Availability Statement
The original contributions presented in this study are included in the article. Further inquiries can be directed to the corresponding authors.
Conflicts of Interest
The authors declare no conflict of interest.
Appendix A
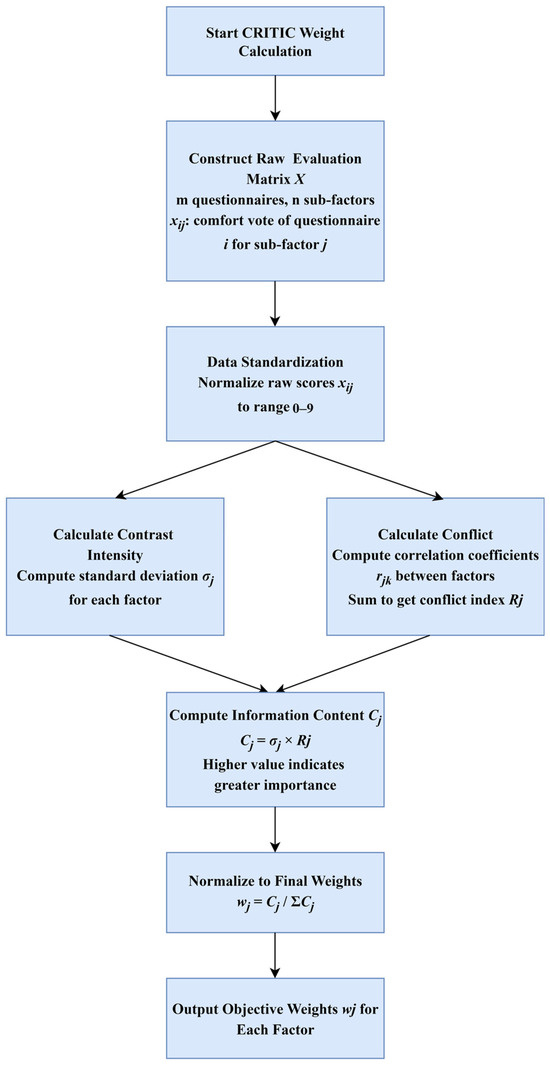
Figure A1.
Flowchart of the CRITIC weighting method.
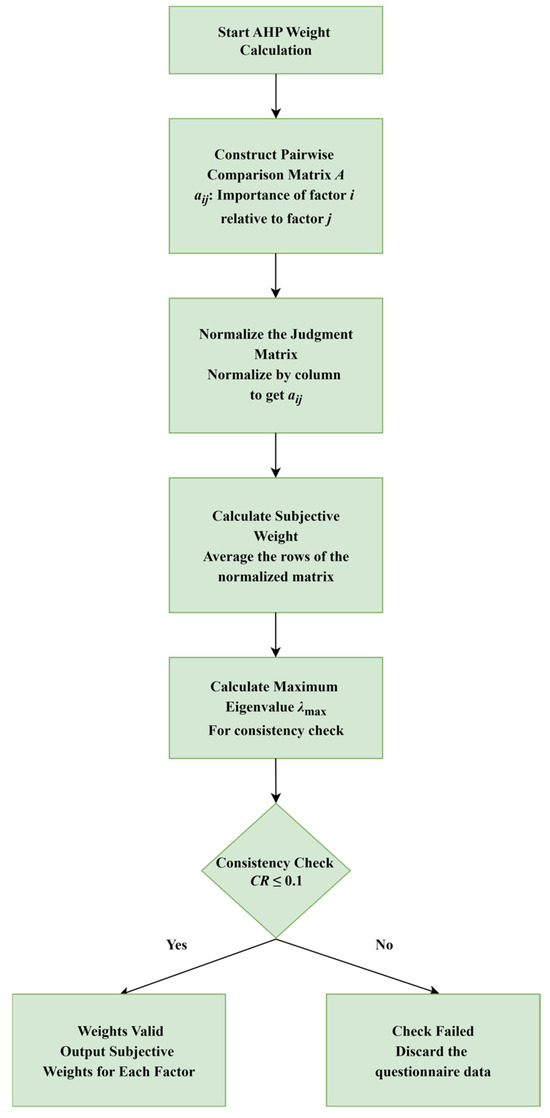
Figure A2.
Flowchart of the AHP weighting method.
The symbols and their meanings in the CRITIC weight calculation process are as follows:
m: The number of valid questionnaires.
n: The number of environmental sub-factors selected in a certain environmental domain.
X: The original evaluation matrix, constructed from the comfort votes from the questionnaire survey. Its dimensions are m by n.
xij: The comfort vote from questionnaire i concerning environmental sub-factor j. This is an element of the original matrix X.
aij: The normalized comfort vote of subject i for environmental sub-factor j. Its value is scaled to a range between 0 and 1.
σj: The standard deviation of the normalized values for environmental sub-factor j. It quantifies the contrast intensity of the indicator.
āj: The mean (average) comfort vote of the normalized values for environmental sub-factor j.
rjk: The linear correlation coefficient between environmental sub-factor j and environmental sub-factor k.
Rj: The sum representing the conflict between environmental sub-factor j and all other sub-factors within the same domain.
Cj: The amount of information emitted by the j-th environmental sub-factor.
wj: The objective weight of environmental sub-factor j.
The symbols and their meanings in the AHP weight calculation process are as follows:
A: A pairwise comparison judgment matrix derived from comfort votes of each questionnaire.
aij: A quantitative value representing the relative importance of environmental factor i over environmental sub-factor j.
n: The number of environmental sub-factors within a specific environmental domain being compared.
āij: The element in row i and column j of the regularized judgment matrix.
: The subjective weight of environmental factor i.
λmax: The maximum eigenvalue of the original pairwise comparison judgment matrix.
CR: The Consistency Ratio. This is a measure used to check the consistency of the judgments in the pairwise comparison matrix.
Appendix B
When evaluating the thermal comfort of student research rooms in the open-plan building, please compare the relative importance of the following factors in pairs:
| Same Important | Former Is More Important than Latter | Latter Is More Important than Former | |||||||||
| 1 | 3 | 5 | 7 | 9 | Median Values of the Above Adjacent Judgment | 1/3 | 1/5 | 1/7 | 1/9 | Median Values of the Above Adjacent Judgment | |
| Temperature/Relative humidity | |||||||||||
| Temperature/Air velocity | |||||||||||
| Relative humidity/Air velocity | |||||||||||
When evaluating the acoustic comfort of student research rooms in the open-plan building, please compare the relative importance of the following factors in pairs:
| Same Important | Former Is More Important than Latter | Latter Is More Important than Former | |||||||||
| 1 | 3 | 5 | 7 | 9 | Median Values of the Above Adjacent Judgment | 1/3 | 1/5 | 1/7 | 1/9 | Median Values of the Above Adjacent Judgment | |
| Outdoor sound/Indoor sound | |||||||||||
| For acoustic comfort caused by outdoor sound | |||||||||||
| Outdoor traffic/Outdoor entertainment | |||||||||||
| For acoustic comfort caused by indoor sound | |||||||||||
| People conversation/People movement | |||||||||||
| People conversation/Burst sound | |||||||||||
| People movement/Burst sound | |||||||||||
When evaluating the air quality comfort of student research rooms in the open-plan building, please compare the relative importance of the following factors in pairs:
| Same Important | Former Is More Important than Latter | Latter Is More Important than Former | |||||||||
| 1 | 3 | 5 | 7 | 9 | Median Values of the Above Adjacent Judgment | 1/3 | 1/5 | 1/7 | 1/9 | Median Values of the Above Adjacent Judgment | |
| Air pollution/ Air freshness | |||||||||||
When evaluating the light comfort of student research rooms in the open-plan building, please compare the relative importance of the following factors in pairs:
| Same Important | Former Is More Important than Latter | Latter Is More Important than Former | |||||||||
| 1 | 3 | 5 | 7 | 9 | Median Values of the Above Adjacent Judgment | 1/3 | 1/5 | 1/7 | 1/9 | Median Values of the Above Adjacent Judgment | |
| Natural light/Artificial light | |||||||||||
References
- d’Ambrosio Alfano, F.R.; Olesen, B.W.; Palella, B.I.; Riccio, G. Thermal comfort: Design and assessment for energy saving. Energy Build. 2014, 81, 326–336. [Google Scholar] [CrossRef]
- Cheung, T.; Schiavon, S.; Graham, L.T.; Tham, K.W. Occupant satisfaction with the indoor environment in seven commercial buildings in Singapore. Build. Environ. 2021, 188, 107443. [Google Scholar] [CrossRef]
- Olesen, B.W. The philosophy behind EN15251: Indoor environmental criteria for design and calculation of energy performance of buildings. Energy Build. 2007, 39, 740–749. [Google Scholar] [CrossRef]
- Juan, Y.; Chen, Y. The influence of indoor environmental factors on learning: An experiment combining physiological and psychological measurements. Build. Environ. 2022, 221, 109299. [Google Scholar] [CrossRef]
- Seyedrezaei, M.; Awada, M.; Becerik-Gerber, B.; Lucas, G.; Roll, S. Interaction effects of indoor environmental quality factors on cognitive performance and perceive comfort of young adults in open plan offices in North American Mediterranean climate. Build. Environ. 2023, 224, 110743. [Google Scholar] [CrossRef]
- Liu, F.; Chang-Richards, A.; Kevin, I.; Wang, K.; Dirks, K.N. Effects of indoor environment factors on productivity of university workplaces: A structural equation model. Build. Environ. 2023, 233, 110098. [Google Scholar] [CrossRef]
- Zhang, X.; Du, J.; Chow, D. Association between perceived indoor environmental characteristics and occupants’ mental well-being. cognitive performance, productivity, satisfaction in workplaces: A systematic review. Build. Environ. 2023, 246, 110985. [Google Scholar] [CrossRef]
- Kim, J.; Hong, T.; Jeong, J.; Koo, C.; Kong, M. An integrated psychological response score of the occupants based on their activities and the indoor environmental quality condition changes. Build. Environ. 2017, 123, 66–77. [Google Scholar] [CrossRef]
- Li, Z.; Zhang, Q.; Fan, F.; Shen, S. A comprehensive comfort assessment method for indoor environmental quality in university open-plan offices in severe cold regions. Build. Environ. 2021, 197, 107845. [Google Scholar] [CrossRef]
- Sun, R.; Xu, S.; Han, Y.; Zhuang, D.; Yan, B.; Sun, C. Exploring impacts of thermal and lighting conditions on office workers’ subjective evaluations, cognitive performance and EEG features in multi-person offices. J. Build. Eng. 2024, 95, 110170. [Google Scholar] [CrossRef]
- Lou, H.; Ou, D. A comparative field study of indoor environmental quality in two types of open-plan offices: Open-plan administrative offices and open-plan research offices. Build. Environ. 2019, 148, 394–404. [Google Scholar] [CrossRef]
- Cao, B.; Ouyang, Q.; Zhu, Y.; Huang, L.; Hu, H.; Deng, G. Development of a multivariate regression model for overall satisfaction in public buildings based on field studies in Beijing and Shanghai. Build. Environ. 2012, 47, 394–399. [Google Scholar] [CrossRef]
- Frontczak, M.; Wargocki, P. Literature survey on how different factors influence human comfort in indoor environments. Build. Environ. 2011, 46, 922–937. [Google Scholar] [CrossRef]
- Mui, K.W.; Chan, W.T. A New Indoor Environmental Quality Equation for Air-Conditioned Buildings. Archit. Sci. Rev. 2005, 48, 41–46. [Google Scholar] [CrossRef]
- Vilcekova, S.; Meciarova, L.; Burdova, E.K.; Katunska, J.; Kosicanova, D.; Doroudiani, S. Indoor environmental quality of classrooms and occupants’ comfort in a special education school in Slovak Republic. Build. Environ. 2017, 120, 29–40. [Google Scholar] [CrossRef]
- Wu, H.; Sun, X.; Wu, Y. Investigation of the relationships between thermal, acoustic, illuminous environments and human perceptions. J. Build. Eng. 2020, 32, 101839. [Google Scholar] [CrossRef]
- Huang, L.; Zhu, Y.; Ouyang, Q.; Cao, B. A study on the effects of thermal, luminous, and acoustic environments on indoor environmental comfort in offices. Build. Environ. 2012, 49, 304–309. [Google Scholar] [CrossRef]
- Fathi, A.S.; O’Brien, W. Impact of indoor environmental quality weighting schemes on office architectural design decisions. Build. Environ. 2024, 248, 111075. [Google Scholar] [CrossRef]
- Ncube, M.; Riffat, S. Developing an indoor environment quality tool for assessment of mechanically ventilated office buildings in the UK—A preliminary study. Build. Environ. 2012, 53, 26–33. [Google Scholar] [CrossRef]
- Pérez-Lombard, L.; Ortiz, J.; Pout, C. A review on buildings energy consumption information. Energy Build. 2008, 40, 394–398. [Google Scholar] [CrossRef]
- Guo, T.; Hu, S.; Liu, G. Evaluation Model of Specific Indoor Environment Overall Comfort Based on Effective-Function Method. Energies 2017, 10, 1634. [Google Scholar] [CrossRef]
- Mihai, T.; Iordache, V. Determining the indoor environment quality for an educational building. Energy Procedia 2016, 85, 566–574. [Google Scholar] [CrossRef]
- Kong, Y.; Zhao, T.; Yuan, R.; Chen, C. Allocation of carbon emission quotas in Chinese provinces based on equality and efficiency principles. J. Clean. Prod. 2019, 211, 222–232. [Google Scholar] [CrossRef]
- Roumi, S.; Zhang, F.; Stewart, R.A.; Santamouris, M. Indoor environment quality effects on occupant satisfaction and energy consumption: Empirical evidence from subtropical offices. Energy Build. 2024, 303, 113784. [Google Scholar] [CrossRef]
- Sun, Y.; Kojima, S.; Nakaohkubo, K.; Zhao, J.; Ni, S. Analysis and evaluation of indoor environment, occupant satisfaction, and energy consumption in general hospital in China. Buildings 2023, 13, 1675. [Google Scholar] [CrossRef]
- Kamaruzzaman, S.N.; Lou, E.C.W.; Wong, P.F.; Wood, R.; Che-Ani, A.I. Developing weighting system for refurbishment building assessment scheme in Malaysia through analytic hierarchy process (AHP) approach. Energy Policy 2018, 112, 280–290. [Google Scholar] [CrossRef]
- Pombo, O.; Allacker, K.; Rivela, B.; Neila, J. Sustainability assessment of energy saving measures: A multi-criteria approach for residential buildings retrofitting-A case study of the Spanish housing stock. Energy Build. 2016, 116, 384–394. [Google Scholar] [CrossRef]
- Wong, L.T.; Mui, K.W.; Hui, P.S. A multivariate-logistic model for acceptance of indoor environmental quality (IEQ) in offices. Build. Environ. 2008, 43, 1–6. [Google Scholar] [CrossRef]
- Heinzerling, D.; Schiavon, S.; Webster, T.; Arens, E. Indoor environmental quality assessment models: A literature review and a proposed weighting and classification scheme. Build. Environ. 2013, 70, 210–222. [Google Scholar] [CrossRef]
- Tang, H.; Ding, Y.; Singer, B. Interactions and comprehensive effect of indoor environmental quality factors on occupant satisfaction. Build. Environ. 2020, 167, 106462. [Google Scholar] [CrossRef]
- Chiang, C.M.; Chou, P.C.; Lai, C.M.; Li, Y.Y. A methodology to assess the indoor environment in care centers for senior citizens. Build. Environ. 2001, 36, 561–568. [Google Scholar] [CrossRef]
- Lai, A.C.K.; Mui, K.W.; Wong, L.T.; Law, L.Y. An evaluation model for indoor environmental quality (IEQ) acceptance in residential buildings. Energy Build. 2009, 41, 930–936. [Google Scholar] [CrossRef]
- Xue, P.; Mak, C.M.; Ai, Z.T. A structured approach to overall environmental satisfaction in high-rise residential buildings. Energy Build. 2016, 116, 181–189. [Google Scholar] [CrossRef]
- Kang, S.; Ou, D.; Mak, C.M. The impact of indoor environmental quality on work productivity in university open-plan research offices. Build. Environ. 2017, 124, 78–89. [Google Scholar] [CrossRef]
- Buratti, C.; Belloni, E.; Merli, F.; Ricciardi, P. A new index combining thermal, acoustic, and visual comfort of moderate environments in temperate climates. Build. Environ. 2018, 139, 27–37. [Google Scholar] [CrossRef]
- Yang, W.; Moon, H.J. Combined effects of acoustic, thermal, and illumination conditions on the comfort of discrete senses and overall indoor environment. Build. Environ. 2019, 148, 623–633. [Google Scholar] [CrossRef]
- Kaushik, A.; Arif, M.; Tumula, P.; Ebohon, O.J. Effect of thermal comfort on occupant productivity in office buildings: Response surface analysis. Build. Environ. 2020, 180, 107021. [Google Scholar] [CrossRef]
- Yang, D.; Mak, C. Relationships between indoor environmental quality and environmental factors in university classrooms. Build. Environ. 2020, 186, 107331. [Google Scholar] [CrossRef]
- Piasecki, M.; Kostyrko, K. Development of Weighting Scheme for Indoor Air Quality Model Using a Multi-Attribute Decision Making Method. Energies 2020, 13, 3120. [Google Scholar] [CrossRef]
- Zhan, H.; Yu, J.; Yu, R. Assessment of older adults’ acceptance of IEQ in nursing homes using both subjective and objective methods. Build. Environ. 2021, 203, 108063. [Google Scholar] [CrossRef]
- Jia, L.R.; Li, Q.Y.; Chen, X.; Lee, C.C.; Han, J. Indoor thermal and ventilation indicator on university students’ overall comfort. Buildings 2022, 12, 1921. [Google Scholar] [CrossRef]
- Amoatey, P.; Al-Jabri, K.; Al-Saadi, S. Impact of Indoor Environmental Quality on Students’ Comfort in High School Buildings during the Summer Season in an Extreme Climate. J. Archit. Eng. 2023, 29, 04023014. [Google Scholar] [CrossRef]
- Al-Akhzami, F.; Al-Khatri, H.; Al-Saadi, S.; Khan, H.; Etri, T. A comprehensive objective and subjective assessment survey of indoor environmental quality in higher education classrooms in a hot arid climate. Build. Environ. 2024, 263, 111870. [Google Scholar] [CrossRef]
- Maciejewska, M.; Szczurek, A. Indoor air parameters in association with students’ performance, rating of indoor conditions and well-being during classes. Build. Environ. 2025, 271, 112633. [Google Scholar] [CrossRef]
- Diakoulaki, D.; Mavrotas, G.; Papayannakis, L. Determining objective weights in multiple criteria problems: The critic method. Comput. Oper. Res. 1995, 22, 763–770. [Google Scholar] [CrossRef]
- Lee, S. Determination of Priority Weights under Multiattribute Decision-Making Situations: AHP versus Fuzzy AHP. J. Constr. Eng. Manag. 2015, 141, 05014015. [Google Scholar] [CrossRef]
- QX/T 152-2012; China Standard, Division of Climatic Season. China Meteorological Administration: Beijing, China, 2010.
- Han, Y.M.; Lee, S.C.; Cao, J.J.; Ho, K.F.; An, Z.S. Spatial distribution and seasonal variation of char-EC and soot-EC in the atmosphere over China. Atmos. Environ. 2009, 43, 6066–6073. [Google Scholar] [CrossRef]
- Xue, Q.; Wang, Z.; Liu, J.; Dong, J. Indoor PM2.5 concentrations during winter in a severe cold region of China: A comparison of passive and conventional residential buildings. Build. Environ. 2020, 180, 106857. [Google Scholar] [CrossRef]
- ANSI/ASHRAE 55-2020; ASHRAE Standard: Thermal Environmental Conditions for Human Occupancy. American National Standard. American Society of Heating, Refrigerating and Airconditioning Engineers Inc.: Peachtree Corners, GA, USA, 2020.
- EN 16798-1:2019; Indoor Environmental Input Parameters for Design and Assessment of Energy Performance of Buildings Addressing Indoor Air Quality, Thermal Environment, Lighting and Acoustics. European Committee for Standardization: Brussels, Belgium, 2019.
- Gower, J.C. A General Coefficient of Similarity and Some of Its Properties. Biometrics 1971, 27, 857–871. [Google Scholar] [CrossRef]
- Ward, J. Hierarchical grouping to optimize an objective function. J. Am. Stat. Assoc. 1963, 58, 236–244. [Google Scholar] [CrossRef]
- Gao, Z.; Li, M.; Gao, F.; Wang, X. Fuzzy Comprehensive Evaluation on Body Parts’ Weight Coefficients towards Sitting Comfort Based on AHP to Limit Entropy Method. Math. Probl. Eng. 2019, 2019, 3826468. [Google Scholar] [CrossRef]
- Kahraman, C.; Cebeci, U.; Ruan, D. Multi-attribute comparison of catering service companies using fuzzy AHP: The case of Turkey. Int. J. Prod. Econ. 2004, 87, 171–184. [Google Scholar] [CrossRef]
- Zarghami, E.; Azemati, H.; Fatourehchi, D.; Karamloo, M. Customizing well-known sustainability assessment tools for Iranian residential buildings using Fuzzy Analytic Hierarchy Process. Build. Environ. 2018, 128, 107–128. [Google Scholar] [CrossRef]
- GB 3095-2012; Ambient Air Quality Standards. General Administration of Quality Supervision, Ministry of Environmental Protection of the People’s Republic of China: Beijing, China, 2012.
- GB 18883-2002; Indoor Air Quality. General Administration of Quality Supervision, Inspection and Quarantine of the People’s Republic of China: Beijing, China, 2002.
- JGJT229-2010; Code for Green Design of Civil Buildings. Ministry of Housing and Urban-Rural Development of the People’s Republic of China: Beijing, China, 2010.
- GB 3096-2008; Ambient Air Quality Standards. Environmental Quality Standard for Noise. Ministry of Environmental Protection of the People’s Republic of China: Beijing, China, 2008.
- GB 50034-2013; Standard for Lighting Design of Buildings, Environmental Quality Standard for Noise. Ministry of Housing and Urban-Rural Development of the People’s Republic of China: Beijing, China, 2013.
Disclaimer/Publisher’s Note: The statements, opinions and data contained in all publications are solely those of the individual author(s) and contributor(s) and not of MDPI and/or the editor(s). MDPI and/or the editor(s) disclaim responsibility for any injury to people or property resulting from any ideas, methods, instructions or products referred to in the content. |
© 2025 by the authors. Licensee MDPI, Basel, Switzerland. This article is an open access article distributed under the terms and conditions of the Creative Commons Attribution (CC BY) license (https://creativecommons.org/licenses/by/4.0/).