3.1. Uniaxial Compression Test
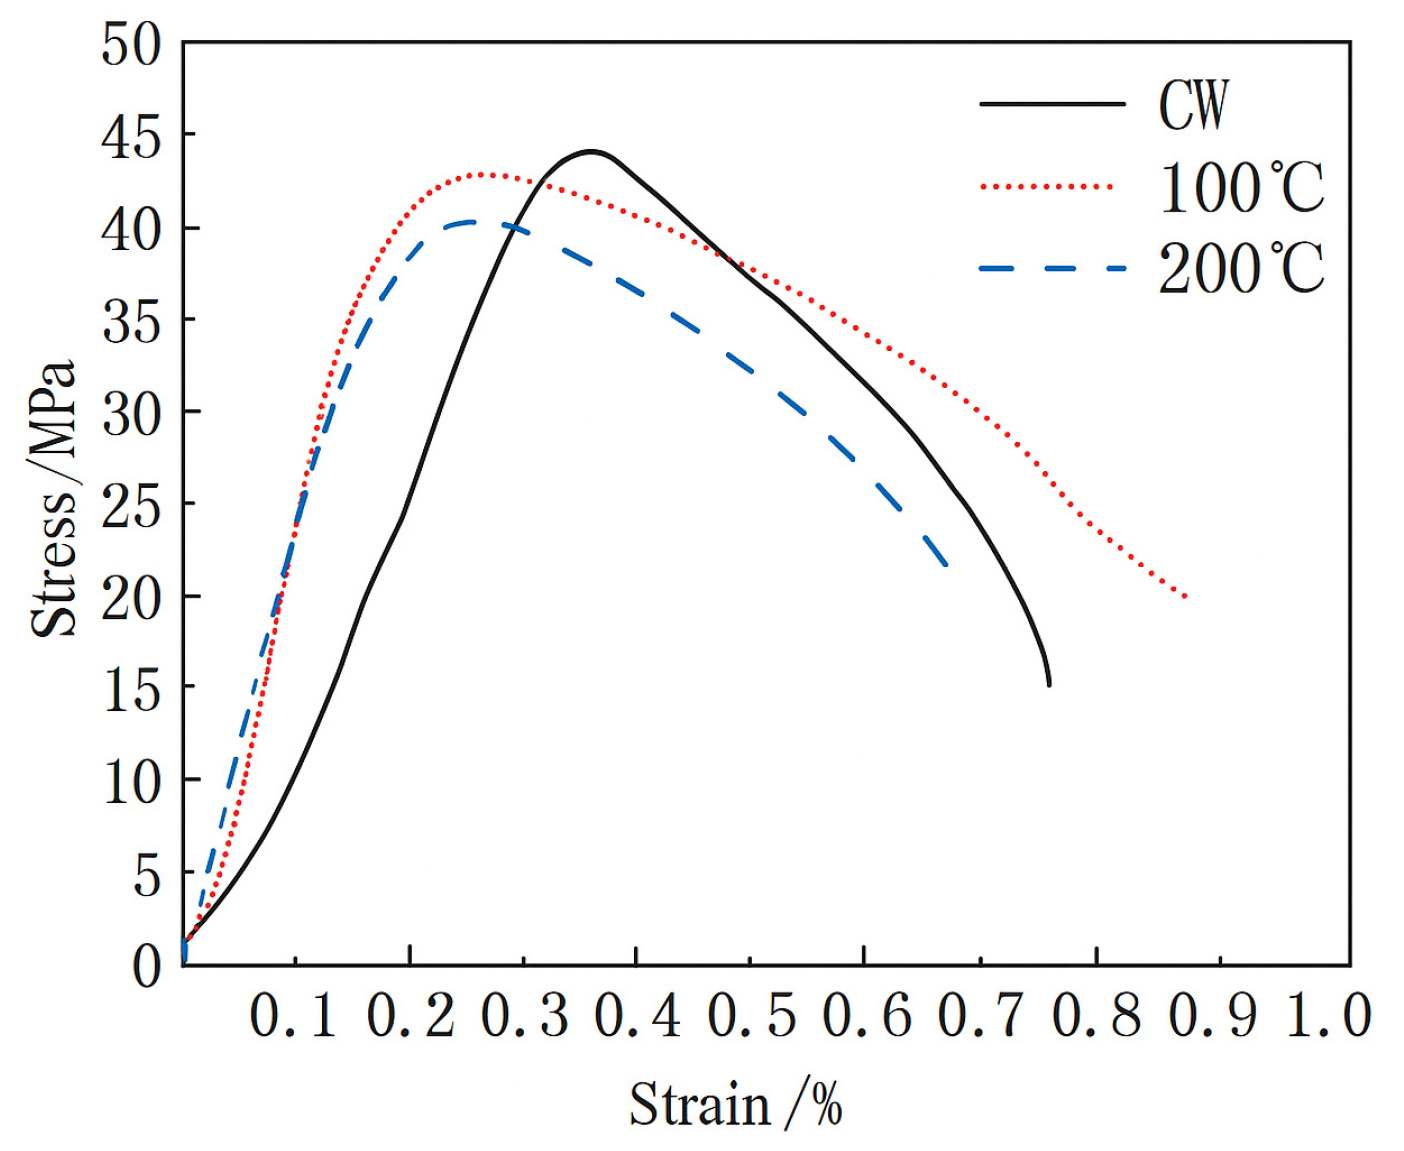
The uniaxial compressive stress–strain curves under three working conditions (normal temperature, 100 °C, and 200 °C) are shown in
Figure 4.
Based upon the uniaxial compressive stress–strain curves of concrete shown in
Figure 4, this study revealed systematically the evolution laws and intrinsic deterioration mechanisms of concrete’s mechanical properties at room temperature (~25 °C) and after undergoing temperature–humidity coupling (thermal–humidity treatment) at 100 °C and 200 °C. The test data showed clearly that the room-temperature concrete exhibited the typical characteristics of quasi-brittle materials, with a peak stress of 44.1 MPa and a corresponding peak strain of 0.36%. Before they reached their peak strength, the stress and strain were in an approximately linear proportional relationship, indicating that the material was in the elastic working stage, and the accumulation of microstructural damage was limited. After undergoing 100 °C temperature–humidity coupling, the concrete’s peak stress was 42.8 MPa, which is only approximately 2.9% lower than that at room temperature, but its corresponding peak strain decreased significantly to 0.25%, with a drop of up to 30.6%. After 200 °C temperature–humidity coupling, the peak stress decreased further to 40.3 MPa (approximately 8.6% lower than that at room temperature), while the peak strain remained at the low level of 0.25%.
Analysis of the test phenomena showed that the evolution of concrete’s mechanical properties under the action of temperature–humidity coupling was attributable largely to the phased characteristics of its internal microstructure deterioration. Under the 100 °C temperature–humidity action, the evaporation of free water within the concrete generated pore pressure, which induced the propagation of microcracks and weakened the interfacial transition zone (ITZ) between the cement paste and aggregate, which reduced the material’s ductility significantly (the peak strain dropped sharply by 30.6%). At this time, the cement hydration products had not decomposed on a large scale, and the aggregate structure was basically intact, so that the loss of compressive strength was limited (only 2.9%). When the temperature rose to 200 °C, the high temperature promoted the dehydration and shrinkage of cement gel, decomposing the C-S-H gel in part, and the difference in thermal expansion between the aggregate and the paste aggravated ITZ damage, which led to a further decrease in strength (8.6%). However, as the concrete’s brittle failure mechanism had been formed significantly at the previous 100 °C (the microcrack network was developed widely), the material’s deformation capacity dropped to a low-value platform, so the peak strain no longer decreased significantly; this showed the deterioration law in which the strength continues to decay while the brittleness tends to be stable. Among them, the peak strain decreased significantly from 0.36% to 0.25%, while the compressive strength only decreased by 2.9–8.6%. The reason why the strength loss was significantly lower than the ductility loss lies in the following: the temperature–humidity coupled environment first and primarily deteriorates the ductility of concrete. The mechanism behind this is the weakening of the interfacial transition zone (ITZ) and the initiation of microcracks, which is directly manifested as a significant reduction in peak strain. In contrast, the attenuation of compressive strength depends more on the strength of the cement paste matrix itself. Since the cement paste matrix maintains relative integrity in environments below 200 °C, the magnitude of strength loss is smaller than that of ductility loss. This phenomenon of “strength–toughness decoupling” is a typical characteristic of concrete under the combined action of heat and humidity in the medium-temperature range.
3.2. Analysis of Concrete DIC Results
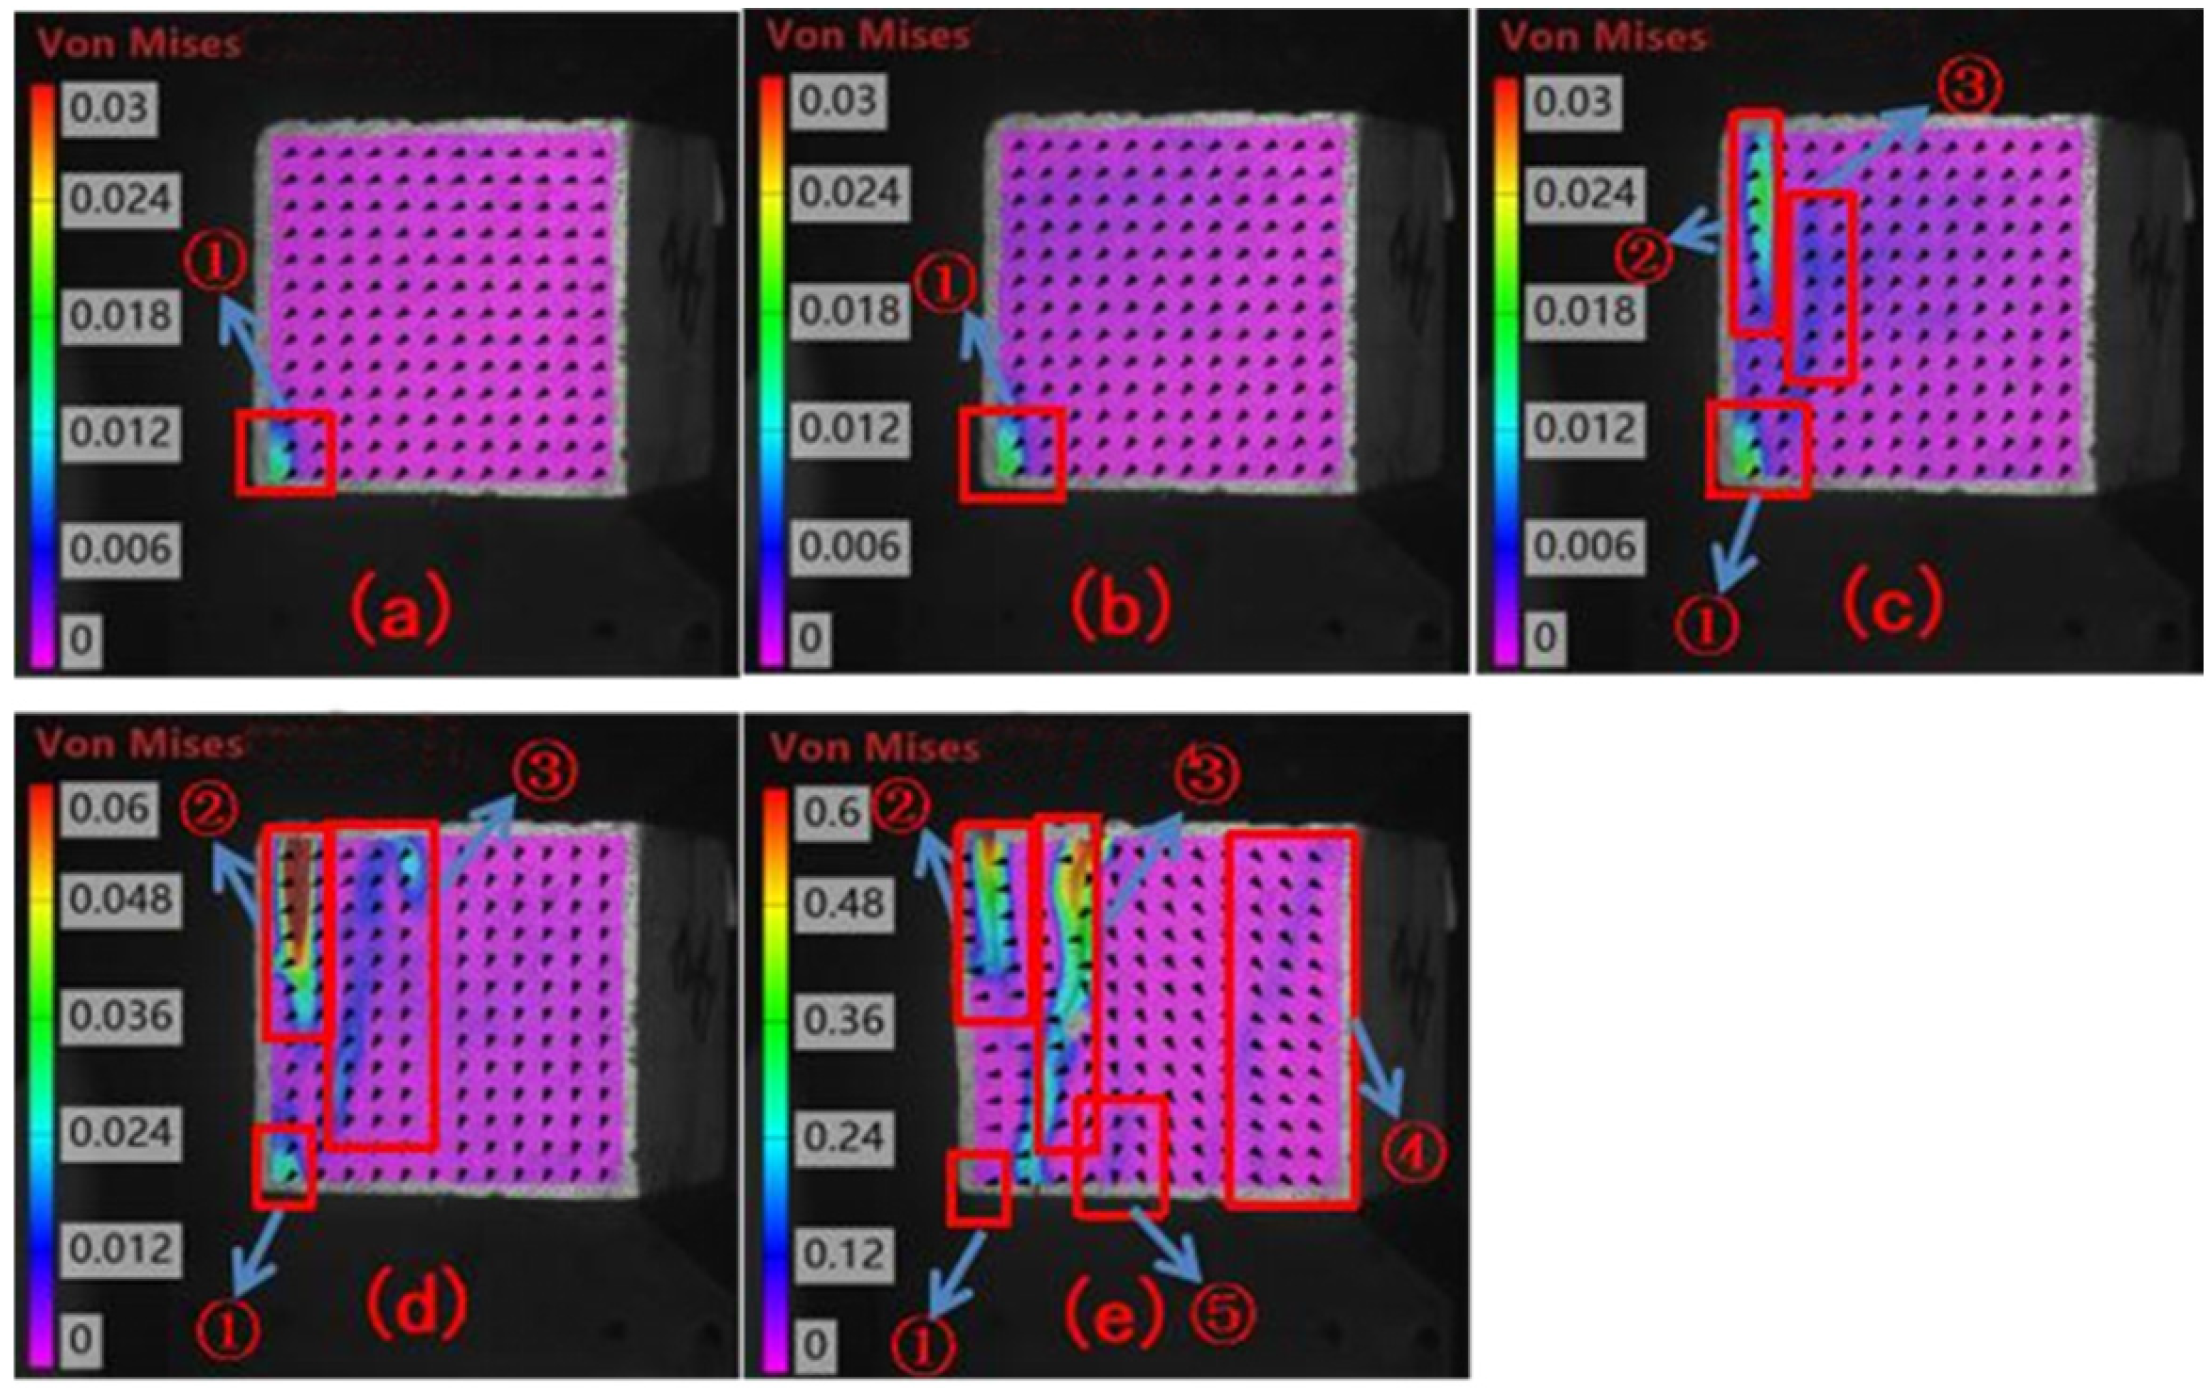
The DIC test results of the specimens under the normal-temperature condition are shown in
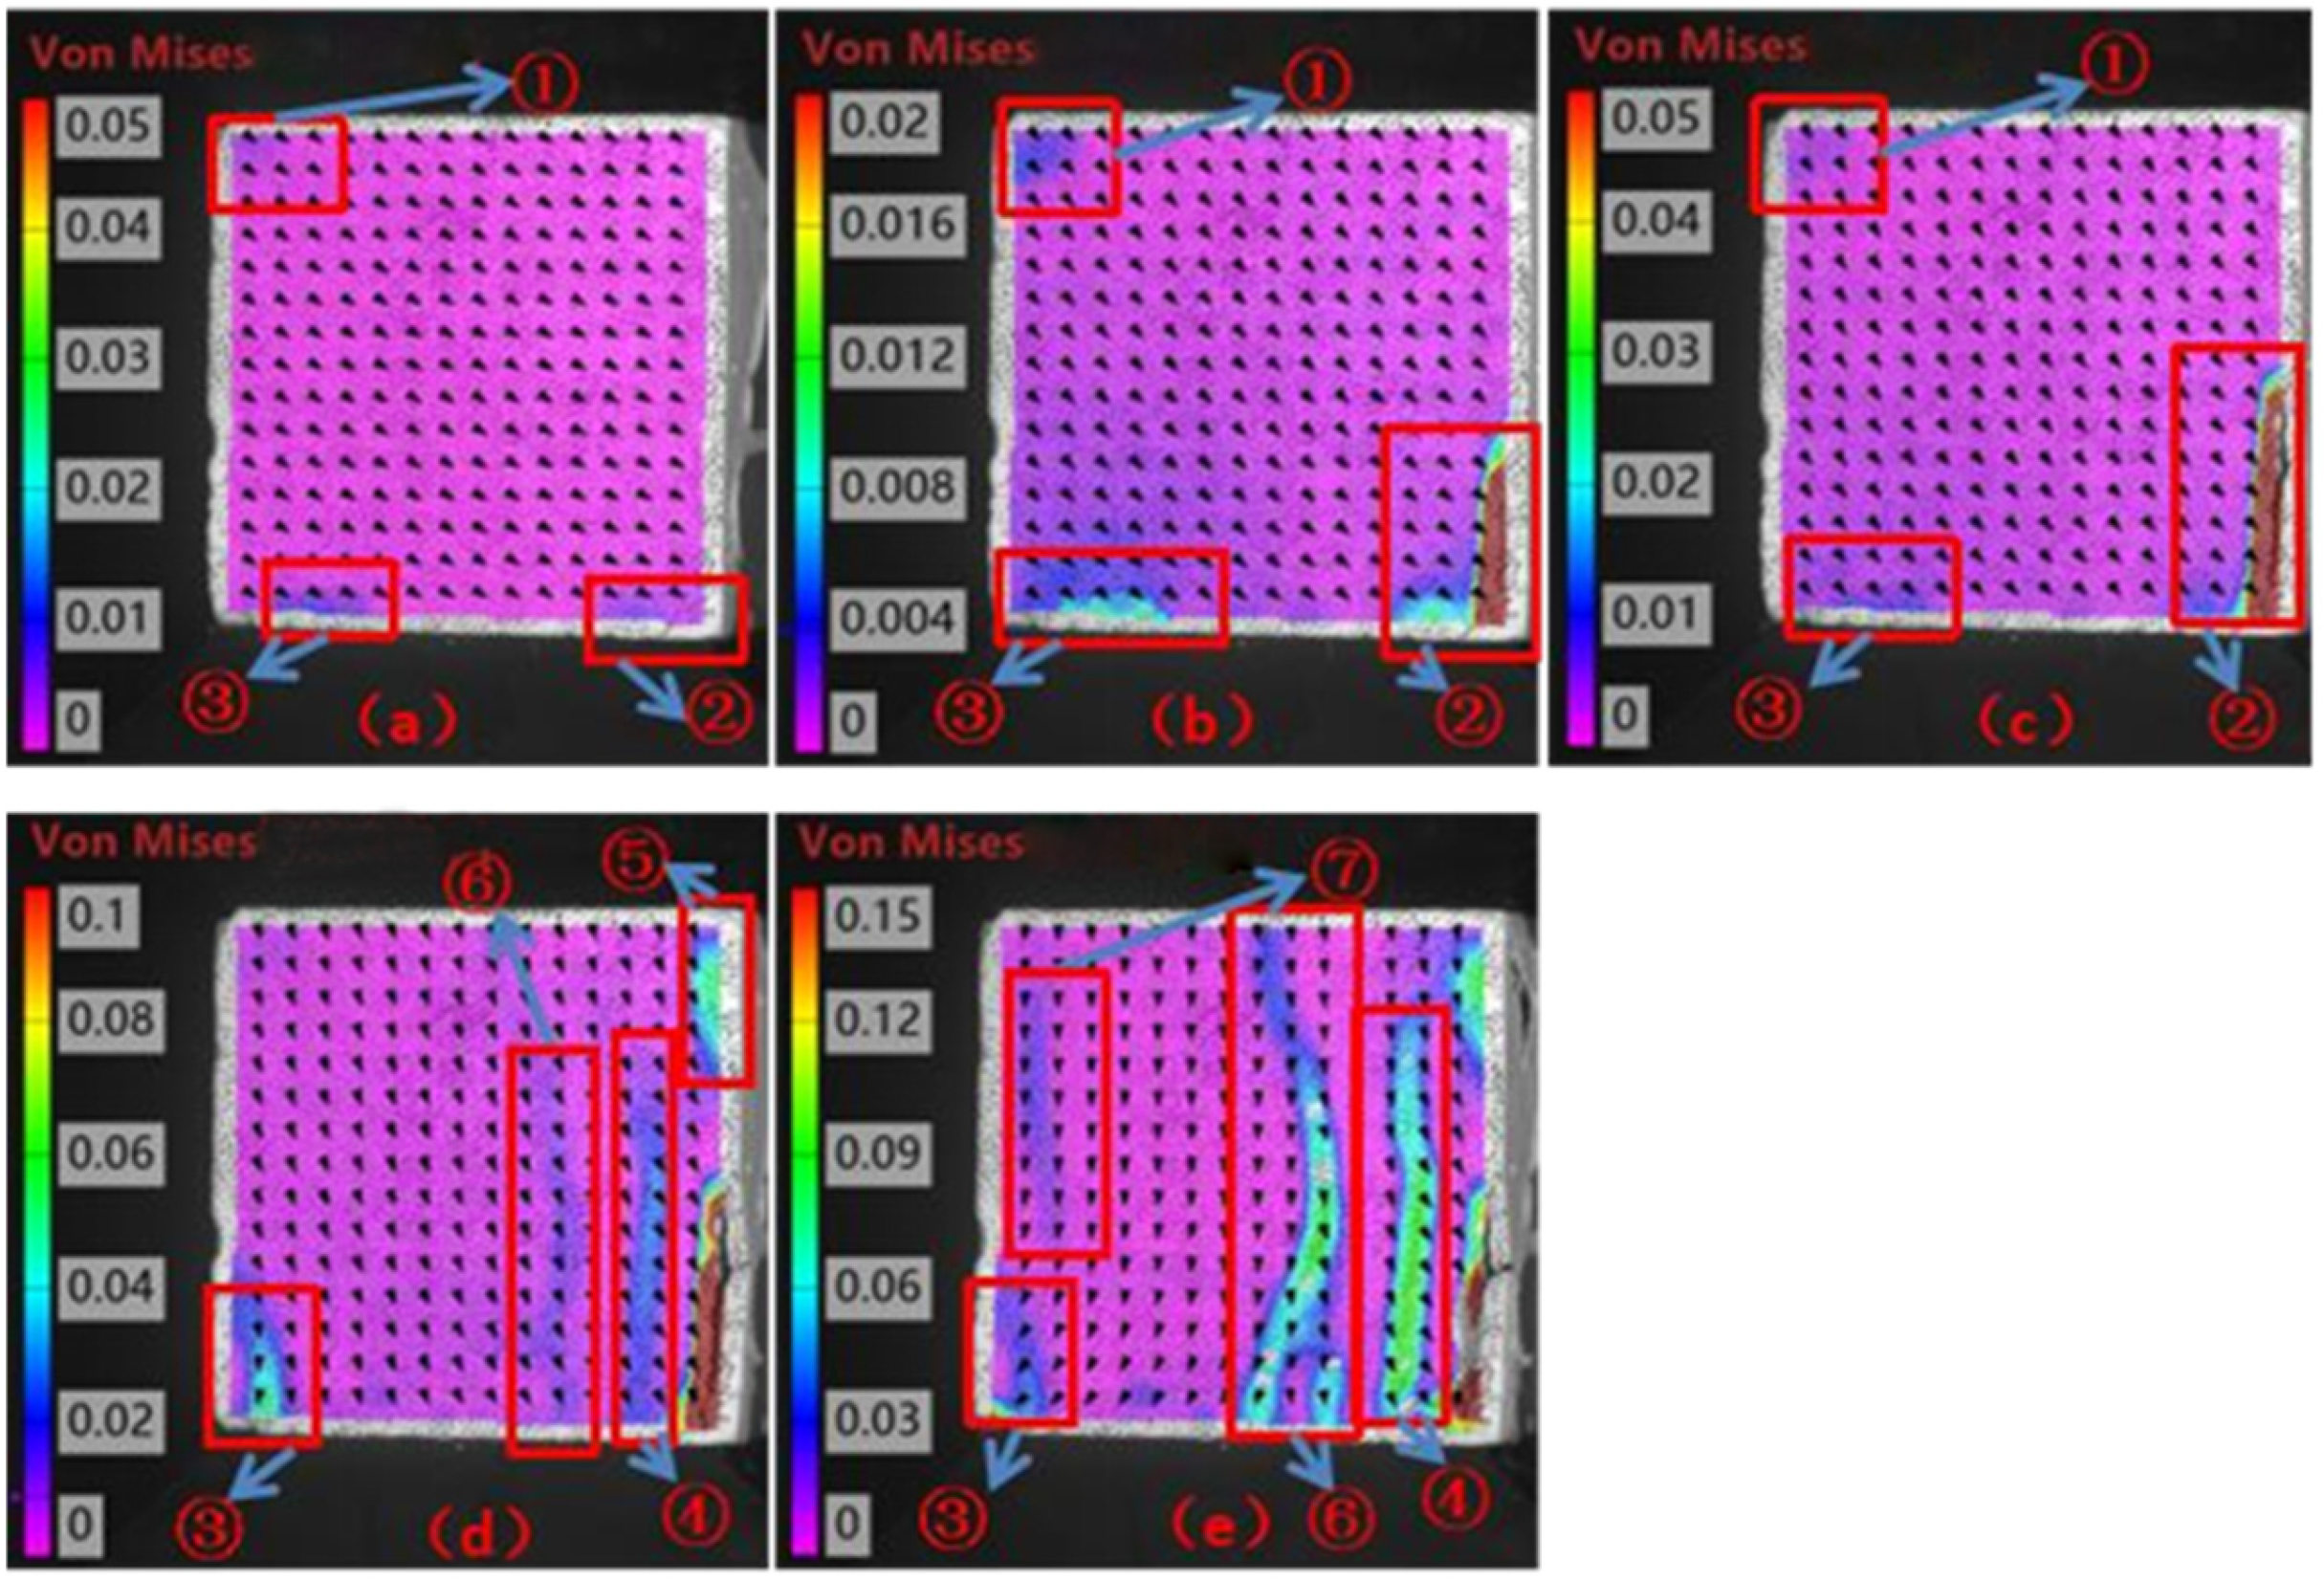
Figure 5, those under the 100 °C condition are shown in
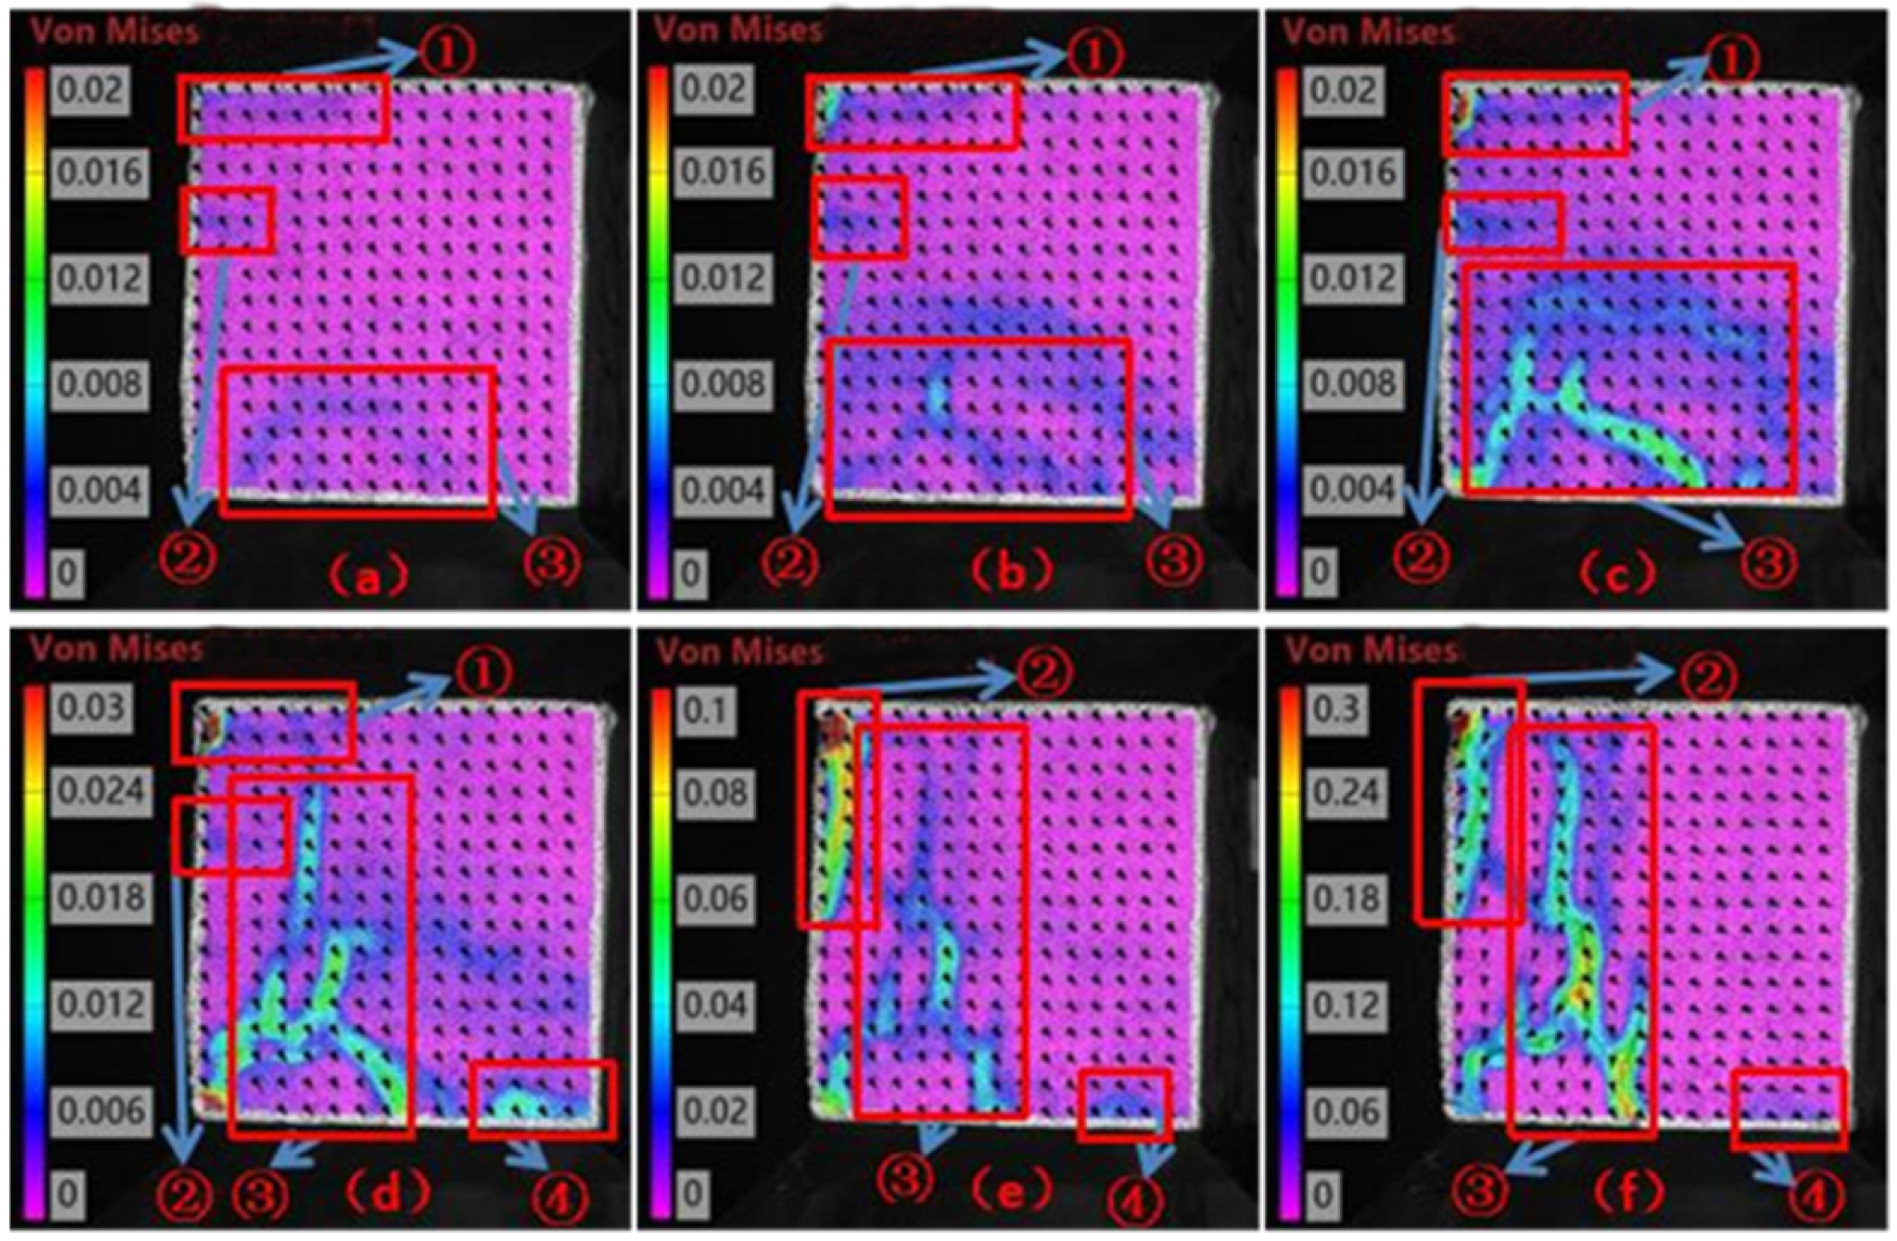
Figure 6, and those under the 200 °C condition are shown in
Figure 7.
Figure 5 reveals the meso-mechanical mechanism and progressive failure characteristics of its uniaxial compressive failure. In the initial loading stage (120 s,
Figure 5a), the strain concentration appeared in the end region ① of the specimen (local strain 0.0125%), and the displacement field was dominated by horizontal leftward movement that reflected the stress concentration effect caused by end friction constraint. As the load increased (220 s,
Figure 5b), the downward component of the displacement vector increased significantly, indicating that axial pressure had begun to dominate the deformation behavior, while the strain distribution remained relatively uniform (maximum strain approximately 0.006%), with the material in the stage of elastic coordinated deformation. In the middle and later stages (320 s,
Figure 5c), the emergence of new strain concentration zones ② (0.018%) and ③ (0.006%) marked a qualitative change in the accumulation of internal damage. The continuous increase in the downward component of the displacement field revealed the non-uniform initiation of microcracks at the aggregate–paste interface. When the peak load was approached (436 s,
Figure 5d), the strains in zones ② and ③ increased sharply (>0.06% and 0.024%) and formed penetrating microcracks. The displacement field shifted overall to be dominated by the vertical direction, while the displacement vectors in the crack zones showed a horizontal separation trend, which thus confirmed the crack surfaces’ tensile–shear composite failure mechanism. In the final failure stage (441 s,
Figure 5e), the strains in the main cracks ② and ③ increased suddenly to 0.48%, and secondary cracks ④ and ⑤ developed synchronously (strain 0.12%). The displacement field showed significant divergence characteristics in the crack regions (e.g., leftward at ② and ③, oblique separation at ④).
Based upon the DIC strain evolution analysis of the 100 °C temperature–humidity-coupled concrete specimen shown in
Figure 6, its uniaxial compressive failure process exhibited significantly different modes of damage accumulation and failure compared to the room-temperature specimen. In the initial loading stage (120 s,
Figure 6a), strain concentrations (approximately 0.002%) appeared in the end regions ① and ② of the specimen simultaneously, and the displacement field showed a 45° oblique distribution (dominated by the lower left direction) and revealed that the weakening of the interface transition zone caused by temperature–humidity coupling intensified the end constraint effect. As the load increased (
Figure 6b 220 s), the main strain concentration zone shifted to the middle region ③ (0.002%) accompanied by increased strain in region ① (0.006%). The downward component of the displacement vector enhanced significantly while the horizontal component remained, which indicated that microcracks initiated preferentially in pre-damaged areas under the dominance of axial pressure. A critical turning point occurred in the middle and later stages (
Figure 6c 320 s), where a new strain concentration zone ④ appeared suddenly and the strain values jumped to 0.04% (far exceeding 0.004% in region ③ during the same period). The vertical component of the displacement field continued to increase, indicating that the pre-existing microcrack network within the material promoted the jump-style development of damage. When failure was approached (
Figure 6d 392 s), the strain in region ④ surged to 0.06% and formed a penetrating main crack. The displacement field shifted completely from oblique to vertical dominance, and the displacement vectors in the crack zone showed unidirectional leftward expansion characteristics, confirming that the aggregate–paste interface debonding caused by high-temperature and humidity weakened the crack surfaces’ shear resistance capacity significantly. In the final failure stage (
Figure 6e 412–425 s), the strain of the main crack ④ exceeded 0.1%, and the secondary crack ⑤ developed accordingly (strain 0.02%). The displacement field showed intense horizontal separation in the crack zone (leftward in region ④, rightward in other regions).
The full-field strain evolution analysis of the 200 °C temperature–humidity-coupled concrete specimen during uniaxial compression is presented in
Figure 7. In the initial stage (
Figure 7a), it exhibited non-uniform deformation dominated by the end effect and formed strain concentration zones of approximately 0.004% at positions ①, ②, and ③, with displacement vectors distributed downward and to the right, indicating the end stress concentration effect in the structure’s uncracked state. As the load increased (
Figure 7b), the strain at ③ increased significantly to 0.007% and formed a main strain band, while microcracks initiated at ①, and the rightward trend of the displacement field intensified, indicating that local damage had caused a deviation in the deformation path. In
Figure 7d, the strain at ③ surged to 0.015%, the crack propagated upward and formed a tendency to penetrate, and the displacement vector maintained the right–down direction, but the crack zone showed rightward expansion, confirming that the main crack dominated the deformation mode. The entire process showed the progressive law: initial strain concentration at the ends (
Figure 7a), strain strengthening and microcrack initiation at ③ (
Figure 7b), directional propagation of the main crack, and strain localization (
Figure 7d). The displacement field changed gradually from the initial uniform sinking to crack-driven rightward expansion. This deformation sequence indicated that the temperature–humidity coupling effect weakened the concrete’s coordinated deformation capacity significantly and promoted the concentration of strain energy in specific paths (such as ③), and ultimately triggered the directional propagation of penetrating cracks and the reconstruction of the displacement field, which provides key experimental evidence of concrete structures’ catastrophic failure mechanism in high-temperature and high-humidity environments.
The analysis of the concrete’s failure mechanism under uniaxial compression based upon DIC technology showed that the specimens under normal-temperature, 100 °C and 200 °C temperature–humidity coupling environments exhibited significantly different damage evolution laws and failure modes. The normal-temperature specimen initially showed horizontal displacement-dominated strain concentration (0.0125%) attributable to end friction constraints, then underwent an elastic coordinated deformation stage (maximum strain 0.006%), and finally was characterized by the progressive propagation of multiple cracks (main crack strain 0.48%) and tensile–shear composite failure. However, because the aggregate–paste interface weakened, the 100 °C temperature–humidity-coupled specimen initially formed an oblique displacement field synchronously at both ends (strain 0.002%). In the middle and later stages, jump-like damage occurred—the strain in the new zone ④ increased suddenly from 0.004% to 0.04%, and the main crack propagated as a one-way left separation (strain exceeded 0.1%), revealing that interface debonding led to the loss of shear resistance. The 200 °C condition exacerbated this trend further: the initial multi-end strain concentration (≈0.004%) locked the main failure path directly (zone ③), the strain band continued to strengthen to 0.015% and expanded directionally to the right, and the displacement field was reconstructed from uniform sinking to crack-driven rightward expansion, which reflected the complete loss of coordinated deformation capacity at high temperatures. Comprehensive analysis showed that as the temperature increased, the concrete degenerated gradually from the multi-crack progressive failure mechanism at normal temperature to the single-crack jump failure at 100 °C, and finally evolved into the directional penetration failure of a single path at 200 °C. The root cause is that the temperature–humidity coupling environment weakened the interface transition zone continuously, which promoted the concentration of strain energy in a single weak zone, and at the same time, the displacement field characteristics degenerated from the composite type (horizontal–vertical coupling at normal temperature) to pure tension dominance (one-way separation at high temperature). This finding warns us that in high-temperature and high-humidity engineering environments, it is necessary to focus on monitoring the end constraint effect and the sudden change in the dominant strain band’s behavior, and improve concrete structures’ disaster resistance through interface strengthening strategies.
3.3. Acoustic Emission Test
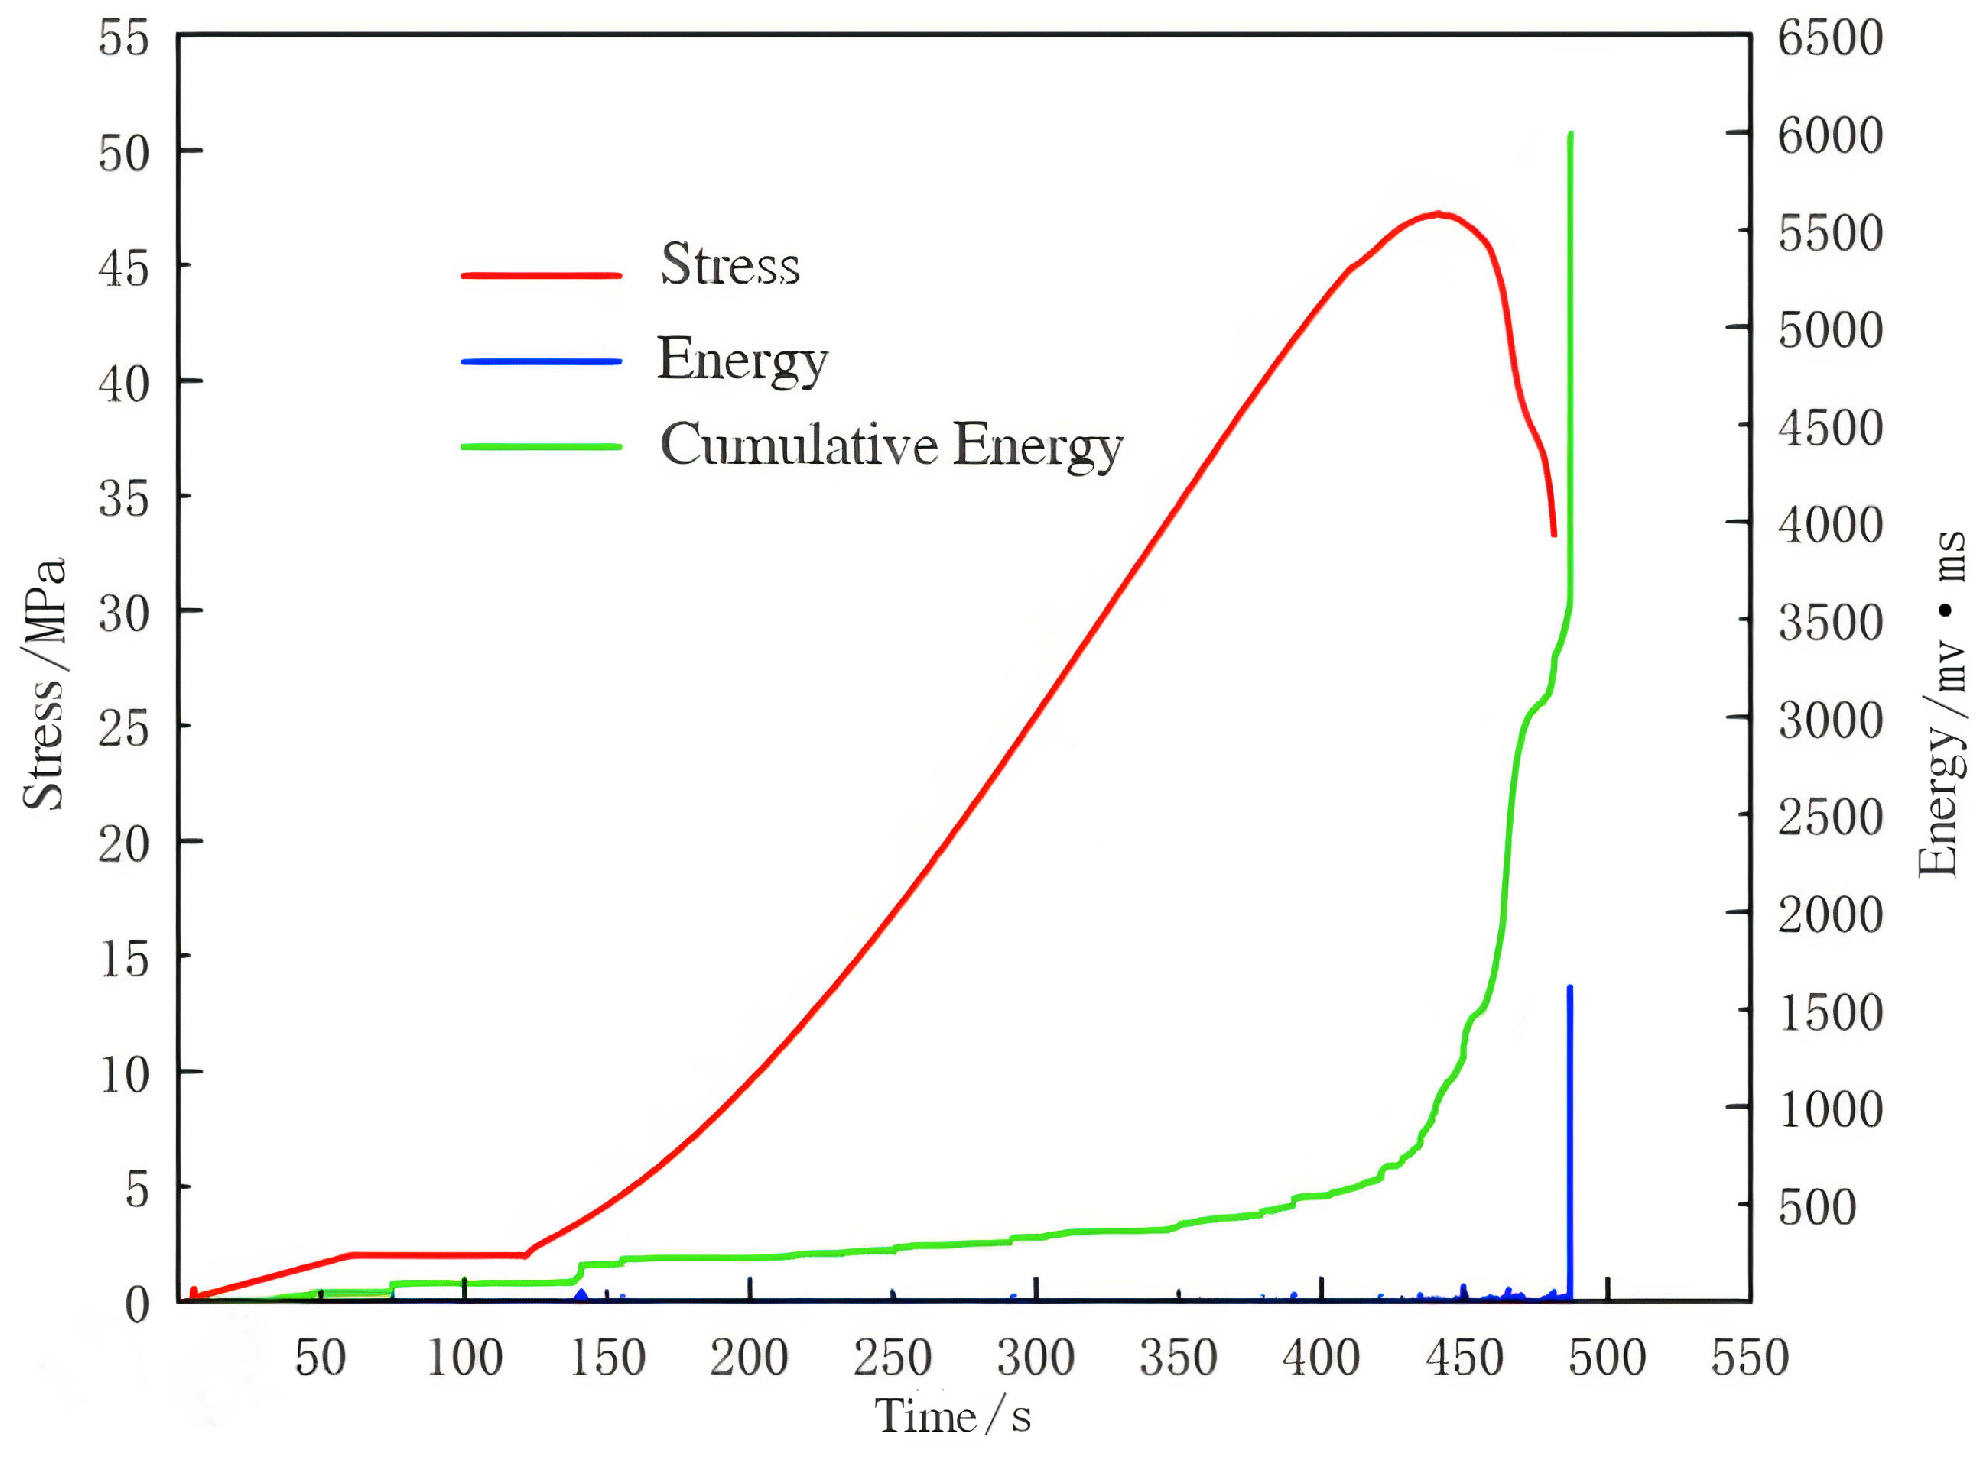
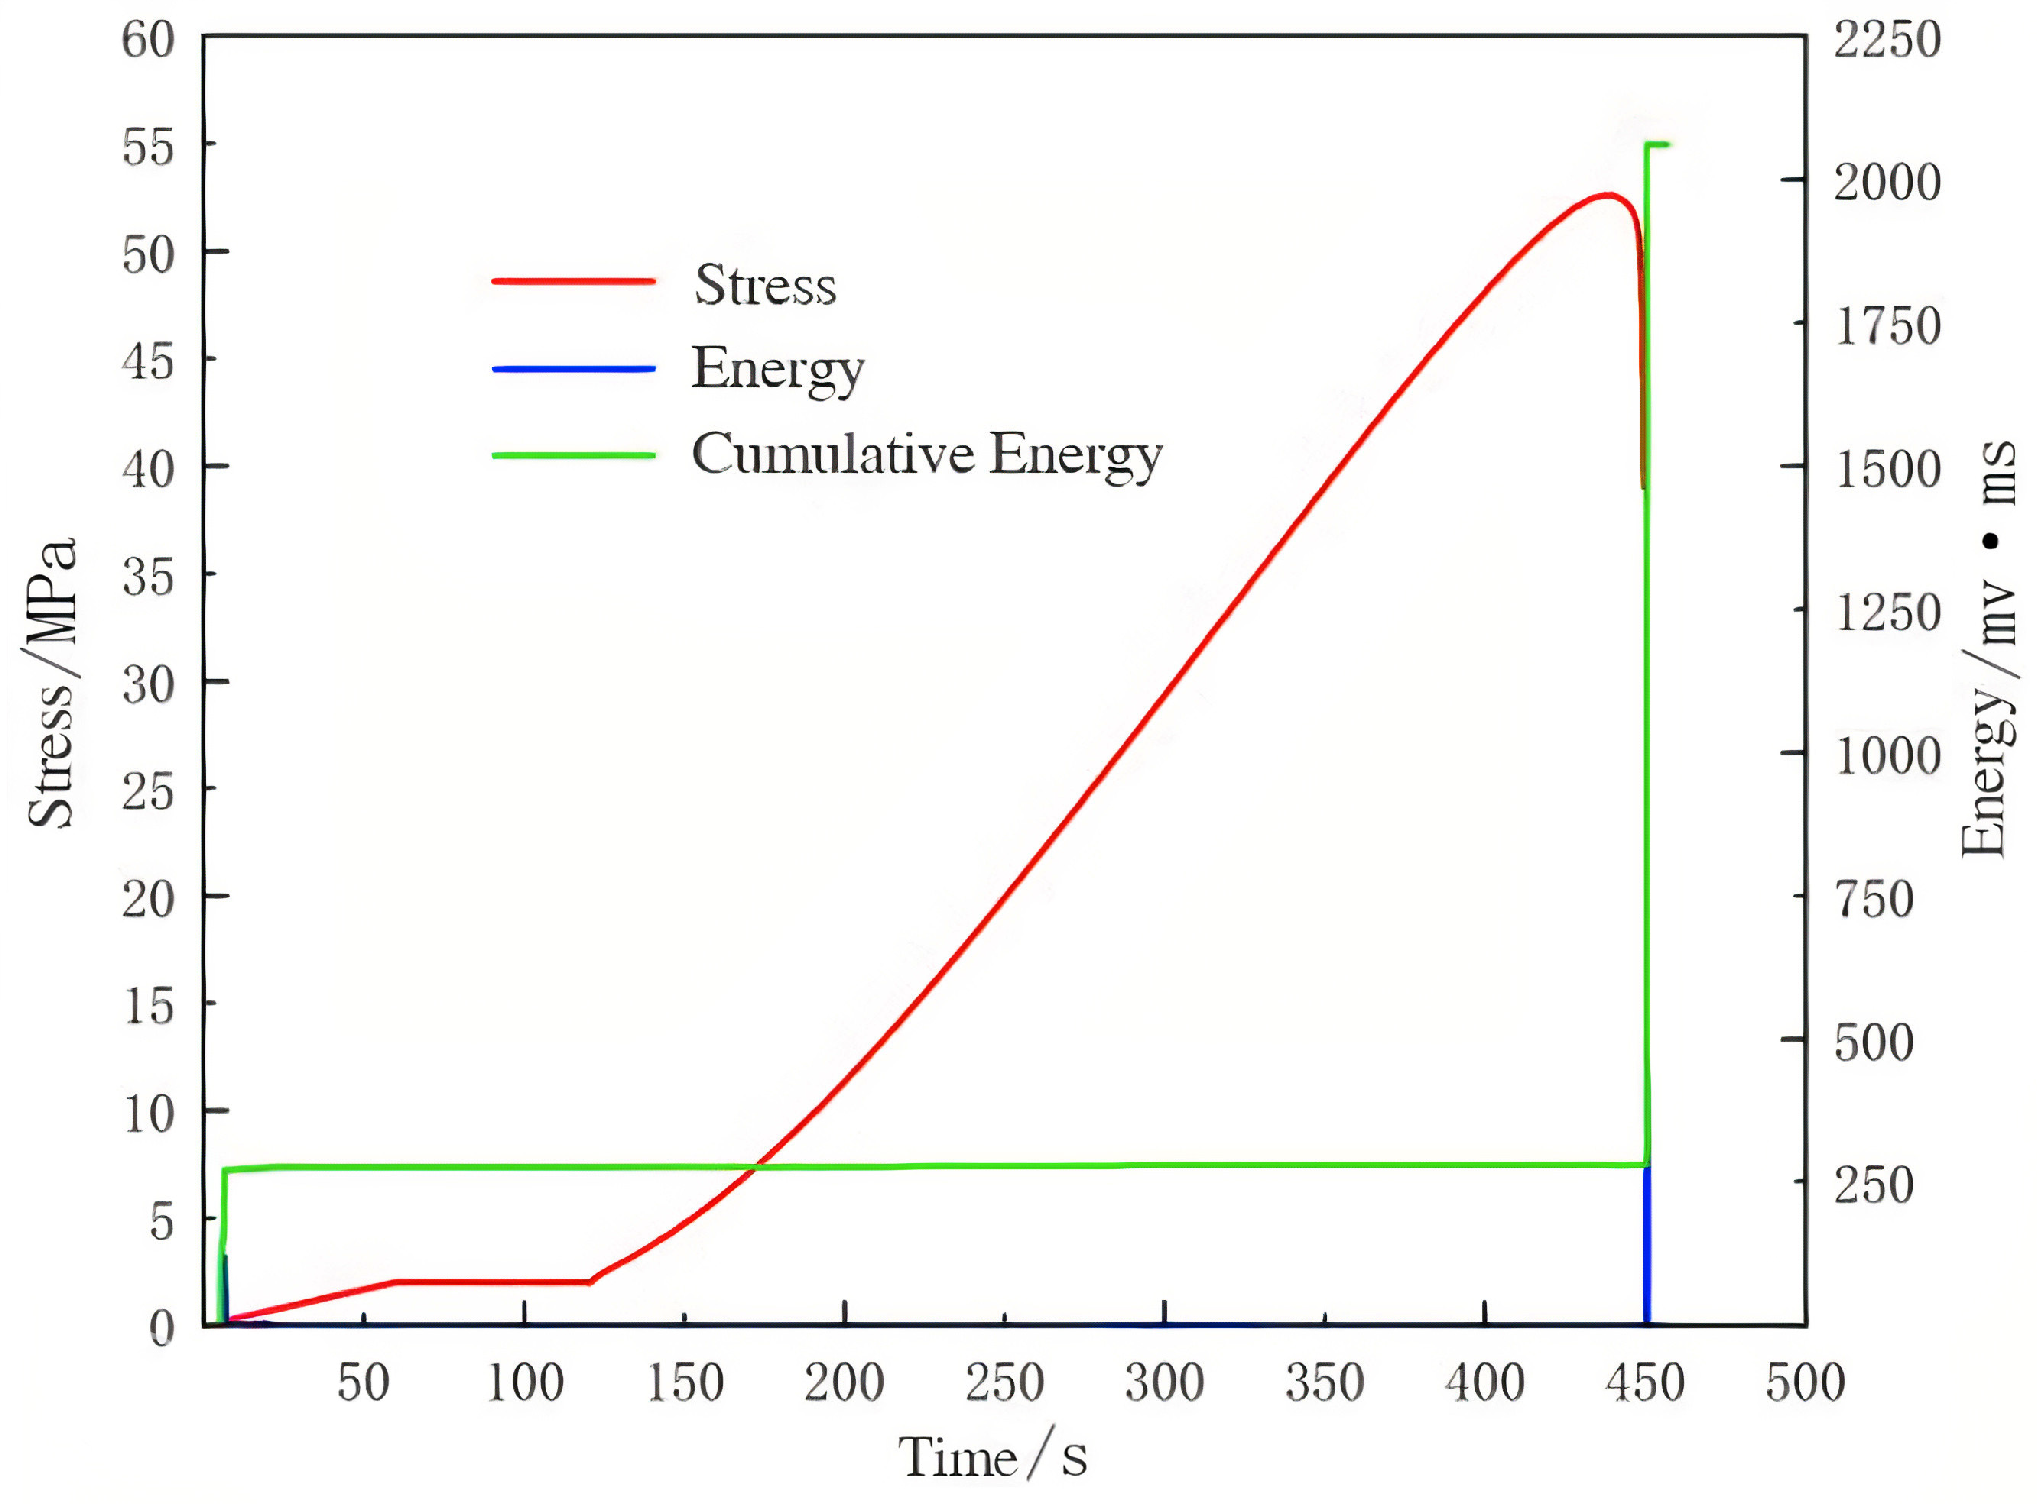
The acoustic emission test results of the specimens under the normal-temperature condition are shown in
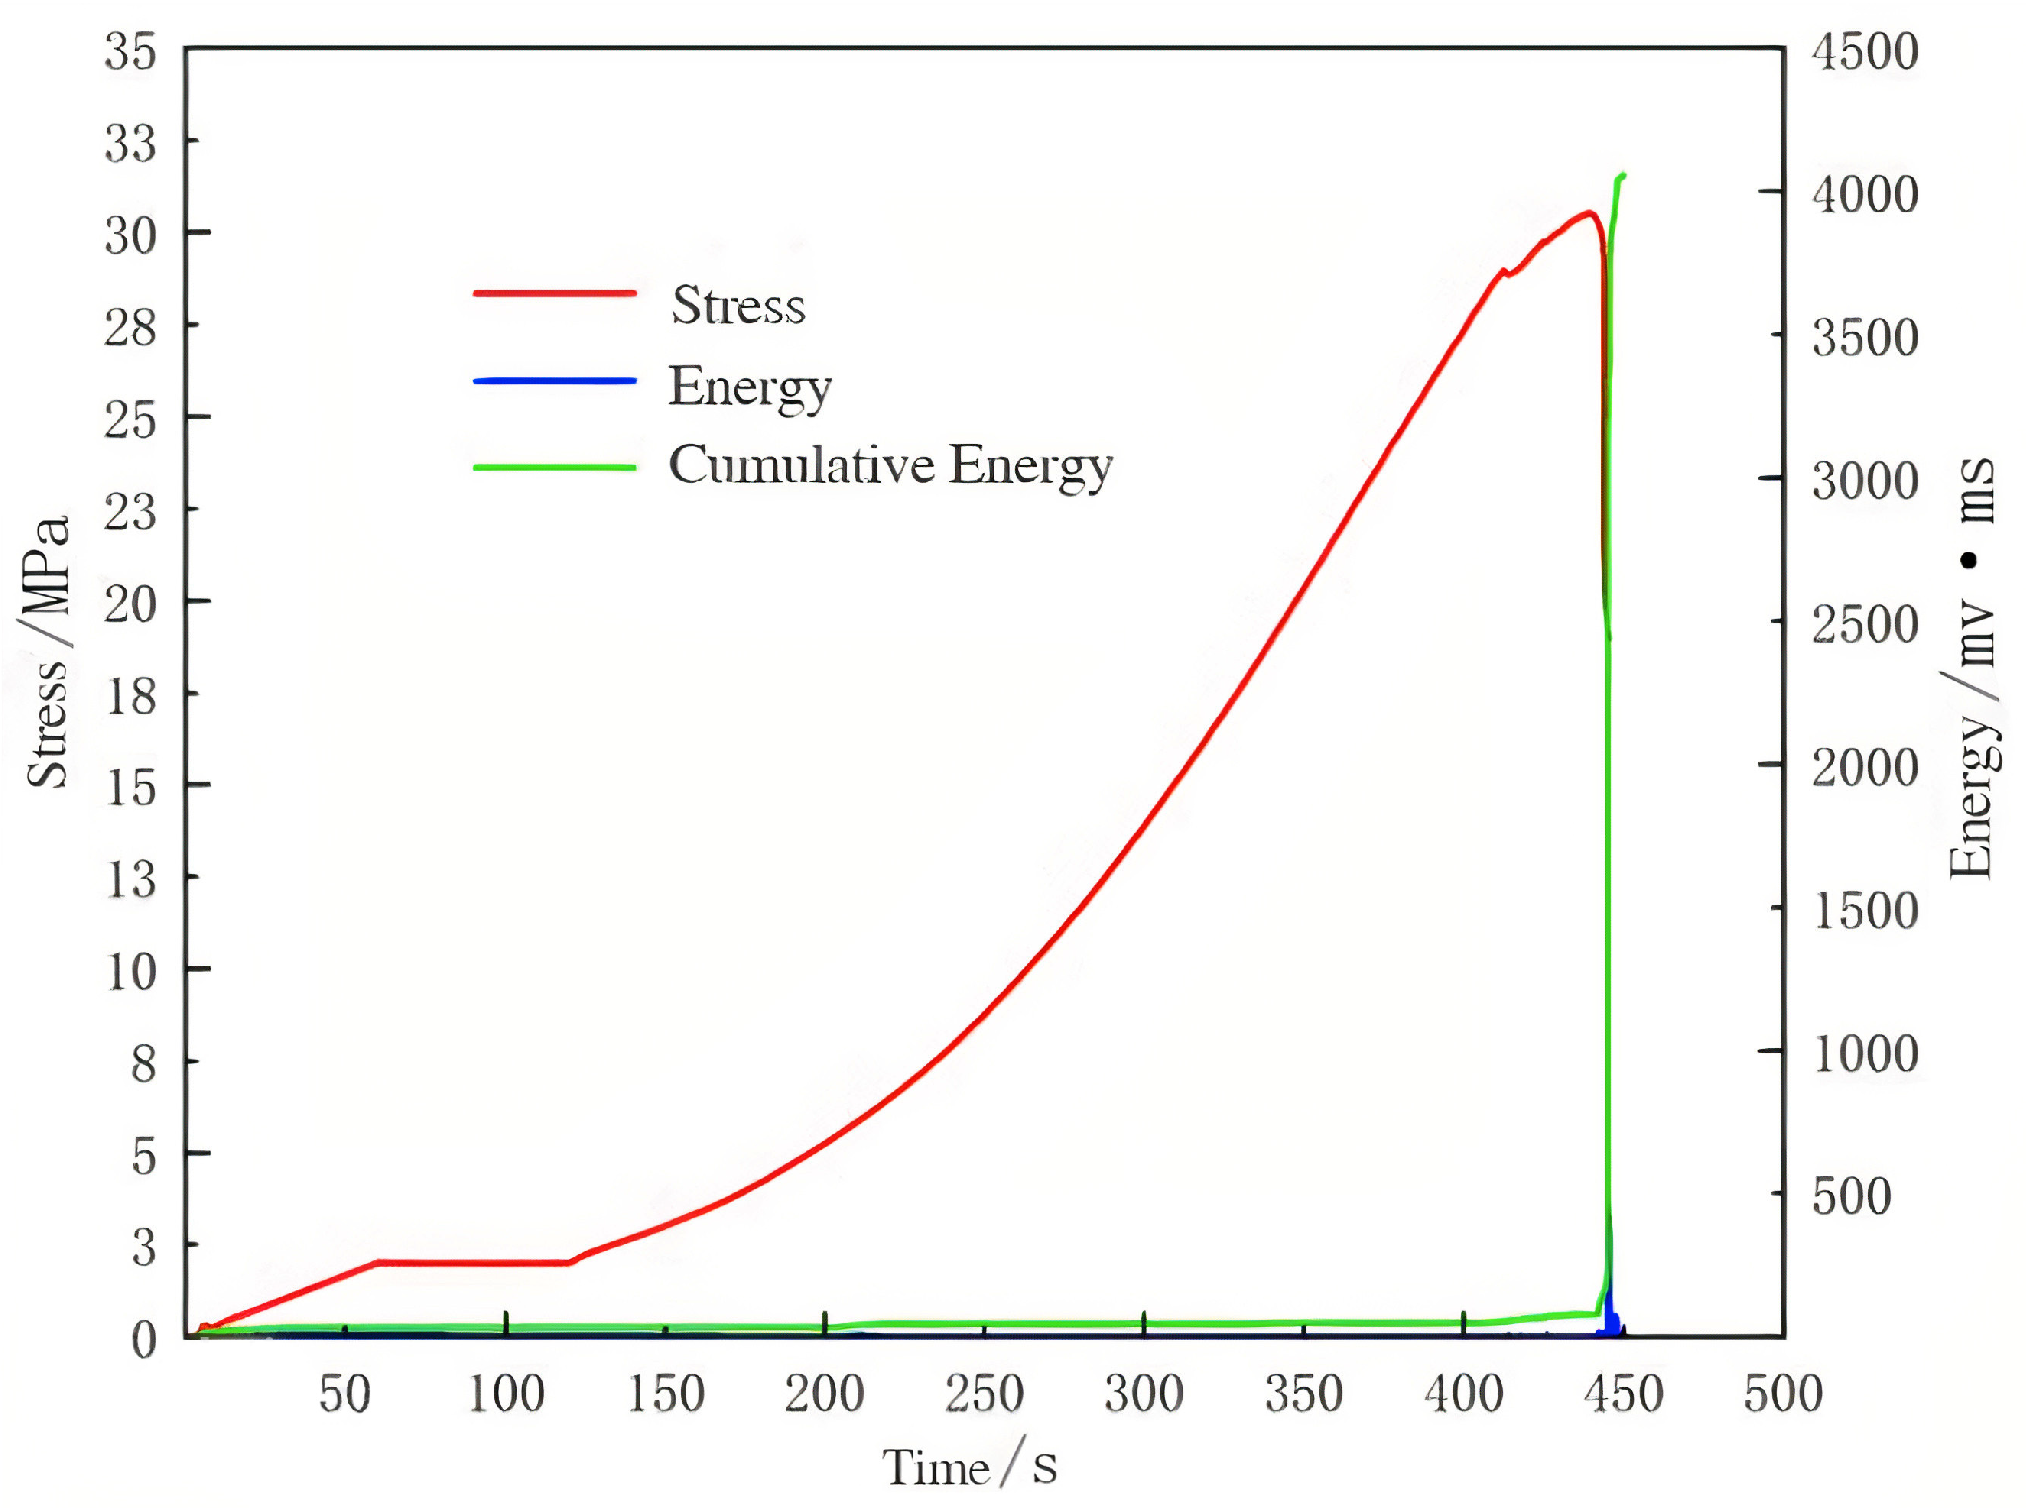
Figure 8, those under the 100 °C condition are shown in
Figure 9, and those under the 200 °C condition are shown in
Figure 10.
The experimental data in
Figure 8 indicate clearly that the concrete generated AE signals continuously throughout the loading process. The initiation and propagation of microcracks are inherent characteristics of concrete’s response under load, and there was a significant accumulation of microscopic damage even in the macroscopic linear elastic stage. The AE energy release rate showed a strong positive correlation with the stress level applied: in the low-stress stage, energy release was relatively sparse and weak and corresponded to local adjustments of isolated micro-defects within the material; as the stress level approached the peak (approximately 70–80% of the ultimate strength), both the frequency of AE events and the intensity of energy released exhibited a non-linear accelerating growth trend, in which a steep inflection point appeared in the cumulative energy curve. This marked a critical stage where microcracks evolved gradually from relatively stable, dispersed, and independent propagation to densification, interaction, and finally connection to form dominant macroscopic cracks. The surge in cumulative energy, particularly in the section after the peak stress, reflected the enormous fracture energy consumed by the rapid unstable propagation of the crack network.
The analysis of acoustic emission (AE) responses during uniaxial compression of the 100 °C temperature–humidity-coupled concrete specimen in
Figure 9 indicated that high-temperature and high-humidity pretreatment altered its damage evolution mechanism and mechanical properties significantly. Although AE activities accompanied the entire loading process (which confirmed the continuous initiation and propagation of cracks), the characteristics of energy release showed critical changes: at relatively low stress levels, both the frequency of AE events and the intensity of energy release increased significantly, and the cumulative energy curve exhibited an accelerating inflection point before the peak stress was reached. This suggests that temperature–humidity coupling effects (such as microcrack induction, ITZ weakening, or decomposition of hydration products) cause substantial initial damage that reduces the energy barrier required for stable propagation of microcracks significantly, and leads to an earlier threshold and an accelerated rate of damage accumulation. It is noteworthy that the increase in post-peak cumulative energy slowed, implying an increase in the material’s brittle tendency, where the crack network tended to concentrate and penetrate more rapidly, and thus reduced post-peak dispersed energy dissipation. In summary, 100 °C temperature–humidity degradation exacerbated the initial sensitivity to damage and the concrete’s potential embrittlement, but the failure process still began under low stress, underwent progressive accumulation, and led eventually to instability. These modulated AE characteristics provide key indicators with which to monitor non-destructive damage and assess concrete structures’ life in harsh environments.
In the 200 °C condition (
Figure 10), the energy release pattern of the specimen exhibited further deterioration compared to the 100 °C condition: at an extremely low stress stage, both the frequency of AE events and the intensity of energy release showed an abnormally active jump, and the cumulative energy curve presented a steep rising inflection point significantly earlier before it reached the peak stress. This phenomenon highlights that the 200 °C temperature–humidity coupling effect caused in-depth degradation of the concrete’s micro-mesoscopic structure (such as severe decomposition of hydration products, extensive debonding at the aggregate–paste interfacial transition zone (ITZ), and pre-existing microcrack networks), which resulted in a substantial reduction in the energy barrier for the material’s internal damage accumulation and a significant advance in the critical threshold for unstable propagation of microcracks.
Particularly critical is that the growth rate of post-peak cumulative energy slowed sharply, and even demonstrated a short-term plateau trend, indicating that the crack propagation mode had shifted from the dispersed and progressive failure at room temperature to highly localized rapid penetration, in which the characteristics of the material’s brittle fracture intensified significantly.
3.4. Thermal Infrared Test
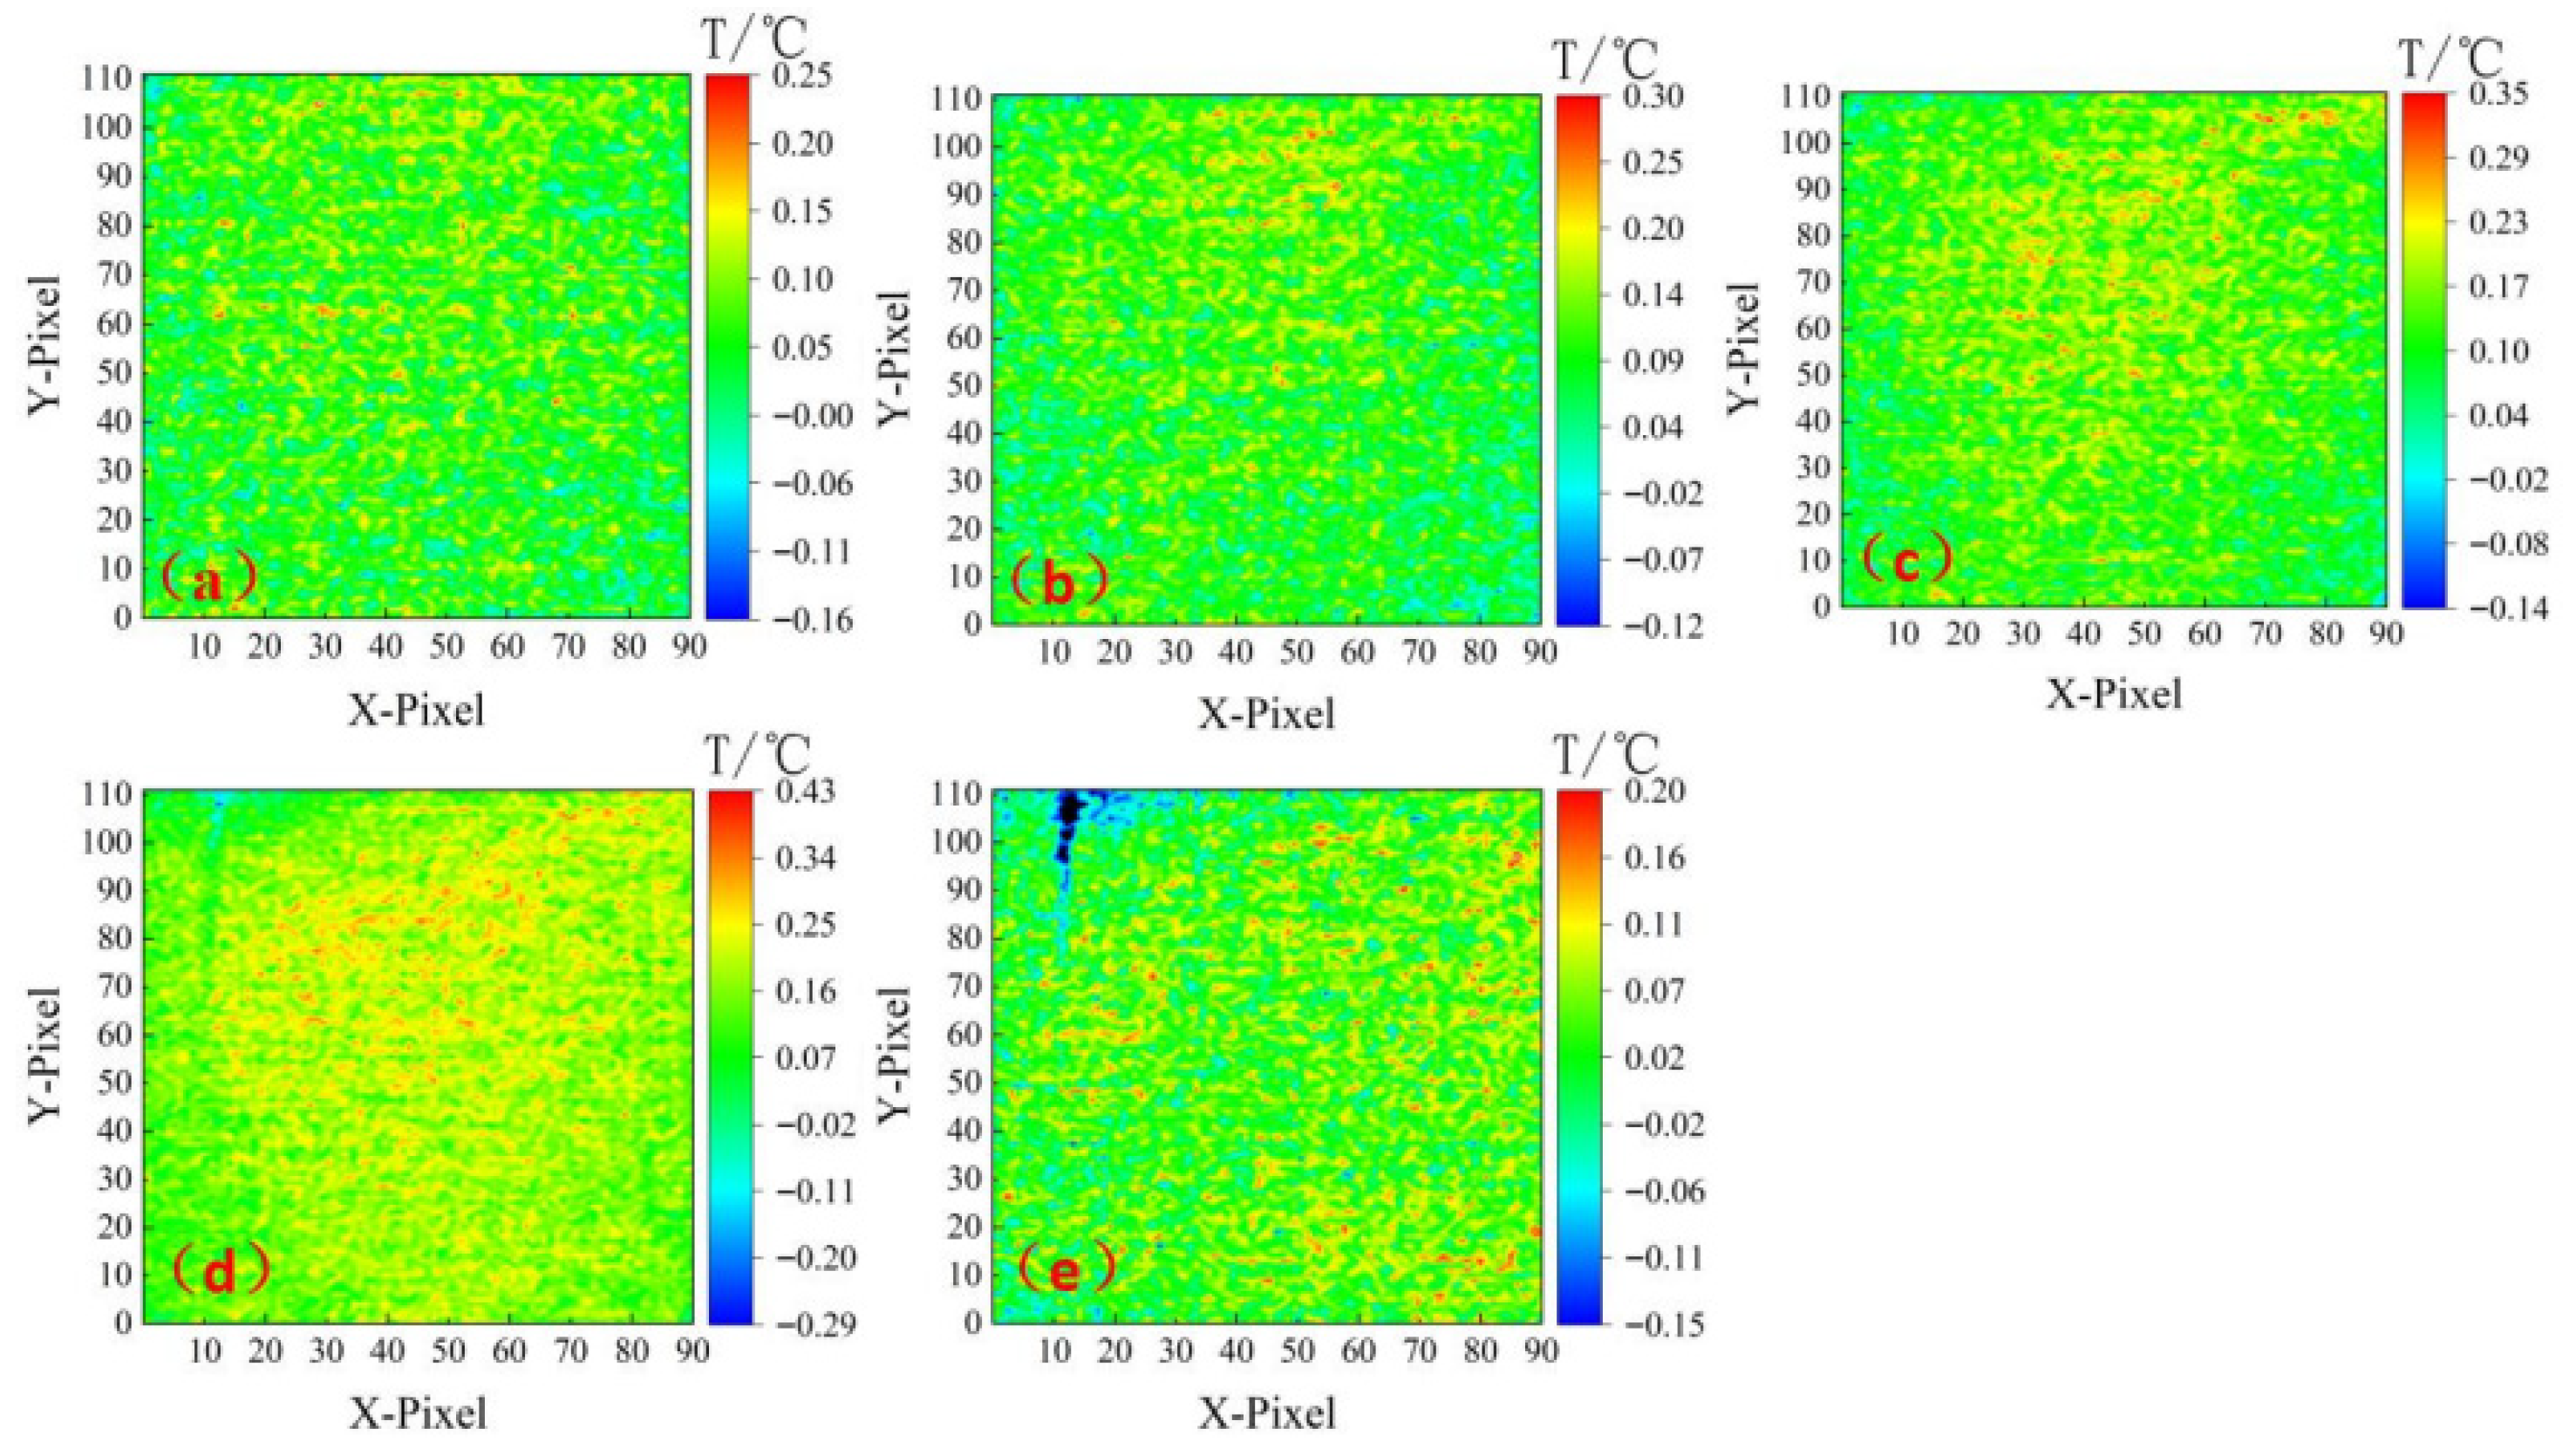
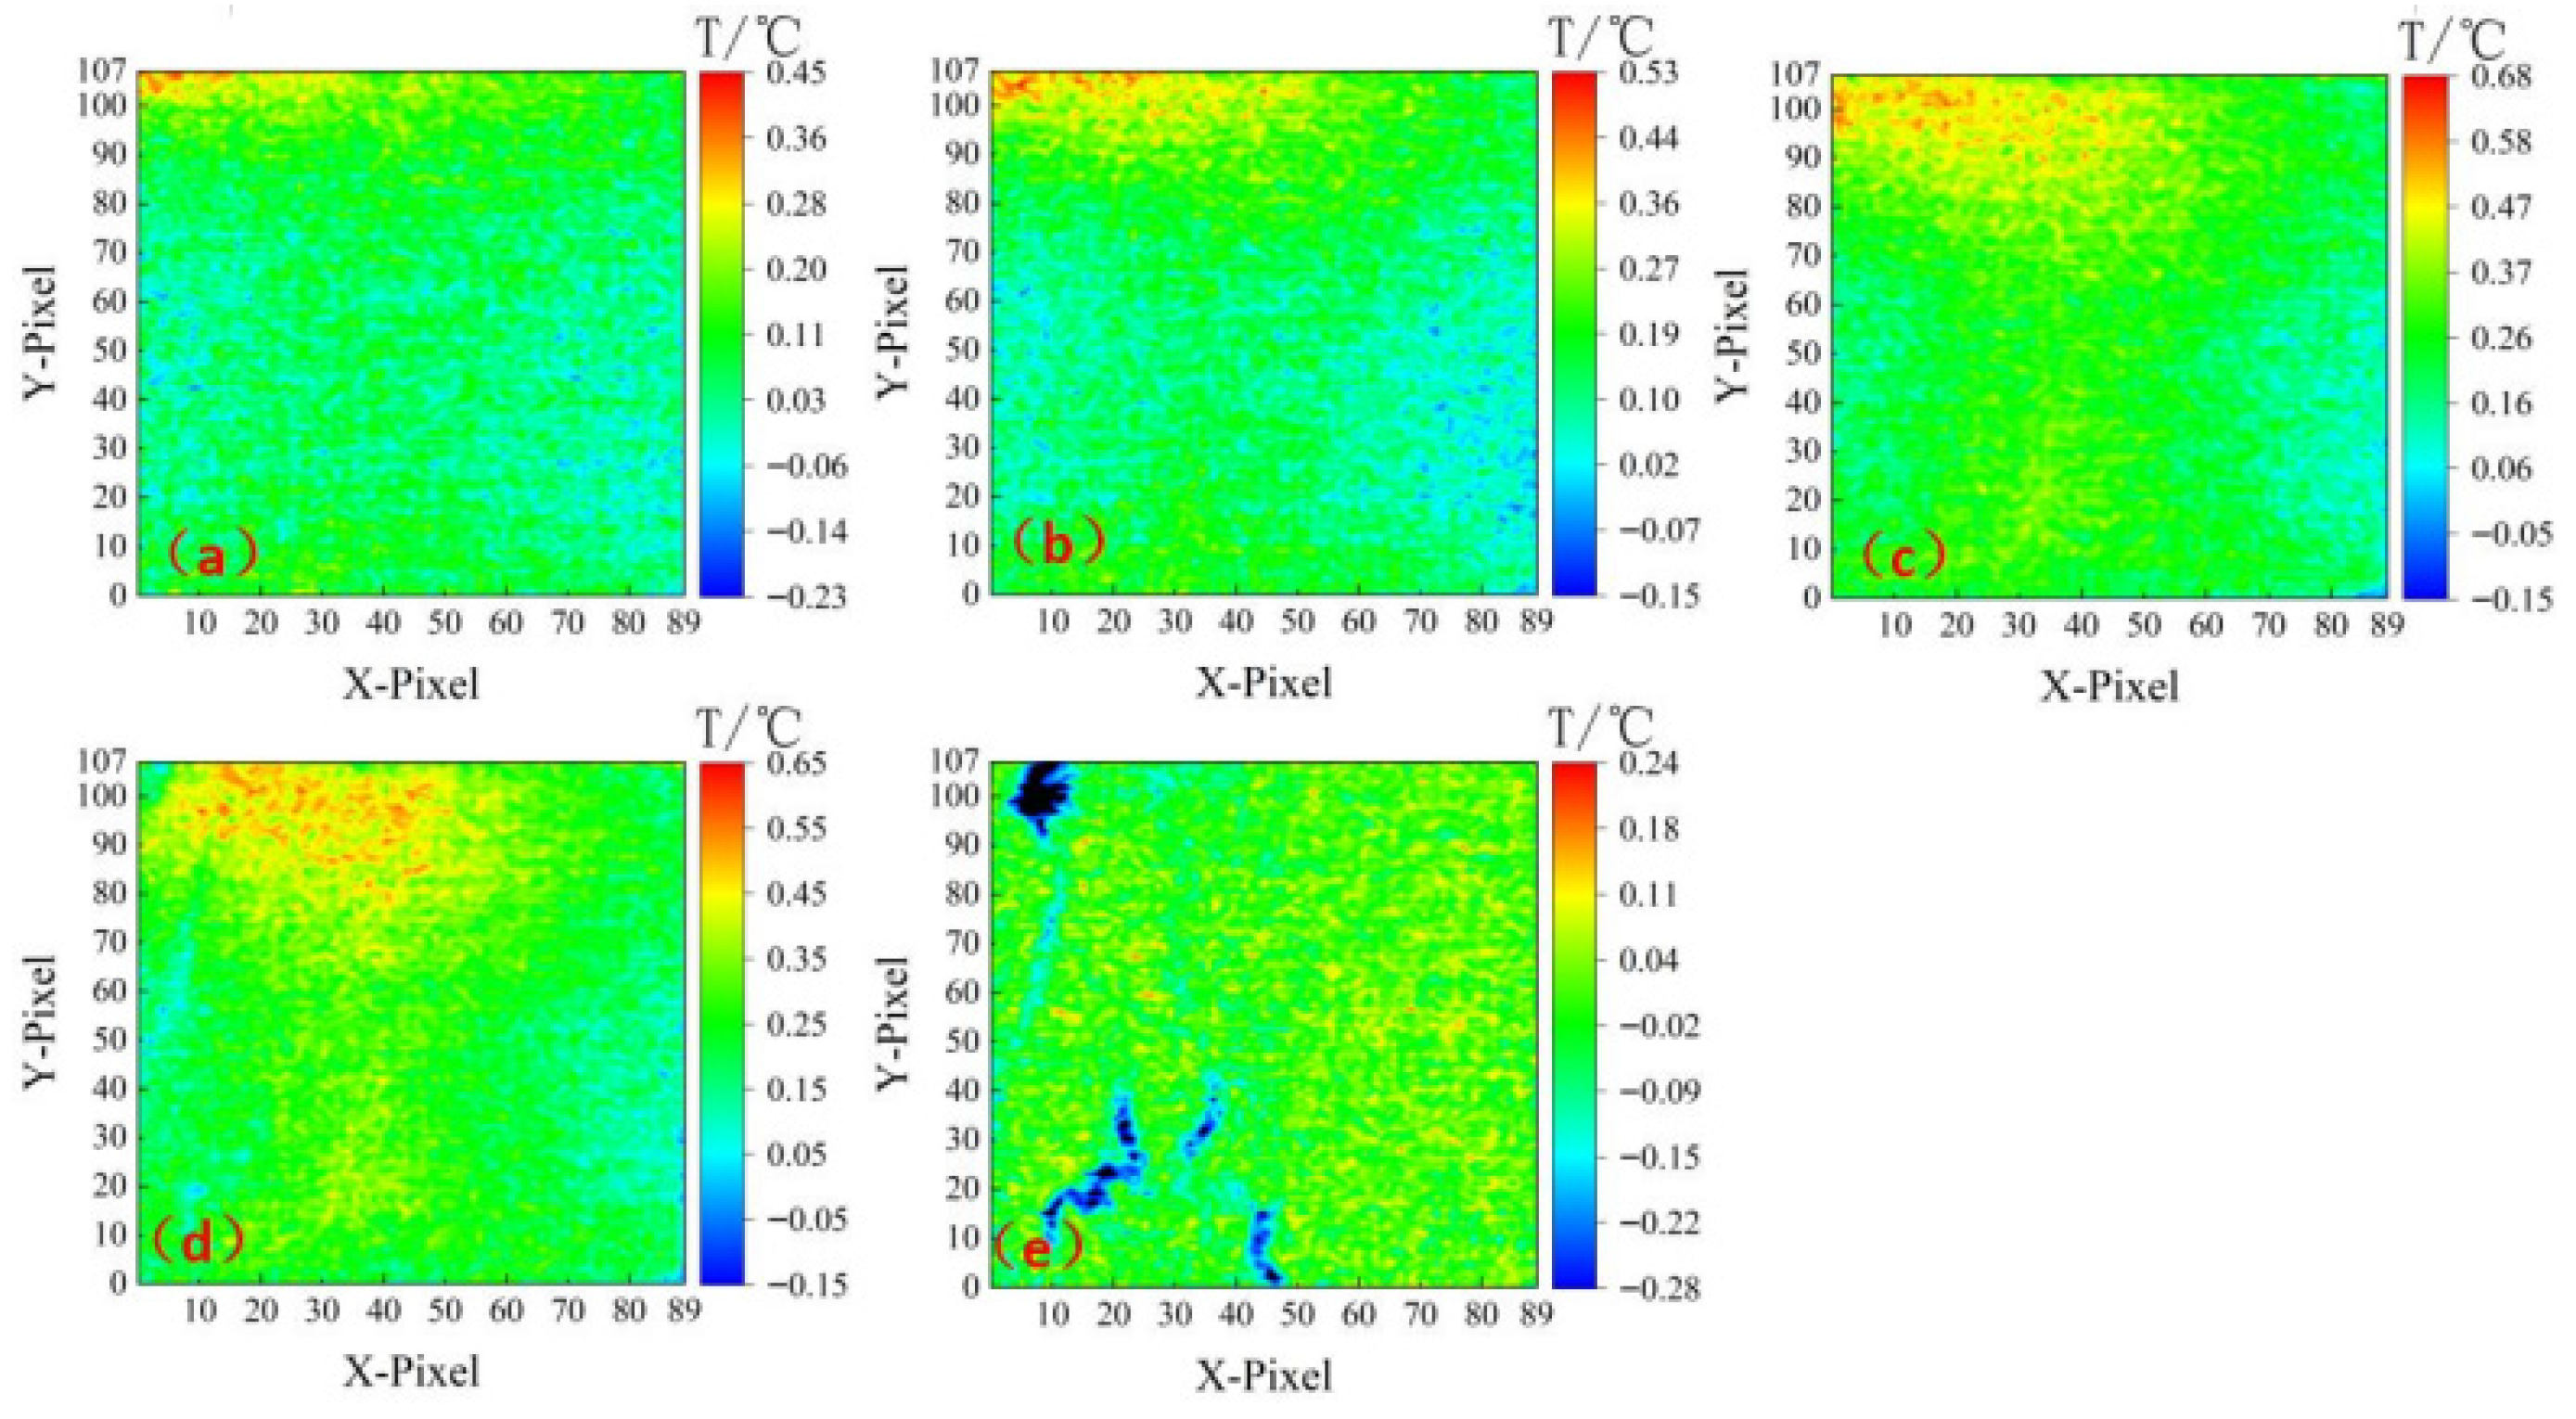
The thermal infrared test results of the specimens under the normal-temperature condition are shown in
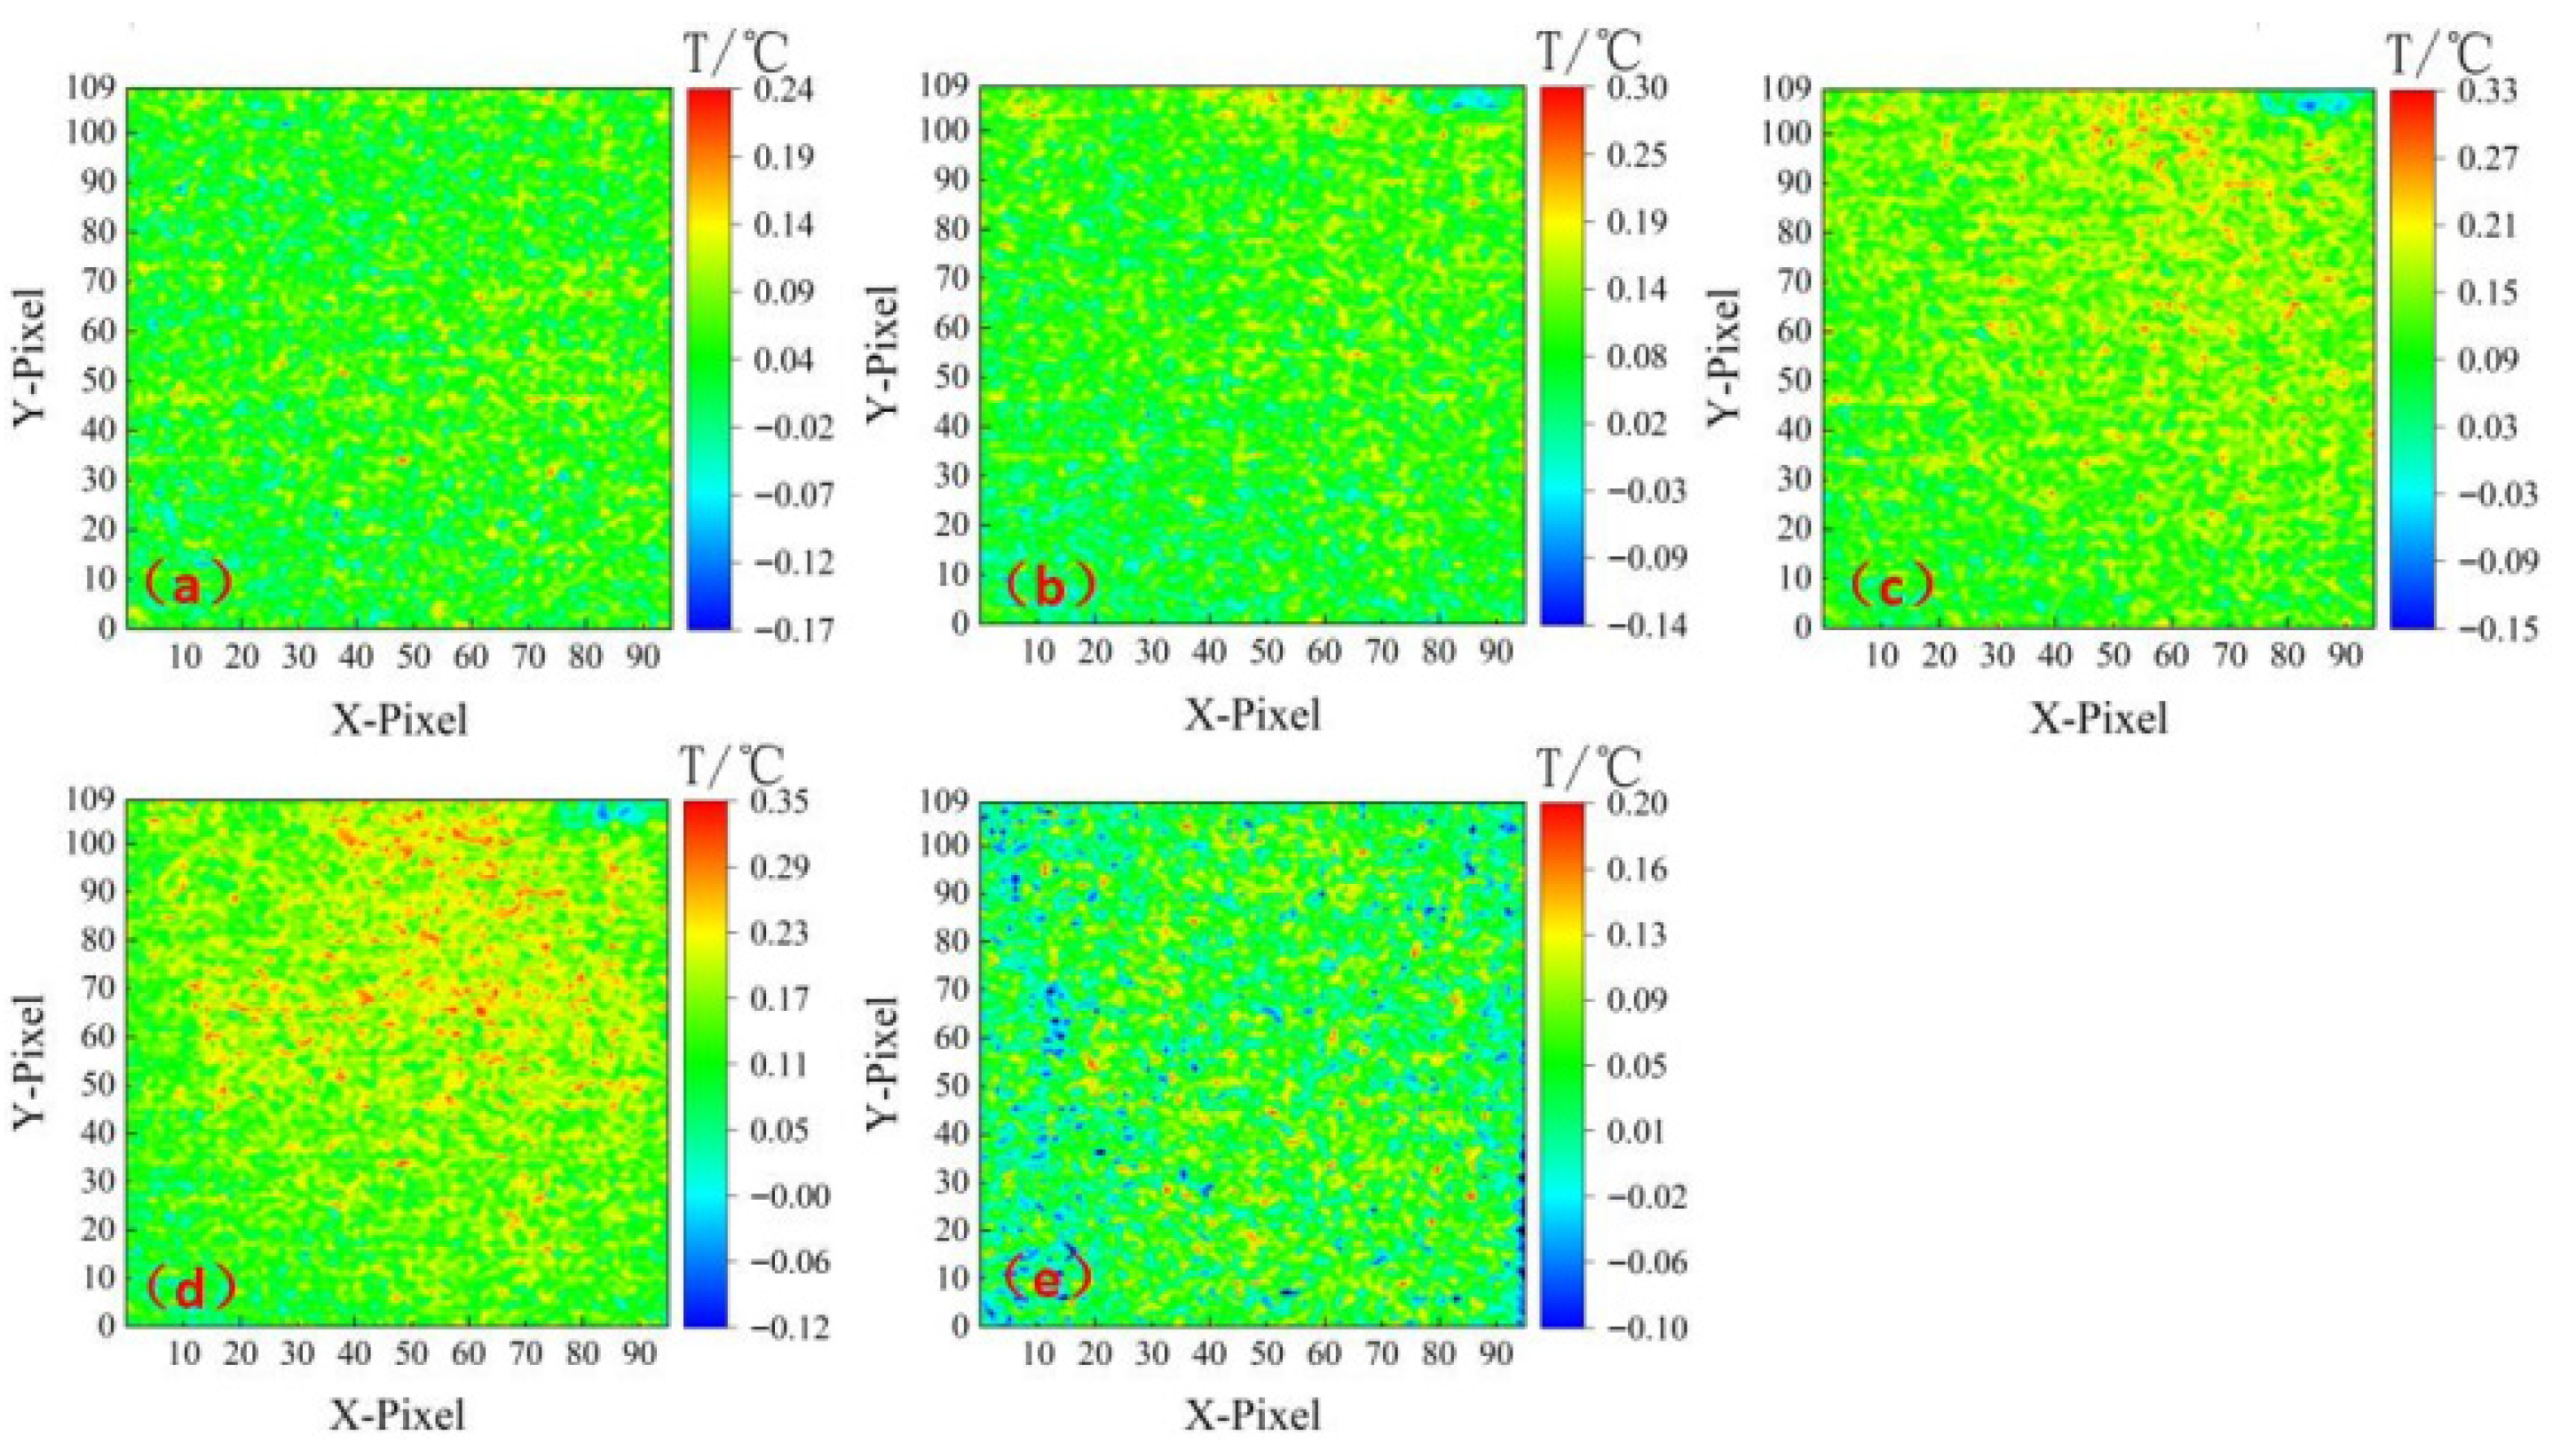
Figure 11, those under the 100 °C condition are shown in
Figure 12, and those under the 200 °C condition are shown in
Figure 13.
As shown in
Figure 11, under normal temperature and humidity coupling conditions, the infrared thermal imaging analysis of concrete specimens revealed the typical characteristics of their thermodynamic responses and damage evolution mechanisms. Infrared thermograms indicated that the temperature field on the specimen’s surface exhibited significant spatial heterogeneity during uniaxial compression: continuous temperature rises (ΔT ≈ 1.2–2.8 °C) occurred in the central region and the contact zone with the upper indenter. This phenomenon resulted from the conversion of elastic energy into thermal energy attributable to stress concentration and frictional heat generation from internal microcracks. The high consistency between the central area in
Figure 11c/the corner in
Figure 11e and the final failure surface suggested that thermal signals can characterize the damage accumulation process effectively. When the stress approached the peak value (t = 436–441 s), a sudden temperature drop (ΔT ≈ −3.5 °C) occurred in the crack initiation zone. This thermal shock effect stemmed from adiabatic expansion caused by fracture energy release and heat absorption from water vapor evaporation in micro-regions, and confirmed moisture migration’s key role in dissipating energy.
As shown in
Figure 12, under the 100 °C temperature–humidity coupling condition, the evolution of the surface temperature field during uniaxial compression revealed by thermograms exhibited three-stage characteristics:
Because of the superposition of the specimen’s initial thermal background (~100 °C) and heat generated by compression, in the initial stage (t < 120 s), the temperature rise rate (dT/dt ≈ 0.18 °C/s) overall was significantly higher than that of the specimen under normal temperature.
In the development stage (120–392 s), energy accumulation presented a bimodal distribution—the indenter contact area formed a continuous high-temperature zone attributable to frictional effects (ΔTmax ≈ 4.2 °C), while the central part of the specimen underwent local temperature reduction (ΔTmin ≈ −1.5 °C) caused by pore vapor migration. This thermal differentiation phenomenon stemmed from the strong coupling between the moisture phase change and stress field at high temperatures: the reduction in liquid water weakened the capillary heat absorption effect, but enhanced vapor diffusion intensified heat loss through convection.
In the failure stage (t > 392 s), crack initiation was accompanied by a severe thermal shock effect (ΔT ≈ −5.8 °C), in which the temperature drop amplitude increased by 65% compared to the normal-temperature specimen. This was attributable to the fact that high temperature reduced the energy required for microcrack propagation and enhanced the adiabatic expansion effect of vapor at the crack tip.
The damage mode exhibited obvious high-temperature characteristics: the thermal concentration coefficient in the indenter area (T = 1.85) was 40% higher than that of the normal-temperature specimen, indicating that the contact surface is more prone to shear failure; the spatial consistency between the crack location and the high-temperature core–low-temperature anomaly zone (|ΔT| ≥ 1.5 °C/cm) reached 92%, which verified infrared features’ sensitive ability to provide an early warning of high-temperature damage.
The temperature–humidity coupling mechanism underwent an essential transformation at this temperature threshold—moisture dominated the heat transport process in the form of vapor migration, and its latent heat of phase change regulated the energy distribution mode significantly. As a result, the thermodynamic response presented composite characteristics: frictional heat generation dominates the temperature rise in the indenter area, vapor diffusion inhibits the temperature rise in the central part, and phase change heat absorption intensifies the temperature drop during fracture.
In the initial stage (t < 220 s) of
Figure 13, a high-temperature core was formed preferentially in the indenter area (ΔTmax ≈ 5.8 °C), where its thermal concentration coefficient (KT = 2.1) increased by 13.5% compared to the 100 °C specimen. This was attributable to the weakened aggregate–mortar interface caused by high temperature, which enhanced the frictional heat effect. In the development stage (220–411 s), energy accumulation exhibited a unique pattern of “migration from the edge to the center” (
Figure 13b,c). This phenomenon is related to the micro-pore network formed by the dehydration of cement paste at the threshold of 200 °C; directional migration of pore vapor (flow rate ~0.35 mm/s) induced redistribution of thermal convection and resulted in a bipolar gradient characteristic in the temperature field (|ΔT| ≥ 2.0 °C/cm). In the failure stage (t > 430 s), crack initiation was accompanied by intense heat dissipation (ΔT ≈ −7.2 °C), in which the temperature drop amplitude increased by 24.1% compared to the 100 °C specimen. The mechanism lays in the fact that high temperature reduced the crack propagation energy to 38% of that at room temperature, and the Joule–Thomson effect of vapor at the crack tip was enhanced significantly. The damage evolution presented high-temperature brittle characteristics: the spatial correlation between the initial thermal anomaly area (upper left corner/upper indenter) and the final fracture surface reached 95%, while the thermal shock time constant (τ ≈ 0.6 s) when the crack forms was shortened to 45% of that of the room-temperature specimen, confirming the phase change-mechanics’ coupling mechanism that high-temperature accelerates energy release. The temperature–humidity coupling effect is reconstructed deeply at this temperature: complete vaporization of free water shifted heat transport from capillary action to vapor diffusion dominance. The phase change latent heat (~2200 kJ/kg) and increased permeability (k ≈ 1.8×10
−14 m
2) jointly led to an imbalance in energy distribution among the three processes of indenter frictional heat accumulation, vapor migration heat dissipation, and crack phase change heat absorption; macroscopically, in technical contexts, this represents an increase of 37% in the thermodynamic responses’ spatial heterogeneity.
As the temperature–humidity coupling temperature increased, the concrete’s thermodynamic behavior showed a significant threshold response. Both the room-temperature and 100 °C specimens exhibited central energy accumulation (thermal concentration coefficient KT = 1.62→1.85), but at 100 °C, the indenter friction temperature increase was enhanced by 40% and the local temperature dropped because of vapor diffusion (|ΔT| increased to 1.5 °C/cm). At the critical point of 200 °C, the energy accumulation mode transformed into “edge-to-center migration” (
Figure 13 (b→c)), which was related to the achievement of the migration of vapor in pores (0.35 mm/s) caused by the micro-pore network formed by cement paste dehydration at 200 °C, which resulted in a bipolar temperature gradient (|ΔT| ≥ 2.0 °C/cm). The thermal shock effect in the failure stage strengthened gradually: the temperature drop amplitude in the crack area increased from −3.5 °C (room temperature) to −7.2 °C (200 °C), and the mechanism shifted from capillary heat absorption to vapor adiabatic expansion (Joule–Thomson effect), while the heat absorption efficiency increased by 65%. The ability to warn of early damage was optimized simultaneously: the spatial correlation between thermal anomaly areas and fracture surfaces increased from 86% (room temperature) to 95% (200 °C), and the thermal shock time constant was shortened by 55%. Thus, the temperature–humidity coupling mechanism led to a paradigm shift from liquid capillary action to gaseous vapor diffusion dominance.
