Article

Spatiotemporal Distribution and Driving Factors of Historic and Cultural Villages in China

1
Department of Surveying and Planning, Shangqiu Normal University, Shangqiu 476000, China
2
Nanjing Zhonglu Bide Tourism Planning and Design Research Institute, Nanjing 211000, China
3
Department of Architecture and Civil Engineering, City University of Hong Kong, Hong Kong 518057, China
4
School of Civil Engineering and Architecture, Southwest University of Science and Technology, Mianyang 621010, China
5
College of Land Science and Technology, China Agricultural University, Beijing 100193, China
*
Authors to whom correspondence should be addressed.
Buildings 2025, 15(19), 3507; https://doi.org/10.3390/buildings15193507
Submission received: 24 August 2025 / Revised: 25 September 2025 / Accepted: 26 September 2025 / Published: 28 September 2025
(This article belongs to the Special Issue New Challenges in Digital City Planning)

Abstract

Historic and cultural villages in China are increasingly challenged by rapid urbanization, uneven commercial development, and fragmented preservation mechanisms. Understanding their spatiotemporal distribution and the factors shaping it is crucial for advancing the integrated development of cultural heritage conservation, ecological sustainability, and socio-economic growth. This study examines 487 historic and cultural villages using the nearest neighbor index (NNI) and kernel density analyses to reveal spatial differentiation patterns. Vector buffer analysis and the geographic detector method were further employed to identify the key drivers of village distribution. The results indicate that: (1) historic and cultural villages exhibit a distinctly clustered spatial pattern, characterized by “more in the southeast, fewer in the northwest; more in the northeast, fewer in the southwest” (NNI = 0.44, Z = –23.52, p = 0.00); (2) provincial-level spatial density demonstrates clear stratification, with high-density clusters concentrated in the Yangtze River Delta, southern Anhui, the Fujian–Zhejiang–Jiangxi junction, and along the Yellow River in Shanxi–Shaanxi–Henan. From the fifth to seventh designation batches, kernel density peaks (maximum ~0.11 × 10⁻²) increased significantly, reflecting stronger spatial clustering; and (3) the spatial distribution of villages is jointly shaped by natural geography, socio-economic conditions, transportation infrastructure, visitor markets, and tourism resources. Among these, nighttime light intensity was identified as the most influential individual factor (q = 0.6132), while the combination of slope aspect and per capita disposable income emerged as the dominant factor pair (q = 0.966).

1. Introduction

China’s nationally designated historic and cultural villages (historic and cultural villages, villages) refer to traditional settlements that safeguard abundant cultural relics and embody significant historical or revolutionary value [1] (Table A1). As living witnesses to the trajectory of human settlement, these villages preserve profound regional cultural legacies and intergenerational knowledge, representing a critical component of both tangible and intangible cultural heritage [2]. Closely aligned with UNESCO’s notions of cultural landscapes and living heritage, they not only reinforce local identity and social cohesion but also play an essential role in sustaining global cultural diversity and advancing strategies for sustainable development [3]. In recent years, with the continuous refinement of China’s heritage conservation framework, non-traditional heritage categories—such as vernacular architecture, historic streets, cultural routes, and twentieth-century heritage—have gradually been incorporated into protection agendas, thereby expanding the scope and enriching the connotation of villages [4]. Nevertheless, under the pressures of accelerated urbanization and regional restructuring, nearly 83% of traditional villages in China face the challenge of depopulation and spatial “hollowing out,” with unprotected villages disappearing at an annual rate of 1–2%. As a critical subset of traditional villages, villages are disproportionately affected by shrinking populations, spatial voids, and cultural ecosystem fragmentation. In some mountainous regions of central and western China, the hollowing-out rate exceeds 50%, with the elderly accounting for over 30% of the remaining population, severely undermining prospects for sustainable development [5]. In response, the Chinese government has emphasized the fundamental role of cultural heritage in rural revitalization and ecological civilization. This highlights the urgent need for a systematic examination of the spatial evolution and underlying driving forces of villages, in order to foster coordinated progress in heritage conservation and rural development.
Villages constitute an irreplaceable element of China’s cultural legacy. At the international level, heritage studies have yielded significant insights into spatial structures and evolutionary processes, offering valuable references for China. Much of this work builds on quantitative analysis and legal frameworks. Conceptually, notions such as heritage corridors and cultural landscapes provide theoretical guidance for identifying clusters of heritage resources at macro scales [6]. Methodologically, hydrodynamic models have been used to examine how water systems shape village layouts and architectural forms [7], while environmental fluid dynamics models have been employed to assess the influence of natural conditions on preservation outcomes [8]. Legally, UNESCO’s Convention Concerning the Protection of the World Cultural and Natural Heritage (1972) emphasizes the monitoring of “integrity” and “authenticity,” thereby establishing rigorous international standards for long-term and fine-grained assessment of heritage values and carriers [9]. Against the backdrop of multiple and often competing development agendas, analyzing the spatiotemporal patterns of villages has emerged as a vital avenue for advancing settlement studies [10]. The dialectic of spatial clustering and diffusion, alongside temporal continuity and transformation, constitutes the basic framework of their evolution. Spatial analytical methods have been applied to detect geographic clusters of villages, such as heritage corridors—linear zones rich in cultural assets reflecting distinct historical or cultural trajectories—and traditional settlement cluster belts—aggregations of villages characterized by geographic proximity, cultural affinity, and common historical roots [11,12]. Such studies not only contribute to building regional networks of heritage protection but also provide scientific support for integrating conservation with eco-tourism and cultural creative industries [13]. Existing scholarship largely emphasizes planning for conservation and tourism development, addressing institutional frameworks, heritage utilization strategies, and branding. However, research on spatial structures, evolutionary trajectories, and typological characteristics remains mostly qualitative, with limited attention to national-scale pattern recognition or quantitative mechanism analysis [14,15,16].
The advancement of Geographic Information Systems (GIS) has provided powerful methodological tools for investigating the spatiotemporal dynamics of traditional settlements, making it a cornerstone of international heritage research [17]. GIS-based methods, such as nearest-neighbor analysis, kernel density estimation, and standard deviational ellipse, enable detailed assessments of clustering tendencies, density variations, and expansion directions of historic villages, thereby illuminating distributional dynamics and evolutionary patterns [18]. Although these approaches are widely applied in international heritage monitoring and urban morphology research, domestic studies remain predominantly confined to provincial, watershed, or local scales, with limited exploration of national-level trends [19,20]. Hence, the construction of a unified analytical framework at the national scale is imperative for systematically revealing spatiotemporal distribution patterns and informing cross-regional protection strategies and resource allocation.
Beyond descriptive analysis, the systematic identification of key drivers shaping the spatial distribution of villages has become a central focus of global heritage research [21]. The evolution of such sites reflects the coupled effects of natural geographical contexts, historical human activities, and institutional arrangements [22]. While some studies qualitatively examine governance systems, community participation, and morphological characteristics, others employ spatial econometric tools such as spatial autocorrelation and geographically weighted regression to quantify relationships between village distribution and variables such as population density, slope, and building density [23,24]. However, these methods often fall short in capturing nonlinear interactions and spatial heterogeneity, limiting their explanatory power. Further attempts to integrate GIS analysis with Multi-Criteria Decision Analysis (MCDA) have produced “memory–space–function” models for historic districts [25], though challenges remain regarding subjectivity in weight assignment and model validation. With advances in technology, big data analytics and machine learning approaches have also been introduced into heritage morphology studies [26]. Yet, their applicability is frequently constrained by issues of data quality and interpretability. To overcome these limitations, this study adopts the Geodetector model—a spatial statistical method increasingly applied across geography, public health, and regional studies. Geodetector is particularly effective in quantifying the explanatory power and interactive effects of multiple factors, thereby offering a robust framework for disentangling the drivers of spatial differentiation [27] (Table A2). Building upon this approach, we construct a multidimensional indicator system encompassing five domains—natural environment, socioeconomic foundations, transportation accessibility, tourist markets, and tourism resources—to identify dominant drivers and explore their interactions in shaping the evolution of villages.
In conclusion, this study seeks to systematically analyze the spatiotemporal evolution and driving mechanisms of villages across China at the national scale. Specifically, it aims to: (1) delineate the distributional patterns and dynamic evolutionary pathways of the first to seventh batches of nationally recognized villages; (2) establish a multidimensional indicator framework and apply Geodetector to uncover driving forces and interaction mechanisms; and (3) propose regionally differentiated conservation and development strategies to enhance the endogenous vitality and living heritage value of these villages. The findings are intended to provide theoretical support for integrating cultural heritage governance with rural revitalization while seeking to balance preservation with socioeconomic development. Beyond informing China’s practices, the study aspires to contribute transferable insights for other developing countries and culturally diverse regions.

2. Research Data and Methods

2.1. Overview of the Study Area

The research is conducted within mainland China, which is situated in East Asia and encompasses a land area of approximately 9.6 million km2 and a maritime territory of about 4.73 million km2. Its extensive coastline borders the Bohai Sea, the Yellow Sea, the East China Sea, and the South China Sea (Figure 1). The overall topography presents a west–east gradient, with the western regions dominated by the Qinghai–Tibet Plateau and the Himalayas, while the eastern regions are characterized by expansive plains and low hills, including the North China Plain and the middle–lower reaches of the Yangtze River Plain [28]. Mainland China spans a wide range of climatic zones, from tropical to cold temperate, predominantly shaped by the East Asian monsoon system. This results in a hydrothermal distribution pattern described as “humid in the southeast and arid in the northwest,” with considerable spatial variability in precipitation. Such diverse geographical conditions have fostered distinctive settlement patterns and cultural landscapes, ranging from the water towns of Jiangnan to the fortified villages of Northwest China. These settlements embody the adaptive wisdom of human–environment interactions and represent tangible evidence of population migration, cultural exchange, and regional development throughout history, thereby illustrating the pluralistic yet unified character of Chinese civilization. Population distribution is highly uneven due to variations in topography, resource endowment, and development conditions. The Hu Huanyong Line demarcates a distinct pattern of dense populations in the east and sparse settlements in the west. Similarly, the economic landscape exhibits substantial spatial disparities, with a general gradient of “higher in the southeast and lower in the northwest.” To further capture the structural characteristics of economic development, scholars have proposed the “Bo–Tai Line,” connecting Bole in Xinjiang to Taipei in Taiwan. Running perpendicular to the Hu Huanyong Line, this axis offers an additional perspective for analyzing socioeconomic spatial differentiation in mainland China. By the end of 2023, the resident population of mainland China had reached 1.41 billion, with an urbanization rate of 66.16%. Within this natural and socioeconomic context, an examination of the spatial–temporal distribution and driving factors of villages not only deepens understanding of the evolutionary dynamics of traditional human settlements but also provides theoretical and practical implications for enhancing human settlement quality and safeguarding China’s cultural heritage.

2.2. Data Sources

The data used in this study consist of three main categories: vector data, raster data, and statistical data. Statistical information on villages, encompassing seven batches with a total of 487 sites, was obtained from the Ministry of Housing and Urban–Rural Development and the National Cultural Heritage Administration. These sites are distributed across 31 provinces, autonomous regions, and municipalities, as well as the Xinjiang Production and Construction Corps, with Hong Kong, Macao, and Taiwan excluded. Geographic coordinates for each village were collected using the Baidu Coordinate Picker System and compiled into a core database, which served as the foundation for spatial visualization and analysis. All spatial operations were conducted on the ArcGIS 10.8 platform. A detailed summary of data types, sources, and processing methods is presented in Table 1.

2.3. Research Framework

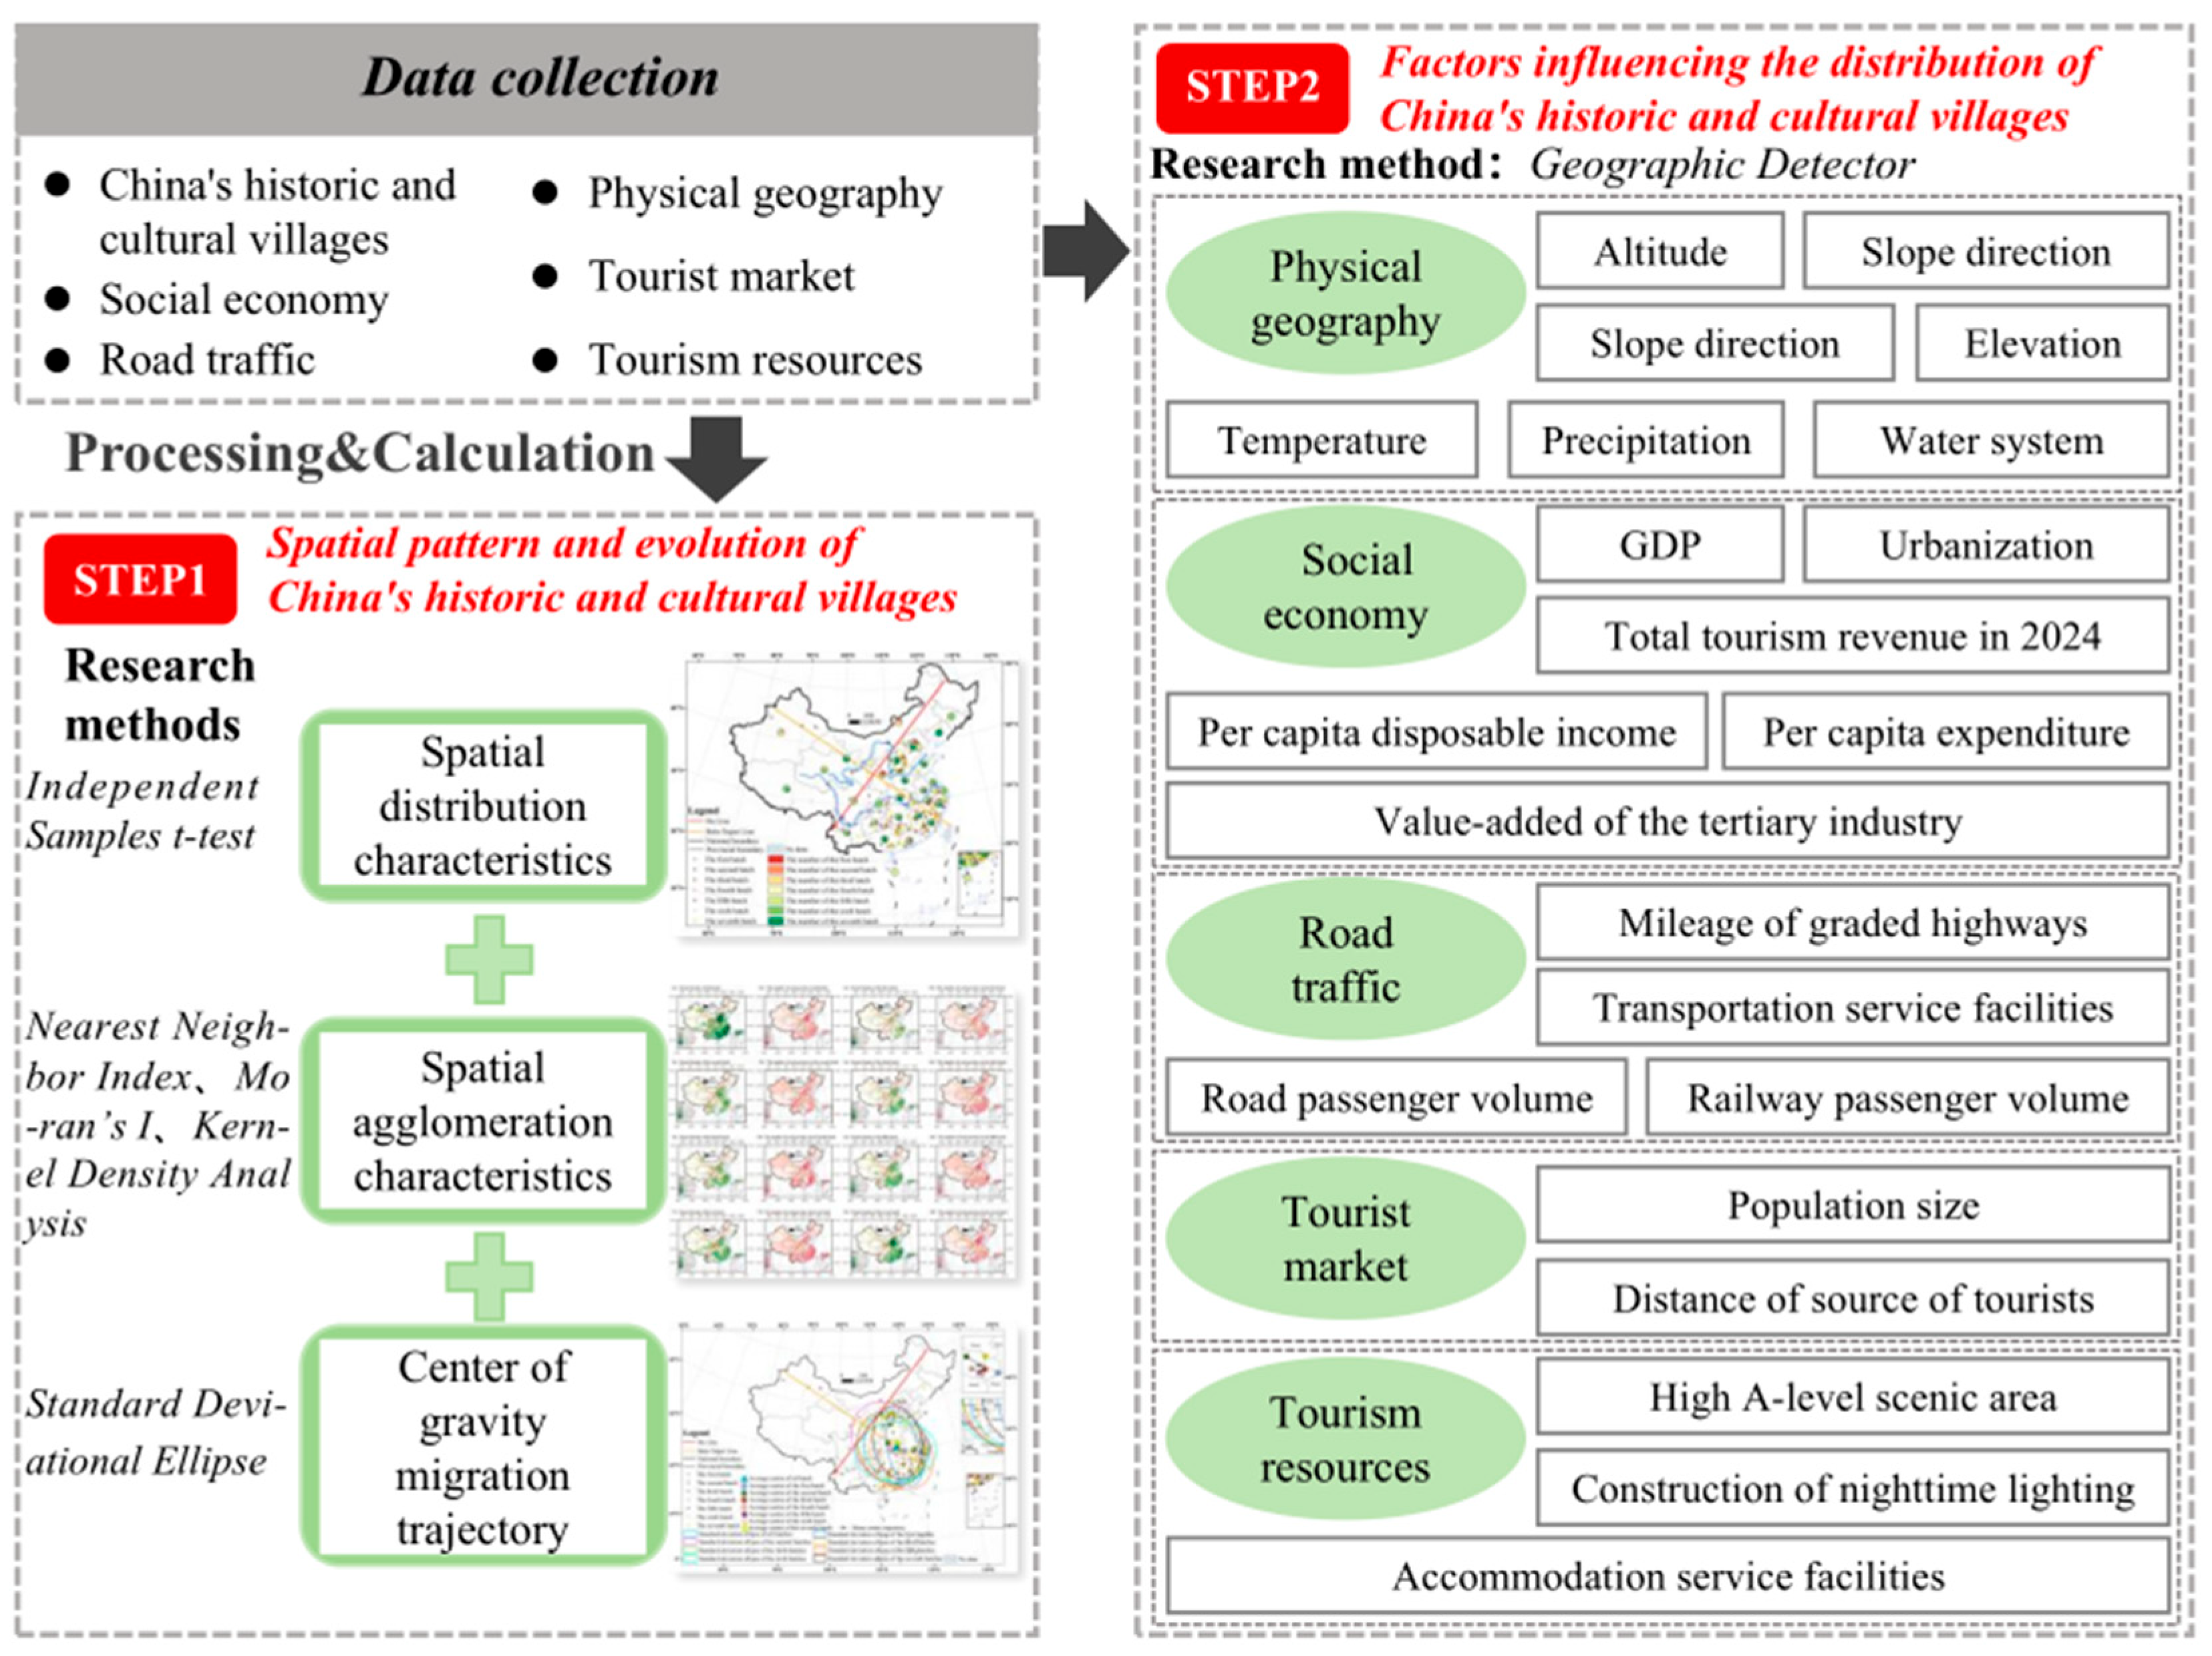
The research framework of this study is designed to systematically examine the spatial distribution patterns, driving mechanisms, and optimization strategies of villages (Figure 2). First, to quantify their spatiotemporal distribution and evolutionary trajectories, an independent-sample t-test was conducted to assess differences in village density across the Hu Huanyong Line and the Bo–Tai Line. Concurrently, GIS-based spatial analysis methods—including the nearest neighbor index, Moran’s I, kernel density estimation, and standard deviational ellipse—were employed to visualize spatial distribution features, clustering dynamics, and centroid migration from the first through the seventh batches of designated villages. Second, to identify the determinants underlying spatial differentiation, the geographical detector model was applied. This method allows for the assessment of the explanatory power of multiple dimensions—natural environment, socioeconomic development, transportation accessibility, tourist markets, and tourism resources—while also detecting the interactive effects among these influencing factors. Finally, building upon these empirical findings, region-specific protection and development strategies were proposed, providing a scientific basis for the sustainable conservation and revitalization of villages.

2.4. Research Methods

2.4.1. Independent Samples t-Test

The Independent Samples t-test is a statistical method used to compare differences between two independent samples. In this study, by comparing the t-value and p-value of the density of historical and cultural famous villages on the two sides of the Hu Huanyong Line and the Bole–Taipei Line, respectively, we can determine whether there are significant differences between the two groups.
t = X 1 ¯ X 2 ¯ S 1 2 n 1 + S 2 2 n 2
In Equation (1), X 1 ¯ and X 2 ¯ represent the means of the two samples, respectively; S 1 2 and S 2 2 denote the variances of the two samples, respectively; n 1 and n 2 are the sample sizes of the two samples, respectively. When p < 0.05, it indicates a significant difference between the two groups. A larger t-value suggests that the difference in means between the two samples is relatively large compared to the within-sample variation, making it more likely that a significant difference exists; conversely, if the t-value is small, the difference is not significant.

2.4.2. Nearest Neighbor Index

After understanding the density differences in villages in different regions (on the two sides of the Hu Huanyong Line and the Bole–Taipei Line), we further explore their spatial distribution patterns. This study employs the nearest neighbor index to analyze the degree of mutual proximity among villages [34]. The calculation formula is expressed as follows:
R = r ¯ / r j
r j = 1 / 2 n / A = 1 / 2 D
In Equations (2) and (3), R represents the nearest neighbor index, r ¯ is the actual nearest neighbor distance value, r j is the theoretical nearest neighbor distance value, n is the number of historical and cultural villages, A is the regional area, and D is the point density. If R = 1 , r ¯ = r j , the historical and cultural villages are distributed on a random basis. If R < 1 , r ¯ < r j , historical and cultural villages tend to be distributed in an clustered manner; If R > 1 , r ¯ > r j , historical and cultural villages tend to be evenly distributed.
To more precisely determine whether this spatial distribution pattern significantly deviates from a random distribution, we can utilize the Z-score for analysis. The calculation formula is expressed as follows:
Z = d i ¯ E d var d i ¯ E d
In Equation (4), i represents the i-th villages; the d value denotes a specific measured value, and its significance can be assessed using the Z-score. The Z-score is calculated based on the d value and the average nearest neighbor distance E(d). If the Z-score is greater than 1.96 or less than −1.96, the observed d value exhibits a significant difference, indicating a notable deviation from the expectation. Conversely, when the Z-score falls within the range of −1.96 to 1.96, the observed d value shows little difference from the expectation, and thus, no significant difference is considered to exist. Additionally, in ArcGIS, the “Average Nearest Neighbor” tool simultaneously outputs both the Z-score and the p-value. A smaller p-value indicates a higher degree of clustering among villages. Conversely, when the p-value approaches 1, the villages exhibit characteristics of random distribution.

2.4.3. Moran’s I Analysis

To further investigate the spatial autocorrelation of the distribution of villages and verify the significance of their clustering patterns, this study employs global Moran’s I to measure the spatial distribution of these villages. This method effectively validates the extent to which regions with spatial proximity influence their neighboring areas [35].
I = n i = 1 n j = 1 n w i j y i y ¯ i = 1 n j = 1 n w i j i = 1 n y i y ¯ 2
In Equation (5), I represents the global Moran’s I. y i and y j are the variable values for units i and j , respectively. n is the total number of units, y ¯ is the average variable value across the entire region, and W i j is the spatial weight matrix. The value of I ranges from −1 to 1. A positive spatial correlation exists when I > 0, a negative spatial correlation exists when I < 0, and there is no spatial autocorrelation when I = 0.

2.4.4. Kernel Density Analysis

To visually illustrate the specific locations, distribution patterns, and density variation trends of spatial clustering of villages, this study employs kernel density analysis to assess the dispersed or clustered characteristics of their spatial distribution [36]. The calculation formula is as follows:
f ( x ) = 1 n h i = 1 n k x x i h
In Equation (6), x x i h is the kernel function, and h is the bandwidth; x x i is the distance from the village x to the measurement point village x i The higher the nuclear density value, the greater the distribution density of villages. Conversely, the lower the nuclear density value, the smaller the distribution density of villages.

2.4.5. Standard Deviational Ellipse

To demonstrate the directional tendency, centrality, and evolutionary trends in the overall distribution of villages, this study adopts the standard deviational ellipse (SDE) analysis method. This approach can effectively depict the directional patterns in the distribution of spatial elements across regions [37]. By applying the SDE, the orientation of historic and cultural village distributions can be identified. The mean center of the villages is taken as the ellipse centroid, while the axes are determined by calculating the standard deviations of the spatial coordinates of the points. This method is employed to reveal the degree of directional deviation in the spatial distribution of villages. The calculation formula is as follows:
tan θ = i = 1 n x i ˜ 2 i = 1 n y i ˜ 2 + i = 1 n x i ˜ 2 i = 1 n y i ˜ 2 2 + 4 i = 1 n x i ˜ y i ˜ 2 2 i = 1 n x i ˜ y i ˜ σ x = 2 i = 1 n x i ˜ cos θ y i ˜ sin θ 2 n ; σ x = 2 i = 1 n x i ˜ cos θ y i ˜ sin θ 2 n
In Equation (7), x i and y i respectively represent the central coordinates of each spatial unit within the study area; θ is the Angle of the ellipse; x i ˜ and y i ˜ respectively represent the coordinate deviations from the central coordinates of each spatial unit to the regional central coordinates. σ x and σ y respectively represent the standard deviations of the ellipse along the x and y axes.

2.4.6. Selection of Influencing Factors and Indicator System Construction

The spatial distribution of villages is shaped by multiple interacting factors, including natural geography, socioeconomic conditions, transportation accessibility, tourist markets, and tourism resources, each exerting influence at different stages of village evolution. Natural geographic conditions play a foundational role in the initial siting of villages, with relatively flat terrain, moderate elevation, and proximity to rivers representing preferred locations [38]. Socioeconomic development and transportation infrastructure provide essential support for village growth and long-term survival; economically prosperous regions offer financial resources, while adequate transportation networks facilitate external connectivity, reducing the risk of village decline [39,40,41]. The presence of a viable tourist market further guides development by shaping demand for cultural heritage [42], while tourism resources serve as a structural and functional anchor, influencing village typology [43]. Together, these five dimensions interact to shape the spatial patterns of villages across China.
Guided by the principles of scientific rigor, comprehensiveness, and data availability, and drawing on previous studies, this research selects kernel density of villages as the dependent variable. A total of 21 indicators across the five dimensions of natural geography, socioeconomic conditions, transportation accessibility, tourist markets, and tourism resources are defined as independent variables, forming a comprehensive indicator system to analyze the determinants of village spatial distribution (Table 2).

2.4.7. Geographic Detector

The geographical detector is a statistical method used to analyze the spatial differentiation characteristics of geographical phenomena and their driving factors. This model measures the explanatory power of different factors on the distribution of villages by calculating the q-value. In this study, the “Create Fishnet” tool in ArcGIS 10.8 was applied to divide the territory of China into uniform grid cells of 50 km × 50 km. The number of villages within each cell, together with the values of associated geographic factors, was extracted to establish a database for analyzing the determinants of their spatial distribution [44]. The kernel density value of villages was selected as the dependent variable to explore the mechanisms shaping their spatial distribution. The calculation formula is expressed as follows:
q = N σ 2 h = 1 L N h σ h 2 / N σ 2
In Equation (8), q ( 0 q 1 ) represents the detection value that indicates the degree to which a specific metric influences the density of historical and cultural village. A value of q approaching 1 signifies a higher explanatory power of the metric concerning the spatial distribution characteristics of these districts, while a value nearer to 0 suggests a diminished explanatory capacity. L denotes the number of classifications for the h category of influencing factors, whereas N h and N represent the counts of units for the h category and the corresponding density values of historical and cultural village, respectively. Additionally, σ h 2 and σ 2 reflect the variances associated with the h category of influencing factors and the density values of historical and cultural village.

3. Results Analysis

3.1. Spatiotemporal Evolution of Historic and Cultural Villages

3.1.1. Spatial Distribution Characteristics

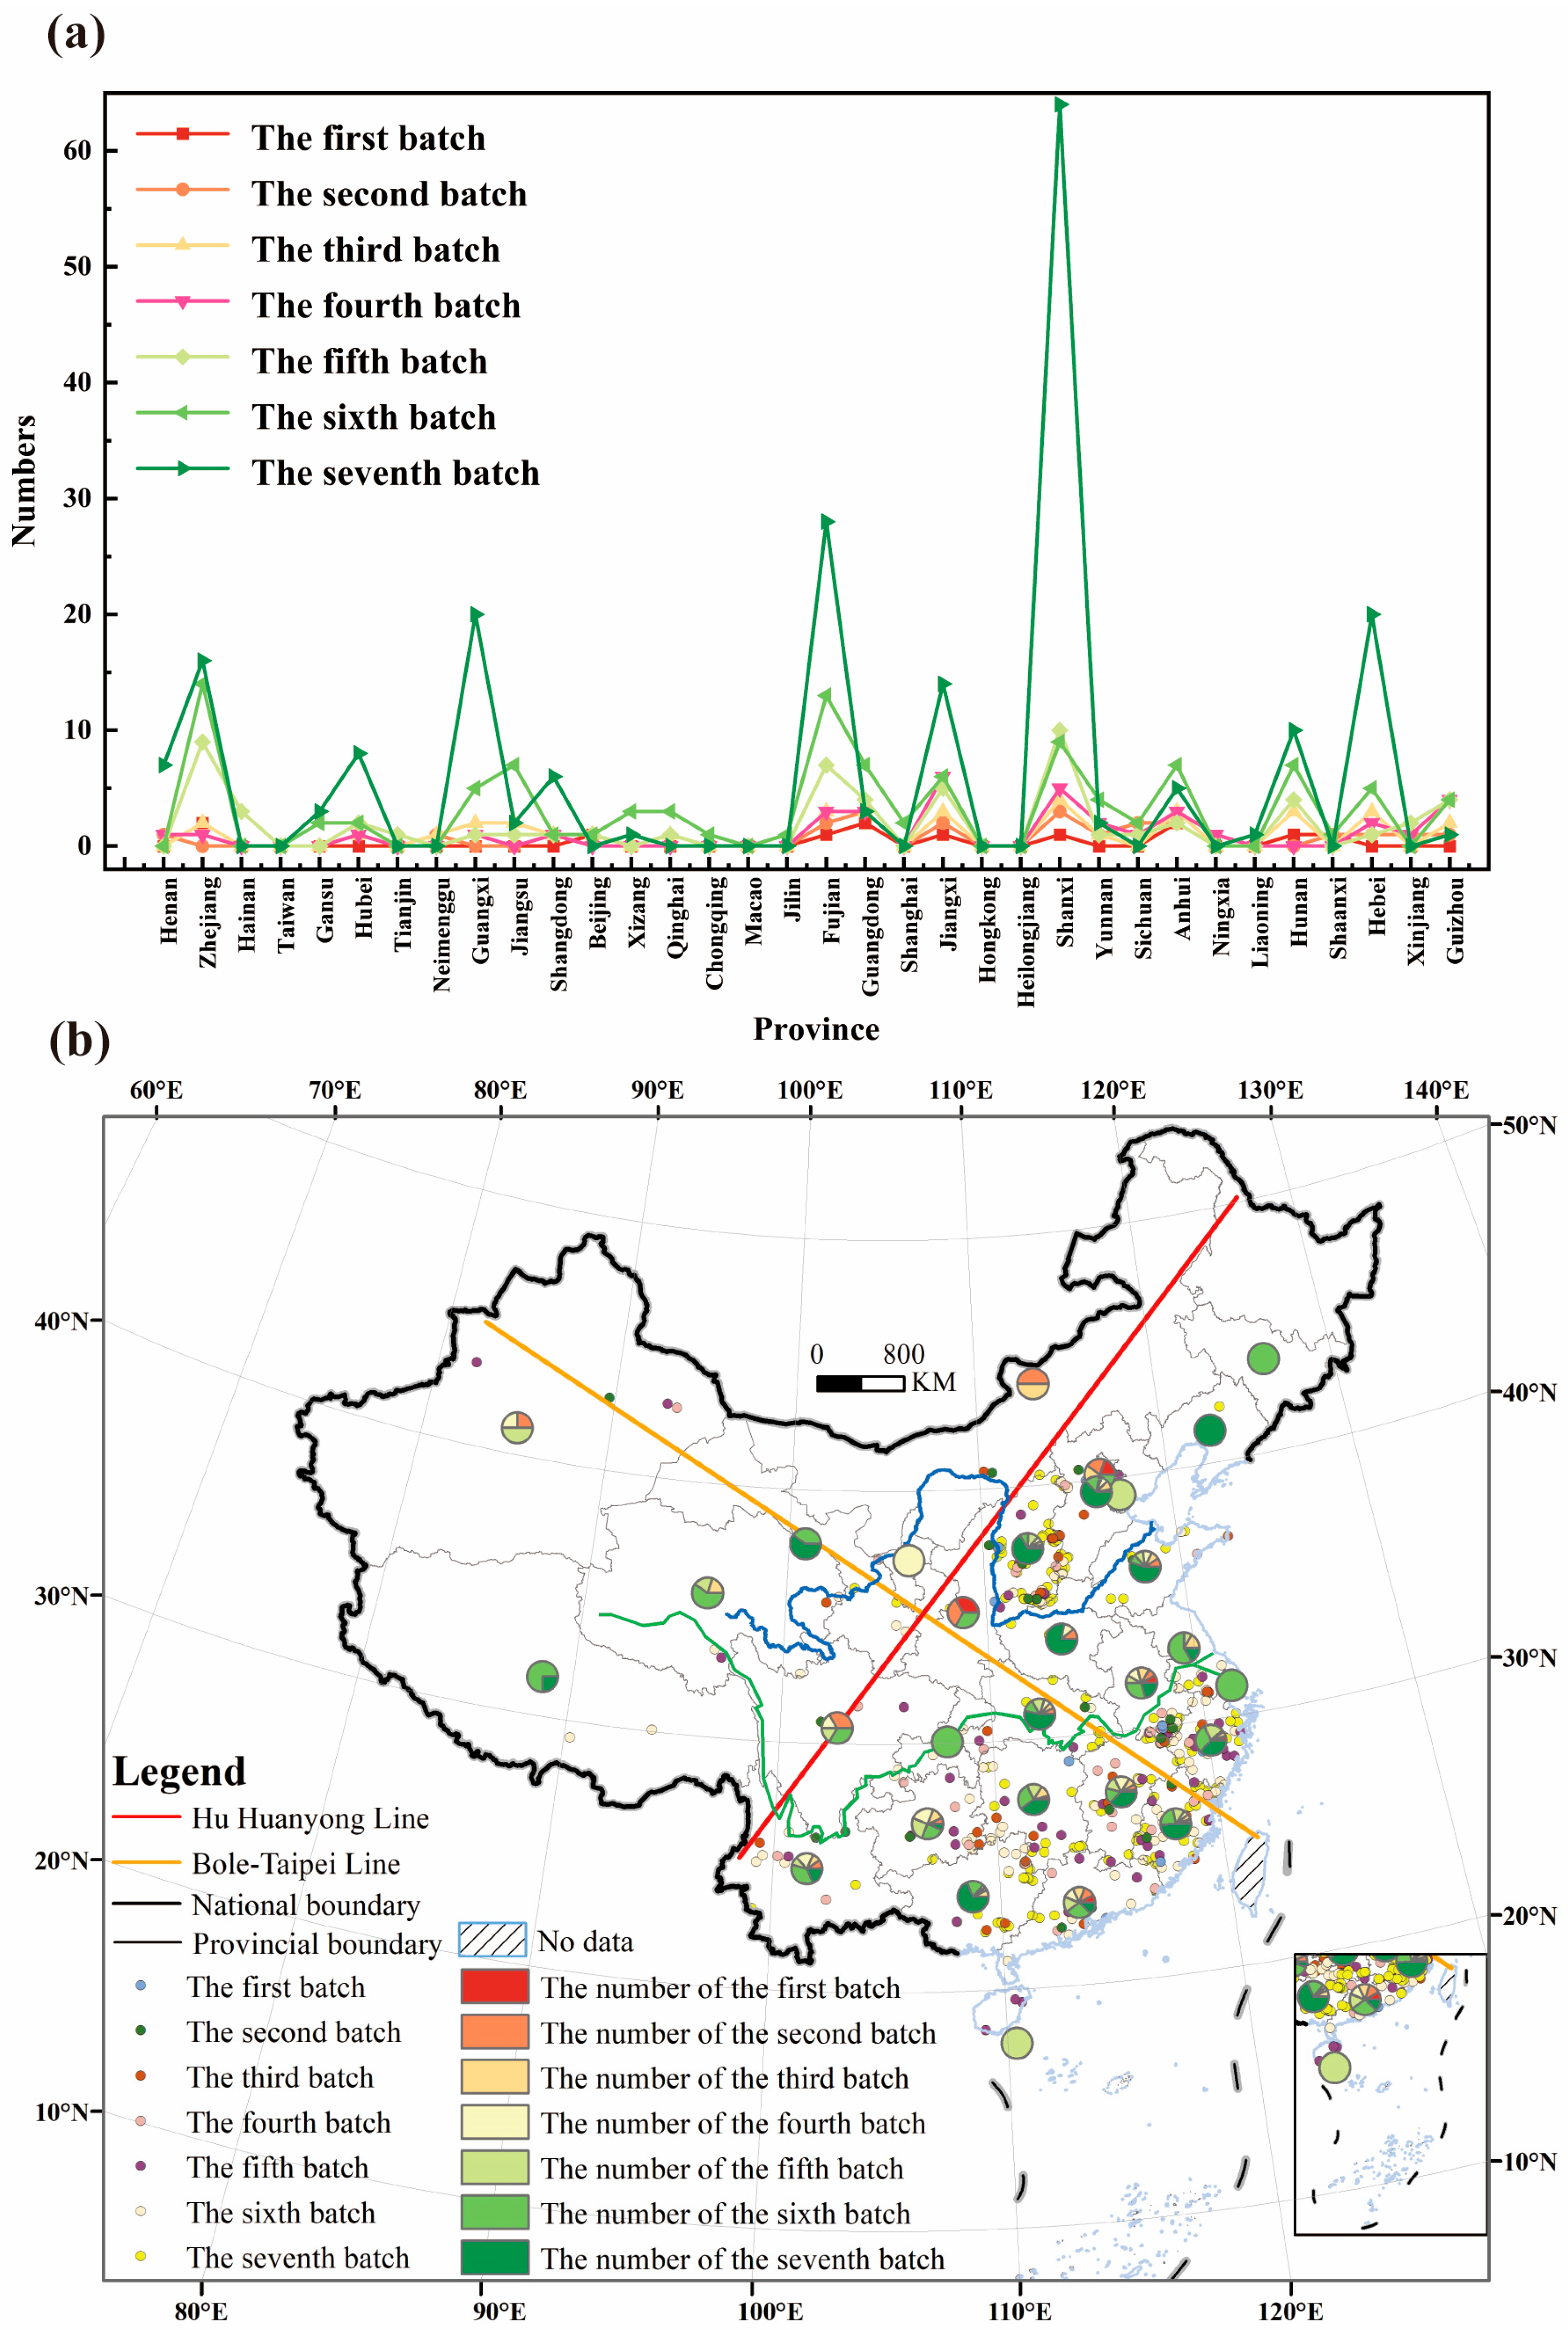
Taking the Hu Huanyong Line and the Bole–Taipei Line as spatial references, the overall distribution of villages in China exhibits a distinct pattern characterized by “dense in the southeast, sparse in the northwest; dense in the northeast, sparse in the southwest” (Figure 3). Specifically, the southeast and northwest regions relative to the Hu Huanyong Line account for 96.10% and 3.90% of the total number of villages, respectively, indicating a markedly higher concentration in the southeast, which closely corresponds to regional patterns of population density and economic development. Analysis along the Bole–Taipei Line further shows that the northeastern half of the country (57.70%) demonstrates a clear dominance over the southwestern half (42.30%) in terms of village quantity, reflecting significant regional disparities.
The independent-sample t-test results reveal that the density of villages (per 10,000 km2) differs significantly between the southeastern and northwestern regions of the Hu Huanyong Line (t = 4.814, p < 0.01). Likewise, significant disparities are observed between the northeastern and southwestern regions along the Bole–Taipei Line (t = 3.636, p < 0.01) (Table 3). Importantly, the magnitude of the density difference across the Hu Huanyong Line (t = 4.814) exceeds that observed across the Bole–Taipei Line (t = 3.636), indicating a more pronounced influence of the Hu Huanyong Line on the spatial distribution patterns of villages.

3.1.2. Spatial Clustering Characteristics

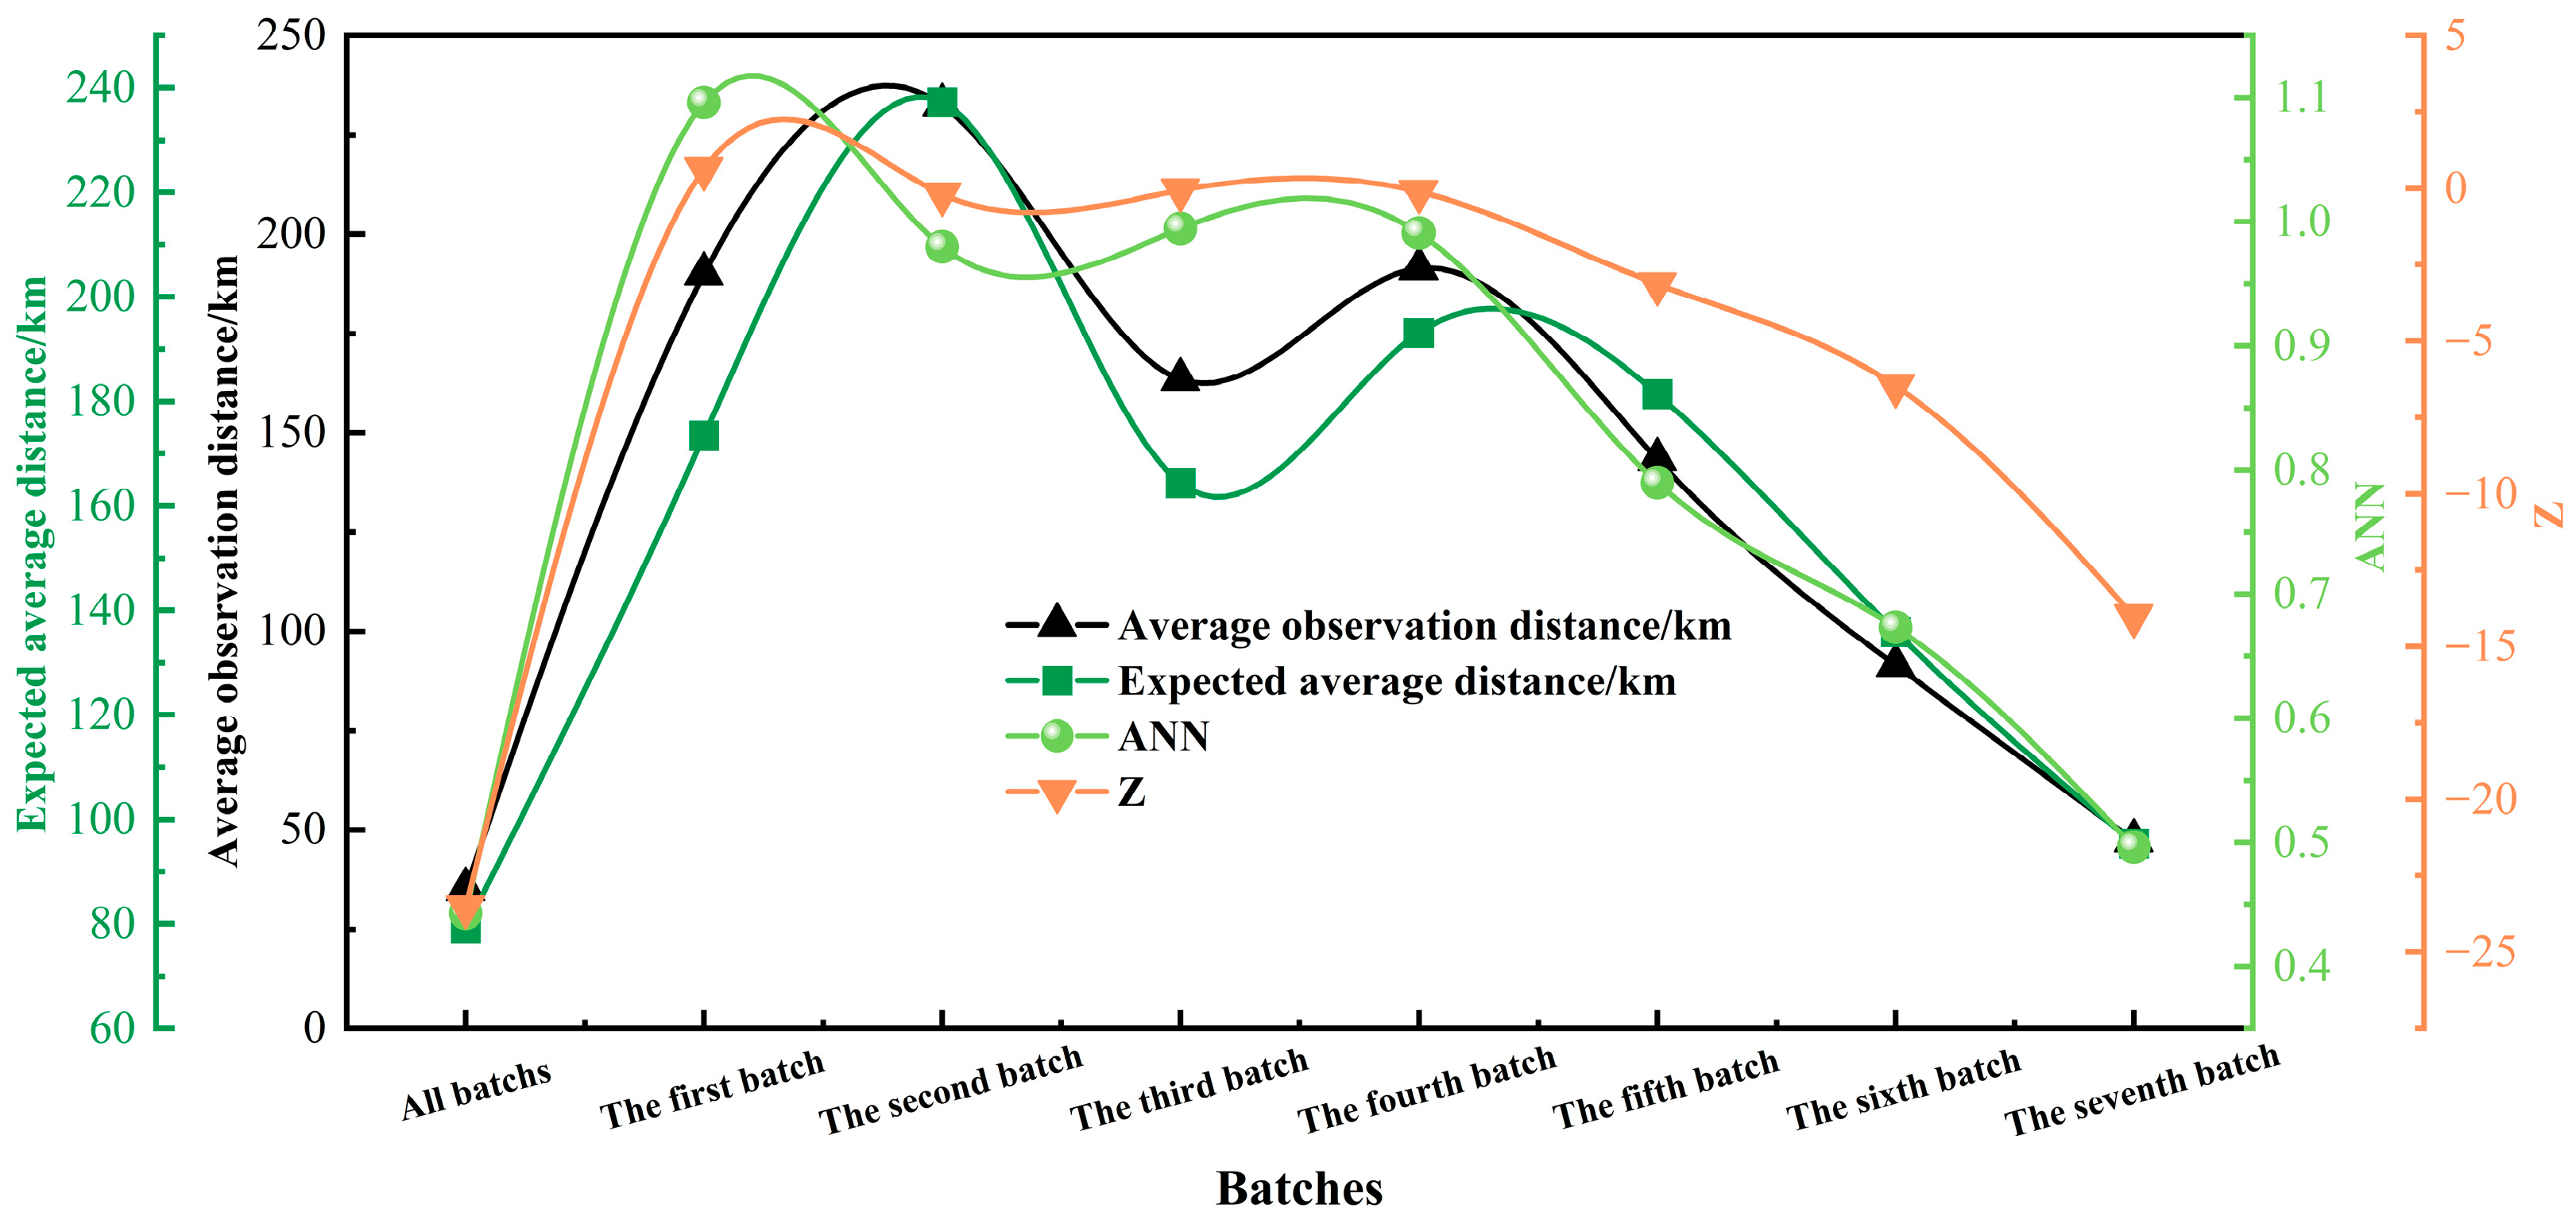
Chinese villages demonstrate a clear pattern of spatial clustering at the national scale (NNI = 0.44, Z = −23.52, p = 0.00) (Figure 4). Examining the data by batch, the first batch exhibits an almost random spatial distribution (NNI = 1.10, Z = 0.64, p = 0.53), whereas the second to fourth batches show no significant clustering tendency (NNI < 1, Z ≈ 0, p > 0.85). By contrast, the fifth to seventh batches reveal a progressively stronger clustering pattern, with NNI values declining to 0.79, 0.67, and 0.50, accompanied by increasingly negative Z scores (−3.14, −6.47, −14.00) and p values of 0.00, reflecting a pronounced intensification of spatial aggregation over time.
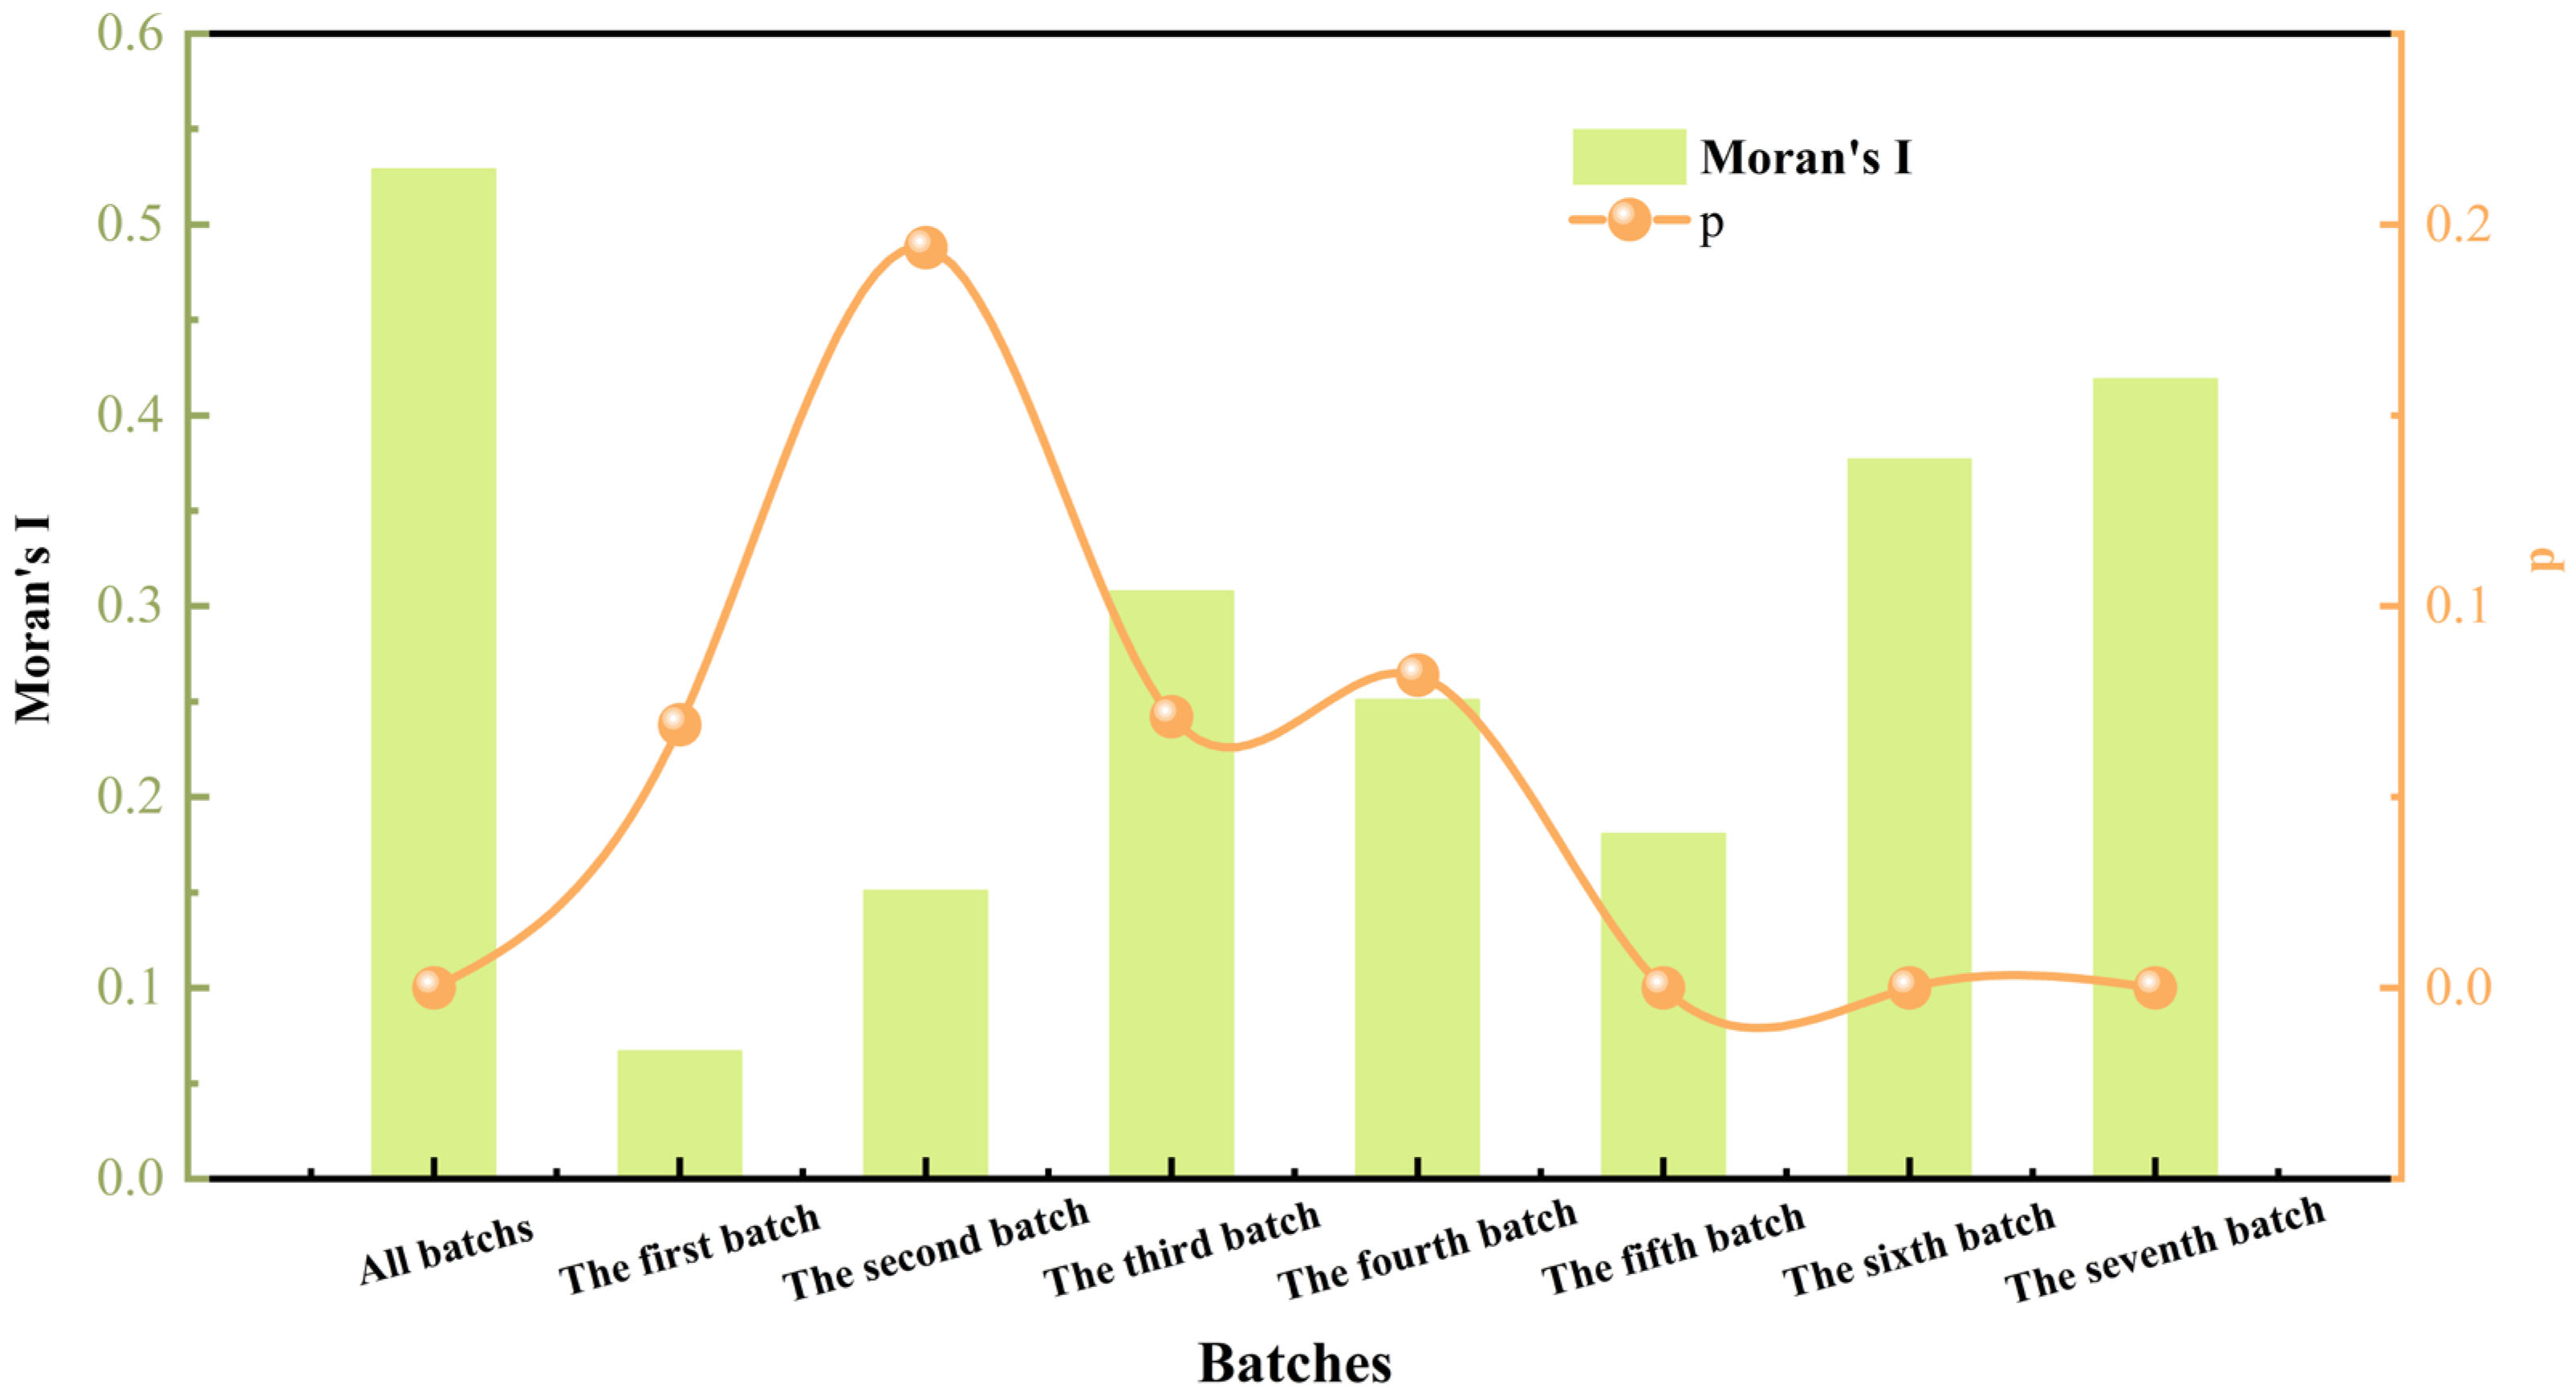
Building on this, Moran’s I was employed to further assess the spatial dependence and heterogeneity of geographically proximate villages. At the national scale, villages exhibit a strong positive spatial autocorrelation, which is highly significant (Moran’s I = 0.529, p < 0.001) (Figure 5). Examining by batch, the first batch shows a low Moran’s I (0.067) with a non-significant p value (p > 0.05), indicating an almost random spatial distribution. The second to fourth batches display a clustering tendency, but they do not reach statistical significance (Moran’s I > 0.15, p > 0.07). In contrast, the fifth to seventh batches demonstrate increasing spatial autocorrelation, with Moran’s I rising to 0.181, 0.377, and 0.419, all with p = 0.00, reflecting a progressively stronger pattern of significant spatial clustering. The observed trend in spatial clustering of villages directly reflects the evolution of China’s heritage conservation policy from a “point-based” to a “zone-based” approach. In the selection of the seventh batch, the introduction of stricter quantitative thresholds for the scale and integrity of historic buildings notably favored regions with concentrated traditional architecture, such as the southwest. Simultaneously, dynamic regulatory mechanisms restricting construction-related damage further enabled areas with better resource and management foundations to accumulate advantages over time. The synergistic effects of policy orientation, selection criteria, and regulatory oversight collectively promoted the clustered spatial distribution of villages.
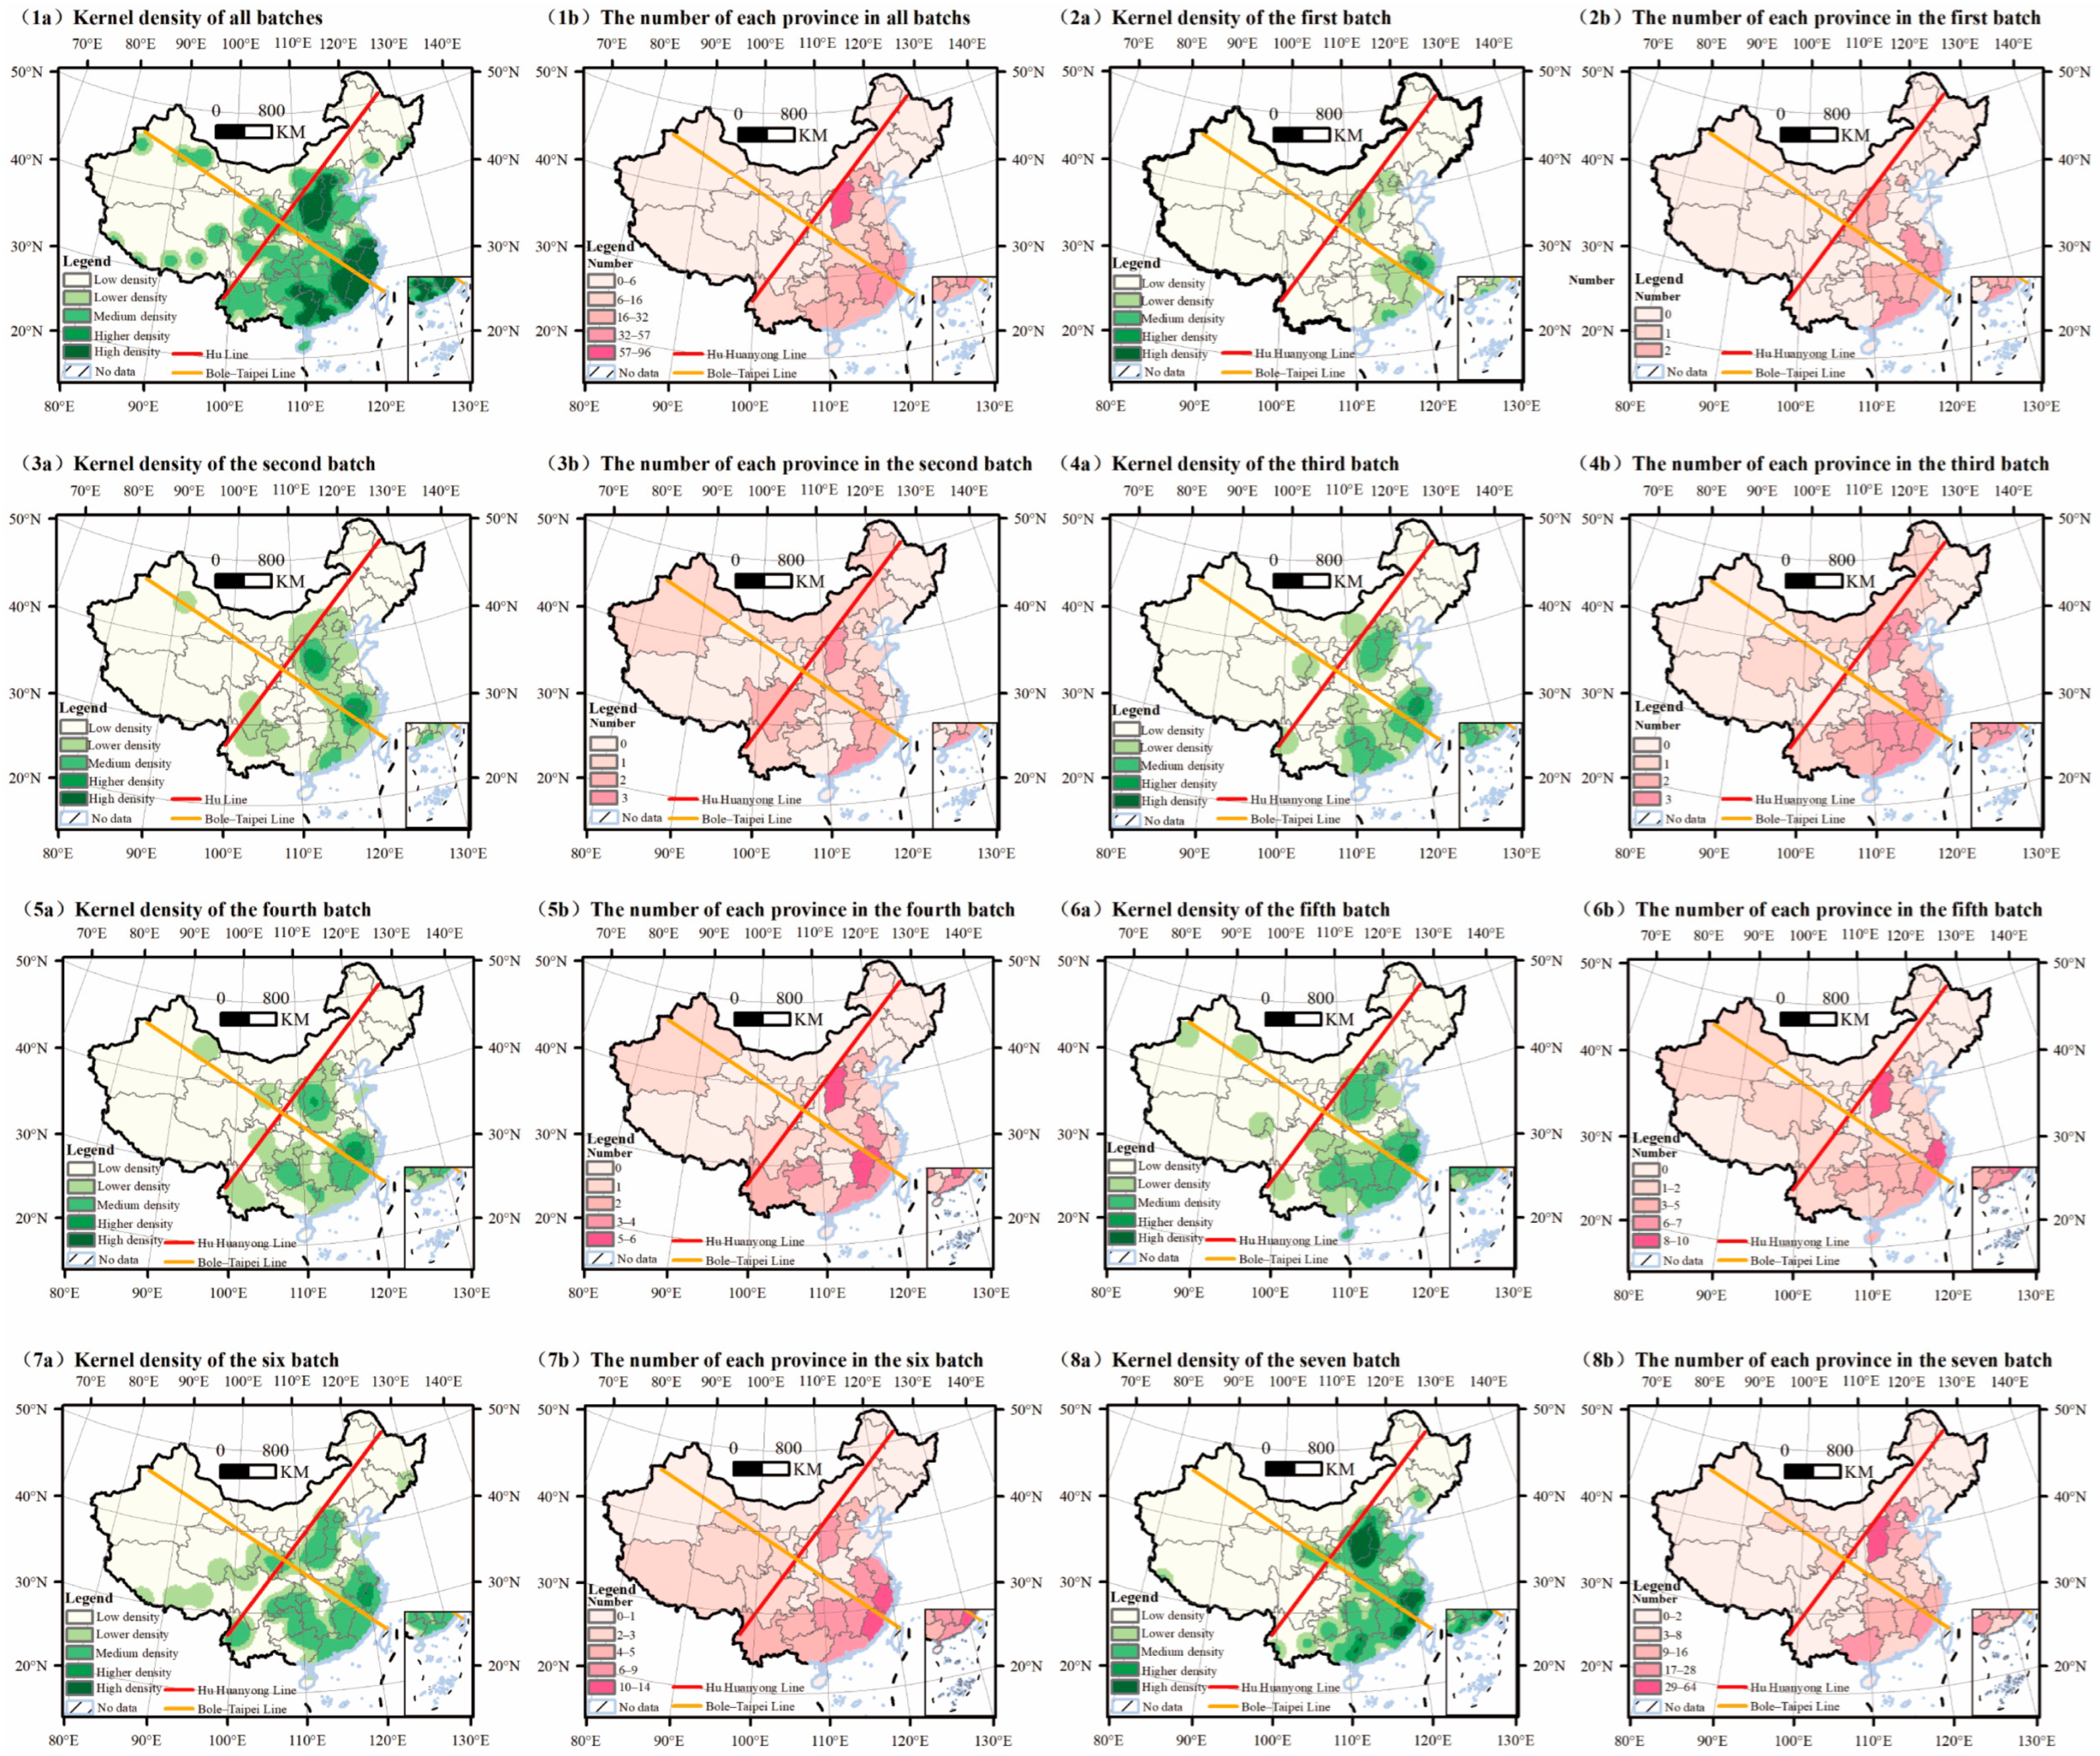
China’s villages form multiple high-density core regions nationwide, with a maximum kernel density of approximately 0.11 × 10⁻². These core areas are primarily concentrated in historically and culturally rich zones, including the Yangtze River Delta, southern Anhui, the Fujian–Zhejiang–Jiangxi junction, and along the Yellow River in Shanxi, Shaanxi, and Henan (Figure 6(1a)). At the provincial level, Anhui, Zhejiang, and Shanxi exhibit the largest number of villages (Figure 6(1b)).
Batch-level analysis reveals that the first batch of villages displays a multi-centered and dispersed kernel density pattern, with high-density regions (0.36 × 10⁻⁴) distributed across North China, Jiangnan, and Southwest China. In terms of quantity, Jiangsu and Sichuan each host two villages, ranking highest, although differences among provinces remain limited (Figure 6(2a,2b)). For the second (0.18 × 10⁻⁴) through fourth batches (0.45 × 10⁻⁴), high-density areas gradually contract toward the middle and lower Yangtze River, with Anhui and Zhejiang provinces increasing their proportional share of villages (Figure 6(3a–5b)). The fifth through seventh batches demonstrate further concentration, with high-density areas focusing on southern Anhui–western Zhejiang and central Shanxi, accounting for 42% and 28% of the seventh batch, respectively. The peak kernel density of the sixth batch (0.17 × 10⁻³) represents a 2.12-fold increase relative to the fifth batch (0.79 × 10⁻⁴), and the seventh batch (0.63 × 10⁻³) further increases 3.80-fold relative to the sixth batch, confirming the NNI results that indicate a substantial intensification of spatial clustering from the fifth to seventh batches (Figure 6(6a–8b)).

3.1.3. Centroid Migration Trajectory

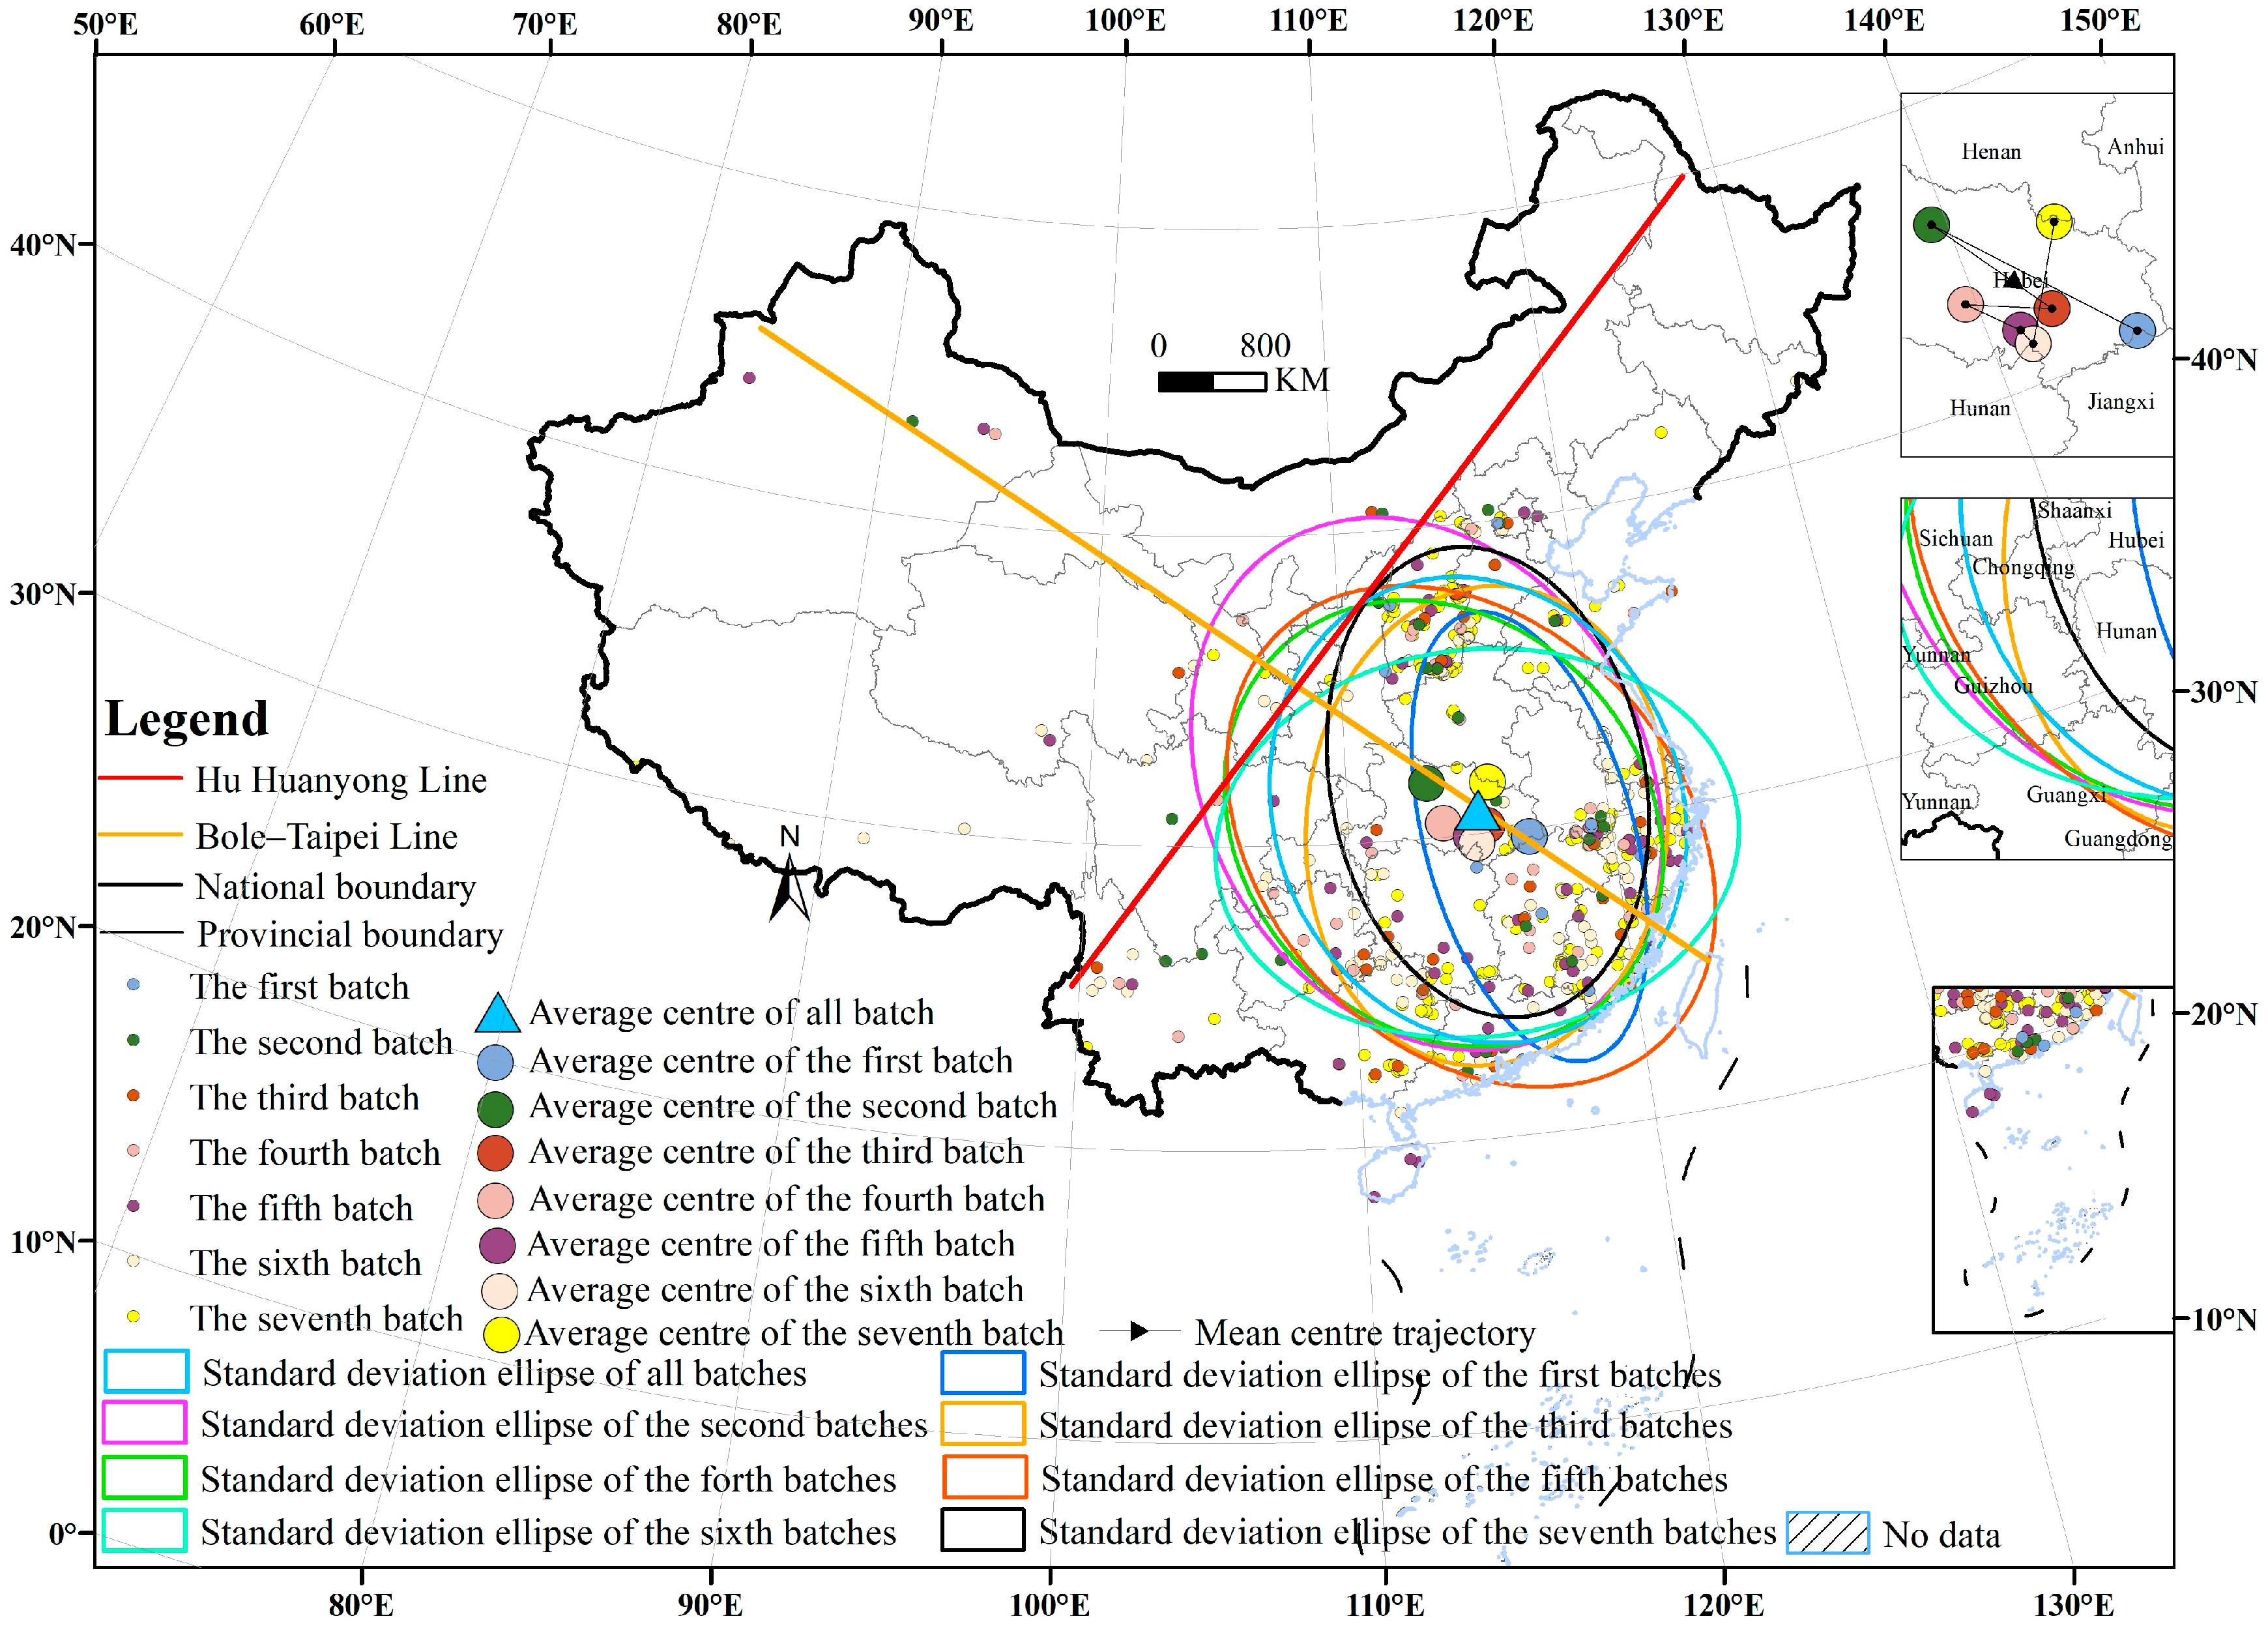
The primary spatial axis of China’s villages aligns along a “southeast–northwest” orientation (Figure 7). Across all seven batches, the centroids of these villages consistently concentrate within Hubei Province (100°47′05″ E–63°23′18″ E, 31°51′08″ N–34°04′25″ N), with the overall spatial range progressively contracting over time (Table 4). Analysis of the ellipse axes indicates that the first batch exhibits the largest coverage (minor axis: 1007.85 km; major axis: 3208.91 km), reflecting the spatially dispersed nature of early village selection. From the second to fourth batches, the minor axis diminishes from 794.01 km to 732.43 km, signifying a reduction in spatial extent. In the fifth to seventh batches, the minor axis further decreases from 760.97 km to 571.82 km, demonstrating enhanced spatial clustering, while the widening gap between major and minor axes underscores a progressively stronger directional distribution. The centroid migration trajectory thus illustrates the evolution of conservation practice from a dispersed, localized approach toward a coordinated, regional, and ultimately national-level strategy. Regarding rotation angles, the first to third batches maintain an overall orientation of 158.21°. Specifically, early batches (first and second) show a decrease in rotation angle from 164.67° to 150.12°, maintaining a southeast–northwest axis. The mid-term third batch rotates sharply to 4.86°, aligning nearly along a true north–south axis. For the late batches (fourth to seventh), rotation angles gradually increase from 138.28° to 169.07°, indicating a shift toward an east–west orientation in the fourth to sixth batches, with the sixth batch approaching a due west–east alignment. The seventh batch exhibits a return to the pronounced southeast–northwest orientation, reflecting the dynamic evolution of the spatial distribution axis over time.

3.2. Factors Influencing the Spatial Distribution of Historic and Cultural Villages

3.2.1. Physical Geography

(1)
Elevation
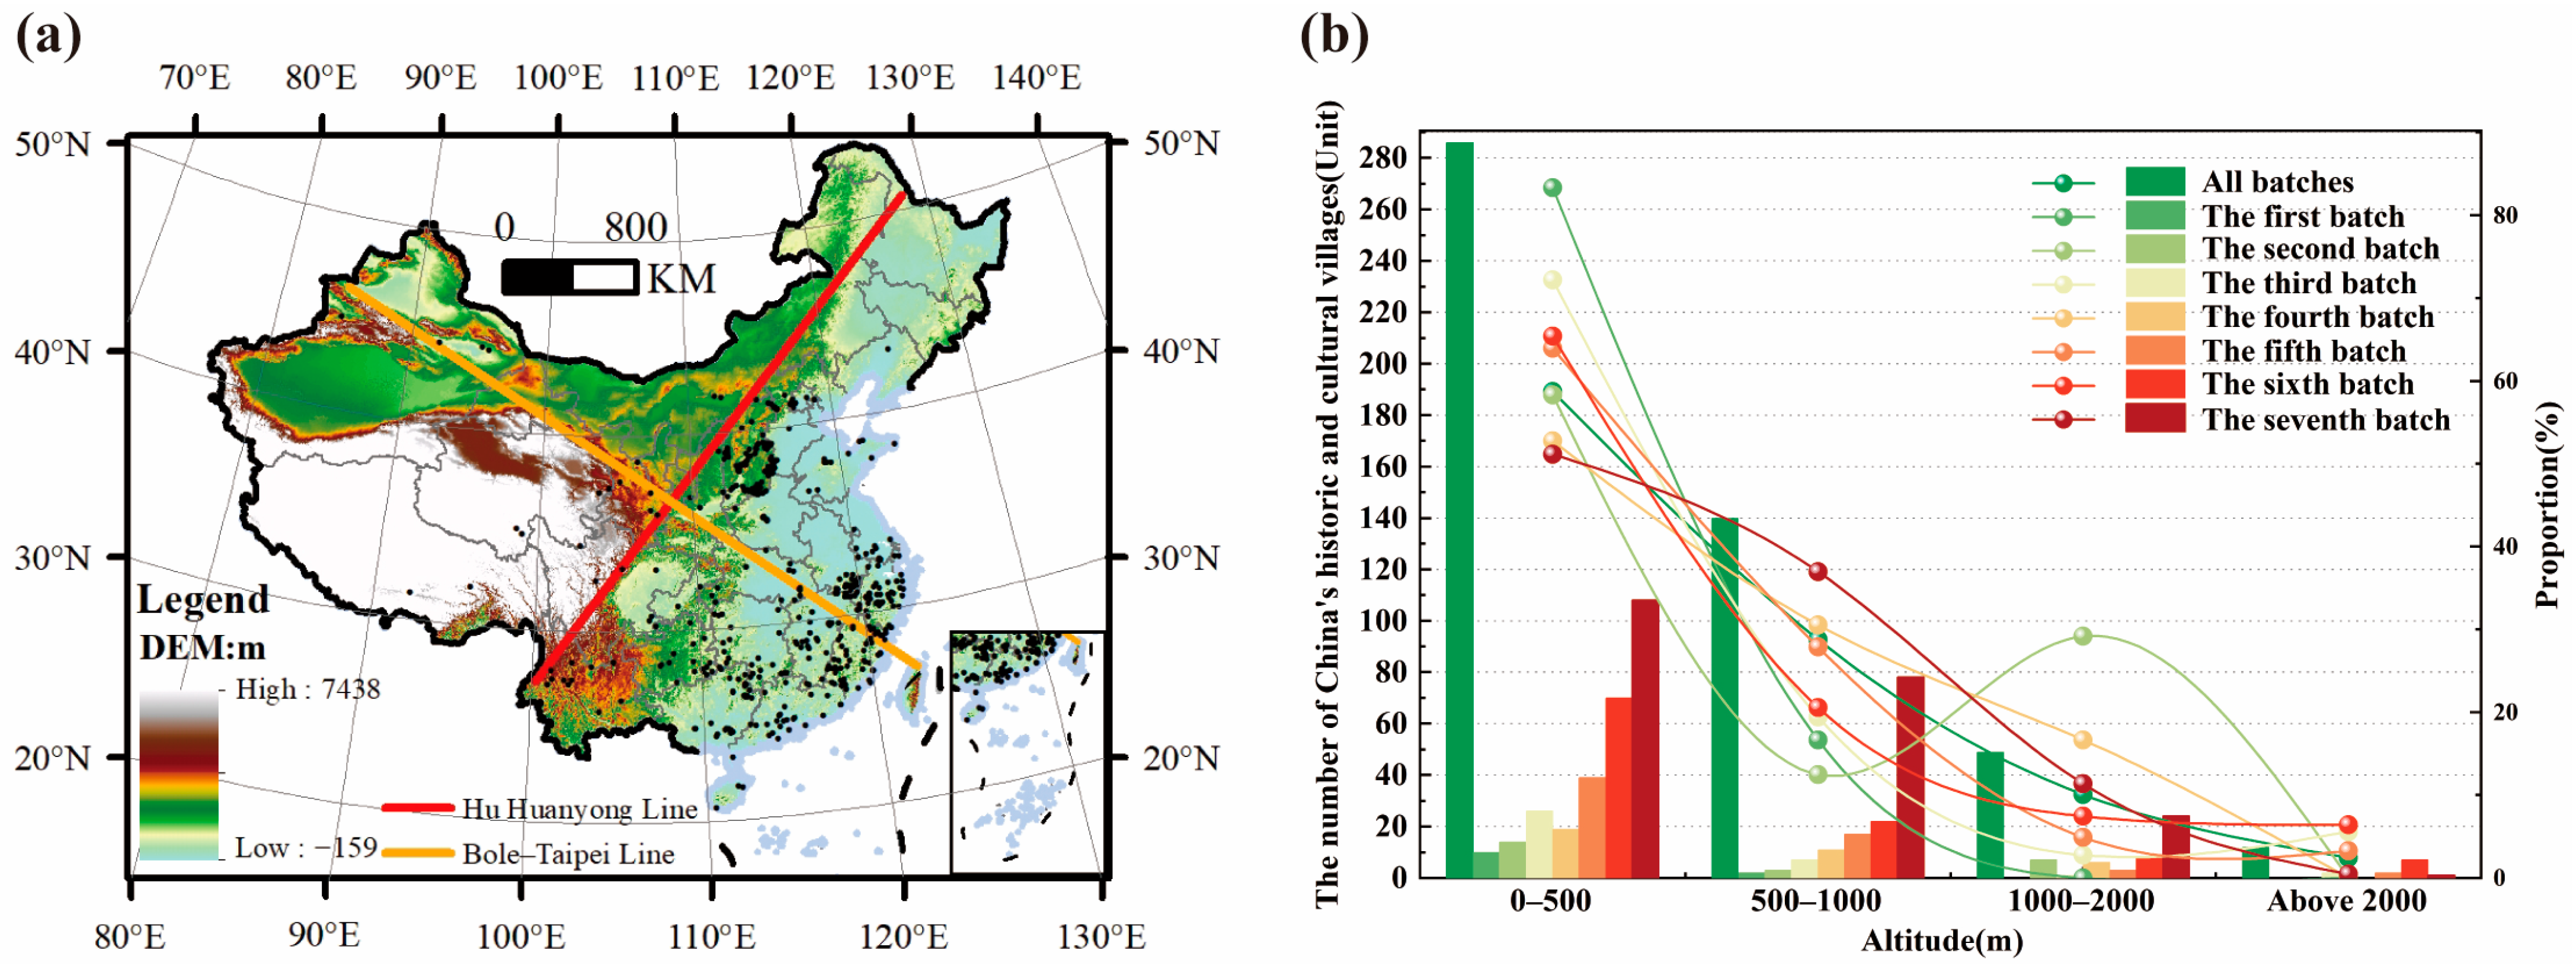
The elevation distribution of villages in China reflects the interplay between natural geographic conditions and human activities. Among the 487 villages analyzed, 58.73% (286 villages) are situated in lowland areas at 0–500 m, 28.75% (140 villages) occupy sub-low elevations of 500–1000 m, while mid-high (10.06%) and high-elevation zones (2.46%) account for a considerably smaller proportion, indicating a typical vertical differentiation pattern of “dense lowlands, sparse highlands” (Figure 8; Table 4). Low-elevation regions offer favorable conditions, including mild climate, contiguous croplands, and developed hydrological networks, which historically supported agricultural development.
Analyzed by batch, the first to third batches indicate that low-elevation regions constitute the core areas for China’s villages, with the second batch particularly concentrated within the 0–500 m elevation range, accounting for 83.33% of villages. In the fourth to sixth batches, village distribution progressively extends into mid- to high-elevation zones, with 6.4% (7 villages) of the sixth batch located above 2000 m. By the seventh batch, the proportion of villages situated at 1000–2000 m rises to 11.37% (24 villages). Notably, in the second batch, villages within the 1000–2000 m elevation band exhibit a substantial increase, representing 29.17% (7 villages). Collectively, the elevational distribution demonstrates a gradient pattern driven by environmental carrying capacity, highlighting the vertical stratification characteristic of China’s villages.
(2)
Slope and Aspect
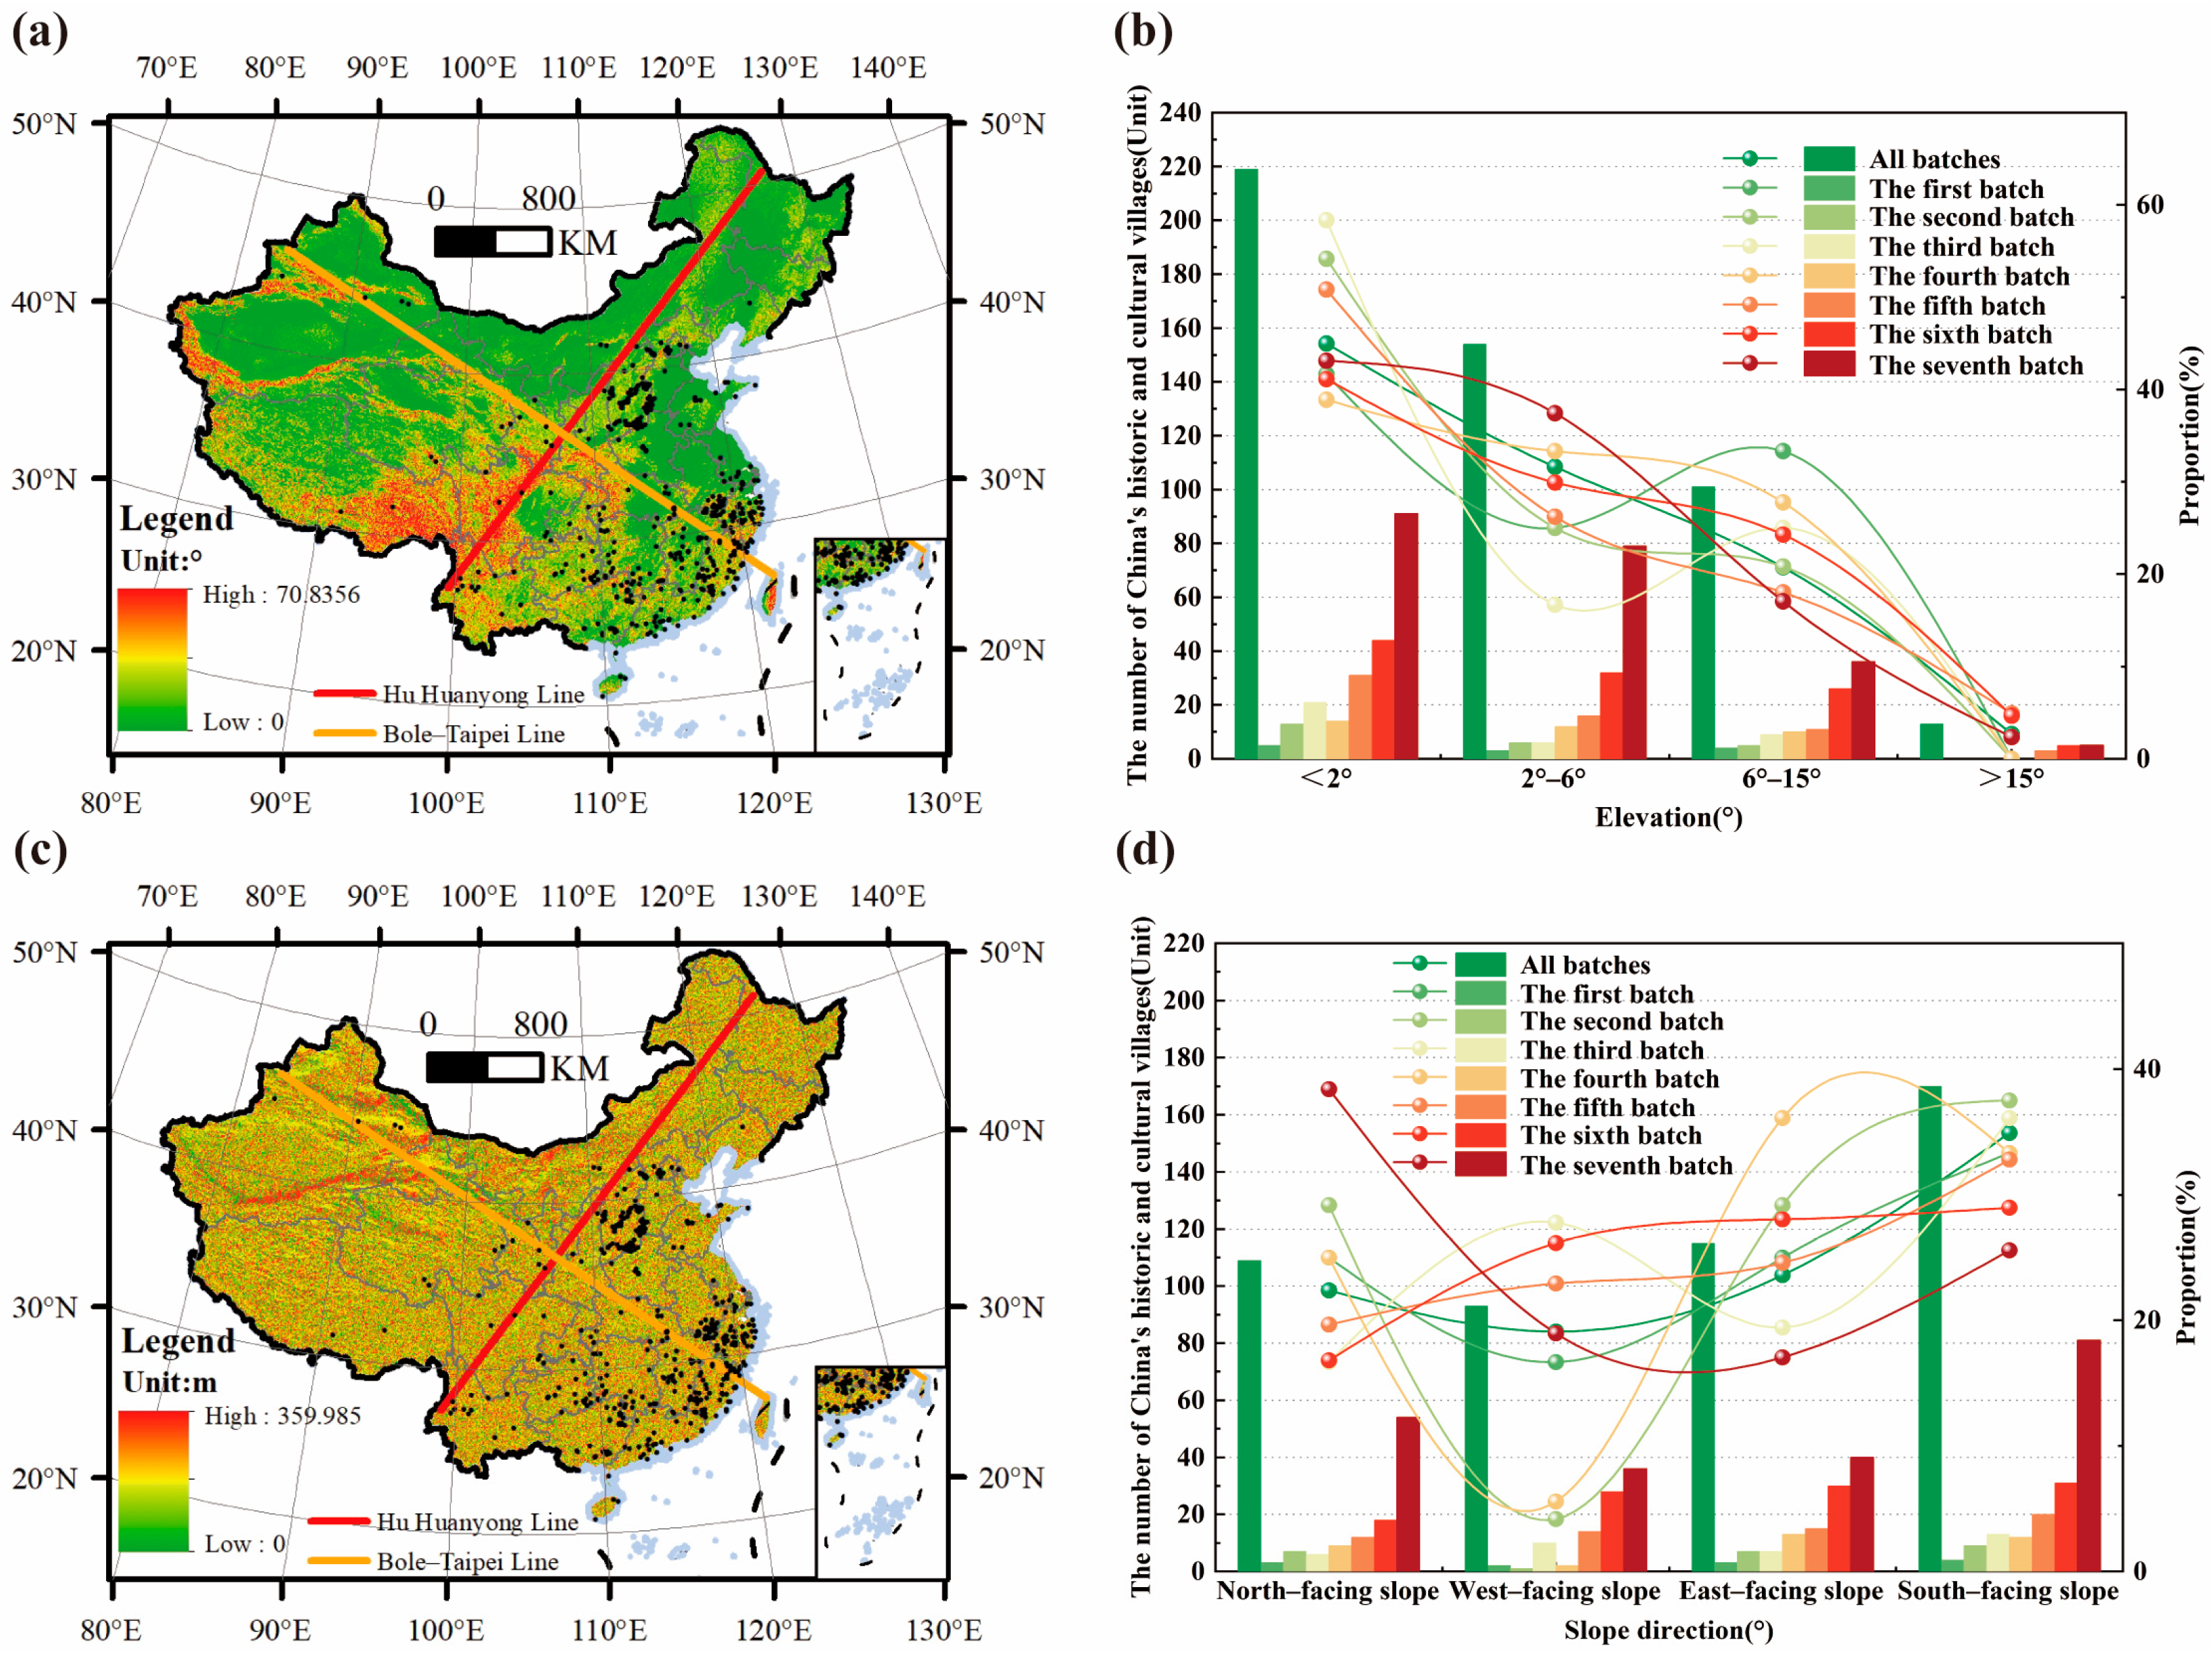
Slope reflects the terrain relief at the sites of China’s villages. Across all seven batches, most villages are concentrated in areas with slopes below 2° (Figure 9a,b). Slope directly influences the scale, intensity, and form of human activities, as well as the feasibility of village construction. Specifically, 219 villages (44.97%) are situated on plains, basins, or coastal lowlands with slopes <2°, 154 villages (31.62%) occupy gentle slopes of 2–6°, and 101 villages (20.73%) are located on moderate slopes of 6–15°. Overall, village density decreases as slope increases, indicating a clear negative relationship between slope steepness and settlement distribution.
Aspect indicates the directional orientation of the terrain. South-facing slopes host 170 villages (34.7%), substantially higher than east-facing (115, 23.5%), north-facing (109, 22.3%), and west-facing slopes (93, 19.0%) (Figure 9c,d). South-facing slopes exhibit the highest village concentration, reflecting the traditional “north–south orientation” principle. East-facing slopes rank second, likely optimizing morning sunlight while mitigating intense afternoon radiation. In contrast, north- and west-facing slopes are less favorable: north-facing slopes are colder and more humid during winter, hindering moisture protection and agricultural activity, whereas west-facing slopes receive strong afternoon sun in summer, increasing thermal stress and reducing habitability.
(3)
Temperature and Precipitation
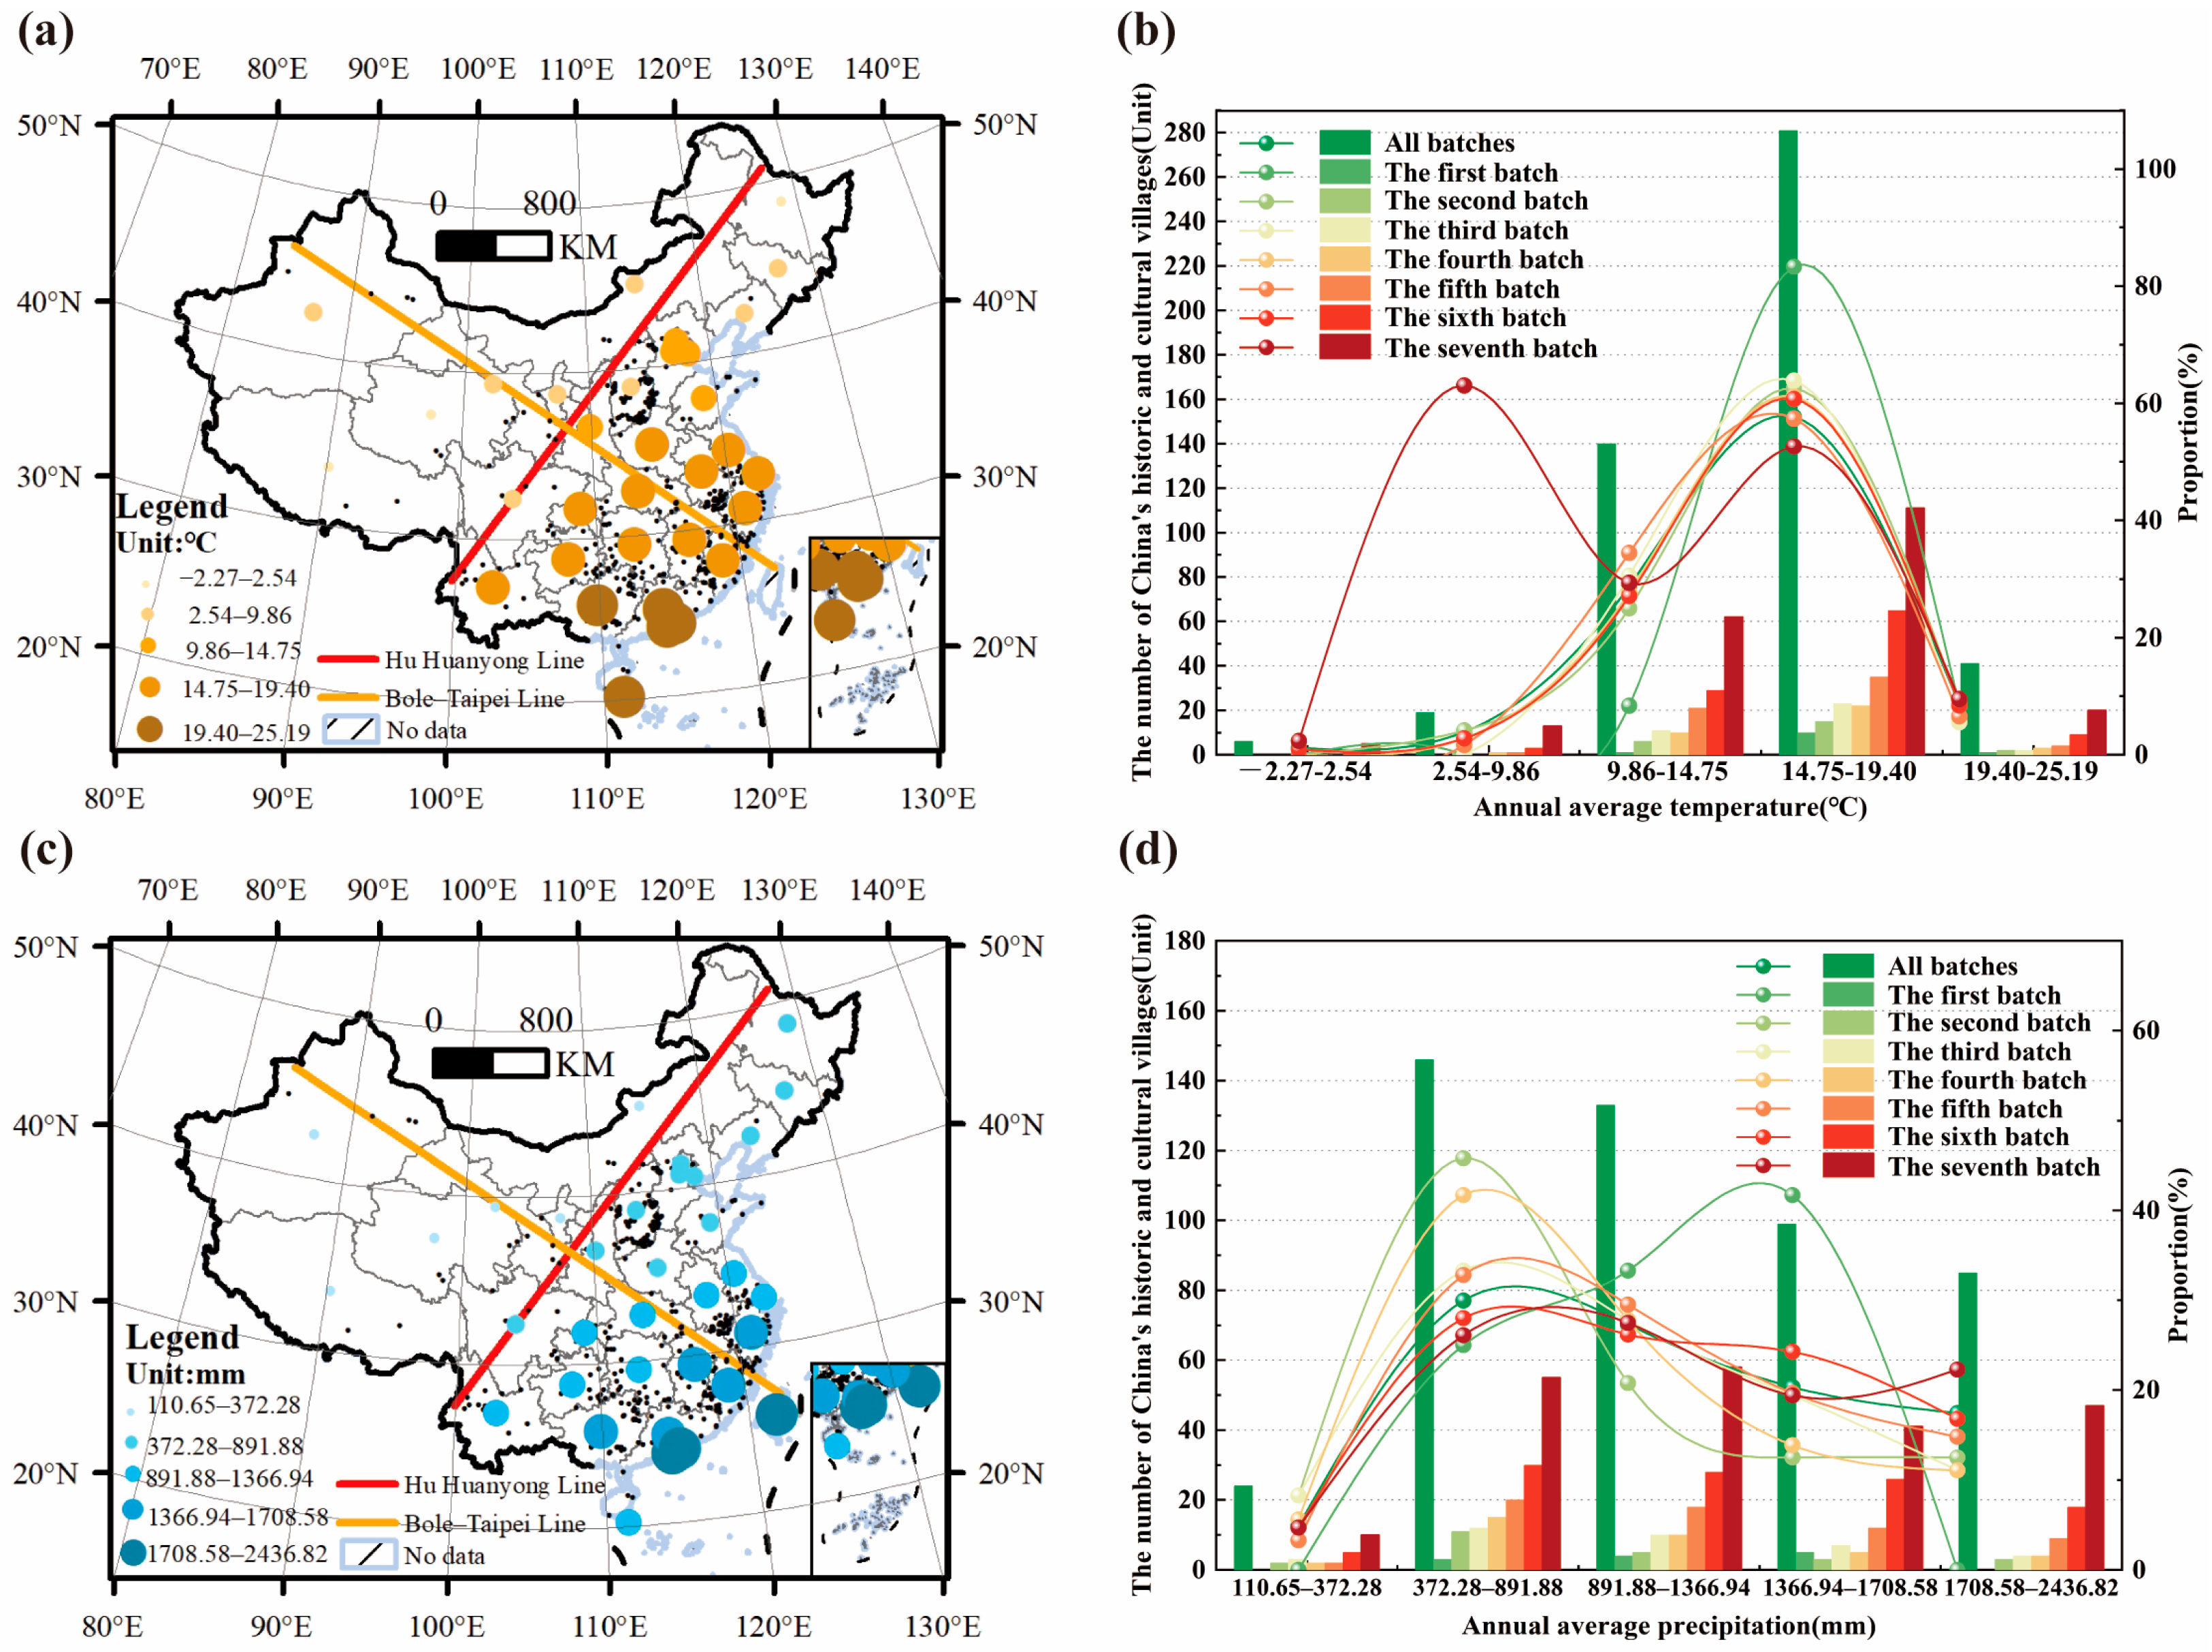
China exhibits a pronounced north–south gradient in annual mean temperature, ranging from −2.27 to 25.19 °C (Figure 10a,b). Among the 487 villages, 177 (36.35%) are located in regions with annual mean temperatures below 15 °C, 253 (51.95%) in the 15–20 °C range, 57 (11.70%) in the 20–25 °C range, and 24 (3.4%) in regions exceeding 25 °C. These results indicate that the majority of villages are concentrated in areas with moderate temperatures of approximately 17–20 °C.
The annual mean precipitation ranges from 189 to 1838 mm, with high-precipitation regions predominantly located in southeastern China (Figure 10c,d). A total of 256 villages (52.57%) are situated in regions receiving less than 1250 mm of precipitation annually, 36 villages (7.39%) in the 1250–1500 mm range, 167 villages (34.29%) in the 1500–1750 mm range, and 28 villages (5.75%) in areas exceeding 1750 mm. Overall, villages are mainly concentrated in areas with annual precipitation between 1500 and 1700 mm, highlighting the influence of moderate climatic conditions on village distribution.
(4)
River Systems
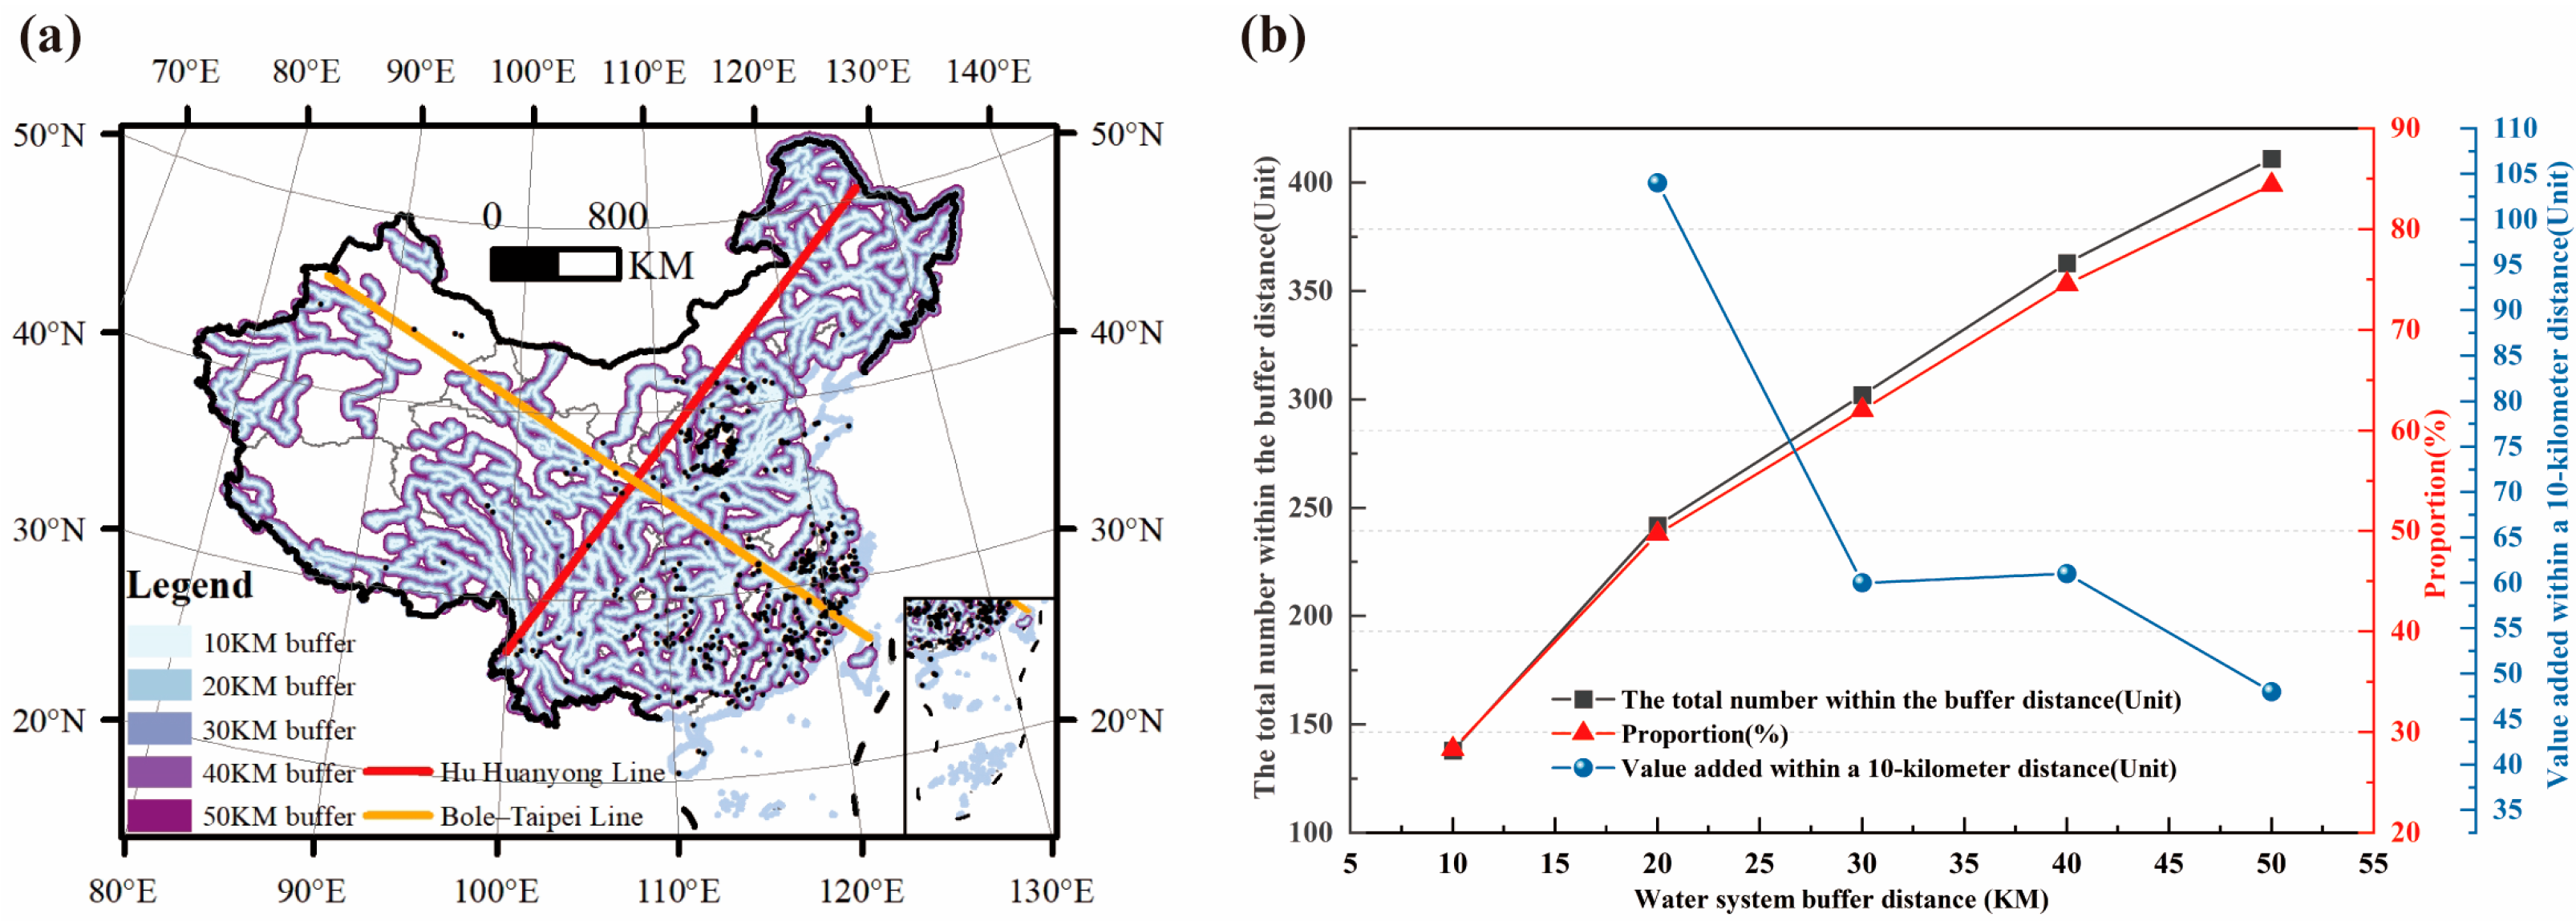
Studies from a historical-geographical perspective demonstrate that water accessibility exerts a significant influence on the formation and evolution of China’s villages. These villages exhibit a strong hydrophilic tendency, with spatial patterns showing an interwoven arrangement along rivers and lakes (Figure 11). Guided by historical-geographical theory, multiple buffer zones were established to assess the influence of proximity: a 10 km buffer corresponds to the effective daily activity radius of villagers in traditional agrarian societies, reflecting the typical range for high-frequency production and domestic activities, such as water collection and irrigation, in an era dominated by human and animal labor. A 20 km buffer represents the economic hinterland as defined by Shi Jianya’s market circle theory, capturing the role of rivers as transportation corridors in fostering trade settlements and cultural corridors [45]. Larger buffers (30–50 km) were used as reference zones to examine distance-decay effects and broader hydrophilic trends. Empirically, 138 villages (28.34%) are located within 10 km of rivers of level three or higher, while 104 villages (21.36%) are situated within the 10–20 km range. The number of villages progressively decreases with distance: 60 villages (12.32%) lie within 20–30 km, 61 villages (12.53%) within 30–40 km, and 48 villages (9.86%) within 40–50 km. Notably, 62.01% of villages are situated within 30 km of level-three or higher rivers, highlighting the decisive role of river networks in determining the spatial distribution of China’s villages.

3.2.2. Socioeconomic Factors

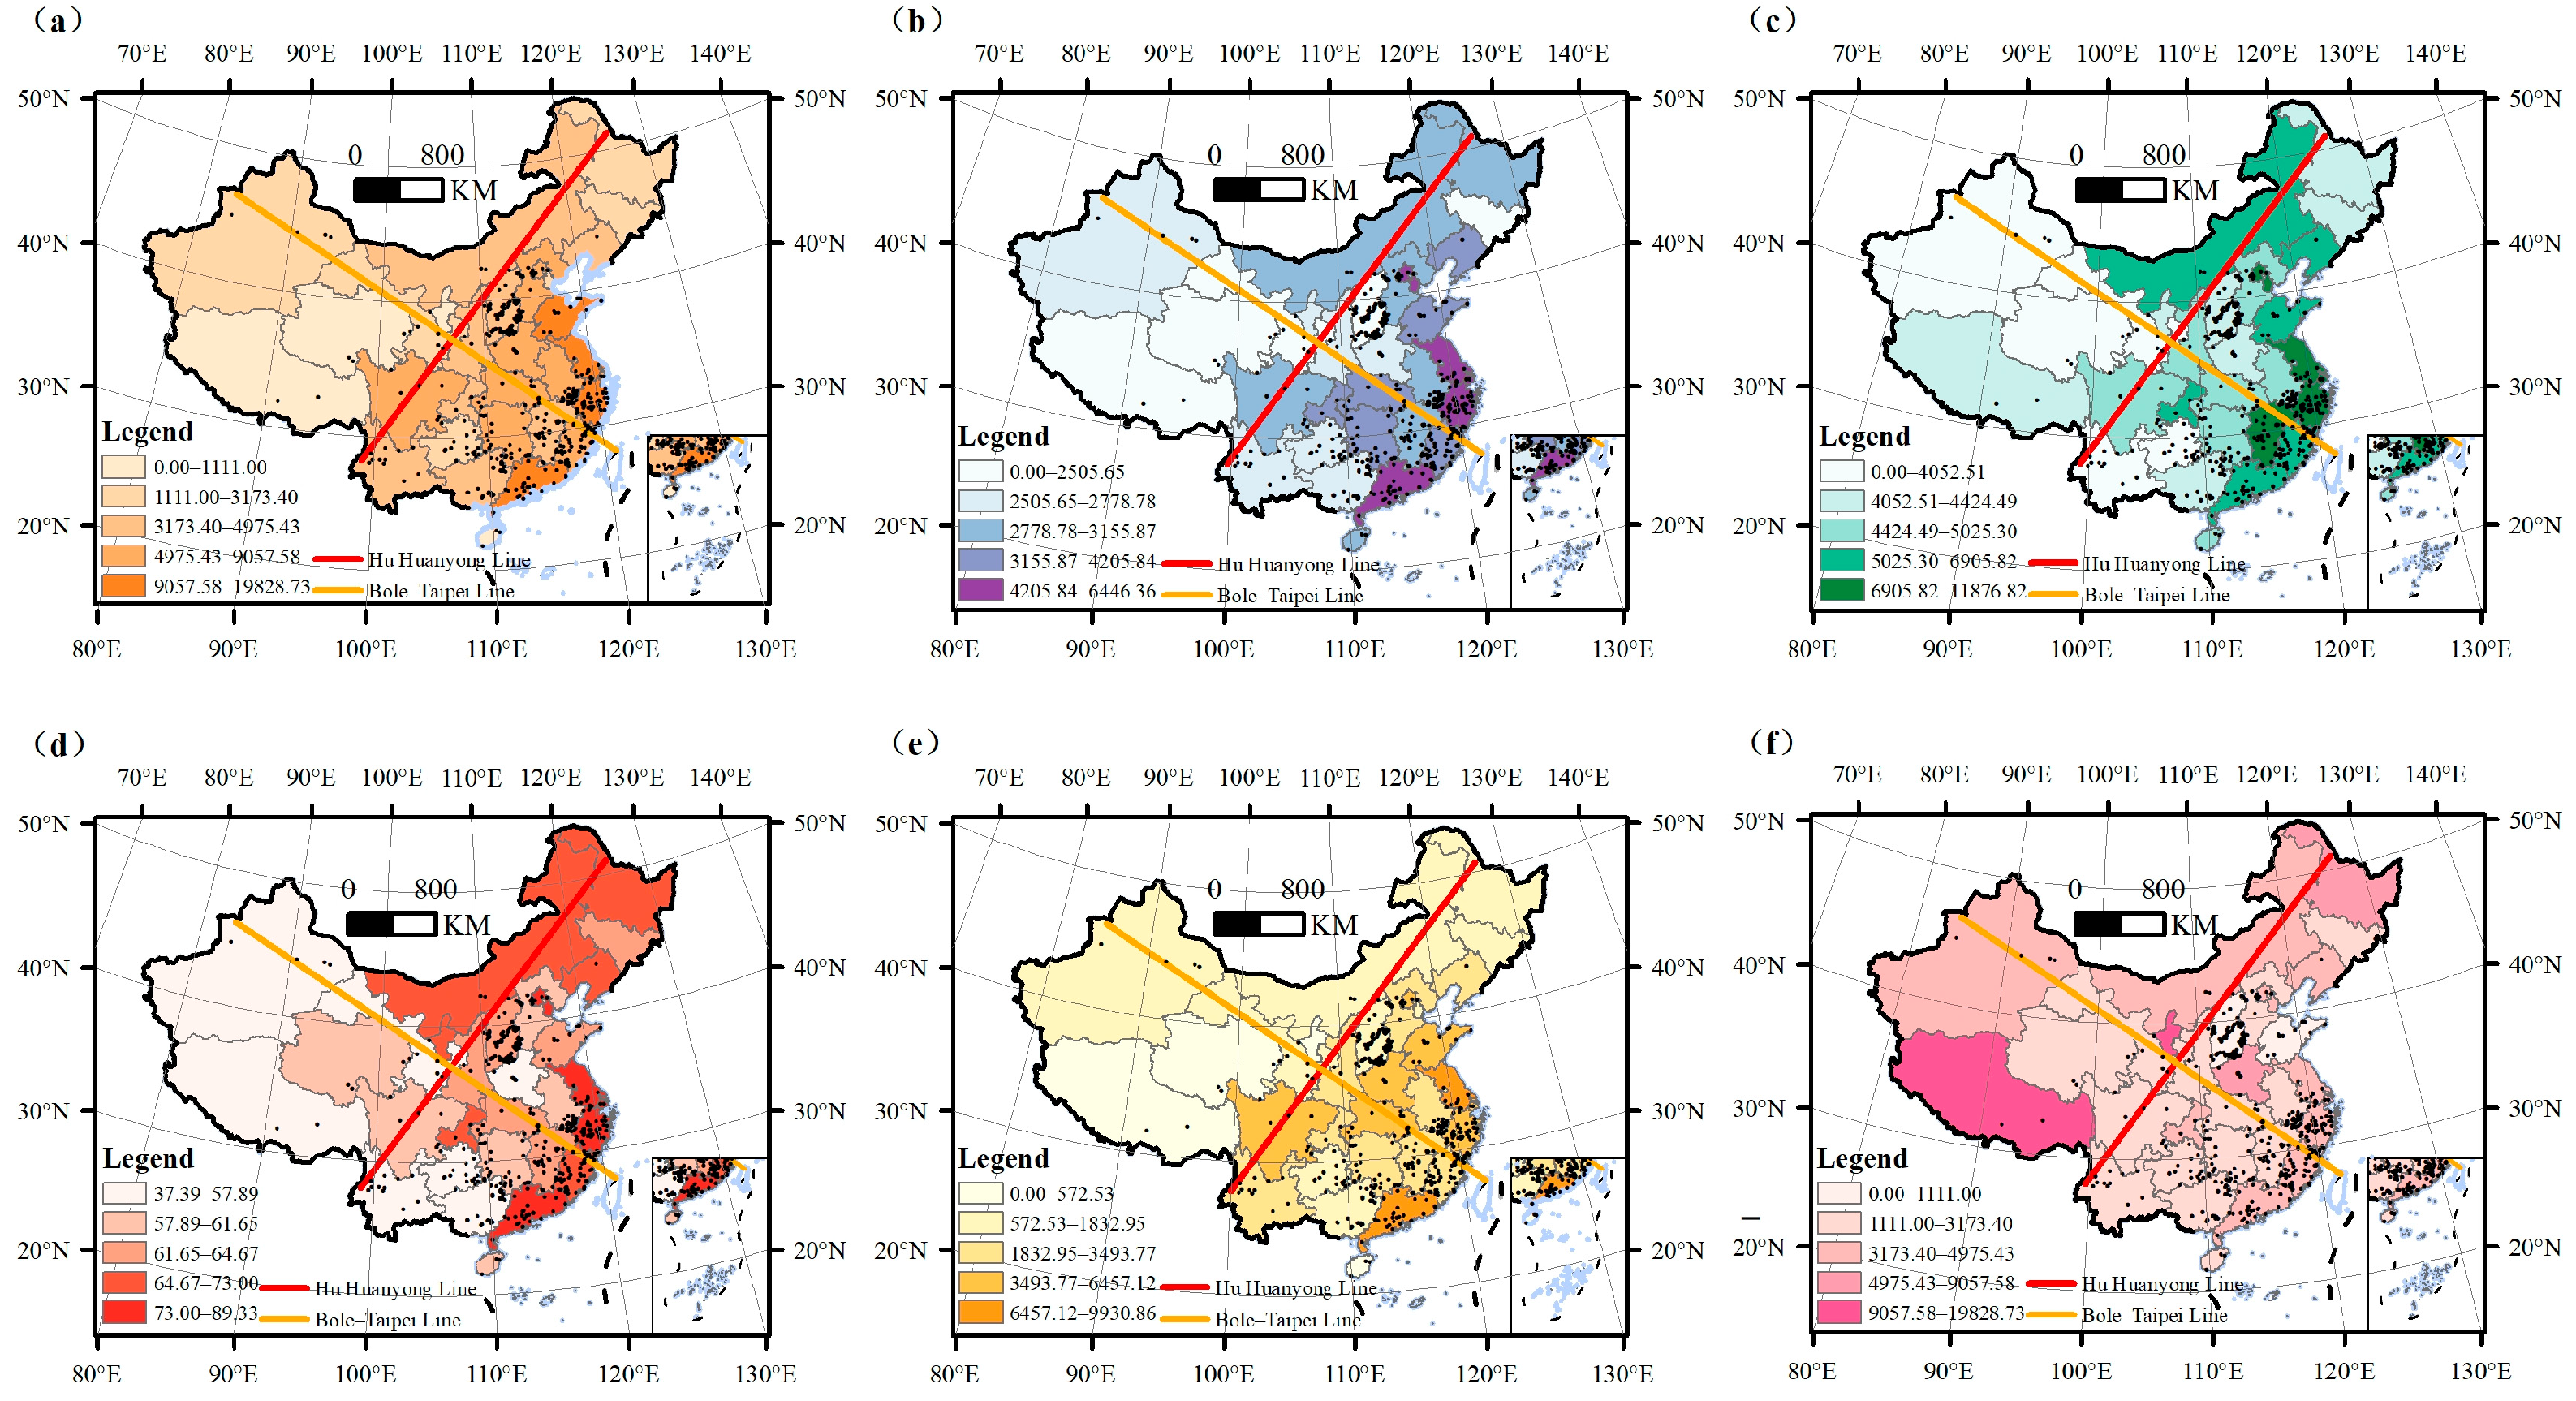
Socioeconomic factors play a dominant role in shaping the organizational patterns and evolutionary trajectories of villages in China. The five provinces with the highest GDP—Guangdong, Jiangsu, Shandong, Zhejiang, and Sichuan—exhibit the highest village density, hosting 98 villages in total, accounting for 20.12% of all sites (Figure 12a). Similarly, regions with higher urbanization rates and tertiary industry value added, including Shanghai, Beijing, Tianjin, Guangdong, Jiangsu, Shandong, and Zhejiang, contain 100 historic villages, representing 20.53% of the total, highlighting the positive influence of economic strength and industrial upgrading on village preservation (Figure 12b,c). Considering residents’ consumption expenditure and disposable income, areas such as the Yangtze River Delta and Pearl River Delta—including Shanghai, Beijing, Zhejiang, Jiangsu, Guangdong, and Jiangxi—host 125 historic villages, accounting for 25.67% of the total (Figure 12d,e). Moreover, economically strong provinces such as Beijing, Guangdong, and Jiangsu, although ranked in the second tier for annual tourism revenue, support the preservation and development of 42 villages. In contrast, provinces relying primarily on natural landscapes, such as Tibet, Ningxia, Henan, and Heilongjiang, rank among the top four in tourism revenue but contain only 16 historic villages (Figure 12f). These patterns indicate that the survival of villages depends not only on tourist flows but also critically on regional economic development.

3.2.3. Transportation Networks

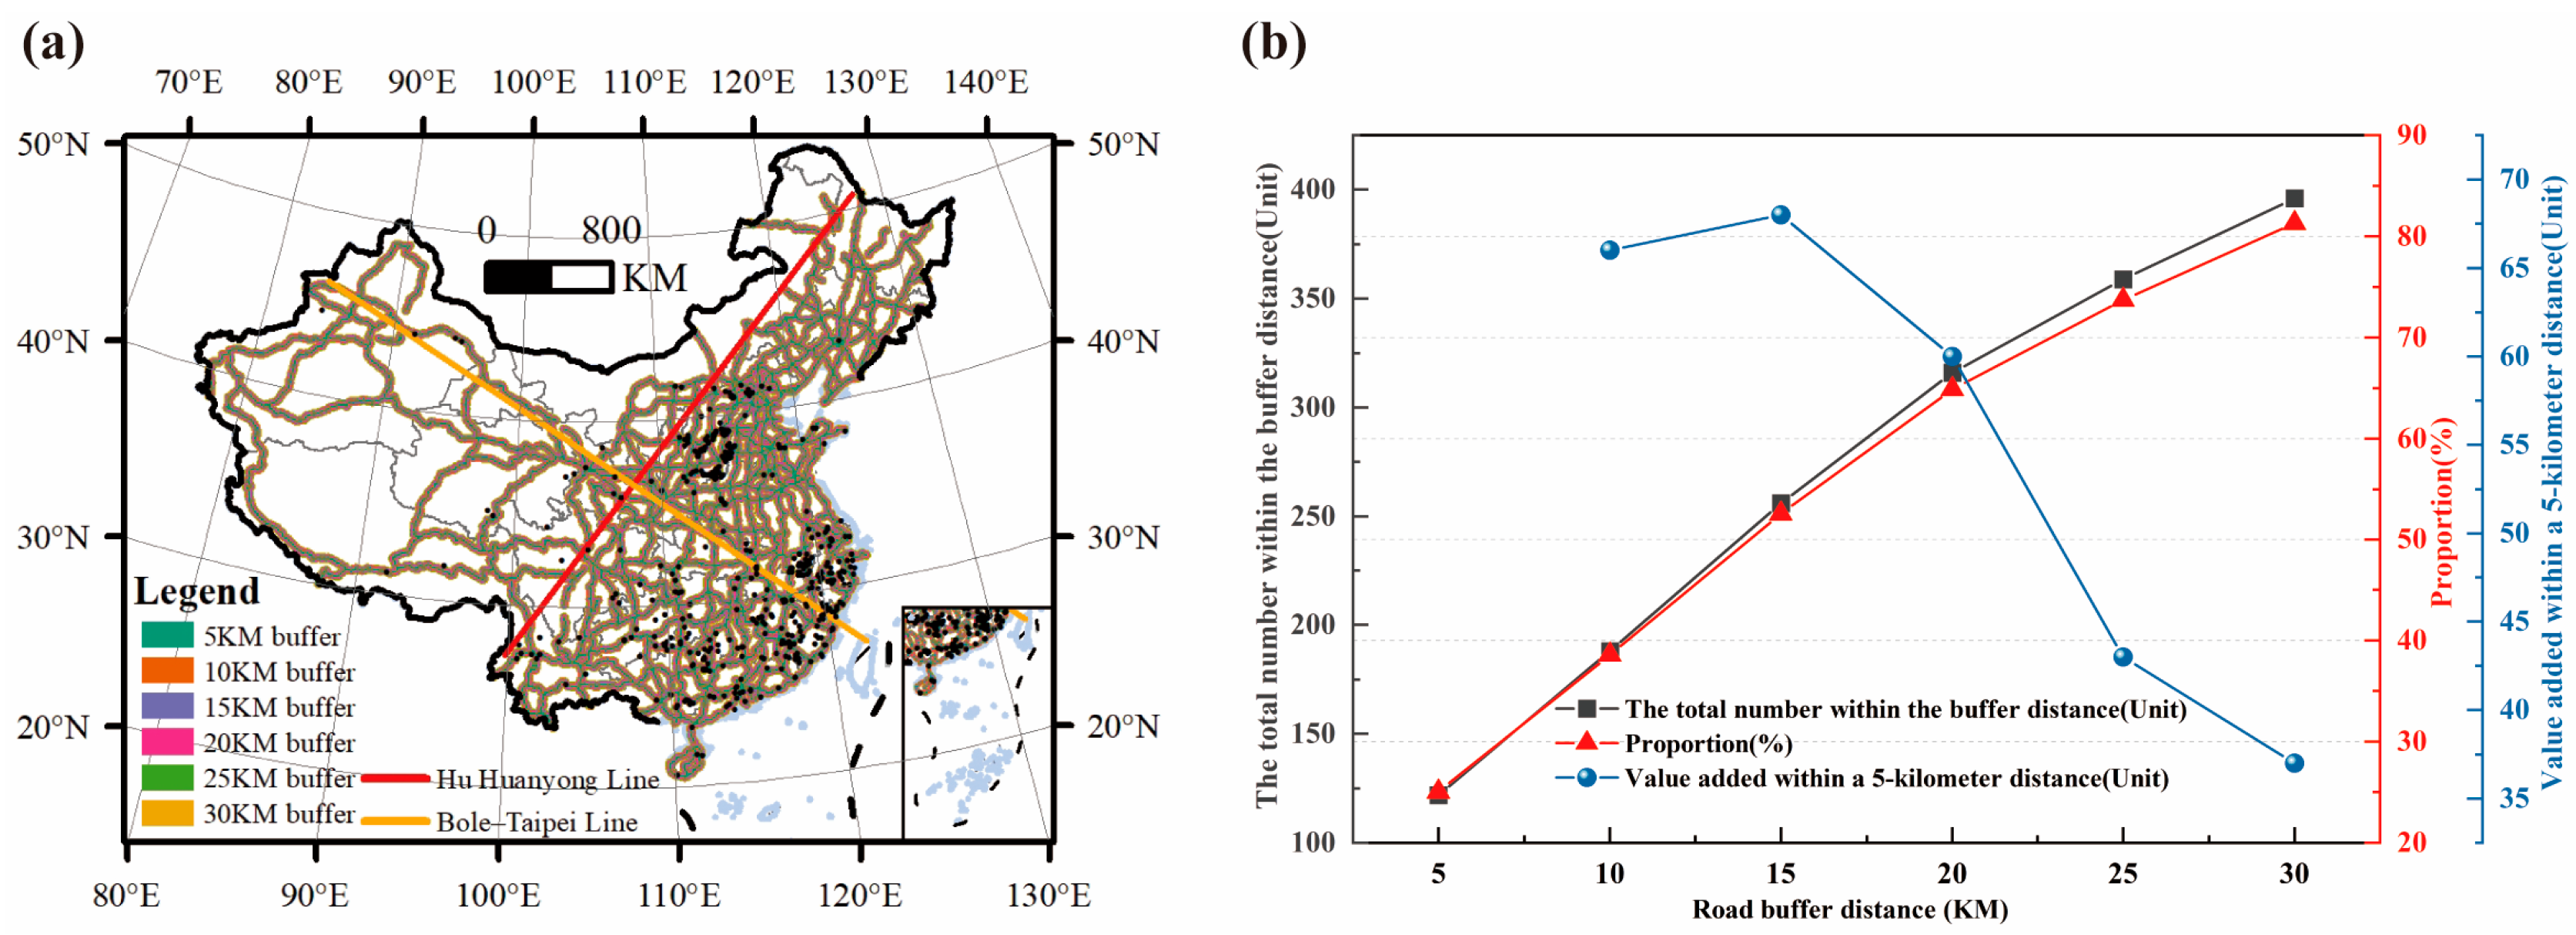
Villages in China are primarily concentrated within a 30 km buffer zone surrounding national highways (Figure 13a). The buffer analysis reveals that 396 villages (81.31%) fall within this range. Within a 5 km buffer, 122 villages (25.05%) are directly accessible via national highways, and the cumulative number of accessible villages increases with expanding buffer distances. The growth rate accelerates within the 10–15 km buffer, reaching a peak at 15 km, and then gradually declines across the 15–30 km range (Figure 13b). Variations among provinces in terms of locational conditions and transport accessibility significantly influence the formation and spatial distribution of villages. Therefore, these villages tend to cluster in areas with favorable transportation, particularly within a 15 km buffer of national highways.

3.2.4. Visitor Market

(1)
Population Density
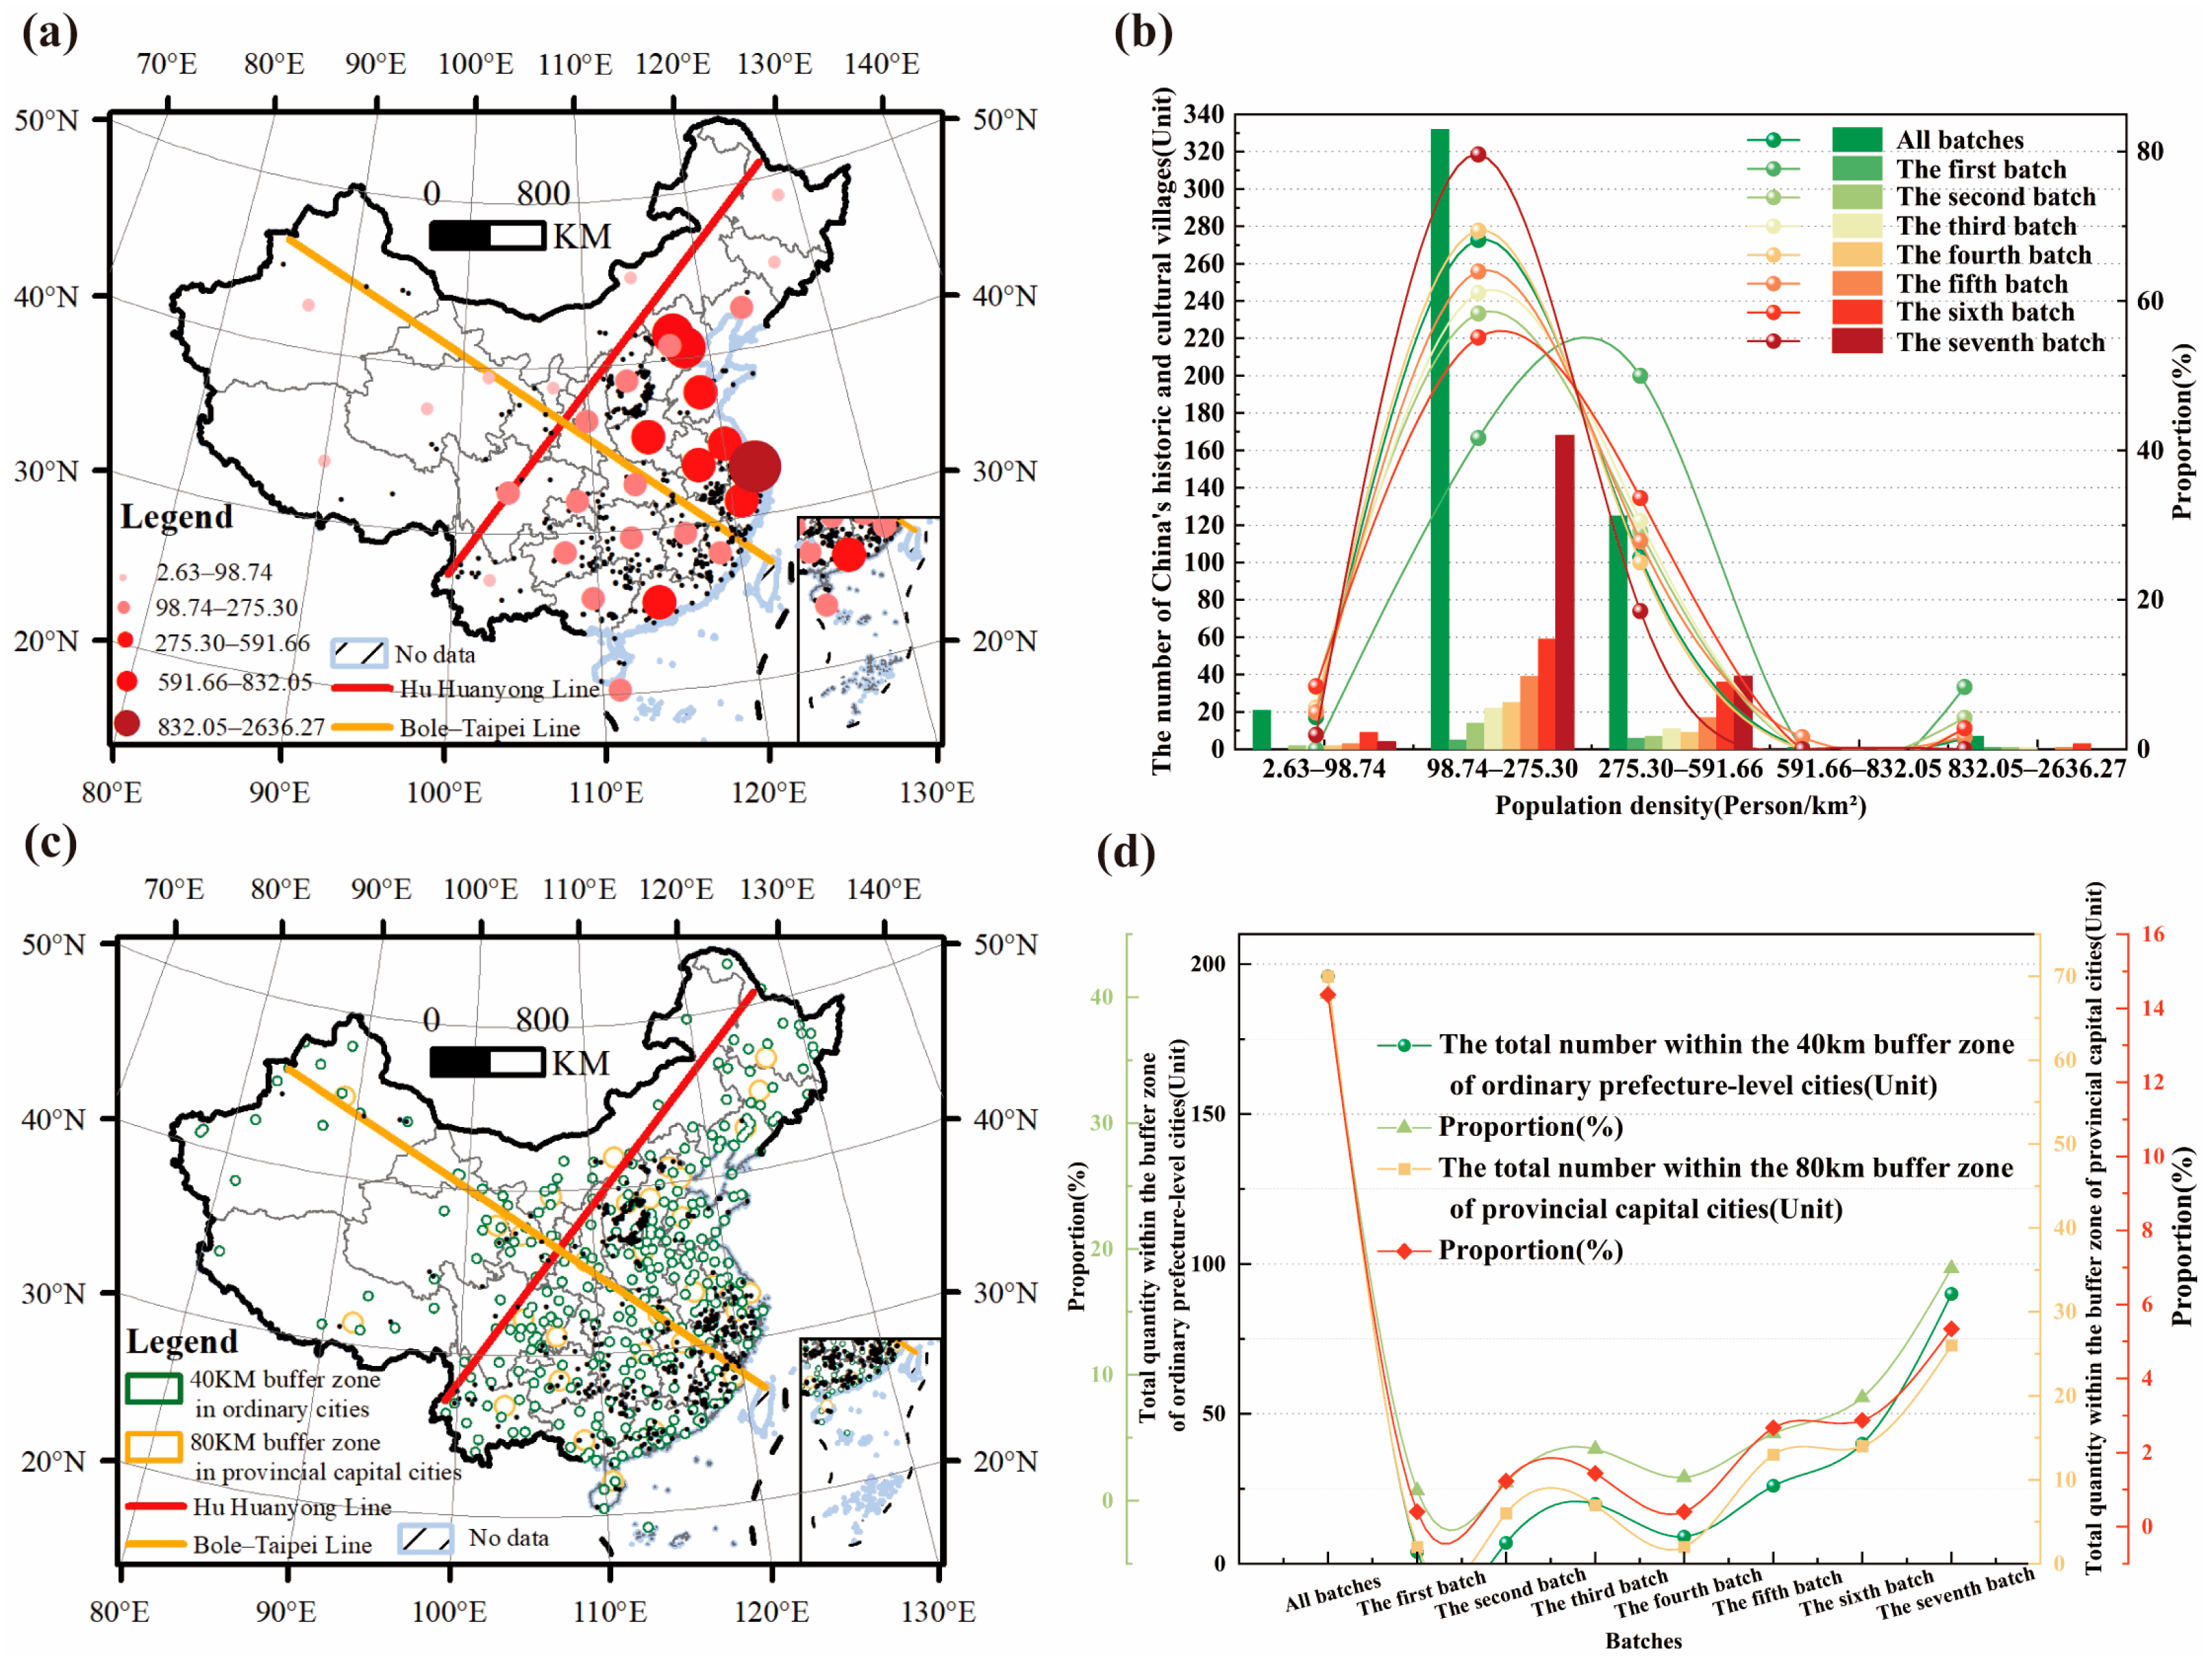
The spatial distribution of villages in China exhibits an inverted U-shaped relationship with population density (Figure 14a,b). Provinces with moderate population densities, such as Shanxi (96 villages), Zhejiang (44 villages), and Anhui (24 villages), show the highest village concentrations. In contrast, highly urbanized regions, including Shanghai (2 villages) and Beijing (5 villages), contain very few villages, as rapid urbanization has largely replaced traditional settlements with modern infrastructure. Low-density regions, such as Tibet (4 villages) and Qinghai (5 villages), also support few villages due to environmental constraints, with peripheral areas like Inner Mongolia (2 villages) exhibiting similar patterns. Overall, population density indirectly shapes village distribution by influencing development intensity and resource allocation.
(2)
Proximity to Administrative Cities
Villages are predominantly situated outside the immediate buffers of administrative cities (Figure 14c,d). Within an 80 km buffer of provincial capitals, only 70 villages exist (14.37% of the total), whereas within a 40 km buffer of ordinary administrative cities, 197 villages are present (40.45%). These findings indicate that proximity to administrative centers significantly affects village distribution. Fewer villages occur within the influence zones of provincial capitals, as strong economic radii and rapid urbanization increase exposure to modern construction, complicating preservation. Conversely, areas surrounding ordinary cities face lower development pressures, and some remote regions retain traditional settlements due to delayed modernization, providing favorable conditions for village persistence.

3.2.5. Tourism Resources

(1)
5A-Rated Scenic Areas
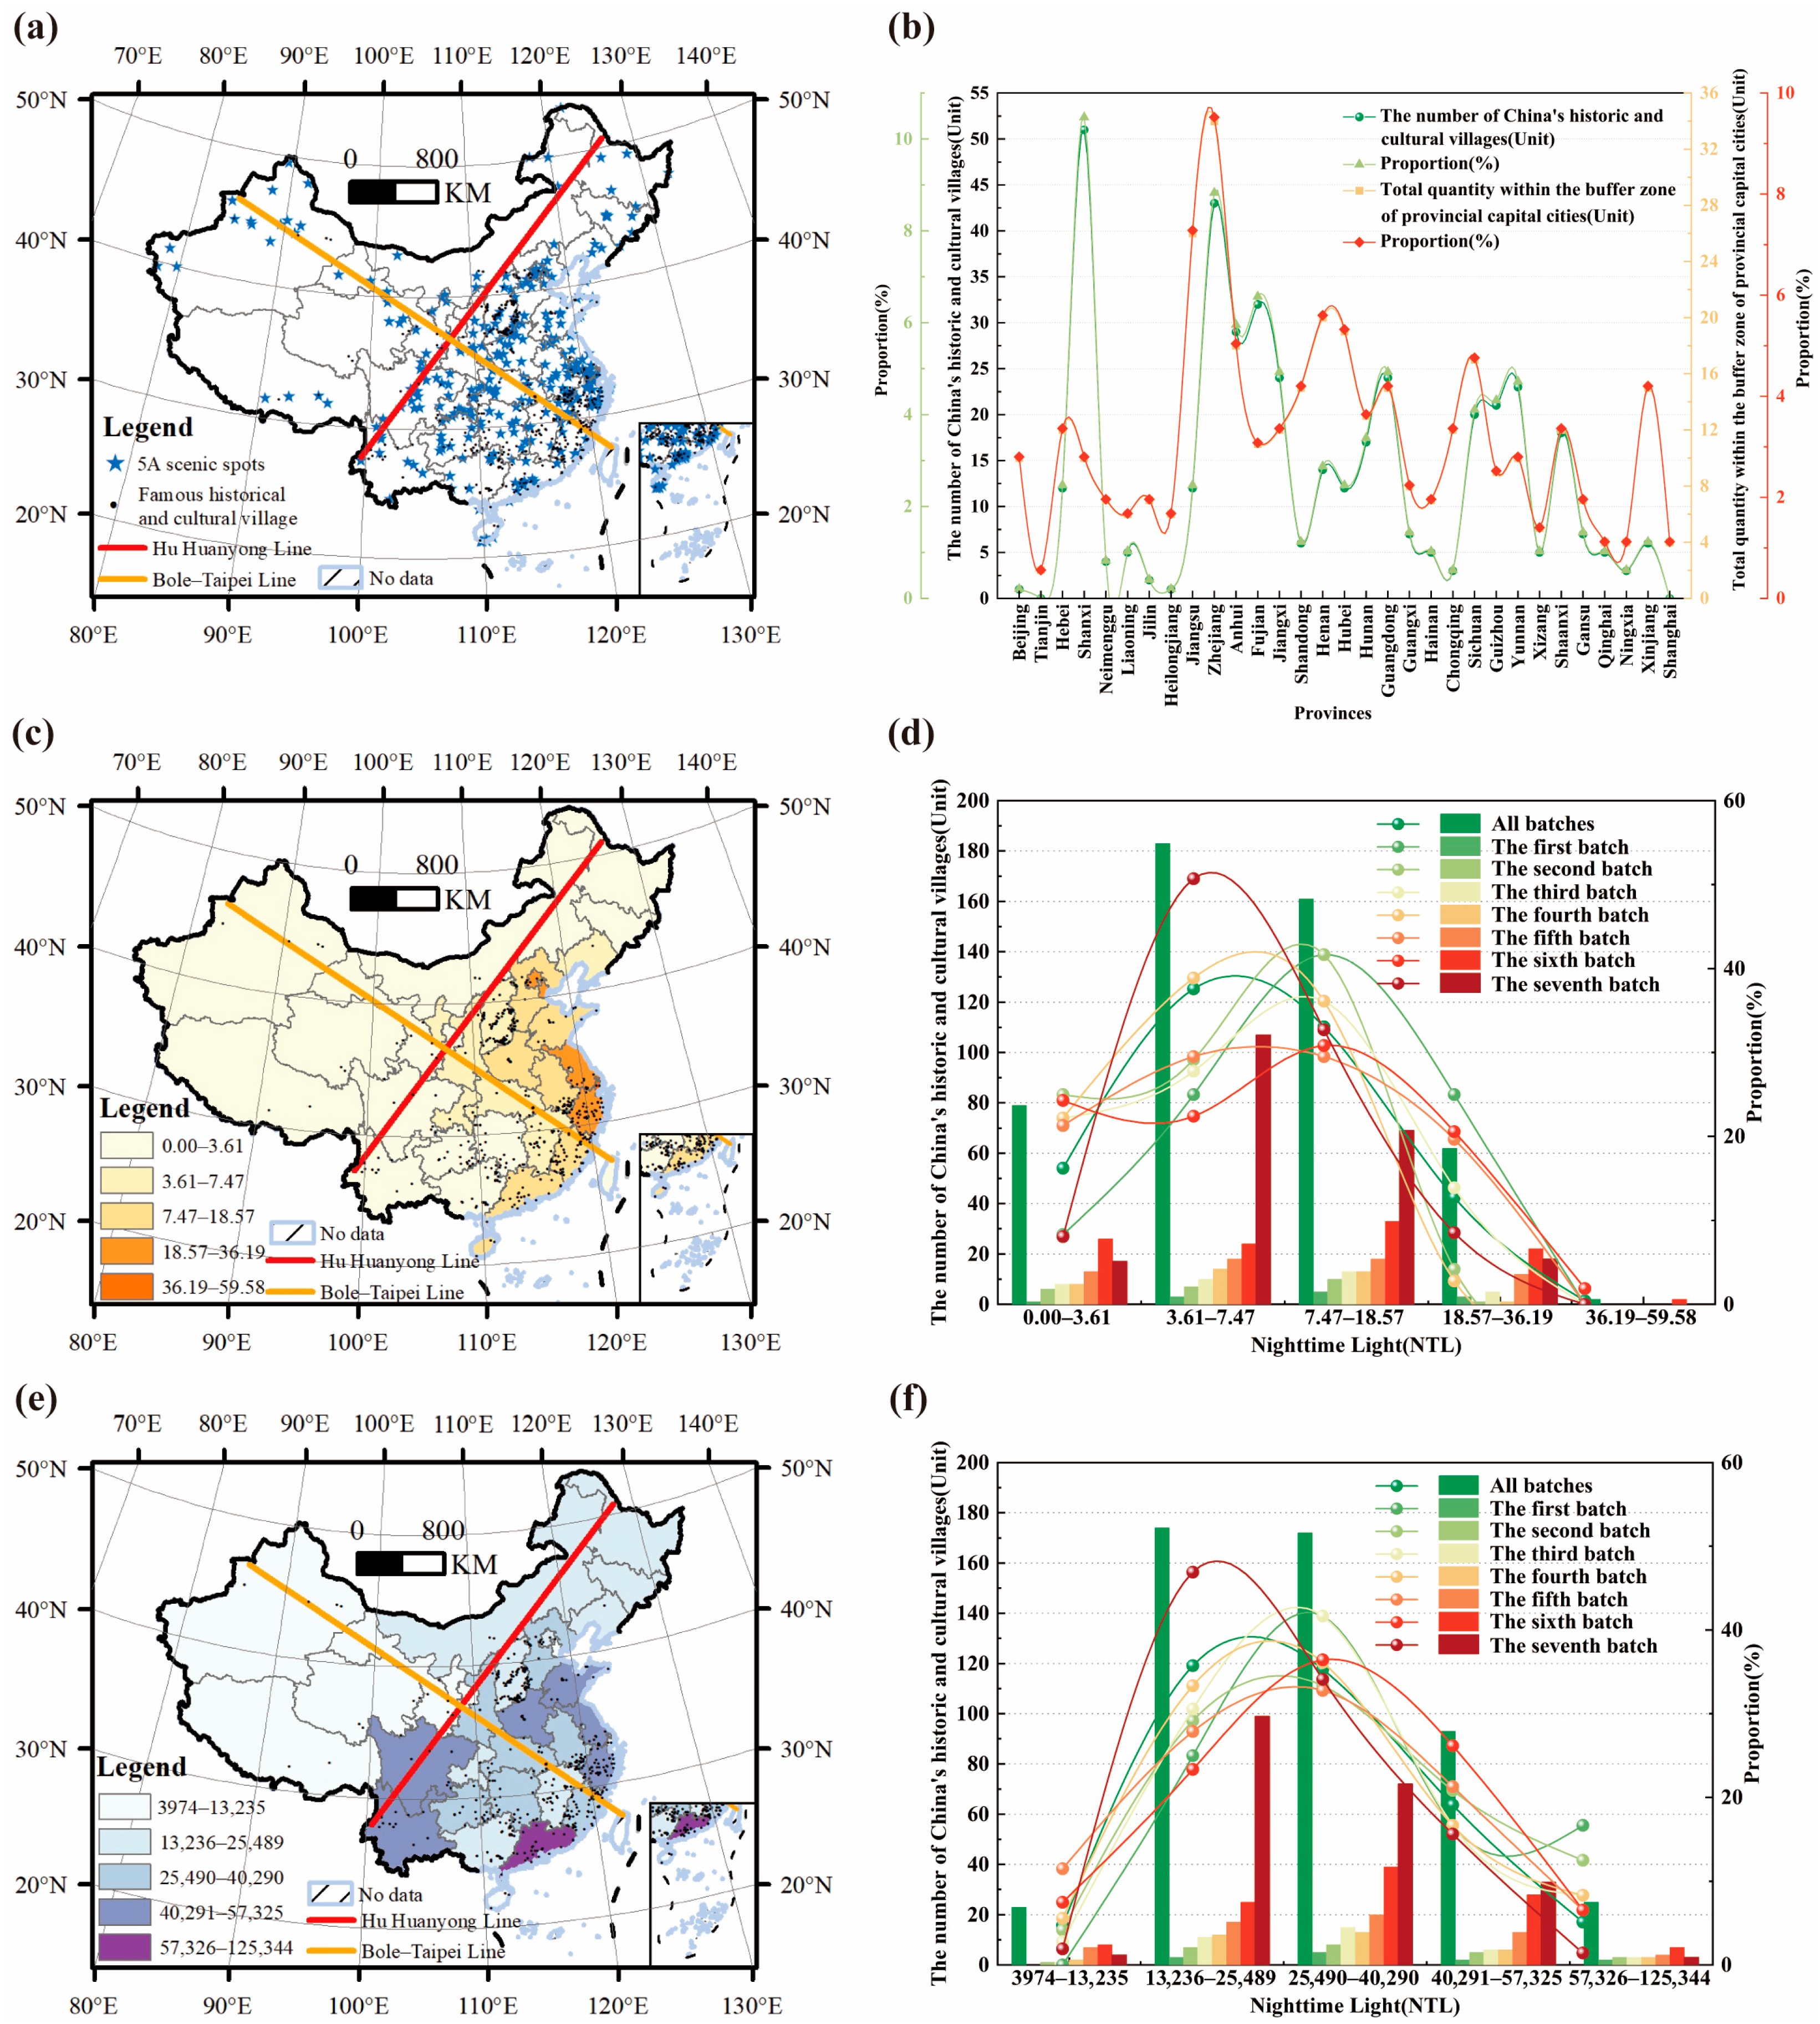
Shanxi and Fujian provinces lead China in both the number of 5A-rated scenic areas and villages, hosting 10 and 11 5A sites alongside 96 and 57 villages, respectively (Figure 15a,b). Further analysis shows that the top five provinces in terms of 5A scenic areas—Zhejiang, Jiangsu, Henan, Hubei, and Anhui—together account for 137 villages, representing 31.2% of the national total. This highlights a strong spatial synergy between high-grade scenic areas and villages, suggesting that the distribution of 5A scenic areas significantly influences village location patterns.
(2)
Nighttime Light Intensity
Nighttime light intensity demonstrates a clear negative association with the distribution of villages (Figure 15c,d). Provinces such as Shanxi and Fujian, with moderate-to-low light values of 7.30 and 10.34, host 96 and 57 historic villages, respectively, ranking them first and second nationally. In contrast, the ten provinces with the highest nighttime light values—including Shanghai, Beijing, Tianjin, and Zhejiang, all exceeding 10.93—collectively account for 144 villages, representing 29.57% of the national total. This pattern is largely attributable to rapid urbanization: in Beijing, Shanghai, and Tianjin, urban expansion has encroached on rural lands, leading to the loss of historic settlements through land acquisition, demolition, and redevelopment. In Zhejiang, the construction of new replica historic streets and the introduction of chain commercial developments have similarly diminished the authenticity of historic villages. Conversely, provinces with lower nighttime light intensity—such as Shanxi, Fujian, Jiangxi, and Anhui, all below 10.93—host 343 historic villages, accounting for 70.43% of the national total. Slower urbanization and lower levels of economic development in these areas have exerted minimal disruption to traditional spatial patterns, thereby preserving historic landscapes and architectural textures. These findings reveal a pronounced spatial mismatch between nighttime light intensity and the distribution of villages across China.
(3)
Accommodation Facilities
Regional accommodation infrastructure plays a crucial role in shaping the spatial distribution of villages (Figure 15e,f). Provinces such as Zhejiang (57,325 facilities, 44 villages), Fujian (27,728 facilities, 57 villages), and Shanxi (21,212 facilities, 96 villages) demonstrate that a well-developed accommodation network supports village conservation by attracting overnight visitors and prolonging stays. By contrast, Guangdong (125,344 facilities, 25 villages) and Jiangsu (53,082 facilities, 12 villages) have extensive accommodation infrastructure but relatively fewer villages. Overall, the availability and quality of accommodation facilities provide essential material support for the sustainable protection and development of villages across China.

3.2.6. Comparison of Influencing Factors

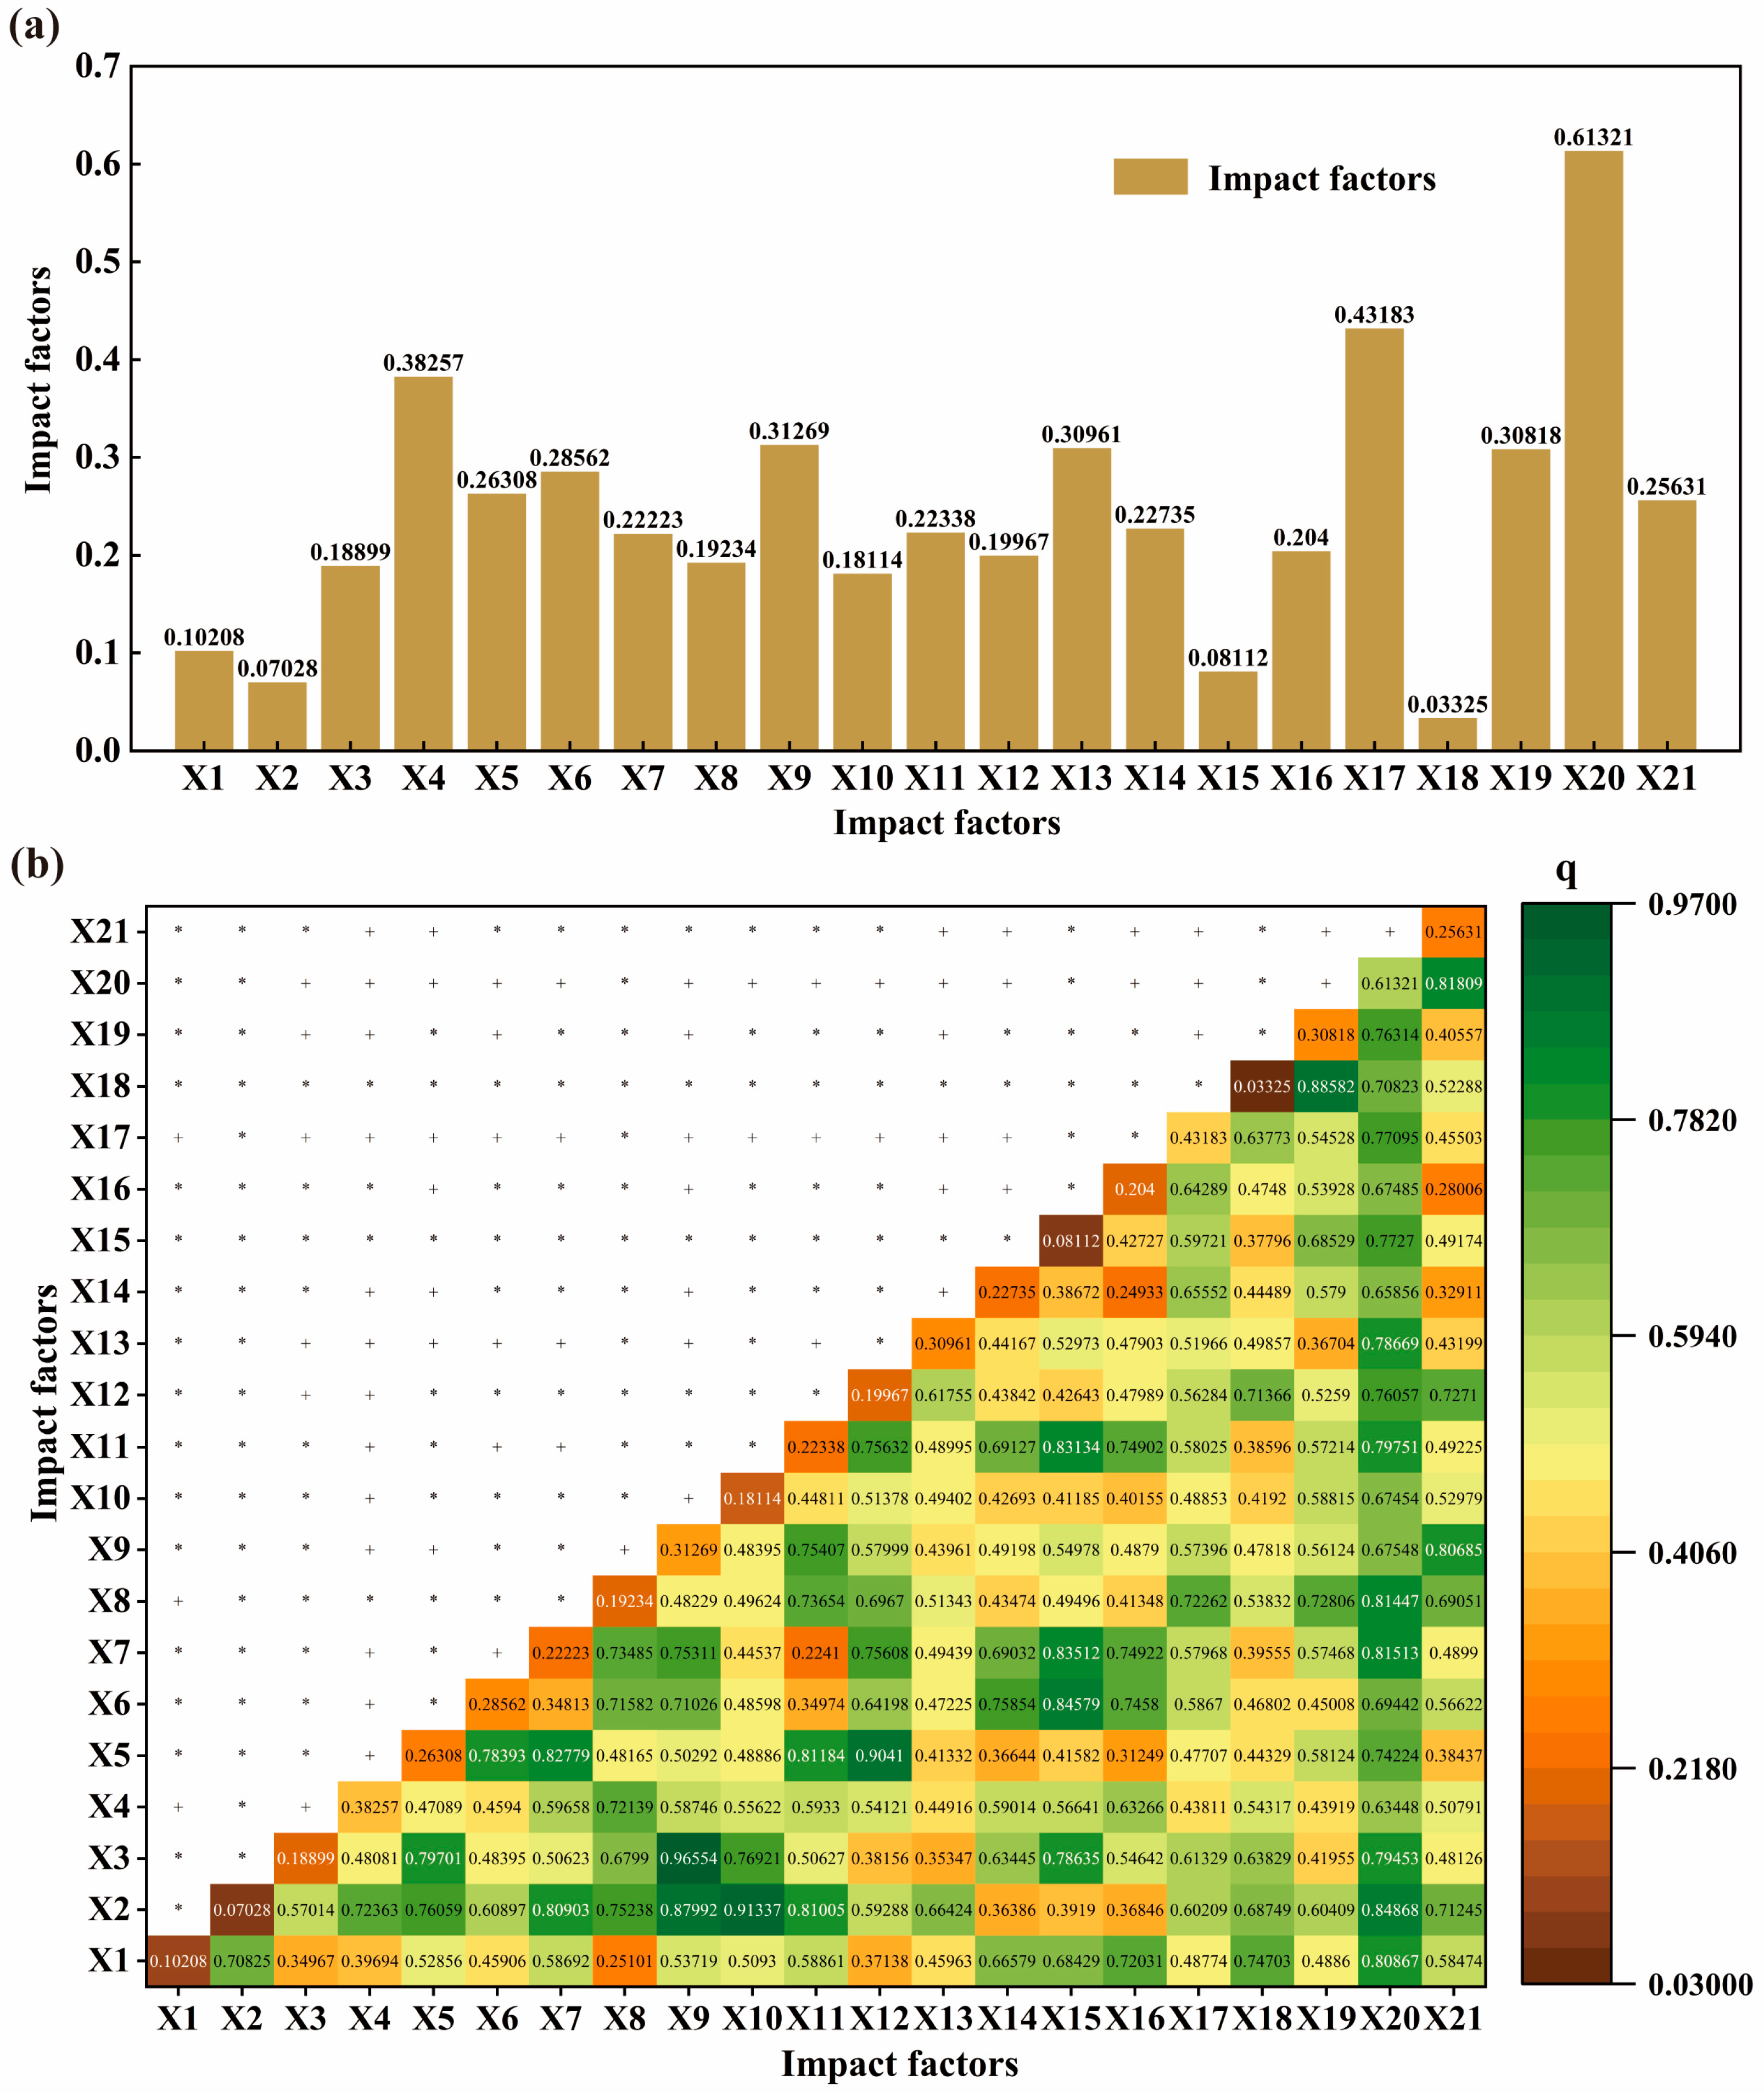
The contribution of individual factors to the spatial distribution of historical and cultural village exhibits substantial variation. The explanatory power of the primary factors is ranked as follows: q (X20) > q (X17) > q (X4) > q (X9) > q (X13) > q (X6) > q (X5) > q (X7) > q (X11) > q (X14) > q (X16) > q (X12) > q (X8) > q (X10) > q (X3) > q (X1) > q (X21) > q (X19) > q (X15) > q (X2) > q (X18) (Figure 16a). Among these, the provincial annual average nighttime light intensity (X20) exhibits the highest explanatory power, exceeding 50% (q = 0.613), indicating that nighttime light development exerts a decisive influence on the spatial distribution of villages. Population density ranks second, with an explanatory power close to 50% (q = 0.432), reflecting that provinces with denser populations tend to host more concentrated village clusters. Additional factors, including annual mean temperature (q = 0.383), per capita disposable income (q = 0.313), the number of transportation service facilities (q = 0.310), and the number of 5A-rated scenic areas (q = 0.308), all show explanatory power above 30%, highlighting the combined influence of climatic conditions, economic factors, infrastructure, and tourism resources on village distribution.
Pairwise interaction analysis of the 21 factors indicates that the combined effects of two factors consistently surpass single-factor effects, manifesting both nonlinear enhancement and bivariate strengthening (Figure 16b). The interaction of annual average nighttime light intensity (X20) with other factors is the most influential, followed by slope (X2) and per capita disposable income (X9), underscoring the decisive role of tourism resources alongside significant contributions from natural and economic conditions. Notably, the interaction between slope orientation and per capita disposable income is the most pronounced, followed by the combination of annual precipitation and annual tourism revenue, with interaction values of X3 × 9 and X5 × 12 reaching 0.966 and 0.904, respectively. These results reveal strong coupling between geographic and economic factors, as well as synergistic effects linking climate and tourism-driven economic development.

4. Discussion

4.1. Factors Influencing the Spatial Distribution of Historic and Cultural Villages in China

4.1.1. Natural Geography

Natural geographic conditions provide the foundational basis for the formation and spatial distribution of historical and cultural villages in China. The country’s stepped topography and diverse landforms have shaped their distinct regional patterns [46]. Villages located above 1000 m account for only 12.53%, suggesting that high altitudes constrain their development, with the influence of elevation diminishing from west to east. Most villages are concentrated in plains, basins, or coastal lowlands with slopes below 2°, and their distribution decreases with steeper gradients. A predominance of sunny slopes further reflects the traditional siting principle of “facing south with a northern backing.” In addition, climatic factors such as temperature and precipitation, together with the proximity to river systems, play a decisive role in creating spatial unevenness

4.1.2. Socioeconomic Conditions

Socioeconomic development acts as a key external driver shaping the spatial distribution of historical and cultural villages. Economically advanced provinces such as Guangdong and Jiangsu have capitalized on their strong economic bases and tourism development strategies to restore ancient villages, positioning tourism as a new engine of growth. In contrast, less developed provinces, including Henan and Ningxia, face financial constraints that limit their capacity to preserve and rehabilitate villages, resulting in comparatively fewer designations of historical and cultural villages.

4.1.3. Transportation Accessibility

Transportation accessibility has a significant impact on the spatial layout of historical and cultural villages. Historically, many villages thrived along major transport routes due to their favorable locations. However, while modern transportation infrastructure and urbanization have enhanced regional connectivity, they have also created challenges for the preservation and sustainable development of traditional villages.

4.1.4. Tourist Market

Market demand, reflected in population density and proximity to administrative cities, is a critical factor influencing development potential [47]. Areas with high population density and strong economic foundations tend to host clusters of historical and cultural villages, supported by greater demographic, economic, and social carrying capacities. Such conditions help buffer the potential adverse effects of population growth, thereby reducing the risk of village degradation.

4.1.5. Tourism Resources

Tourism resources provide essential support for the sustainable development of villages. Factors such as nighttime light intensity, the presence of 5A-level scenic sites, and the availability of accommodation facilities are closely linked to their spatial distribution. In particular, well-developed lodging services not only attract visitors and extend the consumption cycle but also contribute to heritage protection and long-term village sustainability.

4.2. Comparison with Other Countries

Globally, countries such as Italy, France, Japan, Germany, and China have preserved numerous historic rural settlements that carry irreplaceable natural landscapes and cultural memories [48]. All these countries emphasize cultural transmission and sustainable utilization in heritage protection [49]. However, differences in natural geography, social systems, and economic development stages have produced significant variations in spatial distribution, protection mechanisms, and development models. In Italy and France, historic villages are concentrated in mountainous, hilly, and river valley regions, forming dense settlement clusters. Both countries rely on legislation as the core strategy, enforcing strict building protection regulations and heritage listing systems to ensure authenticity during village renewal. These villages leverage traditional industries, such as viticulture, olive oil production, and handicrafts, for adaptive reuse, integrating cultural tourism and specialty agriculture to achieve a balance between conservation and economic benefits [50,51,52]. Germany implements a three-tier governance model across federal, state, and local levels, combining legal regulation, economic incentives, and professional guidance. Spatial planning emphasizes regional coordination, with targeted support for former East German regions. Cultural strategies prioritize the preservation of traditional construction techniques and holistic heritage protection. Participation mechanisms rely on economic incentives supported by technical guidance, forming an efficient and sustainable protection framework [53]. Japan’s historic village protection is centrally led, relying on a robust legal framework and the “Important Preservation Districts for Groups of Traditional Buildings” system. Spatially, village distribution exhibits regional gradients and urban cluster effects, while municipal mergers and other policies aim to balance urban–rural development. However, the model’s strong reliance on policy and economic incentives reduces community autonomy. These international experiences highlight two key principles: (1) protection systems should establish stable, multi-level frameworks; (2) cultural heritage conservation must be integrated with economic revitalization to ensure sustainable preservation and development.
In China, historic village protection follows a government-led and socially participatory system characterized by a “top-down directive, collaborative protection” approach [54]. Morphologically, dispersed villages represent the traditional form, whereas compact villages result from long-term evolutionary processes. In compact villages, the settlement itself forms the core unit of social networks and control, whereas in dispersed villages, this function is carried out by a regional unit of multiple natural villages. These morphological differences influence both conservation strategies and tourism development models. Tourism development in Chinese historic villages follows four main models: government-led, enterprise-led, community-led, and cultural institution-led. Each model offers advantages in resource integration, benefit distribution, and cultural preservation, but practical implementation often encounters coordination gaps and stakeholder conflicts. Overall, the protection and development of Chinese historic villages face two main challenges: (1) conservation is largely government-driven, with limited local engagement; (2) existing policies lack dynamic adjustment mechanisms, risking misalignment with evolving rural needs. Drawing on Germany’s multi-level governance and Japan’s dynamic revitalization mechanisms, improvement pathways can be explored in three dimensions: (1) establishing coordinated national–provincial–local protection systems with dynamic adjustment; (2) enhancing villagers’ decision-making power and benefit-sharing in conservation and development; (3) promoting multi-stakeholder collaboration among government, enterprises, communities, and cultural institutions, enabling sustainable heritage preservation through integrated protection and development.5.3. Research Limitations
This study has several limitations. First, constrained by the availability of data and materials, analyses of the scale structure and economic benefits of villages remain limited and warrant further investigation in future research. Second, the study focuses exclusively on villages officially designated as “China’s villages” with well-preserved conditions. While this sample selection ensures typicality and data standardization, it excludes a substantial number of villages that, despite being damaged or unlisted, still possess research value. This may lead to an overestimation of the average conservation status and economic potential of historic villages, while underestimating regional degradation patterns, thereby partially limiting the generalizability of the conclusions. Third, although the Geodetector model is effective in identifying the interaction of explanatory variables, the contributions of different factors may exhibit collinearity or overlap, which can reduce the precision and independence of the results. Additionally, while the spatial analysis techniques employed are advantageous for revealing regional differentiation patterns, they may still be influenced by sample representativeness, nonlinear coupling of variables, and regional specificity, potentially leading to incomplete inferences.
To address these limitations, future research should prioritize the following directions: (1) expanding the scope of study to include multi-level protection categories, such as China’s traditional villages and provincial-level villages, to enhance the applicability and robustness of the conclusions through comparative analysis; (2) integrating modeling approaches such as geographically weighted regression and machine learning to cross-validate and complement Geodetector results, thereby more accurately identifying driving mechanisms and spatial heterogeneity; and (3) conducting field investigations and in-depth case studies in representative regions and villages to validate macro-level patterns at the micro-level, and to further explore the socioeconomic impact mechanisms of historic villages, including their role in local industrial restructuring and rural employment, thereby improving both the scientific rigor and practical relevance of the research.

4.3. Policy Implications

Protecting historical and cultural villages as vital heritage assets is not only a cornerstone for sustaining cultural continuity and strengthening national cohesion, but also a necessary requirement for advancing sustainable development and fostering a harmonious society. The spatial distribution of these villages reveals two distinct characteristics: pronounced disparities between economically developed and underdeveloped regions, and stark contrasts between areas with convenient transportation and those in remote locations. Accordingly, differentiated protection and development strategies should be adopted in line with local conditions. In economically advanced and well-connected regions, where historical and cultural villages are highly concentrated and spatially imbalanced, policies should emphasize “protection with rational utilization.” Conversely, in low-density areas, greater investment in infrastructure and targeted policy support are required. Provinces with a high concentration of villages should build on existing experiences, address emerging challenges through innovation in products and services, and pursue the integration of cultural industries with village heritage. Such efforts can enhance the synergy between preservation and utilization while promoting sustainable development. In less developed regions, where the number of historical and cultural villages is relatively small and awareness of protection and development remains limited, it is essential to improve policies, encourage innovation, and increase financial investment to address existing gaps. The designation of historical and cultural villages can also serve as a catalyst for broader regional development through a “point-to-area” approach, stimulating industrial transformation and economic upgrading in traditional ethnic areas and advancing more balanced and sustainable protection at the national scale. However, current efforts face institutional challenges: first, the absence of comprehensive laws and regulations; and second, inadequacies in supervisory mechanisms, particularly in evaluation systems, accountability, and standard setting. To address these issues, it is necessary to establish and improve legal and regulatory frameworks, develop quantitative evaluation standards, and ensure effective implementation, thereby providing robust institutional support for the long-term preservation and sustainable use of historical and cultural villages

5. Conclusions

This study integrates spatial analysis techniques—such as the nearest neighbor index and kernel density estimation—together with statistical approaches, including the independent samples t-test, supported by ArcGIS 10.8.1, to quantitatively investigate the spatial distribution and density characteristics of historical and cultural villages. Moreover, the geographic detector was applied to evaluate both single-factor effects and their interactions, with the aim of identifying the dominant drivers shaping spatial configurations. The results yield three major findings. (1) The spatial distribution of historical and cultural villages in China is highly uneven and strongly clustered. Using the Hu Huanyong Line and Bole–Taipei Line as reference boundaries, 96.10% of the villages are located in the southeastern region, while 57.70% are concentrated in the northeastern region, highlighting a marked eastern predominance. Spatial clustering has become more pronounced over time: earlier batches displayed relatively dispersed patterns, whereas the fifth to seventh batches formed dense clusters centered in southern Anhui–western Zhejiang and central Shanxi. The orientation of the distribution axis also shifted dynamically, evolving from “southeast–northwest” in the early stage to “north–south” in the mid-stage, and eventually returning to “southeast–northwest” in the later stage with increasing directional intensity, reflecting temporal adjustments in clustering patterns. (2) The spatial configuration of historical and cultural villages is jointly shaped by natural geography, locational conditions, socioeconomic development, and tourism resources. From a physical geography perspective, villages are mainly distributed in low-altitude areas (0–500 m, 58.73%), on gentle slopes (slope < 6°, 76.59%), on sunny aspects (34.70%), within favorable climatic zones (annual mean temperature of 15–20 °C, 51.95%; annual precipitation of 1500–1700 mm, 34.29%), and within 30 km of rivers of grade III or higher (62.01%). Locational advantages—particularly proximity to national highways and transportation accessibility—significantly enhance clustering. Socioeconomic conditions, including higher GDP levels and urbanization rates, also promote village distribution, while population density and tourism resource richness further reinforce spatial agglomeration. (3) The interaction effects among multiple factors provide stronger explanatory power than single-factor influences. Single-factor analysis shows that average nighttime light values exert the greatest impact, followed by slope and per capita disposable income, whereas distance to administrative cities and slope have relatively weaker effects. Interaction detection demonstrates that all two-factor combinations considerably enhance explanatory power compared with single factors, indicating that the coupling of natural and human factors constitutes a critical mechanism shaping the spatial distribution of historical and cultural villages.

Author Contributions

Conceptualization, S.J. and H.P.; methodology, H.P.; software, S.J.; validation, Z.Z., H.P. and S.S.; formal analysis, Z.Z.; investigation, Z.Z.; resources, H.P.; data curation, S.J.; writing—original draft preparation, S.J.; writing—review and editing, H.P. and G.L.; visualization, H.P.; supervision, G.L. and S.S.; project administration, H.P.; funding acquisition, S.J. and N.L. All authors have read and agreed to the published version of the manuscript.

Funding

This research received no external funding.

Data Availability Statement

The majority of the datasets used in this study are publicly available and can be accessed through public repositories. All used data repositories are cited either in the main text. The spatial vector data is comes from the Natural Resources Standard Map Service website (http://bzdt.ch.mnr.gov.cn/, accessed on 25 January 2025),The DEM comes from the geospatial data cloud platform (https://www.gscloud.cn/, accessed on 25 January 2025),The river system comes from the national geographic information resource directory service system (https://www.webmap.cn/main.do?method=index, accessed on 26 January 2025),The national highway comes from The Open Street Map, OSP (https://openmaptiles.org/languages/zh/, accessed on 26 January 2025). This website allows open access.

Acknowledgments

We sincerely thank the reviewers and editors.

Conflicts of Interest

The authors declare no conflict of interest.

Abbreviations

The following abbreviations are used in this manuscript:
villagesHistoric and cultural villages
GISGeographic Information Systems
MCDAMulti-Criteria Decision Analysis
NNINearest neighbor index
SDEStandard deviational ellipse

Appendix A

Table A1. The Protection System and Characteristics of China’s Major Historical and Cultural Heritages.
NameIdentification DepartmentFeatures
China’s Historic and Cultural VillagesMinistry of Housing and Urban-Rural Development (MOHURD) and the National Cultural Heritage Administration (NCHA)Historic and Cultural Villages refer to villages that preserve exceptionally rich cultural relics, possess significant historical value or commemorative importance, and can relatively completely reflect the traditional architectural features and local ethnic characteristics of a specific historical period. Their core resources include cultural and historical assets such as heritage buildings, ancient streets and alleys, historic environmental elements, and intangible cultural heritage, endowing them with prominent cultural status and value. Compared to Traditional Villages, Historic and Cultural Villages are assigned a higher conservation tier for cultural resources and are subject to more stringent protection requirements.
China’s Historic and Cultural TownsMinistry of Housing and Urban-Rural Development (MOHURD) and the National Cultural Heritage Administration (NCHA)China’s Historic and Cultural Towns are designated through a joint selection process by the Ministry of Housing and Urban-Rural Development (MOHURD) and the National Cultural Heritage Administration (NCHA). These towns preserve exceptionally rich cultural relics, possess significant historical value or commemorative importance, and are capable of fully reflecting the traditional architectural features and local ethnic characteristics of specific historical periods.
China’s Historic and Cultural CitiesMinistry of Housing and Urban-Rural Development (MOHURD) and the National Cultural Heritage Administration (NCHA)China’s Historic and Cultural Cities refer to urban areas that preserve exceptionally rich cultural relics and possess significant historical, cultural, or revolutionary significance. In terms of administrative divisions, such designated areas are not necessarily “cities” in the modern municipal sense—they may also be designated at the county or district level while still carrying the title “Historic and Cultural City” as a national recognition of their heritage value.
Chinese Traditional VillageMinistry of Housing and Urban-Rural Development (MOHURD)Traditional Villages represent a treasury of historical information and cultural landscapes, serving as the most significant legacy of China’s agrarian civilization. These villages retain considerable historical continuity, with their built environment, architectural features, and settlement layout remaining largely unchanged over time. They possess unique folk customs and traditions, and despite their great antiquity, continue to be vibrant, functioning communities. This highlights their profound civilizational value and enduring legacy of cultural transmission.
Table A2. Summary of Research Methods and Their Characteristics.
Technical TypeUniquenessApplicabilityLimitations
Geographically Weighted Regression (GWR)1. GWR accounts for spatial heterogeneity by analyzing local relationships between variables.
2. It is supported by a well-established theoretical foundation and offers a wide range of statistical testing methods.
1. Suitable for analyzing the distribution characteristics of spatial data, spatial relationships between variables, and spatial dependence, among other aspects.
2. Commonly used in fields such as regional economics, urban planning, and ecology to address issues involving spatial data analysis.
1. Geographically Weighted Regression (GWR) has certain limitations in handling multi-factor interactions.
2. It imposes specific requirements on data quality and distribution, such as the assumption of spatial stationarity.
Multi-Criteria Decision Analysis (MCDA) Models1. MCDA models enable comprehensive consideration of multiple evaluation criteria and facilitate decision analysis through weight assignment.
2. They offer robust spatial visualization capabilities to intuitively present analytical results.
1. MCDA models are suitable for addressing geographical issues involving multi-objective decision-making, such as land-use planning and site selection analysis.
2. They can be integrated with other data and methods to construct complex geographical analysis models.
1. The weight determination process in MCDA models is highly subjective, which may impact the accuracy of results.
2. Model validation and calibration are challenging, requiring high data precision and resolution.
Machine Learning Algorithms1. Random Forest can handle high-dimensional data with strong resistance to overfitting; Support Vector Machine (SVM) achieves effective classification and regression results even with small-sample data.
2. Capable of automated feature selection to uncover underlying patterns in data.
1. Suitable for tasks such as classification, regression, and prediction of geographical data, including land use classification and climate change forecasting.
2. Offers advantages in handling complex nonlinear relationships.
1. Machine learning algorithms are often regarded as “black-box” models, with relatively poor interpretability of results.
2. Require large volumes of high-quality data and involve complex data preprocessing procedures.
Geodetector1. Capable of effectively identifying non-linear interactions among multiple factors, enabling in-depth analysis of synergistic or inhibitory relationships between variables.
2. Relatively flexible data distribution requirements, without the need to meet strict statistical assumptions.
1. Suitable for investigating the driving mechanisms behind geographical spatial heterogeneity, particularly advantageous in analyzing the effects of multiple factors within complex geographical systems.
2. Applicable to geographical studies at various scales (e.g., global, national, regional, local) and capable of processing diverse data types (e.g., numerical, categorical).
1. Sensitive to missing data, requiring rigorous data preprocessing.
2. Interpretation of results is relatively complex and necessitates in-depth analysis supported by domain-specific knowledge.

References

  1. National Government Services Platform. Available online: https://gjzwfw.www.gov.cn/index.html (accessed on 2 February 2025).
  2. Agnoletti, M. Rural landscape, nature conservation and culture: Some notes on research trends and management approaches from a (southern) European perspective. Landsc. Urban Plan. 2014, 126, 66–73. [Google Scholar] [CrossRef]
  3. UNESCO. Available online: https://www.unesco.org/en/search?category=UNESCO&query=Cultural+landscape (accessed on 2 February 2025).
  4. Yachen, C.; Jinye, L. Thinking on the evolution path of the intangible cultural heritage protection system around the world. Econ. Geogr. 2022, 42, 225–230. [Google Scholar]
  5. Yang, G. Holistic Spatial Characteristics of Historical and Cultural Villages and Their Sociological Significances. In Rebirth of Historical Cultural Village in China; Tongji University Press: Shanghai, China, 2024. [Google Scholar]
  6. Piech, I.; Dacko, A. Landscape unit as an element of digital cultural heritage: Theory and concepts on the example of Czuów. Geomat. Landmanag. Landsc. 2025, 1, 77–92. [Google Scholar] [CrossRef]
  7. Hussein, A.S.; El-Shishiny, H. Wind flow modeling and simulation over the Giza Plateau cultural heritage site in Egypt. J. Comput. Cult. Heritage 2009, 2, 1–22. [Google Scholar] [CrossRef]
  8. Ghosh, S.; Pillai, R.H.; Roy, A.; Anand Murali, R.; Vardhan, V. A simulation study of dust transport on an ancient amphitheatre: The Delphi example. J. Cult. Herit. 2017, 24, 108–116. [Google Scholar] [CrossRef]
  9. Convention Concerning the Protection of the World Cultural and Natural Heritage. Available online: https://www.un.org/zh/documents/treaty/whc (accessed on 3 February 2025).
  10. Zhu, J.; Xu, W.; Xiao, X.Y. Bingwen Temporal and spatial patterns of traditional village distribution evolution in Xiangxi, China: Identifying multidimensional influential factors and conservation significance. Herit. Sci. 2023, 11, 1–19. [Google Scholar] [CrossRef]
  11. Shummadtayar, U.; Iamtrakul, P.; Kazunori, H. Community-Based Tourism Mechanism Networks: A Factor for Sustainable Tourism at The World Heritage Corridor in Thailand. J. Southeast Asian Stud. 2024, 29, 27–45. [Google Scholar] [CrossRef]
  12. Chen, H.; Xiao, D.; Li, J.; Liu, Y. Study on the distribution characteristics and formation mechanism of traditional village names in Southeast Guizhou. npj Herit. Sci. 2025, 13, 1–25. [Google Scholar] [CrossRef]
  13. Ding, C.; Zhao, Y. Spatial patterns, factor identification, and ethnic differences: A study of traditional villages in the Yuan River Basin based on geographical detectors. Humanit. Soc. Sci. Commun. 2025, 12, 1–15. [Google Scholar] [CrossRef]
  14. Yan, H.; Dong, R.; He, Y.; Qi, J.; Li, L. Spatial Agglomeration Differences of Amenities and Causes in Traditional Villages from the Perspective of Tourist Perception. Sustainability 2025, 17, 4475. [Google Scholar] [CrossRef]
  15. Altaba, P.; García-Esparza, J.A. A Practical Vision of Heritage Tourism in Low-Population-Density Areas. The Spanish Mediterranean as a Case Study. Sustainability 2021, 13, 5144. [Google Scholar] [CrossRef]
  16. Guo, Z.; Sun, L. The planning, development and management of tourism: The case of Dangjia, an ancient village in China. Tour. Manag. 2016, 56, 52–62. [Google Scholar] [CrossRef]
  17. Chen, L.; Zhong, Q.; Li, Z. Analysis of spatial characteristics and influence mechanism of human settlement suitability in traditional villages based on multi-scale geographically weighted regression model: A case study of Hunan province. Ecol. Indic. 2023, 154, 16. [Google Scholar] [CrossRef]
  18. Chen, W.; Yang, L.; Wu, J.; Wu, J.; Wang, G.; Bian, J.; Zeng, J.; Liu, Z. Spatio-temporal characteristics and influencing factors of traditional villages in the Yangtze River Basin: A Geodetector model. Herit. Sci. 2023, 11, 111. [Google Scholar] [CrossRef]
  19. Ma, Y.; Zhang, Q.; Huang, L. Spatial distribution characteristics and influencing factors of traditional villages in Fujian Province, China. Humanit. Soc. Sci. Commun. 2023, 10, 1–17. [Google Scholar] [CrossRef]
  20. Liu, W.; Xue, Y.; Shang, C. Spatial distribution analysis and driving factors of traditional villages in Henan province: A comprehensive approach via geospatial techniques and statistical models. Herit. Sci. 2023, 11, 185. [Google Scholar] [CrossRef]
  21. Wang, X.; Zhang, T.; Duan, L.; Liritzis, I.; Li, J. Spatial distribution characteristics and influencing factors of intangible cultural heritage in the Yellow River Basin. J. Cult. Herit. 2024, 66, 254–264. [Google Scholar] [CrossRef]
  22. Athanasiou, K. The Rise and Decline of Settlement Sites and Traditional Rural Architecture on Therasia Island and Their Reciprocal Interaction with the Environment. Heritage 2024, 7, 5660–5686. [Google Scholar] [CrossRef]
  23. Cahyani, D.; Sudikno, A.; Fauzy, B. Examining the Spatial Pattern in Indonesia’s Villages for the Globalization Mechanism of Survival. J. Eng. Sci. Technol. 2020, 15, 30–38. [Google Scholar]
  24. Fallah Tafti, F.; Lee, J.H. Examining variance, flexibility, and centrality in the spatial configurations of Yazd schools: A longitudinal analysis. Buildings 2022, 12, 2080. [Google Scholar] [CrossRef]
  25. Ruiz-Jaramillo, J.; Munoz-Gonzalez, C.; Joyanes-Diaz, M.D.; Jimenez-Morales, E.; Lopez-Osorio, J.M.; Barrios-Perez, R.; Rosa-Jimenez, C. Heritage risk index: A multi-criteria decision-making tool to prioritize municipal historic preservation projects. Front. Arch. Res. 2020, 9, 403–418. [Google Scholar] [CrossRef]
  26. Wu, J.; Lu, Y.; Gao, H.; Wang, M. Cultivating historical heritage area vitality using urban morphology approach based on big data and machine learning. Comput. Environ. Urban Syst. 2022, 91, 101716. [Google Scholar] [CrossRef]
  27. Zhang, Z.; Song, Y.; Wu, P. Robust geographical detector. Int. J. Appl. Earth Obs. Geoinf. 2022, 109, 102782. [Google Scholar] [CrossRef]
  28. Zhan, C.; Liang, C.; Zhao, L.; Zhang, Y.; Cheng, L.; Jiang, S.; Xing, L. Multifractal characteristics analysis of daily reference evapotranspiration in different climate zones of China. Phys. A Stat. Mech. Appl. 2021, 583, 126273. [Google Scholar] [CrossRef]
  29. Standard Map Service System. Available online: http://bzdt.ch.mnr.gov.cn/ (accessed on 5 February 2025).
  30. National Catalogue Service for Geographic Information. Available online: https://www.webmap.cn/main.do?method=index (accessed on 5 February 2025).
  31. Open Street Map. Available online: https://openstreetmap.org (accessed on 7 February 2025).
  32. Ministry of Culture and Tourism of the People’s Republic of China. Available online: https://www.mct.gov.cn/ (accessed on 7 February 2025).
  33. Geospatial Data Cloud. Available online: https://www.gscloud.cn/ (accessed on 7 February 2025).
  34. Huang, C.; Xiao, C.; Rong, L. Integrating Point-of-Interest Density and Spatial Heterogeneity to Identify Urban Functional Areas. Remote. Sens. 2022, 14, 4201. [Google Scholar] [CrossRef]
  35. Xiong, C.; Ren, H.; Xu, D.; Gao, Y. Spatial scale effects on the value of ecosystem services in China’s terrestrial area. J. Environ. Manag. 2024, 366, 13. [Google Scholar] [CrossRef]
  36. Hambrecht, L.; Lucieer, A.; Malenovský, Z.; Melville, B.; Ruiz-Beltran, A.P.; Phinn, S. Considerations for assessing functional forest diversity in high-dimensional trait space derived from drone-based lidar. Remote. Sens. 2022, 14, 4287. [Google Scholar] [CrossRef]
  37. Yang, C.; Zhan, Q.; Gao, S.; Liu, H. Characterizing the spatial and temporal variation of the land surface temperature hotspots in Wuhan from a local scale. Geo-Spatial Inf. Sci. 2020, 23, 327–340. [Google Scholar] [CrossRef]
  38. Chen, X.; Xie, W.; Li, H. The spatial evolution process, characteristics and driving factors of traditional villages from the perspective of the cultural ecosystem: A case study of Chengkan Village. Habitat Int. 2020, 104, 102250. [Google Scholar] [CrossRef]
  39. Liu, H.; Huang, B.; Yang, C. Assessing the coordination between economic growth and urban climate change in China from 2000 to 2015. Sci. Total. Environ. 2020, 732, 139283. [Google Scholar] [CrossRef]
  40. Qi, J.; Lu, Y.; Han, F.; Ma, X.; Yang, Z. Spatial distribution characteristics of the rural tourism villages in the Qinghai-Tibetan Plateau and its influencing factors. Int. J. Environ. Res. Public Health 2022, 19, 9330. [Google Scholar] [CrossRef]
  41. Xu, H.; Xiao, W.; Zhang, S.; Fan, Y.; Kang, X.; Han, Y.; Zhou, T. Exploring determinants of freeway service area usage in the context of sustainable and collaborated development for transport and tourism. Transp. Res. Part A Policy Pract. 2024, 185, 104124. [Google Scholar] [CrossRef]
  42. Kongbuamai, N.; Zafar, M.W.; Zaidi, S.A.H.; Liu, Y. Determinants of the ecological footprint in Thailand: The influences of tourism, trade openness, and population density. Environ. Sci. Pollut. Res. 2020, 27, 40171–40186. [Google Scholar] [CrossRef]
  43. Xie, X.; Zhang, L.; Sun, H.; Chen, F.; Zhou, C. Spatiotemporal difference characteristics and influencing factors of tourism urbanization in China’s major tourist cities. Int. J. Environ. Res. Public Health 2021, 18, 10414. [Google Scholar] [CrossRef]
  44. Karimian, H.; Zou, W.; Chen, Y.; Xia, J.; Wang, Z. Landscape ecological risk assessment and driving factor analysis in Dongjiang river watershed. Chemosphere 2022, 307, 135835. [Google Scholar] [CrossRef]
  45. Li, D.G. William Skinner (1925–2008) andnew studies of Chinese regional history: Introduction. Chin. Stud. Hist. 2018, 51, 301–304. [Google Scholar] [CrossRef]
  46. Sheng, S.; Pan, H.; Ning, L.; Zhang, Z.; Xue, Q. An Examination of the Spatial Distribution Patterns of National-Level Tourism and Leisure Districts in China and Their Underlying Driving Factors. Buildings 2024, 14, 3620. [Google Scholar] [CrossRef]
  47. Nie, Z.; Chen, C.; Pan, W.; Dong, T. Exploring the dynamic cultural driving factors underlying the regional spatial pattern of Chinese traditional villages. Buildings 2023, 13, 3068. [Google Scholar] [CrossRef]
  48. Zerbe, S. Restoration of Multifunctional Cultural Landscapes: Merging Tradition and Innovation for a Sustainable Future; Springer Nature: Berlin/Heidelberg, Germany, 2022; Volume 30. [Google Scholar]
  49. Nocca, F. The role of cultural heritage in sustainable development: Multidimensional indicators as decision-making tool. Sustainability 2017, 9, 1882. [Google Scholar] [CrossRef]
  50. Mu, Q.; Aimar, F. How are historical villages changed? A systematic literature review on European and Chinese cultural heritage preservation practices in rural areas. Land 2022, 11, 982. [Google Scholar] [CrossRef]
  51. Angrisano, M.; Nocca, F.; Scotto Di Santolo, A. Multidimensional evaluation framework for assessing cultural heritage adaptive reuse projects: The case of the seminary in Sant’Agata de’Goti (Italy). Urban Sci. 2024, 8, 50. [Google Scholar] [CrossRef]
  52. Sardaro, R.; La Sala, P.; De Pascale, G.; Faccilongo, N. The conservation of cultural heritage in rural areas: Stakeholder preferences regarding historical rural buildings in Apulia, southern Italy. Land Use Policy 2021, 109, 105662. [Google Scholar] [CrossRef]
  53. Tuitjer, G.; Steinführer, A. The scientific construction of the village. Framing and practicing rural research in a trend study in Germany, 1952–2015. J. Rural. Stud. 2021, 82, 489–499. [Google Scholar] [CrossRef]
  54. Law, L.Y.; Chen, H.; Liu, S.; Cheung, M.H. Top-down rural heritage revitalization and economic development: A case study of Tangwei village, Dongguan, Guangdong, China. J. Chin. Archit. Urban 2025, 7, 5029. [Google Scholar] [CrossRef]
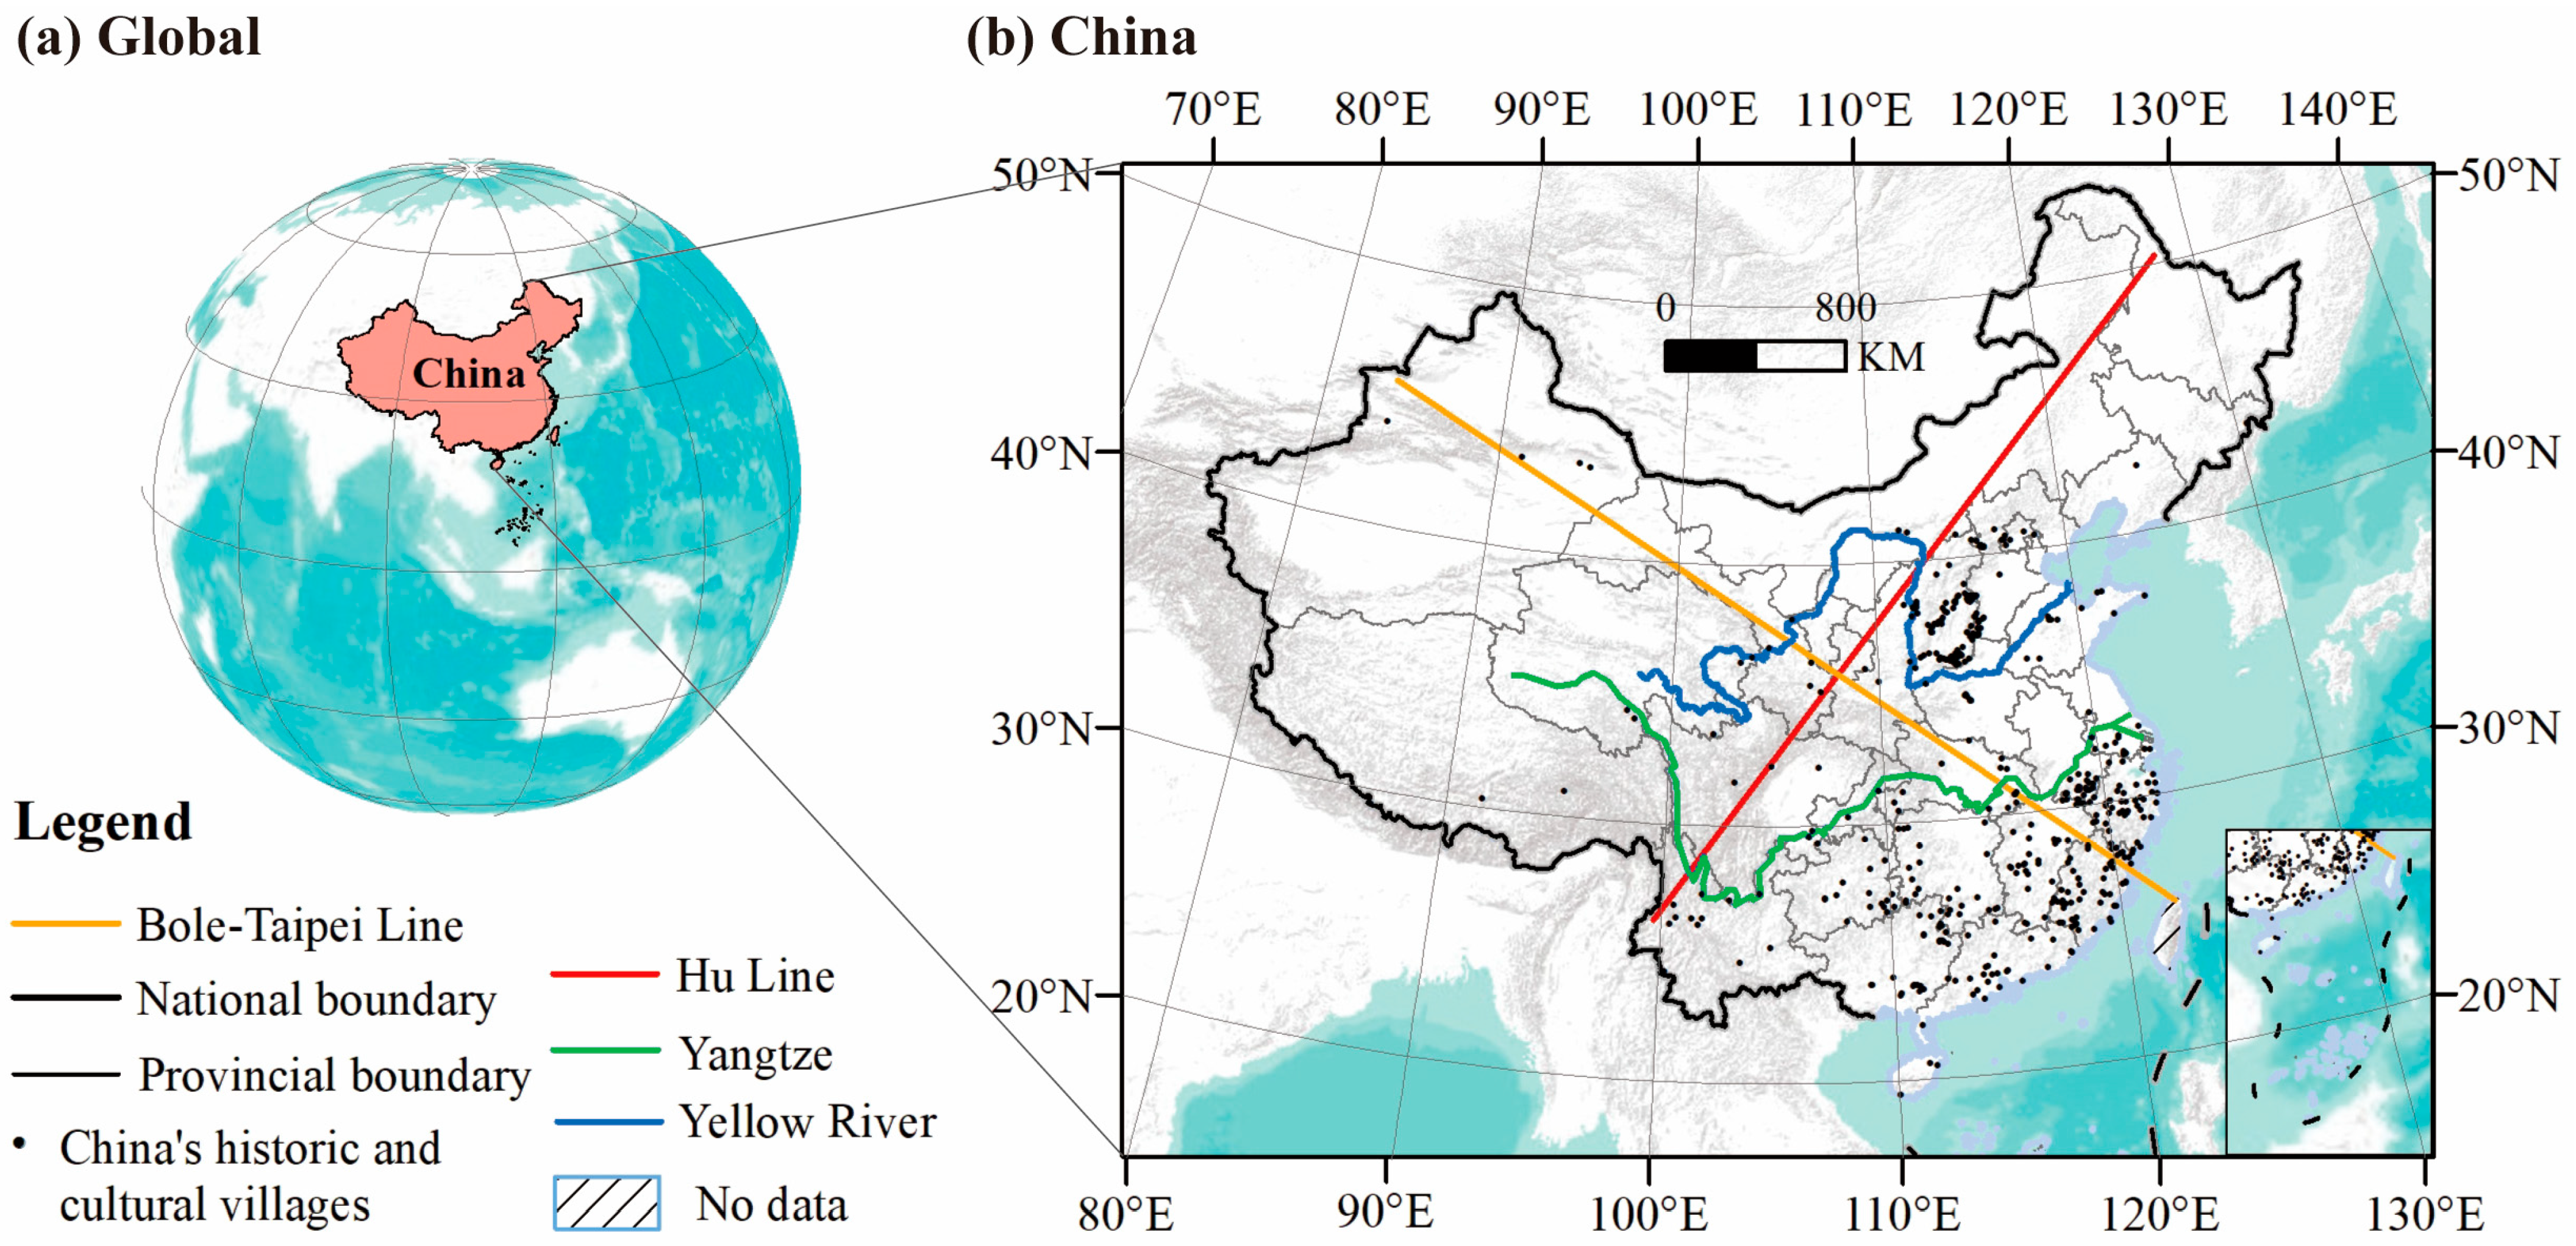
Figure 1. Geographic location of China. Note: The China map is based on the standard map service website of the Ministry of Natural Resources of the People’s Republic of China, with the examination approval number GS (2024) 00650.
Buildings 15 03507 g001
Figure 2. Methodological framework and technical workflow.
Buildings 15 03507 g002
Figure 3. Spatial distribution of Historic and Cultural Villages in China. Note: Figure (a) represents the quantity of Chinese Famous Historical and Cultural Villages in each province; Figure (b) illustrates the spatial distribution characteristics of Chinese Famous Historical and Cultural Villages.
Buildings 15 03507 g003
Figure 4. Nearest Neighbor Index of China’s Historic and Cultural Villages.
Buildings 15 03507 g004
Figure 5. Moran’s I Analysis of Chinese Famous Historical and Cultural Villages.
Buildings 15 03507 g005
Figure 6. Kernel density and provincial distribution of China’s historic and cultural villages.
Buildings 15 03507 g006
Figure 7. Standard deviational ellipses and centroid shifts in China’s historic and cultural villages.
Buildings 15 03507 g007
Figure 8. Spatial Relationship between Historic and Cultural Villages and Elevation. Note: (a) Coupling analysis of the spatial distribution of historic and cultural villages with elevation in China; (b) Spatial distribution curves of villages across different elevation ranges.
Buildings 15 03507 g008
Figure 9. Spatial relationship between historic and cultural villages, slope, and aspect. Note: (a) Coupling analysis of village distribution and slope; (b) Spatial distribution curves of villages across different slope intervals; (c) Coupling analysis of village distribution and aspect; (d) Spatial distribution curves of villages across different aspect intervals.
Buildings 15 03507 g009
Figure 10. Spatial relationships between historic and cultural villages and climatic factors. Note: (a) Coupling analysis between the spatial distribution of historic and cultural villages and mean annual temperature; (b) Spatial distribution curves of villages across different temperature intervals; (c) Coupling analysis between the spatial distribution of historic and cultural villages and mean annual precipitation; (d) Spatial distribution curves of villages across different precipitation intervals.
Buildings 15 03507 g010
Figure 11. Spatial relationship between historic and cultural villages and river systems. Note: (a) Coupling analysis of river system buffer zones and the spatial distribution of historic and cultural villages in China; (b) Spatial distribution curves of villages within different river system buffer zones.
Buildings 15 03507 g011
Figure 12. Spatial relationship between China’s historical and cultural villages and socio-economic conditions. Note: (a) GDP (0.1 billion USD); (b) Per Capita Expenditure (Dollar); (c) Per Capita Disposable Income (Dollar); (d) Urbanization rate (%); (e) Value-added of the Tertiary Industry (0.1 billion USD); (f) Total tourism revenue in 2024 (0.1 billion USD).
Buildings 15 03507 g012
Figure 13. Relationship between Historic and Cultural Villages and Road Transportation in China. Note: (a) Coupling analysis between national highway buffer zones and the spatial distribution of historic and cultural villages; (b) Spatial distribution curve of historic and cultural villages within national highway buffer zones.
Buildings 15 03507 g013
Figure 14. Relationship between Historic and Cultural Villages and Visitor Market. Note: (a) Coupling analysis of village spatial distribution and population density; (b) Spatial distribution curves of villages across different population density intervals; (c) Coupling analysis of village spatial distribution and urban buffers; (d) Spatial distribution curves of villages within urban buffer zones.
Buildings 15 03507 g014
Figure 15. Relationship between Historic and Cultural Villages and Tourism Resources in China. Note: (a) Coupling analysis of Historic and Cultural Village distribution with 5A-rated scenic areas; (b) Number of Historic and Cultural Villages and 5A-rated scenic areas across provinces; (c) Coupling analysis of Historic and Cultural Village spatial distribution with nighttime light intensity; (d) Spatial distribution curves of Historic and Cultural Villages across different nighttime light intensity intervals; (e) Coupling analysis of Historic and Cultural Village distribution with the number of accommodation facilities; (f) Spatial distribution curves of Historic and Cultural Villages across different accommodation facility quantity intervals.
Buildings 15 03507 g015
Figure 16. Single-factor and two-factor interaction detection results for influencing factors of Historic and Cultural Villages in China. Notes: Panel (a) shows the single-factor detection results; panel (b) shows the two-factor interaction detection results. The factors are defined as follows: X1: elevation; X2: slope; X3: aspect; X4: mean annual temperature; X5: mean annual precipitation; X6: distance to nearest river system; X7: GDP; X8: per capita consumption expenditure; X9: per capita disposable income; X10: urbanization rate; X11: tertiary industry value added; X12: total tourism revenue in 2024; X13: number of transportation service facilities; X14: highway passenger volume; X15: length of grade highways; X16: railway passenger volume; X17: population density; X18: average distance to nearest administrative city; X19: 5A-rated scenic areas; X20: annual average nighttime light intensity; X21: number of accommodation facilities. Symbol meanings: * indicates nonlinear enhancement [q (Xi ∩ Xj) > (Xi + Xj)]; + indicates two-factor interaction enhancement [q (Xi ∩ Xj) > max (Xi, Xj)].
Buildings 15 03507 g016
Table 1. Data sources and their applications.
Data TypeIndexTimeSpatial ResolutionUsageSource
Vector dataBase map of administrative boundaries in China2024Natural resources Standard map service website [29]
River system2024Analysis of distance between villages and river systemNational geographic information resources directory service system [30]
National highway2024Analysis of distance between villages and national highwayOpen Street Map (OSM) is an open source platform [31]
Vector point data of 5A-rated tourist attractions2024Used to explore driving factorsMinistry of Culture and Tourism of the People’s Republic of China website [32]
Raster dataDEM202430 mRegional topographic analysisGeospatial data cloud platform [33]
Statistical dataAnnual average temperature (°C), annual average precipitation (mm), GDP (US dollars), per capita disposable income of residents (US dollars), per capita consumption expenditure of residents (US dollars), urbanization rate (%), added value of the tertiary industry (US dollars), number of transportation service facilities (units), mileage of graded highways (km), road passenger volume (ten thousand people), railway passenger volume (ten thousand people), population Density (per 10,000 people/km2), annual average lighting value of the province (lux), number of accommodation service facilities (units)2024Used to explore driving factorsChina Statistical Yearbook, Statistical Yearbook of provincial administrative Regions, Statistical Bulletin of National Economic and Social Development
Table 2. Indicator System of Factors Influencing the Spatial Distribution of Historic and Cultural Villages in China.
Driving FactorsIndexIndex InterpretationUnit
Natural Geography [38]ElevationAverage elevation of each province (X1)m
SlopeAverage slope of each province (X2)°
AspectAverage aspect of each province (X3)°
TemperatureAnnual average temperature of each province (X4)°C
PrecipitationAnnual average precipitation of each province (X5)mm
River SystemsAverage shortest distance from historical and cultural famous villages to water systems of Grade III or above in China (X6)m
Socioeconomic Conditions [40]Economic development levelTotal GDP of each province (X7)USD
Residents’ consumption capacityPer capita consumption expenditure of residents (X8)USD
Residents’ income capacityPer capita disposable income of residents (X9)USD
Urbanization levelUrbanization rate (X10)%
Economic development level of the tertiary industryAdded value of the tertiary industry (X11)USD
Annual tourism revenueAnnual tourism revenue of each province (X12)USD
Transportation Accessibility [41]Number of transportation service facilities Number of transportation service facilities in each province (X13)unit
Highway passenger volumeHighway passenger volume of each province (X14)Ten thousand people
Mileage of classified highwaysMileage of classified highways in each province (X15)km
Railway passenger volumeRailway passenger volume of each province (X16)Ten thousand people
Tourist Market [42]Population sizePopulation density (X17)Person/km2
Distance from tourist source areasAverage shortest distance from historical and cultural famous villages to the nearest administrative city (X18)m
Tourism Resources [43]High-A-grade tourist attractionsNumber of 5A-grade tourist attractions (X19)unit
Nighttime lighting constructionAnnual average nighttime light intensity of each province (X20)Lux
Number of accommodation service facilitiesNumber of accommodation service facilities in each province (X21)unit
Table 3. Analysis of the density differences in historical and cultural famous villages (villages) on both sides of the Hu Huanyong Line and the Bole–Taipei Line based on independent samples t-test results.
GroupsMean ± Standard Deviationtdfp
Southeast of the Hu Huanyong Line0.80 ± 0.754.81423.7310.000 **
Northwest of the Hu Huanyong Line0.04 ± 0.05
Northeast of the Bole–Taipei Line0.92 ± 0.773.63622.5100.001 **
Southwest of the Bole–Taipei Line0.22 ± 0.26
** p < 0.1.
Table 4. Standard Deviational Ellipse Parameters of China’s Historic and Cultural Villages.
BatchLength/kmAngle/°Central Coordinate
X-AxisY-AxisLongitudeLatitude
All batches738.7521863.7777158.210182°10′45″ E33°06′14″ N
The first batch1007.8483208.912164.6658100°47′05″ E32°05′21″ N
The second batch794.01271019.253150.12163°23′18″ E34°00′39″ N
The third batch655.7251873.90254.86025885°17′03″ E32°29′04″ N
The fourth batch732.428869.1536138.278769°34′35″ E32°33′58″ N
The fifth batch760.9651018.645137.693879°35′29″ E32°06′02″ N
The sixth batch952.6357705.028683.7780881°49′45″ E31°51′08″ N
The seventh batch571.8203863.9599169.066385°37′56″ E34°04′25″ N
Disclaimer/Publisher’s Note: The statements, opinions and data contained in all publications are solely those of the individual author(s) and contributor(s) and not of MDPI and/or the editor(s). MDPI and/or the editor(s) disclaim responsibility for any injury to people or property resulting from any ideas, methods, instructions or products referred to in the content.