1. Introduction
Achieving carbon neutrality in the building sector is essential for fulfilling international climate targets and advancing Sustainable Development Goal 7 (SDG 7), which mandates universal access to affordable, reliable, sustainable, and modern energy. Buildings now account for ~30% of global final energy consumption and more than half of electricity use, making their decarbonization pivotal for energy efficiency gains and emissions reductions [
1]. Improving building energy efficiency through retrofits, electrification and deployment of low-carbon heating technologies supports progress toward net zero emissions pathways [
2]. In parallel, regulatory measures such as the European Union’s F-gas Regulation are accelerating the phase-down of high-global-warming-potential synthetic refrigerants, prompting intensive research into natural refrigerants with superior environmental performance [
3]. Carbon dioxide (CO
2, R744) is particularly attractive due to its negligible direct global warming potential, non-toxicity, non-flammability, chemical stability, abundance as an industrial by-product, and favorable thermophysical properties [
4]. Among low-carbon heating technologies, transcritical CO
2 heat pumps (CO
2HP) have demonstrated high energy efficiency, the capability to deliver high-temperature heat, and operational safety, making them a strong candidate for large-scale deployment in sustainable building heating systems [
5].
With the increasing application of CO
2 heat pump technology in electric vehicle thermal management [
6,
7,
8] and ongoing research into high temperature process heating [
9,
10], CO
2HPs for domestic hot water production in buildings have attracted significant research attention, as highlighted in several recent reviews [
11,
12,
13]. These systems are particularly valued for the stable production of water and the convenience of hot water storage. In Japan, CO
2HP water heaters have been widely implemented in residential households [
14], typically operating at suction pressures of 40–45 bar and discharge pressures of 90–100 bar. These operating conditions present technical challenges, including heat leakage during operation and the need for heat exchangers capable of withstanding high pressures. A case study in Japan reported a heating COP of 3.4 and a heating capacity of 3.5 kW for raising water temperature from 8 °C to 65 °C under an ambient temperature of 8 °C [
15]. In China, a transcritical CO
2HP water heater was developed to deliver hot water up to 75 °C, demonstrating that higher COP values can be achieved by minimizing the gas cooler outlet temperature [
16]. Another investigation in a hotel application evaluated the long-term performance of a CO
2HP water heater [
17]. The unit operated with an inlet water temperature of 10.97 °C and a supply temperature of 60 °C, maintaining a discharge pressure of ~91 bar. After two years, the annual performance factor decreased from 4.12 to 2.57, corresponding to a 37.6% reduction in efficiency. More recently, a transcritical CO
2 quasi two stage compression heat pump with an ejector was proposed to improve operation in low ambient temperature conditions. At an ambient temperature of 0 °C and a discharge pressure of 104 bar, the compressor discharge temperature was maintained at 85.77 °C [
18]. Comparative studies have shown that CO
2HP water heaters perform competitively in cold climates, such as in tests against propane air to water heat pumps [
19] and in performance comparisons between fin and tube and microchannel evaporators [
20], although their efficiency in warm or moderate climates leaves room for improvement. Wang et al. [
11] summarized advanced strategies for addressing these performance limitations, including optimization of operating parameters, adoption of multi-stage cycles, improved component design, and the development of novel heat exchanger configurations.
Due to the diverse practical constraints inherent in CO
2HP experiments, the aforementioned advanced strategies are predominantly investigated through simulation models. Tao et al. [
21] numerically analyzed the influence of key operating parameters on the heating COP, including discharge pressure, gas cooler inlet and outlet temperatures, and evaporator temperature. Chen et al. [
22] optimized the discharge pressure based on minimization of the gas cooler pinch point, establishing a mapping relationship between gas cooler outlet temperature and optimal discharge pressure. Yamaguchi et al. [
23] examined the effects of inlet water temperature and ambient air temperature on heating COP for an air source CO
2HP water heater, whereas Yang et al. [
24] investigated the influence of water mass flow rate and inlet temperature on both the evaporator and gas cooler. Liu et al. [
25] proposed a predictive correlation linking discharge pressure with gas cooler outlet temperature, showing that for outlet temperatures of 35 °C, 40 °C, and 45 °C, the corresponding optimal discharge pressures were below 10.75 MPa, 11.17 MPa, and 11.63 MPa, respectively. Overall, these studies consistently indicate that both discharge pressure and gas cooler outlet temperature exert a significant influence on system performance, and that the optimal discharge pressure is strongly dependent on the evaporation temperature.
In parallel, simulation models also serve as a valuable approach for identifying strategies to reduce discharge pressure and improve the efficiency of CO
2HPs through the investigation of system and component modifications. Incorporating an internal heat exchanger (IHX) into the system has been shown to reduce the optimal discharge pressure and increase the COP compared to the basic configuration [
26]. Yamaguchi et al. [
23] developed a steady-state mathematical model of a CO
2 heat pump equipped with a twin-tube IHX and reported that the addition of the IHX increased the COP to as high as 3.5, while also improving heat transfer in both the gas cooler and the evaporator. Jiang et al. [
27] employed a double-pipe copper IHX, where the high-pressure CO
2 flowed through the inner pipe and the low-pressure CO
2 occupied the annular space between the inner and outer pipes. Their experimental results indicated that, at a gas cooler outlet temperature of 15 °C, the system with the IHX achieved a 6.5–11.5% higher COP than the system without it. Furthermore, the integration of two-phase ejectors and multi-ejector configurations has been proposed to reduce throttling losses and improve system performance [
28]. Additional enhancements can be achieved through two-stage compression and subcooling cycles, with mechanical subcooling (applied downstream of the gas cooler) and two-stage parallel compression systems reported as among the most effective configurations [
29,
30]. These approaches are primarily based on steady-state optimization, which serves as the foundation for system improvement; however, transient analyses remain limited despite their importance in enhancing the long-term operational efficiency of CO
2HPs.
The relatively high degree of freedom between gas cooler pressure and outlet temperature in CO
2HPs enables the exploitation of certain steady state characteristics to enhance transient operation. Okasha et al. [
31] employed a bi-objective optimization framework to balance the trade-off between heating capacity and COP. Their results demonstrated that heating capacity could be increased by 131% with a COP of 2.8 at a discharge pressure of 140 bar for rapid heating scenarios, whereas COP could be maximized to 5.8 at a discharge pressure of 77.5 bar once thermal comfort conditions were achieved. Liu et al. [
32] developed and experimentally validated a mathematical model to investigate the dynamic performance of CO
2HPs in electric vehicles during start-up. Their approach achieved the fastest start-up process and reduced start-up time by 82.3% under an ambient temperature of −25 °C. Beyond investigations into CO
2 thermodynamic state evolution during start-up, further research has focused on optimizing both start-up duration and system energy efficiency through improved system architectures and control strategies. For example, the integration of a regenerator within the liquid reservoir has been shown to slow CO
2 migration from the air cooling unit to the evaporator following shutdown. This design enhancement accelerated the vaporization rate of liquid CO
2 in the accumulator during start-up, leading to a 54.76% reduction in stabilization time and a 13.84% increase in average system COP [
33].
While the start-up behavior of air-conditioning systems and conventional heat pumps has been extensively investigated, limited attention has been given to the start-up of CO2 systems, particularly CO2HP water heaters. The start-up characteristics of CO2 systems differ markedly from those of other refrigerants and are strongly influenced by the properties of the heat sinks, such as the cabin in electric vehicles or the water tank in water heaters. Despite the increasing installation of CO2HP water heaters in recent years, their market penetration remains modest. The performance of a CO2HP is determined by the system as an integrated whole, yet the design and performance of individual components can significantly influence the overall efficiency. Although the interdependence among components limits the potential for isolated optimization, targeted improvements in component design and a systematic evaluation of their contribution to system performance remain essential. In particular, there is a need for coupled analyses that link transient operating processes, system-level performance, and detailed configuration parameters such as external water tank capacity and heat exchanger circuitry. Such analyses are also critical for laying the groundwork for high-temperature CO2HPs in industrial electrification, an area that has received limited attention to date.
This study seeks to address these gaps by developing a high-fidelity transient model and constructing an experimental prototype of a transcritical CO2 heat pump water heater. The model explicitly incorporates the detailed circuitry of the heat exchangers and the stratification characteristics of the water tank. The investigation examines the influence of pronounced transient phenomena, extended operation with a water tank, and gravitational effects on system dynamics associated with vertical installation. These aspects, which are underrepresented in existing literature, are critical for identifying the practical performance limitations of CO2 heat pump water heaters and informing their design for improved reliability and efficiency in real-world applications.
2. Model Description
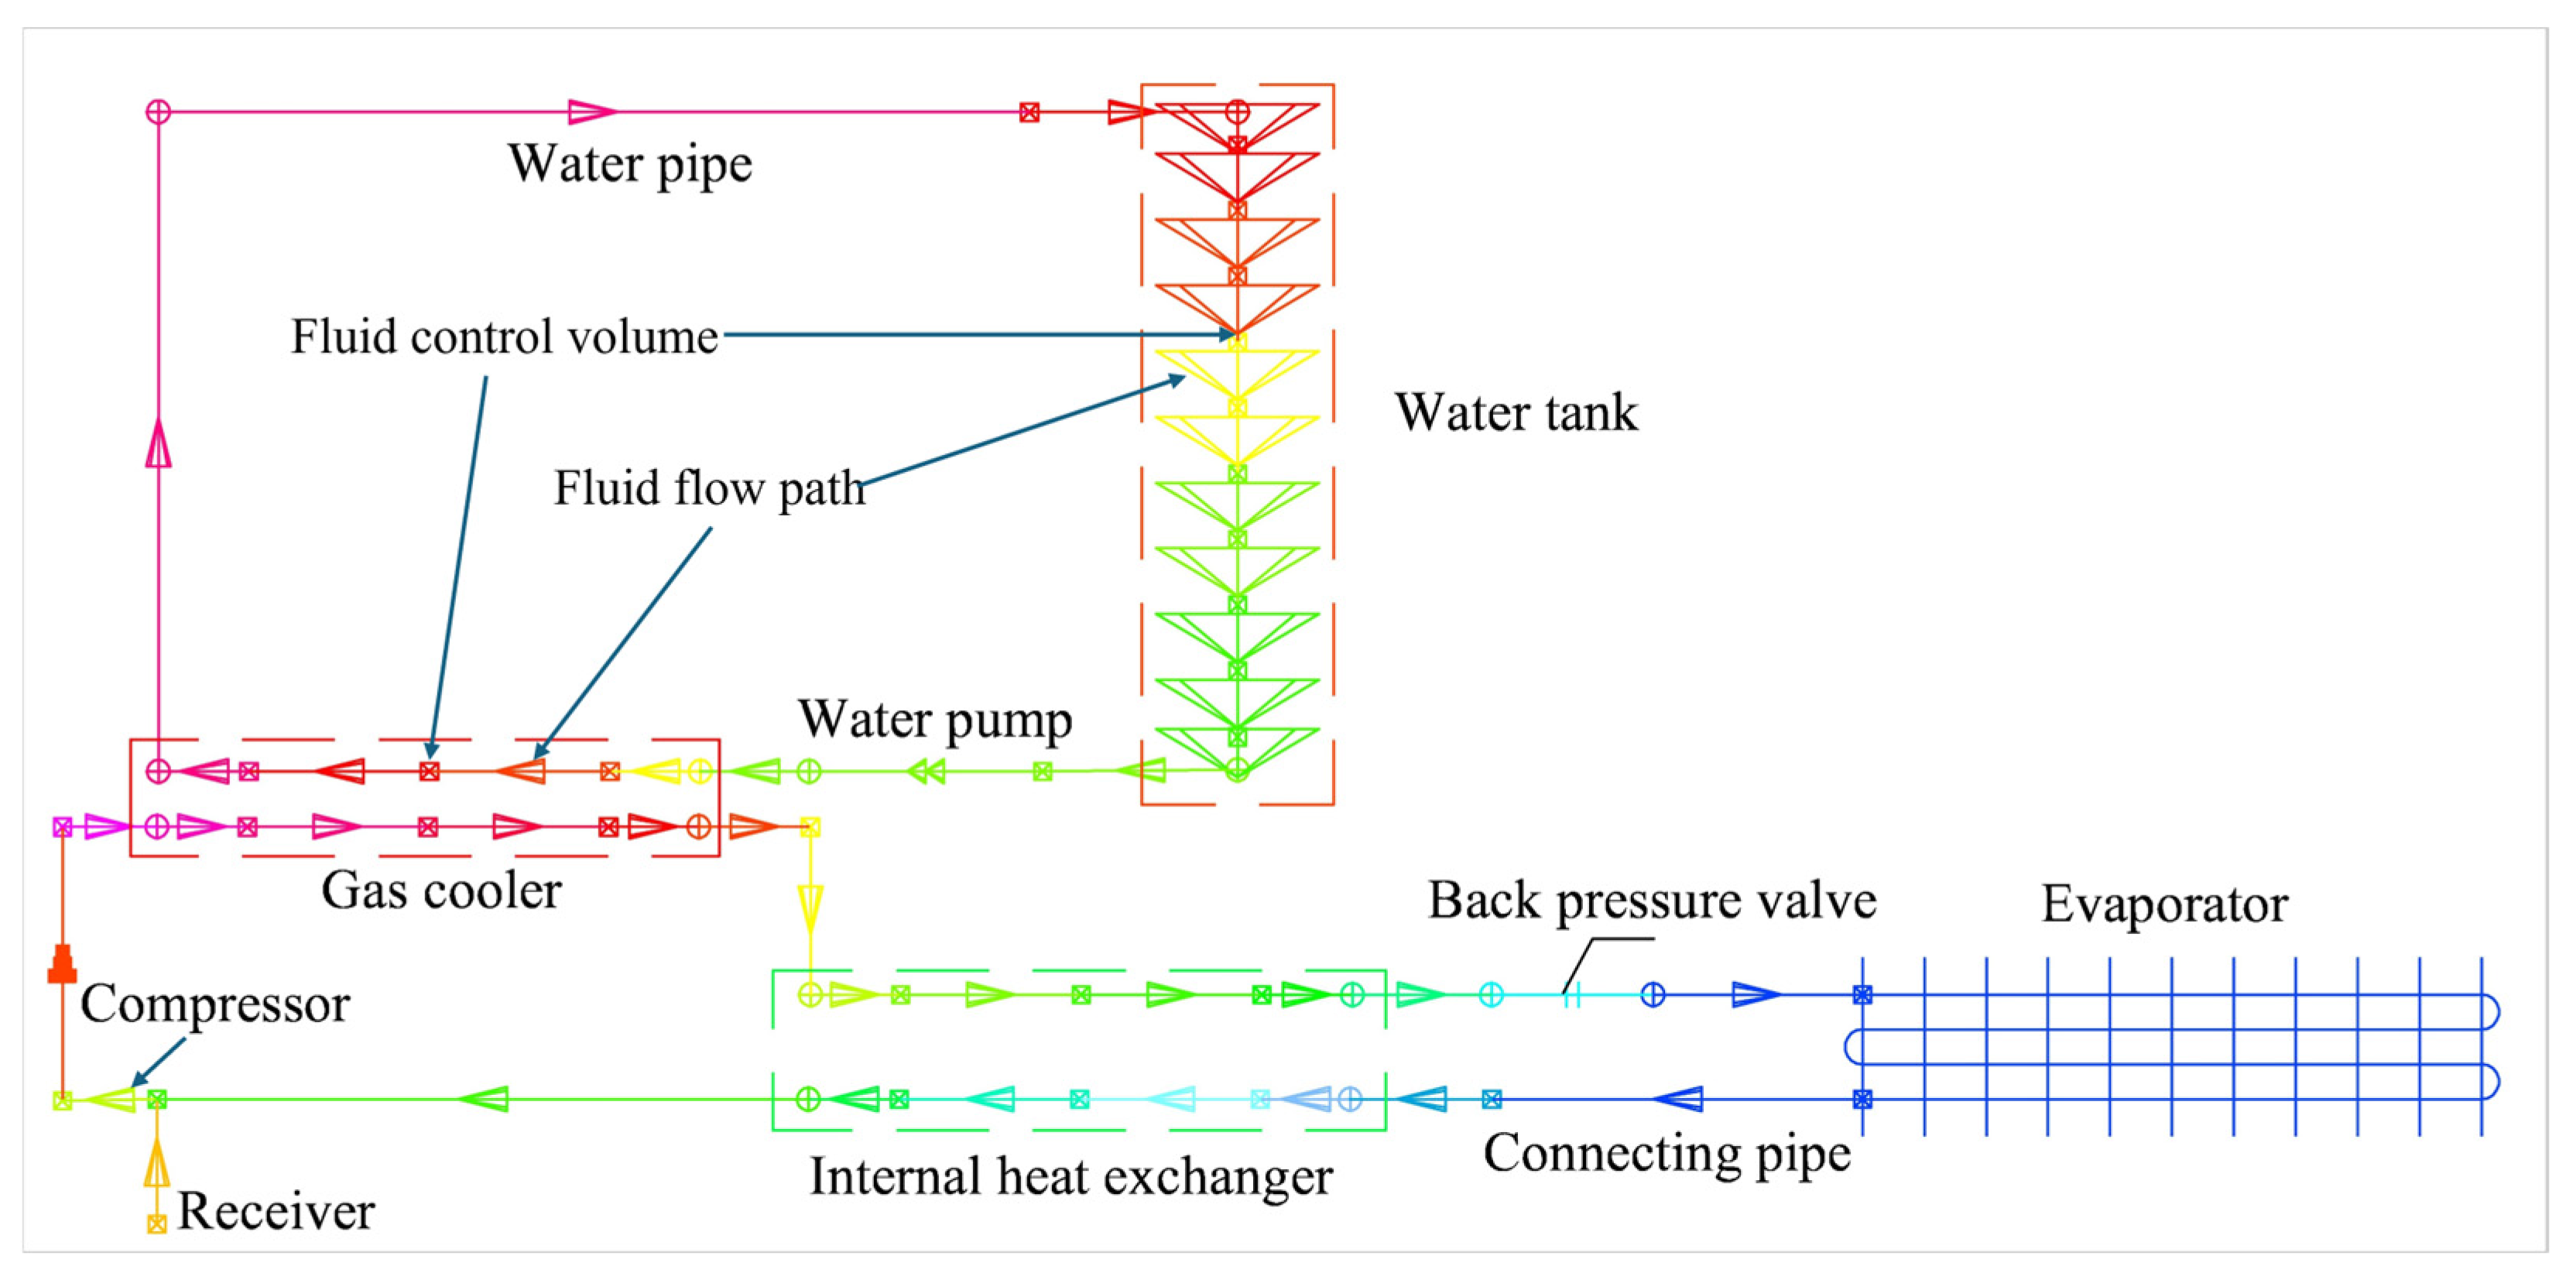
The system model integrates components represented with varying levels of fidelity to balance computational efficiency and physical accuracy. The compressor, throttling valve (back pressure valve), and water pump are modeled as lumped-parameter elements, where performance characteristics are described using experimentally validated empirical correlations. The vapor–liquid separator is implemented using a moving boundary formulation to track phase interface motion and capture transient separation behavior. The evaporator, gas cooler, and IHX are represented by detailed thermal network models that resolve the geometry-specific circuitries, enabling accurate prediction of distributed temperature and pressure fields. The water tank model incorporates a gravitational term to account for buoyancy-driven thermal stratification, allowing the interaction between tank dynamics and system transients to be quantified. All components are thermally and hydraulically coupled, including gravitational effects, through the conservation equations of mass, momentum, and energy. The system is solved within a time-dependent framework to capture both transient start-up dynamics and long-term operational behavior, as detailed in Refs. [
34,
35]. A schematic representation of the modeled transcritical CO
2HP cycle, including its integration with a closed-loop water circuit and stratified storage tank, is shown in
Figure 1.
All components were modeled based on the five fundamental elements which were summarized in
Table 1. The thermophysical properties of the working fluid were obtained from look-up tables generated using the NIST REFPROP dynamic link library [
36]. Pressure drops include both frictional and acceleration components. The stratified water tank model applies the energy balance in discrete horizontal layers, with the buoyancy term accounting for density gradients induced by temperature differences. Gravitational effects are incorporated as a body-force term, interpreted as a superimposed pressure gain or loss along each flow path. This pressure contribution depends on the effective density of the path and the scalar product between the gravitational acceleration vector and the path vector, where the path vector is defined from the upstream lump to the downstream control volume.
In the lumped-parameter compressor model, the mass flow rate is determined from a semi-empirical volumetric efficiency correlation, and the power consumption is obtained from the isentropic efficiency relation, with refrigerant thermophysical properties evaluated using REFPROP 10.0. The throttling valve is modeled as an isenthalpic expansion device, where the mass flow rate is calculated from an orifice flow equation incorporating a discharge coefficient and the upstream–downstream pressure difference. The water pump model applies manufacturer performance curves to relate volumetric flow rate to head and power draw. In the moving boundary model for the vapor–liquid separator, the refrigerant domain is divided into saturated liquid, saturated vapor, and two-phase regions, with the phase interface position tracked using the mass and energy balances across control volumes. The distributed-parameter heat exchanger models (evaporator, gas cooler, and IHX) solve the one-dimensional form of the conservation equations throughout the thermal network, discretized into finite control volumes. Heat transfer coefficients are determined from refrigerant-side correlations selected for transcritical CO2 (e.g., Cavallini–Zecchin for in-tube condensation and Gnielinski for supercritical heat transfer) and from water-side correlations appropriate to the channel geometry.
2.1. Compressor
The compressor model is based on the characterization of volumetric efficiency (
) and overall isentropic efficiency (
), which govern the mass flow rate and power consumption, respectively. Volumetric efficiency is defined as the ratio of the actual volumetric flow rate of refrigerant entering the compressor to the theoretical geometric displacement volume and depends on the pressure ratio and suction superheat for the trochoidal compressor type considered. Empirical correlations for
and
were derived by fitting experimental data and are provided as functions of the pressure ratio
and suction superheat
:
By combining Equations (1) and (2), and the definitions of
and
, once the suction and discharge states are specified, the mass flow rate, power consumption, and efficiency of the compressor can be fully determined. Consequently, the compressor can be implemented as a fluid flow path model with frameworks shown in
Table 1.
2.2. Back Pressure Valve
The back pressure valve implemented in the prototype is modeled as a sharp-edged orifice. The valve is assumed to operate under isenthalpic conditions. Two primary parameters characterize the valve behavior: the mass flow rate and the isenthalpic process, described by the following relations:
where
is the orifice cross-sectional area,
is the fluid density,
is the velocity coefficient (assumed to be 0.98), and
is the contraction coefficient. The flow area
represents the effective flow passage area, and
denotes the pressure drop experienced by the fluid as it flows through the orifice section.
The contraction coefficient
depends on the Reynolds number
Re and is defined as
For
Re > 2500
where the Reynolds number Re is calculated based on the flow properties upstream of the valve. Consistent with the compressor model, the mass flow rate through the valve is determined by the thermodynamic states at the upstream and downstream boundaries. Accordingly, the back pressure valve is incorporated into the system simulation as a fluid flow path framework shown in
Table 1.
2.3. Heat Exchanger
The heat exchanger model, incorporating detailed refrigerant circuitry and air-side flow distribution, was implemented using the resistance–capacitance network framework described in Liang et al. [
35]. In this approach, refrigerant and air streams are discretized into interconnected control volumes, with thermal and hydraulic interactions represented by a network of flow paths and junctions. The geometric configuration of tubes, fins, and headers, as well as the refrigerant circuit arrangement, are explicitly represented, enabling accurate prediction of local temperature, pressure, and phase distribution. The local heat transfer and frictional pressure drop coefficients (Nusselt number
Nu and friction factor
f) were determined using empirical and semi-empirical correlations summarized in
Table 2. The gravitational pressure drop within the heat exchanger was assumed negligible due to the relatively small elevation differences between control volumes. A schematic of the modeled heat exchanger configuration is provided in
Figure 2.
4. Results and Discussion
In this section, the experimental data are used to validate the model, which is then combined with simulation results to assess the overall performance of the CO2HP. The validated model is further employed to investigate the internal characteristics and transient behavior of the CO2HP water heater. Additionally, the dynamic process of heating the water tank over a 10-h period and the gravitational effects of different vertical installation layouts are analyzed.
4.1. Model Validation
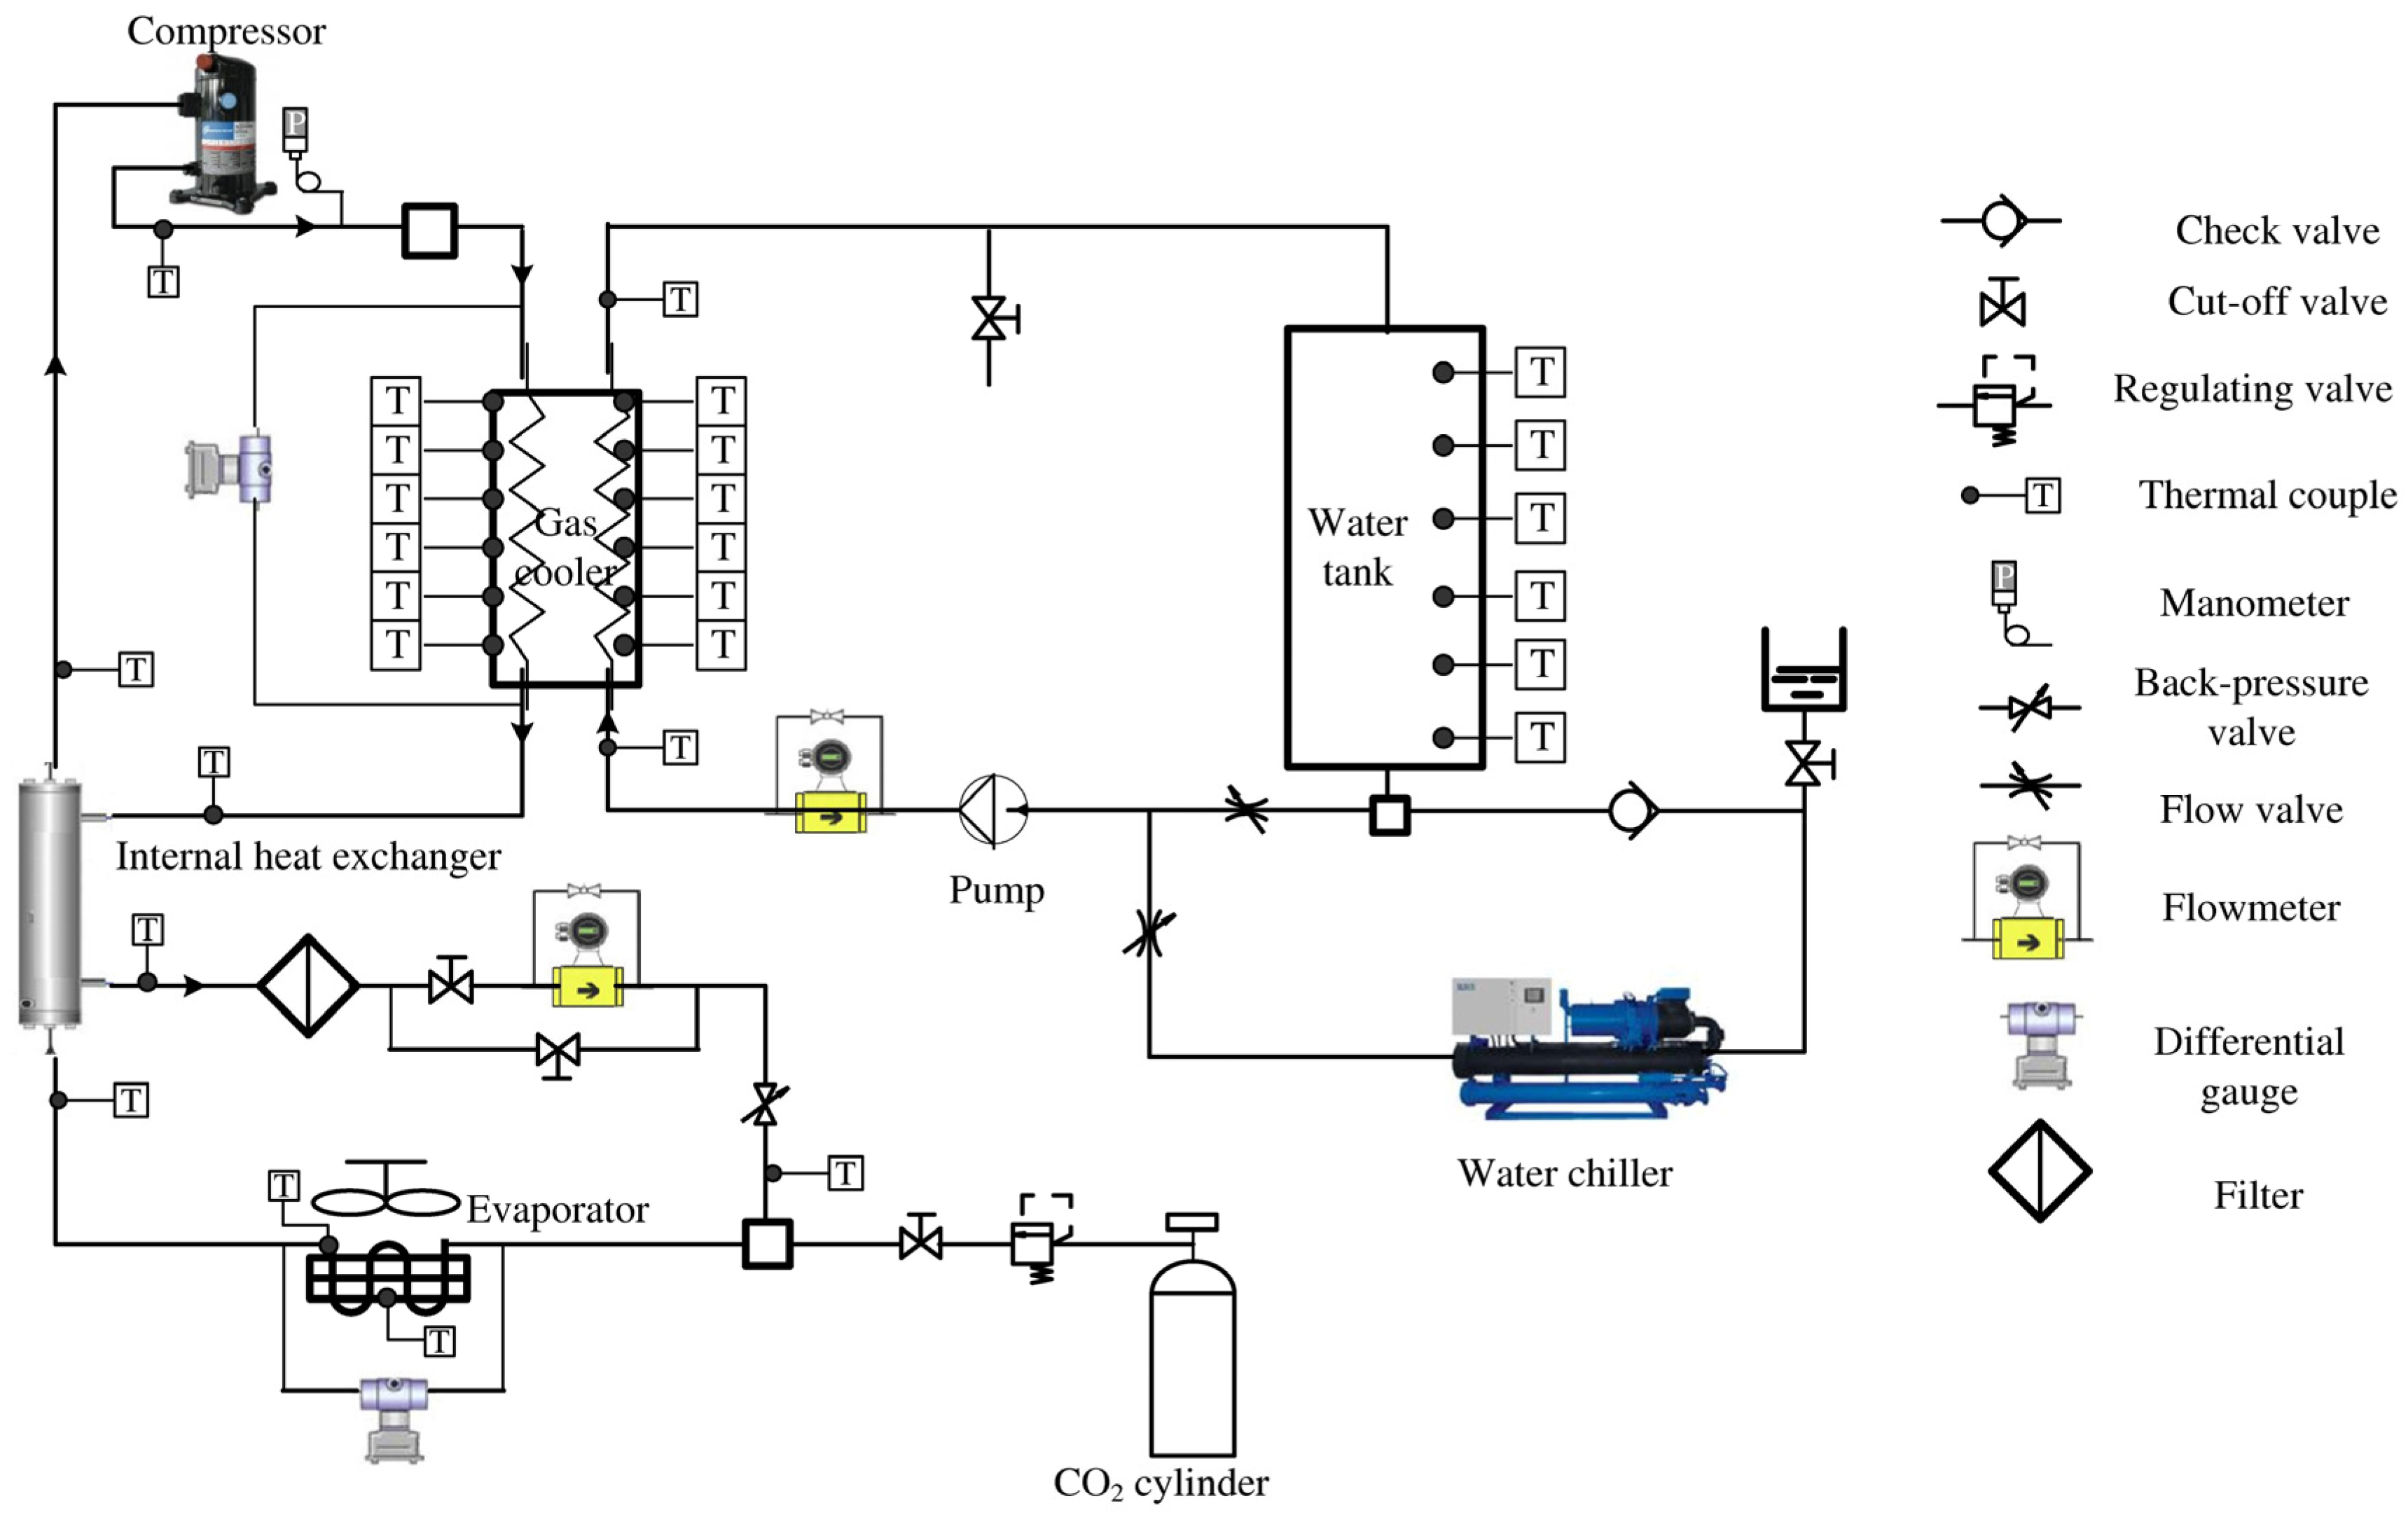
A total of over 160 data points were collected from the experimental tests described above for model validation.
Figure 4 compares the predicted temperatures at the inlet and outlet of each component with the corresponding measured values. The results demonstrate that the model accurately reproduces the thermal behavior of the CO
2 heat pump system. Overall, the predicted values show good agreement with the experimental measurements, with an average deviation of 3.4% and a maximum deviation of 10.7%. These results confirm that the developed model is reliable for simulating system performance under the tested operating conditions.
The observed discrepancies can be attributed to several factors. First, measurement uncertainties from thermocouples, pressure sensors, and flow meters contribute to deviations between measured and predicted values. Second, empirical heat transfer and pressure drop correlations may not fully capture the detailed flow and heat transfer characteristics of the specific heat exchanger geometries used. Third, the model assumes steady-state operation for each data point, whereas small fluctuations in compressor speed, refrigerant charge distribution, and water flow during testing may introduce additional transient effects. Despite these sources of error, the overall agreement indicates that the model can be applied for performance prediction and further parametric studies.
4.2. Heat Pump Performance
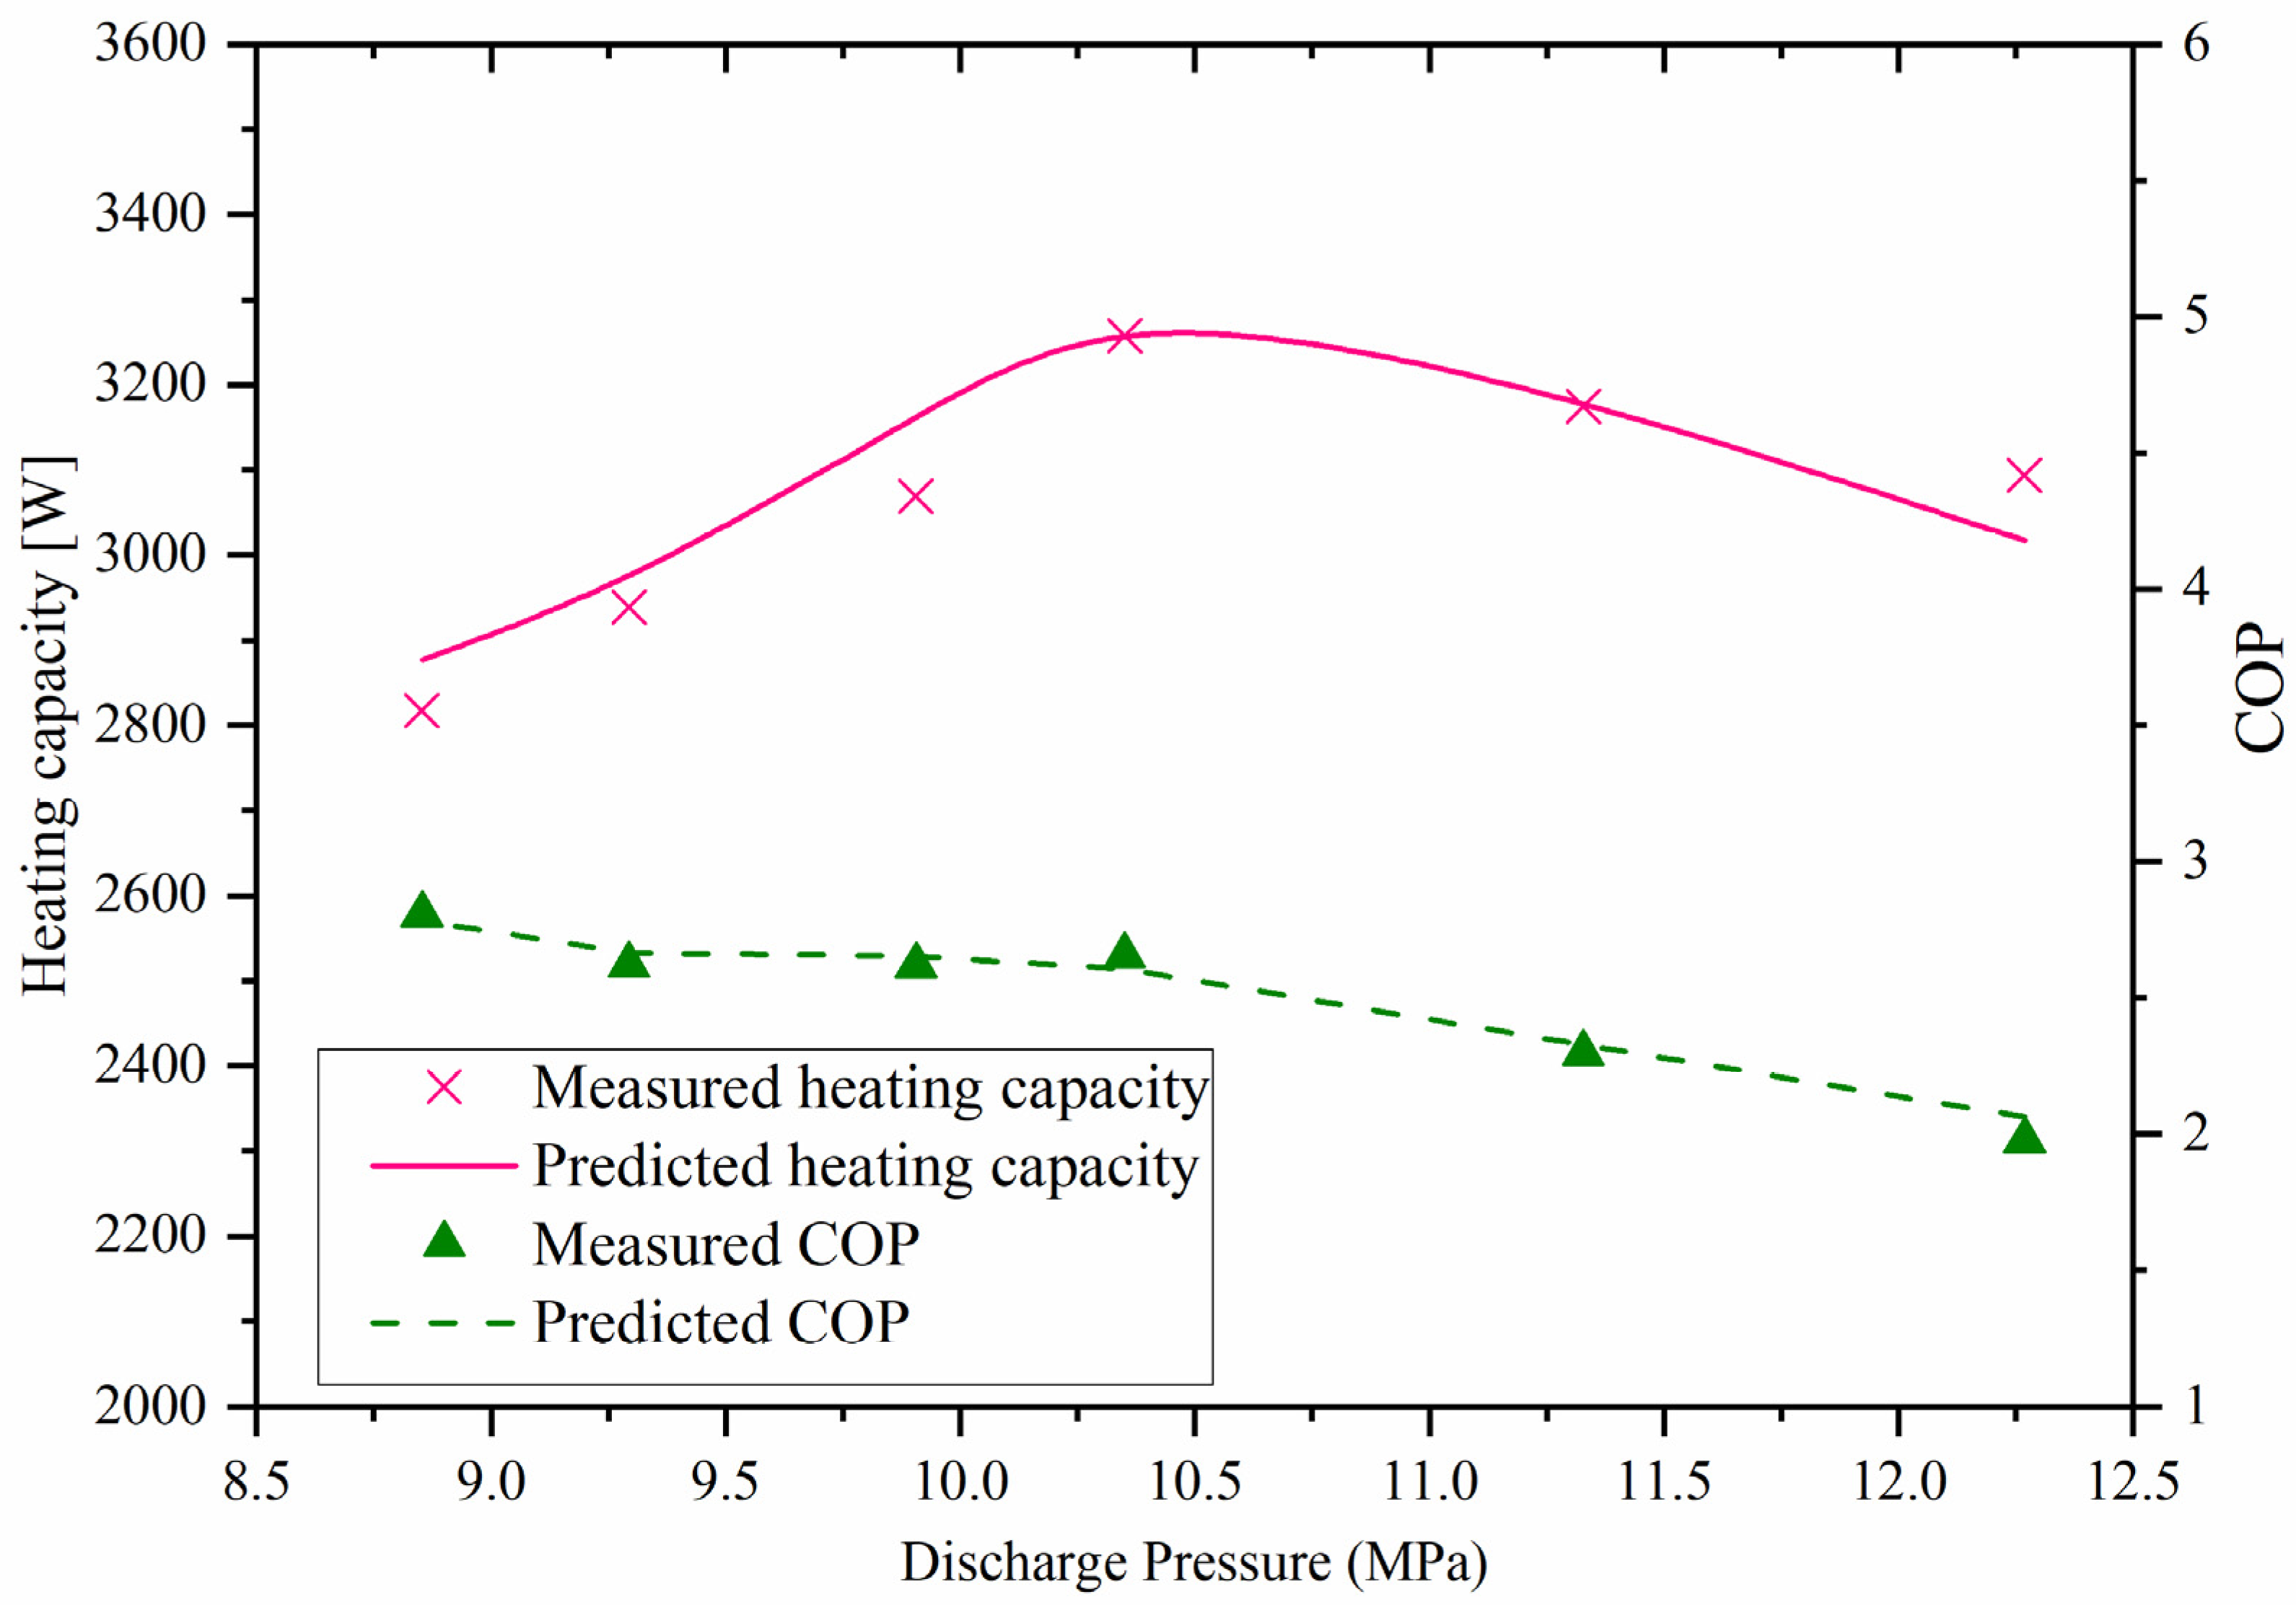
The impact of discharge pressure and inlet water temperature on system performance metrics including COP and heating capacity was systematically evaluated using both experimental data and numerical simulations. Experiments were conducted over a discharge pressure range of 8.8 to 12.2 MPa and an inlet water temperature range of 5 to 50 °C. During tests varying discharge pressure, the inlet water temperature was held constant at 16 °C, while the discharge pressure was fixed at 9.2 MPa during inlet water temperature variation tests.
As depicted in
Figure 5, both simulation and experimental results reveal a distinct maximum in heating capacity near 10.5 MPa discharge pressure, accompanied by a monotonic decline in COP beyond this point. This behavior can be attributed to the faster rise in compressor power consumption compared to heat output as discharge pressure increases, reducing overall efficiency. Furthermore,
Figure 6 shows that increasing the inlet water temperature leads to simultaneous reductions in heating capacity and COP. This trend reflects the diminished temperature gradient between the heat source and sink, which limits heat transfer driving forces and consequently decreases system performance.
The close agreement between modeled and measured data across these parameter sweeps validates the model capability to capture key thermodynamic and operational phenomena governing CO2 heat pump water heaters. This insight provides a foundation for optimizing operating conditions to maximize efficiency and capacity.
4.3. Temperature Profile Analysis
The IHX operates predominantly under subcritical or transcritical conditions, thus exhibiting behavior analogous to a conventional counterflow heat exchanger when operating at low pressures. As illustrated in
Figure 7, which presents the temperature difference between CO
2 and water at three distinct operating pressures, the minimum temperature difference consistently occurs near the refrigerant inlet or outlet. This pattern arises because the heat transfer coefficient varies monotonically and continuously with refrigerant temperature, resulting in smooth temperature gradients along the exchanger length. As the operating pressure increases, the temperature profiles exhibit reduced linearity, reflecting the nonlinear variation of CO
2 thermophysical properties during transcritical processes.
In contrast, the gas cooler functions under supercritical temperature and pressure conditions, displaying fundamentally different thermal characteristics.
Figure 8 shows that the minimum temperature difference between CO
2 and water occurs near the pseudo-critical point. This phenomenon is attributable to the rapid changes in thermophysical properties of CO
2 within the pseudo-critical region, where the heat transfer coefficient reaches its maximum [
40]. The drastic variation of CO
2 heat capacity with temperature and pressure in this region strongly influences the heat exchange process, creating a pronounced pinch point—defined as the location where the temperature difference between the two heat transfer fluids is minimized [
22].
Notably, the water temperature profile in the gas cooler deviates from the linear distribution commonly reported in previous studies [
41], exhibiting a distinct curvature along the flow path. This behavior reflects spatial variations in the local heat transfer coefficient and emphasizes the importance of employing high-fidelity simulation models for accurate pinch point prediction and detailed thermal analysis.
Unlike the general counterflow arrangement in the gas cooler and IHX, the evaporator presents a more complex flow configuration. As shown in
Figure 9, the fin-and-tube evaporator studied features one inlet and two outlets. The CO
2 temperature exhibits a slight decrease upon entering the evaporator due to pressure drop effects. Following this, the temperature rises sharply as the refrigerant undergoes complete vaporization under single-phase heat transfer conditions. Near the evaporator outlet, a modest temperature decline is observed, attributed to heat short-circuiting within the heat exchanger. This non-monotonic temperature behavior highlights the unique thermal dynamics within the evaporator and underscores the need for detailed modeling to capture such phenomena accurately.
4.4. Cold Start-Up Transient Process
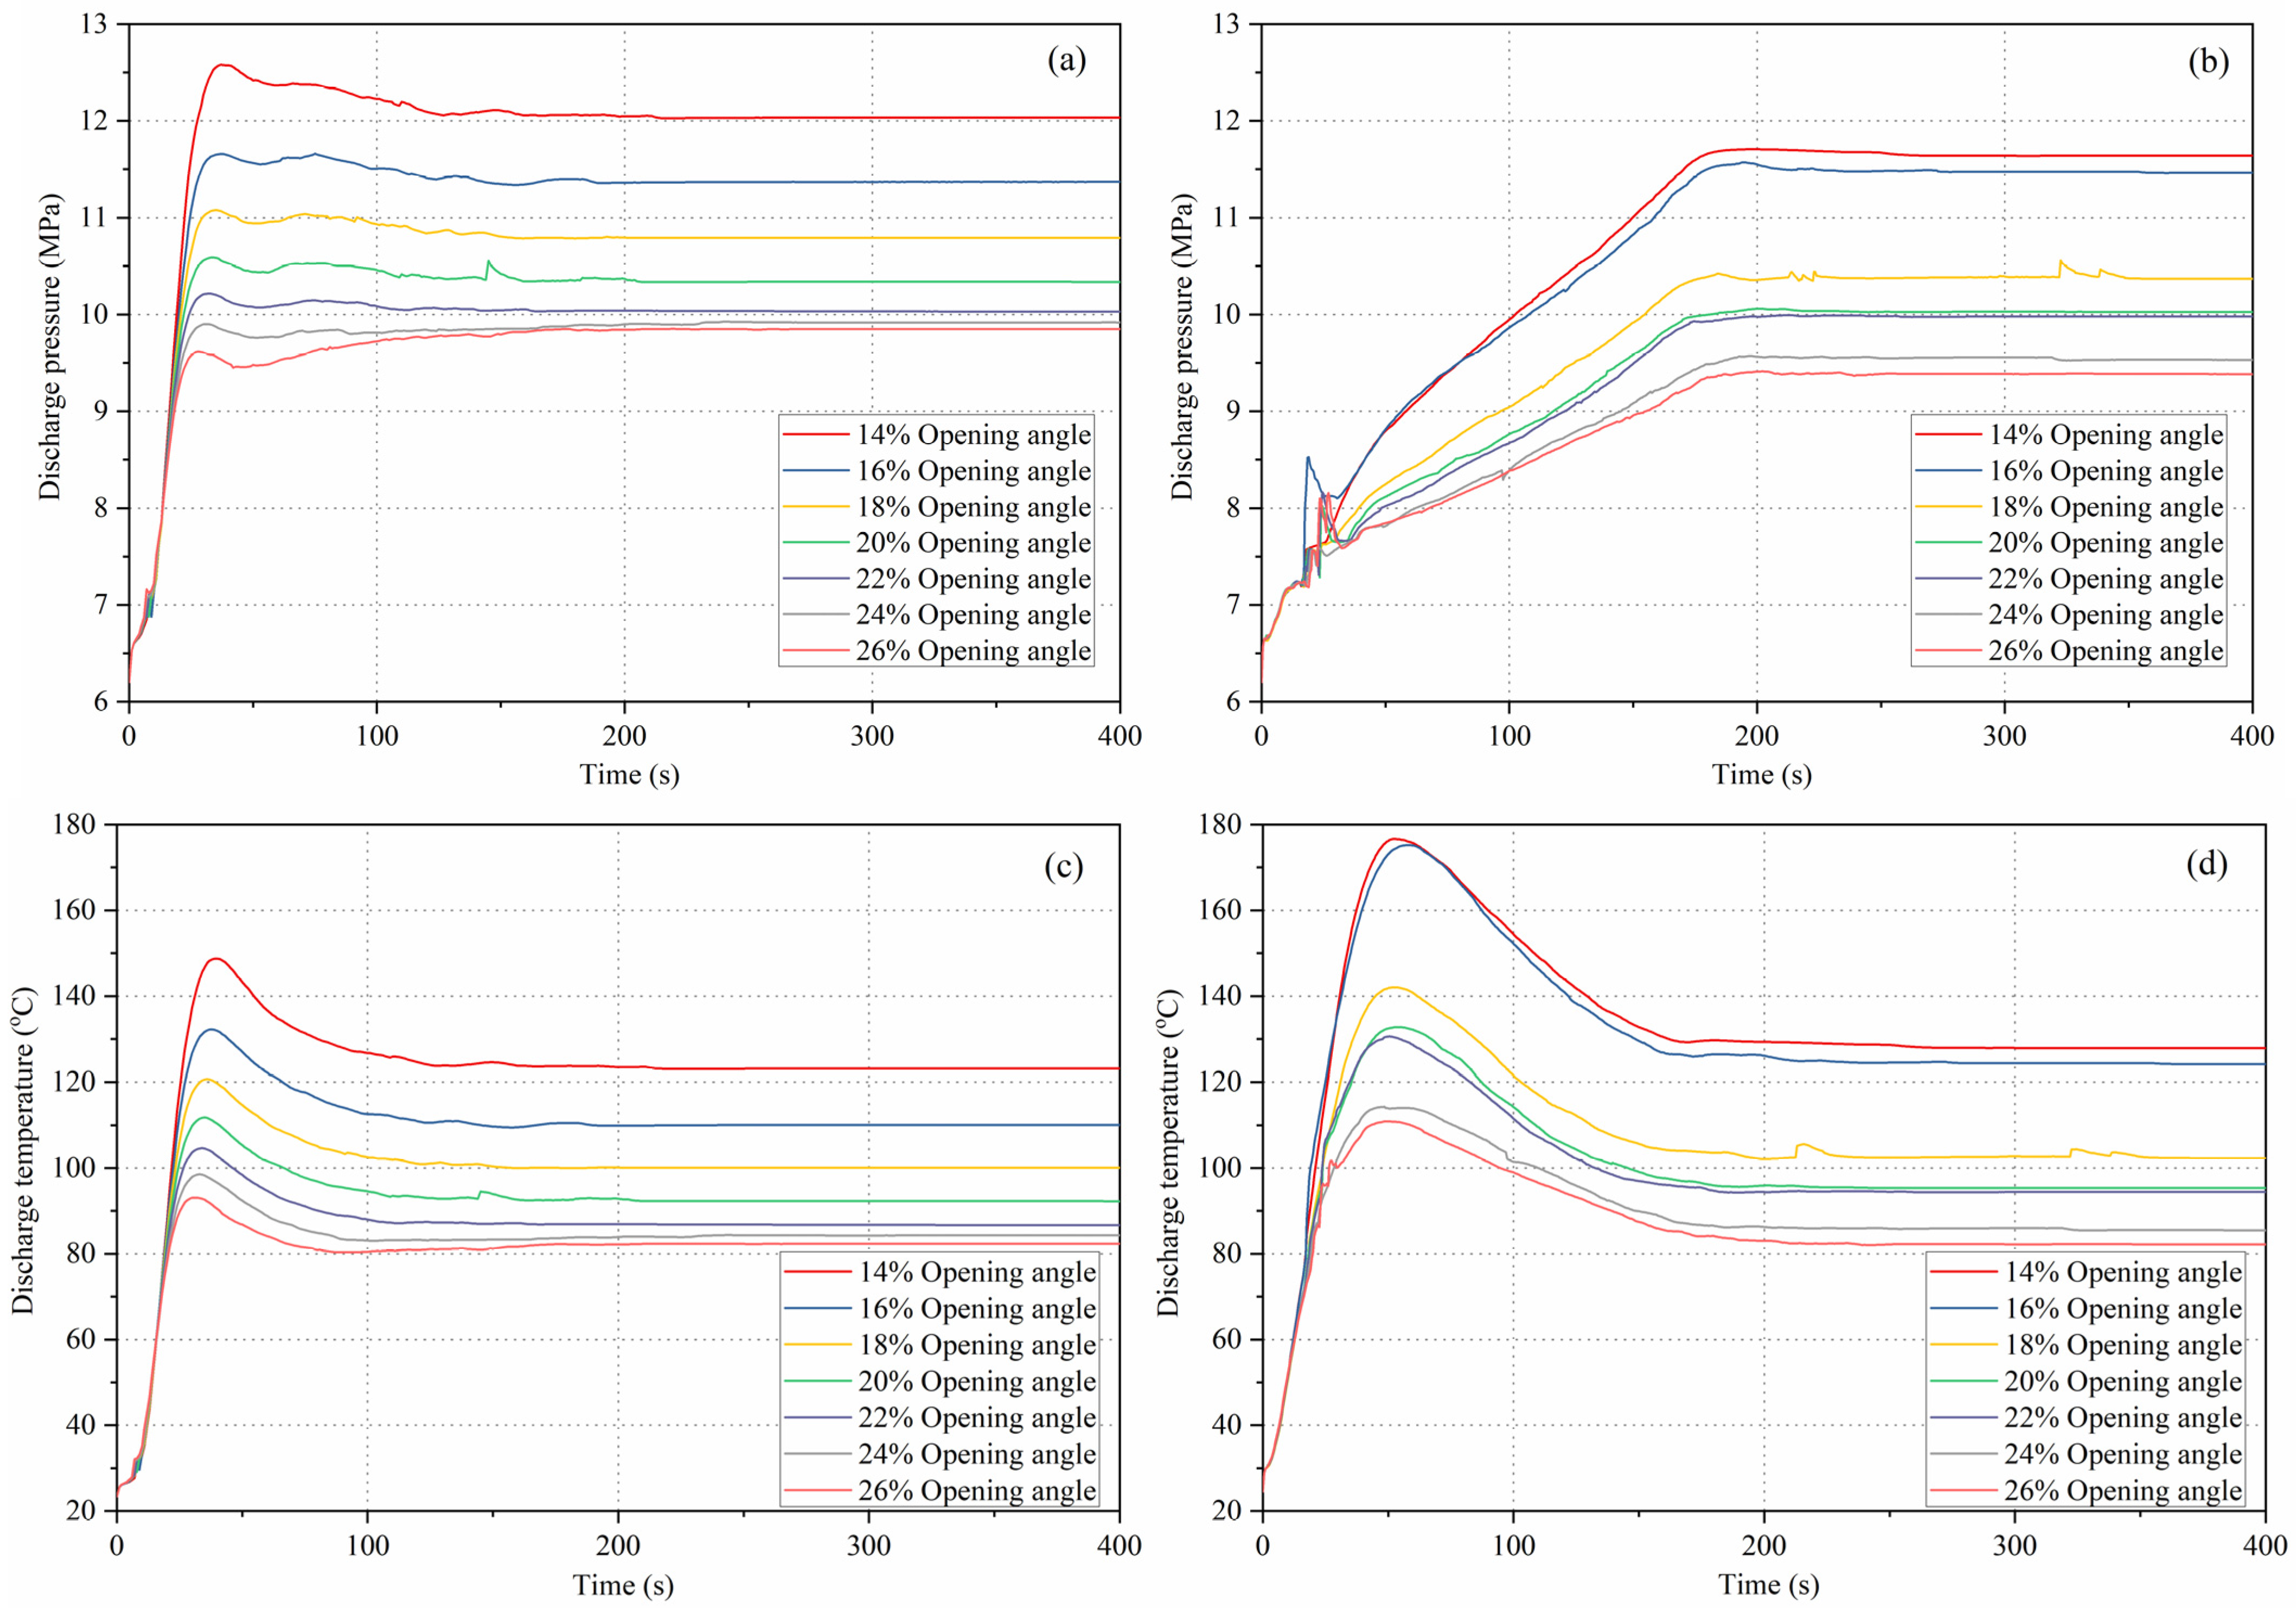
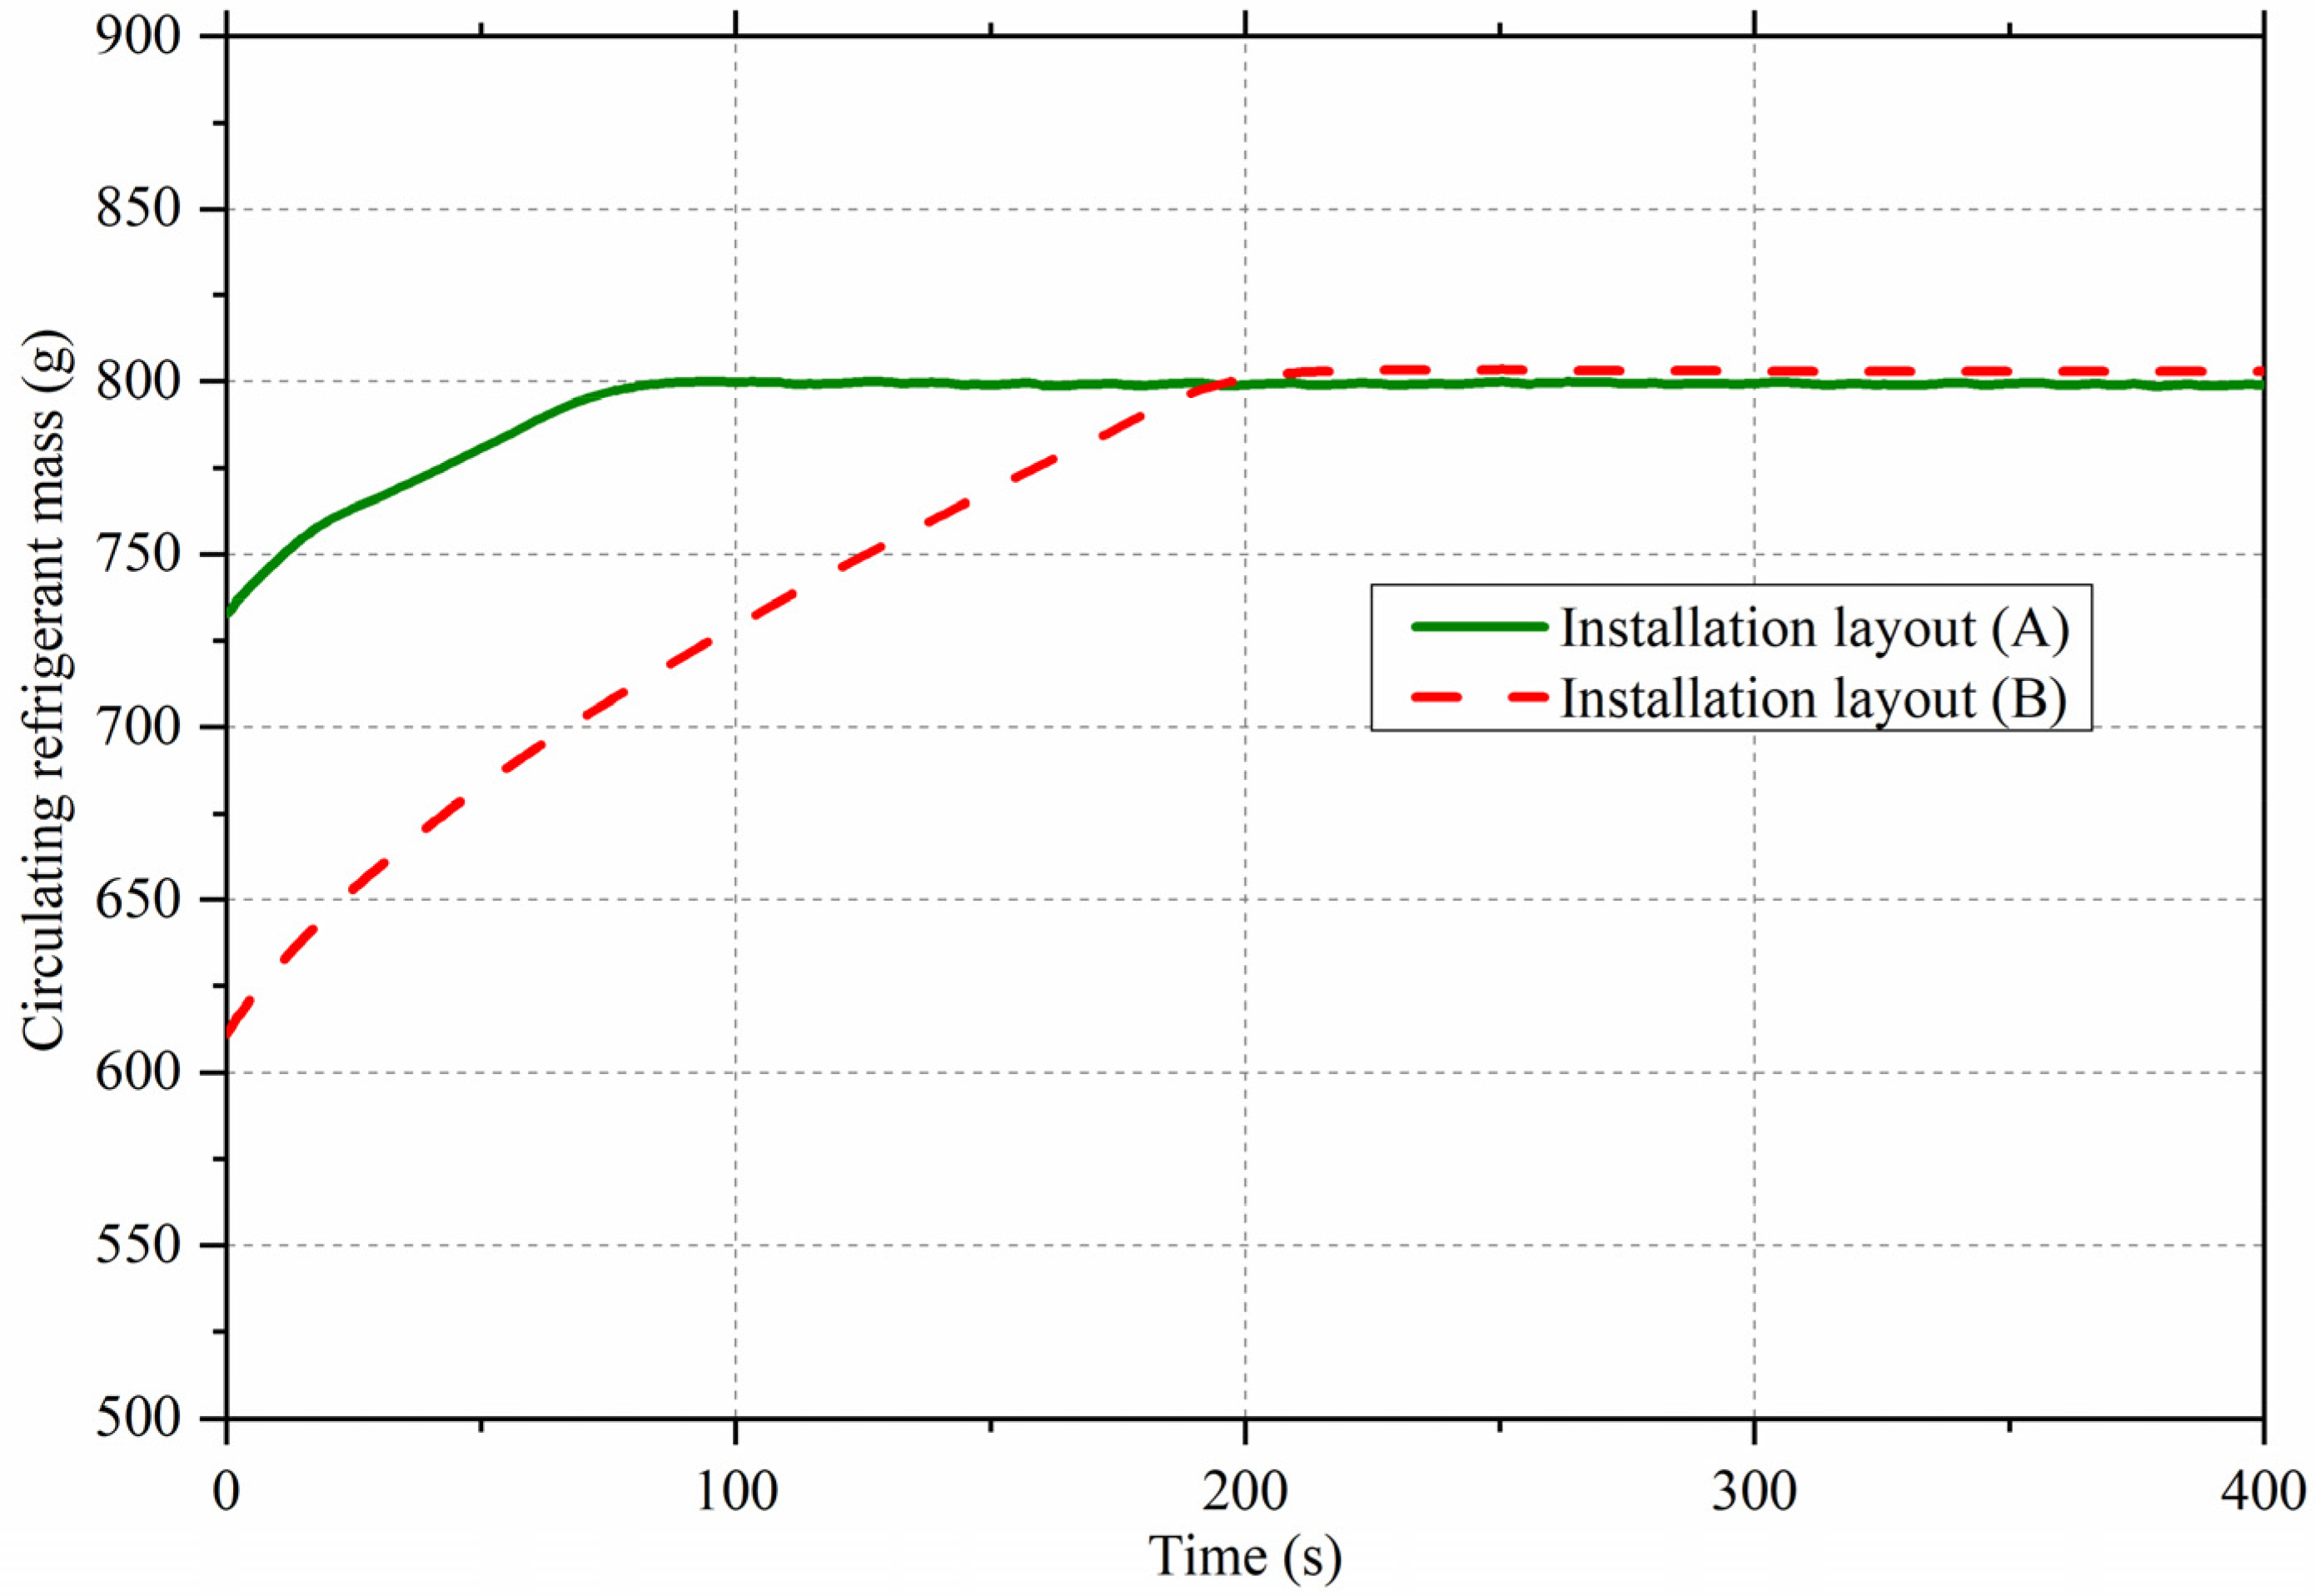
The cold start-up transient behavior of the CO2HP water heater under varying back-pressure valve openings is studied for two vertical installation layouts: (A) all components placed at the same height level, and (B) the receiver, compressor, and gas cooler positioned 5 m below the IHX and evaporator. Since the ambient temperature (25 °C) is below the CO2 critical temperature, the initial refrigerant distribution is significantly influenced by gravitational effects on the two-phase refrigerant. Prior to start-up, in layout (A), the liquid refrigerant is assumed to be uniformly distributed throughout the system. In contrast, in layout (B), the lower elevation causes the liquid refrigerant to accumulate in the receiver, while the remaining components are predominantly filled with vapor refrigerant, determined by the ambient temperature and the equalized system pressure. This difference in initial refrigerant distribution strongly affects the start-up dynamics.
Figure 10 shows the evolution of discharge pressure, discharge temperature, heating capacity, and COP. When the initial refrigerant distribution is the same, varying the back-pressure valve opening produces similar transient trends. However, when the initial refrigerant distribution differs (due to installation layout), the transient profiles change noticeably, even with identical valve openings. In general, discharge pressure, heating capacity, and COP rise more steeply in layout (A) than in layout (B), owing to the smaller amount of circulating refrigerant in the latter case (see
Figure 11).
The elapsed times from the initial state to steady state for each parameter presented in
Figure 10 are summarized in
Table 3 for the two installation layouts. The discharge pressure stabilizes more quickly than the discharge temperature, whereas the heating capacity requires a similar duration to reach steady state as the discharge temperature. Overall, the steady state time for Layout (A) is approximately 16.2% shorter than that for Layout (B). Interestingly, the steady state time of the COP in Layout (B) is shorter than that of the heating capacity. These results suggest that Layout (A) achieves a more stable efficiency during startup compared to Layout (B).
Because the model neglects refrigerant dissolution in the compressor lubricant, the initial liquid refrigerant is concentrated in the receiver (acting as both gas–liquid separator and accumulator) and partially in the gas cooler before start-up. Similar to observations in CO
2HP systems for electric vehicles [
32] and propane heat pumps for space cooling [
34], refrigerant migration first occurs from the evaporator to the receiver, followed by migration from the gas cooler to the evaporator. In layout (B), the evaporation process is initially less dominant than refrigerant accumulation in the receiver, leading to a slower increase in circulating refrigerant. In layout (A), a greater initial refrigerant inventory in the evaporator results in a higher compressor flow rate during the early start-up phase, allowing the discharge pressure to reach its peak in a shorter time.
Although layout (B) results in smoother pressure changes and a lower peak discharge pressure, which helps reduce the risk of leakage, the reduced refrigerant circulation, particularly at small back pressure valve openings, can lead to higher discharge temperatures that may damage compressor seals and accelerate lubricant carbonization. In contrast, layout (B) facilitates faster water heating during start-up. It is important to note that when the dissolution of refrigerant in the lubricant and variations in receiver placement are taken into account, the initial refrigerant distribution, and therefore the transient start-up behavior, can change significantly.
4.5. Dynamic Water Heating Process
The developed model was applied to simulate the water heating process over an extended duration of up to 10 h in order to capture the long-term thermal and operational behavior of the CO
2 heat pump water heater.
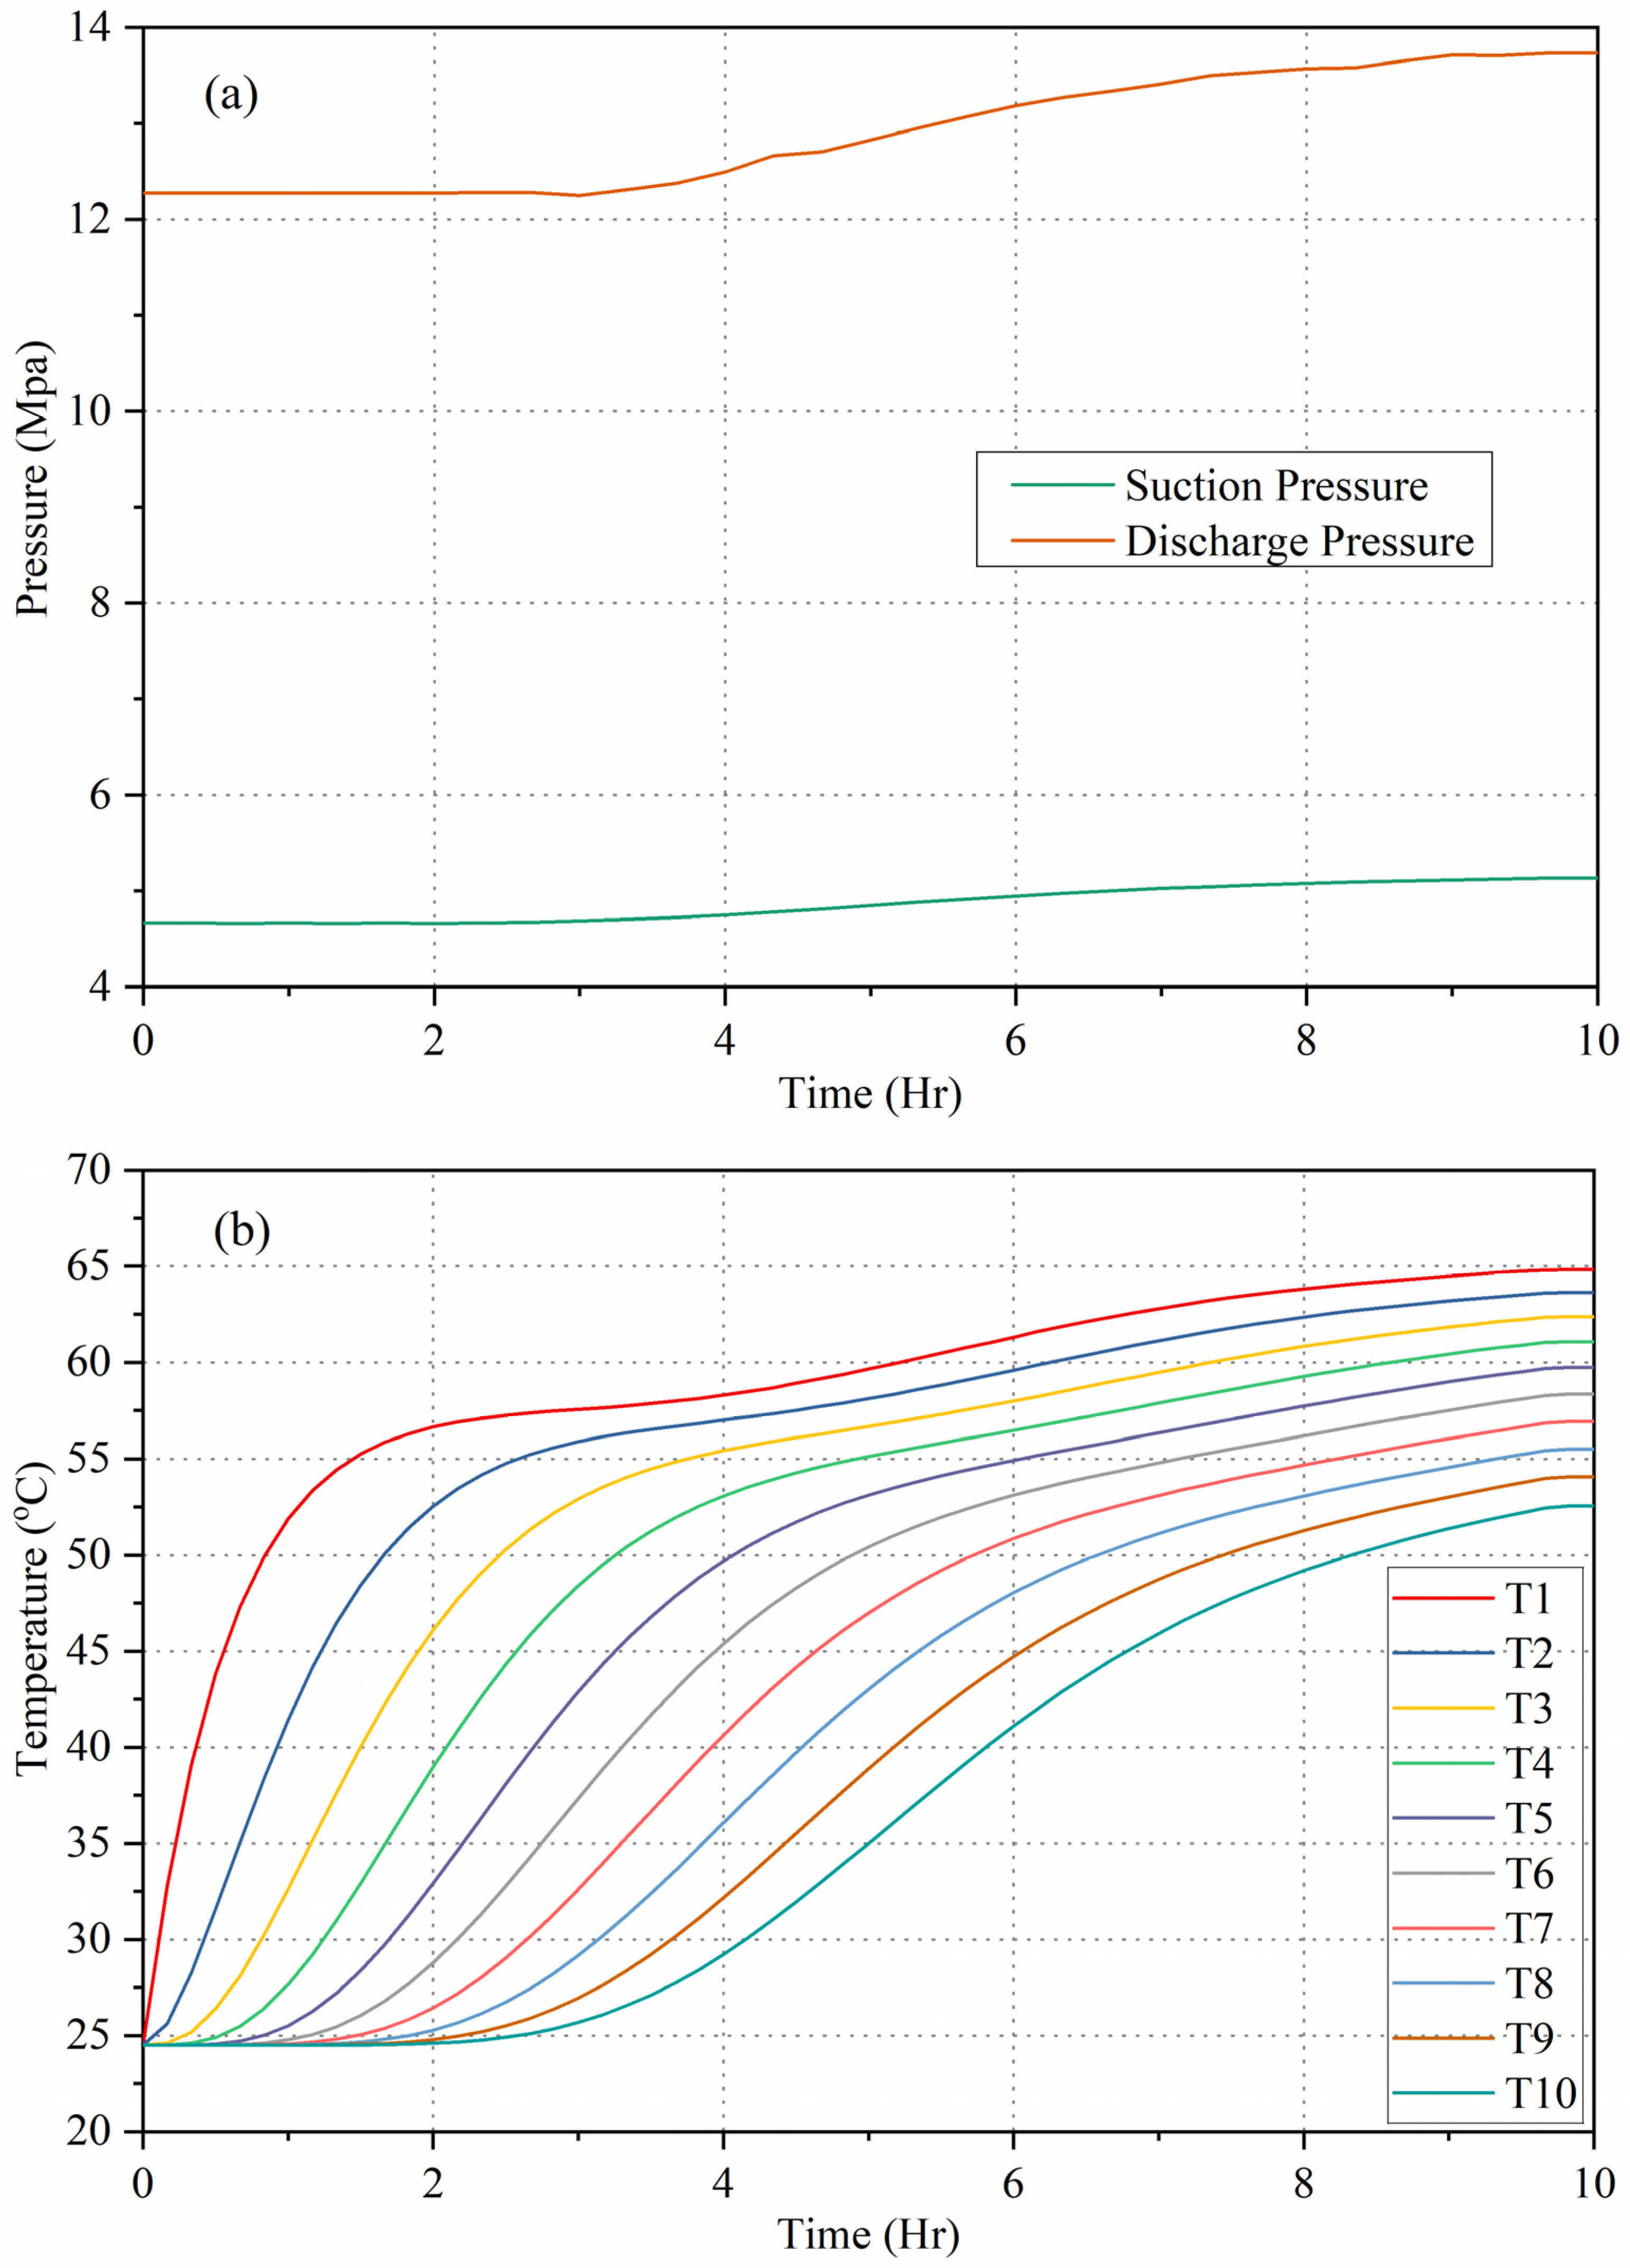
Figure 12 presents the time evolution of the system pressures and the water temperature distribution in the storage tank. As observed from the simulation results, both the discharge pressure and the suction pressure increased by ~10% during the heating period. This gradual pressure rise can be attributed primarily to the elevated temperature of the heat sink as the water temperature in the tank increased, which in turn altered the thermodynamic state of the refrigerant throughout the cycle.
The water temperature profile in the storage tank displayed a distinct degree of stratification during the heating process. Initially, a pronounced vertical temperature gradient was observed, with hotter water accumulating in the upper region of the tank and cooler water remaining in the lower region. As the heating process progressed, this temperature gradient gradually diminished. This reduction in temperature stratification indicates a more uniform temperature distribution within the tank, which is a result of both conductive heat transfer through the water column and mixing effects caused by thermal expansion and localized convection currents. Prolonged heating promotes this homogenization, although some degree of stratification can persist depending on inlet configuration and buoyancy forces.
The electrical power input to the compressor exhibited a steady upward trend over the course of the heating period, increasing from an initial value of ~920 W to about 1170 W at the end of the ten-hour simulation. This rise in electrical consumption is consistent with the increased compression work required at higher condensing pressures, which occur as the heat sink temperature rises. Meanwhile, the heating capacity of the system exhibited a gradual decline with time. This reduction is primarily due to the decreasing water temperature difference between the inlet and outlet of the gas cooler. As the water temperature approaches the desired setpoint, the incremental heat gained by the tank diminishes, and the instantaneous heating rate naturally declines.
Overall, the simulation results illustrate the interplay between refrigerant thermodynamic conditions, compressor operating requirements, and water thermal stratification during prolonged heating operation. The observed pressure rise, gradual reduction in heating capacity, and changes in water temperature distribution provide valuable insight into the dynamic characteristics of CO2 heat pump water heaters, and highlight the importance of considering both refrigerant-side and water-side behaviors in the design and optimization of such systems.
6. Conclusions
A detailed simulation model of a transcritical CO2 heat pump water heating system has been developed and validated against an in-house experimental prototype, achieving an average prediction error of 3.4%. The model accurately reproduces both steady-state and transient behaviors, making it a reliable tool for performance evaluation and design optimization.
The results indicate that increasing the discharge pressure from 8.8 MPa to 12.2 MPa causes compressor power to rise more rapidly than heating capacity, thereby reducing the coefficient of performance. Likewise, raising the inlet water temperature from 5 °C to 50 °C leads to declines in both heating capacity and efficiency. Analysis of the temperature profiles reveals pronounced non-linearities in both the gas cooler (for water and CO2) and the near-critical section of the internal heat exchanger, resulting from the sharp variation in CO2 specific heat near pseudocritical conditions and the uneven distribution of heat flux along the heat exchange path. The study further shows that start-up dynamics are strongly governed by the initial liquid refrigerant distribution, which is sensitive to vertical installation layout. The mapping between circulating refrigerant mass and installation configuration is essential for balancing the trade-off between elevated peak discharge pressure, which occurs with a larger initial refrigerant circulation, and elevated peak suction temperature, which arises when the initial refrigerant circulation is insufficient. In long-duration heating from 25 °C to 60 °C, both discharge and suction pressures increased by ~10%, input power rose from 920 W to 1170 W, and heating capacity gradually declined due to diminishing temperature lift.
The novelty of this work lies in the unified modeling framework that concurrently captures steady-state performance, start-up transients, and extended heating behavior while explicitly incorporating the effects of refrigerant distribution and installation configuration. This integrated perspective provides new insights into thermophysical property interactions, component temperature profiles, and system-level dynamics in transcritical CO2 heat pump water heaters.
