Article

Towards Resilient Urban Design: Revealing the Impacts of Built Environment on Physical Activity Amidst Climate Change

Stuart Weitzman School of Design, University of Pennsylvania, Philadelphia, PA 19104, USA
Buildings 2025, 15(19), 3470; https://doi.org/10.3390/buildings15193470
Submission received: 5 August 2025 / Revised: 17 September 2025 / Accepted: 23 September 2025 / Published: 25 September 2025

Abstract

Understanding how urban environmental features shape physical activity is crucial for building health-supportive cities, especially under climate change pressures such as rising temperatures and extreme weather. Previous studies emphasized density and accessibility, but the spatial mechanisms driving facility usage remain understudied. This study investigates how land use diversity, the distribution of physical activity facilities, street network structure, and road accessibility shape physical activity behaviours at the neighbourhood scale. Using a 500 m × 500 m grid framework in Xiamen, China, a random forest model combined with Shapley Additive Explanations (SHAP) is employed to quantify the importance of environment indicators. The results demonstrate that road accessibility and street connectivity exert the strongest influence on physical activity facility use, followed by land use diversity and 15 min reachable residential Points of Interests (POIs). Spatial autocorrelation and cluster analysis further reveal that high-impact areas are concentrated in central and southern zones, whereas peripheral regions face accessibility deficits. These findings highlight the value of integrating transport planning and land use configuration to address spatial disparities in facility usage. The study contributes a replicable methodological framework and provides practical insights for advancing equitable and activity-friendly neighbourhood design.

1. Introduction

The World Health Organization (WHO) has identified physical inactivity as the fourth most significant risk factor contributing to the global mortality rate [1], contributing to obesity, chronic diseases, and mental health problems [2,3]. Rapid urbanization has transformed lifestyles, and the built environment now plays a crucial role in shaping urban residents’ daily behaviours [4]. For instance, improved access to residential areas, parks, and public transport has been shown to increase the frequency of physical activity [5,6,7].
Creating diverse functional urban areas contributes to the local economy, environment and health [8], whereas single-use, car-dependent development has detrimental health effects [9,10,11]. The urban built environment is shaped by land use patterns, road networks, and urban facilities. The characteristics of the urban built environment play a crucial role in determining the exercise behaviour of urban residents [8]. The design of walkable neighbourhoods with proximity to services, workplaces and recreational spaces not only contributes to physical activity but also enhances social interaction and mental health. The “15 min city” concept, which promotes neighbourhood designs where most daily needs (e.g., shopping, healthcare, education, and recreation) can be met within a 15 min walk or cycle, has been shown to improve health, environmental sustainability, and social equity [12,13,14]. Hence, it is essential to understand how the urban built environment impacts physical activities.
Promoting physical activity offers not only clear health advantages but also significant environmental benefits. In the face of escalating climate change pressures, many cities have become increasingly dependent on private vehicles, a trend that discourages walking and cycling while accelerating greenhouse gas emissions, air pollution, and energy consumption. Designing neighbourhoods that support walking and expanding access to reliable public transport can help curb car use without compromising everyday mobility. Such efforts strengthen the sustainability of urban environments and demonstrate that promoting physical activity is not only a public health initiative but also a practical strategy for creating livable cities.
Recent developments in geographic information science and spatiotemporal data analysis techniques have made it possible to more accurately assess how urban structural features affect human mobility and behaviour. The combination of high-resolution built environment data (including land use maps, POIs distributions, road and transport networks) with dynamic mobility data from mobile phones or social media enables the construction of fine-grained models linking urban form to physical activity (PA) [15,16,17].
However, while previous studies have highlighted the roles of density and accessibility in shaping active lifestyles, limited attention has been given to the spatial mechanisms underlying the intensity of facility usage. Addressing this gap is crucial for understanding how built environment features jointly influence physical activity behaviours at the neighbourhood scale.
This study addresses this research gap by examining how specific features of the urban built environment, including land use diversity, the distribution of physical activity facilities, street network structure, and transportation accessibility, influence physical activity at the neighbourhood scale. A grid-based analytical framework is adopted, combining geospatial analysis, road network modelling, and interpretable machine learning methods such as random forest with Shapley Additive Explanations, SHAP, to identify and quantify the built environment indicators most strongly associated with physical activity. The findings provide new methodological and empirical insights into the spatial determinants of urban health, offering guidance for fostering equitable and activity-supportive neighbourhoods in rapidly urbanizing contexts. The remainder of this article is structured as follows: Section 2 reviews relevant literature, Section 3 introduces the data and methodology, Section 4 presents the empirical results, Section 5 concludes with implications and directions for future research.

2. Literature Review

2.1. Built Environment and Physical Activity

Many studies have consistently demonstrated that the built environment significantly influences individuals’ engagement in physical activity, especially in urban area. PA facility usage has influence not only to individual-level factors such as motivation and health awareness, but also to spatial-environmental constraints. A key determinant of PA facility utilization is its spatial configuration and service radius. Studies have shown that residents are more likely to use facilities located within walkable distance—typically within a 15 min threshold—and are particularly attracted to areas with a higher density and diversity of sports venues [18,19]. The attractiveness of the facility declines consequent accessible distance rising. Moreover, the presence of multiple accessible venues within close proximity is often associated with higher usage intensity, owing to increased options and perceived convenience [20,21].
Moreover, the surrounding built environment plays a vital role in shaping actual usage behaviour. Factors such as population density, land use mix, street connectivity, and transit accessibility influence not only the objective accessibility of facilities but also the perceived ease and safety of reaching them. For instance, Shi et al. [22] found that intersection density and public transit availability were significantly associated with higher rates of walking for activity purposes, particularly among vulnerable populations. Similarly, Fonseca et al. [23] demonstrated that sports program participation was more likely in neighbourhoods with supportive physical infrastructure, such as well-integrated road networks and nearby parks. Research also suggests that land use intensity and functional diversity surrounding facilities can enhance their visibility, perceived utility, and social engagement, further reinforcing usage patterns [24]. Conversely, poorly connected street networks, low-density housing areas, and limited public transport may create spatial barriers, reducing the likelihood of facility visitation despite nominal proximity [25].
In general, PA facility is a behavioural outcome shaped by a complex interplay between spatial form and functional access. While facility provision is foundational, how well facilities are embedded into a walkable, connected, and demographically responsive environment often determines whether they are effectively used.

2.2. Dimensions of the Built Environment Related to Physical Activity Facility Usage

In recent years, a growing number of studies have employed the “5D” model—Density, Diversity, Design, Destination Accessibility, and Distance to Transit—to classify and measure the built environment characteristics, furthermore revealing their complex relationships with PA participation [3,19,26]. Higher residential density correlates positively with increased recreational walking and sports engagement, especially in central districts [27,28], as well as land use diversity [29]. A higher land use diversity will enhance multi-purpose trip potential to increase the visibility of PA facilities and promotes incidental use [30].
With regard to transport-related dimensions, higher levels of street connectivity and spatial integration reduce travel distances and navigation complexity, thereby improving pedestrian mobility and increasing the likelihood of facility exposure and utilization [31]. Transit-related factors such as the density of transport nodes, service frequency, and accessibility of nearby stops also play a supporting role by enhancing the functional reach of urban neighbourhoods. However, these factors are the most effective when coordinated with land use patterns and embedded within a walkable urban fabric, underscoring the need for integrated planning approaches that align infrastructure and facility distribution [32,33,34].

2.3. Methodological Advances in Spatial Analysis of Physical Activity

As the spatial determinants of PA become more complex and localized, methodological advancements are increasingly necessary to capture the nuanced interactions between urban form and behaviour. Traditional statistical models such as linear regression and multilevel models have laid the foundation for understanding associations between built environment variables and PA. However, these models are often limited in their ability to address non-linear relationships, spatial heterogeneity, and complex interdependencies among predictors.
In response to these limitations, recent studies have incorporated machine learning approaches to enhance predictive performance and model flexibility. Among them, Random Forest regression has gained prominence due to its capacity to handle multicollinearity and identify non-linear and interaction effects between built environment features [3,16,35]. Furthermore, interpretable machine learning techniques such as SHAP allow researchers to move beyond “black-box” models by decomposing prediction outcomes into individual variable contributions, enabling both global and local interpretation of model behaviour [26,36,37]. Meanwhile, spatial statistical methods such as Global Moran’s I and Local Indicators of Spatial Association (LISA) are commonly used to explore the spatial clustering and localized impacts of key explanatory variable [38,39,40,41]. These techniques provide critical insights into how the influence of built environment attributes varies across urban space, revealing patterns of inequality and spatial dependence that may be overlooked in non-spatial models.
Integrating these analytical techniques into a unified framework allows for a more comprehensive examination of how built environment indicators influence PA behaviours. By combining machine learning prediction, model interpretation, and spatial analysis, scholars can better uncover the mechanisms by which infrastructure, land use, and urban form interact to shape physical activity engagement.

2.4. Summary and Conceptual Framework

In summary, the reviewed literature demonstrates that the built environment affects physical activity through multiple dimensions, including facility provision, land use diversity, street connectivity, and transport accessibility. While existing studies confirm the importance of these factors, the evidence also highlights several gaps. First, prior research has often emphasized density and accessibility but has paid limited attention to the spatial mechanisms underlying facility usage intensity. Second, although methodological advances have introduced machine learning and spatial analysis techniques, these approaches are rarely integrated into a unified framework to examine the joint effects of built environment features on physical activity.
Based on these insights, this study establishes a conceptual framework in which land use diversity, the spatial distribution of facilities, street network structure, and transportation accessibility are hypothesized as the main determinants of physical activity facility usage (Figure 1). These built environment dimensions shape both the objective accessibility and the perceived convenience of facilities, which in turn influence residents’ participation in physical activity. This framework provides the theoretical foundation for the methodological design of this study, guiding the selection of variables, modelling strategy, and spatial analysis.

3. Methodologies

3.1. Study Area

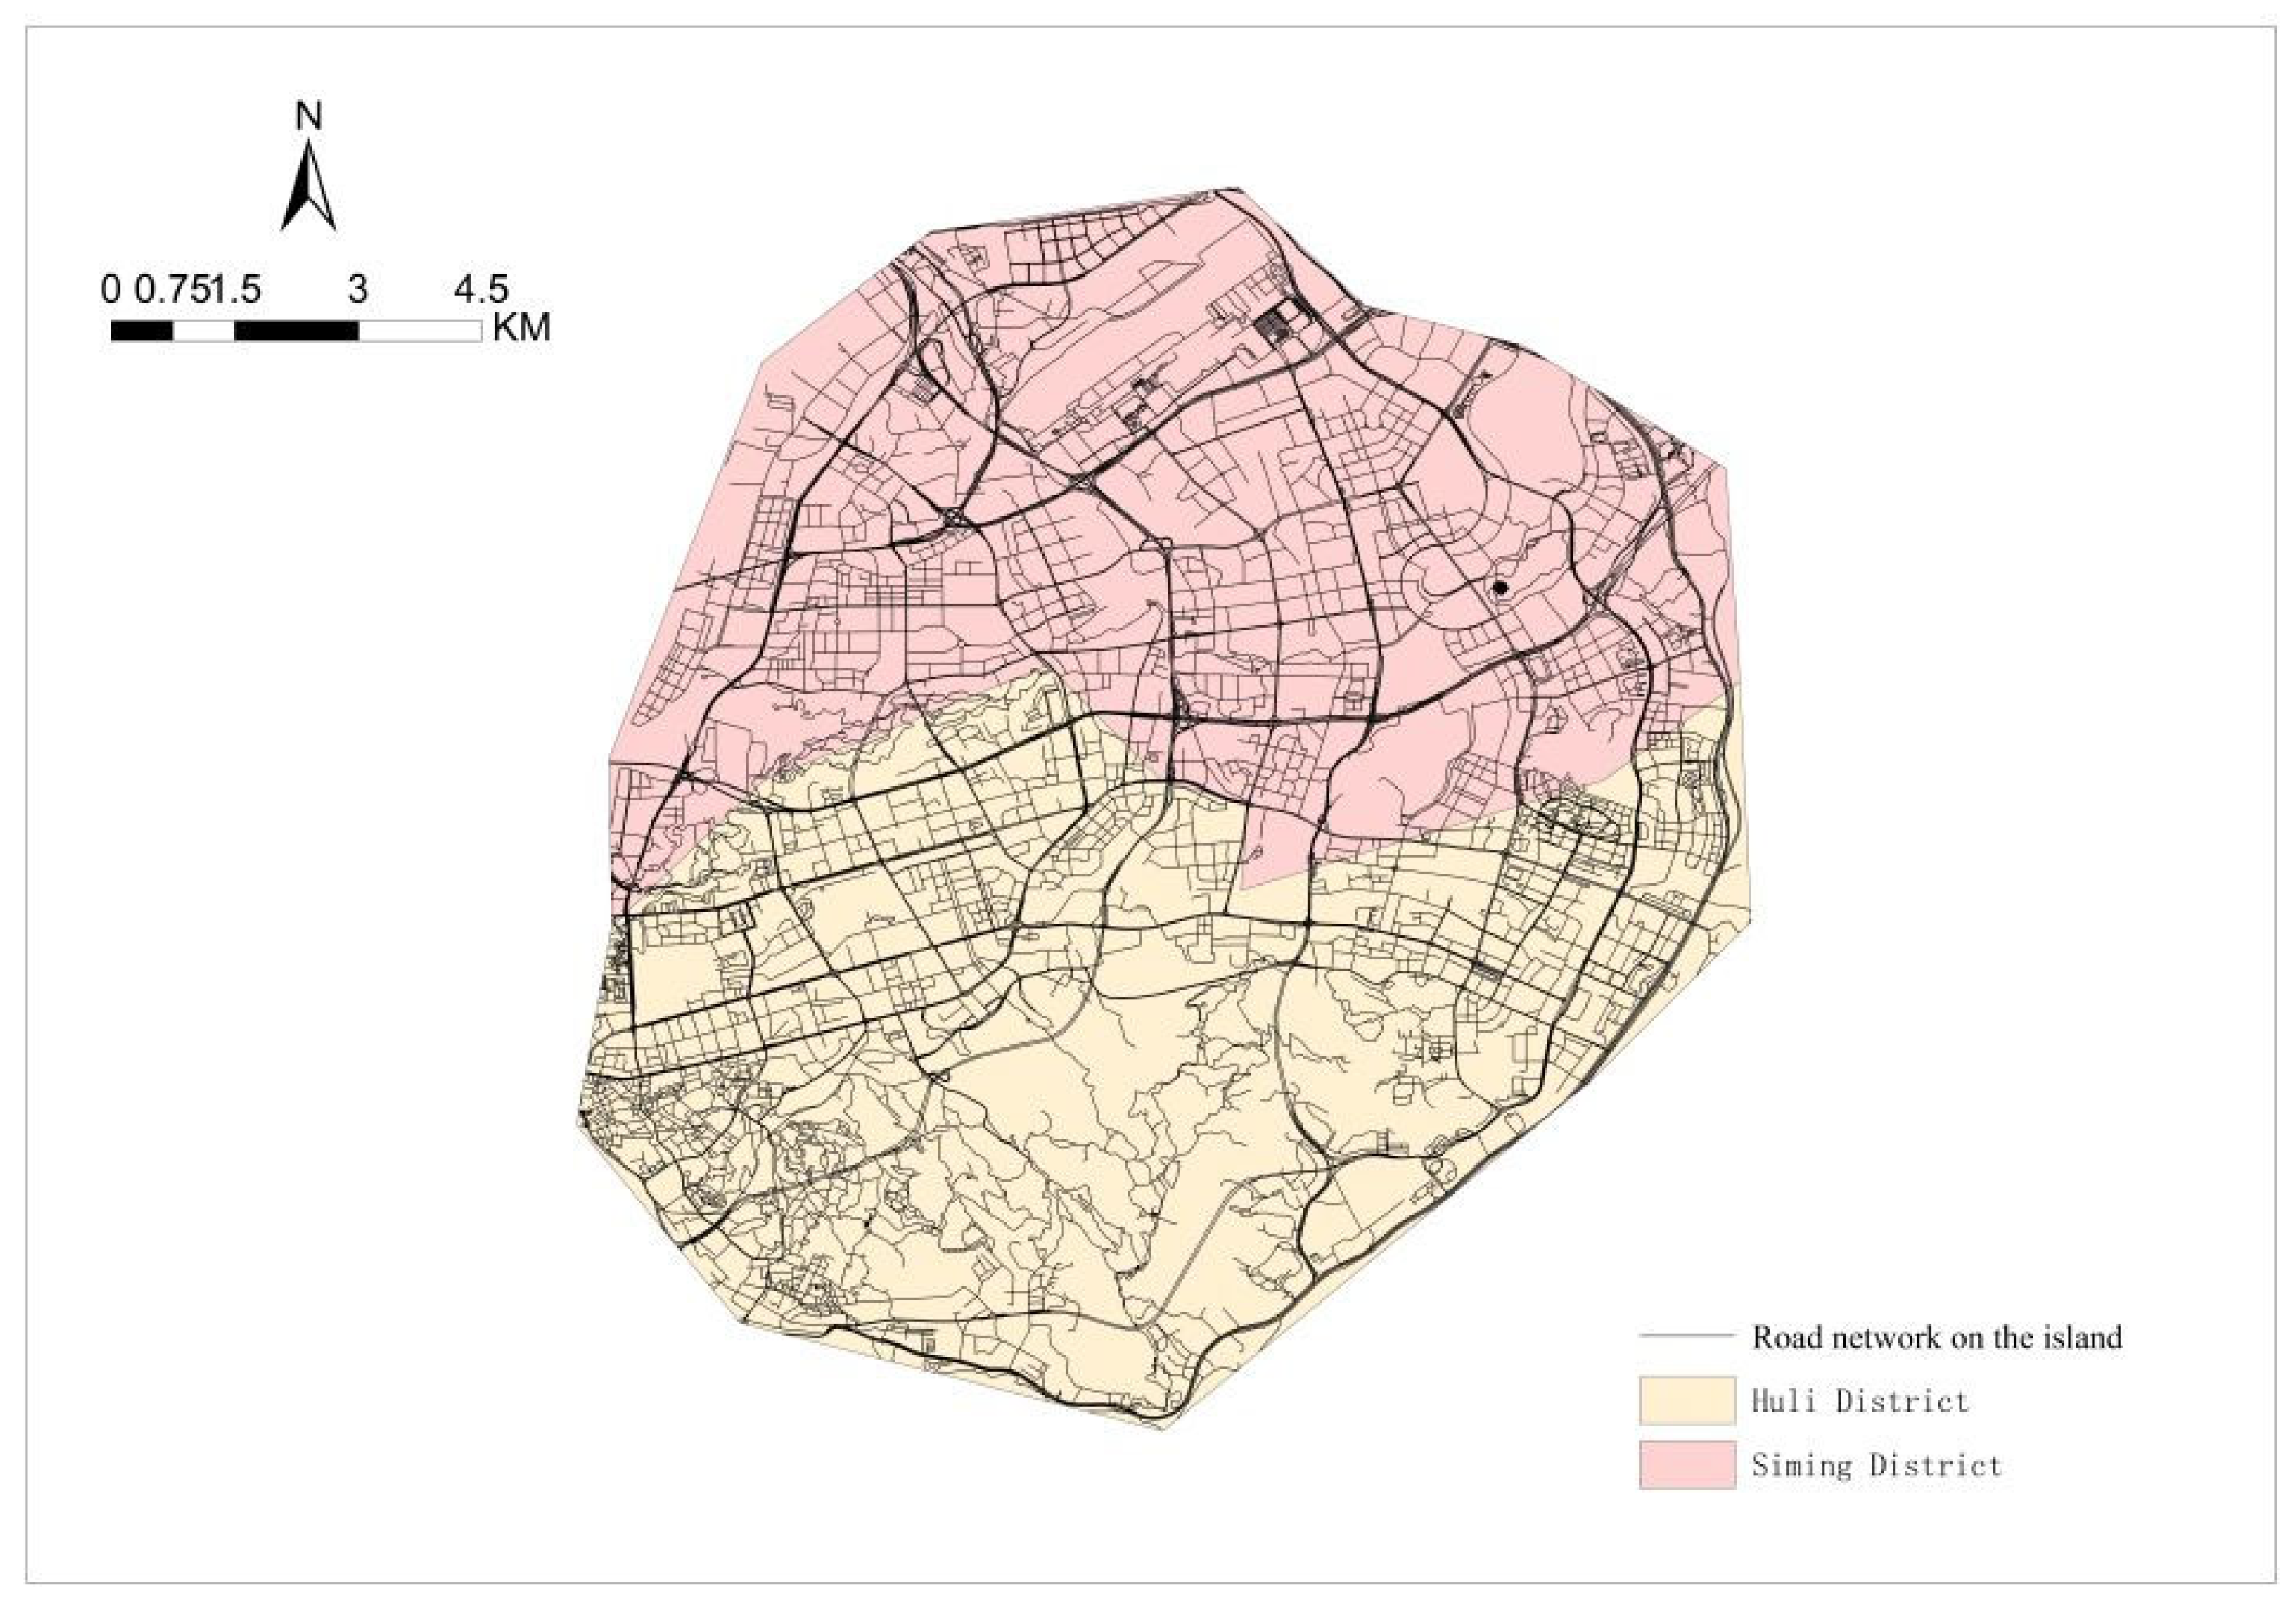
This study selects the central island districts of Xiamen (Siming and Huli districts) as the case area to analyze the relationship between the built environment and physical activity (Figure 2). These two districts represent the city’s administrative and economic core, characterized by a 100% urbanization rate, accounting for approximately 53.6% of the city’s Gross Domestic Product (GDP) and 39% of its permanent population [20]. There are high population density, mixed land use, and excellent accessibility, with a well-established public transportation system and a high proportion of trips made by walking and transit [42]. Moreover, green space is relatively evenly distributed across the districts, supported by a number of large urban parks and coastal open spaces, providing favourable conditions for studying urban health and daily physical activity.

3.2. Data Collection

This study integrates diverse datasets related to population distribution, land use pattern, transport networks, and urban facilities to construct an analytical framework for assessing health-supportive neighbourhoods in Xiamen. By using high-resolution geospatial data and advanced spatial analysis techniques, it enables a fine-grained assessment of how urban spatial form influences access to PA opportunities.
This study focuses on three key spatial datasets—population distribution, POIs, and transport networks—to analyze their roles in influencing access to sports and recreational facilities in Xiamen. To comprehensively capture the spatial dynamics of both physical activity demand and infrastructure supply, four categories of geospatial data are employed. These datasets encompass both the population-side (demand) and facility-side (supply) attributes and form the empirical basis for built environment characterization, service coverage evaluation, and accessibility modelling. A detailed classification is presented in Table 1.
In addition, a uniform spatial analytical framework was established using a 500 m × 500 m grid system, overlaid on the administrative boundaries of Siming and Huli districts. All spatial features were projected, clipped, and aggregated to this standardized grid to ensure analytical consistency across data types.

3.2.1. Population Distribution Dataset

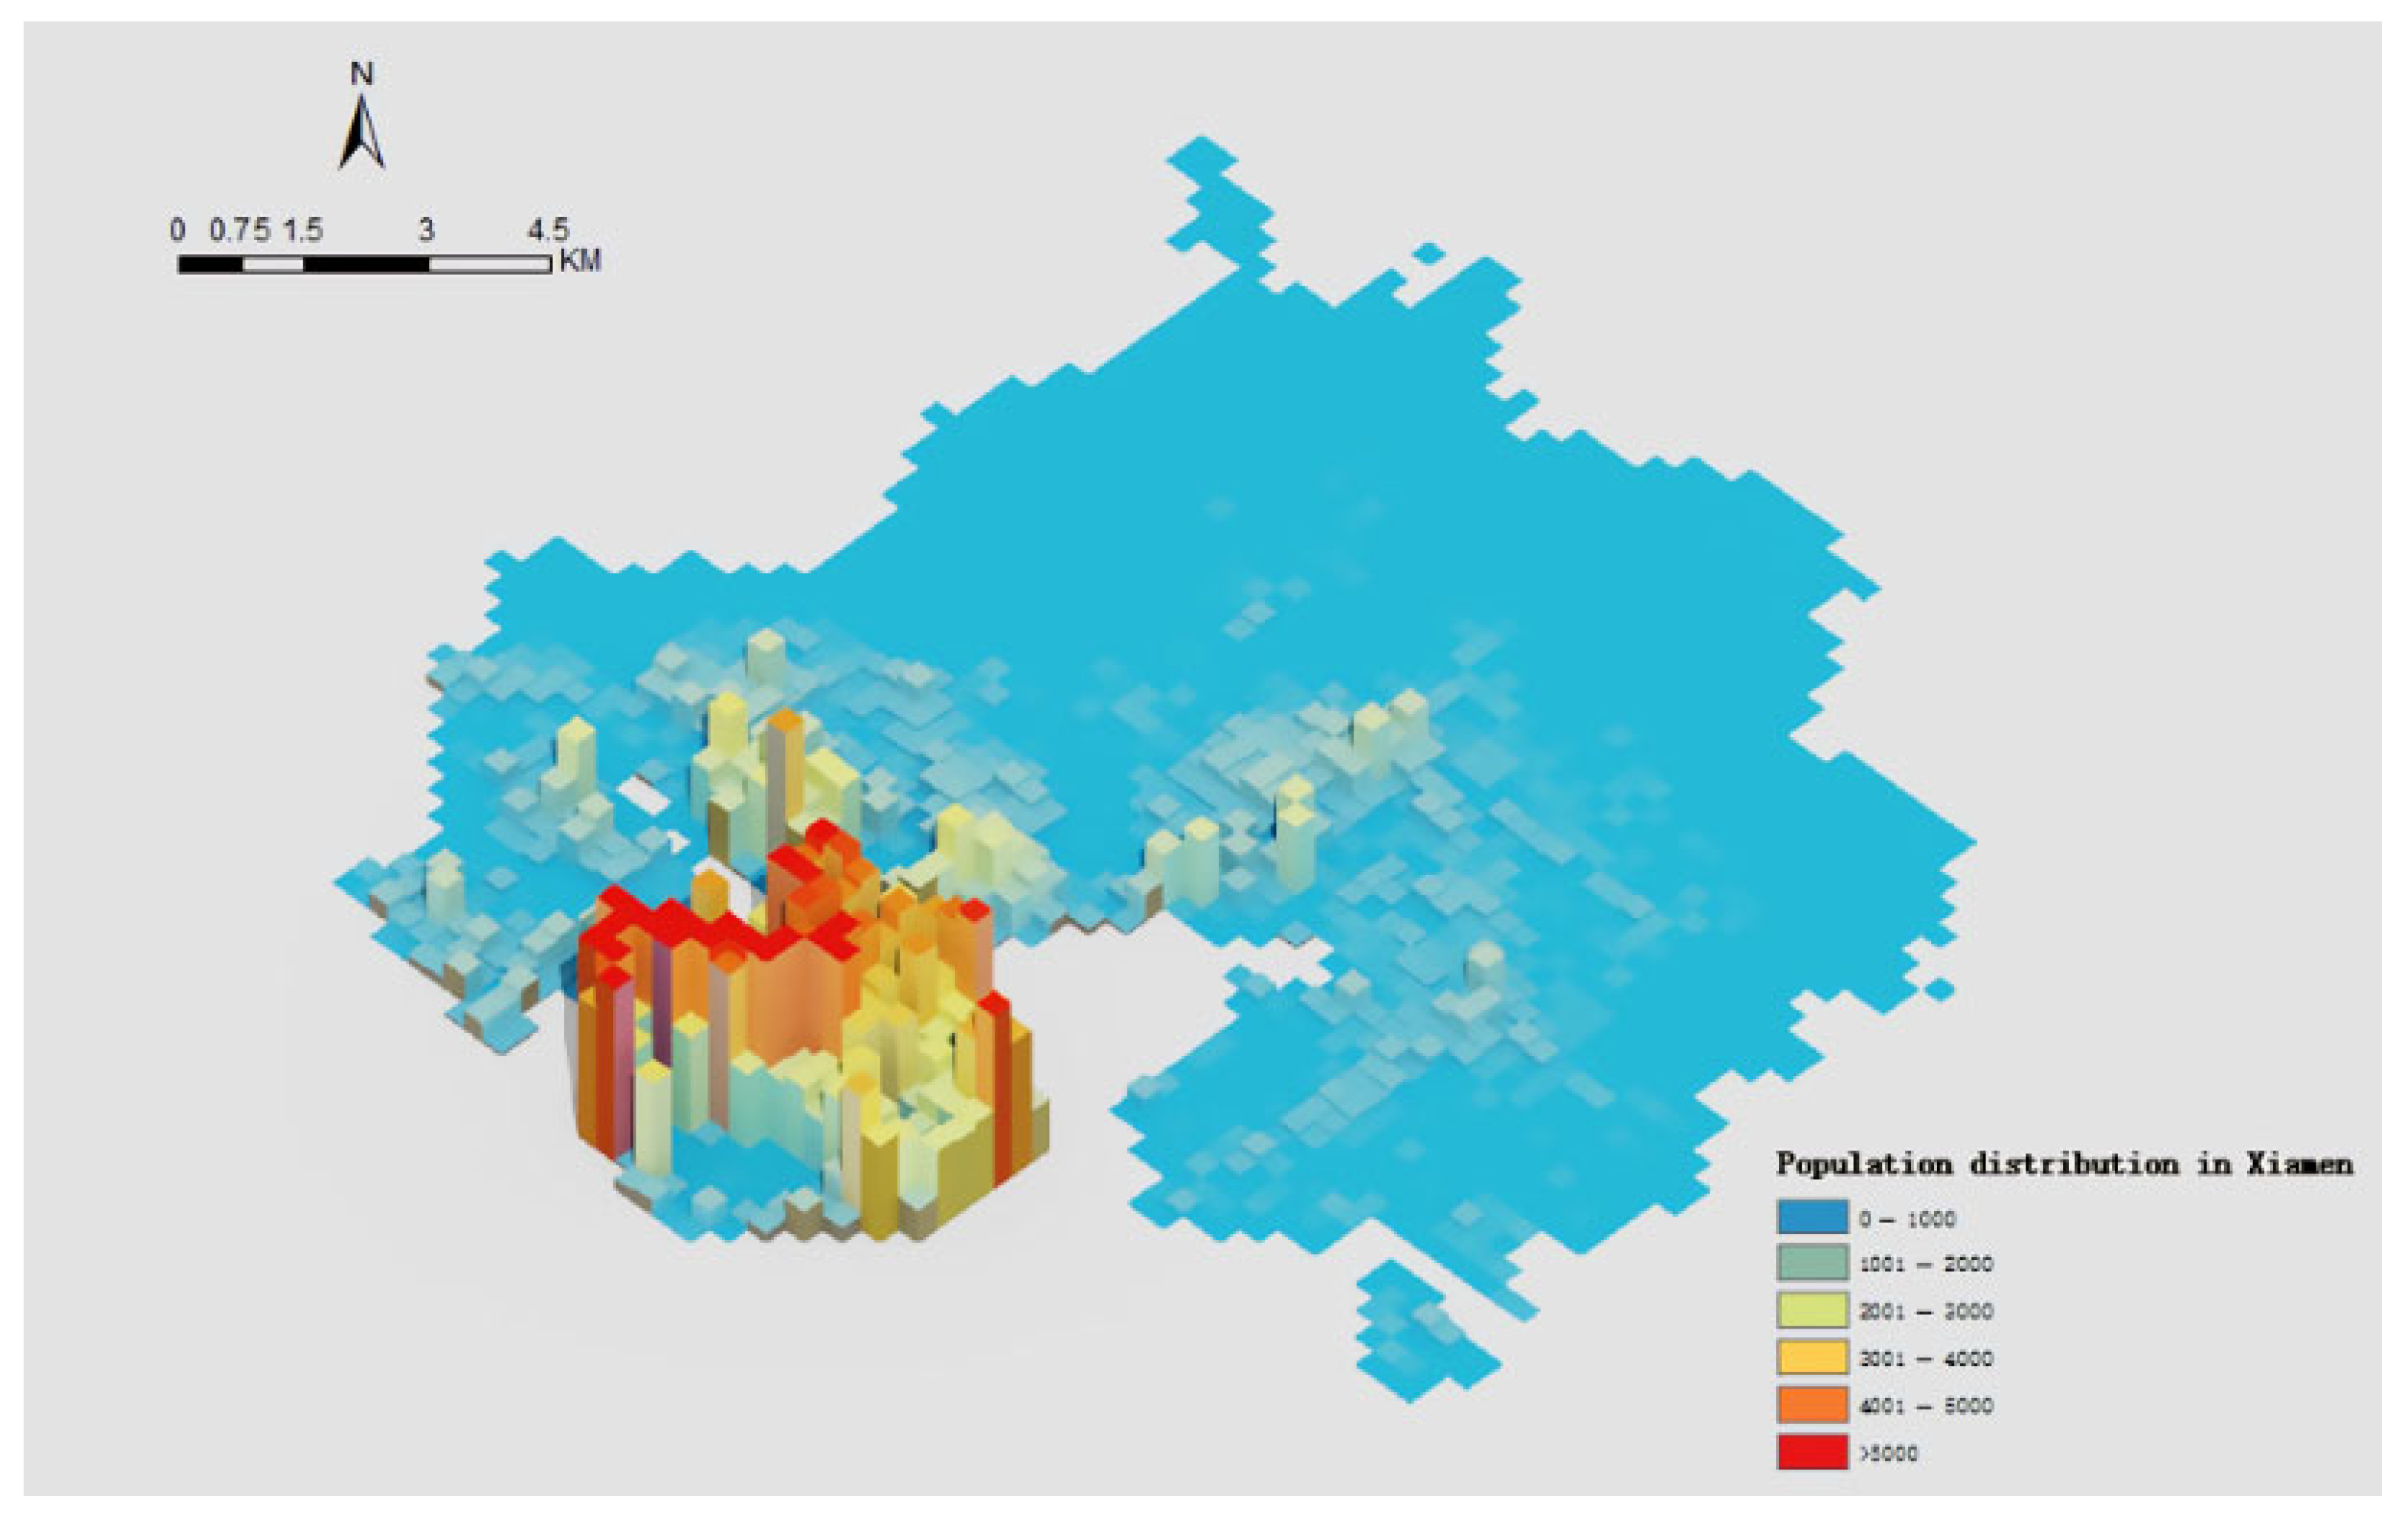
This study uses a high-resolution gridded population dataset provided by the Xiamen Municipal Bureau of Statistics to depict the spatial distribution of residents across Siming and Huli Districts in Xiamen (Figure 3). The dataset represents population counts aggregated at the grid-cell level and is visualized in 3D to capture vertical differences in density. The classification ranges from under 1000 to over 5000 individuals per grid cell. This dataset serves as a foundational layer for identifying high-density residential zones and for evaluating service coverage in relation to physical activity facility accessibility.

3.2.2. Points of Interest (POI) Dataset

POIs reflect the functional layout of urban spaces and are key to understanding accessibility to PA-related services. This study extracts POIs from Gaode Map using a recursive quadtree-based spatial indexing method to bypass Application Programming Interface (API) data limitations and ensure comprehensive coverage. The retrieval process includes:
(1) Polygon-based API retrieval, segmenting Siming and Huli Districts into sub-regions to capture all sports facility POIs;
(2) Data transformation and standardization, converting results into GeoJSON and extracting key attributes (name, category, location);
(3) Coordinate conversion, using Python’s (Python 3.8) coord-convert library to convert from GCJ-02 to WGS84 format for GIS compatibility.
Figure 4 shows the spatial distribution of sports-related POIs, which include outdoor stadiums, community fitness centres, and recreational parks. These POIs are analyzed for their spatial relationship with road connectivity, public transport, and population hotspots.

3.2.3. Transport Network Dataset

Transport infrastructure facilitates or hinders access to PA facilities. This study constructs a multimodal transport network dataset comprising road segments (sourced from OpenStreetMap), public bus stops, and metro stations (from Gaode Map). Figure 5 presents the finalized transport network dataset that includes 15,724 road segments across Xiamen. This integrated dataset provides a robust foundation for subsequent analysis of transport accessibility and spatial structural patterns.

3.3. Data Analysis

To assess the spatial distribution, accessibility, and structural characteristics of PA facilities in Xiamen, this study employs a suite of geospatial analysis methods within a 500 m × 500 m grid-based framework. These methods include hot spot detection, network-based accessibility modelling, cumulative opportunity analysis, and street network analysis. All spatial computations are standardized using the WGS84 coordinate system and a consistent spatial unit for analytical comparability.

3.3.1. Road Accessibility Analysis

To assess the ease with which residents can reach PA facilities through the road network, this study develops a network-based accessibility model using road data obtained from OpenStreetMap. A constant travel speed of 60 km/h is applied to all road segments in order to simulate general travel conditions. This choice is supported by the Chinese national road design standard (CJJ37-2012), which sets 60 km/h as the design speed for many main arterials. In addition, in Xiamen some primary urban roads are limited to or have been adjusted to a speed of 60 km/h, providing local empirical precedent for this assumption. Based on this, the travel time between the centroid of each 500 m × 500 m grid and the nearest PA facility is calculated using the shortest path distance along the road network.
The accessibility of each grid i is defined as the minimum estimated travel time to a facility, which is expressed as Equation (1) [16]:
A i = m i n j F   D i j V
where A i is the estimated travel time from grid cell i to the closest PA facility; D i j represents the shortest path length along the road network from cell i to facility j ; V is the assumed travel speed (60 km/h); F denotes the set of all PA facilities.

3.3.2. Road Network Connectivity Analysis

In addition to road-based accessibility, this study includes street network connectivity as a spatial structural variable to evaluate the configuration of the urban transportation system. Based on the principles of space syntax, connectivity measures the number of direct connections that each road segment maintains with adjacent segments. This indicator reflects the degree to which a given street segment is embedded in the local street structure, which in turn influences movement potential and walkability.
The analysis adopts a segment-based approach, where each road segment is treated as an independent unit. The connectivity for a given segment i is calculated using the following Formula (2) [25]:
C i = j = 1 n   δ i j
where C i is the connectivity value of segment i ; δ i j = 1 if segment j is directly connected to segment i and 0 otherwise; n is the total number of segments in the graph.
To ensure consistency with the overall spatial framework, segment-level connectivity scores are aggregated to the 500 m × 500 m grid level. Within each grid, the average connectivity of all segments is calculated to derive a composite connectivity value.

3.3.3. SHAP-Based Spatial Interpretation Methodology

To systematically investigate how built environment features influence the usage intensity of PA facilities, this study proposes a four-stage modelling and interpretation framework. The workflow comprises: Random Forest modelling, SHAP-based model interpretation, spatial mapping of explanatory values, and spatial autocorrelation and clustering diagnosis. This integrated approach combines the predictive power of machine learning with the structural inference of spatial statistics, enabling the identification of both variable importance and spatial heterogeneity of impact.
(1)
Random Forest Modelling
The first step involves employing a Random Forest regressor to model the non-linear relationships between built environment variables and the usage intensity of PA facilities. As an ensemble learning method, Random Forest integrates multiple decision trees to capture high-order interactions and non-linearity [16,43,44,45], making it highly suitable for modelling complex urban systems.
The model prediction function is expressed as Equation (3) [16]:
y ^ = 1 T t = 1 T   h t ( x )
where y ^ hat is the predicted value, T denotes the number of trees, and h t ( x ) is the output of the t regression tree.
Additionally, the Random Forest model produces feature importance metrics to quantify each variable’s overall contribution, which informs the subsequent interpretation process.
(2)
SHAP Model Interpretation
To enhance the interpretability of model outcomes, the SHAP algorithm is adopted. Derived from game theory, SHAP quantifies the marginal contribution of each variable to individual predictions and guarantees properties of consistency and local accuracy.
For any spatial unit i , the prediction is decomposed as (4) [21]:
f ( x i ) = ϕ 0 + j = 1 M   ϕ i j
where f ( x i ) is the predicted outcome, ϕ 0 is the baseline (expected value), and ϕ i j denotes the contribution of feature j to the prediction for sample i . M is the number of input features.
SHAP allows the identification of positive or negative influences across different spatial units, laying the groundwork for understanding spatially heterogeneous mechanisms of built environment effects.
(3)
Spatial Mapping of SHAP Values
To uncover spatial patterns in the variable contributions, SHAP values are mapped to each grid cell (500 m × 500 m) based on geographic coordinates. For each feature j, its explanatory value is projected onto space as [21]:
S j ( x , y ) = ϕ j | g r i d ( x , y )
where S j ( x , y ) represents the SHAP value of feature j at the grid location ( x , y ) .
This spatialization step enables the visual identification of zones where specific built environment features exert stronger or weaker explanatory power. It links behavioural interpretation with urban spatial structures, enriching the diagnostic value of the model.
(4)
Spatial Autocorrelation and LISA Cluster Detection
Following SHAP spatial mapping, spatial statistical techniques are employed to assess the structure of explanatory strength. First, global Moran’s I is used to quantify the overall spatial autocorrelation of SHAP values. The formula is Equation (6) [1]:
I = n i   j   w i j · i   j   w i j ( ϕ i ϕ ¯ ) ( ϕ j ϕ ¯ ) i   ( ϕ i ϕ ¯ ) 2
where ϕ i is the SHAP value at unit i , w i j is the spatial weight matrix, ϕ ¯ is the global mean of SHAP values, and n is the number of observations.
Next, Local Indicators of LISA are applied to identify significant local clusters of explanatory values. The local Moran’s I for unit iii is defined as (7) [1]:
I i = ( ϕ i ϕ ¯ ) j   w i j ( ϕ j ϕ ¯ )
LISA clusters are categorized into types such as “High–High” and “Low–Low”, which help detect zones of strong local influence or marginalized impact, thereby improving spatial resolution and supporting location-specific interventions.

4. Results and Discussion

This study employs a Random Forest model to predict the intensity of physical activity facility use. The SHAP method is applied to quantify the marginal contributions of built environment variables, revealing their influence mechanisms on residents’ physical activity behaviours. To investigate the spatial heterogeneity of these effects, spatial autocorrelation analysis is conducted: Global Moran’s I is used to assess the spatial clustering of SHAP values, while LISA identifies high–high and low–low clusters to capture localized impact patterns.

4.1. Spatial Distribution Characteristics

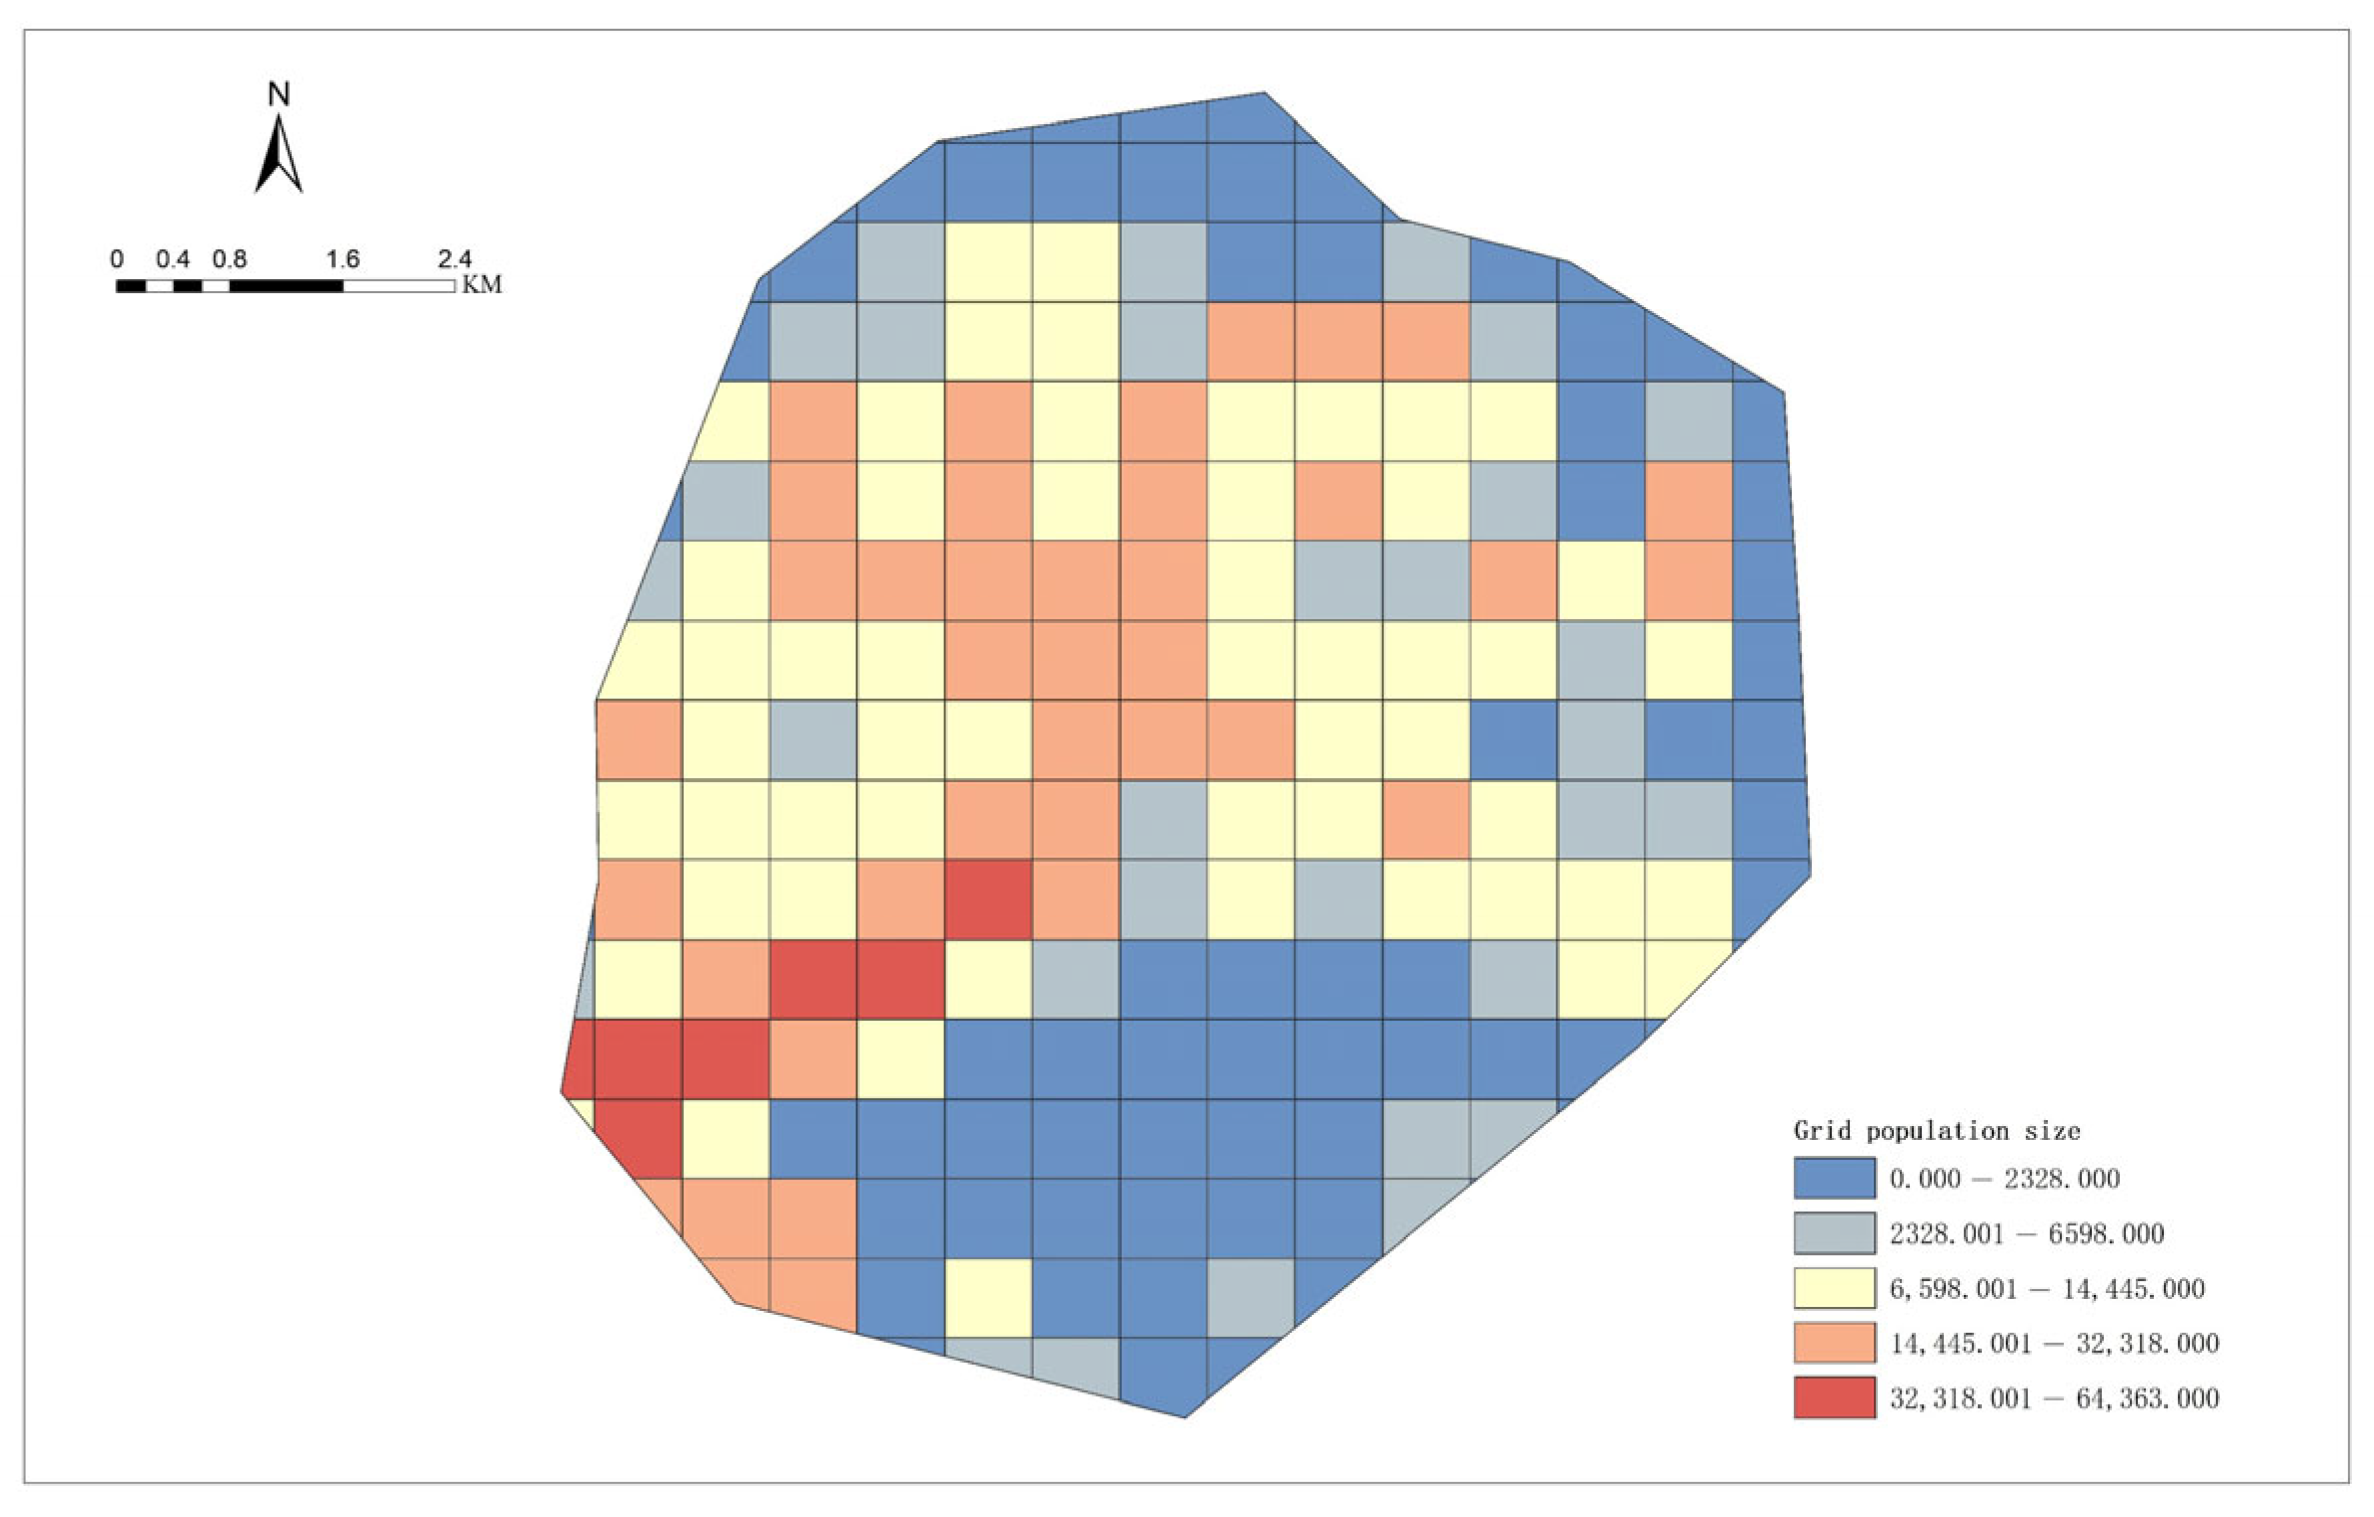
The spatial distribution of population across the study area reveals significant intra-urban heterogeneity. High-density clusters are primarily observed in the southern and central zones, where multiple grids record over 32,000 residents (Figure 6). These areas correspond to mature residential communities and commercial hubs with dense urban development. In contrast, the peripheral northern and eastern edges of the study area exhibit considerably lower population densities, often associated with institutional land, ecological zones, or underdeveloped parcels. This distribution suggests a spatial gradient where urban vitality and demographic concentration are strongest near the core and progressively weaken toward the periphery.
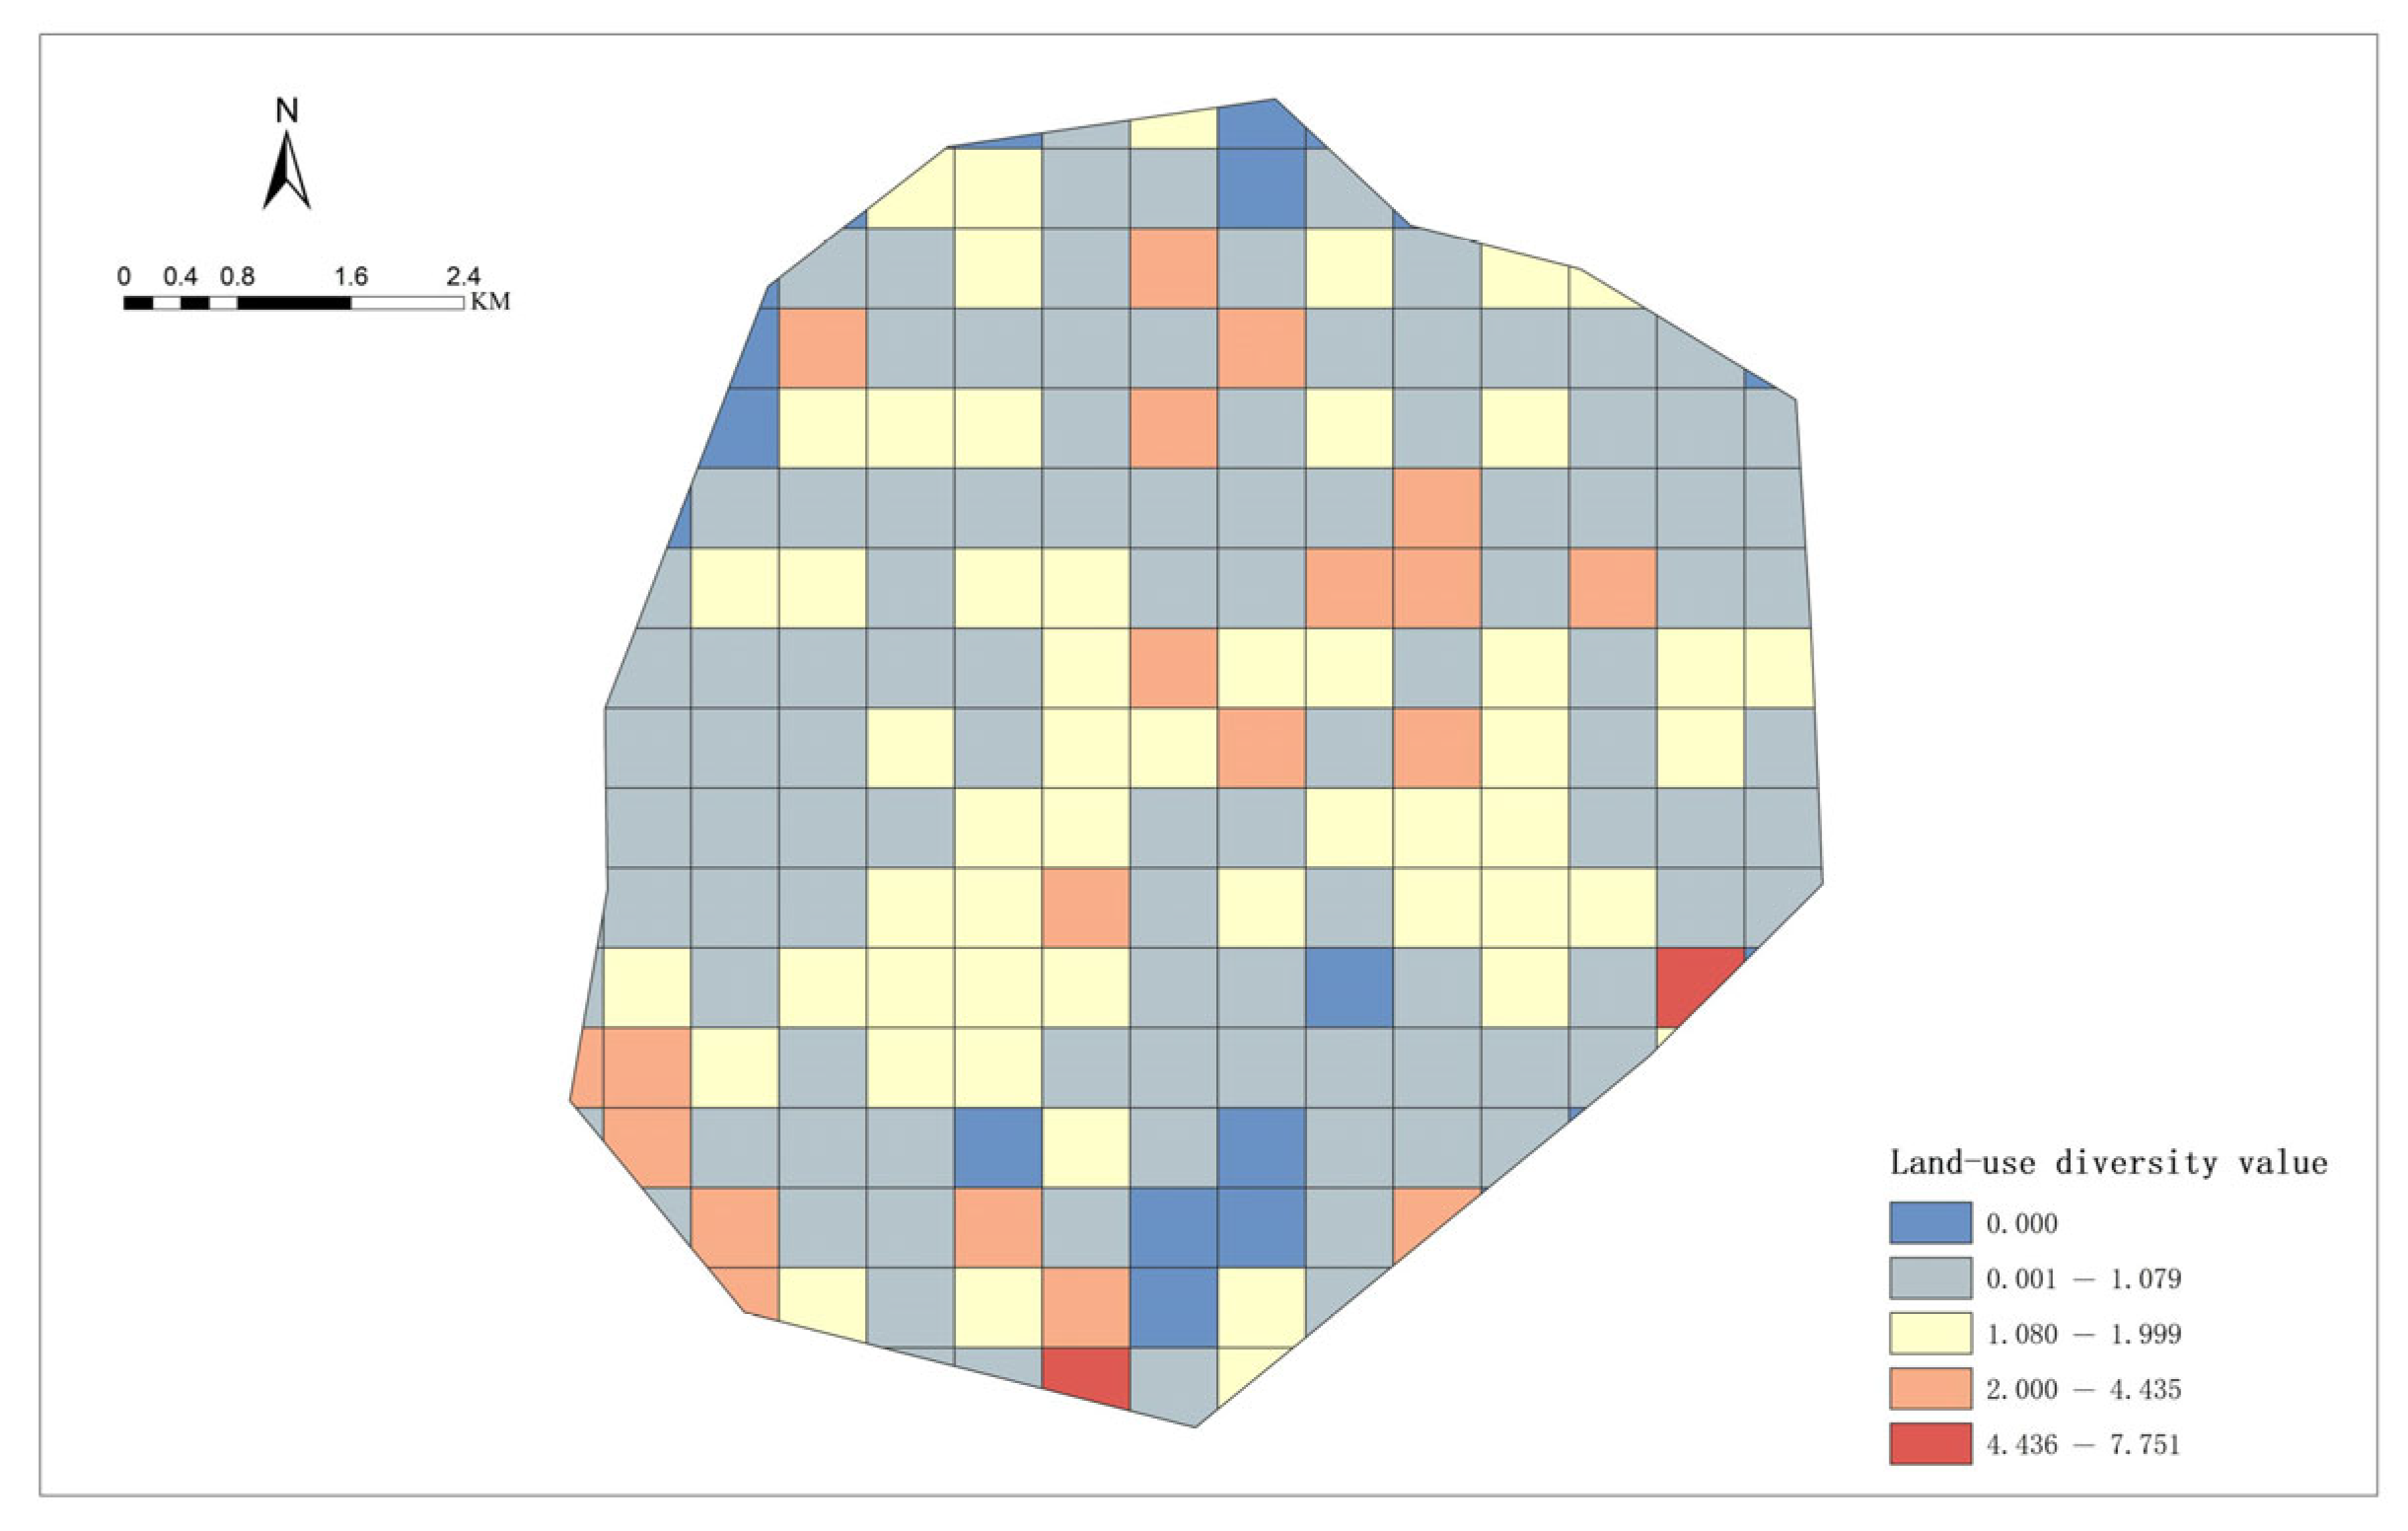
The land use diversity that measures functional mixing within each grid cell shows a fragmented but patterned spatial structure (Figure 7). Moderate levels of land use diversity are common, with higher values scattered near major transport corridors and urban nodes—locations typically associated with mixed-use development. Grids with low or zero diversity are primarily concentrated in mono-functional zones, such as single-use residential estates, large parks, or administrative campuses. These findings imply that while the study area as a whole maintains a mixed-use character, localized functional imbalances persist, influencing daily activity patterns and accessibility.
Figure 8 illustrates the spatial distribution of physical activity facilities across the study area, revealing a clear pattern of core concentration and peripheral sparsity. The southern and central zones contain several grids with a high number of facilities, some exceeding 15 per grid. These areas are typically located near parks, residential communities, or school zones, where the availability of land and the demand for active spaces are relatively high. In contrast, the grid situated in the urban northeast and southwest having fewer than five facilities, with some areas containing no more than one, indicating potential service gaps. This spatial configuration suggests a close association between facility placement and built environment characteristics such as population density and land use intensity. Areas with abundant facilities generally coincide with high-density, mixed-use environments, suggesting a demand-responsive model of infrastructure provision. Conversely, zones with low functional diversity or lower levels of urban development exhibit limited access to PA facility resources.
In the city centre and mature residential areas, the concentration of physical activity facilities tends to coincide with high residential density and diverse land use, as observed in grids where the facility count exceeds 15. These zones benefit from established infrastructure, mixed-use development, and sustained population demand. In contrast, peripheral areas—especially those dominated by mono-functional land uses such as institutional or ecological parcels—often lack both the facility quantity and accessibility, with some grids containing fewer than five facilities or none at all. This spatial gap is not only a result of uneven resource distribution but also linked to the fragmented street layouts and low service demand in these regions. To address such disparities, planning efforts should prioritize targeted investments in facility provision and transport integration in underserved areas, rather than uniformly expanding infrastructure across the city.

4.2. Transportation Accessibility and Connectivity

The spatial structure of urban transportation systems plays a critical role in shaping residents’ daily travel behaviours and participation in PA. To systematically evaluate how the transport environment influences accessibility to PA facilities, this study focuses on two key dimensions: road accessibility and street network connectivity. While road accessibility reflects the physical proximity between residents and the street network, connectivity captures the structural efficiency and navigability of that network. The spatial intersection of these two aspects offers important insights into the extent to which transport infrastructure supports or constrains health-promoting urban behaviours.
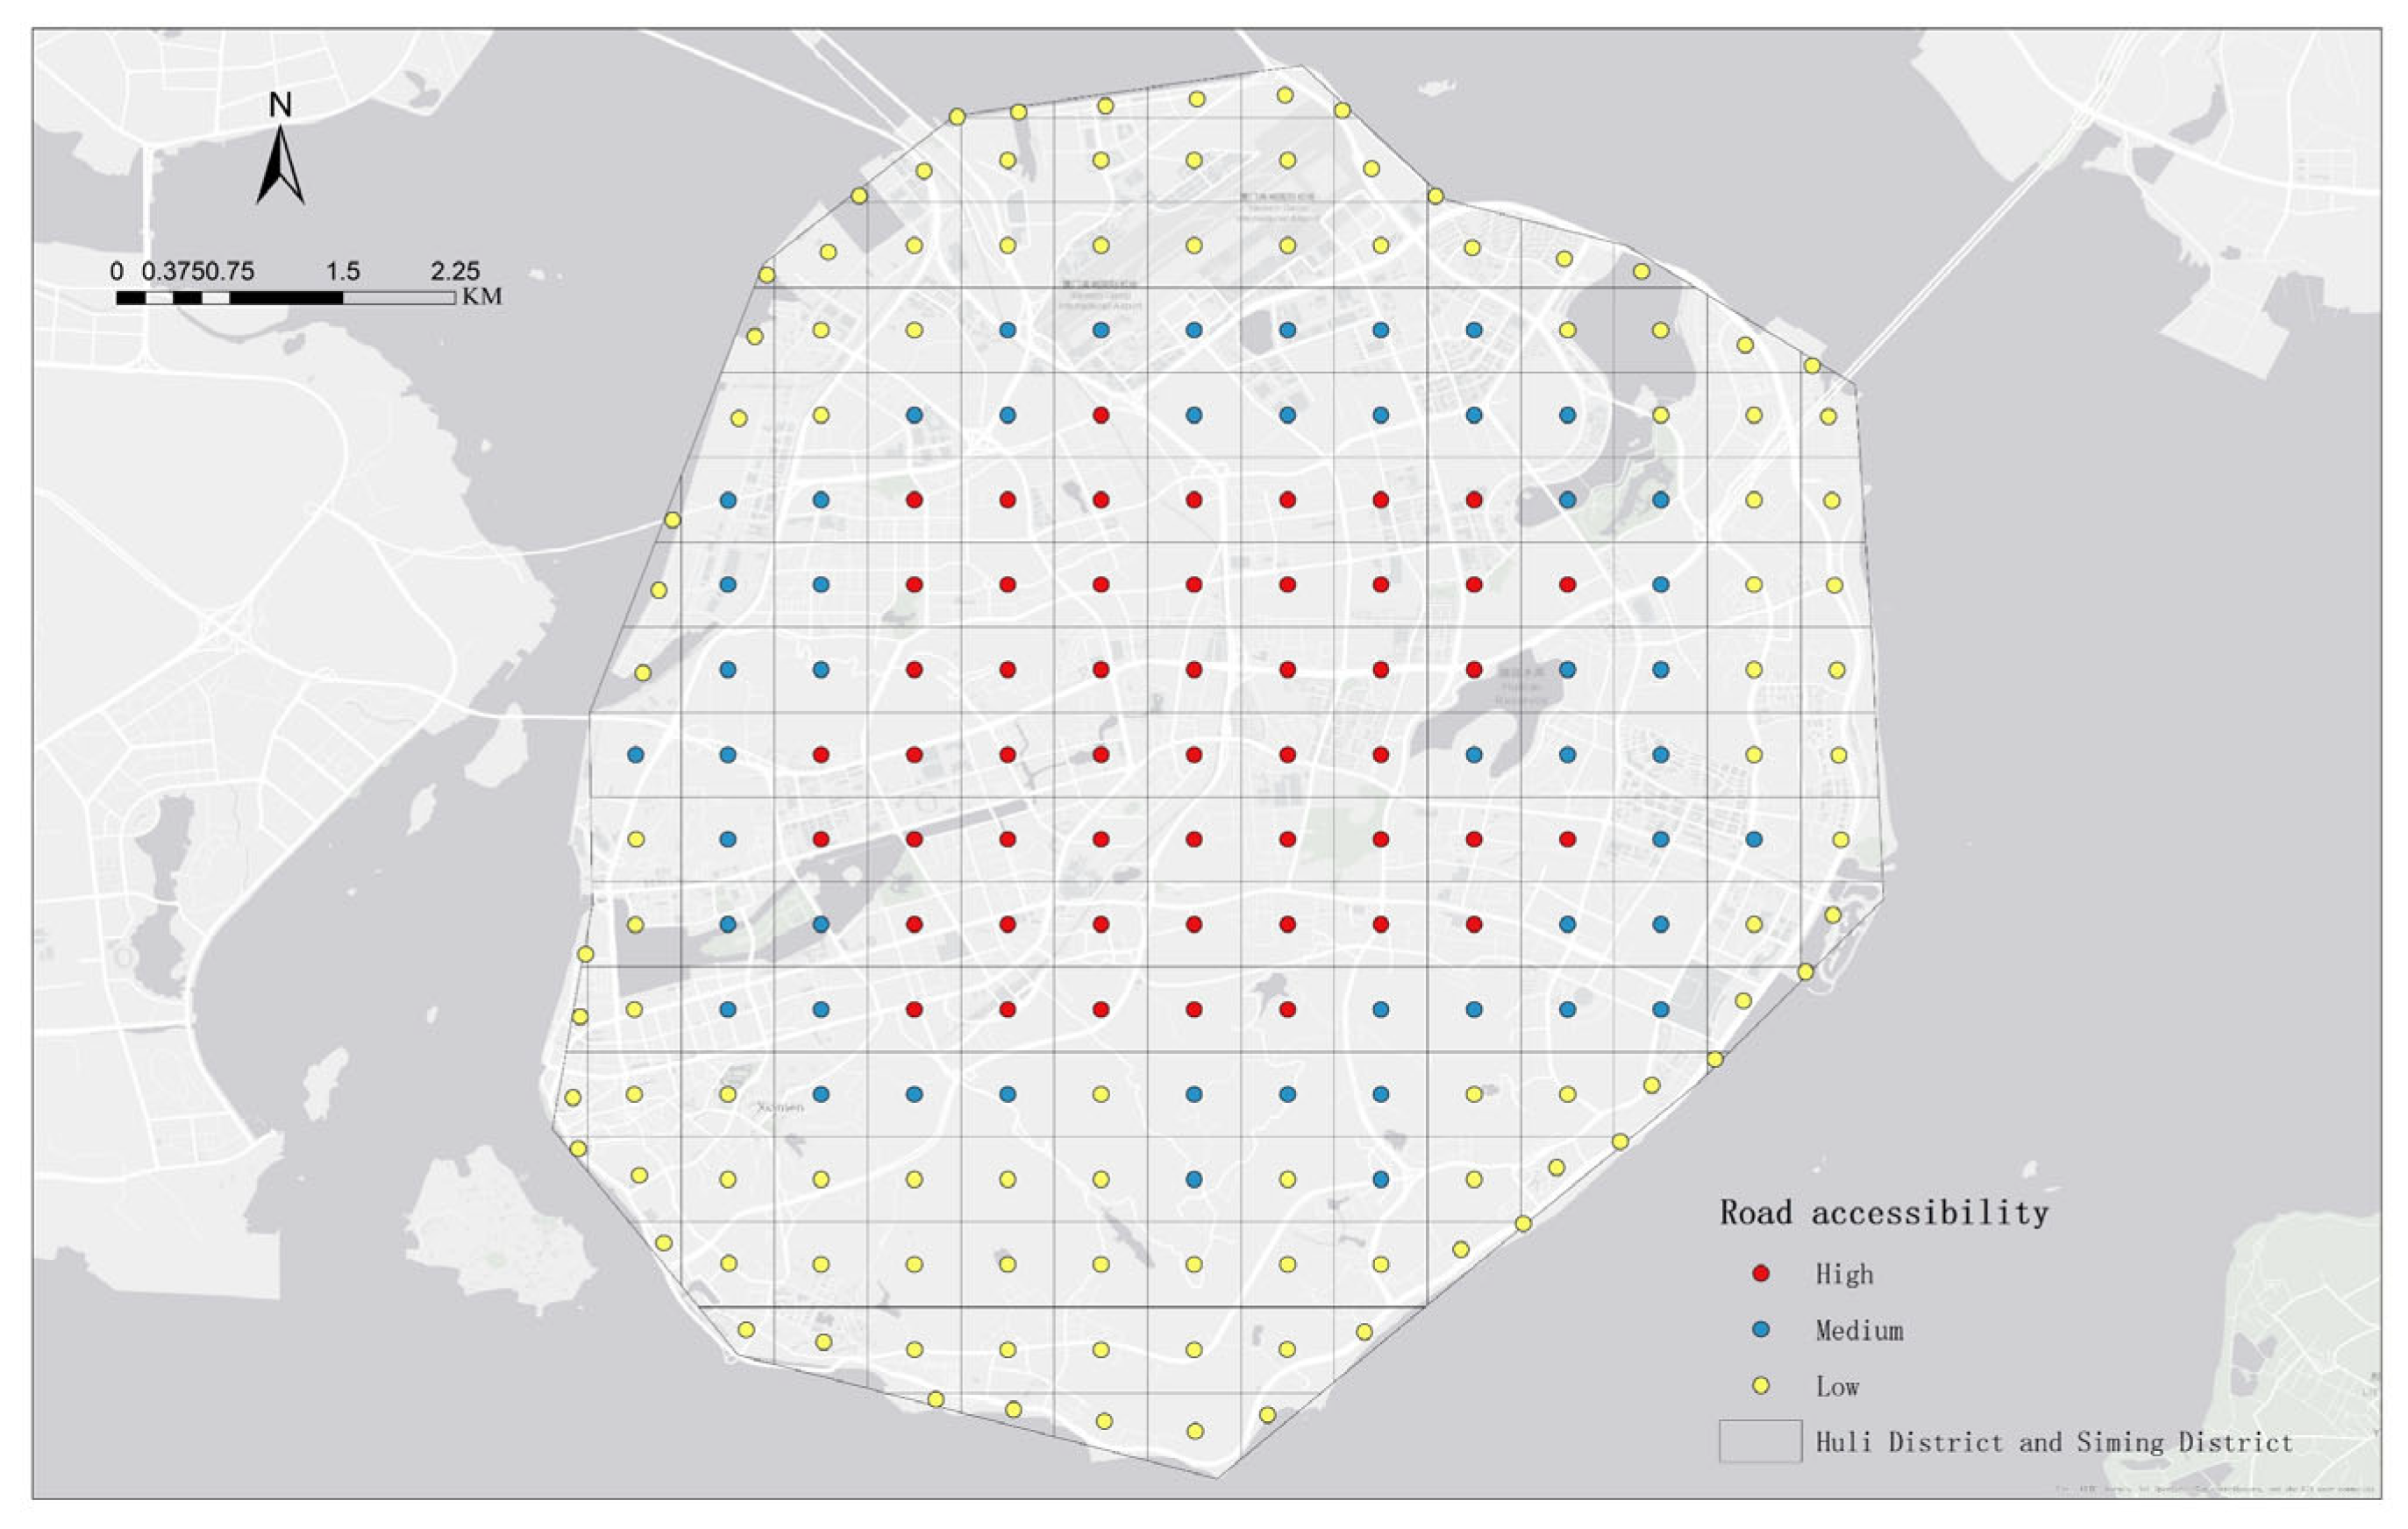
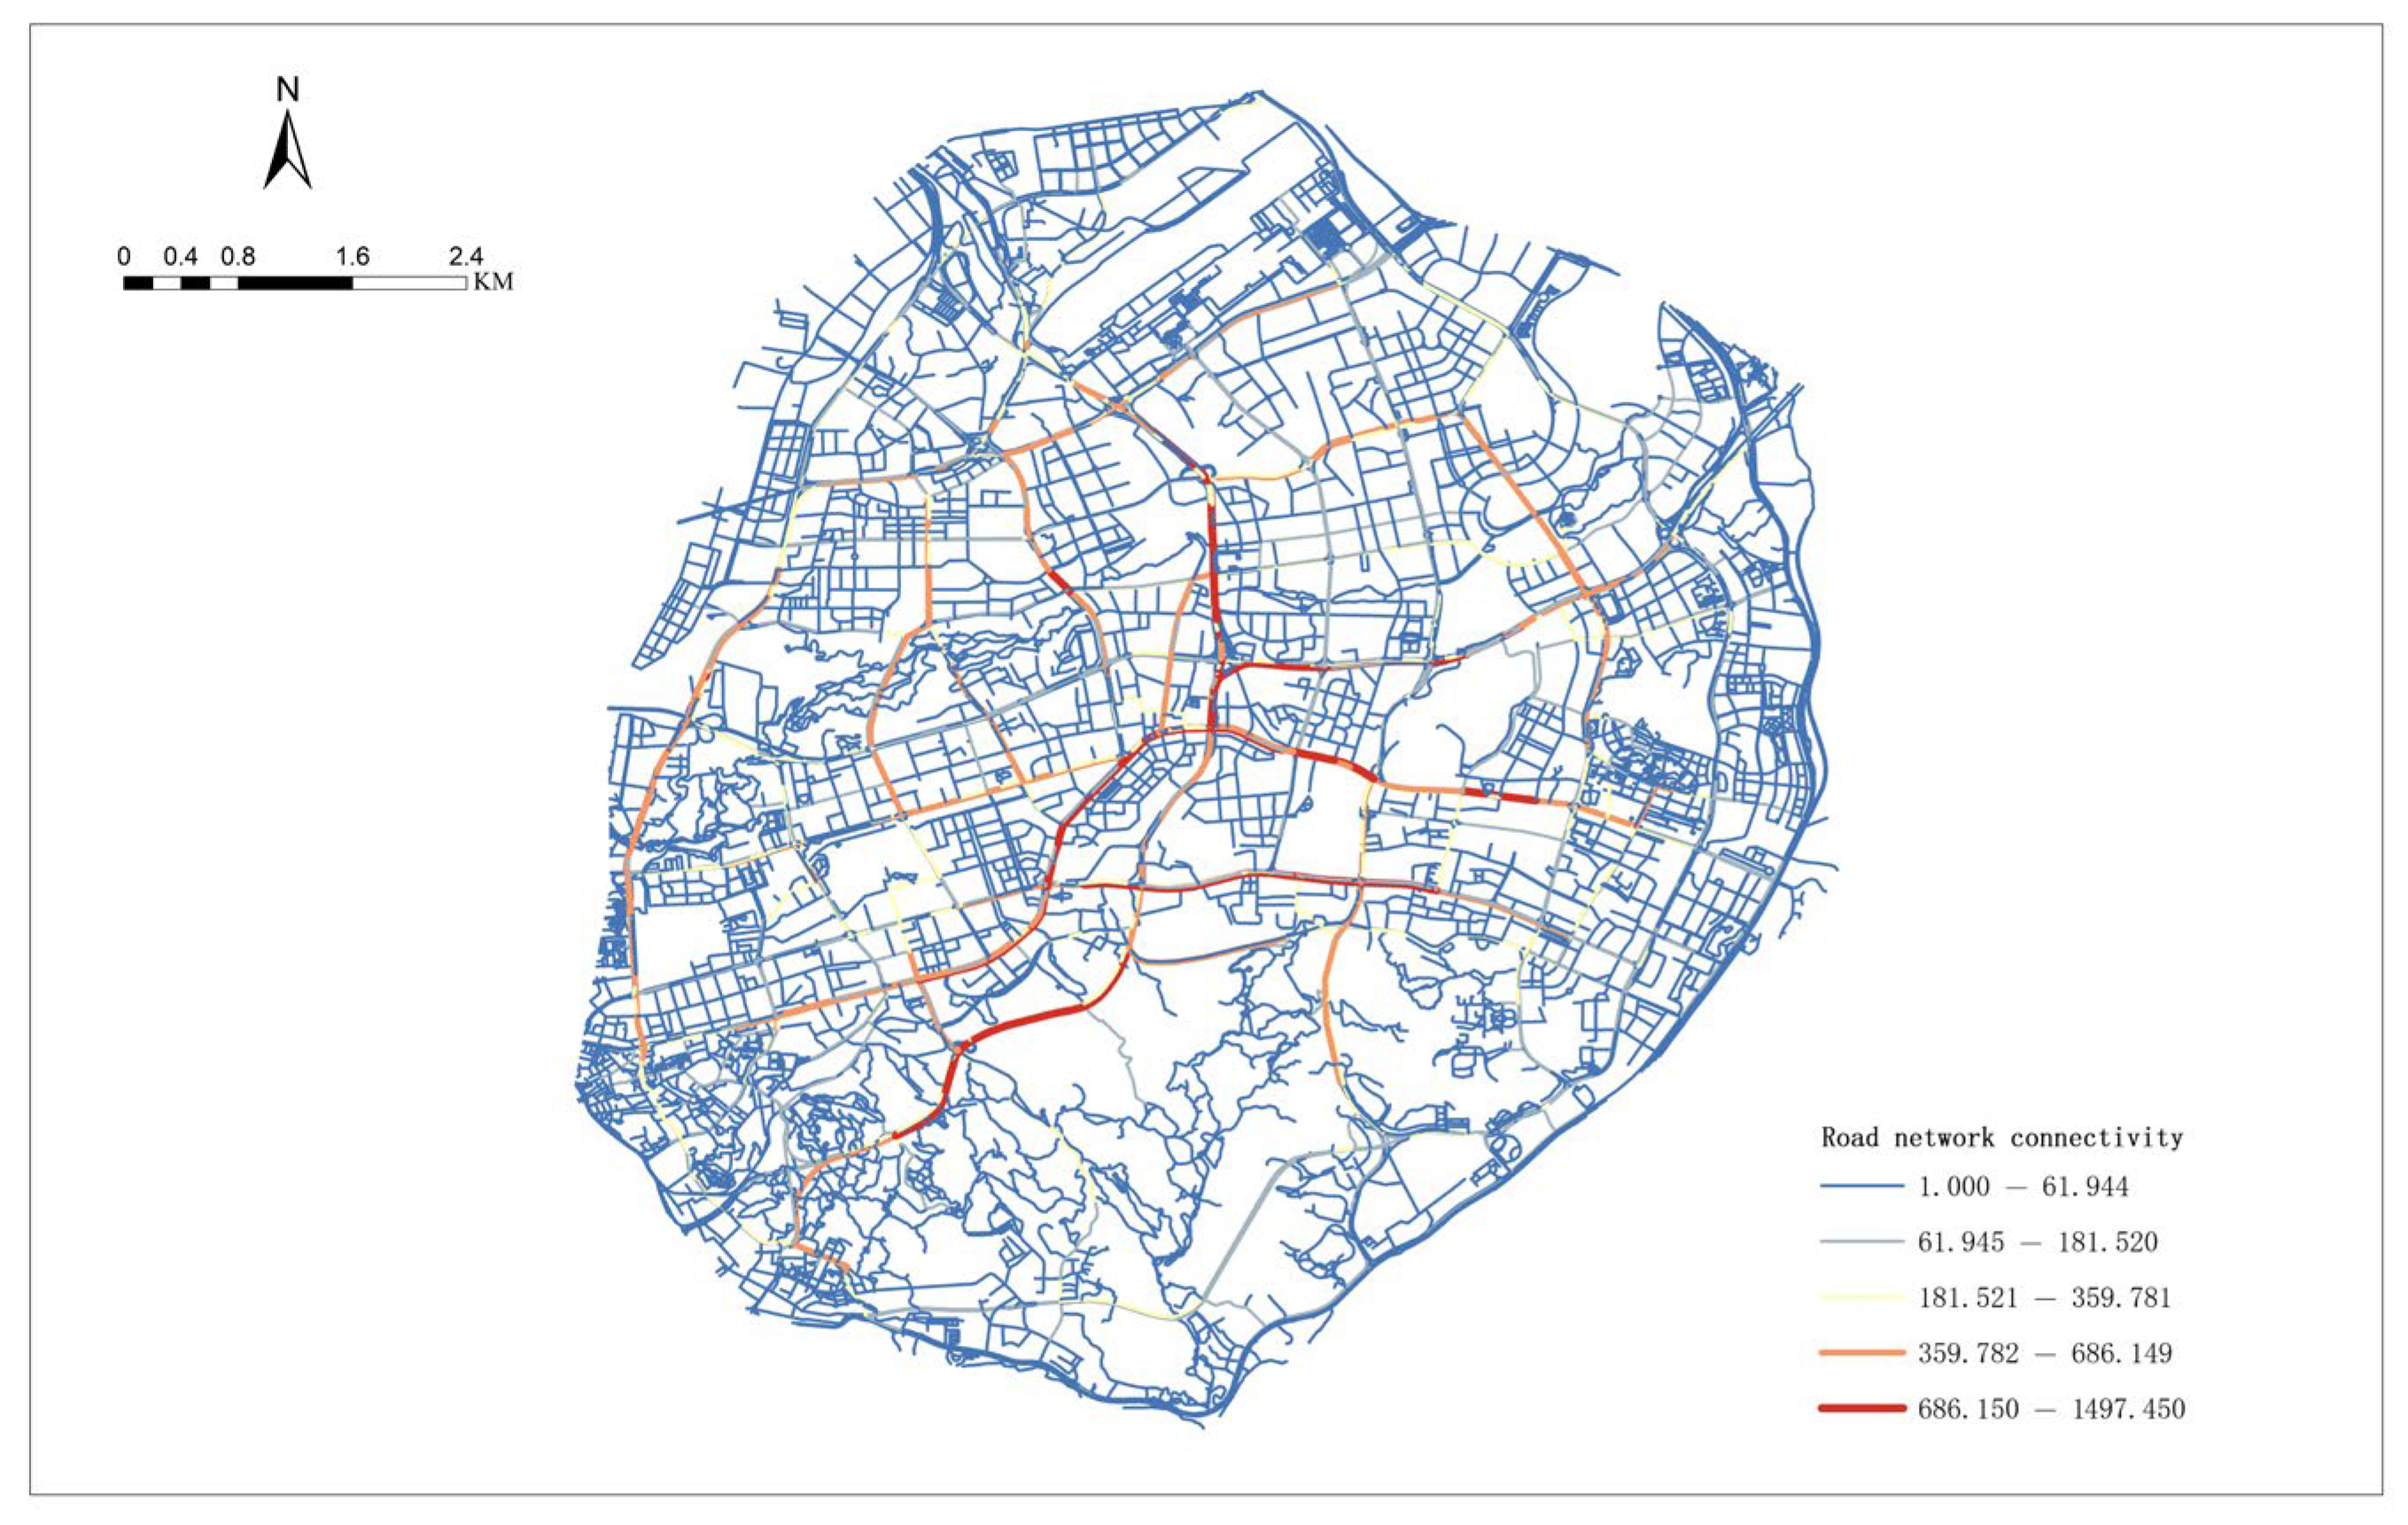
As shown in Figure 9, road accessibility across the study area exhibits a clear spatial gradient. High-accessibility zones are primarily located in the central and southern parts of the city, where road density is high and the coverage is extensive, facilitating convenient walking or cycling to PA facilities. In contrast, the northern and eastern peripheries demonstrate relatively poor accessibility, often associated with fragmented street layouts and weaker transportation coverage. Figure 10 further illustrates the connectivity of the road network using topological metrics. The core urban districts and major arterial corridors present a high degree of network integration, forming a well-structured street system that supports efficient circulation. Peripheral zones, by contrast, display lower connectivity, typically found in suburban or mono-functional areas with less cohesive transport infrastructure.
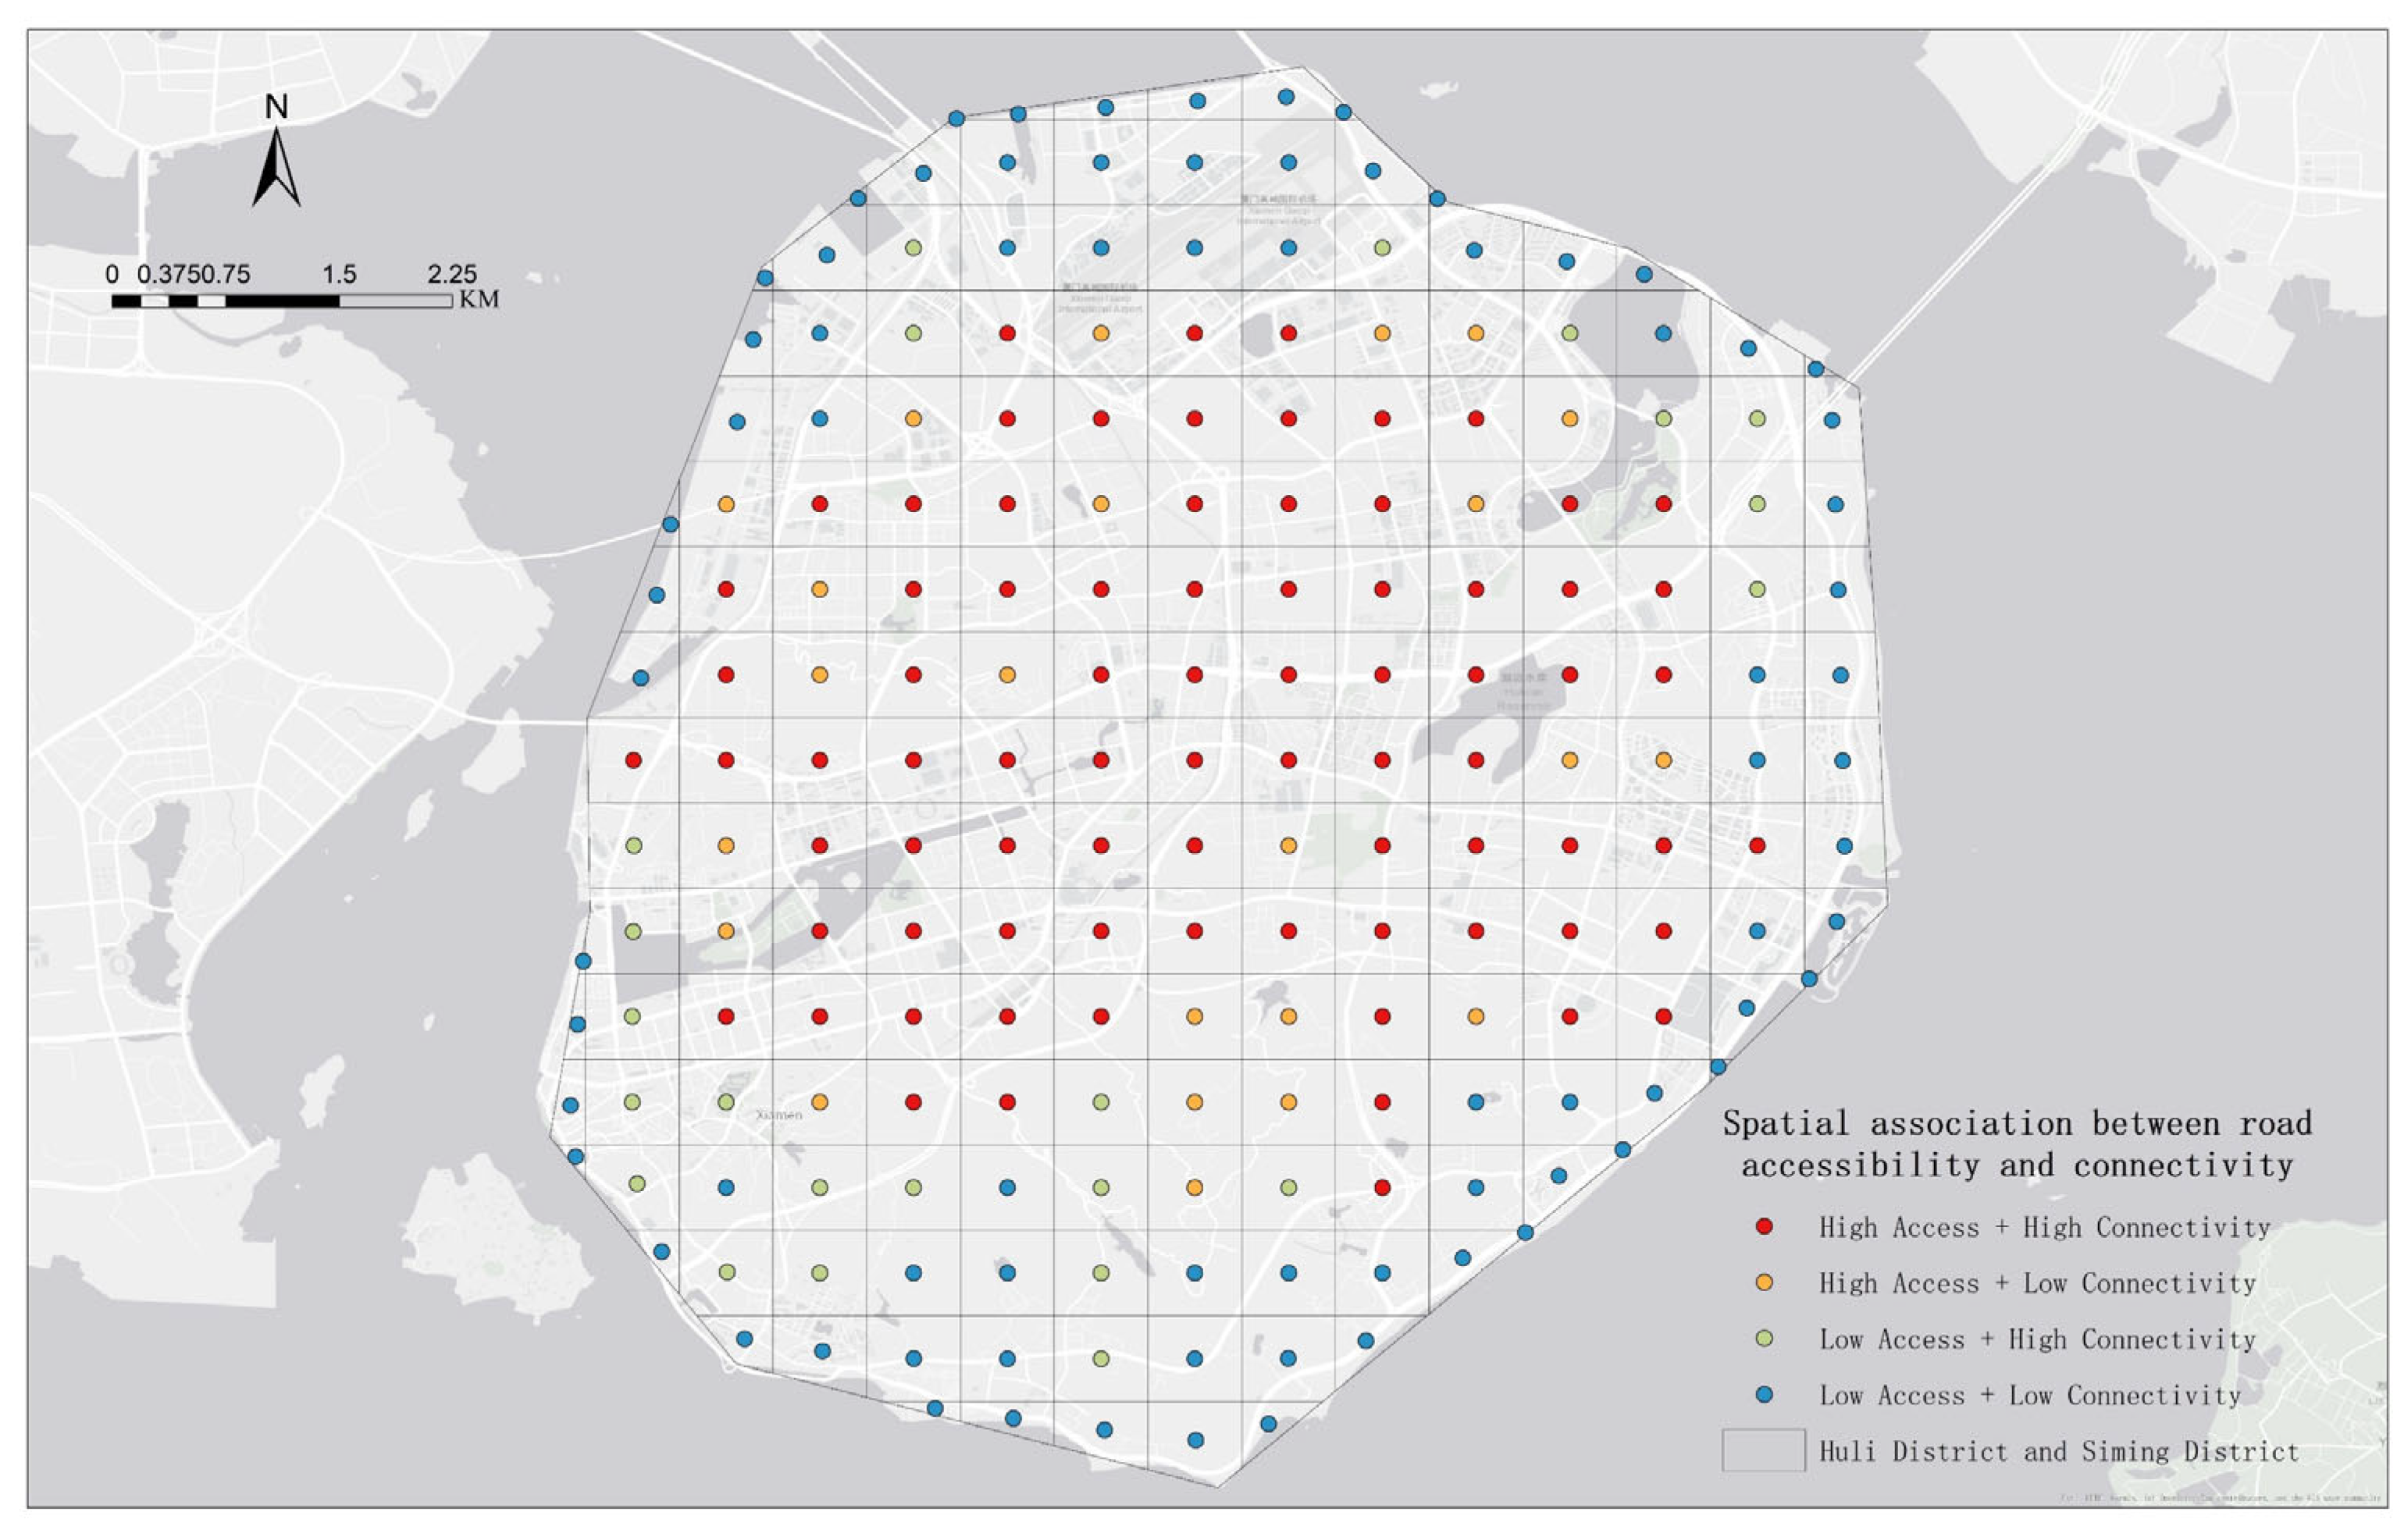
To explore the interplay between accessibility and connectivity, Figure 11 overlays both spatial indicators and classifies each grid cell into one of four composite types: High Accessibility + High Connectivity, High Accessibility + Low Connectivity, Low Accessibility + High Connectivity, and Low Accessibility + Low Connectivity. The results reveal that the central and southern core areas largely fall into the High–High category, offering the most favourable conditions for active mobility and facility use. Zones classified as High Accessibility + Low Connectivity are mainly situated in transitional urban belts, where a dense street network exists but lacks structural integration. Low Accessibility + High Connectivity zones are typically found at the edges of institutional or industrial land parcels—areas where internal road networks are well connected but spatially isolated from the broader system. Finally, Low–Low zones are concentrated in peripheral regions, often underdeveloped and the least conducive to supporting PA behaviours due to compounded spatial disadvantages.
Whether road accessibility and network connectivity are well aligned directly affects how easily residents can reach PA facilities in practice. In central and southern parts of the study area—where roads are both dense and well connected—people are more likely to use nearby facilities on foot or by bicycle. By contrast, in some peripheral or transitional neighbourhoods, broken street networks or poorly integrated road systems can make access difficult, even when facilities exist. These obstacles are especially pronounced for groups with limited mobility, such as older adults, children, or those without access to private vehicles. Recognizing where such disconnects occur helps urban planners focus improvements where they are most needed—for example, by linking dead-end roads, improving pedestrian paths, or relocating facilities to better match how people actually move through the city. Rather than applying uniform standards citywide, addressing these localized gaps can help create more inclusive and health-supportive neighbourhood environments.
These findings are in line with Zhang, Yang [31] and Liu, Wang [34], who also emphasized the importance of street connectivity in shaping walking behaviours. Our results extend this evidence by highlighting that, in a high-density Asian city, road accessibility plays an even more decisive role than facility density.

4.3. Modelling Results and Variable Contributions

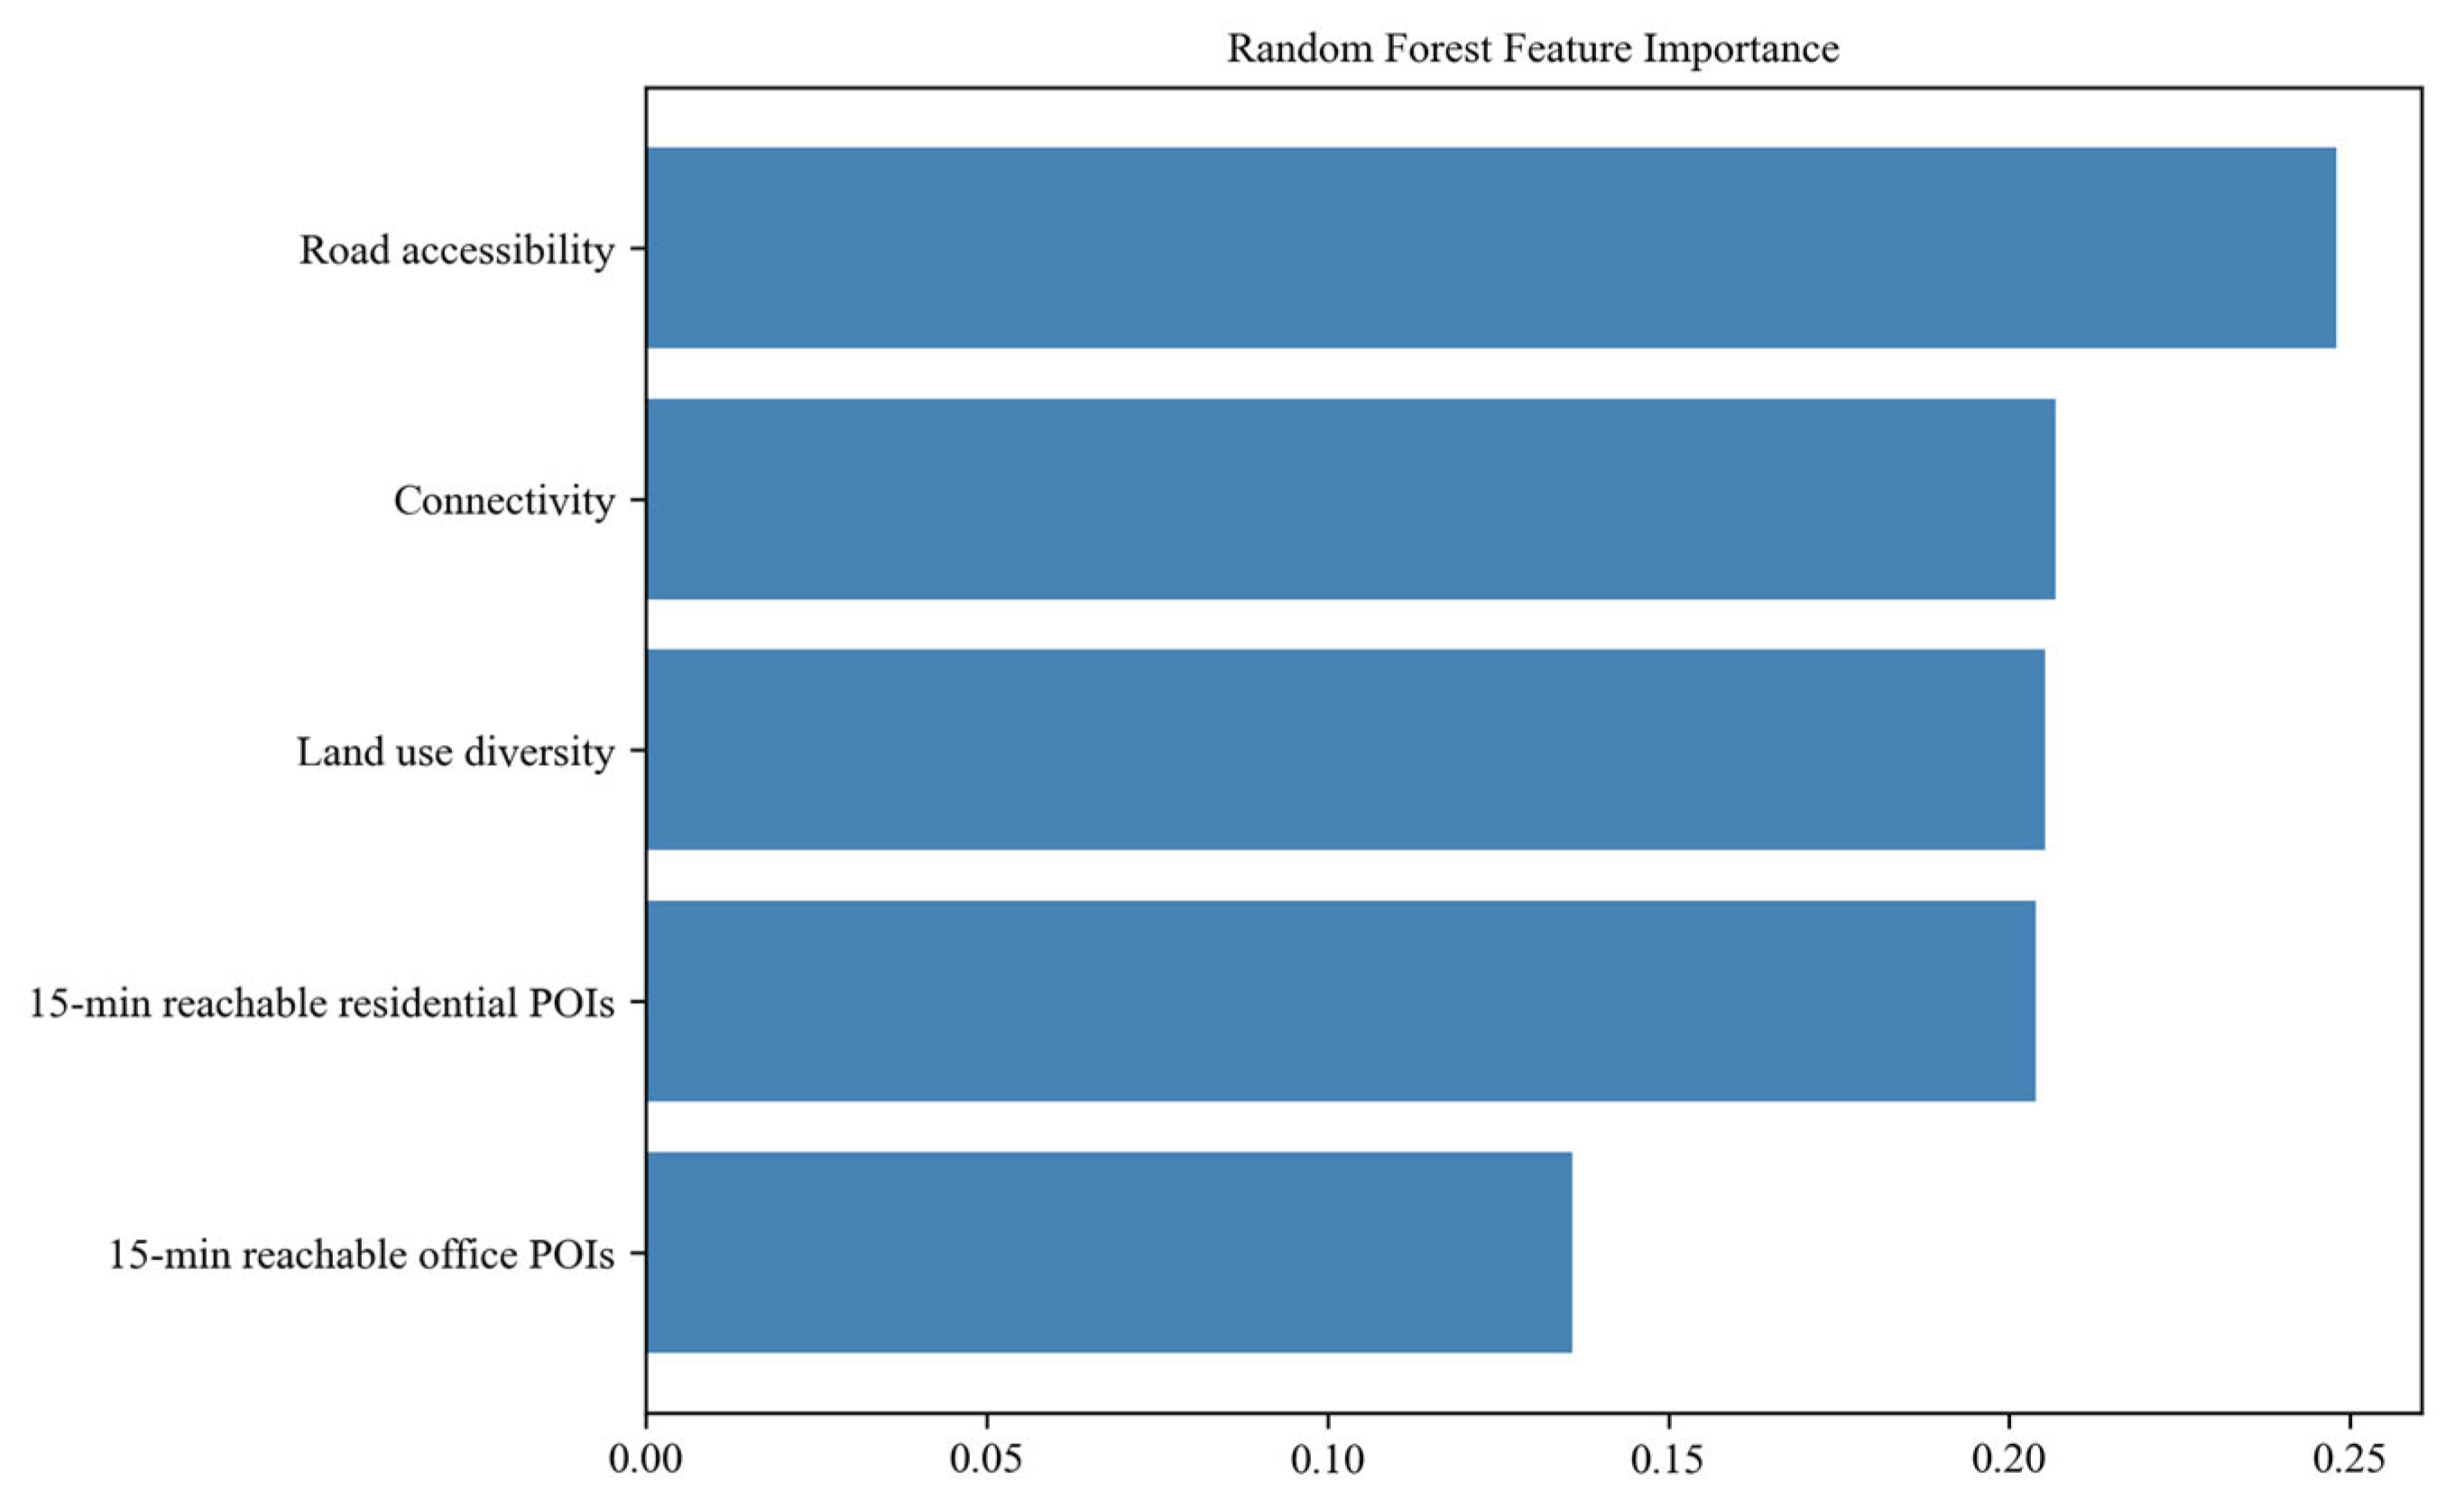
This study employed a random forest regression model to evaluate the relative importance of various built environment attributes on the utilization intensity of PA facilities. The model shows strong predictive performance, with an R2 value of 0.8498 and a root mean square error (RMSE) of 2290.50, indicating a high degree of goodness-of-fit and robust estimation capacity.
Figure 12 presents the ranked importance of predictor variables based on mean decrease in impurity. Among the five variables considered, Road accessibility emerged as the most influential, followed closely by Connectivity, Land use diversity, and 15 min reachable residential POIs. In contrast, 15 min reachable office POIs showed relatively lower importance, suggesting a more limited role in shaping facility use behaviour within the study area.
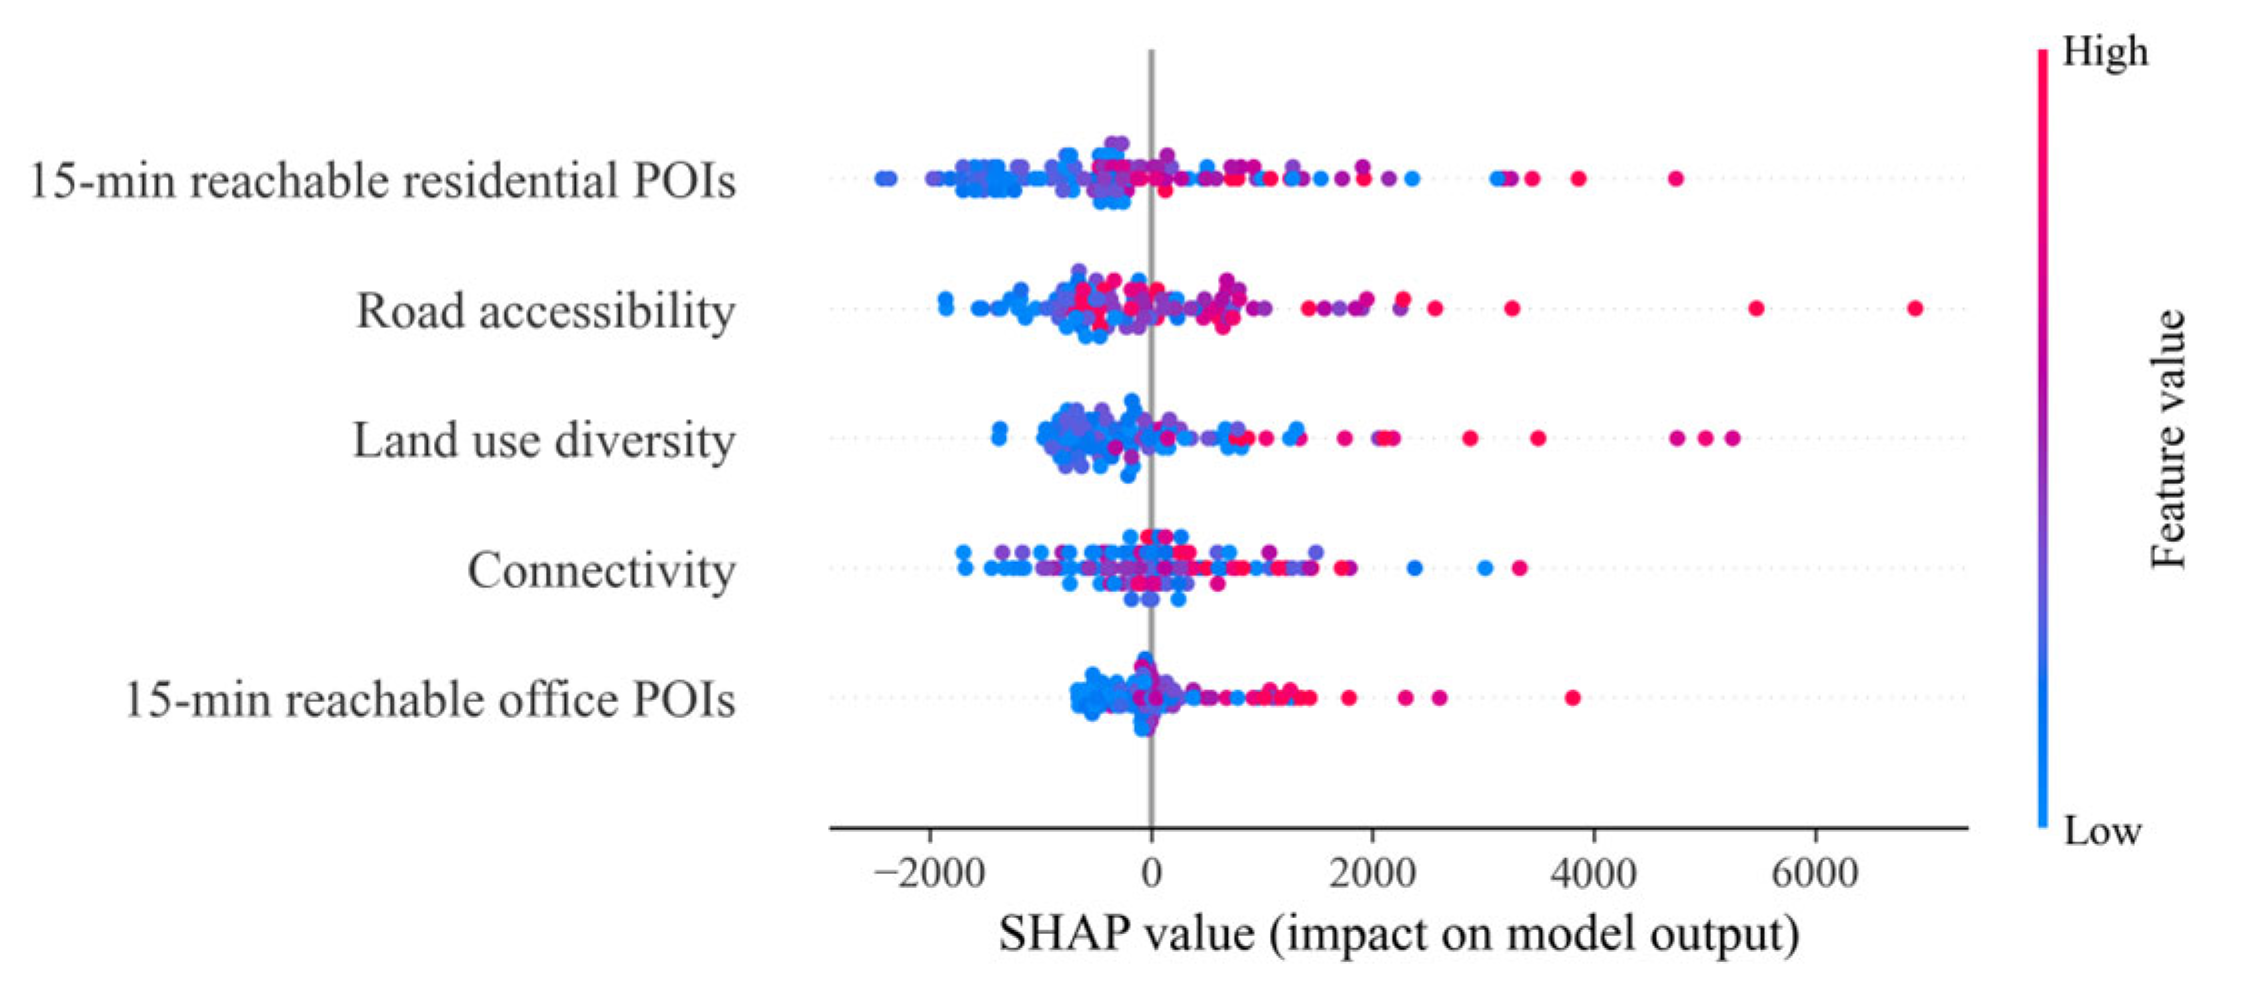
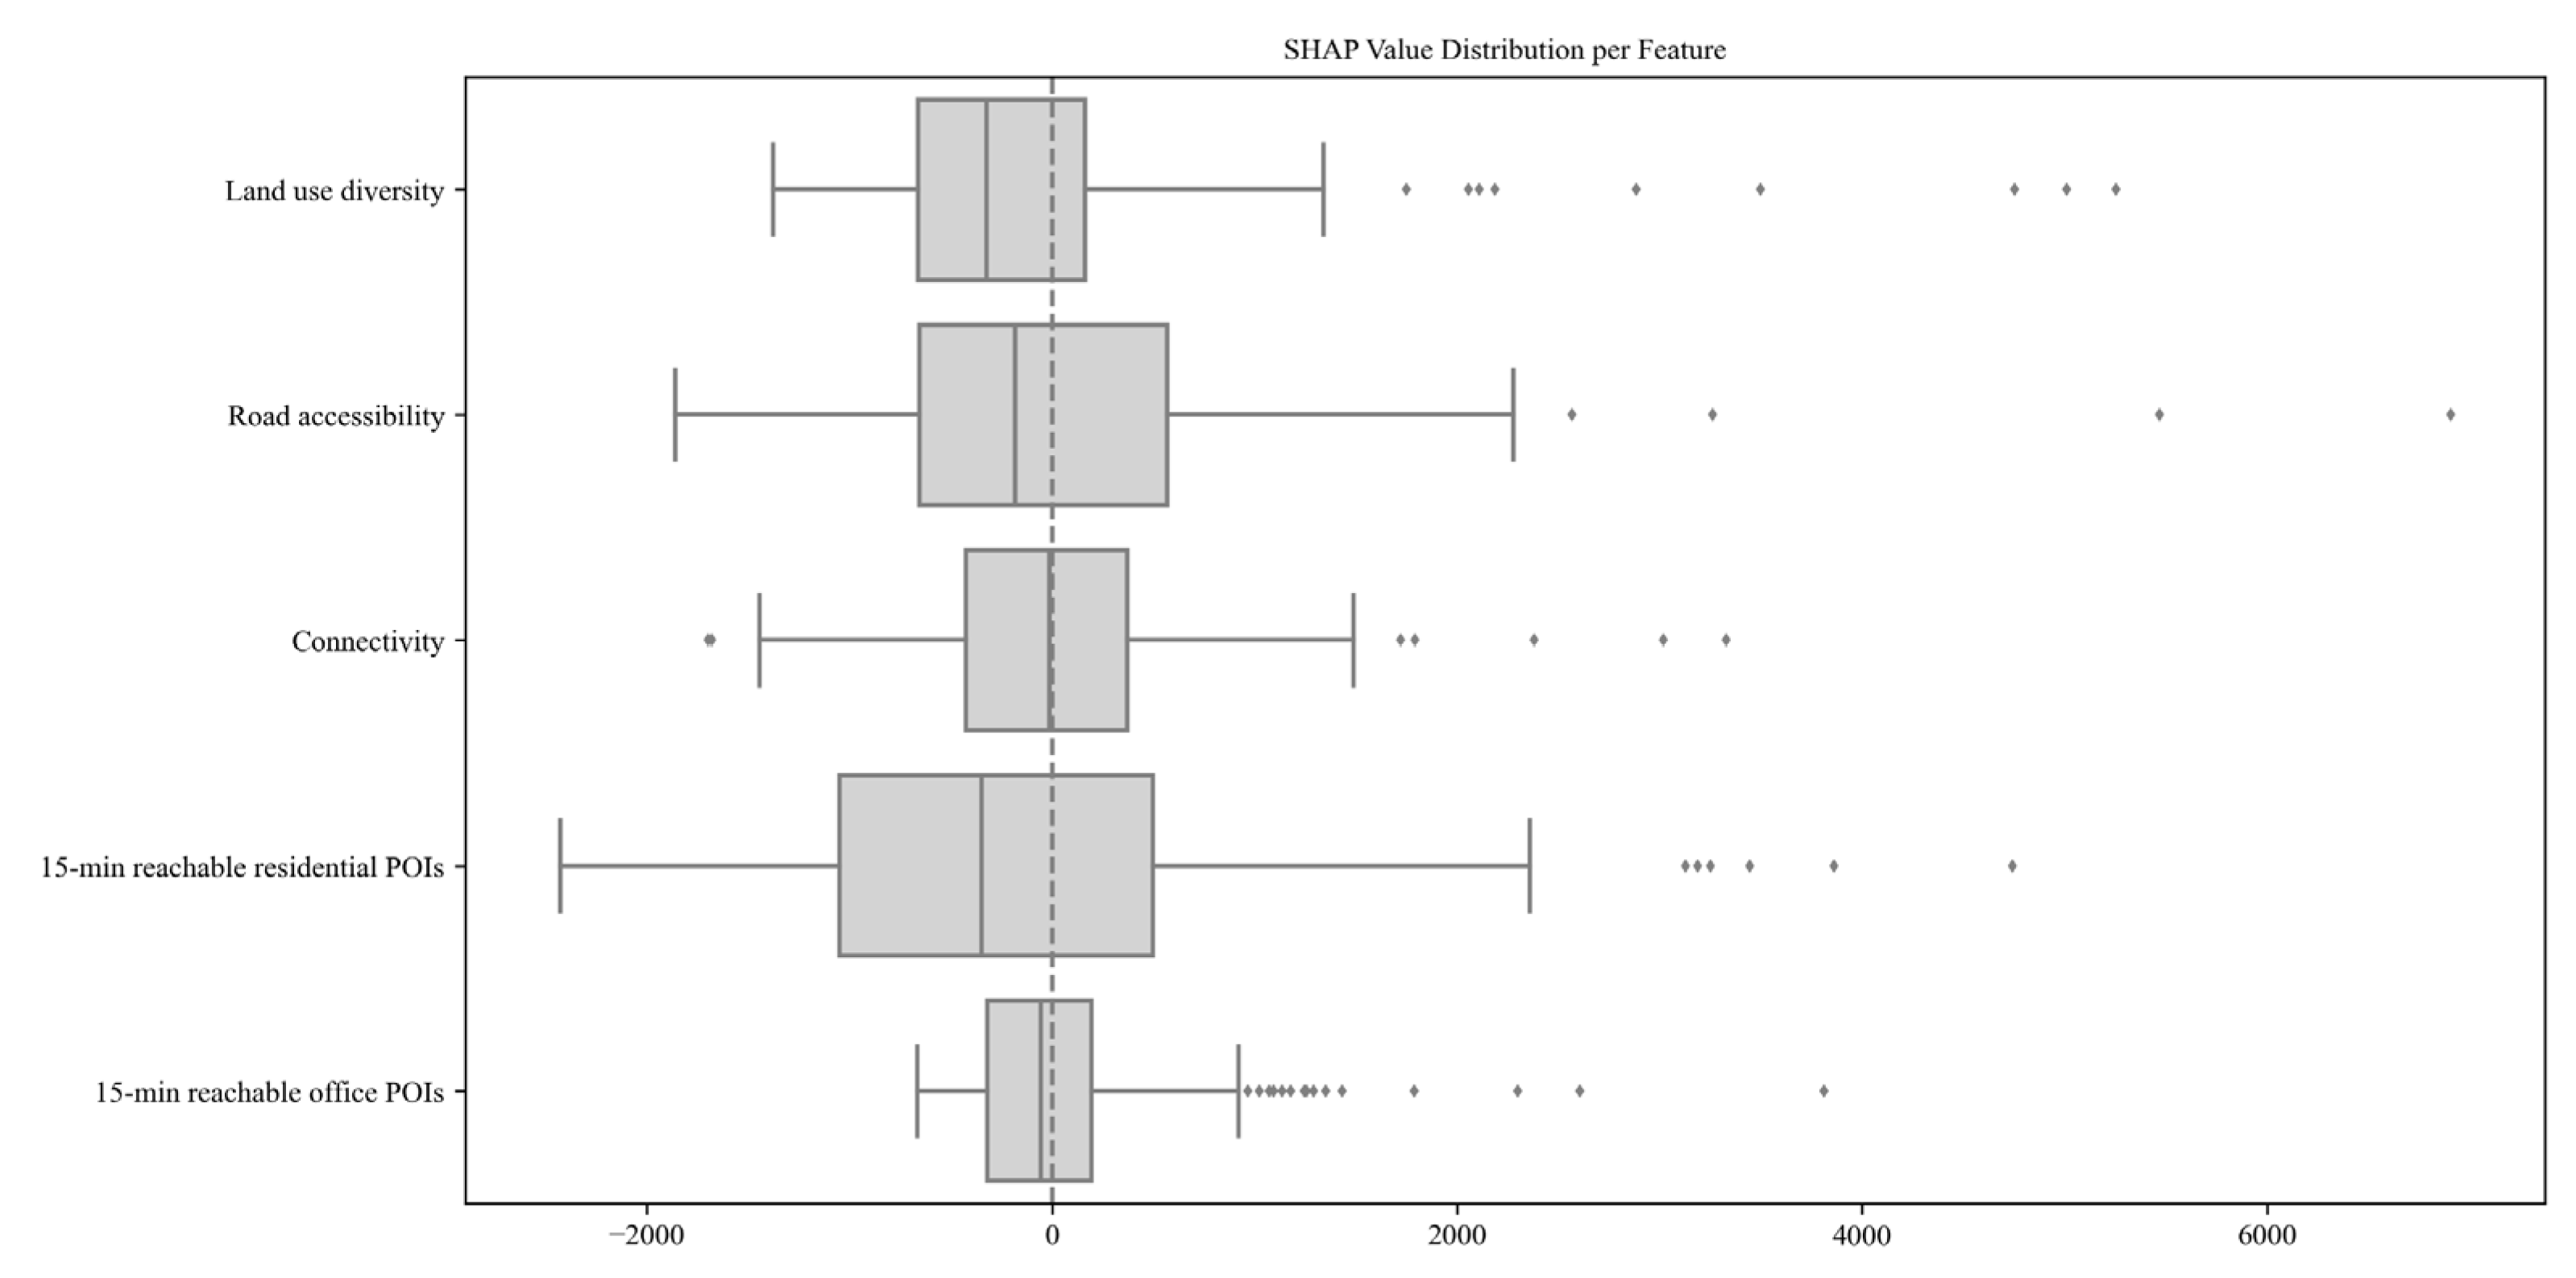
To further interpret variable impacts at the individual prediction level, SHAP analysis was conducted. As shown in the SHAP summary plot (Figure 13), 15 min reachable residential POIs exhibited the widest SHAP value range, implying a strong and heterogeneous influence on the model output. High values of Road accessibility and Connectivity also consistently contributed to higher prediction outcomes, suggesting their positive association with active facility use. The SHAP boxplots (Figure 14) confirm these patterns, highlighting both direction and dispersion of marginal effects across grid cells. Notably, variables such as Land use diversity displayed both positive and negative effects depending on the local context, emphasizing the need to consider spatial heterogeneity in behavioural responses to the built environment.
These results demonstrate that transport-related indicators such as road accessibility and street network structure play a primary role in shaping the intensity of facility usage. In comparison, indicators based on POIs, which reflect the supply-side distribution of services, provide supplementary explanatory power. The integrated modelling framework developed in this study contributes to a more nuanced understanding of how multiple spatial components jointly influence physical activity behaviours at the neighbourhood level.
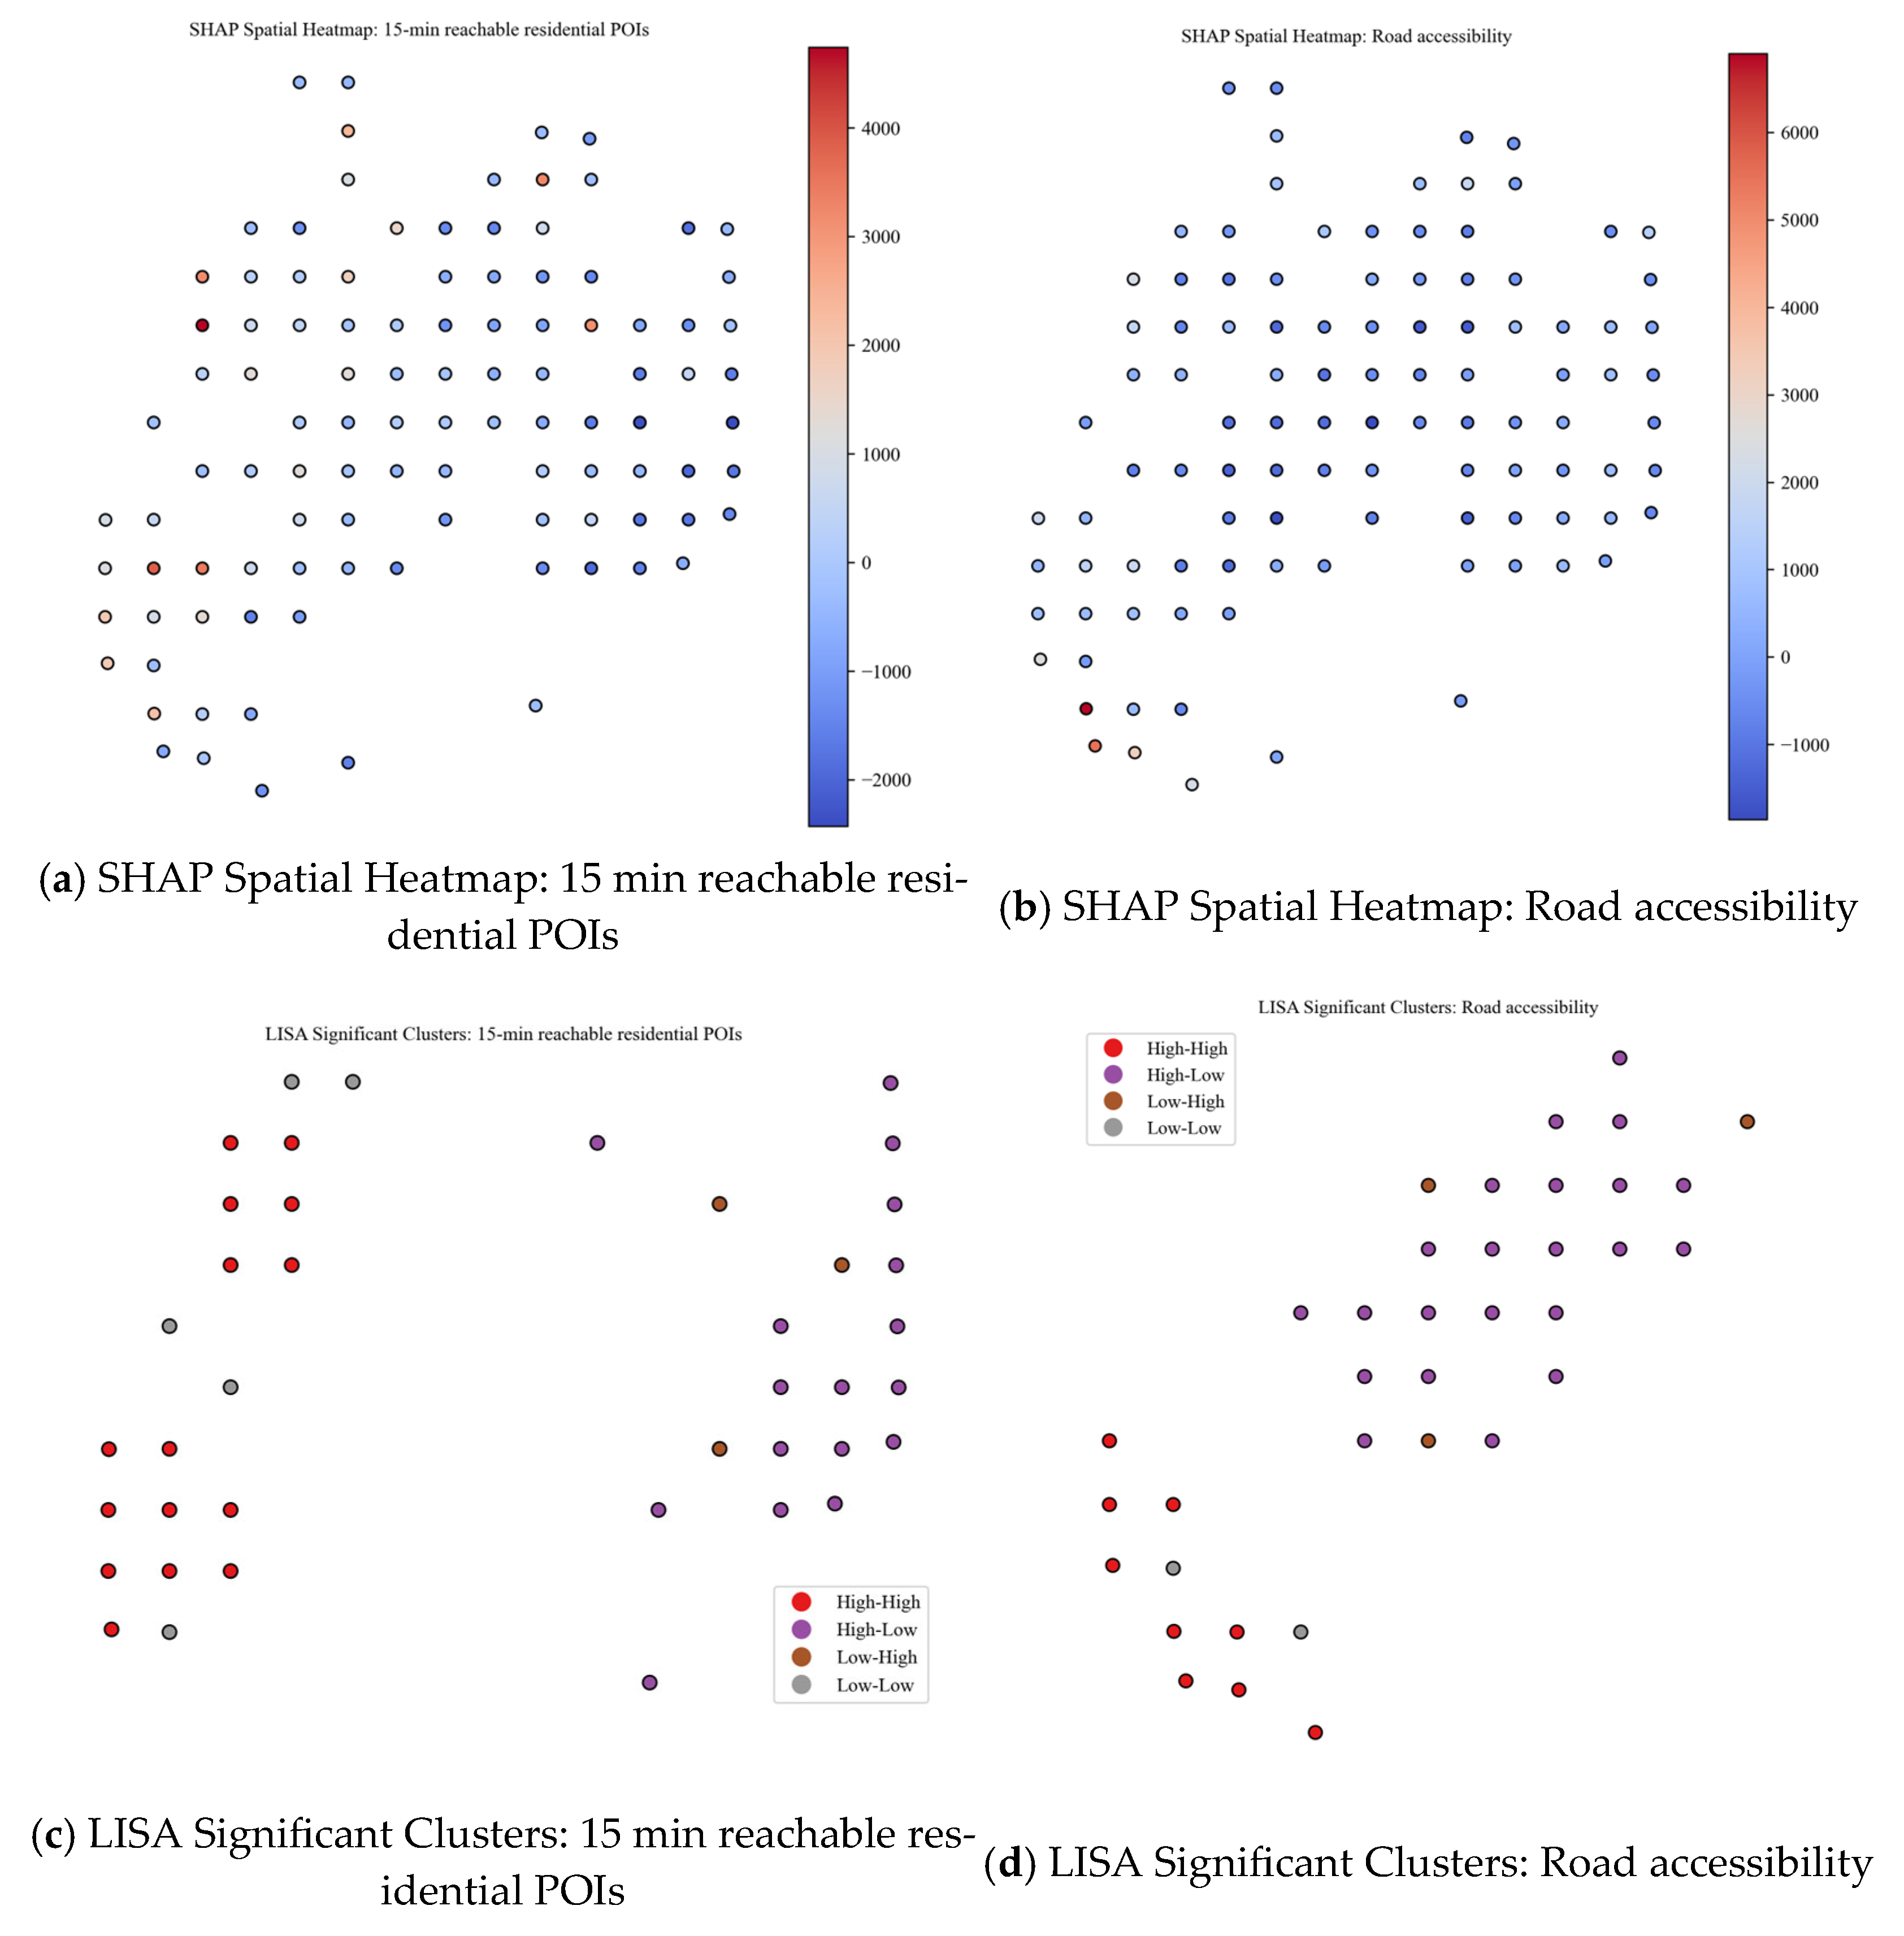
To further examine the spatial heterogeneity of physical activity facility usage, this study focuses on two statistically significant explanatory variables: 15 min reachable residential POIs and road accessibility. These two indicators were selected based on the results of the global spatial autocorrelation test, where both yielded significant Moran’s I values of 0.294 and 0.361, respectively (p < 0.01), indicating clear non-random spatial clustering. In contrast, the remaining indicators did not exhibit statistically significant spatial autocorrelation, thus reinforcing the analytical value of these two variables.
The spatial influence patterns of the two variables are visualized in Figure 15, which integrates SHAP spatial heatmaps and LISA cluster maps to uncover their localized effects and clustering characteristics.
(1) SHAP heatmaps (Figure 15a,b) demonstrate that the positive marginal contributions of both residential POIs and road accessibility are spatially uneven. High SHAP values are concentrated in the southern and southwestern sectors of the study area, whereas the central and peripheral grids exhibit relatively low or even negative contributions. This suggests that the impact of these variables on facility usage is geographically concentrated, pointing to spatial inequality in accessibility-driven facility demand.
(2) LISA cluster maps (Figure 15c,d) further validate these spatial disparities. A prominent pattern of High-High clusters is observed in the southern zone, where high levels of facility usage co-occur with strong accessibility or dense residential POI coverage. These areas reflect positive spatial reinforcement between demand and supply factors. Meanwhile, High-Low and Low-High clusters emerge in several peripheral areas, highlighting spatial mismatches where either demand is high, but accessibility is poor, or vice versa—conditions that may hinder effective facility utilization.
The results of this study indicate that the intensity of PA facility usage is influenced not only by the quantity of infrastructure but also by how well it is integrated within the local urban context. Among all variables, road accessibility and street network connectivity were the most consistent and influential predictors. This underscores the importance of transportation structure in enabling health-supportive behaviours. In contrast, residential POIs density, while indicative of potential demand, proved effective only when access routes were sufficient. These findings provide further evidence that the relationship between the built environment and physical activity is not linear but depends on the alignment between demand, design, and spatial connectivity.
The observed effect of land use diversity is consistent with Li et al. [16], who stressed the significance of functional mix in supporting active travel. However, our analysis shows that its influence is weaker than that of transport-related variables, suggesting that accessibility may outweigh diversity in compact urban contexts. Similarly, while previous studies in Western cities reported positive effects of workplace accessibility on physical activity Li et al. [33], our findings indicate that residential POIs are more influential, reflecting differences in daily routines between urban contexts.
From a planning and policy standpoint, this suggests that interventions should be context-specific. In densely populated areas with limited access, improving walkability through better street integration may have a greater impact than simply adding new facilities. In neighbourhoods where infrastructure exists but remains underused, complementary efforts such as public outreach or adaptive reuse of existing space may help match supply with actual usage patterns. Beyond health outcomes, enhancing everyday access to active spaces can reduce car dependency and encourage lower-emission travel behaviours. This supports the broader objectives of compact and inclusive urban design, such as those promoted by the “15 min city” concept. Ultimately, a planning approach that integrates health, mobility, and land use can promote not only spatial equity, but also long-term environmental sustainability and climate resilience.

5. Conclusions and Implications

This study examined how the built environment influences the usage intensity of PA facilities at the neighbourhood scale, using data from the Siming and Huli districts in Xiamen. By applying a random forest regression model combined with SHAP interpretability and spatial statistical analysis, the research identified key spatial variables and clarified their relative contributions and localized effects.
The results show that road accessibility was the most influential factor in predicting facility usage, followed by street network connectivity, land use diversity, and the density of 15 min reachable residential POIs. The model demonstrated strong performance, with an R2 of 0.8498, confirming the reliability of the selected indicators. In contrast, office POIs within a 15 min radius had limited explanatory power, suggesting that residential spatial factors play a more central role in shaping physical activity behaviours.
Further spatial analysis revealed that the positive effects of road accessibility and residential POIs are not evenly distributed. High SHAP values were primarily concentrated in the southern and southwestern sectors, while several peripheral zones exhibited low accessibility despite evident population demand. The LISA cluster maps confirmed this pattern, identifying High-High clusters in areas with coordinated demand and accessibility and High-Low or Low-High clusters in zones with clear mismatches. These spatial disparities underscore the need to address local imbalances in facility supply and infrastructure.
At the study area level, focusing on the Siming and Huli districts of Xiamen, the analysis demonstrates that transport-related factors—especially road accessibility and street connectivity—are decisive in shaping facility usage. These findings provide context-specific evidence for planners in Xiamen to target underserved peripheral zones and to better align new facility provision with residential demand.
At a broader level, the methodological framework that integrates machine learning, SHAP interpretability, and spatial autocorrelation offers a replicable approach to evaluating the built environment’s effects on physical activity. The study shows how combining predictive modelling with spatial clustering analysis can reveal both global importance and localized disparities. This contributes a generalizable tool that can be adapted to other urban contexts, particularly those experiencing rapid growth, uneven development, or infrastructure gaps. Based on these findings, several implications can be drawn for urban planning and policy:
(1) Prioritize accessibility in planning decisions. Merely increasing the number of PA facilities is not sufficient. Ensuring that they are embedded in areas with well-connected road networks and reachable from residential clusters is essential for encouraging usage.
(2) Identify and improve underserved zones. Areas with low accessibility but high residential density or demand should be prioritized for infrastructure upgrades or new facility placement to improve service equity.
(3) Promote integrated land use and transport planning. The relationship between facility usage and land use diversity varies by location. Policies should avoid one-size-fits-all solutions and instead adapt to the functional characteristics and transport conditions of specific neighbourhoods.
In addition to its practical results, this study highlights the broader potential of neighbourhood-level planning to address issues such as social inclusion, sustainable mobility, and everyday behavioural patterns. Ensuring that physical activity facilities are accessible within walkable distances can help reduce dependence on private vehicles, supporting healthier lifestyles while also contributing to lower emissions. These combined benefits are increasingly important as cities respond to the challenges of climate change and the need to build more resilient urban environments. Identifying specific areas where physical activity facilities do not align with surrounding demand provides a practical basis for more targeted planning. Instead of allocating new infrastructure uniformly, planners can focus on improving access in neighbourhoods with demonstrated gaps between need and availability. The modelling approach developed in this study combines machine learning with spatial interpretation tools, making it possible to visualize and quantify these local mismatches. This method can be adapted to other urban settings with comparable data availability, especially in cities facing similar challenges of uneven development and rapid growth.
The results indicate that the usage of physical activity facilities is shaped by a combination of spatial accessibility, transport infrastructure, and local demand. This study provides spatial evidence and applicable methods for optimizing public health infrastructure. It also underscores the importance of integrated planning that considers both the physical form of the built environment and patterns of human behaviour, offering a foundation for more equitable, sustainable, and health-supportive urban development.
There are several limitations should be acknowledged. First, the analysis is based on static spatial indicators and does not reflect temporal fluctuations in facility use, such as variations between weekdays and weekends. Second, the case study is limited to Xiamen, a high-density city with relatively strong infrastructure, which may affect the applicability of the findings to other urban contexts. Third, while 15 min reachable POIs effectively represent spatial proximity, non-spatial factors such as perceived safety or facility quality can be further analyzed.
Overall, this study contributes both context-specific insights for Xiamen and a transferable methodological framework for broader applications, thereby advancing the understanding of how built environment characteristics shape physical activity facility usage at the neighbourhood scale. Future studies could address these limitations by incorporating dynamic mobility data (e.g., smart card records, mobile phone trajectories) to capture temporal variations in facility usage. Expanding the analysis to include cities with different spatial structures and socioeconomic contexts would also enhance the generalizability of the findings. Moreover, integrating qualitative dimensions such as user perceptions of safety, accessibility, and facility quality could provide a more comprehensive understanding of the behavioural mechanisms linking the built environment with physical activity.

Funding

This research received no external funding.

Data Availability Statement

The data used to support the findings of this study are available from the corresponding author upon reasonable request.

Conflicts of Interest

The author declares no conflict of interest.

References

  1. Wang, M.; Qiu, M.; Chen, M.; Zhang, Y.; Zhang, S.; Wang, L. How does urban green space feature influence physical activity diversity in high-density built environment? An on-site observational study. Urban For. Urban Green. 2021, 62, 127129. [Google Scholar] [CrossRef]
  2. Xu, L.; Meng, D.; Bin Tan, S.; Li, J.; Zhang, X. Neurological benefits of third places for young adults in healthy urban environments. Front. Arch. Res. 2025, 14, 1350–1363. [Google Scholar] [CrossRef]
  3. Zou, Y.; Wang, D. Differences in the influence of the built environment and physical activity on obesity in urban and suburban contexts. Soc. Sci. Med. 2025, 372, 117955. [Google Scholar] [CrossRef] [PubMed]
  4. Li, Z.; Tang, J.; Feng, T.; Liu, B.; Cao, J.; Yu, T.; Ji, Y. Investigating urban mobility through multi-source public transportation data: A multiplex network perspective. Appl. Geogr. 2024, 169, 103337. [Google Scholar] [CrossRef]
  5. Sallis, J.F.; Cerin, E.; Conway, T.L.; Adams, M.A.; Frank, L.D.; Pratt, M.; Salvo, D.; Schipperijn, J.; Smith, G.; Cain, K.L.; et al. Physical activity in relation to urban environments in 14 cities worldwide: A cross-sectional study. Lancet 2016, 387, 2207–2217. [Google Scholar] [CrossRef]
  6. Zhang, H.-S.; Xu, N.; Zhang, S.; Hu, W.; Deng, C.; Chang, Y.; Zhang, Z.; Ou, Y. The hidden economic costs of air pollution in China: Evidence from remotely sensed nighttime light data. GISci. Remote Sens. 2025, 62. [Google Scholar] [CrossRef]
  7. Jiang, Y.; Liu, D.; Ren, L.; Grekousis, G.; Lu, Y. Tree abundance, species richness, or species mix? Exploring the relationship between features of urban street trees and pedestrian volume in Jinan, China. Urban For. Urban Green. 2024, 95, 128294. [Google Scholar] [CrossRef]
  8. Hirt, S.A. Rooting out mixed use: Revisiting the original rationales. Land Use Policy 2016, 50, 134–147. [Google Scholar] [CrossRef]
  9. Ou, Y.; Song, W.; Nam, K.-M. Metro-line expansions and local air quality in Shenzhen: Focusing on network effects. Transp. Res. Part D Transp. Environ. 2024, 126, 103991. [Google Scholar] [CrossRef]
  10. Sugiyama, T.; Rachele, J.N.; Gunn, L.D.; Burton, N.W.; Brown, W.J.; Turrell, G. Land use proportion and walking: Application of isometric substitution analysis. Health Place 2019, 57, 352–357. [Google Scholar] [CrossRef]
  11. Ou, Y.; Bao, Z.; Ng, S.T.; Song, W.; Chen, K. Land-use carbon emissions and built environment characteristics: A city-level quantitative analysis in emerging economies. Land Use Policy 2024, 137, 107019. [Google Scholar] [CrossRef]
  12. Ma, W.; Wang, N.; Li, Y.; Sun, D. 15-min pedestrian distance life circle and sustainable community governance in Chinese metropolitan cities: A diagnosis. Humanit. Soc. Sci. Commun. 2023, 10, 1–14. [Google Scholar] [CrossRef]
  13. Wolf, H.; Vierø, A.R.; Szell, M. CoolWalks for active mobility in urban street networks. Sci. Rep. 2025, 15, 1–15. [Google Scholar] [CrossRef]
  14. Huang, G.; Ng, S.T.; Li, D.; Zhang, Y. State of the art review on the HVAC occupant-centric control in different commercial buildings. J. Build. Eng. 2024, 96, 110445. [Google Scholar] [CrossRef]
  15. Zhou, Y.; Yuan, Q.; Ding, F.; Chen, M.; Yang, C.; Guo, T. Demand, mobility, and constraints: Exploring travel behaviors and mode choices of older adults using a facility-based framework. J. Transp. Geogr. 2022, 102. [Google Scholar] [CrossRef]
  16. Li, X.; Sinniah, G.K.; Li, R.; Li, X. Correlation between Land Use Pattern and Urban Rail Ridership Based on Bicycle-Sharing Trajectory. ISPRS Int. J. Geo-Inf. 2022, 11, 589. [Google Scholar] [CrossRef]
  17. Ou, Y.; Lee, S.Y.; Nam, K.-M.; Lee, K.O. Rethinking Post-pandemic Urban Planning Strategies: Lessons from Singapore and Hong Kong. J. Korea Plan. Assoc. 2023, 58, 27–47. [Google Scholar] [CrossRef]
  18. Du, Z.; Sato, K.; Hino, K.; Kondo, K.; Kondo, N. Gender, socioeconomic, and built environment differences in the association of participation in an incentivized walking program with physical and social activity: A prospective cohort study among older adults in Japan. Soc. Sci. Med. 2025, 377, 118093. [Google Scholar] [CrossRef] [PubMed]
  19. Mepparambath, R.M.; Le, D.T.T.; Oon, J.; Song, J.; Huynh, H.N. Influence of the built environment on social capital and physical activity in Singapore: A structural equation modelling analysis. Sustain. Cities Soc. 2024, 103, 105259. [Google Scholar] [CrossRef]
  20. Zheng, Y.; Hamm, N.A.; Lin, T.; Liu, J.; Zhou, T.; Ren, X.; Bai, X.; Geng, H.; Zhang, J.; Jia, Z.; et al. Quantitative threshold effects identification of urban green exposure on multidimensional human health—A case study in Xiamen City, China. Urban For. Urban Green. 2025, 107, 128808. [Google Scholar] [CrossRef]
  21. Guo, C.; Qiao, R.; Wu, Z.; Jiang, Y.; Yang, Y.; Yu, Z.; Wan, W.; Sun, X. Heterogeneous residential location effects: Variations in how suburban communities shape older adults’ active travel—A case study from Xiamen. Cities 2025, 160. [Google Scholar] [CrossRef]
  22. Shi, X.; Ling, G.H.T.; Leng, P.C.; Rusli, N.; Matusin, A.M.R.A. Associations between institutional-social-ecological factors and COVID-19 case-fatality: Evidence from 134 countries using multiscale geographically weighted regression (MGWR). One Health 2023, 16, 100551. [Google Scholar] [CrossRef]
  23. Fonseca, F.; Ribeiro, P.J.G.; Conticelli, E.; Jabbari, M.; Papageorgiou, G.; Tondelli, S.; Ramos, R.A.R. Built environment attributes and their influence on walkability. Int. J. Sustain. Transp. 2021, 16, 660–679. [Google Scholar] [CrossRef]
  24. Fujihara, S.; Tsuji, T.; Miyaguni, Y.; Aida, J.; Saito, M.; Koyama, S.; Kondo, K. Does Community-Level Social Capital Predict Decline in Instrumental Activities of Daily Living? A JAGES Prospective Cohort Study. Int. J. Environ. Res. Public Health 2019, 16, 828. [Google Scholar] [CrossRef]
  25. Liu, D.; Lu, Y.; Yang, L. Exploring non-linear effects of environmental factors on the volume of pedestrians of different ages using street view images and computer vision technology. Travel Behav. Soc. 2024, 36, 100814. [Google Scholar] [CrossRef]
  26. Zhang, K.; Huang, B.; Divigalpitiya, P. Identifying Community-Built Environment’s Effect on Physical Activity and Depressive Symptoms Trajectories Among Middle-aged and Older Adults: Chinese National Longitudinal Study. JMIR Public Health Surveill. 2025, 11, e64564. [Google Scholar] [CrossRef] [PubMed]
  27. Zhang, X.; Cheng, H.; Tao, Y.; Chai, Y. Housing-related differences in sense of community in mixed housing neighborhood: Impacts of residents’ daily activities and facility utilization. Cities 2024, 149. [Google Scholar] [CrossRef]
  28. Koh, E.F. Influence of ICT usage on perceived walkability and physical activities of older adults: Mixed method study in a high-density city. J. Transp. Health 2025, 41, 101993. [Google Scholar] [CrossRef]
  29. Jiang, Y.; Chen, L.; Grekousis, G.; Xiao, Y.; Ye, Y.; Lu, Y. Spatial disparity of individual and collective walking behaviors: A new theoretical framework. Transp. Res. Part D Transp. Environ. 2021, 101, 103096. [Google Scholar] [CrossRef]
  30. Naseri, M.; Delbosc, A.; Kamruzzaman, L. Did the built environment attenuate reductions in leisure walking during COVID-19? A quasi-panel study. J. Transp. Health 2025, 44, 102101. [Google Scholar] [CrossRef]
  31. Zhang, Z.; Yang, S.; Wang, H.; Zhou, L. Examining non-linear relationships between campus layout, street design, and walking activity. Transp. Policy 2025, 163, 61–72. [Google Scholar] [CrossRef]
  32. Hou, Y.; Liu, Y.; Wu, Y.; Zhang, B. Assessment of spatial and socioeconomic disparities in urban green space accessibility based on a Physical Activity Diversity Index (PADI). Ecol. Indic. 2024, 166, 112478. [Google Scholar] [CrossRef]
  33. Li, H.; Ta, N.; Yu, B.; Wu, J. Are the accessibility and facility environment of parks associated with mental health? A comparative analysis based on residential areas and workplaces. Landsc. Urban Plan. 2023, 237, 104807. [Google Scholar] [CrossRef]
  34. Liu, D.; Wang, R.; Grekousis, G.; Liu, Y.; Lu, Y. Detecting older pedestrians and aging-friendly walkability using computer vision technology and street view imagery. Comput. Environ. Urban Syst. 2023, 105, 102027. [Google Scholar] [CrossRef]
  35. Pitombeira-Neto, A.R.; Santos, H.P.; da Silva, T.L.C.; de Macedo, J.A.F. Trajectory modeling via random utility inverse reinforcement learning. Inf. Sci. 2024, 660, 120128. [Google Scholar] [CrossRef]
  36. Zhang, T.; Tang, F.; Hu, Y.; Zhang, L.; Guo, Y. Shaping greener mobility: Impact of urban greening structure on time-dependent bike-sharing usage. Transp. Res. Part D Transp. Environ. 2025, 141. [Google Scholar] [CrossRef]
  37. Jiang, Z.; Wu, C.; Chung, H. The 15-minute community life circle for older people: Walkability measurement based on service accessibility and street-level built environment—A case study of Suzhou, China. Cities 2025, 157, 105587. [Google Scholar] [CrossRef]
  38. Zhao, C.; Wang, K.; Dong, X.; Dong, K. Is smart transportation associated with reduced carbon emissions? The case of China. Energy Econ. 2022, 105, 105715. [Google Scholar] [CrossRef]
  39. Zeng, Q.; Wu, H.; Wei, Y.; Wang, J.; Zhang, C.; Fei, N.; Dewancker, B.J. Association between built environment factors and collective walking behavior in peri-urban area: Evidence from Chengdu. Appl. Geogr. 2024, 167, 103274. [Google Scholar] [CrossRef]
  40. Li, X.Y.; Sinniah, G.K.; Li, R. Identify impacting factor for urban rail ridership from built environment spatial heterogeneity. Case Stud. Transp. Policy 2022, 10, 1159–1171. [Google Scholar] [CrossRef]
  41. Luo, P.; Yu, B.; Li, P.; Liang, P. Spatially varying impacts of the built environment on physical activity from a human-scale view: Using street view data. Front. Environ. Sci. 2022, 10. [Google Scholar] [CrossRef]
  42. Xu, W.; Yang, L.; Zhang, W. Evaluation of transport policy packages in the excess commuting framework: The case of Xiamen, China. Cities 2019, 87, 39–47. [Google Scholar] [CrossRef]
  43. Huang, G.; Li, D.; Ng, S.T.; Wang, L.; Wang, T. A methodology for assessing supply-demand matching of smart government services from citizens’ perspective: A case study in Nanjing, China. Habitat Int. 2023, 138, 102880. [Google Scholar] [CrossRef]
  44. Liu, D.; Jiang, Y.; Wang, R.; Lu, Y. Establishing a citywide street tree inventory with street view images and computer vision techniques. Comput. Environ. Urban Syst. 2023, 100, 101924. [Google Scholar] [CrossRef]
  45. Zhang, A.; Xia, C. A new two-step estimation approach for retrieving surface urban heat island intensity and footprint based on urban-rural temperature gradients. Int. J. Geogr. Inf. Sci. 2024, 38, 2348–2378. [Google Scholar] [CrossRef]
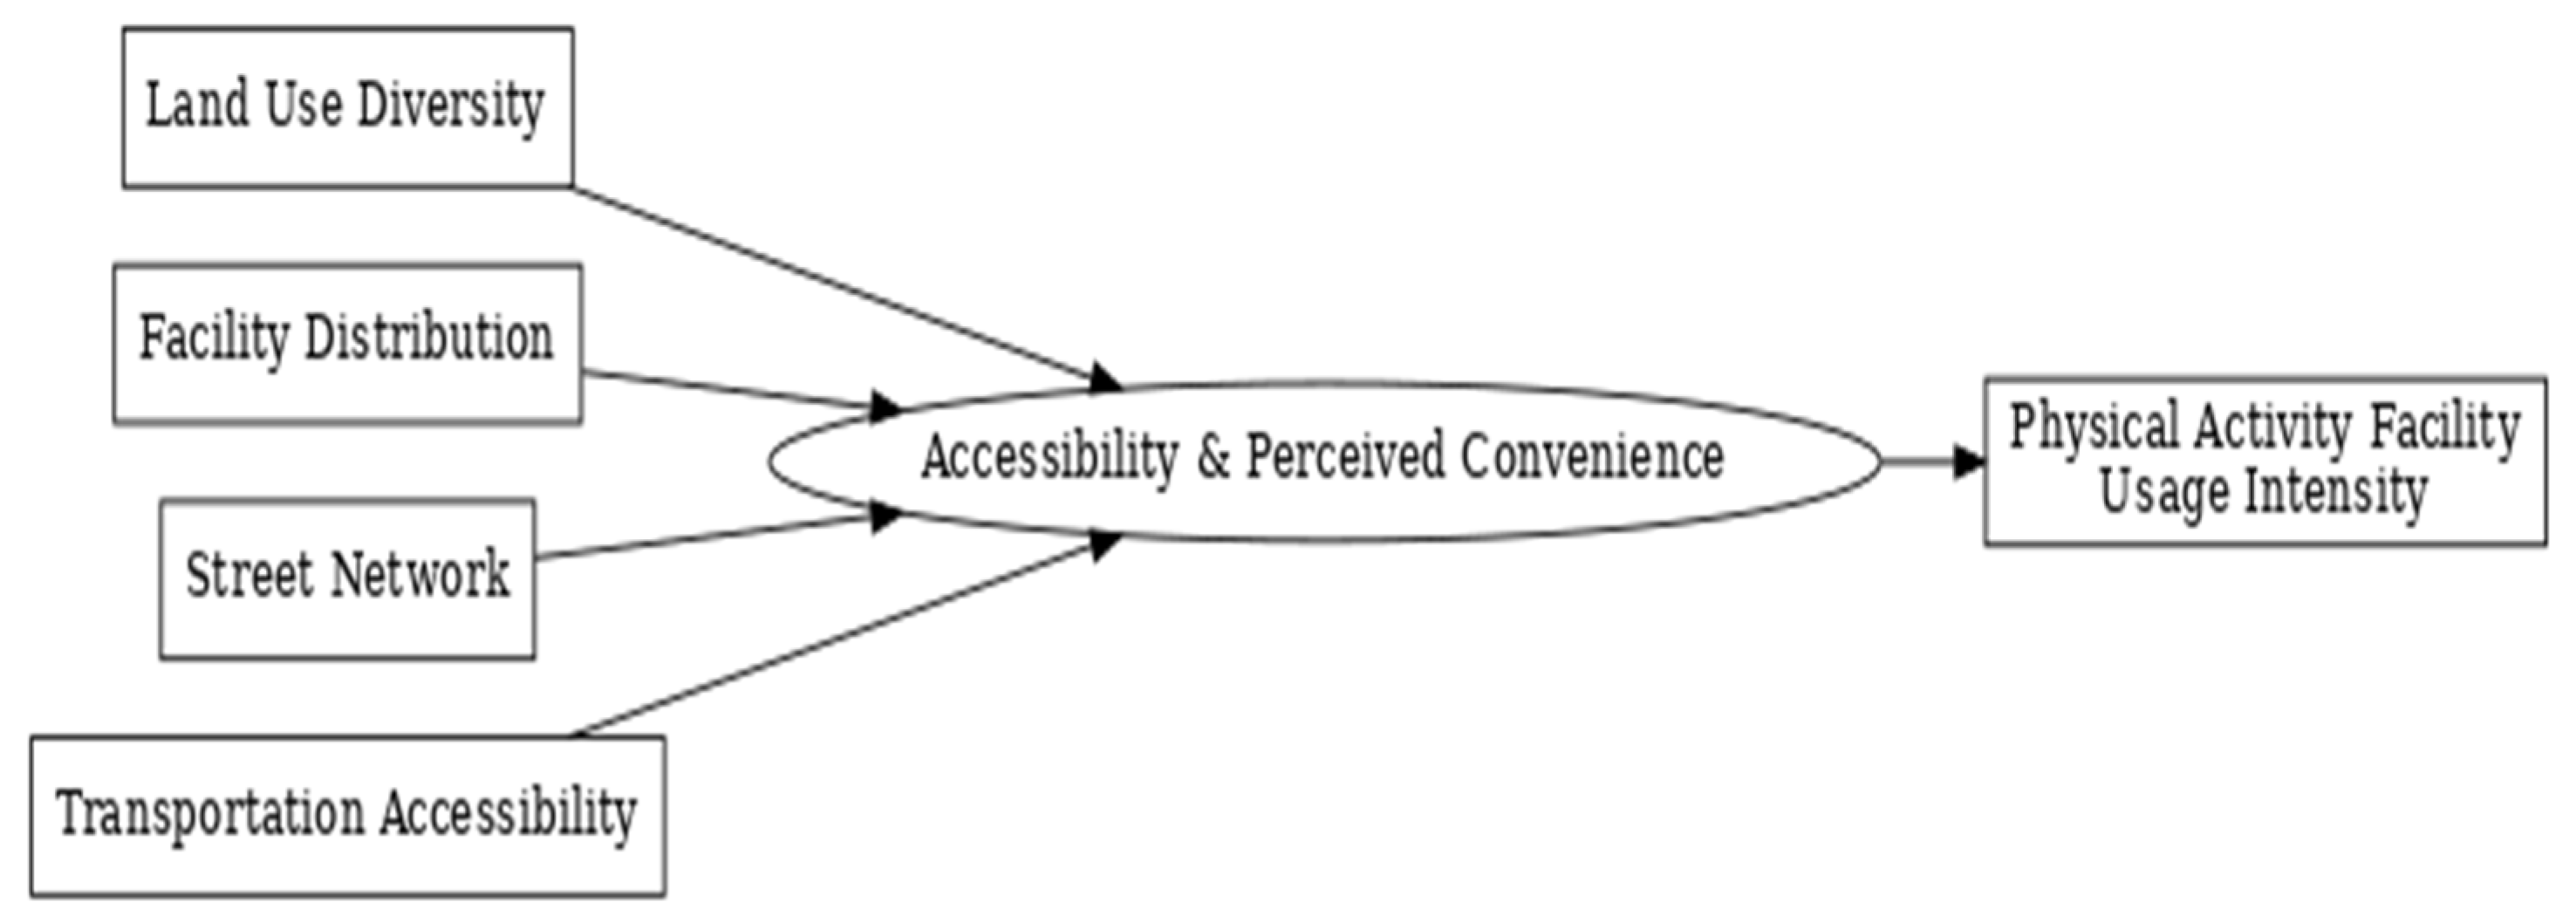
Figure 1. Conceptual framework.
Buildings 15 03470 g001
Figure 2. Study area.
Buildings 15 03470 g002
Figure 3. The population distribution in Xiamen within 500 m × 500 m grid.
Buildings 15 03470 g003
Figure 4. The physical activity facility distribution in Xiamen.
Buildings 15 03470 g004
Figure 5. The road network in Xiamen.
Buildings 15 03470 g005
Figure 6. Population spatial distribution.
Buildings 15 03470 g006
Figure 7. Land use diversity features.
Buildings 15 03470 g007
Figure 8. PA facility distribution.
Buildings 15 03470 g008
Figure 9. Road accessibility distribution.
Buildings 15 03470 g009
Figure 10. Road connectivity distribution.
Buildings 15 03470 g010
Figure 11. Spatial association between road accessibility and connectivity.
Buildings 15 03470 g011
Figure 12. Importance variables rank.
Buildings 15 03470 g012
Figure 13. SHAP summary plot of variables contributions to model predictions.
Buildings 15 03470 g013
Figure 14. Boxplot of SHAP value distributions per variables.
Buildings 15 03470 g014
Figure 15. Spatial influence and clustering patterns of key explanatory variables.
Buildings 15 03470 g015
Table 1. Classification and application of geospatial datasets.
ItemsData TypeDescriptionPrimary Purpose
1PopulationSpatial distribution of residentsIndicates population concentration; supports evaluation of service coverage and equity
2POIs DataLocation and category of sports-related facilitiesIdentifies PA resources; supports density metrics and spatial statistics
3Transport NetworkVector layers of roadsDelineate accessibility zones
Disclaimer/Publisher’s Note: The statements, opinions and data contained in all publications are solely those of the individual author(s) and contributor(s) and not of MDPI and/or the editor(s). MDPI and/or the editor(s) disclaim responsibility for any injury to people or property resulting from any ideas, methods, instructions or products referred to in the content.