Review

Use and Potential of AI in Assisting Surveyors in Building Retrofit and Demolition—A Scoping Review

1
Dyson School of Design Engineering, Imperial College London, London SW7 2AZ, UK
2
Building Research Establishment, Watford WD25 9NH, UK
3
Enable My Team, Ltd., London EC2A 1NS, UK
4
Reusefully, Ltd., Harrold MK43 7FR, UK
*
Author to whom correspondence should be addressed.
Buildings 2025, 15(19), 3448; https://doi.org/10.3390/buildings15193448
Submission received: 20 July 2025 / Revised: 12 August 2025 / Accepted: 22 August 2025 / Published: 24 September 2025
(This article belongs to the Section Building Materials, and Repair & Renovation)

Abstract

Background: Pre-retrofit auditing and pre-demolition auditing (PRA/PDA) are important in material reuse, waste reduction, and regulatory compliance in the building sector. An emphasis on sustainable construction practices has led to a higher requirement for PRA/PDA. However, traditional auditing processes demand substantial time and manual effort and are more easily to create human errors. As a developing technology, artificial intelligence (AI) can potentially assist PRA/PDA processes. Objectives: This scoping review aims to review the potential of AI in assisting each sub-stage of PRA/PDA processes. Eligibility Criteria and Sources of Evidence: Included sources were English-language articles, books, and conference papers published before 31 March 2025, available electronically, and focused on AI applications in PRA/PDA or related sub-processes involving structured elements of buildings. Databases searched included ScienceDirect, IEEE Xplorer, Google Scholar, Scopus, Elsevier, and Springer. Results: The review indicates that although AI has the potential to be applied across multiple PRA/PDA sub-stages, actual application is still limited. AI integration has been most prevalent in floor plan recognition and material detection, where deep learning and computer vision models achieved notable accuracies. However, other sub-stages—such as operation and maintenance document analysis, object detection, volume estimation, and automated report generation—remain underexplored, with no PRA/PDA specific AI models identified. These gaps highlight the uneven distribution of AI adoption, with performance varying greatly depending on data quality, available domain-specific datasets, and the complexity of integration into existing workflows. Conclusions: Out of multiple PRA/PDA sub-stages, AI integration was focused on floor plan recognition and material detection, with deep learning and computer vision models achieving over 90% accuracy. Other stages such as operation and maintenance document analysis, object detection, volume estimation, and report writing, had little to no dedicated AI research. Therefore, although AI demonstrates strong potential in PRA/PDA, particularly for floor plan and material analysis, broader adoption is limited. Future research should target multimodal AI development, real-time deployment, and standardized benchmarking to improve automation and accuracy across all PRA/PDA stages.

1. Introduction

Due to increasing urbanization and the demand for sustainable construction practices, the UK and EU market for building retrofit and demolition is experiencing significant growth [1]. Building retrofit involves adding new features and technologies to old buildings and is important in addressing energy performance in aging buildings [2]. To be specific, building retrofit can improve energy efficiency of buildings, extend buildings lifespan, ensure safety, repurpose or adapt for new uses of buildings, and make buildings satisfy new laws and regulations [3]. Building demolition involves systematically deconstructing or removing built structures and their associated materials. It can be used to ensure safe and efficient removal of outdated infrastructure. When a building reaches the end of its life (such as irreparable structural damage) or when redevelopment is more feasible than retrofit (for example, the cost of retrofit exceeds the value of the building), building demolition becomes necessary [4,5,6].
Pre-retrofit auditing (PRA) is a detailed inspection carried out before a building is renovated or upgraded [7]. It evaluates the current energy efficiency status and potential areas for improvement and guides subsequent measures to enhance energy efficiency. Pre-demolition auditing (PDA) is a comprehensive assessment conducted before a building’s demolition [8]. It aims to identify and document the materials and structures within the building and facilitates the optimization of resource recovery and waste management strategies.
Pre-retrofit auditing and pre-demolition auditing (PRA/PDA) provide information on structural integrity, material composition, and compliance with regulations [9]. Ideally, PRA/PDA should be conducted at an early stage and should inform re-design. Conducting a PRA/PDA before refurbishment, retrofit, or demolition can establish the volume, type, and condition of a building interior’s components and materials. A PRA/PDA provides a list of Key Demolition Products (KDPs) that have the potential to arise during the demolition phase of redevelopment and that may be suitable for reuse and recycling. In this way, the results of the survey can provide insights and help reduce retrofit or demolition waste leaving the site, maximize materials for reuse and recycling, highlight technical options on recycling of material on site, minimize materials going to landfill, advise on targets for demolition waste, strengthen collaboration and information exchange among stakeholders across the construction sector’s supply chain, and demonstrate associated cost-savings and environmental rewards.
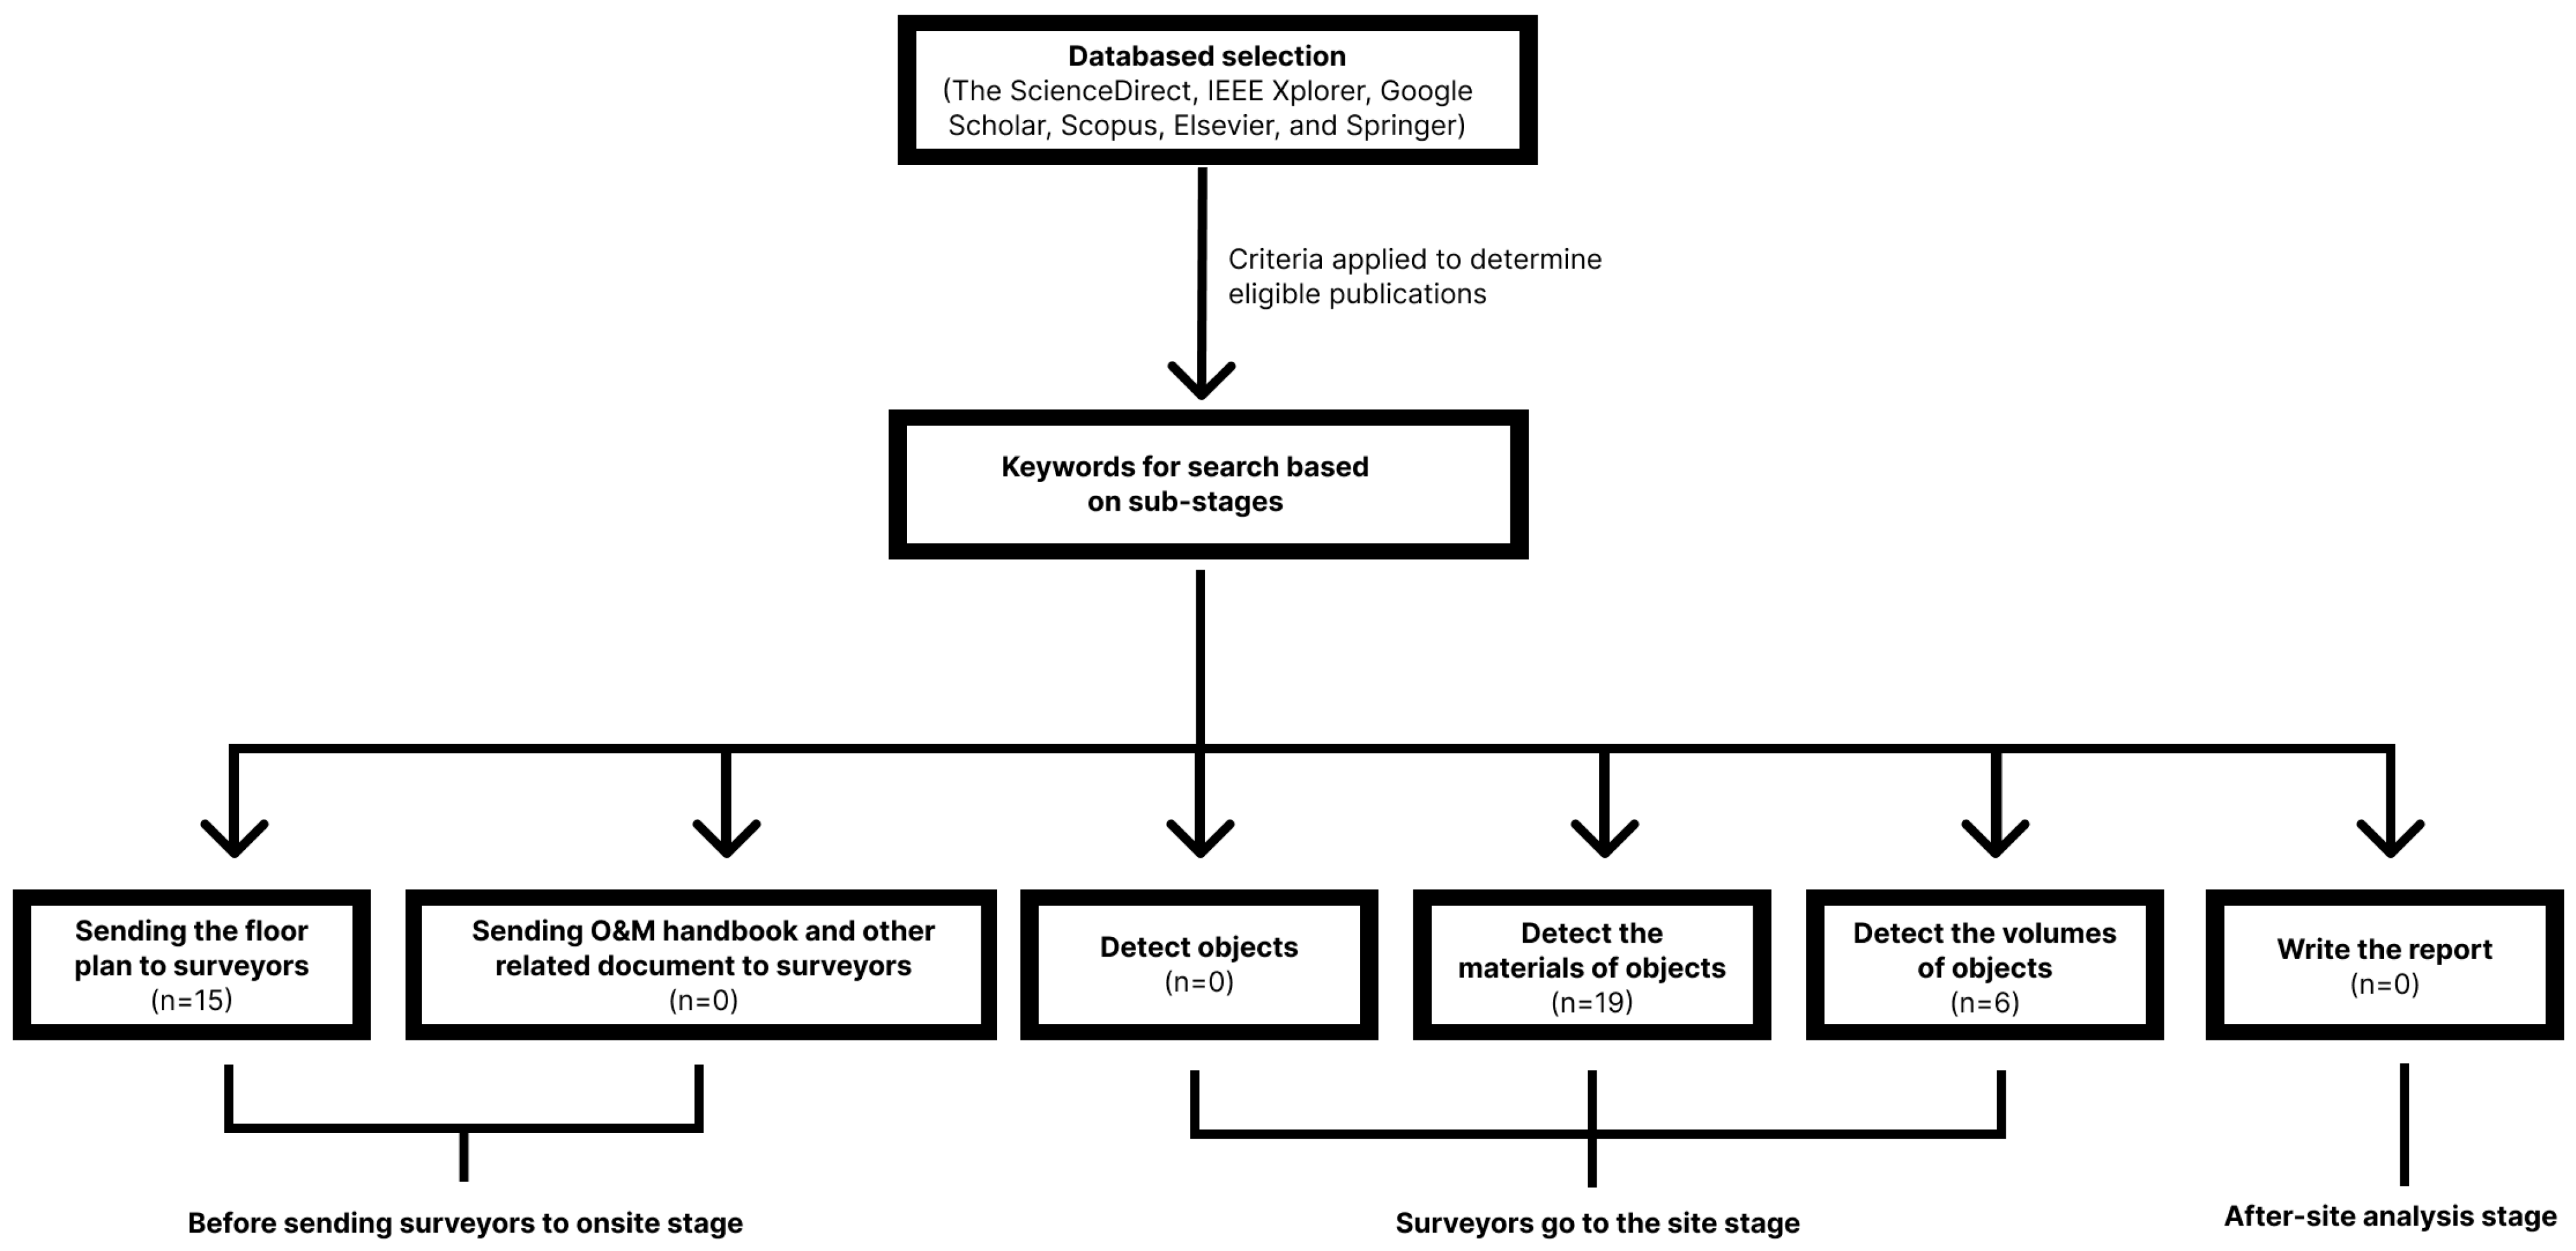
Surveyors are important in PRA/PDA as they can contribute to making the decision on how to conduct building retrofit and demolition [10]. PRA/PDA processes can be divided into “Before sending surveyors to onsite stage”, “Surveyors go to the site stage”, and “After the site stage”. The detailed activities in each stage are summarized and explained as follows and also summarized in Figure 1. Before sending surveyors to onsite stages, existing data such as building floor plans and operation and maintenance handbook need to be collected to help surveyors understand the structural condition of the building. Floor plans can be used to help surveyors analyze building structural components before site visits, while the operation and maintenance handbook can identify changes in the building structure and potential hazards before visiting the site. Therefore, “Before sending surveyors to onsite stage” includes two principle activities: sending the floor plan to surveyors and sending operation and maintenance handbook and other related document to surveyors. After obtaining the information before going on-site, surveyors can collect real-time data on site (Surveyors go to the site stage). During this stage, surveyors can detect objects, materials, and volumes of the objects. Based on this information, surveyors can calculate what the building has and what and how much can be reused, recycled, or thrown out. When surveyors return from the site (After the site stage), surveyors can integrate field data into a comprehensive report, which summarizes findings, gives recommendations, and ensures compliance status.
However, challenges have been met by surveyors. Policy development and trends has led to a significant volume requirement for retrofit and demolition. This increase has amplified the need for surveyors. However, surveyors need expertise and training, which means a high entry requirement for working as surveyors and makes the condition that the number of surveyors is not enough harder to solve. To make things worse, PRA/PDA is time-consuming. Surveyors need to manually measure the building, identify materials and objects, calculate, and write reports. The larger the retrofit or demolition project for a building or part of it, the more time is needed. In addition, PRA/PDA involves some repetitive tasks, such as measuring structural dimensions, identifying materials and objects, and compiling reports. Although each project has a unique situation, what the surveyors need to do is similar, especially when they measure structural dimensions and identify materials and objects. This repetitive work increases the workload for surveyors. In addition, manually collecting and processing repetitive data can increase human errors, such as inaccurate measurements, missed observations, and incorrect interpretations. These errors can cause retrofit and demolition to overrun costs or lead to safety risks.
Artificial intelligence (AI) continues to advance and become integrated with various emerging technologies and can be found in various construction, architecture and structural engineering related tasks. In construction, Pan and Zhang (2021) examined the application of AI within construction engineering and highlighted its utilization in building information modeling (BIM) [11]. Abioye et al. (2021) suggested that AI can be used in construction industry from various perspectives such as activity monitoring, risk management, resource and waste optimization [12]. In architecture engineering, integrating AI into architectural design processes has the potential to increase efficiency, stimulate creative solutions, and advance the sustainability of construction initiatives [13,14]. Generative AI such as ChatGPT has also be promoted that can be used in contribute to BIM by enabling the creation of complex design solutions, refining spatial configurations, and modeling construction activities virtually [15]. Momade et al. (2021) [16] review the application of AI in architecture engineering. Their review suggested that AI has been used for geotechnical engineering, project management, energy, hydrology, environment and transportation, construction materials and structural engineering. They also pointed out that ANNs have seen extensive adoption within the field of architectural engineering for a variety of analytical and predictive applications [17]. Based on the review, Tapeh and Naser (2023) reported that AI has been applied across a range of areas such as earthquake, wind, and fire engineering, as well as for structural health monitoring, damage assessment, and the prediction of properties for over 200 types of structural materials [18]. Similarly, Thai (2022) indicated that machine learning supports tasks including structural analysis and design, the evaluation of structural integrity, assessment of fire performance, analysis of member response to various loads, and optimization of both mechanical characteristics and concrete mix design [19]. In addition to these broad applications, recent literature has increasingly focused on integrating AI, sustainability, and lifecycle-based decision support in the built environment. Mulero-Palencia et al. (2021) [20] applied machine learning to as-built BIM models using IFC data to automate the detection of thermal pathologies and recommend energy conservation measures in deep renovation projects. Ajayi et al. (2017) [21] emphasized that effective construction and demolition waste minimization requires integrating waste prevention principles from the early design stage, highlighting barriers such as cost constraints and lack of standardization. Baset and Jradi (2025) [22] provided a comprehensive review of data-driven and explainable AI approaches for building energy retrofits, showing how these methods can optimize retrofit outcomes, handle incomplete datasets, and improve stakeholder trust. Vidanapathirana et al. (2021) [23] investigated AI-enabled compliance checking in sustainable building projects, demonstrating the potential of NLP in interpreting regulatory documents to guide retrofit and demolition audit processes.
This application of AI in construction, architecture, and structure engineering indicated the potential of AI to help surveyors in PRA/PDA. For example, computer vision could automatically finish PRA/PDA tasks such as material and object identification and reduce the time and effort required from surveyors. Some AI technologies have been applied to building retrofitting and demolition. For example, Graph Neural Networks (GNNs) have facilitated the conversion of 2D floor plans into 3D representations [24]. Additionally, convolutional neural networks (CNNs) have been utilized for the identification of objects [25], while Support Vector Machines (SVMs) have been employed for the classification of materials [26].
Although AI can potentially help surveyors in PRA/PDA, existing studies have mainly focused on how to apply specific AI technology in some specific PRA/PDA stages and AI’s role in broader construction and demolition contexts. No studies have focused specifically on detecting how AI can be embedded in PRA/PDA from the entire perspective. In other words, there are no comprehensive reviews on how AI has been applied to PRA/PDA.
Therefore, this study aims to review how AI has been applied in PRA/PDA. To be specific, this study reviews which type of AI has been applied in each specific PRA/PDA stage. The objectives of this study are to (i) provide a comprehensive overview of how AI techniques are used in PRA/PDA; (ii) present a discussion about perspectives and future research on using AI in PRA/PDA.

2. Methodology

2.1. Search Processes

This section introduces the methodologies used to review how AI has been applied in PRA/PDA. This methodology is adapted from the review methodology conducted from Panchalingam and Chan (2019) [27] and Aguilar et al. (2021) [28]. The PRISMA guidelines were followed.
This section begins by outlining the search strategies, then describes the criteria for including or excluding sources and the methods used to select relevant documents. The process used to finalize the selection is subsequently detailed. This review was based on the sub-stages of PRA/PDA. For each sub-stage, the search methodology followed the following steps:
The ScienceDirect, IEEE Xplorer, Google Scholar, Scopus, Elsevier, and Springer databases were explored. The criteria applied to determine eligible publications are outlined below:
  • Articles, books, and conference papers in English related to the sub-processes
  • Document is available in electronic form
  • Published before 31 March 2025
  • The paper should be related to structured elements or mainly related to the structured elements of building, but can include non-structured elements.
  • The paper related to use AI in PRA/PDA
The search is based on sub-stages of PRA/PDA (Figure 1) as listed in Table 1 (second column). For each sub-stage, the search process follows the three steps adjusted from Aguilar et al. (2021) [28]: Firstly, the articles were selected by evaluating their title and keywords, using the search strings. The keywords used for each sub-stage are shown in Table 1 (third column). Then, the abstracts of the papers found in the previous step were read and justified based on the inclusion criteria to determine whether they were selected for the next step. If the paper satisfied the inclusion criteria, the full text was read and justified by the inclusion criteria for the final selection.

2.2. Scope of AI Topics

As a developing technology, AI encompasses various topics that may contribute to supporting and enhancing PRA/PDA procedures. Based on the summary from Panchalingam and Chan (2019) [27], these topics include Machine learning, Deep learning, Neuro networks, Natural language processing, Pattern recognition, Machine vision, Expert systems, Fuzzy logic, and Genetic algorithms. An explanation of each AI topic is summarized in Appendix A.

2.3. Preliminary Results

Table 1 (fourth column) shows how many papers were found. Based on the search, 15 papers were found that were related to applying specific AI in PRA/PDA-related floor plan (papers listed in Appendix B); no papers were related to using specific AI to deal with PRA/PDA-related operation and maintenance handbook and other related documents; no papers were related to applying specific AI in PRA/PDA-related object detection; 19 papers related to applying specific AI in PRA/PDA-related material detection were founded (papers listed in Appendix E); 6 papers related to using specific AI in volume detection were founded (papers listed in Appendix F); no papers were related to using specific AI in PRA/PDA-related report writing. The flowchart of the methodology is displayed in Figure 2.

3. Discussion

In this section, the review results on how AI has been used in PRA/PDA processes and the potential of AI in PRA/PDA processes are discussed based on each sub-stage.

3.1. AI for PRA/PDA-Related Floor Plan Recognition

3.1.1. AI-Based Floor Plan Recognition and Reconstruction Processes

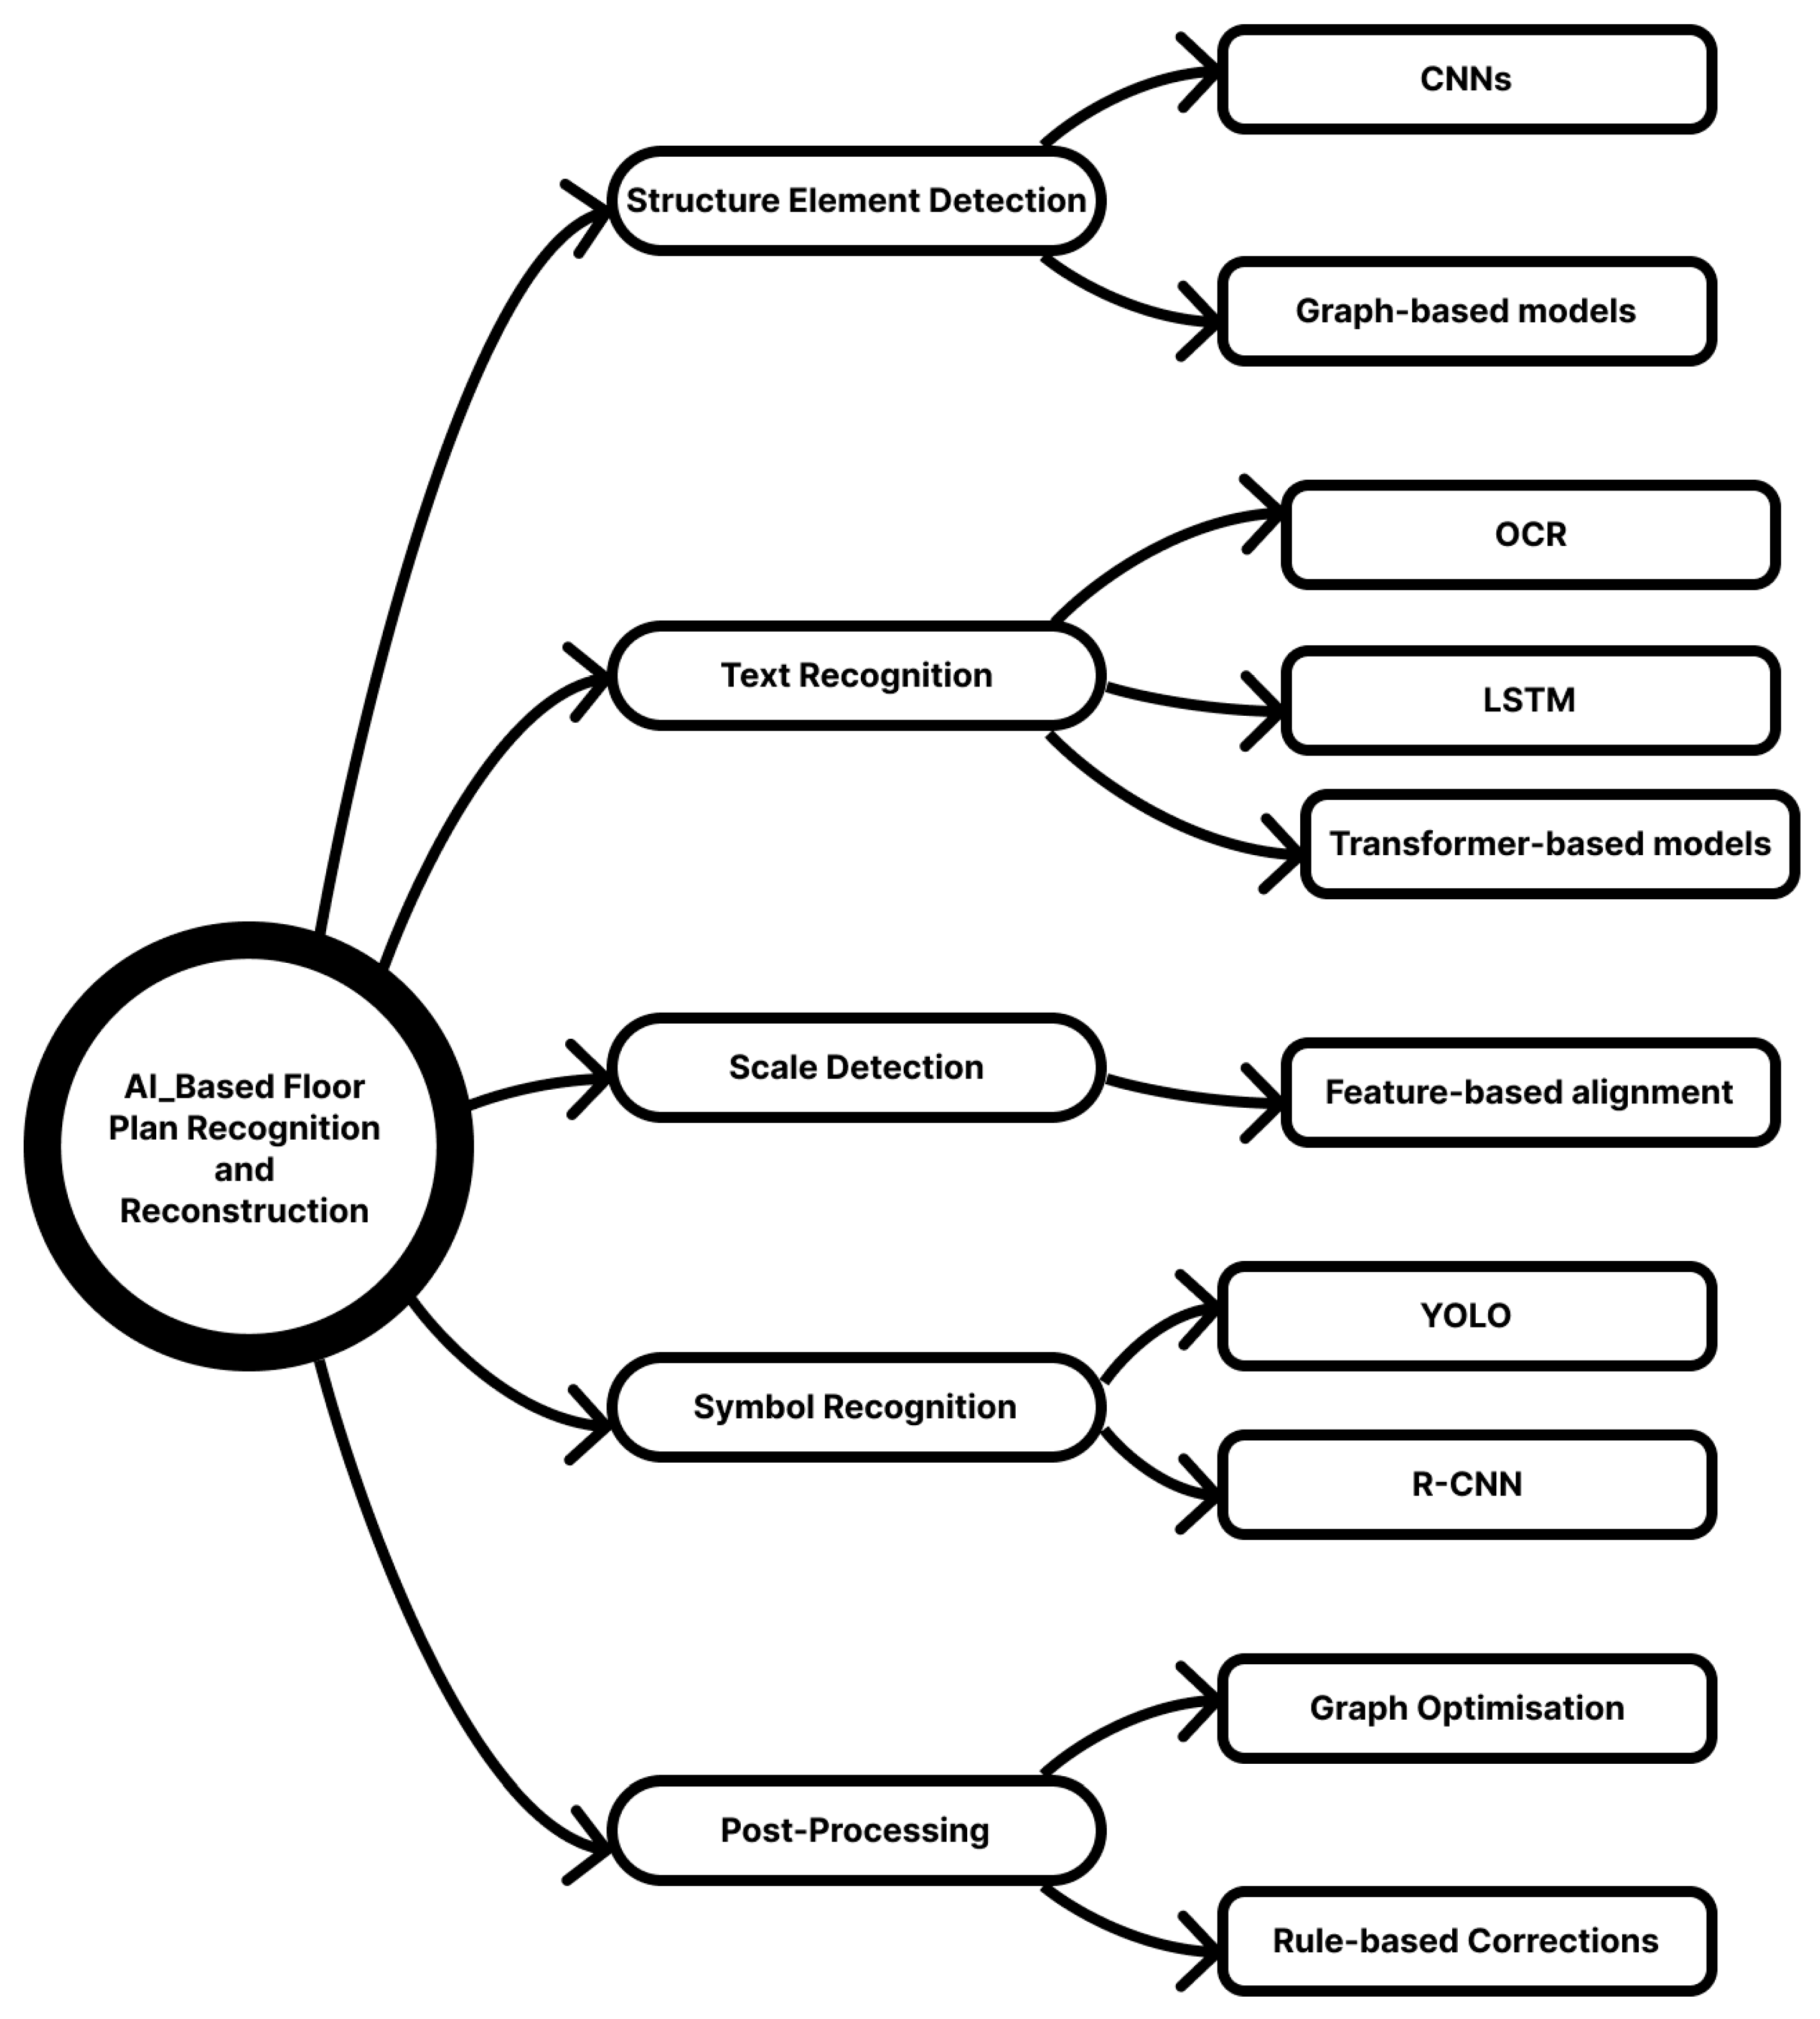
The process of detecting, extracting, and transforming floor plans into 3D models using AI involves a series of systematic steps (Figure 3). Each step addresses a key component of floor plan understanding, which contributes to the construction of a structured digital model [29].
The first step is structural elements extraction. In floor plan recognition, key architectural components such as walls, doors, and windows need to be segmented and classified. Convolutional neural networks (CNN) and graph-based learning approaches can be used to detect and classify these structural elements. The extracted geometric features are then used to reconstruct the 3D layout of the building. After that, texts and annotations need to be detected and recognized. Texts within floor plans can provide semantic information, such as room labels, dimensions, and annotations. By employing Optical Character Recognition (OCR) methods, AI can effectively extract and interpret text data. These models can help associate functional labels with detected spaces to ensure that the room usage is accurately mapped within the reconstructed 3D model.
In the next step, symbols need to be detected. Floor plans also contain architectural symbols such as staircases, elevators, furniture, and electrical components. AI-based object detection algorithms, such as You Only Look Once (YOLO) and Region-Based Convolutional Neural Networks (R-CNNs), can identify and categorize these symbols. The ability to recognize these elements contributes to enhance spatial representation and improving the semantic richness of the 3D model. Follow by that, AI need to interpret the scale of floor plan drawings and adjust proportions accordingly. Feature-based alignment algorithms can assist in detecting measurement indicators within the floor plan to maintain spatial relationships among architectural elements.
Once all architectural features have been extracted, AI models refine the detected elements to ensure geometric consistency. Post-processing techniques such as graph-based optimization and rule-based validation are applied to correct misaligned walls, misclassified elements, or incomplete structures in the resulting 3D model.

3.1.2. AI Technologies for Floor Plan Recognition and Transformation

Based on the review, 15 papers have been identified to be related to AI-based floor plan recognition and reconstruction in PRA/PDA. A summary of the 15 papers including the input data types, AI methodologies, and its accuracy rates is displayed in Appendix B. These AI technologies can be grouped as “Deep learning-based image recognition”, “Generative Adversarial Network (GAN)—based methodologies”, “Rule-based vectorization methods”, and “Hybrid AI and procedural modelling”.
Deep Learning-Based Image Recognition
Barreiro et al. (2023) [30] used (CNN) architectures to convert floor plan images into vector representations, in this way to enhance the identification of key architectural features including walls, doorways, and furniture locations. They developed a deep learning-driven approach for automatically transforming digitized 2D floor plans into organized 3D BIM. This emphasizes the extraction of semantic spatial data which is used for integration with GIS and architectural design frameworks. Their method applies a CNN-based segmentation network to detect walls, doors, and structural elements, followed by a Hough transform-based edge detection algorithm for vectorization. The segmented data is then extruded into a 3D model format which adheres to Industry Foundation Classes (IFC) standards, enabling efficient incorporation within architectural design processes. Training was conducted using the CubiCasa5k dataset, resulting in 81% IoU in wall segmentation and an 80% accuracy in vectorization, surpassing the performance reported in earlier leading methodologies. However, the system requires large training datasets and may need manual corrections for complex or non-standard layouts.
Moloo et al. (2011) [31] also integrate CNN-based classification. However, their study used OpenCV-based segmentation first to extract architectural components before applying CNN models, which lead to an overlap with Barreiro et al. (2023) [30] in feature extraction but differing in preprocessing techniques. Moloo et al. (2011) [31] proposed a three-phase methodology to automate the conversion of scanned 2D architectural floor plans into interactive pseudo-3D models. Their method reduces the time and effort of traditional 3D reconstruction. The process involves image processing using OpenCV techniques to extract walls, doors, and windows; structured data storage in XML for interoperability; and 3D model generation with the Irrlicht engine for interactive visualization. The model was tested on six floor plans. The system achieved 85% to 90% accuracy and processed images in 2–5 s, with 3D model generation averaging 4 s per scene. Although it has been verified as effective, the method requires manual adjustments, particularly for door and window alignment, and supports only horizontal and vertical walls, which limited its application for complex layouts.
Cheng et al. (2022) [32] combine YOLO-based object detection with OCR for text recognition, allowing precise identification of architectural symbols and room labels. They proposed a deep-learning-based multi-stage recognition approach for transforming 2D raster floor plan images into vector-based 3D representations. Their methodology consists of five steps: YOLOv5 for detecting and separating floor plan components, deep residual networks (DRN) for extracting structural data, OCR for reading annotation texts, vectorizing extracted features, and generating an accurate isometric 3D model. The dataset includes 2000 manually labelled floor plan images from the RJFM dataset. The model achieves 98% recognition accuracy, which can significantly improve floor plan recognition. However, the approach requires manual annotation for training and struggles with unstructured or irregular plans.
Generative Adversarial Network (GAN)-Based Methodologies
Generative Adversarial Network (GAN)-based methodologies can be used for automated architectural drawing transformation, style standardization, and 3D reconstruction. Kim et al. (2021) [33] introduced a Conditional Generative Adversarial Network (cGAN)-based model to address inconsistencies in architectural floor plan representations before vectorization. Their approach utilizes a deep learning-based style transfer mechanism that normalizes hand-drawn, scanned, and digitally rendered floor plans to reduce the variability in architectural notations across different sources. The proposed model enhances room detection and structural feature extraction by transforming unstructured floor plans into a more standardized format. The system was trained on the EAIS floor plan dataset, achieving a 12% improvement in room recognition accuracy compared to conventional segmentation techniques, with a 95% room-to-room matching accuracy. However, the approach struggles with extreme variations in floor plan notations, such as those found in historical or non-standardized drawings, and may require manual intervention for error correction.
Usman et al. (2024) [34] extend GAN-based techniques to hand-drawn architectural sketches, which demonstrated that GANs can generalize across different drawing formats. To be specific, Usman et al. (2024) [34] introduce an automated workflow for converting hand-drawn floor plans into immersive 3D layouts using deep learning-based layouts and object detection. The system, built with Unity3D, processes hand-sketched floor plans and extracts features using CNNs. However, it requires clean and high-contrast sketches for optimal performance.
Aiming to enhance the realism of 3D scene reconstruction from 2D floor plans, Vidanapathirana et al. (2021) [24] incorporate GAN-based texture synthesis into a Graph Neural Network (GNN) framework. Different from Kim (2021) [33], Vidanapathirana et al. (2021) [23] did not focus on architectural vectorization or model generation. Instead, the method focused on realistic scene generation, which is more aligned with Usman et al. (2024) [34] and Park & Kim (2021) [35] in extending GAN-based processing toward 3D realism and immersive environments.
Rule-Based Vectorization Methods for Automated Floor Plan Processing
The rule-based vectorization methods for automated floor plan processing rely on computer vision, symbol recognition, and structured vectorization techniques to extract architectural elements from rasterized or CAD-based 2D images. Their connections can be understood in terms of vector-based geometric reconstruction, rule-based symbol detection, and 3D model generation from 2D representations.
So et al. (1998) [36], Or et al. (2005) [37], and Chandler (2006) [38] focused on vector-based geometric reconstruction, which formed the foundation for rule-based feature extraction. So et al. (1998) [36] introduced extrusion-based 3D modeling from 2D CAD plans, which remains a fundamental technique in modern vectorization pipelines and influenced how floor plan vectorization contributes to structured 3D model generation. Or et al. (2005) [37] introduced a symbol recognition-based approach for automated 3D reconstruction of floor plans. Their system detects walls, doors, and windows using pattern recognition and Region Adjacency Graphs (RAGs). The dataset consists of various floor plans from architectural projects. Although highly automated, the system requires post-processing corrections for complex layouts. Chandler (2006) [38] developed Imhotep, a tool that can read SVG-format floor plans and export them as 3D Wavefront .obj files. The methodology relies on layered vector parsing to identify walls, doors, and windows. The dataset comprises various CAD-generated floor plans, with an accuracy of 92% in feature recognition. However, inconsistent floor plan standards pose challenges for generalization.
Mello et al. (2012) [39] expanded on these techniques by applying the Hough transform and contour-based segmentation to improve historical floor plan vectorization. Their approach bridges traditional rule-based processing with modern vector-based extraction methods. As a result, the accuracy of dealing with aged or degraded floor plan images increases. Wu (2015) [40] introduced IndoorOSM-based vectorization techniques for automatic 3D building reconstruction from 2D floor plans. This technique extends rule-based vectorization techniques into GIS and spatial mapping applications. The techniques connect vectorization-based techniques with automated 3D building reconstruction and link traditional vectorization methods and modern GIS-based modeling approaches.
Hybrid AI and Procedural Modeling
Combining machine learning, probabilistic models, and rule-based methodologies, Hybrid AI and procedural modeling approaches can be applied to automated 3D reconstruction, semantic modeling, and architectural layout generation.
Park and Kim (2021) [35] introduced 3DPlanNet, an ensemble learning model combining deep learning and rule-based heuristics to generate 3D vector models from 2D plans. Using only 30 labelled floor plans for training, they achieved 95% accuracy in wall extraction and 97% accuracy in object reconstruction. The model successfully processed over 110,000 floor plans, but its reliance on a small dataset raises concerns about generalization.
Liu et al. (2015) [41] and Pizarro et al. (2022) [29] both employed probabilistic models to improve architectural layout estimation and refinement. Liu et al. (2015) [41] presented Rent3D, a Markov Random Field (MRF)-based model that reconstructs 3D virtual tours from 2D floor plans and monocular images. The approach infers room layout, camera pose, and depth information. Their dataset consisted of 215 apartments from a London-based rental website. The model achieves 90% accuracy in layout estimation although faces challenges in occlusion handling and texture generation. Similarly, Pizarro et al. (2022) [29] relied on CNN to facilitate the automatic generation of 3D models from 2D architectural drawings. Their system extracts structural elements using feature extraction networks and refines predictions through reinforcement learning. The dataset consisted of large-scale multi-unit residential building plans. The approach achieved over 90% accuracy which is better than traditional rule-based methods.
Zak and Macadam (2017) [42] focus on integrating AI into BIM-based methodologies to enhance automated 3D object classification and semantic modeling. They integrated BIM methodologies with AI-driven image analysis to convert 2D CAD drawings into 3D models. Their system identifies walls, doors, and staircases and reconstructs spatial relationships. The dataset comprises existing BIM models and their corresponding 2D drawings. The approach achieves around 89% accuracy. However, its effectiveness is influenced by the completeness and quality of the CAD data provided as input.

3.1.3. Decision-Making Flowchart to Select AI Used in PRA/PDA-Related Floor Plan Recognition

The decision-making flowchart (Figure 4) illustrates a structured approach to determining suitable AI techniques for converting 2D floor plans into 3D architectural models, taking into account the specific properties and formats of the input data, based on the type and characteristics of the input data. This flowchart categorizes input data into “CAD or raster” and “hand-drawn or sketch”.
For CAD or raster floor plans, the dealing process is based on rule-based or hybrid AI approaches. These approaches can deal formalized drawings which contains consistent structural symbols. The core decision point in this branch assesses the need for Geographic Information System (GIS) integration. If GIS compatibility is required, the process recommends using the Wu (2015) [40] methodology, which integrates Indoor OSM-based vectorization techniques for spatial modeling. When GIS is not essential, methods proposed by Chandler (2006) [38], Or et al. (2005) [37], or So et al. (1998) [36] are suitable due to their emphasis on vector-based geometric reconstruction. Both pathways can generate a structured 3D model, focusing on architectural accuracy and computational efficiency.
For hand-drawn or sketch-based floor plans, the model will use GANs and deep learning methods, given their robustness in handling non-standardized and stylistically varied inputs. The decision point examines whether realism is a critical requirement for the reconstruction process. If high fidelity and immersive realism are prioritized, the methodology proposed by Vidanapathirana et al. (2021) [23] will be used, which integrates GANs with GNNs for realistic scene generation and results in an immersive 3D model. If realism is not a primary objective, GAN approaches exemplified by the work of GAN-based models such as those by Usman et al. (2024) [33] or Kim et al. (2021) [32] can be employed to produce standard structured 3D layouts and retained efficient handling of sketch-based input variability.

3.1.4. Summary

AI-driven methodologies for 2D-to-3D floor plan transformation employ multiple types of input data, utilize a variety of input data sources, including scanned, hand-drawn, and digital floor plans, raster images, 2D CAD drawings, IndoorOSM GIS data, and monocular images. These data types require preprocessing techniques such as vectorization, segmentation, and feature extraction to enhance accuracy and usability in downstream tasks. AI-driven methodologies, including CNN-based feature recognition, GAN-powered style transfer, rule-based vectorization, and Hybrid AI and Procedural Modeling, have improved the accuracy, efficiency, and scalability of 2D-to-3D floor plan-based architectural reconstruction. CNN-based approaches facilitate structural element detection and vectorization, while GANs enhance style standardization and sketch-to-model conversions. Hybrid AI techniques, such as probabilistic modeling and reinforcement learning, further refine semantic object classification and spatial alignment in complex layouts. In terms of accuracy, CNN-based approaches achieve 80–98% recognition accuracy, particularly excelling in wall segmentation, room-to-room matching, and object classification. GAN-based techniques focus on realistic texture generation and style normalization, but their performance is dependent on high-quality input sketches. Rule-based and GIS-integrated methodologies provide high-detail 3D reconstructions, although challenges remain in standardization and handling diverse architectural styles. The decision-making flowchart suggested AI methodologies with the nature of input data and end-user requirements, enabling optimized selection of techniques for accurate and semantically rich 3D reconstruction from diverse floor plan formats.
Future research could focus on multi-modal AI fusion, which can integrate deep learning with semantic reasoning, procedural modeling, and reinforcement learning to enhance automation and fidelity in 3D model generation based on floor plans. Moreover, improving training dataset diversity to refine OCR-based text recognition and enhancing AI-driven spatial consistency mechanisms will be important in overcoming challenges related to non-standardized floor plan notations, geometric inconsistencies, and symbol recognition variations.

3.2. AI for PRA/PDA-Related Document Detection

Apart from floor plans, there are other kinds of documents can be accessed by surveyors before going to on site. These documents include Operation and Maintenance (O&M) Books, Building Survey Reports, As-Built Drawings, Material Inventory Reports, Energy Performance Certificates (EPCs), Hazardous Material Survey, Environmental Impact Assessments (EIA), Mechanical, Electrical, and Plumbing (MEP) Reports, Fire Safety Reports, Occupancy and Usage Records, Geotechnical Reports, Waste Management Plans, Regulatory Compliance Documentation. The context included in each document is listed in Appendix C. Although no specific AI has been developed to deal with these documents to assist PRAPDA processes, some AI technologies have shown their potential, such as natural language processing (NLP), optical character recognition (OCR), and computer vision.

3.2.1. Natural Language Processing (NLP)

NLP technology can analyze and interpret textual information, effectively categorizing and summarizing content from documents such as Material Inventory Reports, Hazardous Material Surveys, and Regulatory Compliance Documentation. NLP can automatically identify hazardous substances, construction materials, recyclables, and compliance standards. For example, Named Entity Recognition (NER) can automatically identify and extract critical building-related entities from documents. Terms such as “asbestos”, “lead paint”, “PVC piping”, or “concrete slab” can be recognized and tagged, giving surveyors a quick overview of what materials exist in the building. NLP can also identify associated risks, such as flammability, toxicity, or structural weaknesses, helping highlight areas that require special attention during audits. In addition to entity extraction, relation extraction can identify links between materials and specific locations in the building—such as noting that “asbestos insulation is present in the third-floor mechanical room”—providing spatial context to the findings.

3.2.2. Optical Character Recognition (OCR)

In PRA/PDA, one of the first and most crucial steps is gathering and analyzing existing building documentation. These documents can date back decades and are usually in the form of scanned PDFs, photocopies, blueprints, or even handwritten notes. While these records may hold critical information—such as material types, historical repairs, safety hazards, or modifications—they are often not digitally searchable or editable. This creates a major barrier for auditors who need to extract relevant data efficiently. OCR technology digitizes printed or handwritten text from documents such as Operation and Maintenance Books and Building Survey Reports, transforming them into machine-readable data. By rapidly extracting structured information, OCR substantially reduces the manual data entry workload, minimizes transcription errors, and enables quick referencing and data sharing among stakeholders. For example, a scanned O&M manual from say the 1980s might contain important notes about the use of asbestos in wall insulation. Without OCR, a surveyor would have to manually read the entire document, page by page, to find this information. However, with OCR, the text is extracted automatically, making the document searchable and analyzable in a matter of seconds.

3.2.3. Computer Vision

Operation and Maintenance (O&M) manuals often contain visual information that is just as important—if not more so—than the written content. These visuals typically include diagrams, schematics, and photographs of building systems or equipment, such as boilers, ventilation units, electrical panels, and plumbing fixtures. With the help of Computer Vision, these images can be analyzed for distinct patterns, shapes, and layouts. The system can compare them to a digital database of known equipment types and material profiles. For example, a photo of a fan coil unit in the manual can be matched to its model and identified as containing copper piping and aluminum fins. This allows the audit team to quickly determine what the equipment is, what materials it includes, and whether it can be safely reused, recycled, or requires specialized disposal. In addition, Computer Vision can be combined with OCR and NLP for deep document understanding. For example, a scanned equipment diagram might be visually identified by Computer Vision, its model number read through OCR, and its maintenance status interpreted through NLP.

3.3. AI for PRA/PDA-Related Object Detection

In this review, we direct our attention to review the major efforts in object detection. This involves two primary steps: object localization, which predicts the presence and location of an object via a bounding box around it, and object classification, which predicts the class or category to which the object belongs. Although nonspecific AI methods have been applied specifically in PRA/PDA-related object detection, certain techniques currently used for point-cloud-based object detection in practical applications demonstrate potential suitability for integration into PRA/PDA object detection workflows. Figure 5 provides an overview of the data types and algorithms employed in these detection methods.

3.3.1. Types of Input Data for Object Detection

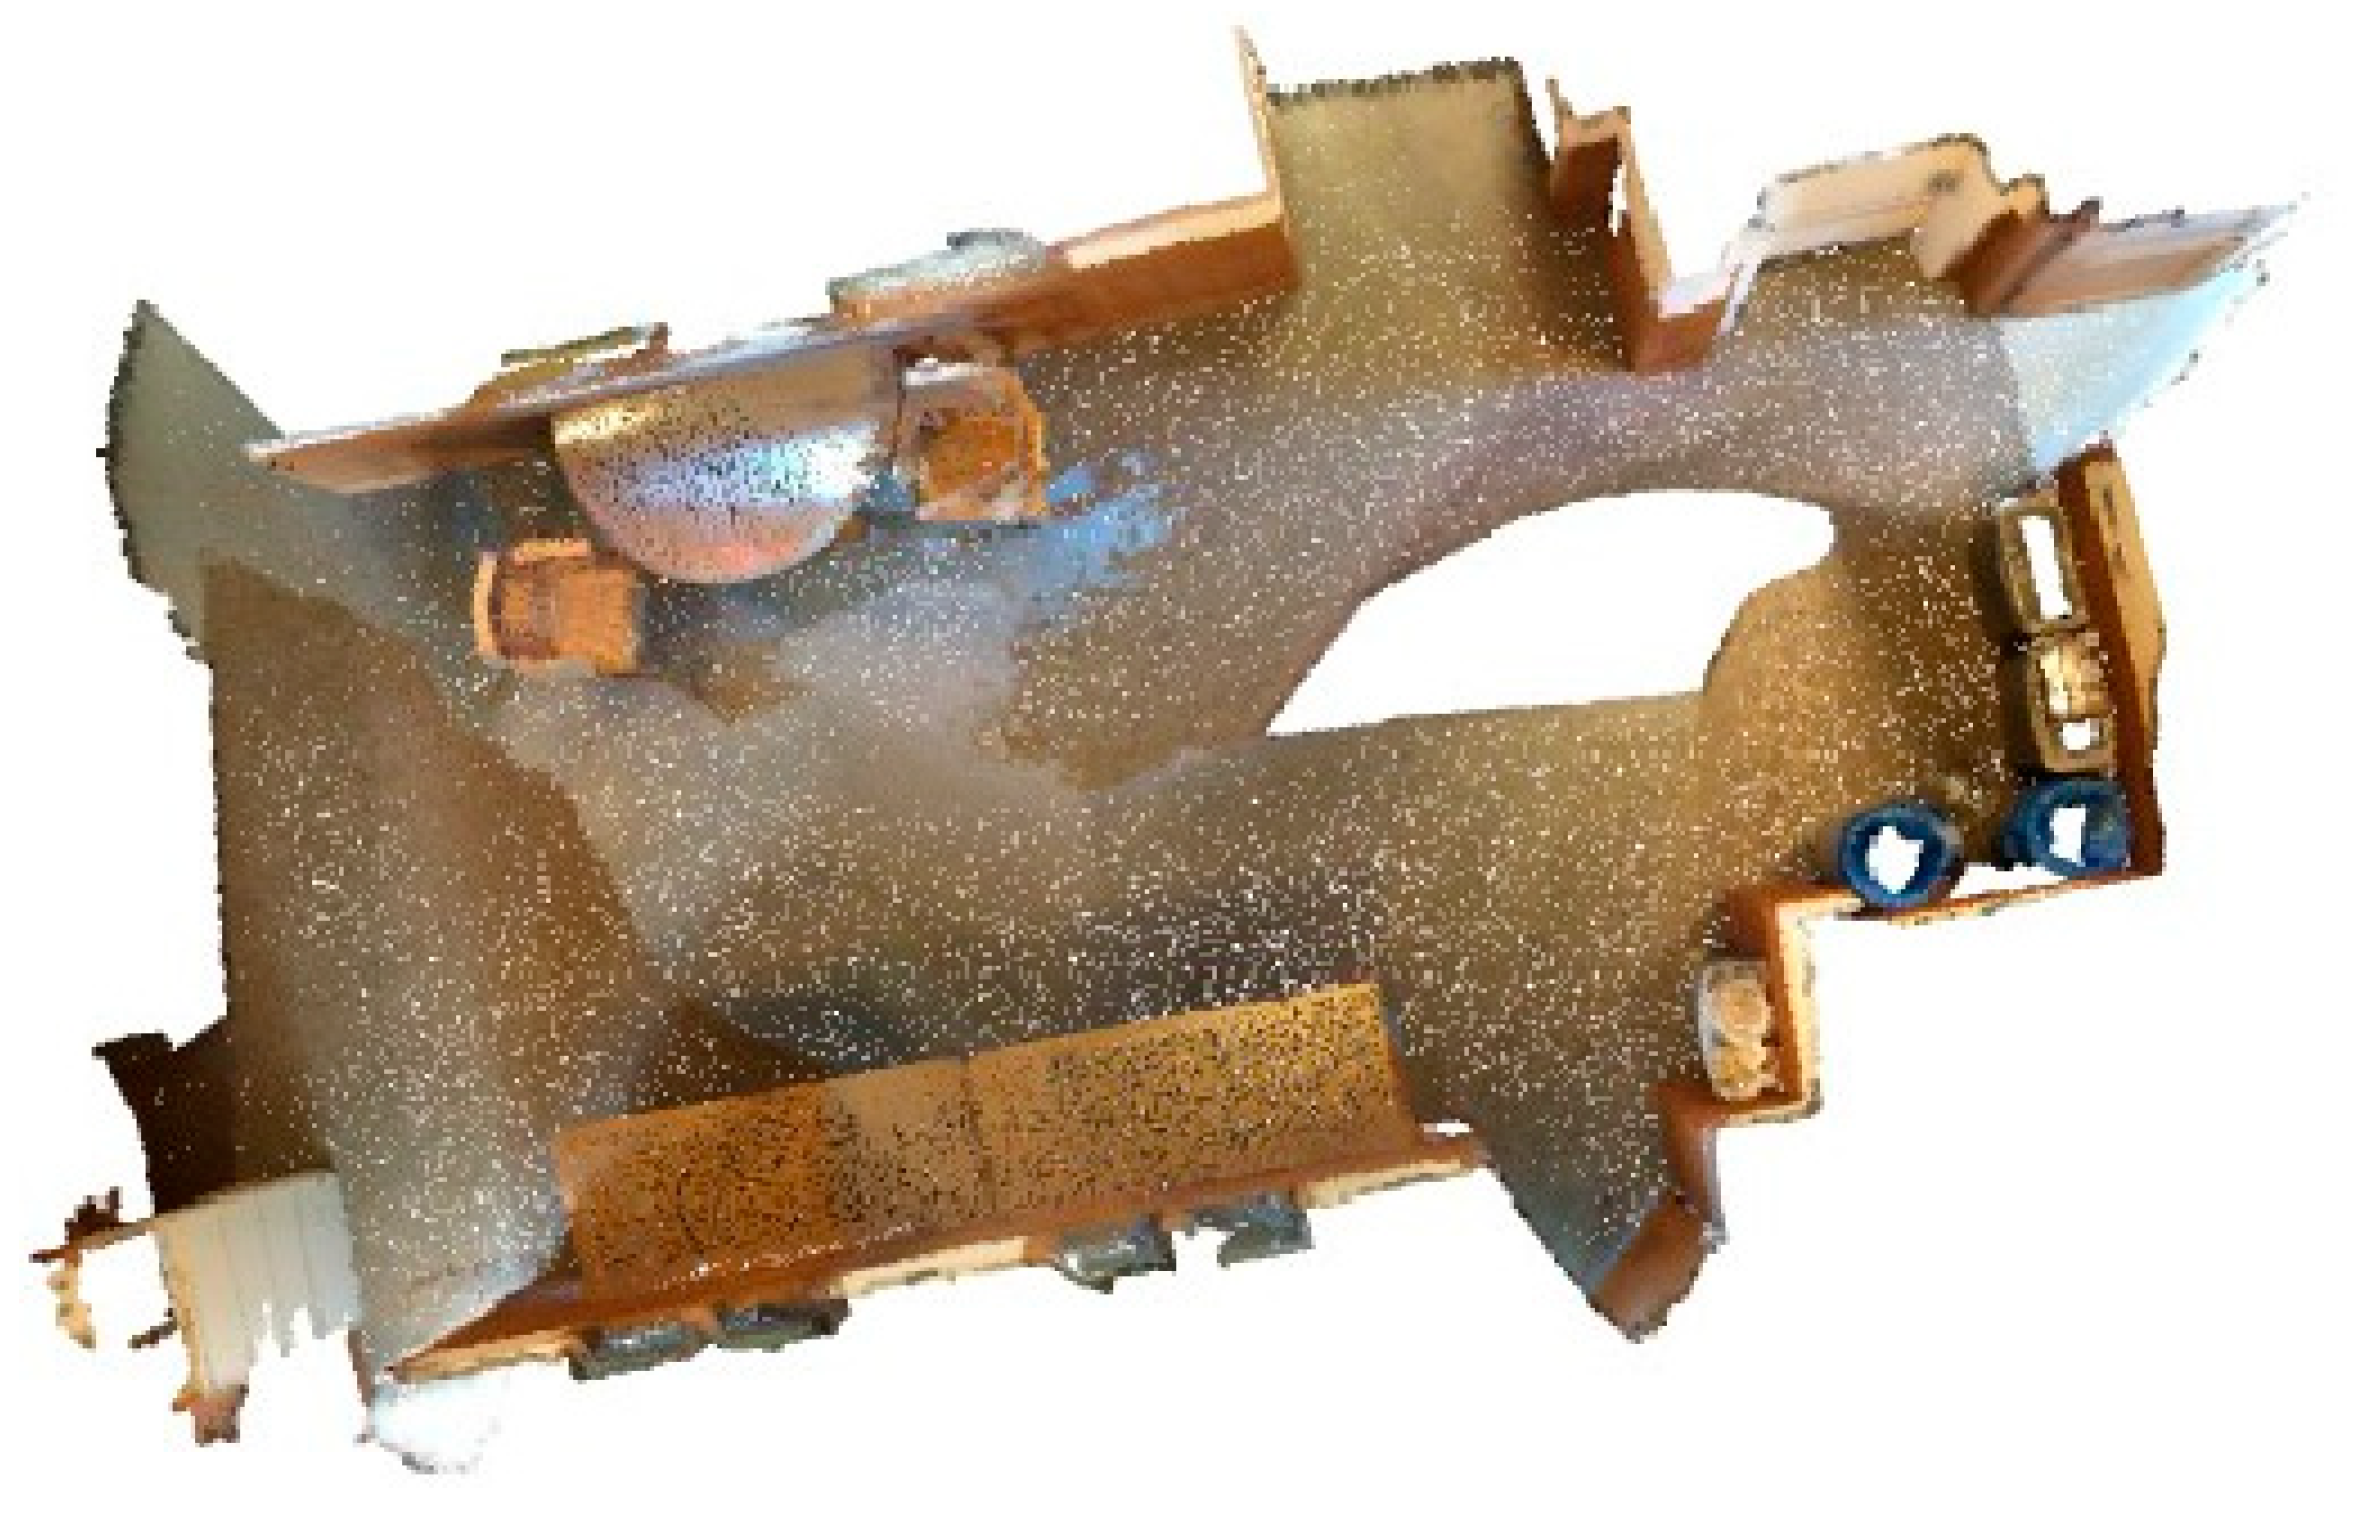
Object detection frameworks typically employ various forms of data (primarily images and point clouds) to evaluate and understand environmental contexts. Image data sourced from digital photographs and video frames. It is the most common and widely used format due to its ease of processing and accessibility. It contains detailed photometric information such as color and intensity but is susceptible to lighting variations and occlusions, making detection challenging under certain conditions [43,44]. Although monocular images lack depth perception, stereo cameras attempt to estimate depth with limited accuracy. Point cloud data is generated by 3D scanners such as Light Detection and Ranging (LiDAR). One example of point cloud in indoor building is shown in Figure 6. It offers a three-dimensional representation of objects and their spatial relationships. Different from images, point clouds provide structural and topological details essential for precise object detection [45]. However, they tend to be sparse, necessitating complementary image data for more comprehensive scene understanding [44].
Combining image data with point cloud information is implemented in applications where both visual and spatial details are needed. For example, in PRA/PDA, images can be used to catalog a building’s features while point cloud data provides geometric accuracy for structural analysis [46]. 3D image processing technologies enhance object detection by analyzing spatial relationships and geometric structures. LiDAR-based ranging and scanning methodologies, including Mechanical, Hybrid, and Solid-State LiDARs, contribute to capturing precise environmental details [47]. Mechanical LiDAR achieves 360-degree scanning with multiple laser channels, while Hybrid and Solid-State LiDARs offer more compact and cost-effective solutions.
For 3D object detection, deep learning models employ structured network architectures for the identification and spatial positioning of objects within a 3D environment. Object detection networks generally follow two approaches: (i) two-stage methods, which refine object proposals for higher accuracy [48], and (ii) one-stage methods, which predict objects in a single inference for faster processing [49]. These networks take input from multiple sensors, combining LiDAR point clouds and RGB images for enhanced feature extraction. The detected objects are then represented by 3D bounding boxes, which are encoded using methods such as 8-corner encoding, 4-corner 2-height encoding, or center-size encoding [44]. These encoding strategies help define object orientation and dimensions, which are important for tasks such as object tracking and motion prediction. With advancements in sensor technology and deep learning, object detection systems continue to evolve, improving precision and efficiency in applications across autonomous systems and structural assessments [42,45,47].

3.3.2. AI and Machine Learning Techniques in PRA/PDA-Related Object Detection

Although it has not been applied in PRA/PDA-related object detection, some methods have been applied in real-life object detection and display a potential to be applied in PRA/PDA-related object detection processes. 3D point clouds and 2D images are the two core inputs of PRA/PDA-related object detection. The section, thus, reviews the methods that can achieve object detection based on 3D point clouds and 2D images. These methods can be categorized into Region proposal-based and Single-shot methods. Region proposal-based approaches include (i) Multi-view-based methods, (ii) Segmentation-based methods, and (iii) Frustum-based methods. Single-shot methods include (i) BEV-based methods, (ii) Discretization-based methods, and (iii) Point-based methods. A review of these potential methods and evidence has been listed in Appendix D.
Region Proposal-Based Methods
(i) Multi-view-based methods
Multi-view-based methods aim to integrate information from multiple perspectives, such as Bird’s Eye View (BEV), LiDAR front view, and RGB images, to generate more precise 3D bounding boxes. For example, Chen et al. (2017) [44] introduced the Multi-View 3D Object Detection Network (MV3D), which advances 3D object detection by fusing information from LiDAR point clouds and RGB images across multiple viewpoints. This method initially creates 3D region proposals in BEV format, which are subsequently projected onto several distinct visual perspectives, including LiDAR front view and camera images, to extract multi-modal features. These features are fused using a deep learning-based framework to predict oriented 3D bounding boxes with high accuracy. Their method achieves a 99.1% recall at an IoU of 0.25, which indicated an exceptional detection capability. However, this high recall comes at the cost of significant computational overhead, as the process involves multiple stages of feature extraction, proposal refinement, and multi-view fusion, which may limit its practicality for real-time use. In response to such limitations. Liang et al. (2019) [50] developed a Multi-Task Multi-Sensor 3D Object Detection Network that aims to improve feature extraction across different modalities by combining LiDAR point cloud data with RGB imagery. Their approach first projects LiDAR points onto a BEV representation, which provides a structured 2D grid format for feature extraction. Then, these BEV features are aligned with corresponding image features through continuous convolution operations, allowing for effective multi-resolution feature fusion. By leveraging both LiDAR’s depth information and RGB images’ color and texture cues, their method generates a dense and well-structured representation that improves object detection performance in both 2D and 3D spaces. This approach enhances detection robustness in occluded scenarios and distant objects, where single-modality methods often struggle.
Various approaches have been explored to develop resilient data representations. Lu et al. (2019) [51] introduced SCANet, a Spatial-Channel Attention Network, which seeks to advance 3D object detection by incorporating both spatial and channel-based attention strategies to strengthen feature extraction and contextual understanding. Their approach introduces the Spatial-Channel Attention (SCA) module, which refines feature representations by applying spatial attention to emphasize important regions and channel-wise attention to highlight relevant feature maps. Furthermore, the Extension Spatial Upsample (ESU) component addresses the loss of spatial detail that occurs during downsampling by aggregating low-level features across multiple scales, leading to more precise 3D region proposals. To further improve detection accuracy, SCANet employs a multi-level fusion scheme, which enables continuous interaction between 2D and 3D feature representations, enhancing classification and 3D bounding box regression. Empirical evaluation using the KITTI benchmark indicates that SCANet attains performance comparable to the current leading methods while maintaining an inference speed of 11 FPS on an NVIDIA 1080Ti GPU. Nonetheless, the added computational demands of attention mechanisms create a balance between model precision and the ability to operate in real time, highlighting the need for additional optimization, especially in settings with limited computational resources. In response, Zeng et al. (2018) [52] introduced RT3D, a real-time framework for three-dimensional object detection utilizing LiDAR point clouds. This method enhances the traditional two-stage detection process by implementing a pre-RoI pooling convolution approach, effectively shifting most convolutional computations to occur before the Region of Interest (RoI) pooling phase. This optimization allows convolutions to be shared across all RoIs, significantly reducing redundant computations. Additionally, they developed a pose-sensitive feature map that enhances detection accuracy by leveraging vehicle orientation and spatial context. Their method achieves competitive accuracy on the KITTI benchmark while being the first LiDAR-based 3D detection model capable of real-time processing at 11.1 FPS, which is five times faster than MV3D. However, while the method greatly improves speed, the reliance on early-stage feature extraction may limit the adaptability of later-stage refinements, potentially affecting detection performance in highly complex and cluttered environments. By leveraging complementary data from different views, these methods can enhance detection performance, especially in occluded and cluttered environments. However, they come with significant computational costs due to the necessity of processing multiple sensor inputs.
(ii) Segmentation-based methods
Instead of processing the entire point cloud, segmentation-based methods for 3D object detection focus on filtering out irrelevant background points by applying semantic segmentation. Segmentation-based methods can significantly reduce computational costs while improving object proposal quality. By isolating foreground objects, segmentation-based methods ensure that only highly relevant regions are processed, which can improve detection performance in complex environments with occlusions and dense object distributions.
Two representative segmentation-based methods—PointRCNN [50] and PV-RCNN [25]—have been promoted to evolute point cloud-based object detection. PointRCNN was introduced by Shi et al. (2019) [25]. PointRCNN is a two-stage framework that directly segments foreground objects from raw LiDAR point clouds. Instead of relying on handcrafted feature extraction or voxelization, PointRCNN applies a bottom-up segmentation strategy to separate foreground and background points. The first stage classifies each point based on its likelihood of belonging to an object, removing background noise and ensuring high recall rates. The second stage employs a Region Proposal Network (RPN) that refines these foreground points to generate precise 3D bounding boxes. This segmentation-first approach significantly improves detection recall, making it highly effective in complex scenarios with occlusions and dense object distributions. However, although PointRCNN’s point-wise feature extraction ensures precise localization, the intensive computational requirements of processing each individual point result in significant overhead, in this way to limit the method’s practicality for real-time implementation.
Shi et al. (2020) [25] extended segmentation-based object detection by integrating learning point-based and voxel-based features into PV-RCNN, a hybrid 3D object detection framework. Compared to PointRCNN which relies solely on point-wise segmentation, PV-RCNN introduces a multi-scale feature aggregation strategy that combines the advantages of voxelized feature representation and raw point-based learning. The Voxel Set Abstraction (VSA) component identifies a limited number of representative points from voxel-derived feature maps, in this way to enhance processing efficiency while maintaining the precision of spatial information. In addition, PV-RCNN incorporates a RoI-grid pooling module, which extracts high-quality features within each detected region, which further improves classification confidence and localization precision. Compared to PointRCNN, PV-RCNN enhances efficiency and detection performance, demonstrating superior results on the KITTI and Waymo Open datasets.
(iii) Frustum-based methods
Frustum-based methods use 2D object detection models to propose 2D bounding boxes, which are then extended into the 3D space using LiDAR point clouds. This method effectively reduces search space, making it computationally efficient. Although these techniques are effective in generating potential positions for 3D objects, their overall performance is constrained by the inherent limitations of the 2D detection stage within the sequential pipeline.
F-PointNets creates a frustum hypothesis for every detected two-dimensional area and employs PointNet or PointNet++ architectures to extract point cloud features from each corresponding three-dimensional frustum, enabling the estimation of modal 3D bounding boxes. Building on this foundation, Zhao et al. (2019) [53] introduced Point-SENet. Point-SENet is an adaptive feature selection mechanism which is designed to enhance 3D object detection by dynamically predicting scaling factors. These factors can selectively emphasize informative features and suppress less relevant ones. Different from conventional feature extraction methods that treat all points equally, Point-SENet assigns varying importance to spatial and semantic attributes to ensure that critical object features are amplified for better recognition. Point-SENet significantly improves detection performance over F-PointNet, especially when confronted with complexities such as object occlusions, measurement noise from sensors, and variability in object shapes.
Xu et al. (2018) [46] introduced PointFusion, a sensor fusion framework grounded in deep learning for 3D object detection. PointFusion combines features extracted from 2D images with data from 3D point clouds to enable precise estimation of 3D bounding boxes. Their method processes each modality separately.
A CNN derives visual and geometric characteristics from the RGB images, while a separate PointNet-based architecture independently captures spatial information from the unprocessed LiDAR point cloud. Subsequently, these features are combined using a unified fusion network, which directly predicts 3D box corner locations to ensure accurate localization and orientation estimation. Through advanced sensor fusion techniques, PointFusion operates effectively without requiring dataset-specific parameter adjustments and achieves leading results on benchmark datasets, including KITTI for outdoor and SUN-RGBD for indoor environments, outperforming several multi-stage and voxel-based methods. However, while dense fusion improves accuracy, the method’s reliance on CNN-based feature extraction introduces additional computational costs, which requires optimizations for real-time deployment.
Shin et al. (2019) [54] presented RoarNet, a dual-stage framework for 3D object detection that integrates 2D detections from monocular images with 3D LiDAR point cloud data to accurately generate 3D bounding boxes. During the initial phase, RoarNet 2D employs a monocular image detector to localize objects in 2D and deduce their 3D poses via a geometric consistency search. This search refines the estimated 3D object locations by considering multiple geometrically feasible object candidates, significantly reducing the search space in 3D point clouds and improving detection efficiency. In the second stage, RoarNet 3D extracted 3D object and processed them through a box regression network. A PointNet-based feature extraction process is used within this network to enhance the initial object proposals and determine the precise orientation of the resulting 3D bounding boxes. This network employs a PointNet-based feature extraction pipeline to refine the object proposals and predict the final oriented 3D bounding boxes. This recursive region refinement process enables precise localization and robust detection performance, even in challenging sensor synchronization conditions such as LiDAR and camera data are not perfectly aligned. Empirical results using the KITTI dataset indicate that RoarNet surpasses the performance of contemporary fusion-based 3D detection frameworks, achieving superior accuracy and robustness in both synchronized and unsynchronized sensor conditions.
Wang et al. (2019) [55] introduced Frustum ConvNet (F-ConvNet), an end-to-end framework for 3D object detection. F-ConvNet enhances feature aggregation by sliding frustums along the frustum axis to capture local point-wise features. F-ConvNet generates a sequence of frustums instead of using a single frustum per object when given a 2D region proposal from an RGB image. This can ensure a more comprehensive feature extraction process. Within each frustum, PointNet is applied to aggregate point-wise features, which are then reformed into a 2D feature map. A fully convolutional network (FCN) then processes this feature map, integrating spatial information from individual frustums to produce a unified representation, allowing for continuous estimation of 3D bounding boxes. Different from previous methods, such as F-PointNet, which relies on separate segmentation and proposal stages, F-ConvNet performs joint feature learning and detection, leading to a more efficient and accurate detection pipeline. Results from empirical testing on both the SUN-RGBD (indoor) and KITTI (outdoor) datasets show that F-ConvNet surpasses prior methods, attaining leading performance metrics and achieving a top ranking on the KITTI benchmark at the time of its release.
Lehner et al. (2019) [56] introduced Patch Refinement, a dual-phase framework designed to provide precise 3D object detection and localization using LiDAR point cloud data. Patch Refinement includes two independently trained VoxelNet-based networks: a RPN and a LRN. The detection process is first decomposed into a preliminary BEV detection step, where the RPN generates initial object proposals. Based on these proposals, the LRN extracts localized point cloud subsets, referred to as patches. These patches are then refined to improve detection accuracy. The LRN operates with a higher voxel resolution, which can overcome the memory constraints of full-scene processing by focusing only on small and object-centric areas. This localized processing enables efficient regression training, reduces unnecessary computations on background points, and enhances the precision of 3D bounding box predictions.
Single-Shot Detection Methods
Single-shot detection methods bypass the need for region proposals and directly predict object categories and 3D bounding boxes from input data using a single-stage neural network.
(i) BEV-based methods
BEV-based methods transform 3D point cloud data into organized BEV formats, in this way to enable effective processing with CNN. Yang et al. (2018) [57] proposed PIXOR, a real-time single-stage 3D object detection framework, which is designed to balance accuracy and computational efficiency. Different from traditional methods which rely on computationally expensive region proposal networks (RPNs) or multi-view fusion, PIXOR directly operates on BEV LiDAR projections, which can eliminate the need for multiple processing stages. The network architecture consists of a FCN that outputs dense, pixel-wise predictions for oriented 3D bounding boxes. By optimizing feature extraction, network efficiency, and loss function design, PIXOR outperforms contemporary leading models in terms of both precision and processing speed, reaching more than 28 frames per second (FPS) on the KITTI benchmark. However, its reliance on BEV representations leads to height information loss, limiting detection performance for objects with vertical variations.
Beltran et al. (2018) [58] introduced BirdNet, a 3D object detection framework that leverages LiDAR point cloud data to enhance object recognition. The approach encodes LiDAR data into BEV representation, which can preserve spatial details and enable efficient 2D convolutional processing at the same time. The framework comprises three stages: LiDAR data are transformed into an innovative cell-based encoding to produce a BEV representation, while a CNN is employed to estimate object positions and orientations; and a post-processing phase refines 3D oriented bounding boxes. By minimizing information loss during projection, BirdNet attains leading performance metrics on the KITTI benchmark. The model demonstrates multi-device generalizability and enables deployment across various LiDAR sensors. However, its reliance on BEV encoding imposes some limitations in accurately capturing height variations, making it less optimal for highly cluttered environments.
(ii) Discretization-based methods
Discretization-based approaches transform point cloud data into a uniform and discrete format, after which CNNs are used to classify objects and estimate their 3D bounding boxes. Zhou and Tuzel (2017) [47] proposed VoxelNet, a 3D object detection framework based on deep learning that removes the necessity for manually engineered feature extraction from LiDAR point cloud data. VoxelNet first divides the point cloud into 3D voxels and applies a Voxel Feature Encoding (VFE) layer, which transforms point features into descriptive representations. The resulting voxel feature representations are subsequently passed through a 3D convolutional backbone and then into a Region Proposal Network (RPN), which produces oriented 3D bounding boxes. However, due to its dense voxel representation, VoxelNet suffers from substantial computational demands, in this way to hinder its feasibility for real-time implementation.
To improve efficiency, Yan et al. (2018) [59] introduced Sparsely Embedded Convolutional Detection (SECOND), a 3D object detection framework that improves LiDAR-based object recognition by enhancing convolutional efficiency. Distinct from previous voxel-based approaches which suffer from high computational costs, SECOND introduces sparse 3D convolutional networks to process LiDAR point clouds efficiently. The method consists of three components: a voxelwise feature extractor, a sparse convolutional middle layer, and a Region Proposal Network (RPN). Furthermore, the method integrates an innovative angle loss regression strategy designed to enhance the accuracy of orientation estimation, and a ground-truth database-based data augmentation strategy which can enhance both convergence speed and final accuracy. However, reliance on SECOND on voxelization introduces quantization errors, which may slightly reduce spatial precision.
(iii) Point-based methods
Point-based approaches process raw point cloud data directly, avoiding transformation into structured representations. These methods employ deep learning architectures, such as PointNet++, to derive informative features at the individual point level.
Yang et al. (2020) [49] introduced 3DSSD, a single-stage, point-based framework for 3D object detection that eliminates upsampling and refinement to enhance efficiency and real-time performance. Distinct from two-stage methods such as PointRCNN which rely on feature propagation (FP) layers, 3DSSD directly performs object detection on downsampled representative points which can reduce computational overhead. The approach implements a hybrid sampling strategy that integrates distance-based farthest point sampling (D-FPS) with feature-based farthest point sampling (F-FPS) to retain essential object points while discarding redundant background points. In addition, 3DSSD uses an anchor-free regression module combined with a 3D center-ness assignment scheme, which improves bounding box prediction accuracy. The model attains leading performance benchmarks on both the KITTI and nuScenes datasets, with over 25 FPS inference speeds, making it twice as fast as previous point-based detectors. However, the removal of feature propagation layers can lead to reduced accuracy in detecting smaller or partially occluded objects.
Qi et al. (2019) [45] introduced VoteNet, a novel 3D object detection framework that directly processes raw point clouds without relying on 2D image-based proposals or voxelization. Inspired by the Hough voting process, VoteNet predicts 3D bounding boxes by initially producing votes derived from seed points within the input point cloud. These votes are then aggregated to form clusters, which are used for box proposals and classification. The backbone architecture is built upon PointNet++, enabling effective point-wise feature learning. In contrast to earlier approaches that transform point clouds into 2D projections or voxelized representations, VoteNet preserves the geometric integrity of the data and delivers leading performance on the ScanNet and SUN RGB-D benchmarks. However, the reliance on Hough voting leads to increased complexity in the inference process and makes it computationally more demanding than some alternative methods.

3.3.3. Decision-Making Flowchart to Select AI Used in PRA/PDA-Related Object Detection

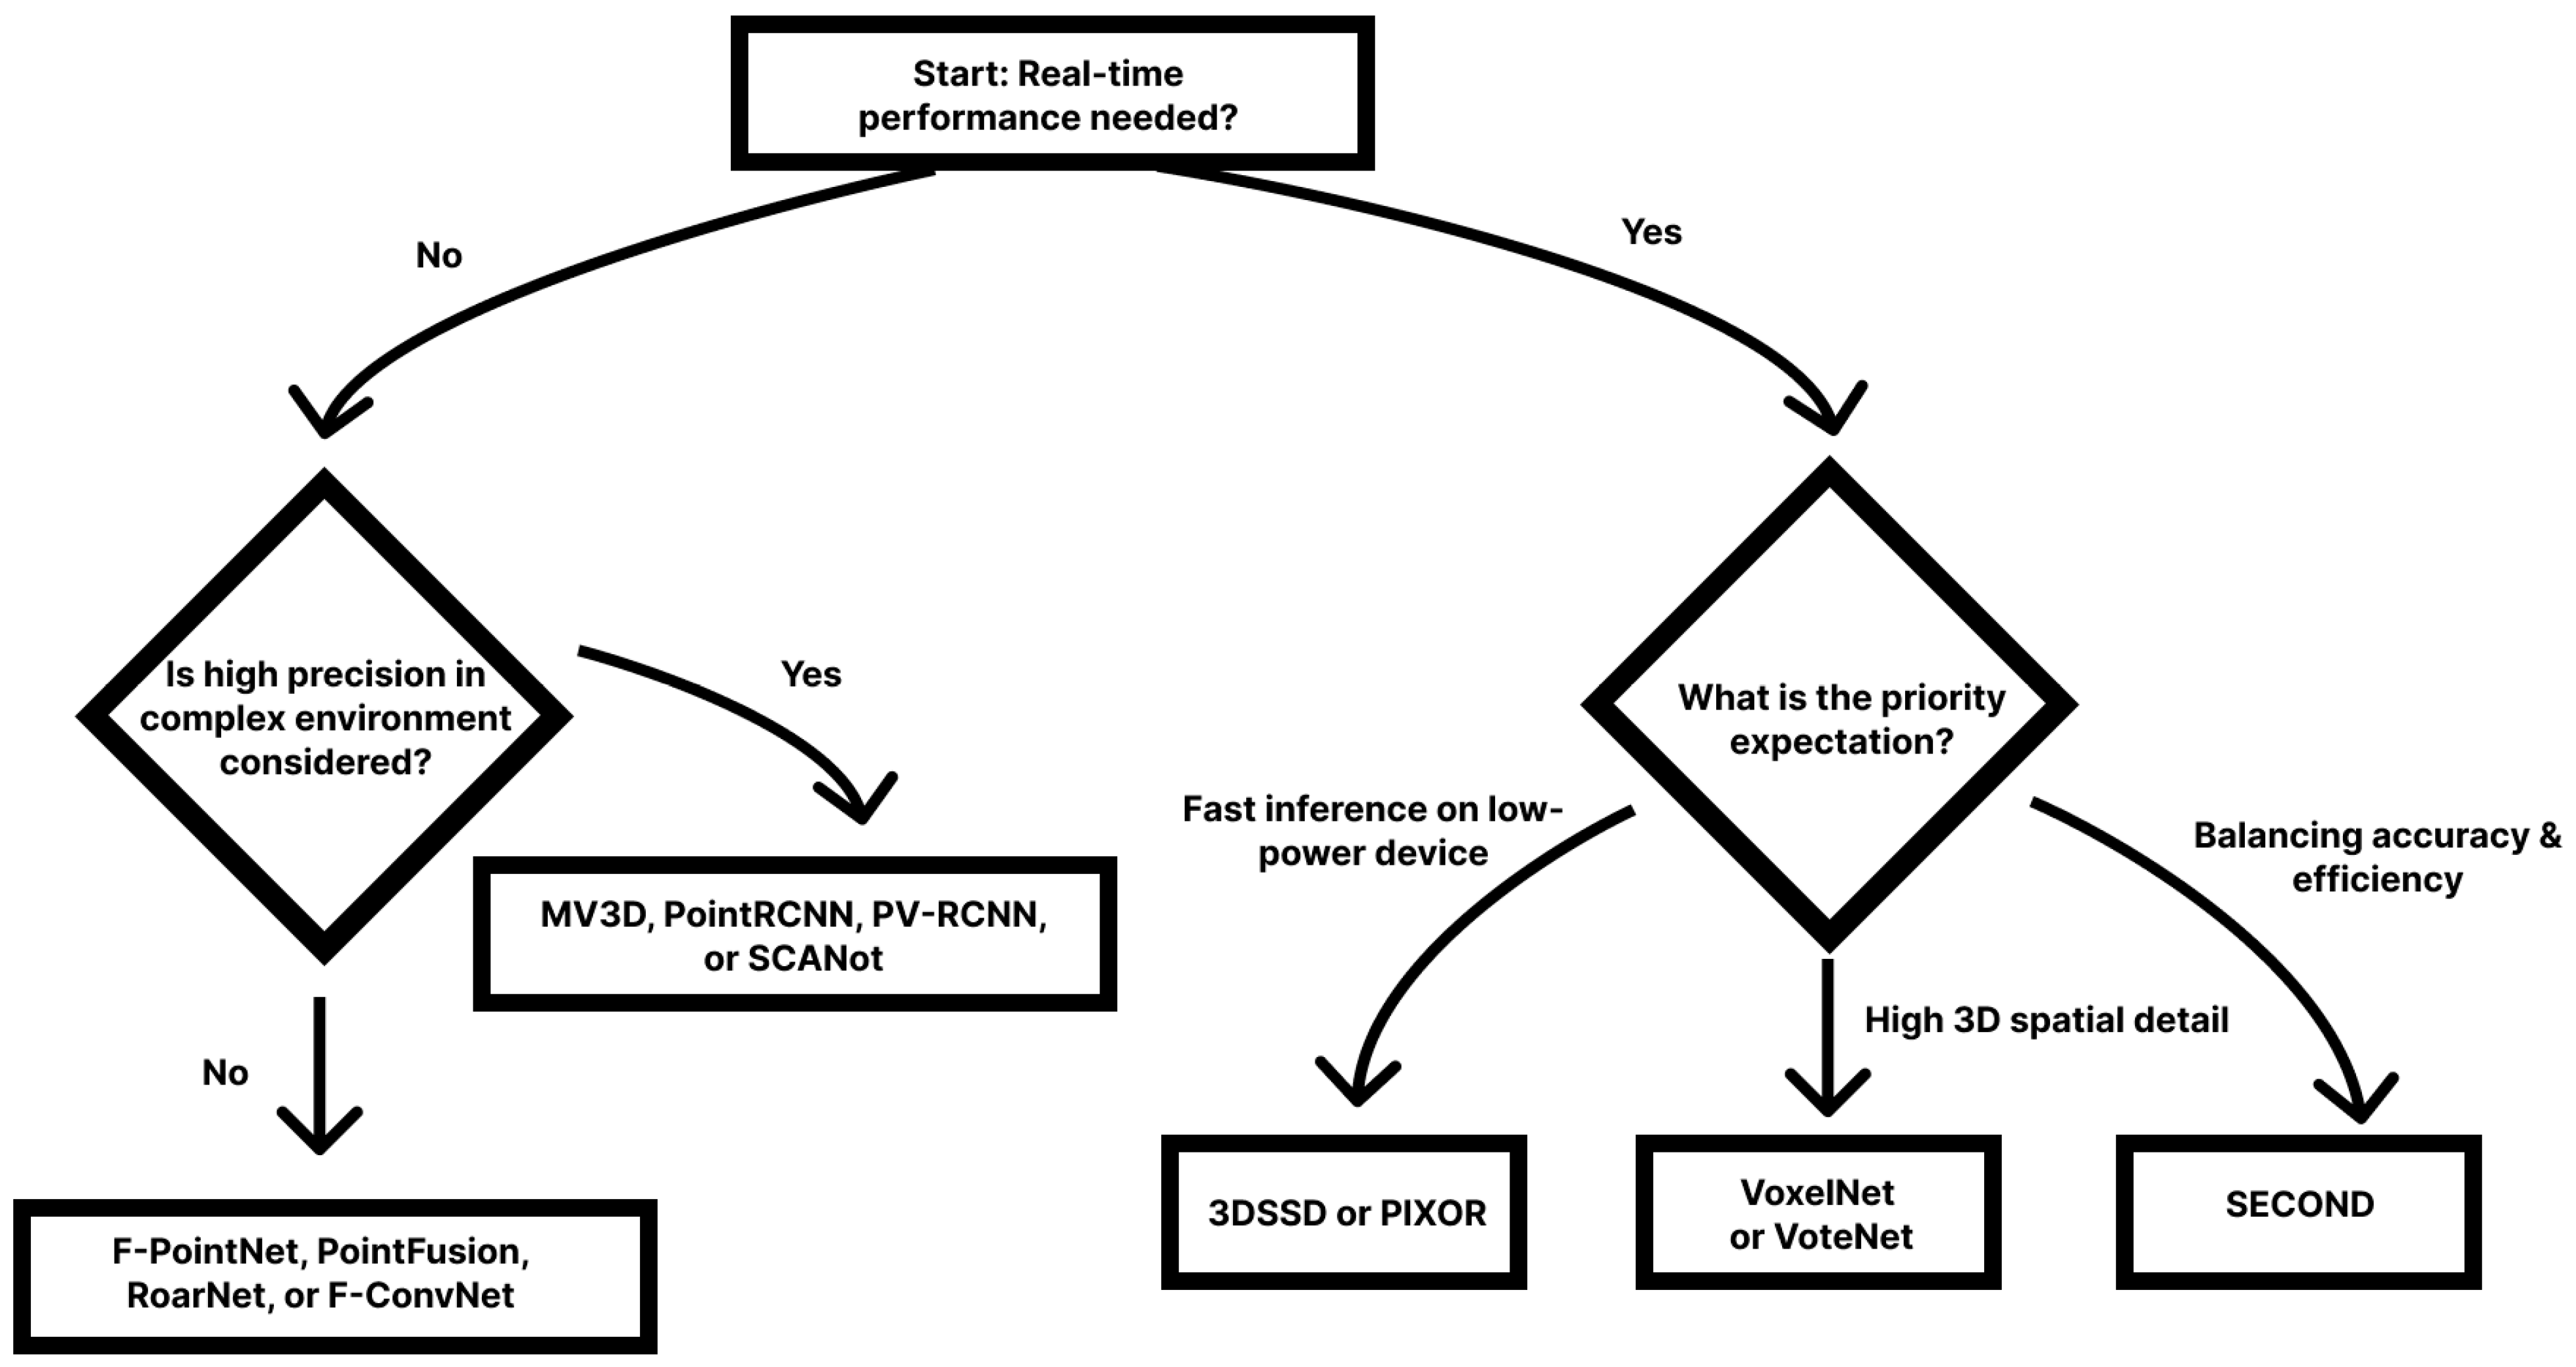
The decision-making flowchart (Figure 7) illustrates a structured approach to selecting appropriate AI methodologies for PRA/PDA-related object detection. The decision is made based on task-specific priorities such as real-time performance and environmental complexity. The process begins by evaluating whether real-time performance is required. If not, the decision turns to whether high precision in complex environments is considered. When high precision is prioritized, MV3D, PointRCNN, PV-RCNN, or SCANet are recommended. If precision is less critical, F-PointNet, PointFusion, RoarNet, or F-ConvNet are more suitable. In contrast, if real-time performance is a requirement, the flowchart considers the primary expectation—whether it’s fast inference on low-power devices, high 3D spatial detail, or a balance between accuracy and efficiency. For low-power deployment, 3DSSD or PIXOR are ideal. VoxelNet or VoteNet are suggested for capturing detailed 3D structures, while SECOND offers an optimized trade-off between performance and precision. This framework enables effective alignment between model capabilities and PRA/PDA needs.

3.3.4. Object Detection Summary

The integration of AI in object PRA/PDA-related detection enables the automated identification and classification of indoor structural and non-structural elements. Based on the review, no specific AI approach has been applied in PRA/PDA-related object detection. This study, thus, discussed AI technologies which have display a potential to be used specifically in PRA/PDA-related object detection. These AI technologies are justified as a potential because they are all able to deal with 3D point-cloud and 2D image data which is the core input data form in PRA/PDA.
Through this discussion, we have explored object detection AI technologies based on primary input data, detection methodology, algorithmic approaches, and feature extraction processes. Some AI technologies have been experimentally tested to be able to detect indoor objects which further supported the potential of achieving using AI in PRA/PDA-related object detection [43,44,53]. Modern deep learning-based approaches, particularly those utilizing point cloud processing and CNN architectures, have significantly enhanced object detection capabilities within indoor spaces. However, challenges remain exist, such as computational overhead, real-time processing efficiency, and adaptability to complex indoor layouts.
Future studies can leverage these insights to strategically select and implement the most appropriate object detection technologies, aligning with the objectives of precision-driven, scalable, and legally compliant audit solutions. Future research and development efforts may also further refine these models by incorporating multi-modal data fusion, self-supervised learning techniques, and enhanced real-time processing capabilities to address existing limitations.

3.4. AI for PRA/PDA-Related Material Detection

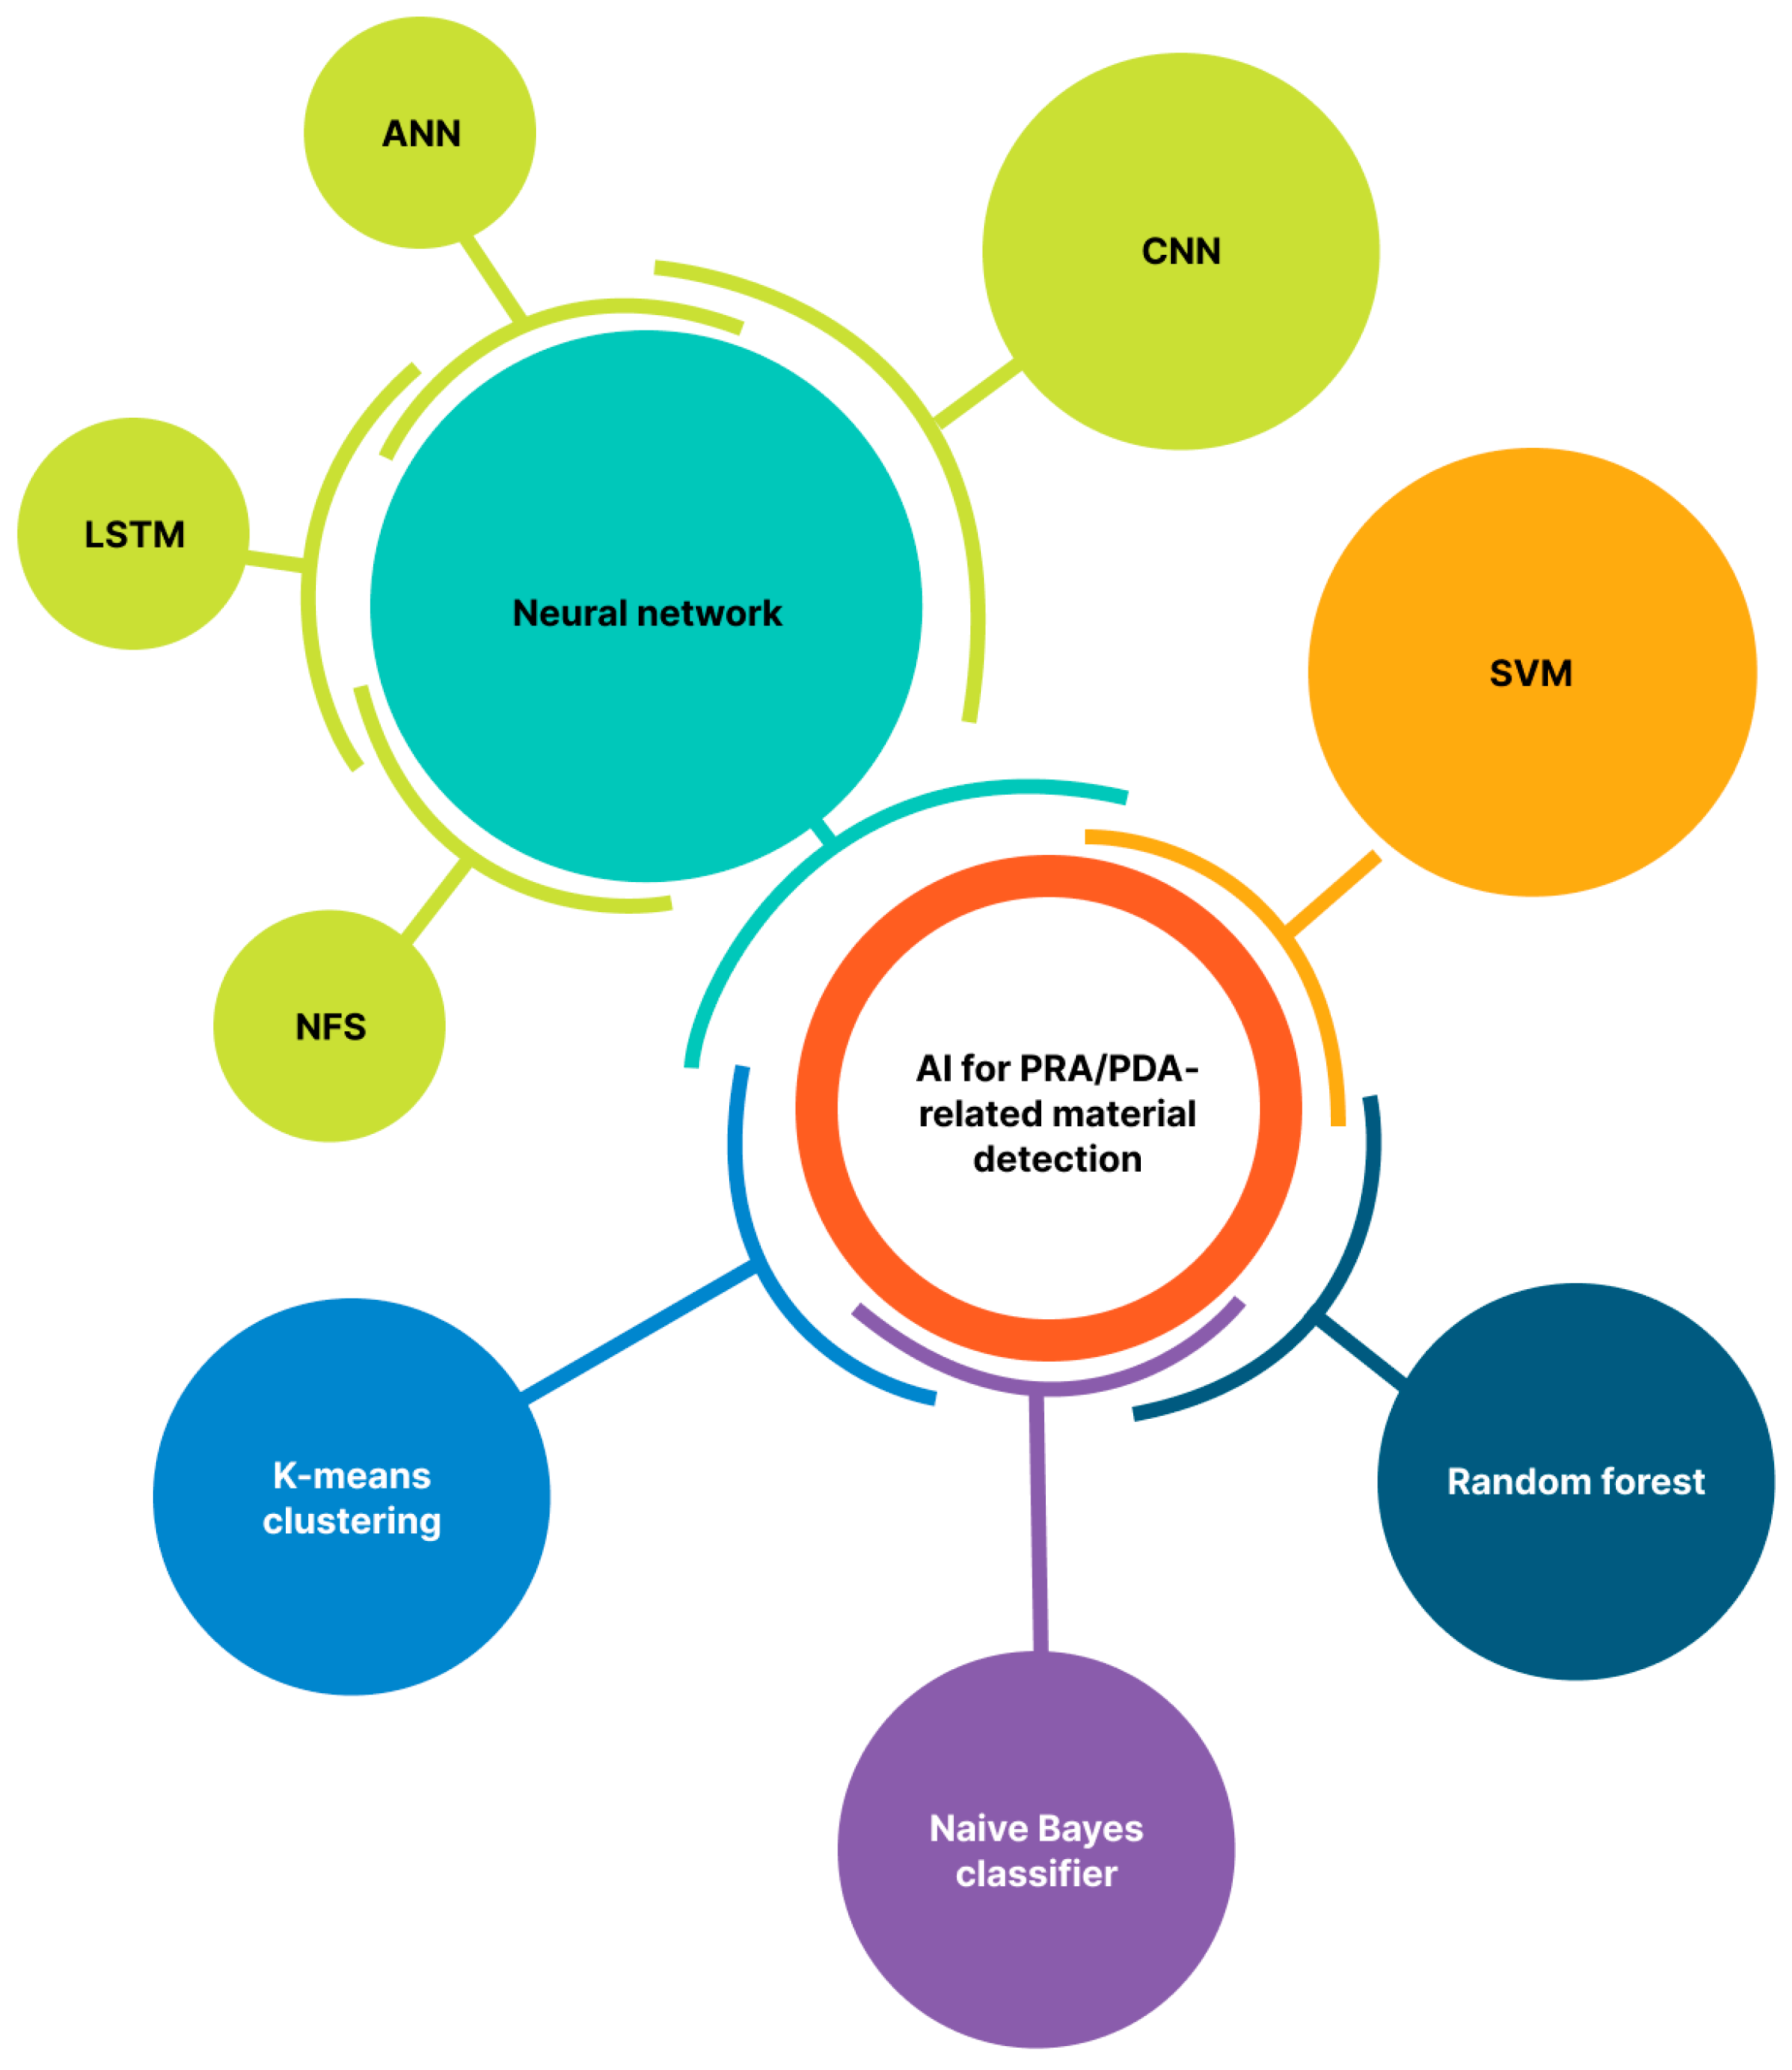
In this review, we reviewed the major efforts in PRA/PDA-related AI material detection. Distinct from object detection, 19 papers have been found in PRA/PDA-related AI material detection. Therefore, in the discussion section, we reviewed these papers and analysed the content in detailed based on the input data types, features that used for material detection, and the applicable algorithm. The results of the review have been summarized in Appendix E.

3.4.1. Input Data Types of Material Detection

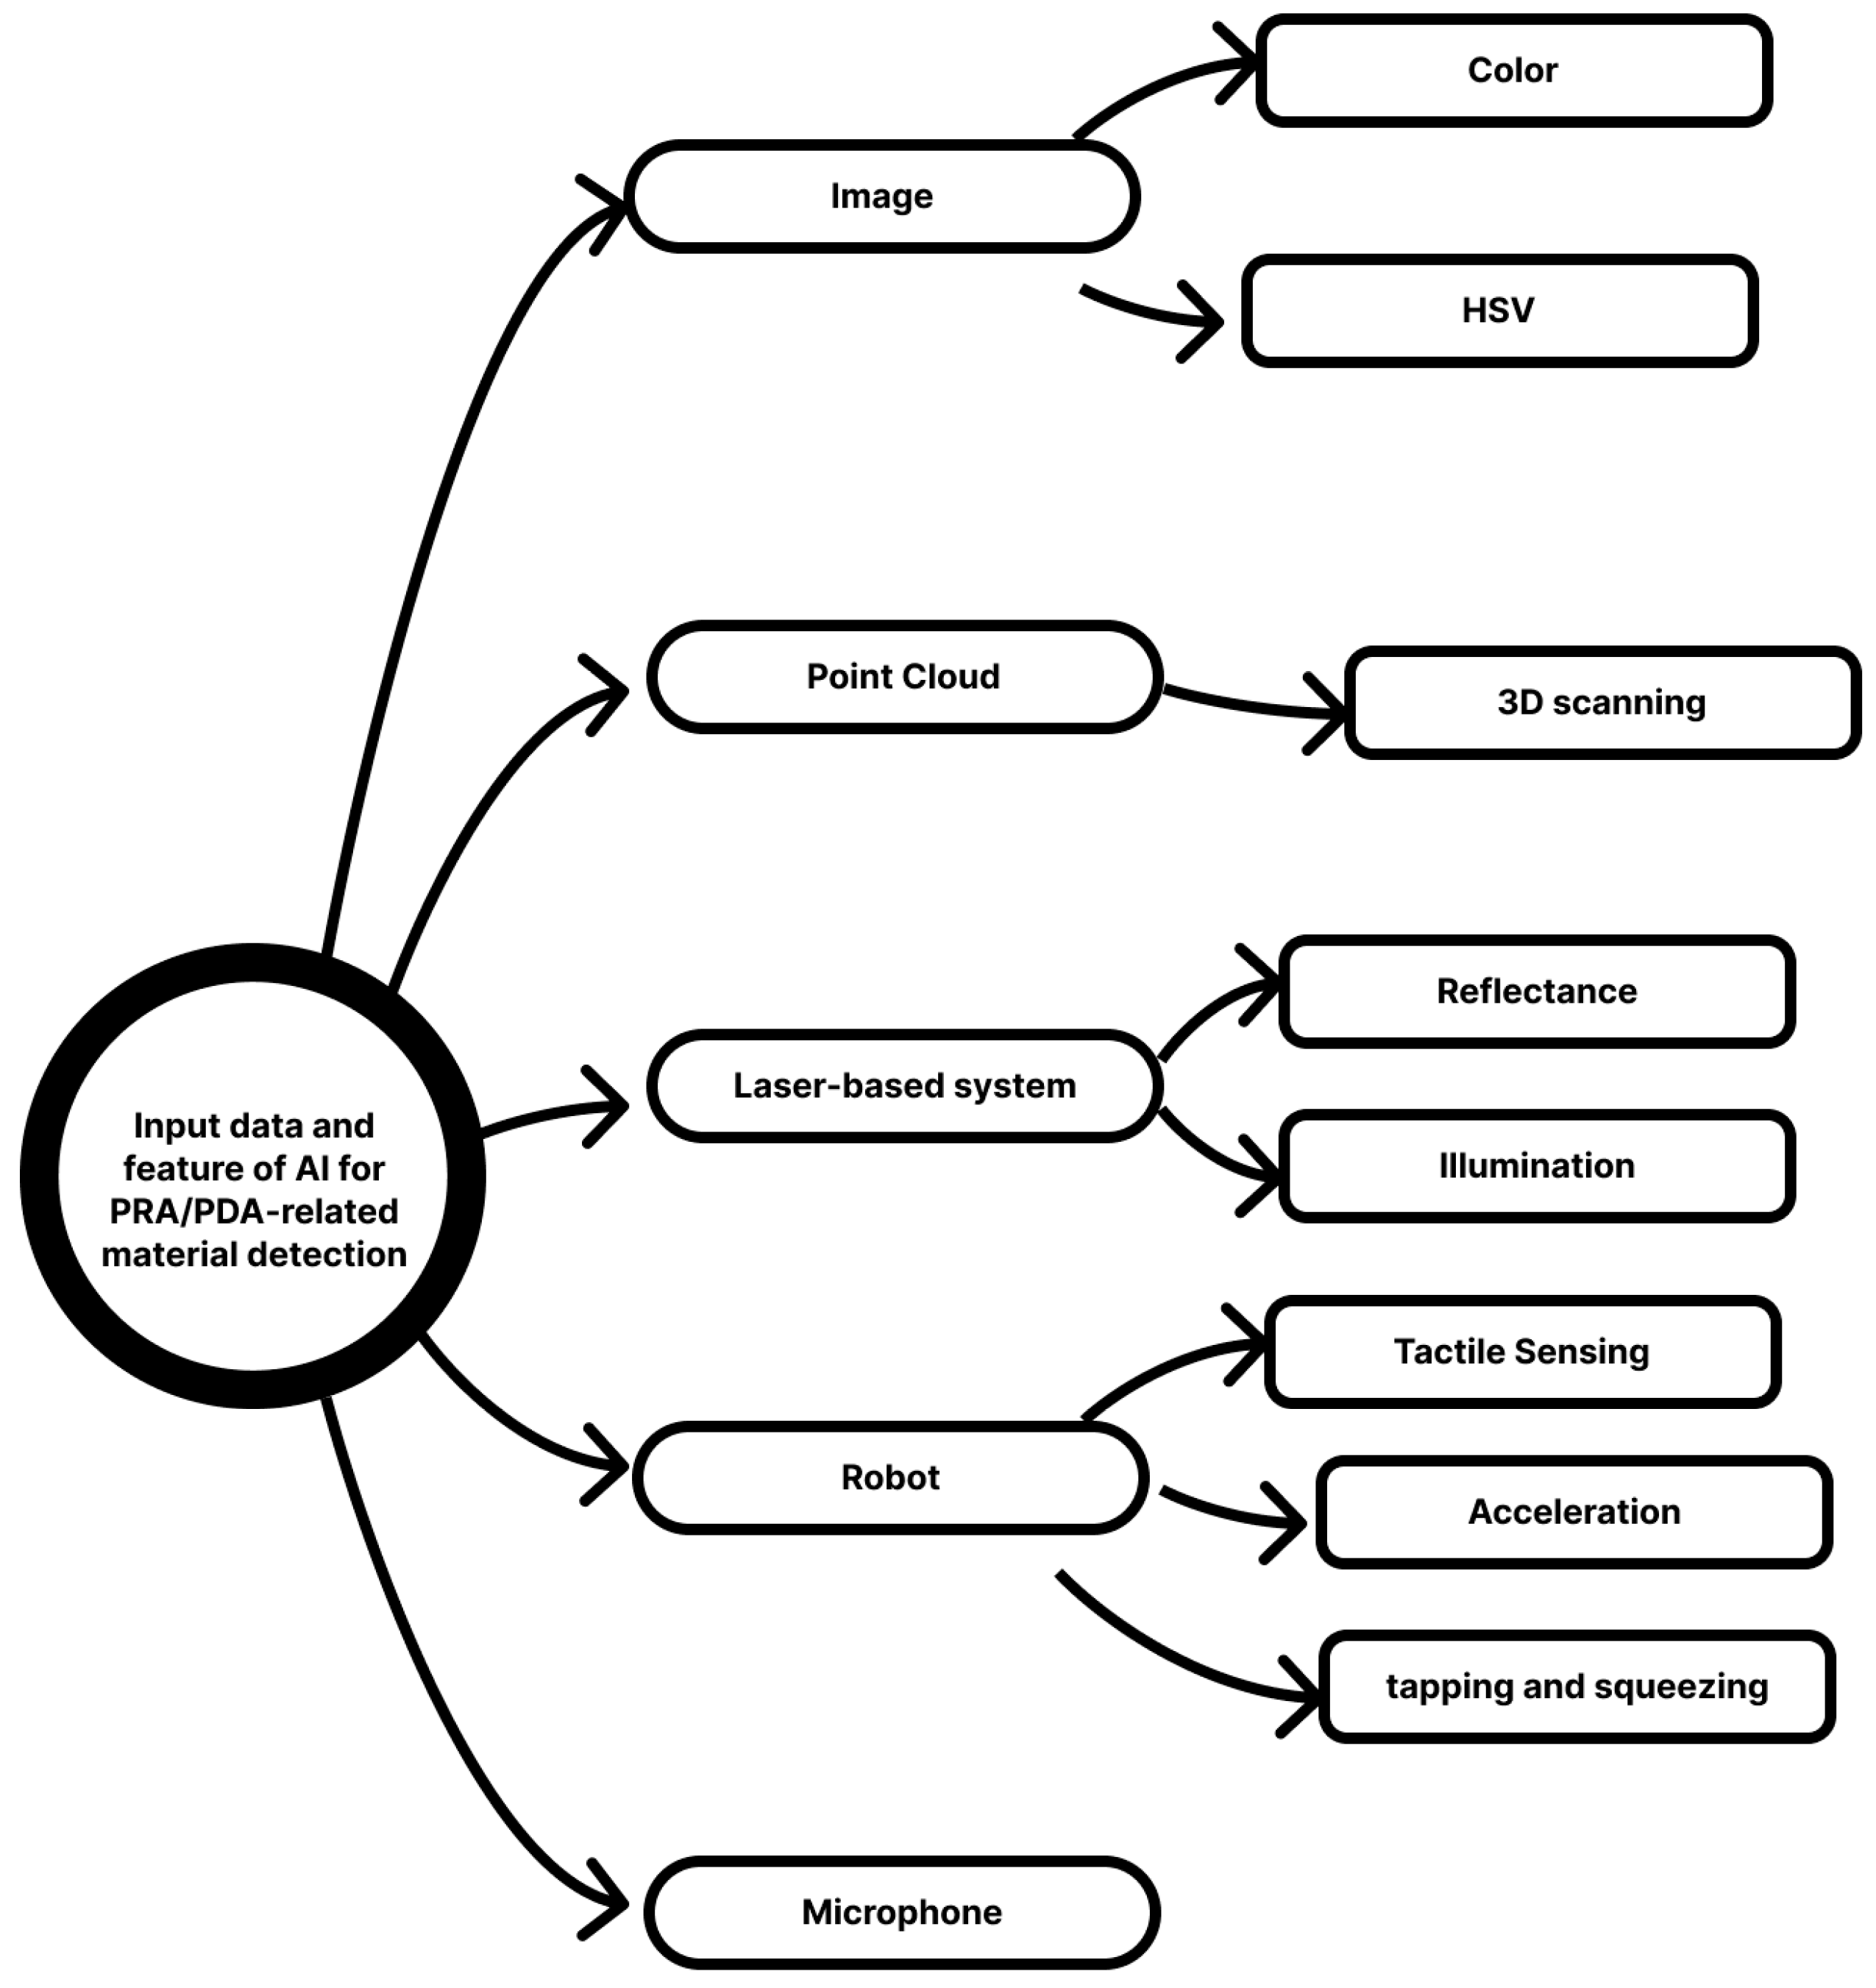
A summary of input data types of material detection is shown in Figure 8.
Image and Camera
A digital image is a finite number of discrete values, commonly referred to as picture elements or pixels. Although the format of digital images can be divided into raster and vector, in construction, the images are taken from real estimates and all the images are raster-based photos. A digital raster image is organized into a fixed grid of rows and columns composed of pixels. Each pixel represents the smallest discrete unit of the image and stores quantized values that correspond to the intensity of a specific color at a particular location.
Images have been considered as a commonly used data type which can be used for material detection. The images are mainly collected from a camera and in a digital photo format. These images include the features which can be learnt by computer models, such as RGB color model which includes the color value of Red, Green, and Blue, Hue-Saturation-Value (HSV; hue, saturation, and value of color), edge of different materials, texture, roughness, illumination, and reflectance and associated local geometric and photometric properties. For example, Dimitrov and Golparvar-Fard (2014) [60] identified 20 different types of materials using color information obtained through a camera.
However, similar to the image that can be used in object detection, the quality of the image can be affected by the image resolution which depends on the quality of data collection technology. The lighting condition will also affect the image quality [25,58,59,60,61,62]. For example, the color of the material will be different between white and green light scenarios. In addition, objects made from different materials can appear identical in terms of their RGB image.
One strategy for overcoming the difficulties associated with vision-based material classification involves leveraging the optical characteristics of materials, including surface reflection, subsurface scattering, and diffuse reflection. Erickson et al. (2019) [63] used a robotic platform and a spectrometer to classify five different materials based on these properties. However, spectrometer-based analyses necessitate close-range positioning relative to the target material, and the devices are often expensive.
Point Cloud
Point clouds provide a precise and high-resolution 3D representation of a scanned environment or object. In a point cloud, each point stores multiple attributes, including spatial coordinates (X, Y, Z) and additional measurements such as color and luminance. These datasets are typically generated through 3D scanning technologies, including LiDAR and structured light systems. LiDAR operates by emitting laser pulses into the environment and recording the time required for each pulse to return after reflecting off a surface. The resulting measurements are assembled into a point cloud that offers a precise digital representation of the scanned structures and surfaces. Such high-fidelity 3D models provide an accurate depiction of a building’s existing layout and condition, which is particularly valuable for applications such as material identification and classification.
For material detection, point cloud technology enables the acquisition of extensive and intricate spatial data in a single scan, producing a precise and richly detailed three-dimensional representation of the environment to support both visualization and analytical tasks. In contrast to conventional measurement approaches, point cloud acquisition can reduce project time and costs by eliminating the need for manual measurements. Non-contact scanning methods, such as LiDAR, further enhance efficiency by capturing data without physically interacting with objects and by enabling the collection of measurements from areas that are difficult or unsafe to access. However, sparse data, noise, and artifacts can all lead to inaccurate reconstructions. In addition, point cloud resolution relies highly on sensor resolution, object distance, and sampling density.
Laser-Based Systems
Laser-based material classification leverages unique properties such as thermal conductivity, diffusion, and effusion to distinguish different materials. This approach involves directing laser beams at the target material and analyzing the temperature changes observed in response. Different from conventional imaging methods, laser-based classification remains unaffected by external lighting conditions, providing a robust alternative for material detection [64].
In a laser detection system, non-modulated laser beams continuously illuminate the material surface while sensors capture reflected signals. To develop predictive classification capabilities, these signals undergo supervised training using deep learning networks, such as Long Short-Term Memory (LSTM) models. The intensity of the reflected signal varies based on surface roughness, micro-texture, and material composition, allowing differentiation between materials.
Laser-based classification exhibits versatility across various applications, including terrestrial laser scanning (TLS) for large-scale material assessment. TLS technology integrates point cloud imaging with reflection data analysis, facilitating high-resolution non-contact material detection. However, challenges remain in handling varying reflection intensities and optimizing computational efficiency in real-world conditions.
Robot
Robots achieve multimodal interaction with the environment and increase the possibility of material detection. The core advantage of robots is that robots equipped with advanced sensors can detect and classify materials with high precision. Such robots can detect and classify materials based on tactile, visual, and auditory data, simulating human sensory capabilities. Tactile sensors simulate the human sense of touch and play a key role in robotic material detection. These sensors detect various properties such as texture, hardness, roughness, and friction [64,65]. In addition, when a robotic tool interacts with a surface, the interaction generates acceleration signals that provide information about the surface’s texture [66]. These signals can be analyzed to extract features such as the fundamental frequency or spectral energy bins. Robots can then classify materials based on these signals.
Soft robots have gained significant attention due to their highly deformable, flexible nature, which closely mimics the characteristics of living organisms. Soft materials are generally defined based on their interaction with the environment and if they are able to deform plastically or elastically to the same or greater extent than their surroundings under similar forces. A soft robot’s design and actuation allow it to alter its surface profile and curvature to adapt to different terrains, which is important for effective locomotion [67].
However, the acquisition and implementation of robotic systems can be expensive. High costs for purchasing robots, sensors, and the necessary software can be a barrier for smaller companies with limited budgets [63]. Also, introducing robots into construction sites requires workers to undergo specialized training to operate and maintain the machines. This can lead to additional costs and time investment to upskill the workforce [67]. In addition, robots require regular maintenance and can experience technical failures, which can lead to downtime [67]. If a problem happens, the project could face delays, increasing costs and reducing overall efficiency. Over-reliance on robotic systems for material detection can also create vulnerabilities [64]. For example, system failures, software bugs, or cyber-attacks could disrupt operations and lead to costly delays or mistakes in material identification. Although robots are highly efficient in repetitive and controlled tasks, they may struggle in environments that require adaptability or creativity. Unforeseen material changes or irregular site conditions might require human intervention to solve complex problems [64].
Microphone
Microphones rely on physical interaction, such as tapping, scratching, or vibration, to generate sound waves from the material. Using microphones for material detection in construction is an approach that leverages sound and vibration analysis to identify materials and assess their properties [67,68]. Also, the microphone is always used together with some other input methods such as robot, image, camera, and point cloud.
Microphone-based techniques can be employed across diverse material types, such as concrete, wood, metal, and composite materials. This versatility allows for more comprehensive material detection. However, microphone is sensitive to environments. Environmental noises can interfere with the accuracy of microphone-based detection systems, making it challenging to isolate material-related sounds. Advanced filtering techniques or soundproofing measures may be required. In addition, microphones may struggle to differentiate between materials with similar acoustic properties, such as two types of metals or composite materials that have overlapping sound signatures. In such cases, additional sensors or more sophisticated algorithms may be needed to classify materials accurately. To make things worse, microphones rely on physical interaction. This requires that the material be accessible and actively engaged during the detection process, which may not be feasible in all situations, such as for the ceiling.

3.4.2. Features for Material Detection

Color
Color is widely regarded as an effective attribute for detecting materials from their surface color. Color is not related to the position and shape of the material and thus more easily to be recognized in material detection compared to alternative features, such as texture, particularly in visually complex environments [64]. In addition, color values are calculated based on the pixel of an image. This makes material detection more robust and makes the detection in a high computationally efficient.
Abeid et al. (2002) [69] proposed a method to detect edges and color to identify materials in images. The RGB detected from images is compared with predetermined RGB values, and thus, the materials can be identified. Son et al. (2014) [65] proposed an automated material detection method that can capture both color information and three-dimensional data obtained through a stereo vision system (3D-point cloud). These methods derive 3D coordinate information corresponding to the color features of each material. Similar principles on how to link color with material are also applied to the methods promoted by Han and Golparvar-Fard (2015) [70]. Yuan et al. (2020) [71] promoted a method that can detect material reflectance, Hue-Saturation-Value (HSV) color values, and surface roughness from a terrestrial laser scanner (TLS) with a built-in camera. Considering the development of artificial neural networks (ANNs), Zhu et al. (2010) [72] used ANNs to identify concrete regions within construction site images by analyzing the color and texture characteristics of materials. Initially, the images were segmented into distinct regions based on color, after which the color and texture attributes of each segment were computed and classified using a pre-trained ANN classifier.
Hue-Saturation-Value (HSV) Color Model
Hue-Saturation-Value (HSV) is a color model that represents colors in a cylindrical coordinate system, which is often used in image processing, computer graphics, and color analysis. It provides a more intuitive way to describe and manipulate colors than the traditional RGB model. Hue (H) represents the color type and is defined by its position on the color wheel. Hue is measured in degrees (0° to 360°), where each angle corresponds to a specific color. Saturation (S) defines the vividness or purity of a color, indicating the extent to which it is diluted with gray; its scale spans from 0% (completely desaturated) to 100% (fully saturated). Value (V) denotes the perceived brightness or lightness of a color, reflecting its relative position between complete darkness and full illumination, and is likewise measured on a scale from 0% to 100%.
HSV is always used together with other visual features. Dimitrov and Golparvar-Fard (2014) [60] proposed an image-based material recognition algorithm based on the statistical distribution of filter responses over images. Their method classifies 20 major construction material types—Asphalt, Brick, Cement-Granular, Cement-Smooth, Concrete-Cast, Concrete-Precast, Foliage, Form Work, Grass, Gravel, Marble, Metal-Grills, Paving, Soil-Compact, Soil-Vegetation, Soil-Loose, Soil-Mulch, Stone-Granular, Stone-Limestone, and Wood—by analyzing primitives such as edges, spots, waves, and Hue-Saturation-Value (HSV) color values. The algorithm consists of two stages: learning and classification. The incorporation of HSV color values enhances robustness to brightness variations, which are common in construction imagery. This approach achieves an accuracy of 97.1% for high-quality 200 × 200 pixel color images and above 90% for images as small as 30 × 30 pixels. The method maintains an accuracy above 92%, even for highly compressed, low-quality images.
Reflectance (Surface Roughness)
Materials with smooth surfaces tend to produce specular reflections, while rough or textured surfaces produce diffuse reflections. By analyzing the reflected light pattern, AI can infer the material’s surface texture. Each material also has a specific reflectance coefficient, which measures how much light it reflects. This coefficient can vary based on the material’s color, texture, and finish. Higher reflectance values indicate more reflective surfaces, while lower values indicate less reflective surfaces.
Han et al. (2024) proposed an extended multispectral LiDAR to a polarimetric multispectral configuration, incorporating unpolarized and linearly polarized reflectance spectra as supplementary features for material and surface roughness classification [73]. The study analyzed and interpreted spectral data acquired at two different resolutions (10 nm and 40 nm) from test specimens representing five distinct materials, each prepared with two surface roughness levels. Employing a linear SVM, the study evaluated the discriminative capability of these spectral features, demonstrating their potential for accurate classification of both material composition and surface texture.
Lee et al. (2016) introduced an efficient method for estimating surface roughness using a single time-of-flight (ToF) camera [74]. Material classification was performed using features derived from the estimated roughness in combination with conventional color descriptors. Testing on a dataset containing fabric, plastic, wood, paper, leather, metal, and fur revealed strong recognition performance, with the highest accuracy (99.50%) achieved for distinguishing plastic from fur. In contrast, plastic and leather exhibited a lower recognition rate (66.0%) due to the similarity of their reflective surface characteristics.
Illumination Effects
Bidirectional Reflectance Distribution Function (BRDF) is a concept in radiometry and optics that describes how light is reflected off a surface. It provides a comprehensive way to characterize the reflective properties of materials by specifying how light is distributed in various directions after striking a surface.
Liu and Gu (2014) [26] introduced a coded illumination approach for directly deriving discriminative features to support material classification. This technique involves learning optimal illumination patterns, termed discriminative illumination, from training datasets so that, when projected, the spectral reflectance differences among materials are maximized. The method captures surface reflection characteristics by integrating incident light. While a single discriminative illumination proved effective for linear, binary classification, results indicated that employing multiple discriminative illuminations yields superior performance for nonlinear and multi-class classification involving materials such as metals, plastics, fabrics, ceramics, and wood. To implement the approach, the researchers developed an LED-based multispectral dome and applied it to classify raw materials, including multiple metal types (aluminum alloy, steel, stainless steel, brass, and copper), along with plastics, ceramics, fabrics, and wood. Experimental results demonstrated a classification accuracy of 93–96%, underscoring the robustness and efficacy of the method.
Features from Physical Robots
Material differentiation can be achieved through analysis of surface texture employing a biomimetic artificial finger embedded with randomly arranged strain gauges and polyvinylidene fluoride (PVDF) films within a silicone matrix. During slippage, friction data and different frequency components in the sensor signal can be captured and analyzed to differentiate materials. Machine learning models, including naive Bayes, decision tree, and naive Bayes tree classifiers, have been trained to categorize surface textures captured by the artificial finger sensor. By preprocessing sensor data and extracting Fourier coefficients, these classifiers effectively distinguish various textures such as carpet, vinyl flooring, tiles, sponge, wood, and polyvinyl chloride (PVC) woven mesh with high accuracy [68].
One key feature of friction is acceleration, a technique that has been extensively applied in robotic texture recognition. For instance, Jamali and Sammut (2011) [75] introduced a biomimetic sensor modeled after a human finger and equipped it installed on an industrial robotic platform to analyze surface textures and capture acceleration data for subsequent material classification. Their approach achieved 95% accuracy, utilizing a feature vector constructed based on the five most prominent peaks within the spectral envelope. However, texture signals are highly dependent on applied force and scanning velocity. To mitigate this variability, the robot followed predefined trajectories, ensuring that data was collected constantly for training and classification. Romano and Kuchenbecker (2014) [76] expanded upon this approach by incorporating applied force and scan velocity as additional classification features, alongside the energy of 30 spectral bins. Using a multi-class support vector machine (SVM) on a dataset comprising 15 distinct textures, the system achieved an accuracy of 72% from a single exploration. In a related study, Oddo et al. (2011) [77] employed the fundamental frequency of the acceleration signal as a discriminative feature for texture analysis. Their research examined sinusoidal grating profiles, where the fundamental frequency was anticipated to exhibit a linear relationship with scanning velocity, thereby supporting surface classification. Nonetheless, the approach required precise regulation of both applied force and scanning velocity to maintain measurement consistency. Yu et al. (2022, 2023) applied reservoir computing in the identification of surfaces [64,76].
Jamali and Sammut (2011) [75] employed frequency-domain analysis to identify 20 distinct surface types, including floor mats, soft cloth, corduroy, leather, cotton, wool, and paper. Each surface was examined by scratching it with an artificial fingernail equipped with a three-axis accelerometer. The acceleration magnitude signals were transformed into the frequency domain using a short-term Fourier transform (STFT), producing 25 frequency bands distributed across five fixed time intervals. This frequency–time representation was then used as input to a SVM classifier for distinguishing between materials. Using tenfold cross-validation, the classifier achieved an average accuracy of 58.3%. When multiple scratch behaviors were combined for classification, the accuracy improved significantly to 80%.
Beyond frequency-based analysis from acceleration signals, the interaction between a tooltip and a surface can generate audible sound waves. These audio features are often combined with other physical interaction features to improve material classification accuracy. Strese et al. (2017) [78] proposed a multimodal feature-based material classification approach, integrating acceleration, friction force, sound signals, and surface images from 69 different materials, including meshes, stones, glossy surfaces, wooden surfaces, rubbers, fibers, foams, foils/papers, and fabrics/textiles. In this classification system, acceleration features (hardness, microscopic roughness, and macroscopic roughness), sound features (hardness, spectral low-high ratio, spectral roll-off frequency, spectral harmonics, and spectral spread), and image features (coarseness, edginess, glossiness, line-likeness, roughness, and dominant color distance) were captured. By combining acceleration, sound, friction, and image-based features into a Naive Bayes classifier, their system achieved an overall classification accuracy of 74%.
Takamuku et al. (2007) [79] investigated the use of exploratory actions, namely tapping and squeezing, by a robotic system to evaluate material characteristics, with a focus on assessing compliance. The experiment included various objects, such as paper, bubble wrap, LEGO pieces, a card, tissue, cloth, and a breadboard. In the squeezing procedure, the material was placed on the robot’s palm. The ring finger was commanded to fully close, in this way to compress the material between the palm and the ring finger. The average strain gauge values were recorded during compression. In the tapping procedure, the material was positioned on the palm, and the middle finger executed a tapping motion to induce vibrations within the material. The PVDF sensor values were captured during vibration.

3.4.3. Algorithms for Material Detection

Various computational methods, such as SVM, Naive Bayes classifiers, K-means clustering, Random Forest, and Neural Networks, have been used to differentiate materials based on their distinctive properties (Figure 9). These algorithms analyze input data from multiple sources, including images, point clouds, reflectance properties, and physical interactions, to achieve accurate classification.
Support Vector Machines (SVM)
SVM have been applied in material detection to categorize different material types according to their unique characteristics. In material detection, SVM uses features extracted from sensor data or images, such as illumination [25,69], reflectance [71], RGB [68,80], HSV color value [58,69], and surface roughness [71], to distinguish between different materials. The inputs for SVM are always visual-based inputs such as images, point clouds, or cameras.
Penumuru et al. (2020) [81] applied SVM and RGB as features to distinguish Aluminum, Copper, Medium density fiber board, and Mild steel with a 100% accuracy rate with small samples. Han and Golparvar-Fard (2015) [70] also applied SVM and RGB as features to distinguish materials. Their material includes Asphalt, Brick, Granular and Smooth Cement surfaces, Concrete, Foliage, Formwork (Gang Form and Plywood form), Gravel, Insulation, Marble, Metal, Paving, Soil (Compact, Dirt, Vegetation, Loose, and Mulch), Stone (Granular, Limestone), Waterproofing Paint, and Wood with average accuracy of 92.4%.
Dimitrov and Golparvar-Fard (2014) [60] applied SVM and edges, spots, waves, and HSV color values as features to distinguish Asphalt, Brick, Cement-Granular, Cement-Smooth, Concrete-Cast, Concrete-Precast, Foliage, Form Work, Grass, Gravel, Marble, Metal-Grills, Paving, Soil-Compact, Soil-Vegetation, Soil-Loose, Soil-Mulch, Stone-Granular, Stone-Limestone, and Wood with 97.1% accuracy level. Liu and Gu (2014) [26] applied SVM and illumination as features to distinguish Metal, Aluminum, Alloy, Steel, Stainless steel, Brass, Copper, Plastic, Ceramic, Fabric, Wood, Concrete, Mortar, Stone, Metal, Painting, and Wood. Aluminum and stainless steel plates can be classified with 51% to 61% accuracy levels, while varnished and unvarnished paints can achieve 94% to 97% accuracy levels. Yuan et al. (2020) [71] applied SVM and material reflectance, HSV color values, and surface roughness as features to distinguish Concrete, Mortar, Stone, Metal, Painting, Wood, Plaster, Pottery, and Ceramic with a 96.7% accuracy level.
Neural Networks
Neural networks, a subset of machine learning and artificial intelligence, are modeled after the interconnected neuron structures found in the human brain. They consist of multiple layers of nodes (neurons) that process input data to identify patterns and make informed decisions. Through training, these networks can learn complex relationships between inputs and outputs, making them highly effective for tasks such as image and speech recognition, natural language processing, and various forms of pattern classification. Their capacity to process diverse data types (including images, point clouds, and sensor measurements) renders them particularly suitable for material classification tasks within the construction domain. Now, ANN and CNN are mainly used in material detection in construction based on visual-based technology. LSTM is mainly used in material detection and frequency of construction-based signal data.
Neural networks function through a layered structure comprising an input layer, one or more hidden layers, and an output layer. Each artificial neuron within these layers receives input values, applies a weight to each, sums them (optionally adding a bias), and passes the result through a nonlinear activation function (such as ReLU, sigmoid, tanh). This process allows the network to model complex, non-linear relationships. Learning occurs via a process called backpropagation, where the network iteratively adjusts its weights and biases to minimize the error between predicted and actual outputs, guided by an optimization algorithm such as stochastic gradient descent. Different architectures are suited for different data types: Feedforward Neural Networks (FNNs) are effective for structured tabular data, Convolutional Neural Networks (CNNs) excel at analyzing spatial and visual data like images and floor plans, and Recurrent Neural Networks (RNNs) and their variants such as Long Short-Term Memory (LSTM) networks are well-suited for sequential data, including time-series sensor readings. In PRA/PDA contexts, these architectures enable automated classification of materials from images, recognition of floor plans, defect detection, and interpretation of sensor-based measurements, significantly reducing manual effort and increasing processing accuracy.
(i) Artificial Neural Networks (ANNs)
Artificial Neural Networks (ANNs) are computational architectures inspired by the structural organization and functional mechanisms of the human brain. They consist of multiple interconnected layers of nodes (neurons) that process information and identify patterns within data, facilitating tasks such as prediction, classification, and decision-making. ANNs form a fundamental component of both machine learning and deep learning paradigms. Zhu and Brilakis (2010) [72] compared the performance of ANN, Support vector data description (SVDD), and C-support vector classification (C-SVC) in distinguishing concrete images. The results indicated that the training accuracy of the ANN stabilized at approximately 99% when the number of neuron nodes exceeded seven, outperforming C-SVC (96.4%) and SVDD (90.4%). However, the ANN achieved average precision and recall rates of 83.3% and 79.6%, respectively—performance levels that remain below those achieved by human evaluators.
(ii) Neuro-fuzzy system (NFS)
A neuro-fuzzy system (NFS) is an integrated framework combining the strengths of fuzzy logic systems and artificial neural networks (ANNs). This hybrid methodology uses the pattern-learning capacity of ANNs while preserving the interpretability and adaptability inherent in fuzzy logic systems. By incorporating these two methodologies, NFS is particularly effective in handling uncertainty, nonlinearity, complexity, and a lack of specificity. Furthermore, NFS facilitates the optimization of fuzzy system parameters, enabling more precise and adaptable modeling of complex systems. Also, NFS has a stronger ability to incorporate expert knowledge into fuzzy linguistic rules, which can enhance robustness and interpretability.
One of the key advantages of NFS is its ability to qualitatively model and represent human knowledge without requiring precise or quantitative definitions. This capability makes NFS particularly suitable in noisy or complex environments, where conventional methods may meet challenges. In addition, NFS exhibits strong learning abilities, making it an effective tool for prediction, classification, and recognition tasks [61,82].
(iii) Convolutional Neural Networks (CNNs)
The input of CNN is visual-based input such as image [83,84] point cloud, and camera. Bell et al. (2015) [84] applied CNN to distinguish images of Brick, Carpet, Ceramic, Fabric, Foliage, Food, Glass, Hair, Leather, Metal, Mirror, Painted, Paper, Plastic, Pol, Stone, Skin, Sky, Stone, Tile, Wallpaper, Water, and Wood with an 85.2% accuracy. Erickson et al. (2020) [85] applied CNN to distinguish Ceramic, Fabric, Foam, Glass, Metal, Paper, Plastic, and Wood. The data was collected from a spectrometer and near-field camera with an 80.0% accuracy. Erickson et al. (2019) [63] applied CNN to distinguish Plastic, Fabric, Paper, Wood, and Metal. The data is collected from micro spectrometers (robots). A classification accuracy of 94.6% is achieved when the system is provided with a single spectral sample for each object.
VGG-16 is a CNN developed by Simonyan and Zisserman (2015) [86]. The architecture comprises 13 convolutional layers and three fully connected layers, employing the ReLU activation function in line with the design principles established by AlexNet. Mahami et al. (2020) [87] applied VGG16-CNN to distinguish Sandstorms, Paving, Gravel, Stone, Cement-granular, Brick, Soil, Wood, Asphalt, Clay hollow block, and Concrete block which was collected from the camera. The accuracy of this material detection was 97.35%.
ResNet-50 is a CNN that is 50 layers deep. It is part of the Residual Networks (ResNet) family, introduced by Microsoft Research. ResNet-50 is known for its ability to train deep networks effectively by mitigating the vanishing gradient issue by incorporating residual connections. Li et al. (2022) [88] applied ResNet-50 to the 3D model and point cloud data to distinguish Wood, Metal, Fabric, Marble, Ceramic, Glass, Leather, Plastic, Rubber, Granite, and Wax. The accuracy performance was 76.82%.
(iv) Long Short-Term Memory (LSTM) Networks
Long Short-Term Memory (LSTM) networks are an advanced variant of Recurrent Neural Networks (RNNs) designed to address the limitations of conventional RNNs in modeling and retaining long-term dependencies within sequential datasets. Central to each LSTM unit is a memory cell that preserves its state across time steps, enabling the retention and utilization of long-term information. This memory cell is capable of storing information for long periods. LSTMs use three types of gates to regulate the transfer of information entering and leaving the memory cell: Input Gate, Forget Gate, and Output Gate. Olgun and Türkoğlu (2022) [62] have successfully used LSTM to deal with data from laser light to distinguish Aluminum, Black fabric, Frosted glass, Glass, Pottery, Granite, Linden, Magnet, Polyethylene, and Artificial marble. It can accurately classify the materials with an average of 93.63%.
Other Algorithms
Apart from SVM and neuro network, Naive Bayes classifier, K-means clustering, and random forest also display the abilities to achieve the material detection in PRA/PDA.
The Naive Bayes classifier has been applied in material detection by leveraging its simplicity and effectiveness in handling probabilistic classification problems. Naive Bayes is based on Bayes’ theorem and works well when dealing with features that are conditionally independent, which makes it suitable for tasks like material classification based on a variety of features from physical interaction such acceleration, friction force, sound, and visual-based input such as images [69]. Strese et al. (2017) [69] applied the Naive Bayes classifier and acceleration, friction force, sound, and images as features to distinguish Meshes, Stones, Glossy Surfaces, Wooden surfaces, Rubbers, Fibers, Foams, Foils/Papers, and Fabrics/Textiles with an accuracy of 74%.
K-means clustering has been applied in material detection for various tasks where materials need to be grouped or classified based on shared features without prior knowledge of material labels. K-means is an unsupervised learning algorithm that organizes data into a predefined number of clusters based on feature similarity. In material detection, it can be particularly effective in analyzing visuals to identify different materials on construction sites. Leung and Malik (2001) [89] applied K-means clustering and used reflectance, surface normal, and associated local geometric and photometric properties to distinguish images of Felt, Rough Plastic, Sandpaper, Plaster, Rough paper, Roof Shingle, Cork, Rug, Styrofoam, Lambswook, Quarry Tile, Insulation plaster, slate, Painted spheres, Brick, Concrete, Brown bread, and Crackers with a 97% accuracy level.
Random Forest can be applied in material detection in construction due to its robust performance in both classification and regression tasks.
Random Forest is a supervised machine learning technique that constructs an ensemble of decision trees during training to improve predictive performance and robustness, producing the final output by aggregating the class predictions (for classification) or averaging the outputs (for regression) from the individual trees. In material detection, this method combines various sensor data types (such as signal data and visual data) and extracts meaningful patterns to classify or detect different materials. Although random forest can be applied to material detection tasks, its classification accuracy in this context remains suboptimal. When distinguishing images of brick, carpet, ceramic, fabric, foliage, food, hair, leather, metal, mirror, painted, paper, plastic, polished stone, skin, sky, stone, tile, wallpaper, water, wood, the random forest (84.23%) over-performed than SVM (83.65%) while it does not perform as well as VGG16-CNN (84.80%) [83].

3.4.4. Hazardous Materials Detection

In PRA/PDA contexts, misinterpretation of AI-generated results for hazardous materials (such as asbestos, lead-based paint, and PCB-containing components) can lead to safety risks, regulatory non-compliance, and costly remediation errors. To address this, several strategies can be integrated into AI-assisted frameworks such as adding human-in-the-loop verification (AI predictions for hazardous materials should be validated by certified inspectors before final decision-making); increase confidence thresholding (implementing high-confidence thresholds for positive hazardous material detection results, with uncertain classifications flagged for manual review); introducing multi-modal cross-checking (combining visual detection with supporting data sources (such as historical building records, material provenance data, and on-site sampling) to confirm hazardous content); using standardized tagging (applying consistent tagging conventions for hazardous materials within datasets to minimize ambiguity during model training and interpretation); adding regulatory compliance mapping—Aligning hazardous material tags with jurisdiction-specific safety regulations to ensure that flagged materials automatically trigger relevant compliance checks.

3.4.5. Summary on AI-Driven Material Detection in PRA/PDA

Based on the review, it can be found that in AI-driven material detection, cameras, images, point clouds, lasers, physical interaction from robot touch, and microphones are the core input methods for material detection. CNN and SVM are the core algorithms used to achieve material detection. However, other algorithms such as random forest, Naive Bayes classifier, K-means clustering, and other neuro networks (such as LSTM) can also be applied. Various features that can be used to detect the material include RGB, HSV, friction force, sound, acceleration, reflectance, and illumination. Most of the detection accuracy rates can be over 80%, especially for SVM and CNN with image and point cloud data.
Figure 10 shows materials that existing material detection methods have focused on. It can be seen that most of the algorithms have focused on the detection of concrete, wood, and brick. Metal, stone, plastic, and fabrics also feature prominently. Soil, ceramic, glass, granular, marble, paper, steel, asphalt, cement, foliage, plaster, and tile have also been paid some attention. However, aluminum and stainless steel plates tend to be identified as a similar surface condition. Metal is mainly identified as a whole, not as separate types of material. It is notable that this uneven research focus may limit the applicability of current AI approaches in comprehensive PRA/PDA workflows and in the future, the intensity of the algorithms should be calculated.

3.5. AI for PRA/PDA-Related Volume Detection

Based on the review, 6 papers have been found to show the potential to be related to use AI in volume detection in PRA/PDA. The general result is shown in Appendix F.

3.5.1. AI Technologies for Volume Detection in PRA/PDA

Five key AI-based technologies—Structured Light, Time-of-Flight (ToF) Cameras, LiDAR, Multi-View Stereo (MVS), and Monocular Depth Estimation—have been applied in volume detection in PRA/PDA. Each of these technologies has its principles, advantages, and limitations to make them suitable for detecting the volume of objects in PRA/PDA.
Structured Light
Structured Light technology is a method that involves projecting a predefined pattern, such as grids or stripes, onto an object’s surface. The deformations in the pattern, as seen by a camera, enable the system to reconstruct the object’s 3D geometry. In PRA, with the help of structured light, high-detail precision of the geometry of structures can be captured in modifications.
Peng et al. (2019) [90] presented a system that estimates box volumes by combining line-structured light with deep learning techniques. The setup uses a 2 × 2 laser line grid projector integrated with a sensor and specialized software to process only two laser-modulated images for volume determination. An improved Holistically-Nested Edge Detection (IHED) deep learning model is applied to enhance edge detection within these images, a critical step for ensuring accurate volumetric measurement. The system demonstrates the capability to measure volumes ranging from 100 mm to 1800 mm with an accuracy of ±5.0 mm. Experimental results indicate a measurement uncertainty between ±0.52 mm and ±4.0 mm.
Time-of-Flight (ToF) Cameras
Time-of-Flight (ToF) cameras operate by emitting infrared light pulses and determining the time interval required for light to travel to an object’s surface and return to the sensor. The time delay is converted into depth information, allowing real-time volume detection. This technology is highly effective in PDA applications where quick and accurate volume measurements of demolition debris are required.
Baek et al. (2020) [91] address the challenge of distance measurement inaccuracies in ToF cameras, especially on surfaces that are either very reflective or very dark. The proposed solution uses three ToF sensors with varying integration times to capture depth data from multiple perspectives. This approach helps identify and correct errors by cross-verifying the data across the sensors. The system utilizes a novel filtering technique that incorporates a weighted median filter adapted to the skew-normal distribution, significantly enhancing the depth data accuracy by minimizing noise and preserving edge sharpness. The experiments confirm that different integration times can effectively mitigate errors associated with reflective and absorptive surface properties, thereby providing more reliable and accurate depth information.
LiDAR
LiDAR technology utilizes laser pulses to map an object’s surface in three dimensions. The acquired measurements produce a high-resolution point cloud, making this approach among the most precise techniques for volume estimation. In PDA, LiDAR is widely employed to estimate the overall volume of debris and waste materials, while in PRA, LiDAR helps in detailed structural analysis.
Malik et al. (2023) [92] presented an approach to 3D reconstruction and view synthesis through the integration of LiDAR data with neural radiance field techniques. The methodology involves a transient neural radiance field (Transient NeRF) that leverages LiDAR data to generate detailed 3D models and synthetic views of objects from sparse data points. This approach integrates an advanced array of sensors and pulsed laser technology with deep learning algorithms to improve the precision of depth maps derived from transient LiDAR data. The system has shown remarkable precision in rendering and reconstructing complex scenes and objects, enabling it to operate effectively even in challenging lighting conditions.
Multi-View Stereo (MVS)
Multi-View Stereo (MVS) is a three-dimensional reconstruction method that derives 3D structural information by analyzing multiple two-dimensional images acquired from varying viewpoints. It is a cost-effective alternative to LiDAR, suitable for PRA, where highly detailed structural reconstructions are necessary for evaluating modifications.
Li et al. (2024) [93] introduce DEC-MVSNet, a refined multi-view stereo network that builds upon the foundational MVSNet framework to enhance 3D reconstruction processes. This approach integrates a Dilated convolution and ECA-Net into the feature extraction phase, allowing for a broader receptive field and richer pixel information capture. Moreover, the integration of the CBAM at multiple stages within the network architecture improves the regularization of cost volumes and depth estimation accuracy. The study demonstrates that DEC-MVSNet outperforms traditional methods and other deep learning approaches in terms of completeness and overall quality on standard datasets such as DTU and BlendedMVS, providing evidence of superior generalization capabilities across different scenarios.
Shen and Maier (2021) [94] developed a multi-camera-based 3D reconstruction method for measuring the geometry of tubes during the freeform bending process. The cameras are strategically positioned around the bending machine to capture images from various angles during the bending operation. These images are then processed using software to reconstruct the 3D coordinates of the tube midline. The 3D coordinates will be processed with simulation software C4D for image synthesis and Matlab for camera calibration and processing. The proposed methodology significantly decreases the time required for measurement, taking about 12 s, with a relative deviation in measurement precision between 0.30% and 0.61%, depending on the tube type. The research suggests that five cameras provide adequate coverage for inspection purposes.
Monocular Depth Estimation
Monocular depth estimation is an AI-driven method that uses deep learning models to predict depth from a single image. Different from ToF and LiDAR which require specialized hardware, monocular depth estimation relies on software.
Dahnert et al. (2022) [95] merged 3D geometric reconstruction with both semantic and instance segmentation into a unified framework, enabling comprehensive panoptic three-dimensional scene reconstruction. Using a single RGB image, this method predicts the entire 3D scene within the camera’s view and assigns semantic and instance labels to every point of the reconstructed surface. This method leverages a 2D convolutional network to derive features from the input image, subsequently utilizing them to estimate depth and assist in the 3D scene construction process. This method improves the accuracy and efficiency of scene understanding. Also, it addresses the limitations of processing 3D data separately by combining all tasks into a unified model to enhance semantic coherence and instance specificity.

3.5.2. Decision-Making Flowchart to Select AI Used in PRA/PDA-Related Volume Detection

The decision-making flowchart (Figure 11 illustrates a structured approach to selecting appropriate AI methodologies for PRA/PDA-related object detection based on input environment characteristics and technological needs. It begins by identifying the type of input environment—indoor controlled scenes, complex outdoor environments, or single-image data. For indoor settings, if high precision is required, Structured Light [90] is recommended; otherwise, ToF Cameras [91] are suitable for faster but less precise measurements. For complex environments, the next decision evaluates the need for detail and scale. When high detail is needed, LiDAR [92] is the preferred method due to its accurate 3D point cloud generation. If less detail is sufficient, Multi-View Stereo (MVS) methods are used. Within MVS, cost efficiency can be used to decide whether to choose Shen & Maier (2021) for affordability or DEC-MVSNet [94] for higher performance. In scenarios where only a single image is available, Monocular Depth Estimation [95] provides a viable solution using deep learning-based depth inference.

3.5.3. Discussion on Volume Detection in PRA/PDA Using AI

PRA/PDA are important procedures in sustainable construction and waste management. Accurate volume detection allows surveyors to estimate the quantity of reusable and recyclable materials, minimizing waste generation and environmental impact. Also, it facilitates precise planning in retrofitting projects by providing data on existing structures, enabling optimized material procurement and reducing unnecessary resource usage.
The primary technologies used in PRA/PDA-related volume detection include Structured Light, ToF Cameras, LiDAR, MVS, and Monocular Depth Estimation, leveraging distinct input data to achieve precise volumetric measurements. Structured Light employs projected light patterns and image-based deformation analysis, while ToF Cameras rely on infrared light pulses and depth measurement techniques. LiDAR generates high-resolution 3D point clouds through laser pulse reflections, while MVS reconstructs 3D structures using multiple 2D images from different viewpoints. Monocular Depth Estimation utilizes single RGB images processed through deep learning networks to infer depth.
Volume detection in PRA/PDA also faces several challenges. First, the complexity of building geometries makes it difficult to capture accurate volumetric data, especially in structures with irregular shapes and varying material compositions, and multiple layers. Secondly, obstruction from surrounding objects, furniture, or vegetation can hinder accurate data acquisition. In addition, volume detection’s reliability depends on the sensing technology choice. The technologies’ resolution, sensitivity to environmental conditions, and computational requirements may also influence accuracy. Finally, integrating multiple sensing modalities for improved precision often requires sophisticated processing algorithms to make real-time applications challenging.
Future investigations should prioritize the integration of diverse AI-enabled sensing technologies to improve accuracy and operational robustness in complex and dynamic environments. Advances in deep learning models, sensor fusion techniques, and computational efficiency will be crucial in overcoming limitations such as occlusion, environmental variations, and real-time processing constraints. The continued development of hybrid AI approaches combining multiple sensing modalities will further optimize PRA and PDA applications, ensuring sustainable construction practices and improved waste management strategies.

3.6. Report Writing

A PRA/PDA report typically includes sections such as an executive summary, project introduction, methodology, building characterization, inventory of materials, hazardous material identification, waste management and resource recovery analysis, environmental and economic assessment, regulatory compliance, conclusions and strategic recommendations, and appendix. The context of each section is described in Appendix G.
Although AI has not been specifically developed for PRA/PDA report generation, AI has shown considerable potential for it. NLP can be used to generate PRA/PDA reports automatically. NLP can integrate and analyze data from diverse sources, such as audit checklists, field inspections, images, and historical records. By identifying key information, AI systems systematically transform this data into clear, structured, and comprehensive written narratives. Then, through automation, AI ensures consistency by employing predefined report templates that meet regulatory standards and industry guidelines.
Apart from NLP, AI-enhanced energy modeling leverages data from Energy Performance Certificates (EPCs) to simulate retrofit scenarios, predicting the outcomes of various energy-saving interventions. AI-driven simulations analyze energy consumption patterns and model the impacts of insulation upgrades, HVAC system replacements, or renewable energy integration. For example, AI energy models can evaluate different retrofit options, suggesting the most cost-effective and efficient energy solutions to achieve sustainability targets.
AI-driven predictive analytics applied to Environmental Impact Assessments (EIAs) and Waste Management Plans can accurately forecast environmental impacts and identify optimal waste management strategies. Predictive models evaluate potential emissions, biodiversity impacts, and pollution risks associated with demolition and retrofit activities. For example, AI can predict the ecological impact of different demolition techniques, guiding decisions towards methods with the least environmental footprint.

4. Conclusions

This paper reviews the potential of AI to assist PRA/PDA processes with particular attention to how AI technologies can be used in each sub-stage of PRA/PDA. The review revealed that although AI has the potential to be applied across multiple PRA/PDA sub-stages, actual application is still limited and unevenly distributed. The strongest evidence of adoption is in floor plan recognition and material detection, where deep learning, GAN-based, and hybrid AI approaches have achieved high levels of accuracy and efficiency (such as CNN-based floor plan models delivering 81–98% accuracy; material detection via SVM and CNN exceeding 90% in most cases, with VGG16-based methods reaching up to 97.35%). However, other sub-stages such as operation and maintenance document analysis, object detection, volume estimation, and automated report generation, remain underexplored, with few or no existing studies addressing them specifically within the PRA/PDA context. These findings emphasize both the immediate opportunities, such as adapting proven computer vision and NLP pipelines to unaddressed stages, and the need for future research focusing on multimodal AI integration, standardized benchmarks, and real-time deployment to close the gap between AI capability and PRA/PDA adoption.
Deep learning and GAN-based models have been used to automate floor plan recognition and 2D-to-3D reconstruction. No specific AI applications currently target PRA/PDA-related document review. However, technologies such as OCR, NLP, and computer vision have shown potential to extract key information from scanned reports and textual data. Although artificial intelligence techniques have not yet been directly implemented for PRA/PDA object detection, numerous computer vision and three-dimensional object detection frameworks leveraging LiDAR and point cloud data show high potential for this task. Technologies such as PointRCNN, Frustum ConvNet, and VoteNet have demonstrated reliable results in accurately locating and classifying indoor structural components. SVMs and CNNs have been successfully applied to detect and classify construction materials using image, video, or point cloud data. Volume detection in PRA/PDA remains under-researched, with only a few AI applications identified. However, AI-based 3D reconstruction and point cloud analysis tools could potentially be adapted for accurate volume estimation of reusable or disposable materials on-site. No AI tools are specifically used for PRA/PDA report generation. However, NLP and automated text generation technologies could support faster, standardized, and more consistent audit documentation in the future.
Based on the review, there is no comparisons between traditional and AI-assisted auditing with the parameters such as time, accuracy, and cost. Future studies should systematically compare time, accuracy, and cost difference between traditional and AI-assisted auditing in PRA/PDA content to better quantify the potential benefits of AI-assisted approaches.
In addition, challenges, including data variability, insufficient domain-specific datasets, algorithmic limitations, and integration into existing workflows, still hinder the use of AI in PRA/PDA. For example, domain-specific datasets that capture the history of building materials, their sources, and degradation rates under real-world conditions are essential for training AI models to accurately predict remaining material lifespan, assess reuse potential, and prioritize salvage operations. The lack of these database lead to reduced prediction accuracy and limited applicability across projects. Establishing shared, standardized repositories that combine historical material records with degradation performance data would significantly enhance the reliability and transferability of AI-based PRA/PDA tools. However, this study also highlights significant opportunities for future research and development, including multi-modal AI model development, real-time and on-site AI deployment, and broader benchmarking standards.

Author Contributions

Conceptualization, T.J., P.C. and H.Z.; methodology, H.Z. and Y.Y.; formal analysis, H.Z. and Y.Y.; investigation, H.Z. and Y.Y.; data curation, H.Z. and Y.Y.; writing—original draft preparation, H.Z. and Y.Y.; writing—review and editing, Y.Y., H.Z., T.J., S.J., B.C., J.B., P.W., K.A., K.H. and P.C.; visualization, Y.Y.; supervision, P.C.; project administration, T.J.; funding acquisition, T.J., S.J., B.C., J.B., P.W., K.A., K.H. and P.C. All authors have read and agreed to the published version of the manuscript.

Funding

This research was funded by Innovative UK (Grant Number: 10102569; grant title BuildAudit). The APC was funded by Imperial College London.

Data Availability Statement

The data presented in this study are available in the manuscript and Appendix A, Appendix B, Appendix C, Appendix D, Appendix E, Appendix F and Appendix G.

Conflicts of Interest

Authors Sandeep Jain and Paul Williams were employed by the company Enable My Team, Ltd. Authors Ben Cartwright and Katherine Adams were employed by the company Reusefully, Ltd. The remaining authors declare that the research was conducted in the absence of any commercial or financial relationships that could be construed as a potential conflict of interest.

Abbreviations

The following abbreviations are used in this manuscript:
3DSSD3D Single Shot Detector
AIArtificial Intelligence
ANNArtificial Neural Network
BEVBird’s Eye View
BIMBuilding Information Modeling
BRDFBidirectional Reflectance Distribution Function
CBAMConvolutional Block Attention Module
cGANConditional Generative Adversarial Network
CNNConvolutional Neural Network
DEC-MVSNetDilated ECA-Net MVSNet
EIAEnvironmental Impact Assessment
EPCEnergy Performance Certificate
FCNFully Convolutional Network
FPFeature Propagation
GANGenerative Adversarial Network
GNNGraph Neural Network
HSVHue-Saturation-Value
IFCIndustry Foundation Classes
KDPKey Demolition Products
LiDARLight Detection and Ranging
LSTMLong Short-Term Memory
MEPMechanical, Electrical, and Plumbing
MRFMarkov Random Field
MV3DMulti-View 3D Object Detection Network
MVSMulti-View Stereo
NFSNeuro-Fuzzy System
NLPNatural Language Processing
O&MOperation and Maintenance
OCROptical Character Recognition
PDAPre-Demolition Auditing
PIXORPixel-wise Oriented Region-based Detector
PRAPre-Retrofit Auditing
PVDFPolyvinylidene Fluoride
R-CNNRegion-Based Convolutional Neural Network
RGBRed-Green-Blue color model
RPNRegion Proposal Network
RT3DReal-Time 3D Detector
SECONDSparsely Embedded Convolutional Detection
STFTShort-Time Fourier Transform
SVMSupport Vector Machine
ToFTime-of-Flight
VFEVoxel Feature Encoding
VoteNetHough Voting-based Network for 3D Detection
VoxelNetVoxel-based Neural Network for 3D detection
VSAVoxel Set Abstraction
YOLOYou Only Look Once

Appendix A. Explanation of AI Topics and Their Definitions

AI TopicDescription
Machine learning (ML)ML enables systems to learn from data and improve machines’ performance over time without being explicitly programmed. By identifying patterns and relationships in large datasets, ML algorithms can make predictions, classify data, or support decision-making.
Deep learning (DL)DL is a subset of ML that uses artificial neural networks with multiple layers to process and analyze complex data. These networks stimulate the human brain’s ability to recognize patterns and extract features from raw data such as images, audio, or text.
Neural networks (NN)NN are computational models inspired by the human brain’s structure and function. They consist of inter-connected layers of nodes that process and transmit information.
Natural language processing (NLP)NLP focuses on enabling computers to understand, interpret, and generate human language. NLP combines computational linguistics with ML to perform tasks such as text analysis, language translation, sentiment analysis, and automated report generation. It bridges the gap between human communication and machine understanding.
Pattern recognitionPattern recognition is the ability of AI systems to identify patterns, regularities, or trends in data. This field often overlaps with ML and computer vision.
Machine visionMachine vision enables machines to interpret and process visual data, such as images or video, to extract meaningful information. This involves techniques like image processing, object detection, and 3D modeling.
Expert systemsExpert systems are AI systems designed to simulate the decision-making abilities of a human expert in a specific domain. These systems rely on a knowledge base of facts and rules and use inference engines to solve problems or make decisions.
Fuzzy logicFuzzy logic is an approach to reasoning. This allows for degrees of truth or partial values, rather than binary true or false logic. It is particularly useful for handling uncertainty and imprecise information.
Genetic algorithmsGenetic algorithms are optimization techniques inspired by the principles of natural selection and evolution. These algorithms iteratively improve solutions to complex problems by stimulating biological processes such as mutation, crossover, and selection.

Appendix B. A Summary of the Papers Highlighted Relating to AI-Based Floor Plan Detection in PRA/PDA

PaperAI MethodAlgorithmDatasetResults AccuracyAdditional Note
So et al. (1998) [36]Rule-BasedN/A (Extrusion from 2D CAD)N/AN/AFocus: Base technique
Or et al. (2005) [37]Rule-BasedRAG + Symbol RecognitionN/AN/AFocus: 3D structure
Chandler (2006) [38]Rule-BasedSVG (parsing to .obj)N/AN/AFocus: Layered parsing
Moloo et al. (2011) [31]Deep LearningOpen CV + CNNN/A85–90% accuracy, 4s model generation
Mello et al. (2012) [39]Rule-BasedHough + Contour SegmentationN/AN/AFocus: Historical plans
Liu et al. (2015) [41]Hybrid AI + Procedural ModellingAI + Procedural ModellingRent3D (MRF + images)90% layout estimation
Wu (2015) [40]Rule-BasedIndoorOSM + VectorizationN/AN/AFocus: GIS integration
Zak & Macadam (2017) [42]Hybrid AI + Procedural ModellingBIM + AI visionN/A89%Input quality dependency issues/challenges
Kim et al. (2021) [33]GAN-BasedcGAN (for style normalization)EAIS12% room detection, 95% room matching
Park & Kim (2021) [35]Hybrid AI + Procedural Modelling3DPlanNet (CNN + Heuristics)30 training sample95% wall, 97% object accuracy
Vidanapathirana et al. (2021) [24]GAN-BasedGAN + GNN for realistic texturesN/AN/AFocus: hand-drawn plans to immersive 3D
Cheng et al. (2022) [32]Deep LearningYOLOv5 + DRN + OCRRJFM (2000 images)98%
Pizarro et al. (2022) [29]Hybrid AI + Procedural ModellingCNN + RL refinementN/A90%+Focus: multi-unit residential models
Barreiro et al. (2023) [30]Deep LearningCNN + Hough TransformCubiCasa5k81% IoU(walls), 80% vector accuracy
Usman et al. (2024) [34] GAN-BasedGAN + CNN (Unity3D)N/AN/AFocus: scene realism, not model vectorization

Appendix C. Documentation That Can Be Accessed by Surveyors Before Going to on Site and Its Context (Apart from Floor Plan)

DocumentationContext Included
Operation and Maintenance (O&M) BookEquipment, systems, components, maintenance schedules, past repairs, warranties, operational guidelines.
Building Survey ReportsStructural details, age, material specifications, condition assessment.
As-Built DrawingsLayout, dimensions, material specifications, utilities (HVAC, electrical, plumbing).
Material Inventory ReportConstruction materials, hazardous substances (asbestos, lead), recyclables.
Energy Performance Certificates (EPCs)Energy efficiency ratings, insulation, heating/cooling systems.
Hazardous Material SurveyAsbestos, lead paint, mold, and other hazardous substances.
Structural Assessment ReportLoad-bearing elements, foundation integrity, risk of structural failure.
Environmental Impact Assessment (EIA)Environmental effects, waste disposal, emissions, biodiversity impact.
Mechanical, Electrical, and Plumbing (MEP) ReportsExisting conditions of mechanical, electrical, plumbing systems.
Fire Safety ReportsFire resistance, evacuation routes, fire protection measures.
Occupancy and Usage RecordsHistorical/current usage, modifications, maintenance history.
Geotechnical ReportsSoil composition, ground stability, foundation conditions.
Waste Management PlanStrategies for waste handling, recycling, disposal during demolition or renovation.
Regulatory Compliance DocumentationPermits, adherence to local building codes, environmental regulations.

Appendix D. An Overview on Potential AI Methods That Can Be Used in PRA/PDA-Related Object Detection

PaperAI MethodSub-MethodDatasetResult/AccuracyNotes
Beltran et al. (2018) [58]Single-Shot (BirdNet)BEV + CNNKITTISoTA at timeLess vertical accuracy
Chen et al. (2017) [44]Deep LearningMulti-View (MV3D)KITTI99.1% recall (IoU 0.25)High accuracy, not real-time
Lehner et al. (2019) [56]Voxel-basedPatch RefinementN/AN/ALocal voxel refinement
Liang et al. (2019) [50]Deep LearningMulti-Sensor FusionKITTIN/ARobust in occlusion
Lu et al. (2019) [51]Attention-Based DL (SCANet)Multi-Level FusionKITTISoTA, 11 FPSComputationally complex
Qi et al. (2019) [45]Point-basedVoteNetScanNet, SUN RGB-DSoTAHigh complexity
Shi et al. (2019) [48]Segmentation-basedPointRCNNKITTIHigh recallHeavy computation
Shi et al. (2019) [25]HybridPV-RCNNKITTI, WaymoHigh efficiencyCombines voxel + point
Shin et al. (2019) [54]Hybrid (RoarNet)Image + LiDAR FusionKITTIHigh accuracyWorks with unsynced sensors
Wang et al. (2019) [55]Deep LearningF-ConvNetKITTI, SUN-RGBDTop-rankedSliding frustum-based
Xu et al. (2018) [46]Deep LearningPointFusionKITTI, SUN-RGBDSoTA on datasetsHigh computation
Yan et al. (2018) [59]Sparse CNNSECONDN/AN/AFaster than VoxelNet
Yang et al. (2018) [57]Single-Shot (PIXOR)BEV-basedKITTI28 FPSLoses height info
Yang et al. (2018) [49]Point-based3DSSDKITTI, nuScenes>25 FPSLacks detail on small objects
Zeng et al. (2018) [52]Deep LearningReal-time 3D (RT3D)KITTIFastest at time (11.1 FPS)Real-time capable
Zhao et al. (2018) [53]Attention-basedPoint-SENetN/ABetter than F-PointNetFocus on feature quality
Zhou & Tuzel (2018) [47]Voxel-basedVoxelNetN/AN/AHeavy computation

Appendix E. An Overview on Existing AI-Driven Material Detection Methods Used in PRA/PDA

ReferenceMaterialMain InputAlgorithmFeature/RGBAccuracy
Penumuru et al., 2020 [82]Aluminum, Copper, Medium density fiber board, Mild steel, Sandpaper, Styrofoam, Cotton, and LinenCameraSVMRGB100% with small sample
Strese et al., 2017 [69]Meshes, Stones, Glossy Surfaces, Wooden surface, Rubbers, Fibers, Foams, Foils/Papers, Fabrics/TextilesRobot touch, Camera, Microphone (sound signals), and FSRNaive Bayes classifierAcceleration, Friction force, Sound, Image74%
Dimitrov et al., 2014 [60]Asphalt, Brick, Cement-Granular, Cement-Smooth, Concrete-Cast, Concrete-Precast, Foliage, Form Work, Grass, Gravel, Marble, Metal-Grills, Paving, Soil-Compact, Soil-Vegetation, Soil-Loose, Soil-Mulch, Stone-Granular, Stone-Limestone, Wood.Single imageSVMEdges, Spots, Waves, Hue-Saturation-Value (HSV) color values97.1%
Zhu et al., 2010 [74]ConcreteImageANNColor, TextureAround 80%
Leung and Malik, 2001 [70]Felt, Rough Plastic, Sandpaper, Plaster, Rough paper, Roof Shingle, Cork, Rug, Styrofoam, Lambswook, Quarry Tile, Insulation plaster, slate, Painted spheres, Brick, concrete, Brown bread, crackerImageK-meansReflectance, Surface normal97%
Bian et al., 2018 [83]Brick, Carpet, Ceramic, Fabric, Foliage, Food, Hair, Leather, Metal, Mirror, Painted, Paper, Plastic, Polished stone, Skin, Sky, Stone, Tile, Wallpaper, Water, Wood, OtherImageCNN, Softmax, SVM, Random ForestN/A80–85%
Liu and Gu, 2014 [26] Metal, Aluminum, Alloy, Steel, Stainless steel, Brass, Copper, Plastic, Ceramic, Fabric, woodImageSVMIllumination51–61% for dented aluminum and stainless steel plates
94–97% for varnished and unvarnished paints.
Bell et al., 2013 [68]Wood, Tile, Marble, GraniteImageSupervised learning classificationMaterial parameters (reflectance, material names), Texture information (surface normals, rectified textures), Contextual information (scene category, and object names).Below 50%
Bell et al., 2015 [84]Brick, Carpet. Ceramic, Fabric, Foliage, Food, Glass, Hair, Leather, Metal, Mirror, Painted, Paper, Plastic, Pol. Stone, Skin, Sky, Stone, Tile, Wallpaper, Water, WoodImageCNNN/A85.2%
Yuan et al., 2020 [73]Concrete, Mortar, Stone, Metal, Painting, Wood, Plaster, Pottery, CeramicA terrestrial laser scanner (TLS) with a built-in cameraSVMMaterial reflectance, HSV color values, and Surface roughness as features96.7%
Han and Golparvar-Fard, 2015 [72]Asphalt, Brick, Granular and Smooth Cement based surfaces, Concrete, Foliage, Formwork (Gang Form and Plywood form), Gravel, Insulation, Marble, Metal, Paving, Soil (Compact, Dirt, Vegetation, Loose, and Mulch), Stone (Granular, Limestone), Waterproofing Paint and Wood4D Building Information Models (BIM), 3D point cloud models SVMRGBAverage accuracy of 92.4%
Mahami et al., 2021 [87]Sandstorms, Paving, Gravel, Stone, Cement-granular, Brick, Soil, Wood, Asphalt, Clay hollow block, and Concrete blockCamera, MicrophoneVGG16N/A97.35%
Mengiste et al., 2024 [96] Concrete surface, Chiseled concrete, Mortar plaster.ImageCNN and GLCMTextual and CNN95% for Tthe limited (208 images) data sets
71% for very small (70 images) data sets
Li et al., 2022 [88]Wood, Metal, Fabric, Marble, Ceramic, Glass, Leather, Plastic, Rubber, Granite, Wax3D model and Point cloudResNet-50 N/A76.82%
Erickson et al., 2020 [85]Ceramic, Fabric, Foam, Glass, Metal, Paper, Plastic, and Wood.A spectrometer and near-field camera CNN (ImageNet)N/A80.0%
Olgun and Türkoğlu, 2022 [62]Aluminum, Black fabric, Frosted glass, Glass, Pottery, Granite, Linden, Magnet, Polyethylene and Artificial marble Laser light LSTM deep learning modelN/AAn average of 93.63%
Lu et al., 2018 [61]Exposed concrete, Concrete-green painting, Grey brick, Concrete-white painting, Orange brick, Red brick, white brick, WoodImageNeuro-Fuzzy system (NFS)Projection results from two directions, Ratio values, RGB color values, Roughness values, and Hue value88–96%
Son et al., 2014 [64]Concrete, Steel, and Wood.ImageCompareN/A82.28–96.70%
Erickson et al., 2019 [65]Plastic, Fabric, Paper, Wood, and MetalMicro spectrometers Nural networkN/A94.6% when given only one spectral sample per object.
79.1% via leave-one-object-out cross validation.

Appendix F. A Summary of Papers Highlighted Relating to AI-Based Volume Detection in PRA/PDA

PaperTechnology UsedInput DataObject Volume DetectedAccuracy Rate
Shen and Maier (2021) [93]Multi-View Stereo (MVS)Multiple camera images, 3D tube midline reconstructionTube geometry during freeform bending0.30–0.61%
Peng et al. (2019)
[89]
Structured LightLaser line grid projector images, IHED deep learning modelBox volume measurementMeasure volumes ranging from 100 mm to 1800 mm with an accuracy of ±5.0 mm
Baek et al. (2020) [90]Time-of-Flight (ToF) CamerasInfrared light pulses, depth data from ToF sensorsDistance measurement for surfacesError correction improves precision significantly
Malik et al. (2023) [91]LiDARLiDAR-based depth maps, transient neural radiance fields (NeRF)3D scene reconstruction and synthetic view generationHigh precision in 3D rendering
Li et al. (2024) [92]Multi-View Stereo (MVS)Multi-view images, DEC-MVSNet, deep learning features3D structural reconstructionHigher completeness and quality than traditional MVS
Dahnert et al. (2022) [95] Monocular Depth EstimationSingle RGB image, convolutional networks for depth estimation3D scene reconstructionSignificant improvement over separate task processing

Appendix G. Context for Sections in PRA/PDA Reports

SectionDescription
Executive summaryProvides a succinct overview of the project’s scope, objectives, key findings, and actionable recommendations to facilitate quick comprehension and decision-making.
Project introductionOutlines project background, objectives, audit boundaries, and detailed information on the structure or site, including geographical location, historical context, usage history, age, and current physical condition.
MethodologyDescribes methodologies used, including assessment methods, techniques, instruments, and adherence to established standards (e.g., ISO guidelines) to ensure transparency, reproducibility, and validity.
Building characterizationDetails structural and architectural features such as floor plans, elevations, total area, construction materials, and historical modifications to enable precise auditing.
Inventory of materialsSystematically identifies, quantifies, and classifies all materials within the structure (e.g., concrete, timber, metals, plastics), supporting resource recovery and waste management planning.
Hazardous material identificationSystematic identification of hazardous substances (e.g., asbestos, lead-based paints, mercury, PCBs, mold) for effective hazard mitigation, compliance, and safety planning.
Waste management and resource recovery analysisEvaluates potential opportunities for material reuse, recycling, or recovery, providing detailed recommendations for selective demolition and handling to enhance resource efficiency and minimize environmental impacts.
Environmental and economic assessmentAssesses environmental impacts, mitigation measures, and economic considerations, including cost-benefit analyses, to balance sustainability objectives and project viability.
Regulatory complianceReviews applicable regulatory frameworks (local, national, international guidelines) to ensure recommendations align with legal and industry standards, thereby minimizing legal and regulatory risks.
Conclusions and strategic recommendationsSynthesizes audit findings into prioritized, actionable recommendations addressing safety, sustainability, economic efficiency, and regulatory compliance for subsequent project phases.
AppendixIncludes Supplementary Materials (e.g., detailed inventories, sampling methods, lab analyses, site photographs, reference documentation) supporting and validating the main report findings.

References

  1. Amoah, C.; Smith, J. Barriers to the Green Retrofitting of Existing Residential Buildings. J. Facil. Manag. 2024, 22, 194–209. [Google Scholar] [CrossRef]
  2. Iwuanyanwu, O.; Gil-Ozoudeh, I.; Okwandu, A.C.; Ike, C.S. Retrofitting Existing Buildings for Sustainability: Challenges and Innovations. Eng. Sci. Technol. J. 2024, 5, 2616–2631. [Google Scholar] [CrossRef]
  3. Miran, F.D.; Husein, H.A. Introducing a Conceptual Model for Assessing the Present State of Preservation in Heritage Buildings: Utilizing Building Adaptation as an Approach. Buildings 2023, 13, 859. [Google Scholar] [CrossRef]
  4. Farneti, E.; Cavalagli, N.; Venanzi, I.; Salvatore, W.; Ubertini, F. Residual Service Life Prediction for Bridges Undergoing Slow Landslide-Induced Movements Combining Satellite Radar Interferometry and Numerical Collapse Simulation. Eng. Struct. 2023, 293, 116628. [Google Scholar] [CrossRef]
  5. Grecchi, M. Building Renovation: How to Retrofit and Reuse Existing Buildings to Save Energy and Respond to New Needs; Springer Nature: Berlin/Heidelberg, Germany, 2022. [Google Scholar]
  6. Wang, Z.; Liu, Q.; Zhang, B. What Kinds of Building Energy-Saving Retrofit Projects Should Be Preferred? Efficiency Evaluation with Three-Stage Data Envelopment Analysis (DEA). Renew. Sustain. Energy Rev. 2022, 161, 112392. [Google Scholar] [CrossRef]
  7. Geldenhuys, H.J. The Development of an Implementation Framework for Green Retrofitting of Existing Buildings in South Africa. Ph.D. Thesis, Stellenbosch University, Stellenbosch, South Africa, 2017. Available online: https://scholar.sun.ac.za/handle/10019.1/100867 (accessed on 26 March 2025).
  8. Zaharieva, R.; Kancheva, Y.; Evlogiev, D.; Dinov, N. Pre-Demolition Audit as a Tool for Appropriate CDW Management–a Case Study of a Public Building. E3S Web Conf. 2024, 550, 01045. [Google Scholar] [CrossRef]
  9. Ann, T.W.; Wong, I.; Mok, K.S. Effectiveness and Barriers of Pre-Refurbishment Auditing for Refurbishment and Renovation Waste Management. Environ. Chall. 2021, 5, 100231. [Google Scholar]
  10. Xu, K.; Shen, G.Q.; Liu, G.; Martek, I. Demolition of Existing Buildings in Urban Renewal Projects: A Decision Support System in the China Context. Sustainability 2019, 11, 491. [Google Scholar] [CrossRef]
  11. Pan, Y.; Zhang, L. Roles of Artificial Intelligence in Construction Engineering and Management: A Critical Review and Future Trends. Autom. Constr. 2021, 122, 103517. [Google Scholar] [CrossRef]
  12. Abioye, S.O.; Oyedele, L.O.; Akanbi, L.; Ajayi, A.; Delgado, J.M.D.; Bilal, M.; Akinade, O.O.; Ahmed, A. Artificial Intelligence in the Construction Industry: A Review of Present Status, Opportunities and Future Challenges. J. Build. Eng. 2021, 44, 103299. [Google Scholar] [CrossRef]
  13. Li, Y.; Chen, H.; Yu, P.; Yang, L. A Review of Artificial Intelligence in Enhancing Architectural Design Efficiency. Appl. Sci. 2025, 15, 1476. [Google Scholar] [CrossRef]
  14. Beyan, E.V.P.; Rossy, A.G.C. A Review of AI Image Generator: Influences, Challenges, and Future Prospects for Architectural Field. J. Artif. Intell. Archit. 2023, 2, 53–65. [Google Scholar]
  15. Rane, N. Role of ChatGPT and Similar Generative Artificial Intelligence (AI) in Construction Industry. 2023. Available online: https://papers.ssrn.com/sol3/papers.cfm?abstract_id=4598258 (accessed on 26 March 2025). [CrossRef]
  16. Momade, M.H.; Durdyev, S.; Estrella, D.; Ismail, S. Systematic Review of Application of Artificial Intelligence Tools in Architectural, Engineering and Construction. Front. Eng. Built Environ. 2021, 1, 203–216. [Google Scholar] [CrossRef]
  17. Salehi, H.; Burgueño, R. Emerging Artificial Intelligence Methods in Structural Engineering. Eng. Struct. 2018, 171, 170–189. [Google Scholar] [CrossRef]
  18. Tapeh, A.T.G.; Naser, M.Z. Artificial Intelligence, Machine Learning, and Deep Learning in Structural Engineering: A Scientometrics Review of Trends and Best Practices. Arch. Comput. Methods Eng. 2023, 30, 115–159. [Google Scholar] [CrossRef]
  19. Thai, H.-T. Machine Learning for Structural Engineering: A State-of-the-Art Review. Structures 2022, 38, 448–491. [Google Scholar] [CrossRef]
  20. Mulero-Palencia, S.; Álvarez-Díaz, S.; Andrés-Chicote, M. Machine Learning for the Improvement of Deep Renovation Building Projects Using As-Built BIM Models. Sustainability 2021, 13, 6576. [Google Scholar] [CrossRef]
  21. Ajayi, S.O.; Oyedele, L.O.; Bilal, M.; Akinade, O.O.; Alaka, H.A.; Owolabi, H.A. Critical Management Practices Influencing On-Site Waste Minimization in Construction Projects. Waste Manag. 2017, 59, 330–339. [Google Scholar] [CrossRef] [PubMed]
  22. Baset, A.; Jradi, M. Data-Driven Decision Support for Smart and Efficient Building Energy Retrofits: A Review. Appl. Syst. Innov. 2025, 8, 5. [Google Scholar] [CrossRef]
  23. Yamusa, M.; Dauda, J.; Ajayi, S.; Saka, A.B.; Oyegoke, A.S.; Adebisi, W.; Jagun, Z.T. Automated Compliance Checking in the Aec Industry: A Review of Current State, Opportunities and Challenges; Social Science Research Network: Rochester, NY, USA, 2024. [Google Scholar] [CrossRef]
  24. Vidanapathirana, M.; Wu, Q.; Furukawa, Y.; Chang, A.X.; Savva, M. Plan2Scene: Converting Floorplans to 3D Scenes. In Proceedings of the 2021 IEEE/CVF Conference on Computer Vision and Pattern Recognition (CVPR), Nashville, TN, USA, 20–25 June 2021; IEEE: New York, NY, USA, 2021; pp. 10728–10737. [Google Scholar] [CrossRef]
  25. Shi, S.; Guo, C.; Jiang, L.; Wang, Z.; Shi, J.; Wang, X.; Li, H. PV-RCNN: Point-Voxel Feature Set Abstraction for 3D Object Detection. In Proceedings of the 2020 IEEE/CVF Conference on Computer Vision and Pattern Recognition (CVPR), Seattle, WA, USA, 13–19 June 2020; IEEE: New York, NY, USA, 2020; pp. 10526–10535. [Google Scholar] [CrossRef]
  26. Liu, C.; Gu, J. Discriminative Illumination: Per-Pixel Classification of Raw Materials Based on Optimal Projections of Spectral BRDF. IEEE Trans. Pattern Anal. Mach. Intell. 2014, 36, 86–98. [Google Scholar] [CrossRef]
  27. Panchalingam, R.; Chan, K.C. A State-of-the-Art Review on Artificial Intelligence for Smart Buildings. Intell. Build. Int. 2021, 13, 203–226. [Google Scholar] [CrossRef]
  28. Aguilar, J.; Garces-Jimenez, A.; R-moreno, M.D.; García, R. A Systematic Literature Review on the Use of Artificial Intelligence in Energy Self-Management in Smart Buildings. Renew. Sustain. Energy Rev. 2021, 151, 111530. [Google Scholar] [CrossRef]
  29. Pizarro, P.N.; Hitschfeld, N.; Sipiran, I.; Saavedra, J.M. Automatic Floor Plan Analysis and Recognition. Autom. Constr. 2022, 140, 104348. [Google Scholar] [CrossRef]
  30. Barreiro, A.C.; Trzeciakiewicz, M.; Hilsmann, A.; Eisert, P. Automatic Reconstruction of Semantic 3D Models from 2D Floor Plans. In Proceedings of the 2023 18th International Conference on Machine Vision and Applications (MVA), Hamamatsu, Japan, 23–25 July 2023; IEEE: New York, NY, USA, 2023; pp. 1–5. [Google Scholar] [CrossRef]
  31. Moloo, R.K.; Dawood, M.A.S.; Auleear, A.S. 3-Phase Recognition Approach to Pseudo 3d Building Generation from 2d Floor Plan. arXiv 2011, arXiv:1107.3680. [Google Scholar] [CrossRef]
  32. Cheng, X.; Ding, X.; Zhang, J.; Liu, M.; Chang, K.; Wang, J.; Zhou, C.; Yuan, J. Multi-Stage Floor Plan Recognition and 3D Reconstruction. In Proceedings of the 8th International Conference on Computing and Artificial Intelligence, Tianjin, China, 18–21 March 2022; ACM: New York, NY, USA, 2022; pp. 387–393. [Google Scholar] [CrossRef]
  33. Kim, S.; Park, S.; Kim, H.; Yu, K. Deep Floor Plan Analysis for Complicated Drawings Based on Style Transfer. J. Comput. Civ. Eng. 2021, 35, 04020066. [Google Scholar] [CrossRef]
  34. Usman, M.; Almulhim, A.; Alaseri, M.; Alzahran, M.; Luqman, H.; Anwar, S. Sketch–to–3D: Transforming Hand-Sketched Floorplans into 3D Layouts. In Proceedings of the 2024 International Conference on Digital Image Computing: Techniques and Applications (DICTA), Perth, Australia, 27–29 November 2024; IEEE: New York, NY, USA, 2024; pp. 359–366. [Google Scholar] [CrossRef]
  35. Park, S.; Kim, H. 3DPlanNet: Generating 3D Models from 2D Floor Plan Images Using Ensemble Methods. Electronics 2021, 10, 2729. [Google Scholar] [CrossRef]
  36. So, C.; Baciu, G.; Sun, H. Reconstruction of 3D Virtual Buildings from 2D Architectural Floor Plans. In Proceedings of the ACM Symposium on Virtual Reality Software and Technology, Taipei Taiwan, 2–5 November 1998; ACM: New York, NY, USA, 1998; pp. 17–23. [Google Scholar] [CrossRef]
  37. Or, S.; Wong, K.-H.; Yu, Y.; Chang, M.M.; Kong, H. Highly Automatic Approach to Architectural Floorplan Image Understanding & Model Generation. Pattern Recognit. 2005, 25–32. [Google Scholar]
  38. Chandler, M.; Genetti, J.; Chappell, G. 3D Interior Model Extrusion from 2D Floor Plans. 2006. Available online: https://www.cs.uaf.edu/2012/ms_project/MS_CS_Matt_Chandler.pdf (accessed on 26 March 2025).
  39. Mello, C.A.B.; Costa, D.C.; Santos, T.J.D. Automatic Image Segmentation of Old Topographic Maps and Floor Plans. In Proceedings of the 2012 IEEE International Conference on Systems, Man, and Cybernetics (SMC), Seoul, Republic of Korea, 14–17 October 2012; IEEE: New York, NY, USA, 2012; pp. 132–137. [Google Scholar] [CrossRef]
  40. Wu, H. Integration of 2D Architectural Floor Plans into Indoor Open-StreetMap for Reconstructing 3D Building Models. Ph.D. Thesis, Delft University of Technology, Delft, The Netherlands, 2015. Available online: https://repository.tudelft.nl/file/File_962bcbb6-7230-4539-bcac-cee5f600191a?preview=1 (accessed on 26 March 2025).
  41. Liu, C.; Schwing, A.G.; Kundu, K.; Urtasun, R.; Fidler, S. Rent3d: Floor-Plan Priors for Monocular Layout Estimation. In Proceedings of the IEEE Conference on Computer Vision and Pattern Recognition, Boston, MA, USA, 7–12 June 2015; pp. 3413–3421. [Google Scholar]
  42. Zak, J.; Macadam, H. Utilization of Building Information Modeling in Infrastructure’s Design and Construction. In Proceedings of the IOP Conference Series: Materials Science and Engineering, Busan, Republic of Korea, 25–27 August 2017; IOP Publishing: Bristol, UK, 2017; Volume 236, p. 012108. [Google Scholar]
  43. Bocaneala, N.; Mayouf, M.; Vakaj, E.; Shelbourn, M. Artificial intelligence based methods for retrofit projects: A review of applications and impacts. Arch. Comput. Methods Eng. 2025, 32, 899–926. [Google Scholar] [CrossRef]
  44. Chen, X.; Ma, H.; Wan, J.; Li, B.; Xia, T. Multi-View 3D Object Detection Network for Autonomous Driving. In Proceedings of the 2017 IEEE Conference on Computer Vision and Pattern Recognition (CVPR), Honolulu, HI, USA, 21–26 July 2017; IEEE: New York, NY, USA, 2017; pp. 6526–6534. [Google Scholar] [CrossRef]
  45. Qi, C.R.; Litany, O.; He, K.; Guibas, L. Deep Hough Voting for 3D Object Detection in Point Clouds. In Proceedings of the 2019 IEEE/CVF International Conference on Computer Vision (ICCV), Seoul, Republic of Korea, 27 October–2 November 2019; IEEE: New York, NY, USA, 2019; pp. 9276–9285. [Google Scholar] [CrossRef]
  46. Xu, D.; Anguelov, D.; Jain, A. PointFusion: Deep Sensor Fusion for 3D Bounding Box Estimation. In Proceedings of the 2018 IEEE/CVF Conference on Computer Vision and Pattern Recognition, Salt Lake City, UT, USA, 18–23 June 2018; IEEE: New York, NY, USA, 2018; pp. 244–253. [Google Scholar] [CrossRef]
  47. Zhou, Y.; Tuzel, O. VoxelNet: End-to-End Learning for Point Cloud Based 3D Object Detection. In Proceedings of the 2018 IEEE/CVF Conference on Computer Vision and Pattern Recognition, Salt Lake City, UT, USA, 18–23 June 2018; IEEE: New York, NY, USA, 2018; pp. 4490–4499. [Google Scholar] [CrossRef]
  48. Shi, S.; Wang, X.; Li, H. PointRCNN: 3D Object Proposal Generation and Detection From Point Cloud. In Proceedings of the 2019 IEEE/CVF Conference on Computer Vision and Pattern Recognition (CVPR), Long Beach, CA, USA, 15–20 June 2019; IEEE: New York, NY, USA, 2019; pp. 770–779. [Google Scholar] [CrossRef]
  49. Yang, Z.; Sun, Y.; Liu, S.; Jia, J. 3DSSD: Point-Based 3D Single Stage Object Detector. In Proceedings of the 2020 IEEE/CVF Conference on Computer Vision and Pattern Recognition (CVPR), Seattle, WA, USA, 13–19 June 2020; IEEE: New York, NY, USA, 2020; pp. 11037–11045. [Google Scholar] [CrossRef]
  50. Liang, M.; Yang, B.; Chen, Y.; Hu, R.; Urtasun, R. Multi-Task Multi-Sensor Fusion for 3D Object Detection. In Proceedings of the 2019 IEEE/CVF Conference on Computer Vision and Pattern Recognition (CVPR), Long Beach, CA, USA, 15–20 June 2019; IEEE: New York, NY, USA, 2019; pp. 7337–7345. [Google Scholar] [CrossRef]
  51. Lu, H.; Chen, X.; Zhang, G.; Zhou, Q.; Ma, Y.; Zhao, Y. SCANet: Spatial-Channel Attention Network for 3D Object Detection. In Proceedings of the ICASSP 2019-2019 IEEE International Conference on Acoustics, Speech and Signal Processing (ICASSP), Brighton, UK, 12–17 May 2019; IEEE: New York, NY, USA, 2019; pp. 1992–1996. [Google Scholar]
  52. Zeng, Y.; Hu, Y.; Liu, S.; Ye, J.; Han, Y.; Li, X.; Sun, N. RT3D: Real-Time 3-D Vehicle Detection in LiDAR Point Cloud for Autonomous Driving. IEEE Robot. Autom. Lett. 2018, 3, 3434–3440. [Google Scholar] [CrossRef]
  53. Zhao, X.; Liu, Z.; Hu, R.; Huang, K. 3D Object Detection Using Scale Invariant and Feature Reweighting Networks. In Proceedings of the AAAI Conference on Artificial Intelligence, Honolulu, HI, USA, 27 January–1 February 2019; Volume 33, pp. 9267–9274. [Google Scholar]
  54. Shin, K.; Kwon, Y.P.; Tomizuka, M. Roarnet: A Robust 3d Object Detection Based on Region Approximation Refinement. In Proceedings of the 2019 IEEE intelligent vehicles symposium (IV), Paris, France, 9–12 June 2019; IEEE: New York, NY, USA, 2019; pp. 2510–2515. [Google Scholar]
  55. Wang, H.; Xu, T.; Liu, Q.; Lian, D.; Chen, E.; Du, D.; Wu, H.; Su, W. MCNE: An End-to-End Framework for Learning Multiple Conditional Network Representations of Social Network. In Proceedings of the 25th ACM SIGKDD International Conference on Knowledge Discovery & Data Mining, Anchorage, AK, USA, 4–8 August 2019; ACM: New York, NY, USA, 2019; pp. 1064–1072. [Google Scholar] [CrossRef]
  56. Lehner, J.; Mitterecker, A.; Adler, T.; Hofmarcher, M.; Nessler, B.; Hochreiter, S. Patch Refinement—Localized 3D Object Detection. arXiv 2019, arXiv:1910.04093. [Google Scholar]
  57. Yang, B.; Luo, W.; Urtasun, R. PIXOR: Real-Time 3D Object Detection from Point Clouds. In Proceedings of the 2018 IEEE/CVF Conference on Computer Vision and Pattern Recognition, Salt Lake City, UT, USA, 18–23 June 2018; IEEE: New York, NY, USA, 2018; pp. 7652–7660. [Google Scholar] [CrossRef]
  58. Beltrán, J.; Guindel, C.; Moreno, F.M.; Cruzado, D.; Garcia, F.; De La Escalera, A. Birdnet: A 3d Object Detection Framework from Lidar Information. In Proceedings of the 2018 21st International Conference on Intelligent Transportation Systems (ITSC), Maui, HI, USA, 4–7 November 2018; IEEE: New York, NY, USA, 2018; pp. 3517–3523. [Google Scholar]
  59. Yan, Y.; Mao, Y.; Li, B. Second: Sparsely Embedded Convolutional Detection. Sensors 2018, 18, 3337. [Google Scholar] [CrossRef]
  60. Dimitrov, A.; Golparvar-Fard, M. Vision-Based Material Recognition for Automated Monitoring of Construction Progress and Generating Building Information Modeling from Unordered Site Image Collections. Adv. Eng. Inform. 2014, 28, 37–49. [Google Scholar] [CrossRef]
  61. Lu, Q.; Lee, S.; Chen, L. Image-Driven Fuzzy-Based System to Construct as-Is IFC BIM Objects. Autom. Constr. 2018, 92, 68–87. [Google Scholar] [CrossRef]
  62. Olgun, N.; Türkoğlu, İ. Defining Materials Using Laser Signals from Long Distance via Deep Learning. Ain Shams Eng. J. 2022, 13, 101603. [Google Scholar] [CrossRef]
  63. Erickson, Z.; Luskey, N.; Chernova, S.; Kemp, C.C. Classification of Household Materials via Spectroscopy. IEEE Robot. Autom. Lett. 2019, 4, 700–707. [Google Scholar] [CrossRef]
  64. Schwab, J.; Wachinger, J.; Munana, R.; Nabiryo, M.; Sekitoleko, I.; Cazier, J.; Ingenhoff, R.; Favaretti, C.; Subramonia Pillai, V.; Weswa, I.; et al. Design Research to Embed mHealth into a Community-Led Blood Pressure Management System in Uganda: Protocol for a Mixed Methods Study. JMIR Res. Protoc. 2023, 12, e46614. [Google Scholar] [CrossRef]
  65. Son, H.; Kim, C.; Hwang, N.; Kim, C.; Kang, Y. Classification of Major Construction Materials in Construction Environments Using Ensemble Classifiers. Adv. Eng. Inform. 2014, 28, 1–10. [Google Scholar] [CrossRef]
  66. Yu, Z.; Sadati, S.H.; Perera, S.; Hauser, H.; Childs, P.R.; Nanayakkara, T. Tapered Whisker Reservoir Computing for Real-Time Terrain Identification-Based Navigation. Sci. Rep. 2023, 13, 5213. [Google Scholar] [CrossRef] [PubMed]
  67. Bell, S.; Upchurch, P.; Snavely, N.; Bala, K. OpenSurfaces: A Richly Annotated Catalog of Surface Appearance. ACM Trans. Graph. 2013, 32, 1–17. [Google Scholar] [CrossRef]
  68. Yu, Z.; Childs, P.R.; Ge, Y.; Nanayakkara, T. Whisker Sensor for Robot Environments Perception: A Review. IEEE Sens. J. 2024, 24, 28504–28521. [Google Scholar] [CrossRef]
  69. Abeid Neto, J.; Arditi, D.; Evens, M.W. Using Colors to Detect Structural Components in Digital Pictures. Comput.-Aided Civ. Infrastruct. Eng. 2002, 17, 61–67. [Google Scholar] [CrossRef]
  70. Han, K.K.; Golparvar-Fard, M. Appearance-Based Material Classification for Monitoring of Operation-Level Construction Progress Using 4D BIM and Site Photologs. Autom. Constr. 2015, 53, 44–57. [Google Scholar] [CrossRef]
  71. Yuan, L.; Guo, J.; Wang, Q. Automatic Classification of Common Building Materials from 3D Terrestrial Laser Scan Data. Autom. Constr. 2020, 110, 103017. [Google Scholar] [CrossRef]
  72. Zhu, Z.; Brilakis, I. Parameter Optimization for Automated Concrete Detection in Image Data. Autom. Constr. 2010, 19, 944–953. [Google Scholar] [CrossRef]
  73. Han, Y.; Salido-Monzú, D.; Butt, J.A.; Schweizer, S.; Wieser, A. A Feature Selection Method for Multimodal Multispectral LiDAR Sensing. ISPRS J. Photogramm. Remote Sens. 2024, 212, 42–57. [Google Scholar] [CrossRef]
  74. Lee, S.; Kim, J.; Lim, H.; Ahn, S.C. Surface Reflectance Estimation and Segmentation from Single Depth Image of ToF Camera. Signal Process. Image Commun. 2016, 47, 452–462. [Google Scholar] [CrossRef]
  75. Jamali, N.; Sammut, C. Majority Voting: Material Classification by Tactile Sensing Using Surface Texture. IEEE Trans. Robot. 2011, 27, 508–521. [Google Scholar] [CrossRef]
  76. Romano, J.M.; Kuchenbecker, K.J. Methods for Robotic Tool-Mediated Haptic Surface Recognition. In Proceedings of the 2014 IEEE Haptics Symposium (HAPTICS), Houston, TX, USA, 24–27 February 2014; IEEE: New York, NY, USA, 2014; pp. 49–56. [Google Scholar] [CrossRef]
  77. Oddo, C.M.; Beccai, L.; Wessberg, J.; Wasling, H.B.; Mattioli, F.; Carrozza, M.C. Roughness Encoding in Human and Biomimetic Artificial Touch: Spatiotemporal Frequency Modulation and Structural Anisotropy of Fingerprints. Sensors 2011, 11, 5596–5615. [Google Scholar] [CrossRef]
  78. Strese, M.; Schuwerk, C.; Iepure, A.; Steinbach, E. Multimodal Feature-Based Surface Material Classification. IEEE Trans. Haptics 2017, 10, 226–239. [Google Scholar] [CrossRef]
  79. Takamuku, S.; Gomez, G.; Hosoda, K.; Pfeifer, R. Haptic Discrimination of Material Properties by a Robotic Hand. In Proceedings of the 2007 IEEE 6th International Conference on Development and Learning, London, UK, 1–13 July 2007; pp. 1–6. [Google Scholar] [CrossRef]
  80. Yu, Z.; Sadati, S.H.; Hauser, H.; Childs, P.R.; Nanayakkara, T. A Semi-Supervised Reservoir Computing System Based on Tapered Whisker for Mobile Robot Terrain Identification and Roughness Estimation. IEEE Robot. Autom. Lett. 2022, 7, 5655–5662. [Google Scholar] [CrossRef]
  81. Penumuru, D.P.; Muthuswamy, S.; Karumbu, P. Identification and Classification of Materials Using Machine Vision and Machine Learning in the Context of Industry 4.0. J. Intell. Manuf. 2020, 31, 1229–1241. [Google Scholar] [CrossRef]
  82. Rahman, K.; Ghani, A.; Alzahrani, A.; Tariq, M.U.; Rahman, A.U. Pre-trained model-based NFR classification: Overcoming limited data challenges. IEEE Access 2023, 11, 81787–81802. [Google Scholar] [CrossRef]
  83. Bian, P.; Li, W.; Jin, Y.; Zhi, R. Ensemble Feature Learning for Material Recognition with Convolutional Neural Networks. EURASIP J. Image Video Process. 2018, 2018, 64. [Google Scholar] [CrossRef]
  84. Bell, S.; Upchurch, P.; Snavely, N.; Bala, K. Material Recognition in the Wild with the Materials in Context Database. In Proceedings of the 2015 IEEE Conference on Computer Vision and Pattern Recognition (CVPR), Boston, MA, USA, 7–12 June 2015; IEEE: New York, NY, USA, 2015; pp. 3479–3487. [Google Scholar] [CrossRef]
  85. Erickson, Z.; Xing, E.; Srirangam, B.; Chernova, S.; Kemp, C.C. Multimodal Material Classification for Robots Using Spectroscopy and High Resolution Texture Imaging. In Proceedings of the 2020 IEEE/RSJ International Conference on Intelligent Robots and Systems (IROS), Las Vegas, NV, USA, 25–29 October 2020; IEEE: New York, NY, USA, 2020; pp. 10452–10459. [Google Scholar] [CrossRef]
  86. Simonyan, K.; Zisserman, A. Very Deep Convolutional Networks for Large-Scale Image Recognition. arXiv 2015, arXiv:1409.1556. [Google Scholar] [CrossRef]
  87. Mahami, H.; Ghassemi, N.; Darbandy, M.T.; Shoeibi, A.; Hussain, S.; Nasirzadeh, F.; Alizadehsani, R.; Nahavandi, D.; Khosravi, A.; Nahavandi, S. Material Recognition for Automated Progress Monitoring Using Deep Learning Methods. arXiv 2020, arXiv:2006.16344. [Google Scholar]
  88. Li, Y.; Upadhyay, U.; Slim, H.; Abdelreheem, A.; Prajapati, A.; Pothigara, S.; Wonka, P.; Elhoseiny, M. 3D CoMPaT: Composition of Materials on Parts of 3D Things. In Computer Vision—ECCV 2022; Avidan, S., Brostow, G., Cissé, M., Farinella, G.M., Hassner, T., Eds.; Lecture Notes in Computer Science; Springer Nature: Cham, Switzerland, 2022; Volume 13668, pp. 110–127. [Google Scholar] [CrossRef]
  89. Leung, T.; Malik, J. Representing and Recognizing the Visual Appearance of Materials Using Three-Dimensional Textons. Int. J. Comput. Vis. 2001, 43, 29–44. [Google Scholar] [CrossRef]
  90. Peng, T.; Zhang, Z.; Song, Y.; Chen, F.; Zeng, D. Portable System for Box Volume Measurement Based on Line-Structured Light Vision and Deep Learning. Sensors 2019, 19, 3921. [Google Scholar] [CrossRef]
  91. Baek, E.-T.; Yang, H.-J.; Kim, S.-H.; Lee, G.; Jeong, H. Distance Error Correction in Time-of-Flight Cameras Using Asynchronous Integration Time. Sensors 2020, 20, 1156. [Google Scholar] [CrossRef] [PubMed]
  92. Malik, A.; Mirdehghan, P.; Nousias, S.; Kutulakos, K.N.; Lindell, D.B. Transient Neural Radiance Fields for Lidar View Synthesis and 3D Reconstruction. In Proceedings of the Advances in Neural Information Processing Systems 36 (NeurIPS 2023), New Orleans, LA, USA, 10–16 December 2023; Volume 36, pp. 71569–71581. [Google Scholar]
  93. Li, G.; Li, K.; Zhang, G.; Zhu, Z.; Wang, P.; Wang, Z.; Fu, C. Enhanced Multi View 3D Reconstruction with Improved MVSNet. Sci. Rep. 2024, 14, 14106. [Google Scholar] [CrossRef]
  94. Shen, J.; Maier, D. A Methodology for Camera-Based Geometry Measurement During Freeform Bending with a Movable Die. Master’s Thesis, Technische Universität München, München, Germany, 2021. [Google Scholar]
  95. Dahnert, M.; Hou, J.; Nießner, M.; Dai, A. Panoptic 3D Scene Reconstruction From a Single RGB Image. arXiv 2022, arXiv:2111.02444. [Google Scholar] [CrossRef]
  96. Mengiste, E.; Mannem, K.R.; Prieto, S.A.; Garcia De Soto, B. Transfer-Learning and Texture Features for Recognition of the Conditions of Construction Materials with Small Data Sets. J. Comput. Civ. Eng. 2024, 38, 04023036. [Google Scholar] [CrossRef]
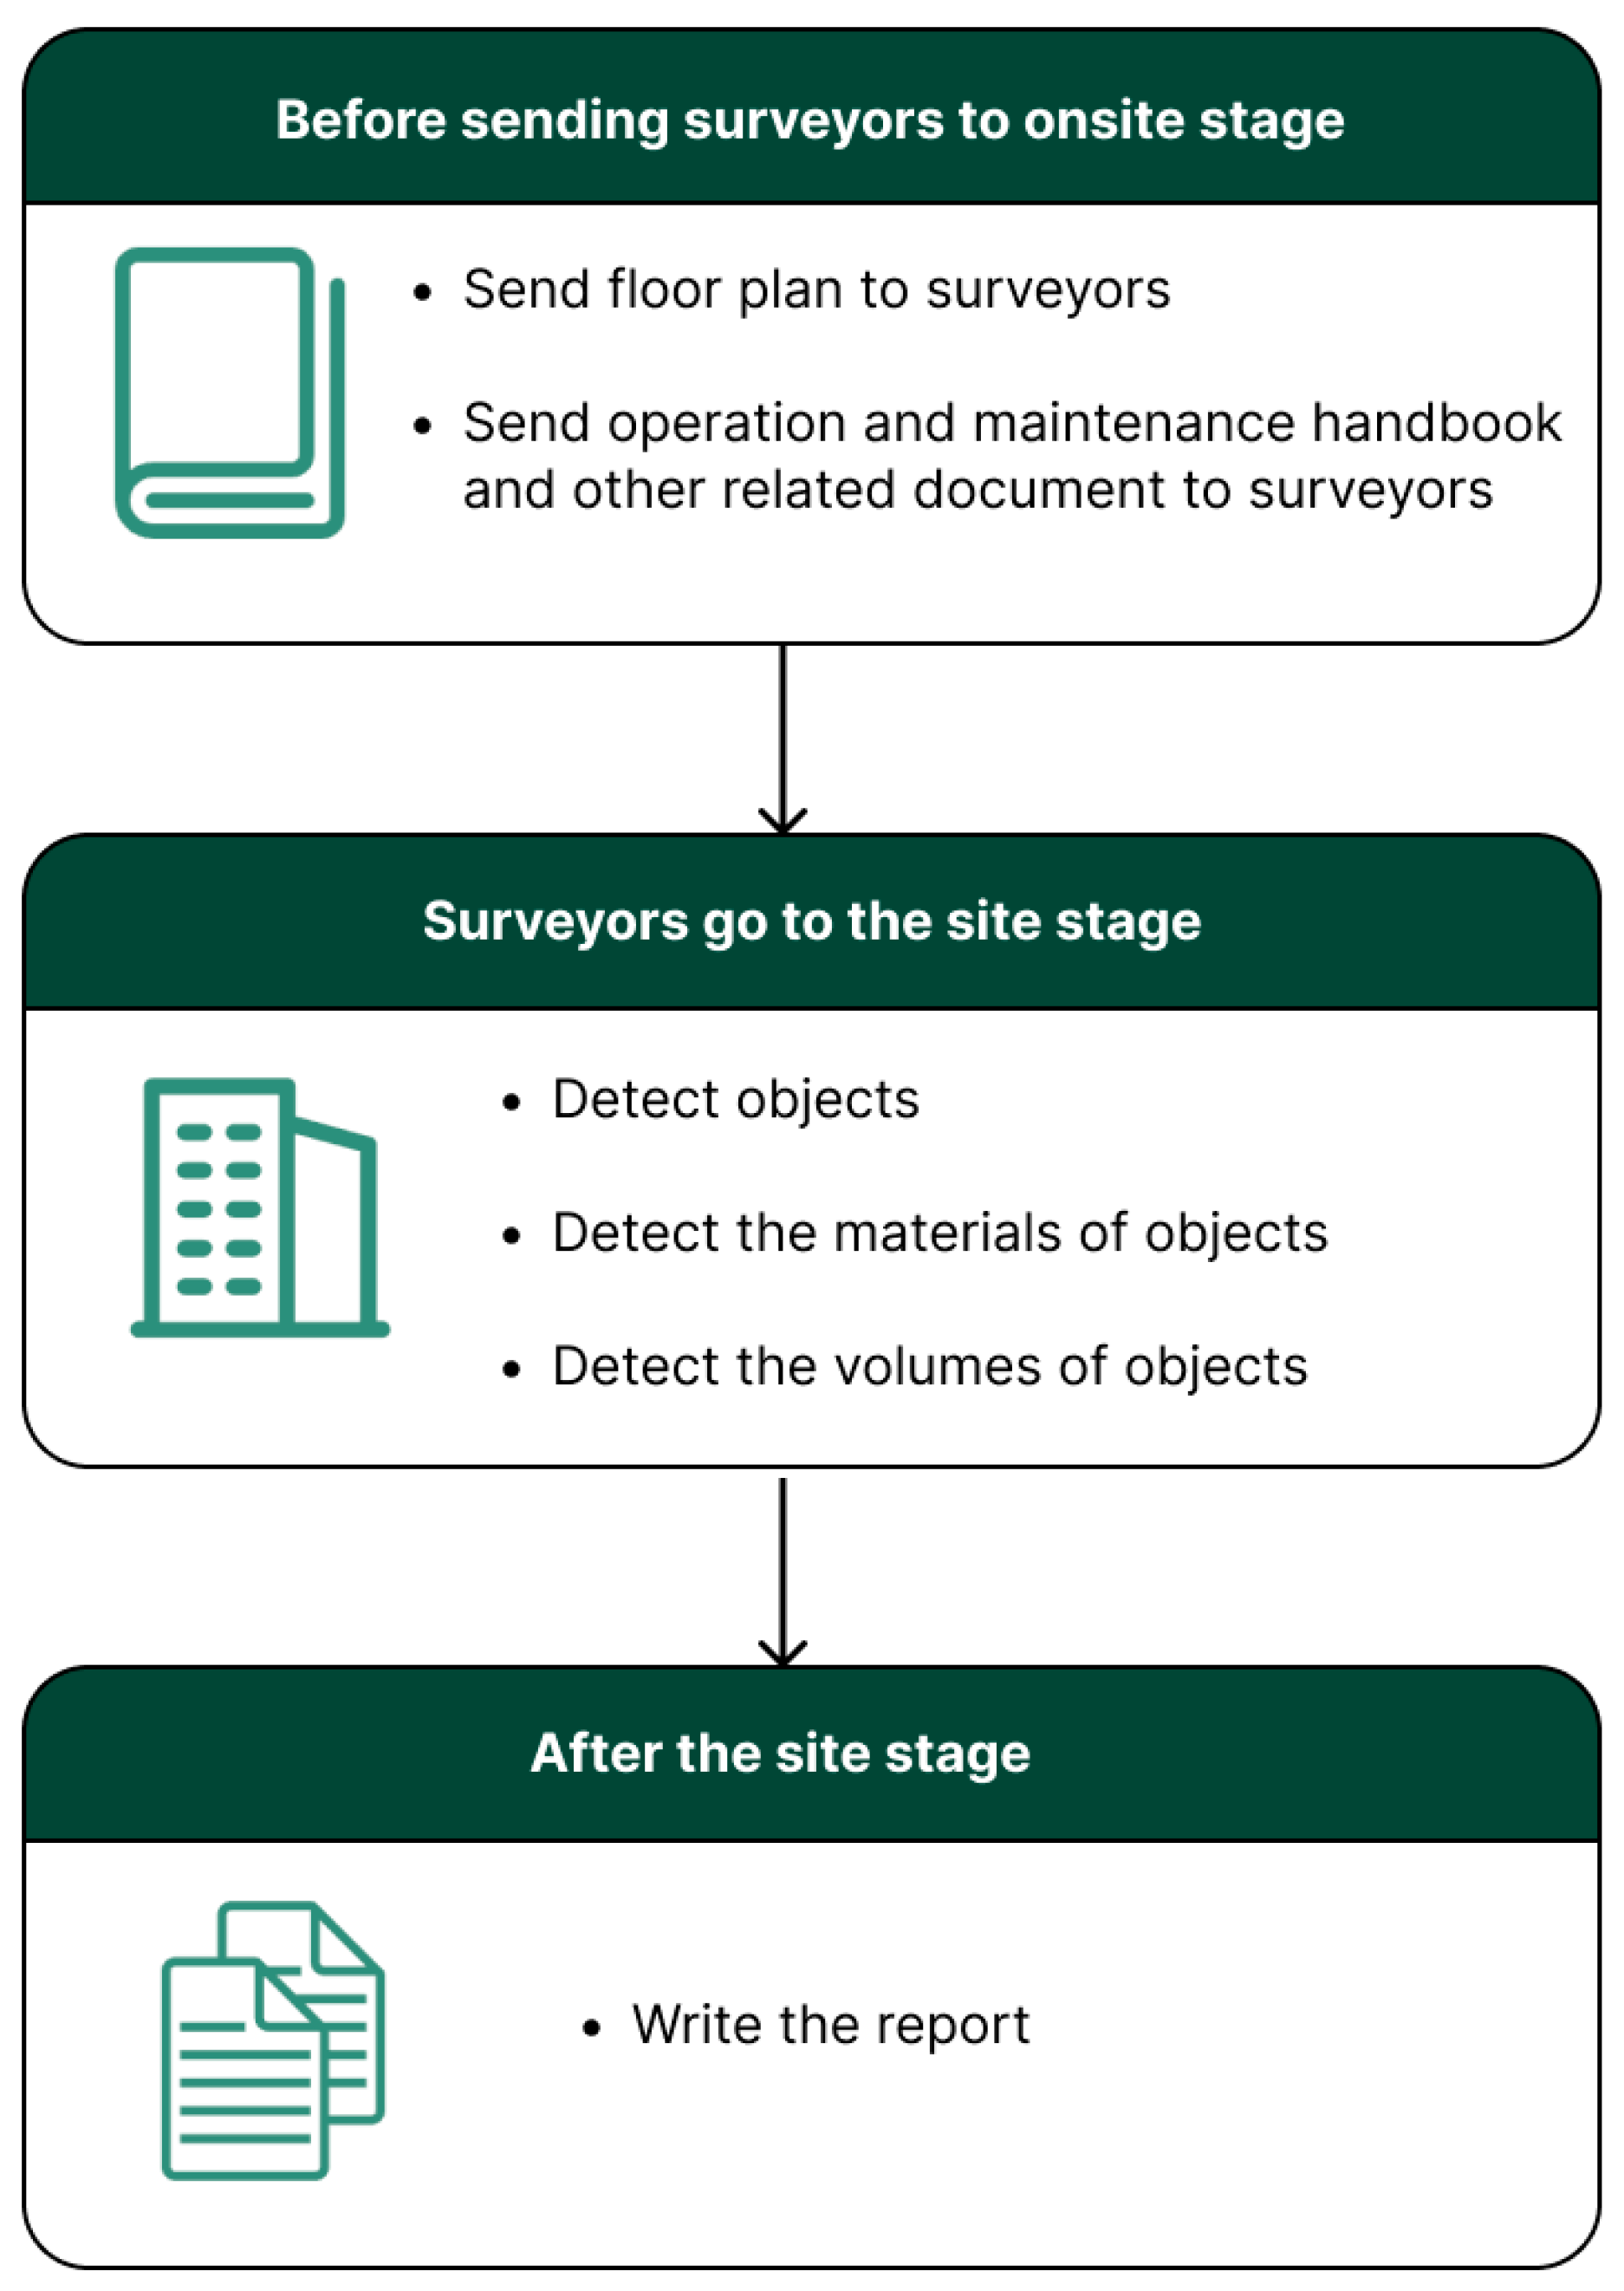
Figure 1. Stages and sub-stages of PRA/PDA.
Buildings 15 03448 g001
Figure 2. The flowchart of methodology.
Buildings 15 03448 g002
Figure 3. AI-based floor plan recognition and reconstruction processes. The AI-based floor plan recognition and reconstruction include five steps: sturtcure element detctionl, texts recognition, scale detection, symbol recognition, and post-processing. CNNs and Graphic-based models are mianlu used for structure element detection. Texts recognition relies on OCR, LSTM, and tranformer-based model. Scale detection is mainly related to feature-based alighment. Symbol recognition is mainly related to two algorithems (YOLO and R-CNN). Post-processing is based on graph optimisation and rule-based correction.
Buildings 15 03448 g003
Figure 4. The decision-making flowchart which displayed a structured approach to selecting appropriate AI methodologies for transforming 2D floor plans into 3D architectural models [24,33,34,36,37,38,40].
Buildings 15 03448 g004
Figure 5. Types of input data and algorithmic approaches used for object detection within PRA/PDA processes.
Buildings 15 03448 g005
Figure 6. An example of a point cloud for the interior of a building.
Buildings 15 03448 g006
Figure 7. The decision-making flowchart which displayed a structured approach to selecting appropriate AI methodologies for PRA/PDA-related object detection.
Buildings 15 03448 g007
Figure 8. Input data types of material detection in PRA/PDA.
Buildings 15 03448 g008
Figure 9. AI for PRA/PDA-related material detection.
Buildings 15 03448 g009
Figure 10. Visualization of the material that existing material detection methods have focused on.
Buildings 15 03448 g010
Figure 11. The decision-making flowchart which displayed a structured approach to selecting appropriate AI methodologies for PRA/PDA-related volume detection [90,91,92,93,94,95].
Buildings 15 03448 g011
Table 1. Paper published conduction on how AI can be used in sub-stages of PRA/PDA.
StagesSub-StagesKeywords for Searching *Finally Found Papers Numbers
Before sending surveyors to onsite stageSending the floor plan to surveyors
o
Floor plan
o
AI
o
Construction/Building/Retrofit/Demolition/PRA/PDA
15
Sending operation and maintenance handbook and other related document to surveyors
o
Operation and maintenance handbook
o
AI
o
Construction/Building/Retrofit/Demolition/PRA/PDA
0
Surveyors go to the site stageDetect objects
o
Object detection/Object identification/Detect object/Identify object
o
AI
o
Construction/Building/Retrofit/Demolition/PRA/PDA
0
Detect the materials of objects
o
Materials detection/Material identification/Detect material/Identify material
o
AI
o
Construction/Building/Retrofit/Demolition/PRA/PDA
19
Detect the volumes of objects
o
Volumes detection/Volumes calculation/Detect volumes/Calculate volumes
o
AI
o
Construction/Building/Retrofit/Demolition/PRA/PDA
6
After-site analysis stageWrite the report
o
Report writing
o
AI
o
Construction/Building/Retrofit/Demolition/PRA/PDA
0
* For the substages which have more than one keywords, the keywords connected with “&”.
Disclaimer/Publisher’s Note: The statements, opinions and data contained in all publications are solely those of the individual author(s) and contributor(s) and not of MDPI and/or the editor(s). MDPI and/or the editor(s) disclaim responsibility for any injury to people or property resulting from any ideas, methods, instructions or products referred to in the content.