Article

Construction Safety Management: Based on the Theoretical Approach of BIM and the Technology Acceptance Model

1
School of Civil Engineering, Zhengzhou University, 100 Science Avenue, Zhengzhou 450001, China
2
College of Civil and Transportation Engineering, Shenzhen University, Shenzhen 518061, China
*
Author to whom correspondence should be addressed.
Buildings 2025, 15(19), 3444; https://doi.org/10.3390/buildings15193444
Submission received: 22 June 2025 / Revised: 1 September 2025 / Accepted: 18 September 2025 / Published: 23 September 2025

Abstract

The construction industry in Pakistan faces persistent challenges due to uncertainties such as behavioral intention, risk identification, and stakeholder perception, which often lead to significant losses in construction activities and human resources. This study aims to quantitatively evaluate these critical factors within the theoretical framework of Building Information Modeling (BIM) and the Technology Acceptance Model (TAM). Specifically, key constructs—Behavioral Intention (BI), Hazard Identification (HI), and Stakeholder Perception (SP)—are analyzed to assess their influence on construction safety management practices. A structured questionnaire was distributed electronically to construction professionals across various ongoing projects in Pakistan. The questionnaire items were based on a five-point Likert scale, and reliability was confirmed with high Cronbach’s alpha values for BI (0.82), HI (0.92), and SP (0.91). To evaluate the relationships between constructs, descriptive statistics and multiple regression analysis were employed. The regression results showed strong model fit for BI and HI (R2 = 0.945), and near-perfect fit for SP (R2 = 0.998), demonstrating robust predictive power. Significant correlations were found among independent variables such as Perceived Usefulness (PU), Perceived Ease of Use (PEOU), Attitude Toward Use (ATU), and others. This study further identifies Trust (TR) and Organizational Culture (OC) as critical predictors of stakeholder perception in the BIM context. A conceptual framework was developed incorporating statistical parameters (e.g., p-values, R2, t-stats) to categorize the effectiveness of BIM and TAM theoretical integration for safety risk management. This approach is novel in its use of TAM-based constructs to evaluate BIM-related safety outcomes in the Pakistani construction sector—a context where such empirical evidence is limited. The findings provide predictive insights into how behavioral, perceptual, and organizational variables influence construction safety performance, offering practical implications for BIM adoption and safety policy design.

1. Introduction

The construction industry continues to face critical safety challenges, with high accident rates, fatalities, and low compliance with safety standards affecting both project performance and worker well-being [1,2,3,4,5]. Key challenges include inadequate safety management practices, insufficient training, weak safety culture, and limited hazard awareness among workers and management [1,2,3,5,6]. Technical inefficiencies, poor resource allocation, and lack of supervision further exacerbate safety risks, particularly in regions with low enforcement or uneven adherence to regulations [4,5]. Specialized operations, such as crane handling and subway construction, present additional high-risk scenarios due to operator errors, mechanical failures, and complex environmental conditions [7,8]. Emerging technologies, including Cyber-Physical Systems and AI-based safety tools, introduce both opportunities and new risks, requiring skilled management, reliable data, and robust system design to prevent accidents [9,10,11,12]. Environmental and operational pressures, such as cost and time constraints, often lead to the deprioritization of safety, resulting in unsafe work practices, underreporting of incidents, and insufficient implementation of preventive measures [3,6,13]. Overall, construction safety challenges are multifactorial, encompassing human, organizational, technical, and environmental factors that demand integrated, proactive, and data-informed interventions. These problems are often rooted in factors such as inconsistent stakeholder engagement, inadequate risk identification [5,14,15,16], and behavioral reluctance [17,18,19] towards the adoption of an advanced approach of safety-enhancing technologies.
Construction sites remain one of the most hazardous workplaces globally, with high rates of accidents, injuries, and fatalities. Despite the development of various safety protocols and standards, the dynamic and complex nature of construction environments continues to challenge traditional safety management practices [20]. In response, the integration of digital technologies, particularly Building Information Modeling (BIM), has emerged as a transformative approach for improving safety outcomes in construction projects. BIM enables the creation of intelligent, data-rich 3D models that support visualization, simulation, and real-time coordination across project stakeholders. Its capabilities have shown particular promise in pre-construction safety planning, hazard identification, clash detection, and worker training through virtual reality (VR) and augmented reality (AR) platforms [21].
The motivation of our research study is a critical need to address these persistent issues by providing a quantitative and systematic understanding of how Behavioral Intention (BI), Hazard Identification (HI), and Stakeholder Perception (SP) influence safety outcomes in BIM-supported concepts [22,23]. By integrating the theoretical approach of the Technology Acceptance Model (TAM) with BIM, this study aims to bridge the gap between theoretical constructs and practical applications in construction safety management based on the design questionnaire format. The novelty lies in contextualizing these models within the socio-technical landscape of Pakistan’s construction sector, where empirical evidence remains scarce. Ultimately, the research aspires to offer actionable insights that can guide stakeholders, policymakers, and industry professionals in fostering a culture of safety, enhancing user acceptance of digital technologies, and improving overall project outcomes.
Construction safety remains a major concern worldwide, particularly in developing countries like Pakistan, where high accident rates persist due to insufficient enforcement, limited trained personnel, and outdated planning methods. Traditional approaches relying on static data, and 2D drawings often fail to capture site-specific temporal and spatial hazards [24,25]. Innovations such as 4D modeling, BIM, GIS, and UAVs have shown potential in improving hazard identification, visualization, and proactive safety management [24,25,26]. Integrating safety into production processes through models like SPC further promotes worker participation and measurable safety performance [27]. Key challenges, including limited client awareness, inadequate safety competencies, and poor communication across project phases, continue to impede effective management [28]. In addition, human-related uncertainties such as employees’ behavioral intentions to implement safety practices [29,30], stakeholders’ risk perceptions [31], and conflicting communications further exacerbate existing safety gaps [32,33,34]. These challenges underscore the necessity of adopting a more systematic, evidence-driven, and theory-informed approach to safety management in construction projects. Addressing these issues through proactive planning, meaningful stakeholder engagement, and the integration of modern technologies is essential for strengthening construction safety in Pakistan.
Building Information Modeling (BIM) is a core digital technology in the construction industry that enables the creation and management of virtual representations of buildings, supporting improved design, collaboration, and project delivery [35,36]. Research on BIM spans conceptual frameworks, tool and standard development, integration with emerging technologies such as digital twins [37], and practical applications in urban renewal projects, demonstrating measurable achievements such as 15% increased efficiency, 30% fewer design changes, 25% reduced rework, two months saved, and 7.41% cost reduction in a renovation project [38]. Despite these benefits, adoption challenges persist, often linked to organizational, cultural, and technical barriers, which can be analyzed through the Technology Acceptance Model (TAM) and its extensions [39,40]. TAM-based studies reveal that Perceived Usefulness, Ease of Use, external pressures, and organizational support are critical factors influencing user acceptance, highlighting the need for continuous refinement of systems, supportive culture, and integration into broader technological ecosystems to fully capitalize on BIM’s potential [39,40].
The literature in this study reveals a variety of methods used to integrate survey data for construction project management to reduce risks, minimize costs, and other costs during the construction process. Traditional processes have been gradually supplemented or replaced by new techniques such as Building Information Modeling (BIM) and the Technology Acceptance Model (TAM). The summarized literature is seen in Table 1. This research highlights key issues, including problem statements, data collection methods, limitations of conventional approaches, and potential solutions for the efficient and effective design of construction projects [41,42,43,44,45,46,47,48,49,50,51].
This study aims to measure three key factors regarding construction activities—Behavioral Intention (BI), Hazard Identification (HI), and Stakeholder Perception (SP)—in a BIM-enhanced safety theoretical concept. Using a computational approach of multiple regression analysis, the purpose of this study is to examine the importance of these factors in influencing building safety outcomes. [52,53,54]. Additionally, the purpose is to develop a framework that uses statistical tools such as p-values and R-squared to evaluate the convergent validity and predictive validity of the collected data, and also provide a comprehensive, evidence-based, and informed assessment of safety in the construction industry.

2. Methodology

The methodological approach employed in this study integrates the theoretical approach of the Technology Acceptance Model (TAM) with Building Information Modeling (BIM) to evaluate the factors influencing the adoption of BIM-based safety management systems in the construction industry. A structured regression analysis was applied to examine the relationships among key TAM constructs, including Perceived Usefulness, Perceived Ease of Use, and Behavioral Intention. Before conducting the regression analysis, necessary diagnostic considerations were taken into account to ensure the analytical validity of the results. The data were reviewed to assess the normality of residuals, linearity between variables, and independence of observations. In addition, variance inflation factor (VIF) values were calculated to evaluate multicollinearity among independent variables, and results indicated acceptable levels, affirming the appropriateness of including all variables in the model. The regression analysis provided insight into the structural alignment of the TAM within the domain of BIM-based safety practices, revealing consistent patterns in user acceptance behavior that align with prior TAM-related research in technology-driven environments. Moreover, the data collection process targeted experienced professionals actively engaged in construction safety management and BIM implementation. This targeted sampling (n = 10) approach enhanced the relevance and reliability of the data by ensuring that respondents possessed the technical expertise and contextual awareness necessary to inform the research model. The findings provide theoretical and empirical evidence supporting the applicability of the TAM in explaining behavioral intentions related to BIM-enabled safety interventions in construction projects. The analytical framework and methodological execution, including verification of regression assumptions, contribute to the robustness of the results and demonstrate the potential for TAM-based modeling to guide future technology adoption strategies in the construction safety domain. The methodology of the research work is illustrated in the flow chart shown in Figure 1.
In this study, we use a quantitative research methodology based on Systems Theory and the Technology Acceptance Model (TAM) to examine the role of the Building Information Model (BIM) in improving building safety. This study aims to identify and evaluate the effects of three key factors, Behavioral Intention (BI), Hazard Identification (HI), and Stakeholder Perception (SP), on the safety performance of construction projects using BIM-based methods [55,56,57,58,59,60].
The theoretical framework includes Systems Theory, which views construction safety as the result of a complex socio-technological process involving interactions of people, technology, and organization. Furthermore, the Technology Acceptance Model (TAM) provides a unique approach to understanding the acceptance and use of BIM for sustainability projects, particularly through the constructs of Perceived Usefulness (PU), Perceived Ease of Use (PEOU), and their influence on Behavioral Intention (BI).
Primary data were collected through a structured questionnaire, distributed electronically to construction professionals involved in various ongoing projects across Pakistan. Respondents included project managers, engineers, construction managers, and site managers. The questionnaire consisted of items rated on a five-point Likert scale designed to measure the constructs of BI, HI, and SP based on the theoretical framework of Building Information Modeling (BIM) and the Technology Acceptance Model (TAM), as shown in Table 2, Table 3 and Table 4. The model of the questionnaire, including the equations applied for each construct (BI, HI, and SP), is provided in Appendix A, Appendix B and Appendix C (as seen in Table A1, Table A2 and Table A3). A total of ten responses were received, representing a diverse range of construction processes and activities. To ensure transparency and replicability, the actual questionnaire items distributed to stakeholders are included in the appendices.
Statistical analysis serves as a fundamental tool to support decision-making processes and address methodological uncertainties and associated risks in engineering and construction studies [61,62,63,64]. Although often applied to complex uncertainty quantification and risk assessment models, in this study, statistical analysis is applied in the context of regression-based assessment of structured survey data. The data, obtained through a systematically designed questionnaire distributed to technical staff at the facility level, was analyzed to identify trends, correlations, and weightings regarding recyclability and factors affecting construction materials. This analytical approach provides a quantitative basis for interpreting the experts’ responses and increases the credibility of the conclusions drawn from the empirical results.
To ensure the appropriateness and rigor of the methodological approach, linear multiple regression analysis was employed due to its suitability for analyzing the relationships among the latent variables: BI, HI, and SP. This method allows for the simultaneous evaluation of multiple relationships and provides a comprehensive understanding of the underlying constructs. Furthermore, the application of this method in the context of construction projects in Pakistan adds to its novelty, as limited empirical research exists employing such techniques in this regional and professional setting. This contributes to both the methodological and contextual uniqueness of the study.
The collected data were analyzed using statistical methods. Descriptive statistics were used to compare data distribution and identify trends. Reliability tests, especially Cronbach’s alpha, were performed to ensure the internal consistency of the research items. Multiple regression analysis was then used to determine the relationship between the independent variables (BI, HI, and SP) and the dependent variables, indicating the improvement in occupational safety resulting from the use of BIM, and the developed equations for all three key factors, Behavioral Intention (BI), Hazard Identification (HI), and Stakeholder Perception (SP), are shown in Equations (1)–(3). The analysis was performed with the significance level set at p < 0.05 to assess the significance of the data. In addition, several R-squared (R2) values were used to assess the predictive power of the regression model in explaining variation in safety outcomes.
B I = α 0 + α 1 P U + α 2 P E O U + α 3 A T U + ε
H I = β 0 + β 1 P U + β 2 P E O U + β 3 S A + ε
P U B I M = γ 0 + γ 1 P E + γ 2 P E O U + γ 3 E x p + γ 4 B A R R + γ 5 T R + γ 6 O C + ε
where the dependent variables are as follows: B I is Behavioral Intention, H I is Hazard Identification, and P U B I M is Perceived Usefulness of BIM for safety management and independent variables: P U is Perceived Usefulness of BIM, P E O U is Perceived Ease of Use, A T U is Attitudes Toward Use, S A is Safety Awareness, P E is Perceived Effectiveness, E x p is Stakeholder Knowledge of BIM (measured in years of knowledge or experience), B A R R is Barriers to BIM Adoption, T R is Training and Education, and O C is Organizational Culture. Also α , β , and γ are the coefficients of the corresponding independent variables of Equations (1)–(3), respectively.
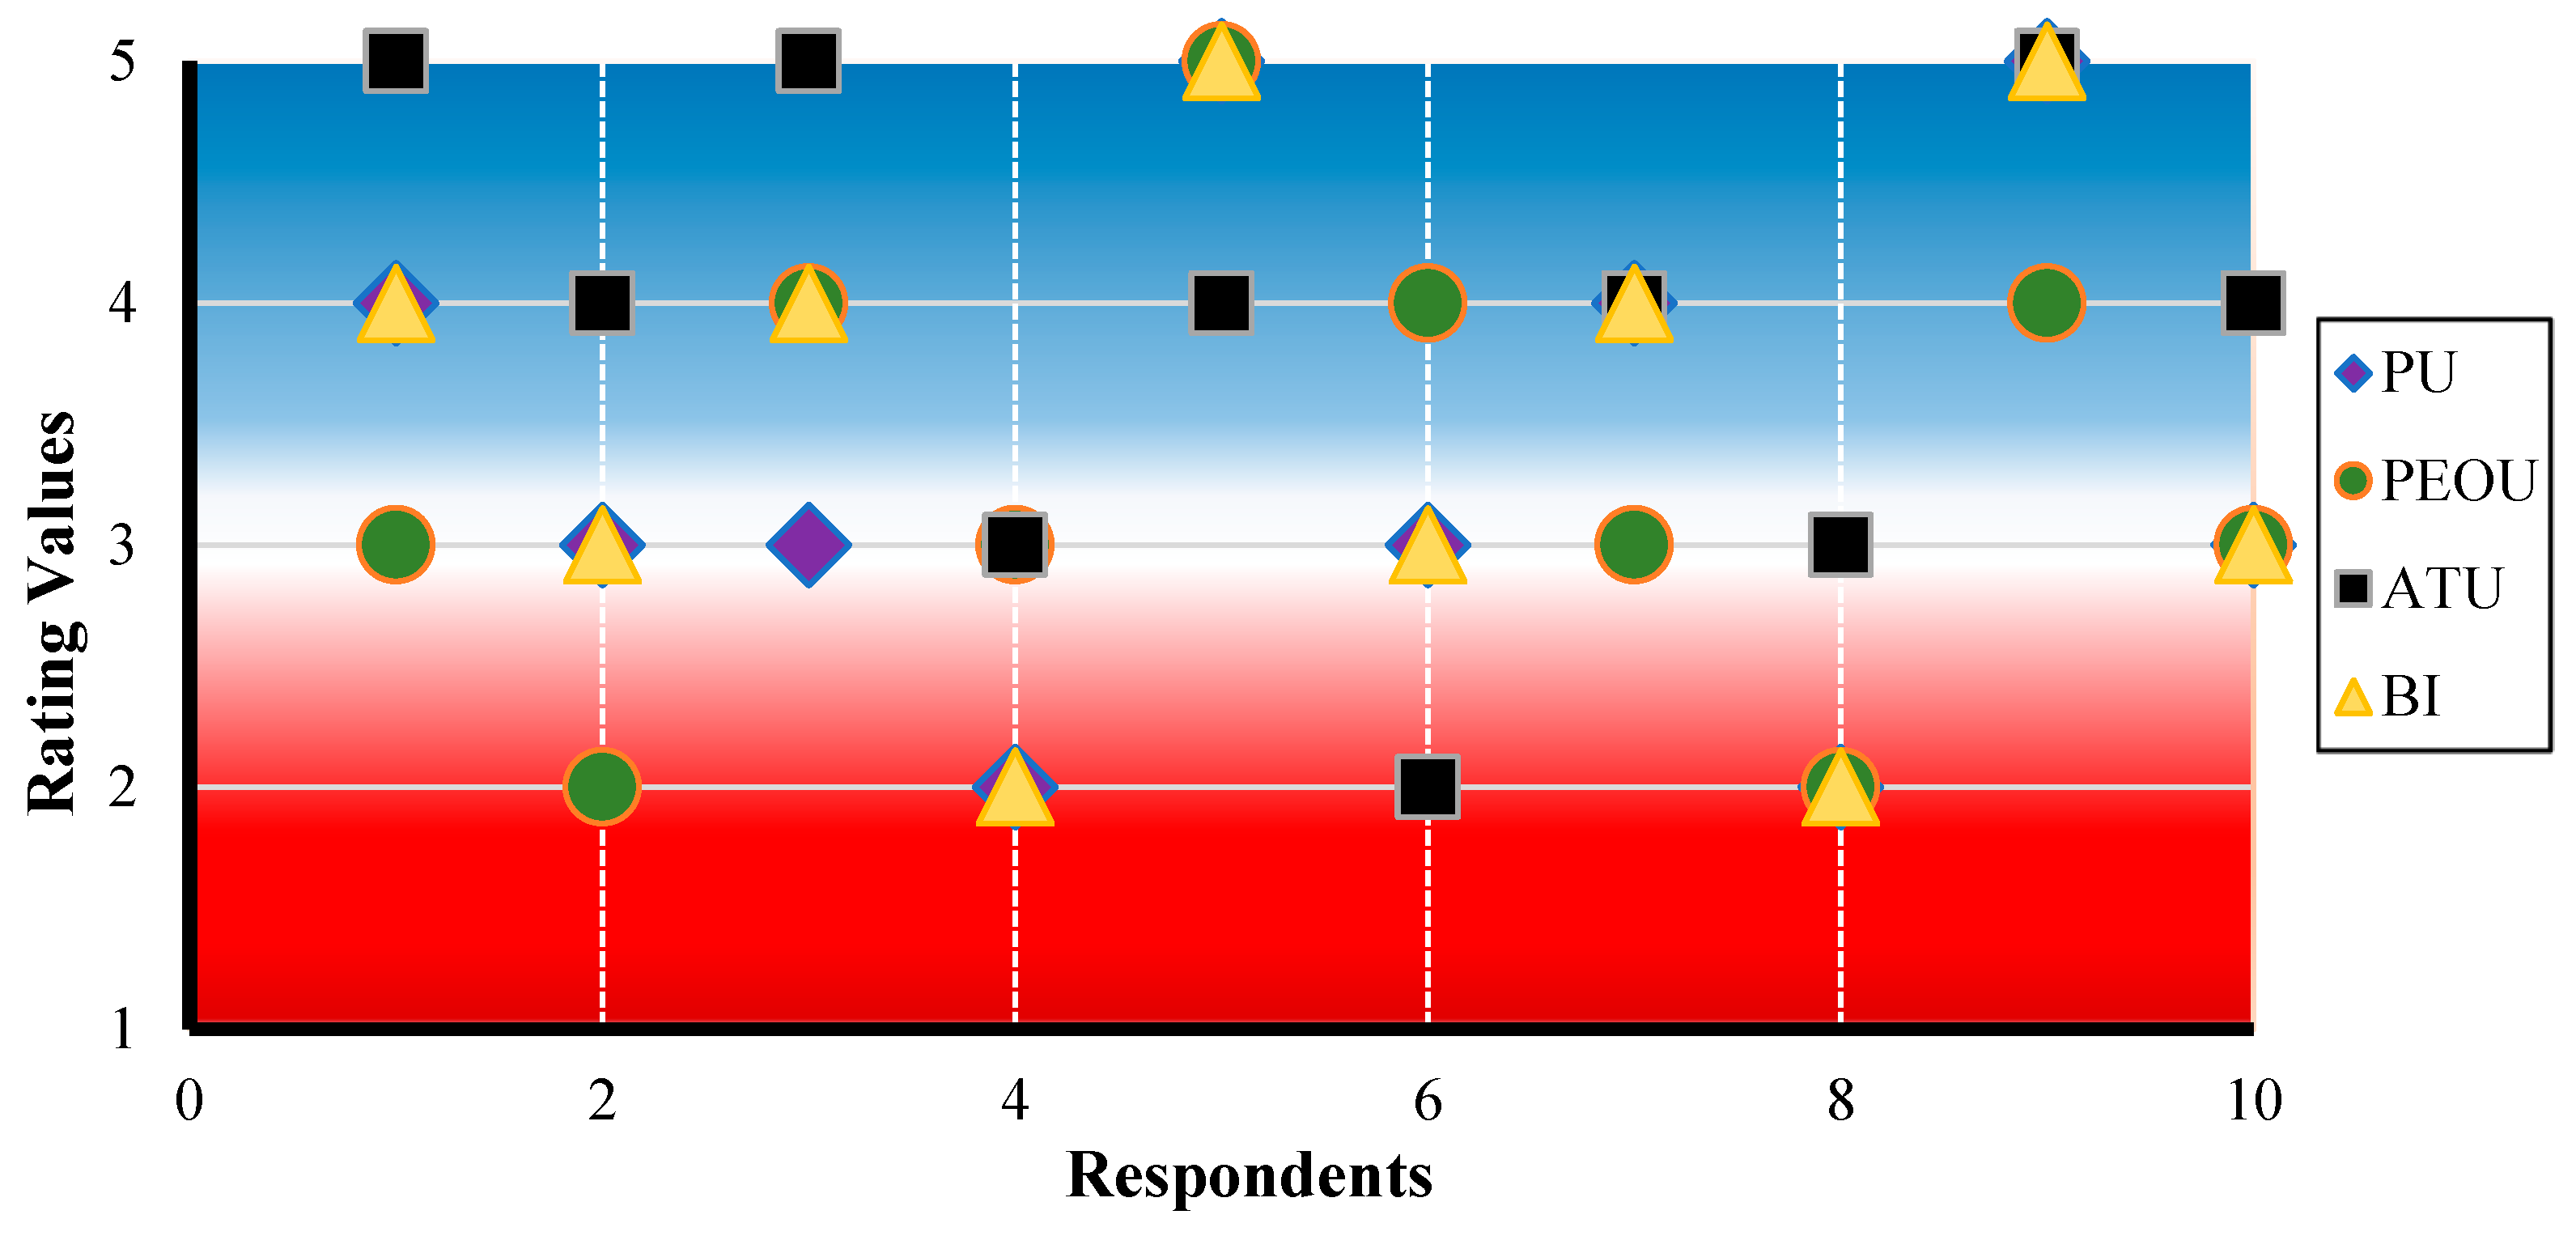
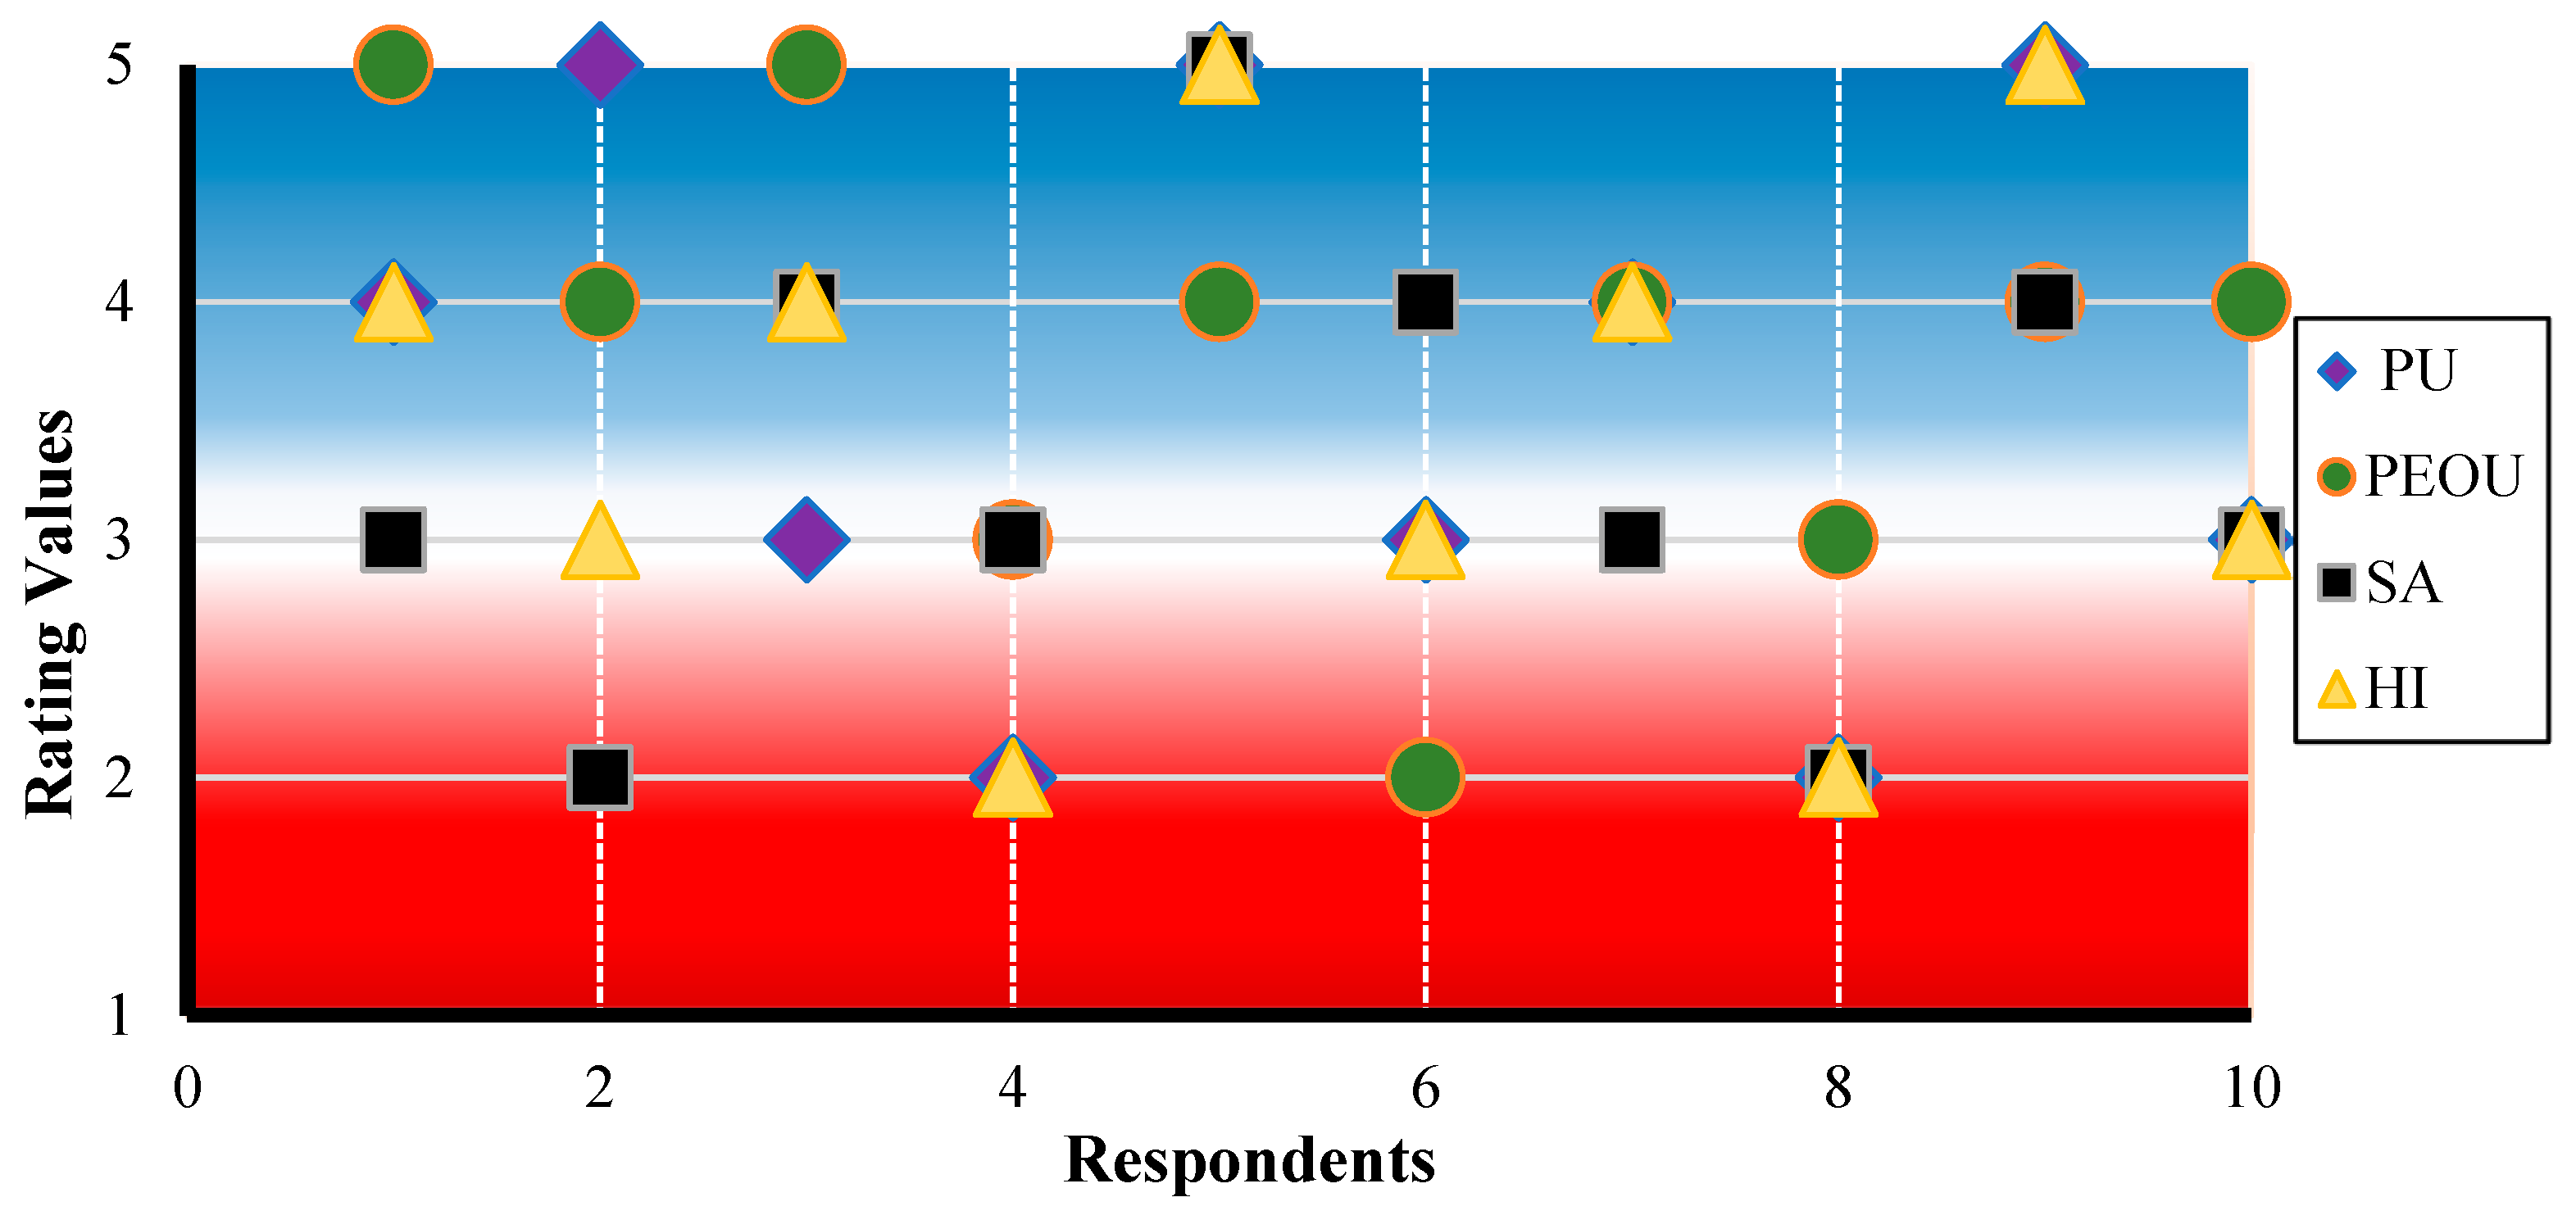
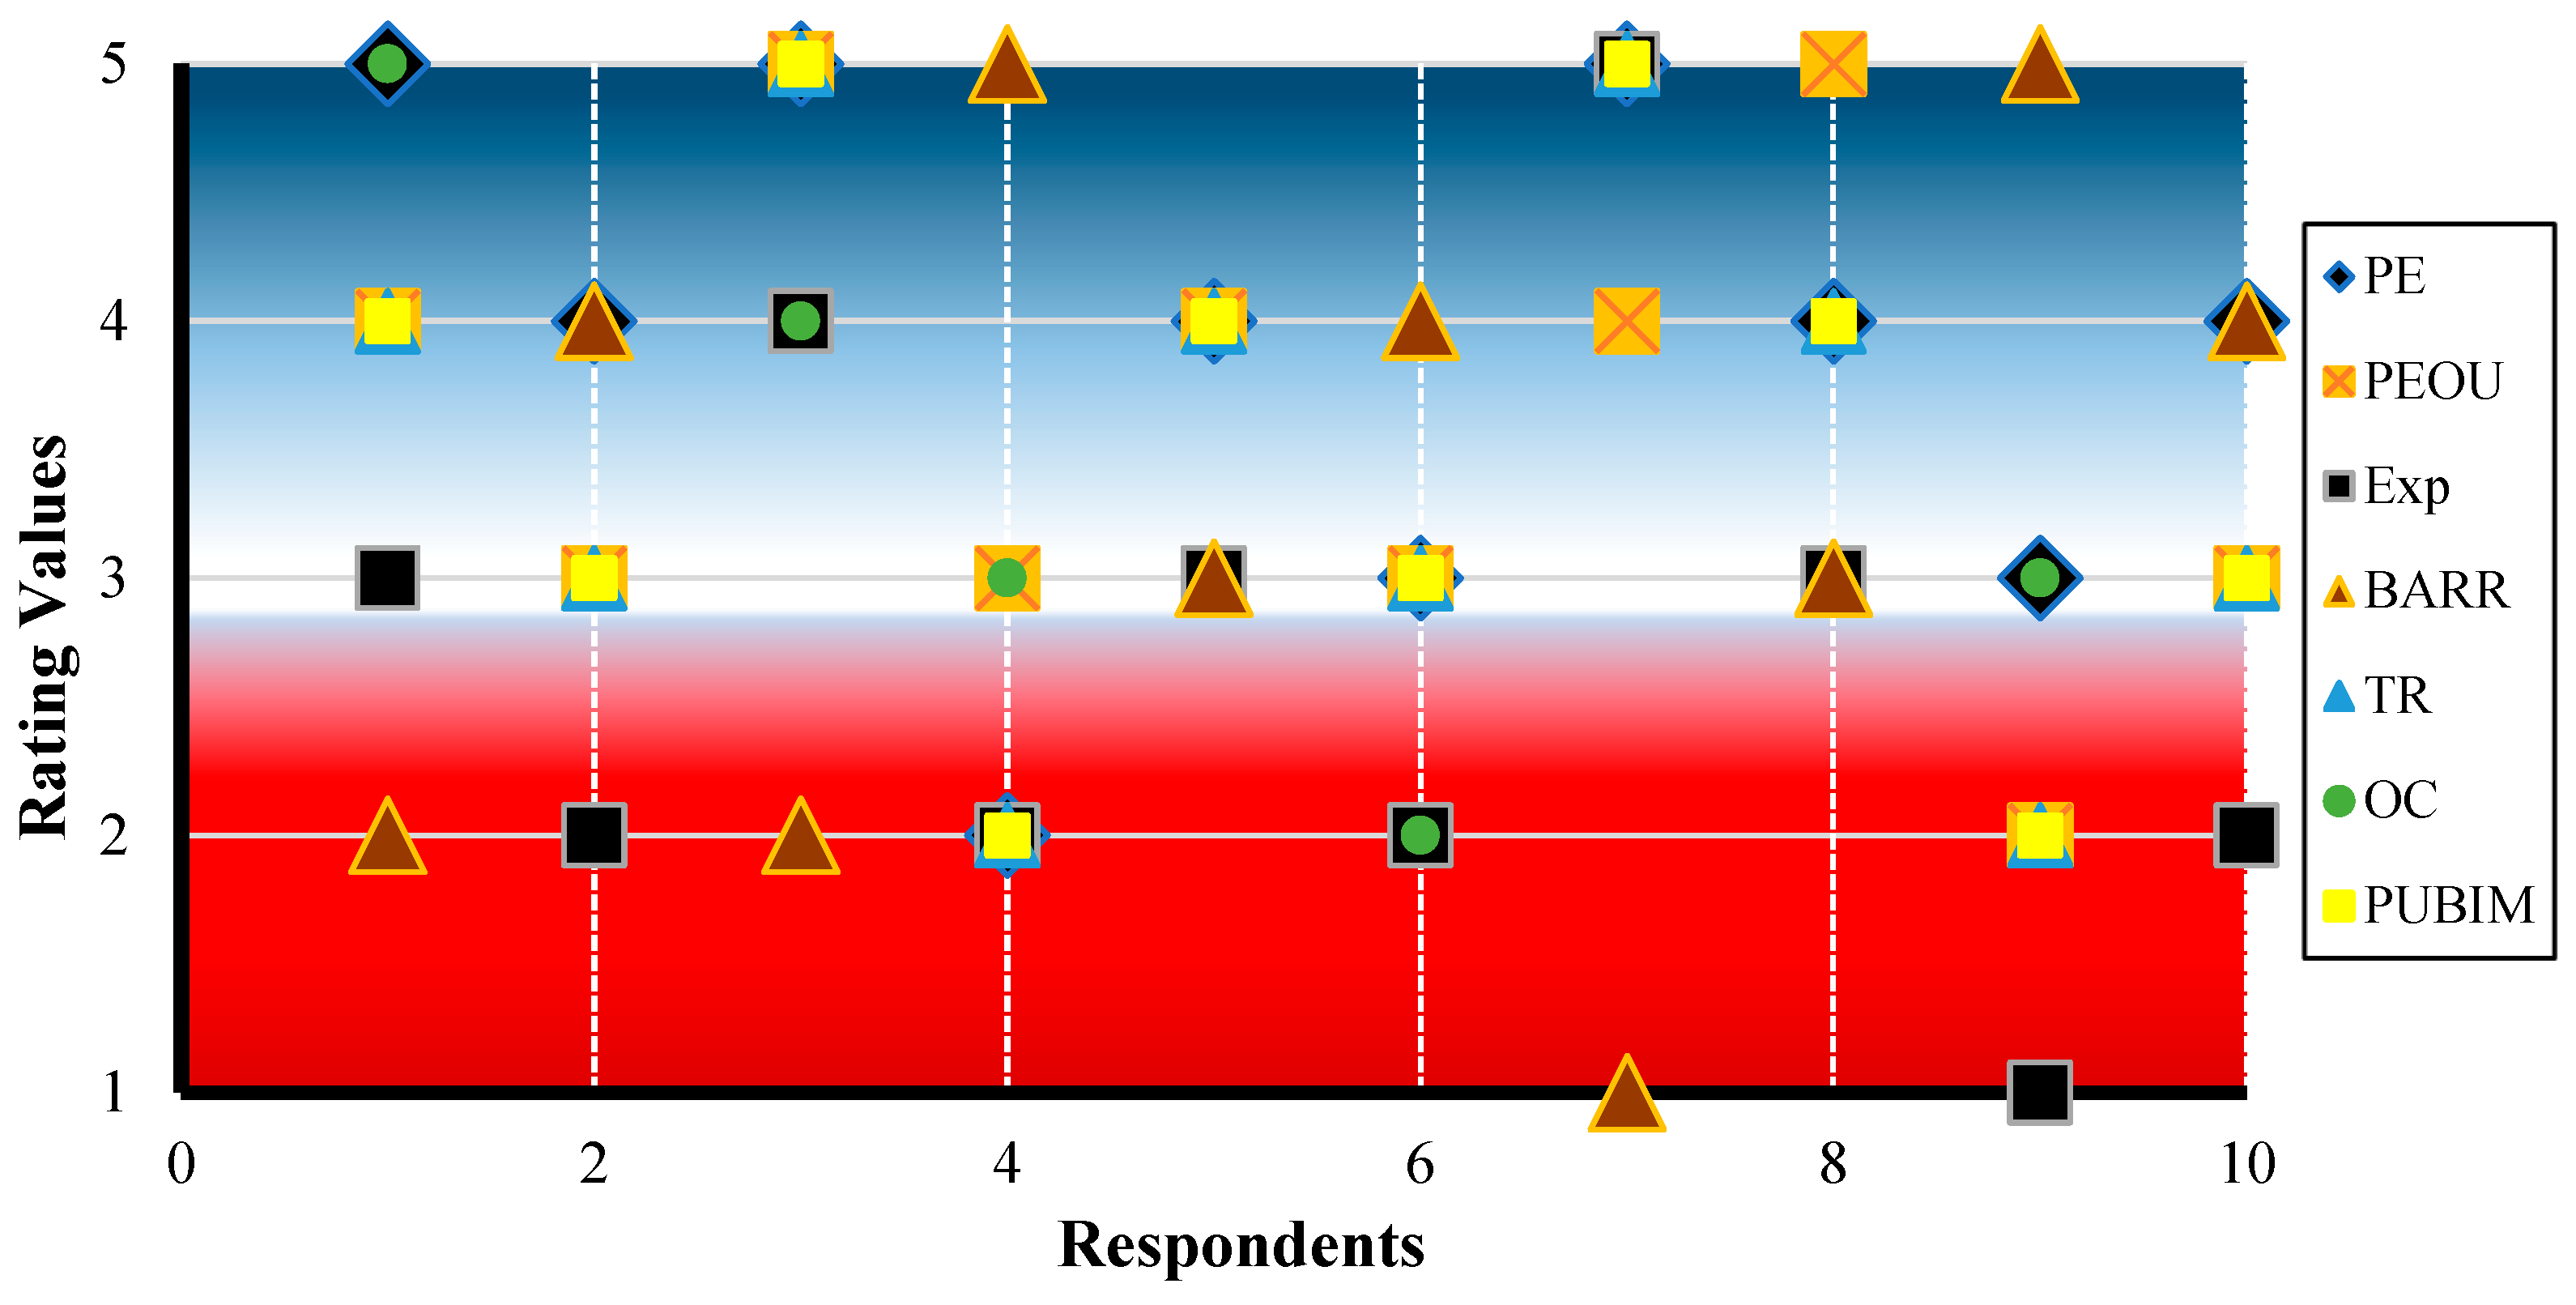
In the context of construction risk management, the integration of Building Information Modeling (BIM) with behavioral frameworks such as the Technology Acceptance Model (TAM) provides a structured approach to identifying and mitigating project uncertainties. This study employs a risk matrix developed (as seen in Figure 2, Figure 3 and Figure 4). Based on survey data of Behavioral Intention (BI), Hazard Identification (HI), and Stakeholder Perception (SP) collected from industry respondents actively involved in BIM-related construction projects with specified variable questions. The colors in the risk matrix represent different scores: blue represents strongly agree (score of 5), red represents strongly disagree (score of 1), and the white line in the center of the matrix represents a score of 3. All scores corresponding to each question are detailed as shown in Appendix A, Appendix B and Appendix C (as seen in Table A1, Table A2 and Table A3). The matrix assesses risks based on perceived likelihood and impact, enabling an intuitive and quantitative assessment of key risk factors. Based on the TAM, risk assessment reflects users’ perception of BIM practicality and ease of use, which influences their identification and prioritization of risks. By combining technical risk factors with behavioral acceptance dimensions, the matrix can serve as both a decision-making tool and a theoretical bridge between technology adoption and actual risk control in construction settings.
To ensure the validity and reliability of the collected questionnaire data shown in Table 2, Table 3 and Table 4 used in this study, Cronbach’s alpha coefficient was calculated for each of the constructs, including Behavioral Intention (BI), Hazard Identification (HI), and Stakeholder Perception (SP), as shown in Table 5. Cronbach’s alpha coefficient is a widely used method to assess the reliability of data, and the general equation of Cronbach’s alpha coefficient is shown in Equation (4).
α c = N N 1 1 σ I t e m 2 σ T o t a l 2
where α c is Cronbach’s alpha parameter, N is the number of variables used in the survey question, α I t e m is individual parameter variation, and α T o t a l is the summation of total parameter variation.
For the analysis of the Cronbach’s alpha parameter (α_c), it ranges from 0 to 1 values, with reliability comments according to [65]. A high alpha value indicates that all items of the construct have the same underlying factor, indicating internal consistency. In general, a Cronbach’s alpha coefficient above 0.70 is considered acceptable in research work, while a Cronbach’s alpha value above 0.80 indicates good reliability of the collective data, as we calculated in Table 5. The analysis conducted in this study resulted in a Cronbach’s alpha coefficient for the following variable, indicating that the survey instrument is reliable and suitable for further statistical analysis. The present study supports further empirical and analytical analysis by examining the relationship between BIM implementation and safety outcomes.

3. Results and Discussion

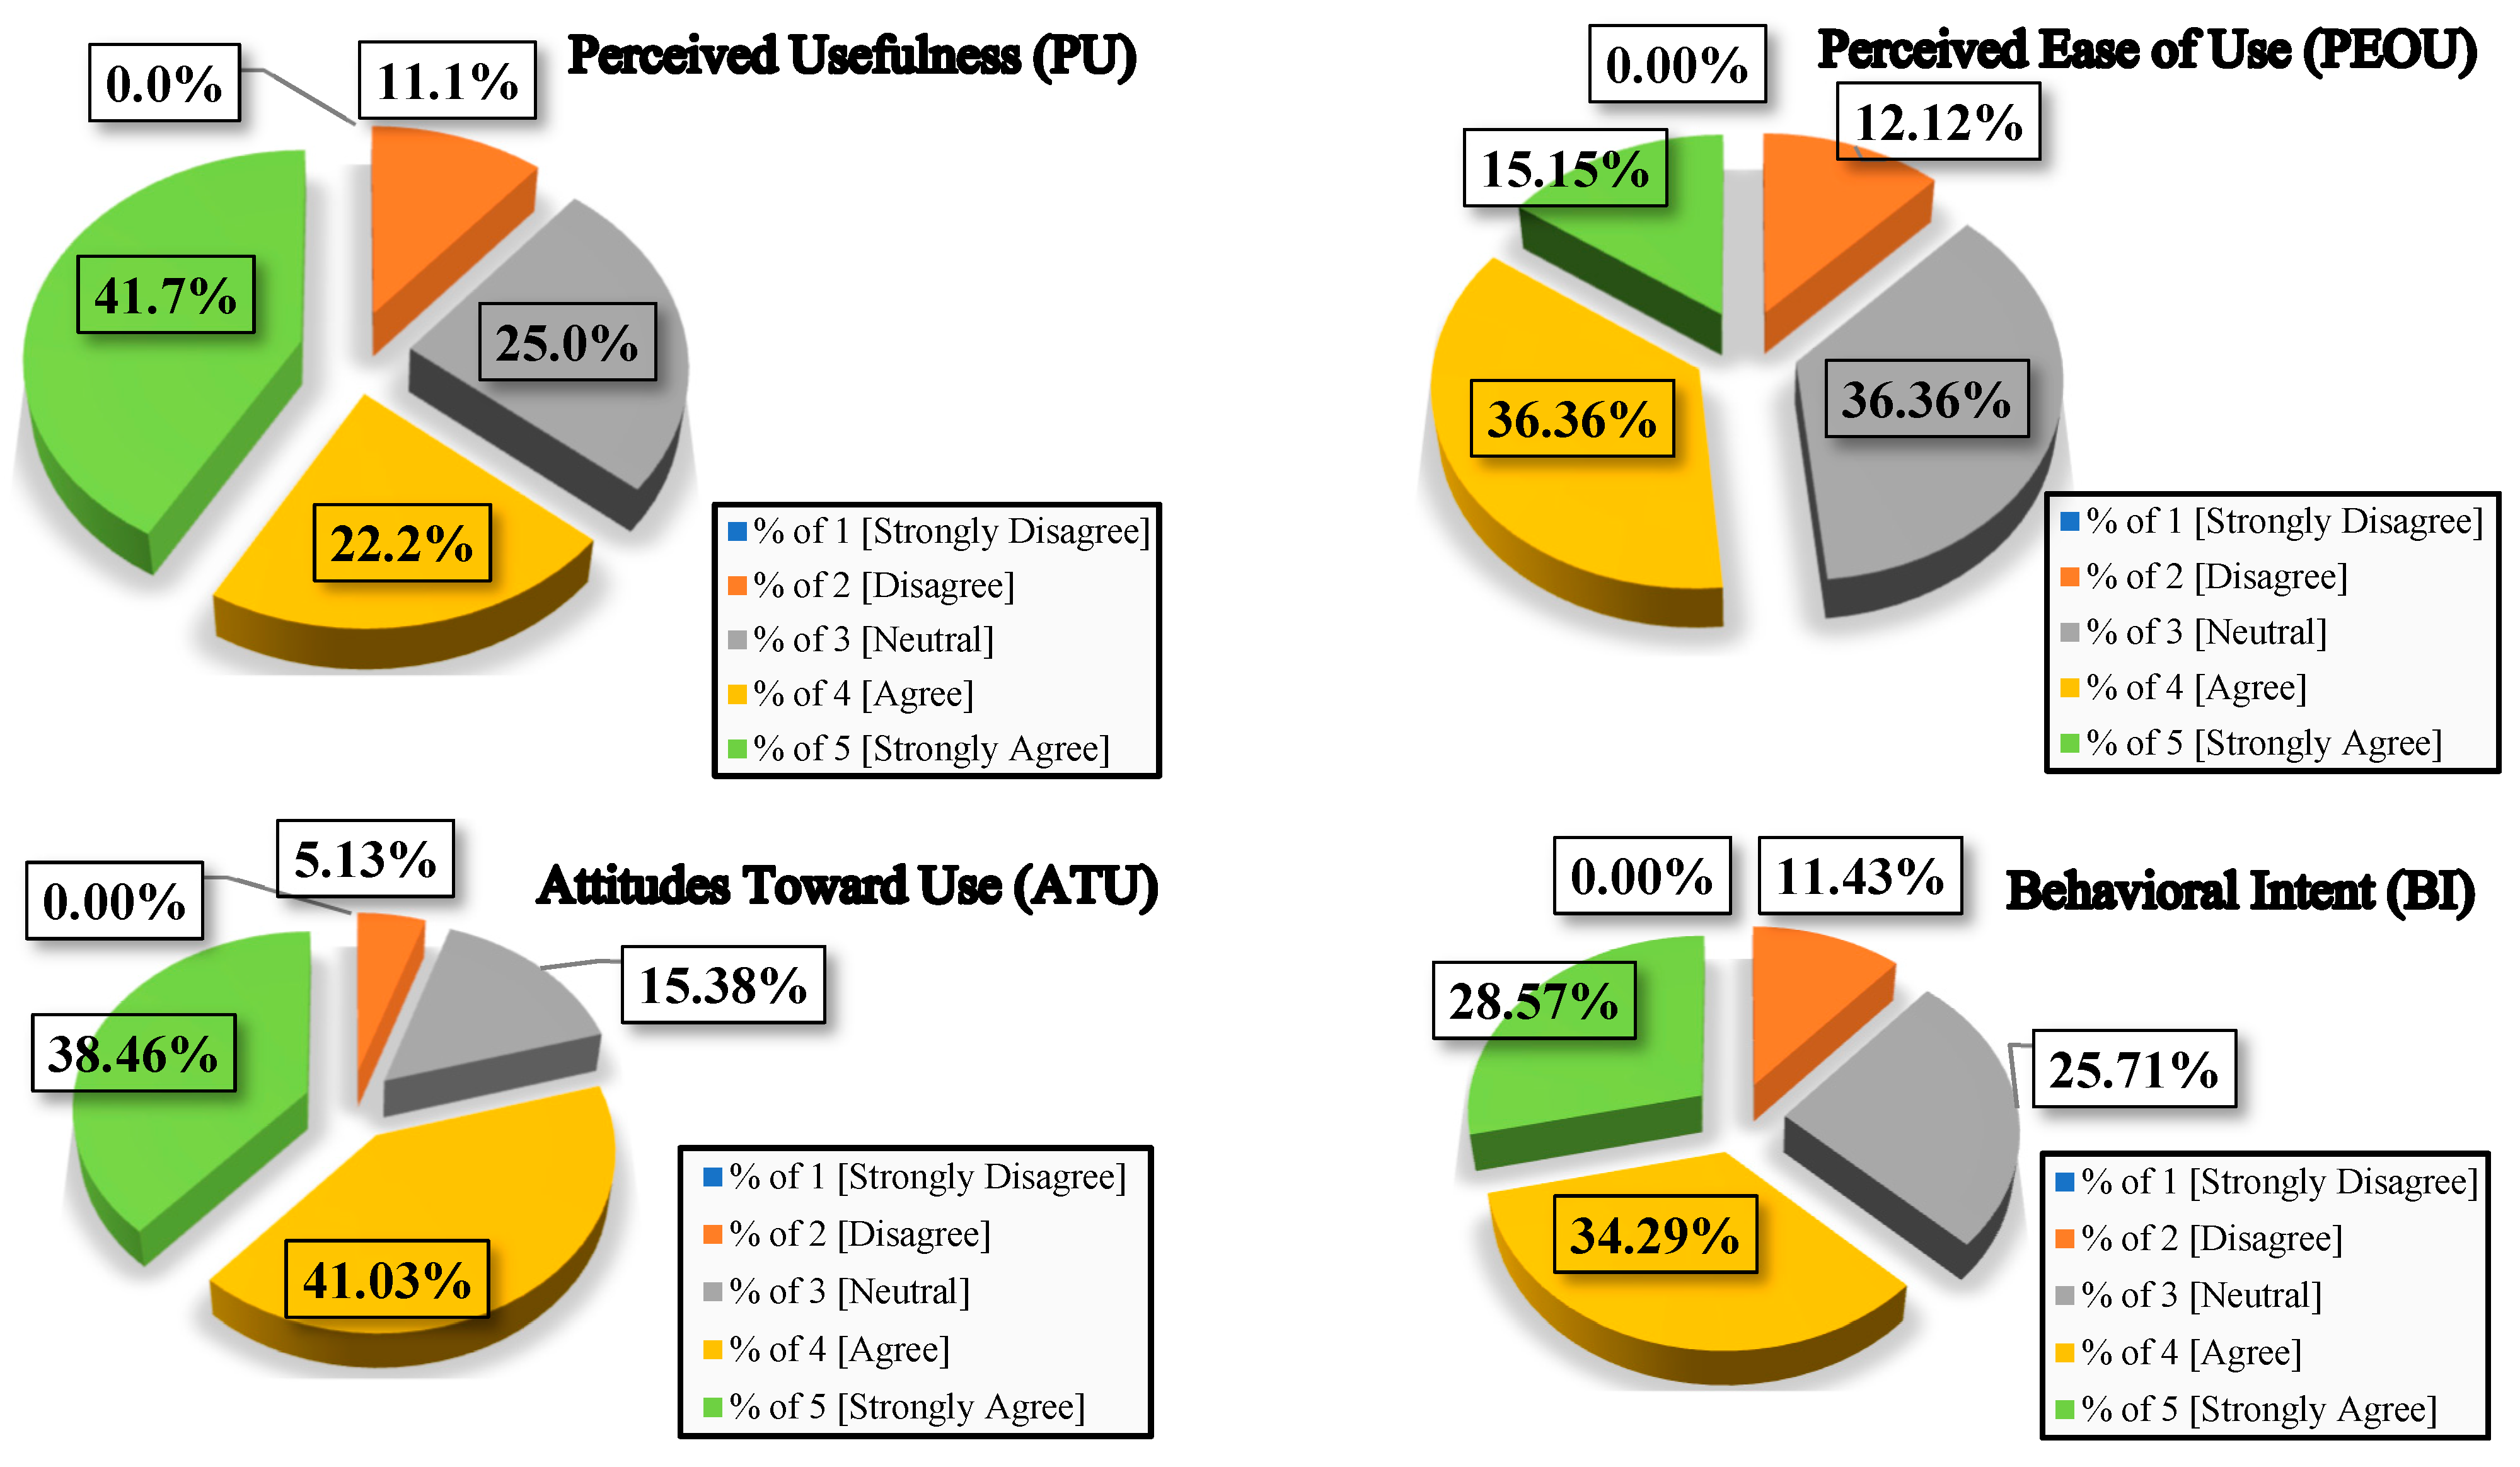
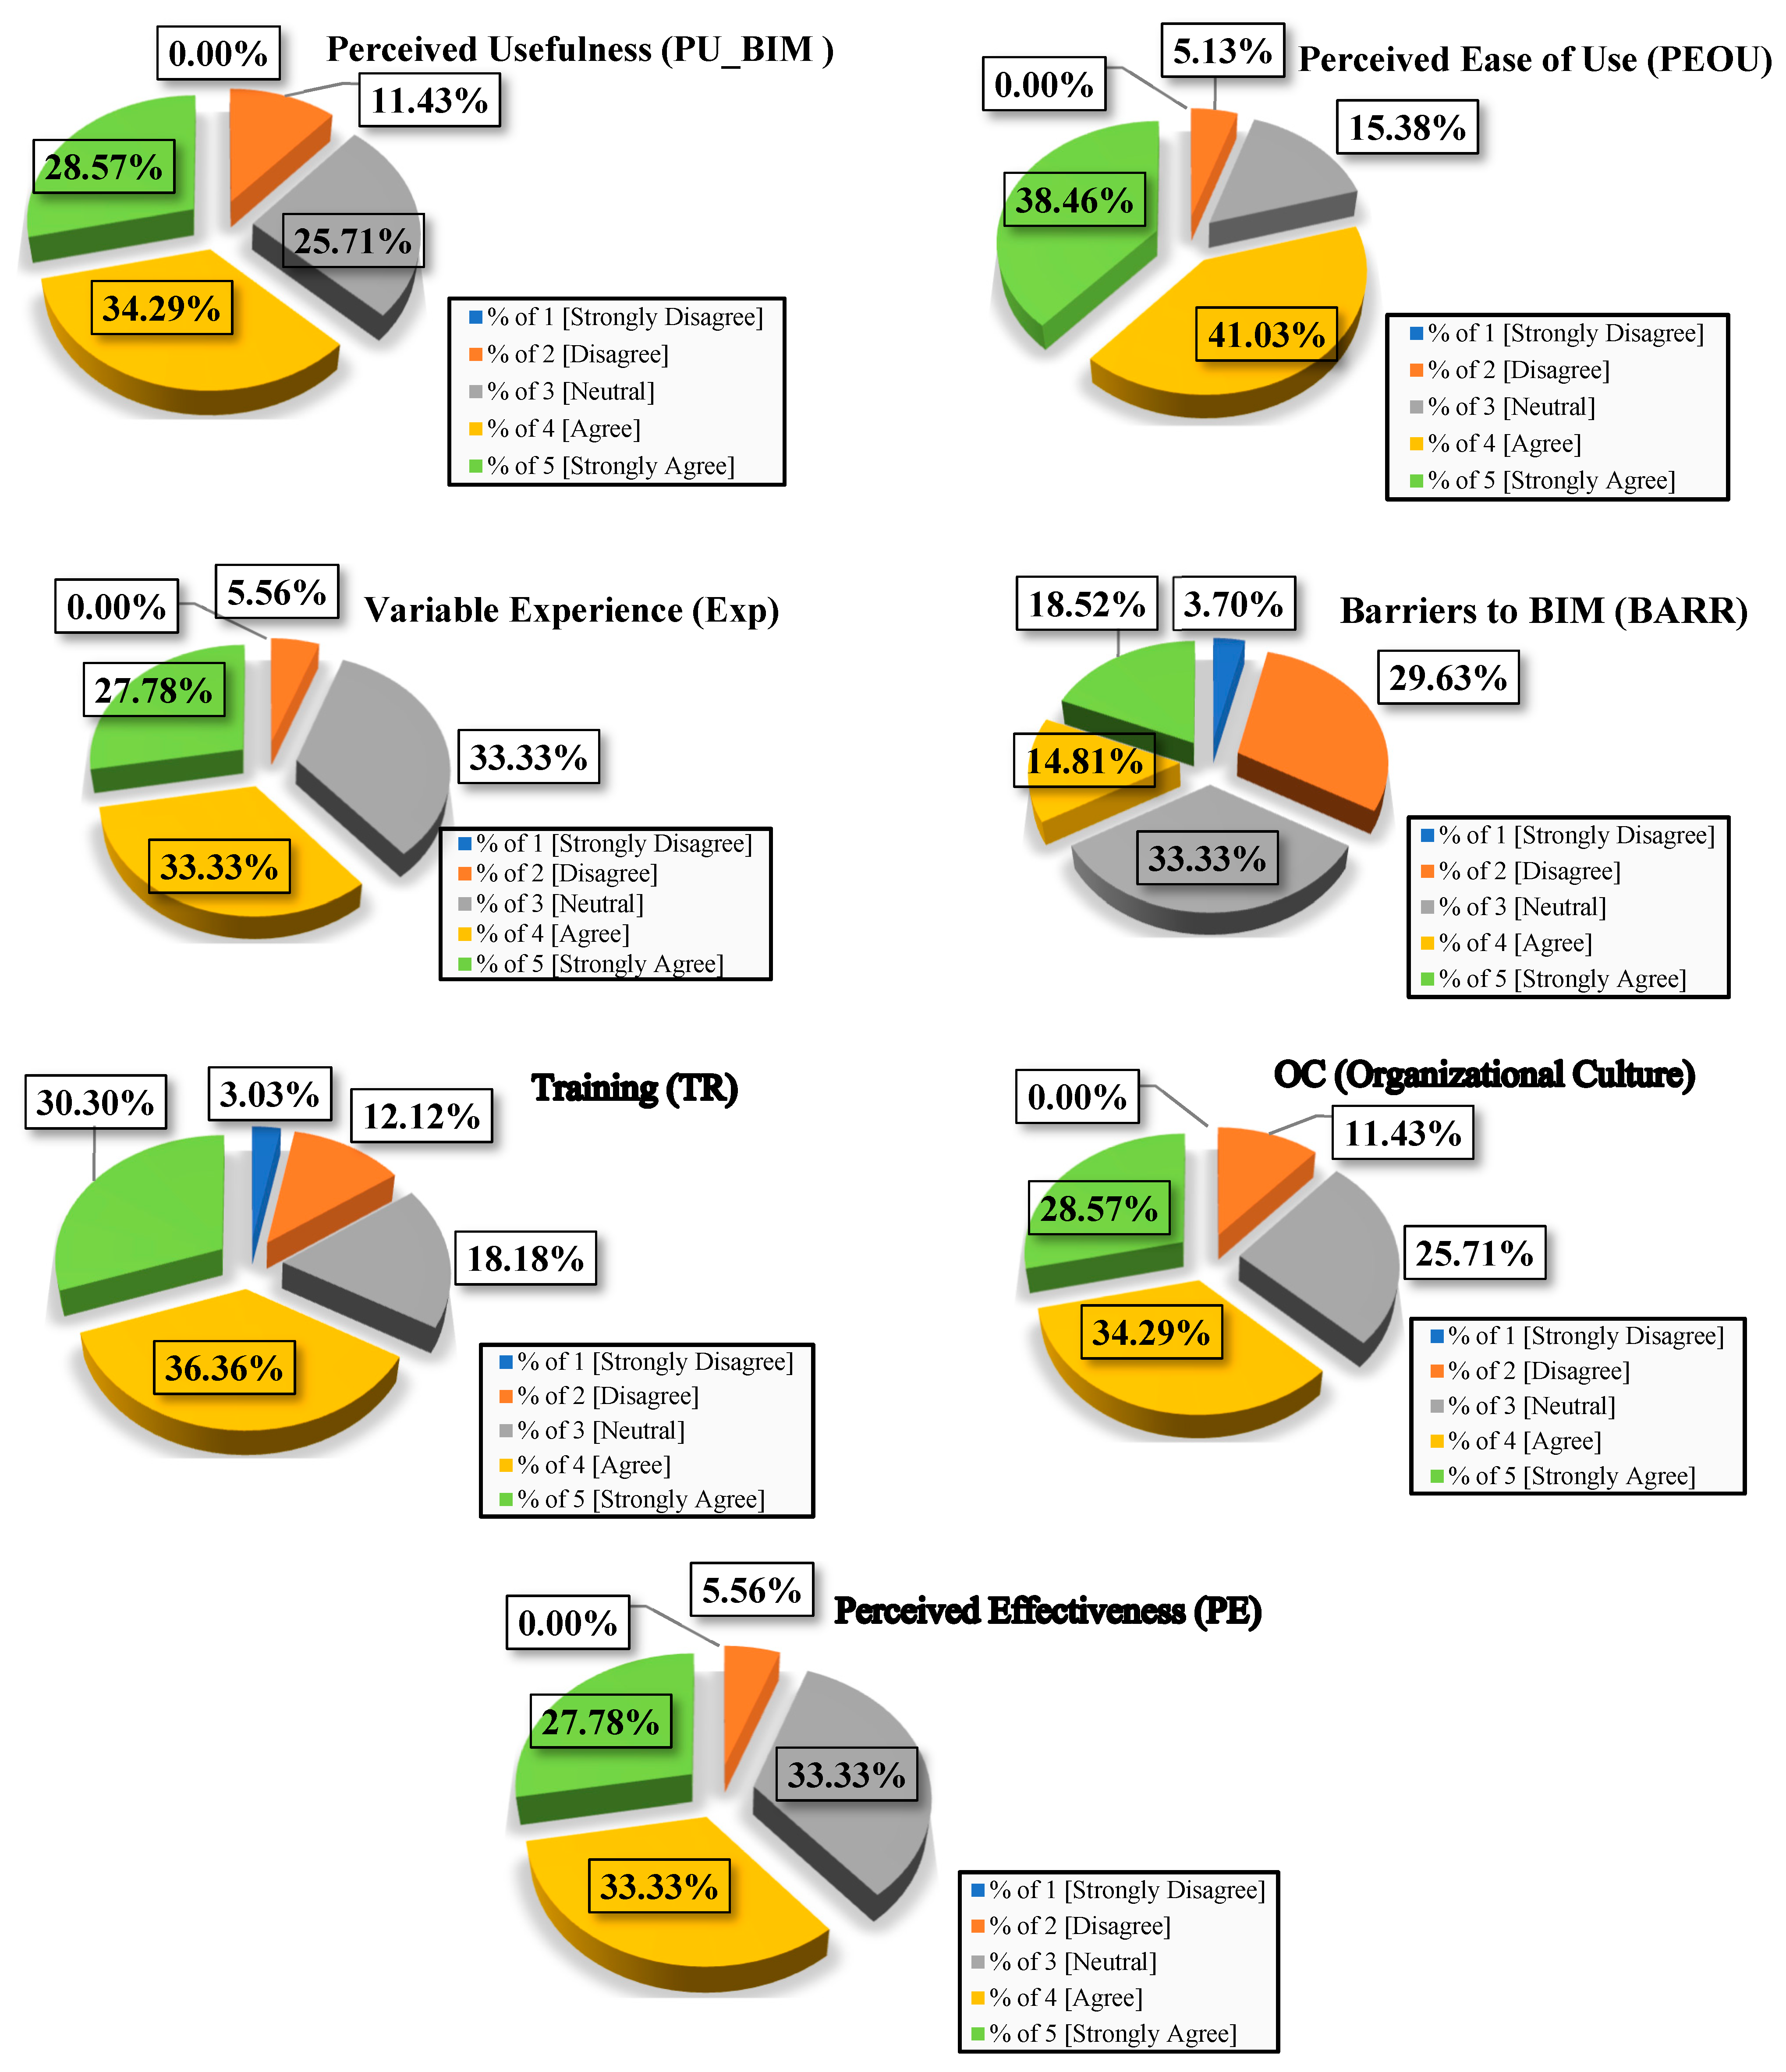
The predefined data of collection through survey processes were analyzed by analytical percentage weightage to show the distribution of each parameter based on a scale ranging from 1 to 5 (corresponding to strongly disagree (1), disagree (2), neutral (3), agree (4), and strongly agree (5)) as shown on Figure 5, Figure 6 and Figure 7, by percentage distribution response of independent variables of the key factors of the BI, HI, and SP, respectively. From the visual inspection of the survey data, we observed that the percentage of ‘disagree’ responses across almost all parameters is zero, except for SP of BARR and TR, which are 3.70% and 3.03%, respectively (see Figure 7).
Descriptive statistics of survey data were calculated to summarize the overall distribution, dispersion, and central tendency of the Behavioral Intention (BI), Hazard Identification (HI), and Stakeholder Perception (SP), as shown in Table 6. To capture both trends and variables, factors such as mean and standard deviation were calculated for each continuous variable. Variables were also described using descriptive statistics and percentages, shedding light on the distribution of responses across groups. Since the skewness and kurtosis values are within the acceptable range, the data appear to be normally distributed. Descriptive statistics such as mean, standard deviation, minimum, and maximum were reported for each variable.
Pearson correlation coefficients were calculated to examine the strength and direction of the relationship between variables. This analysis revealed several significant statistical correlations, suggesting a moderate relationship between the dependent and independent variables. The correlation analysis of Behavioral Intention (BI), Hazard Identification (HI), and Stakeholder Perception (SP) is shown in Table 7, Table 8 and Table 9, respectively.
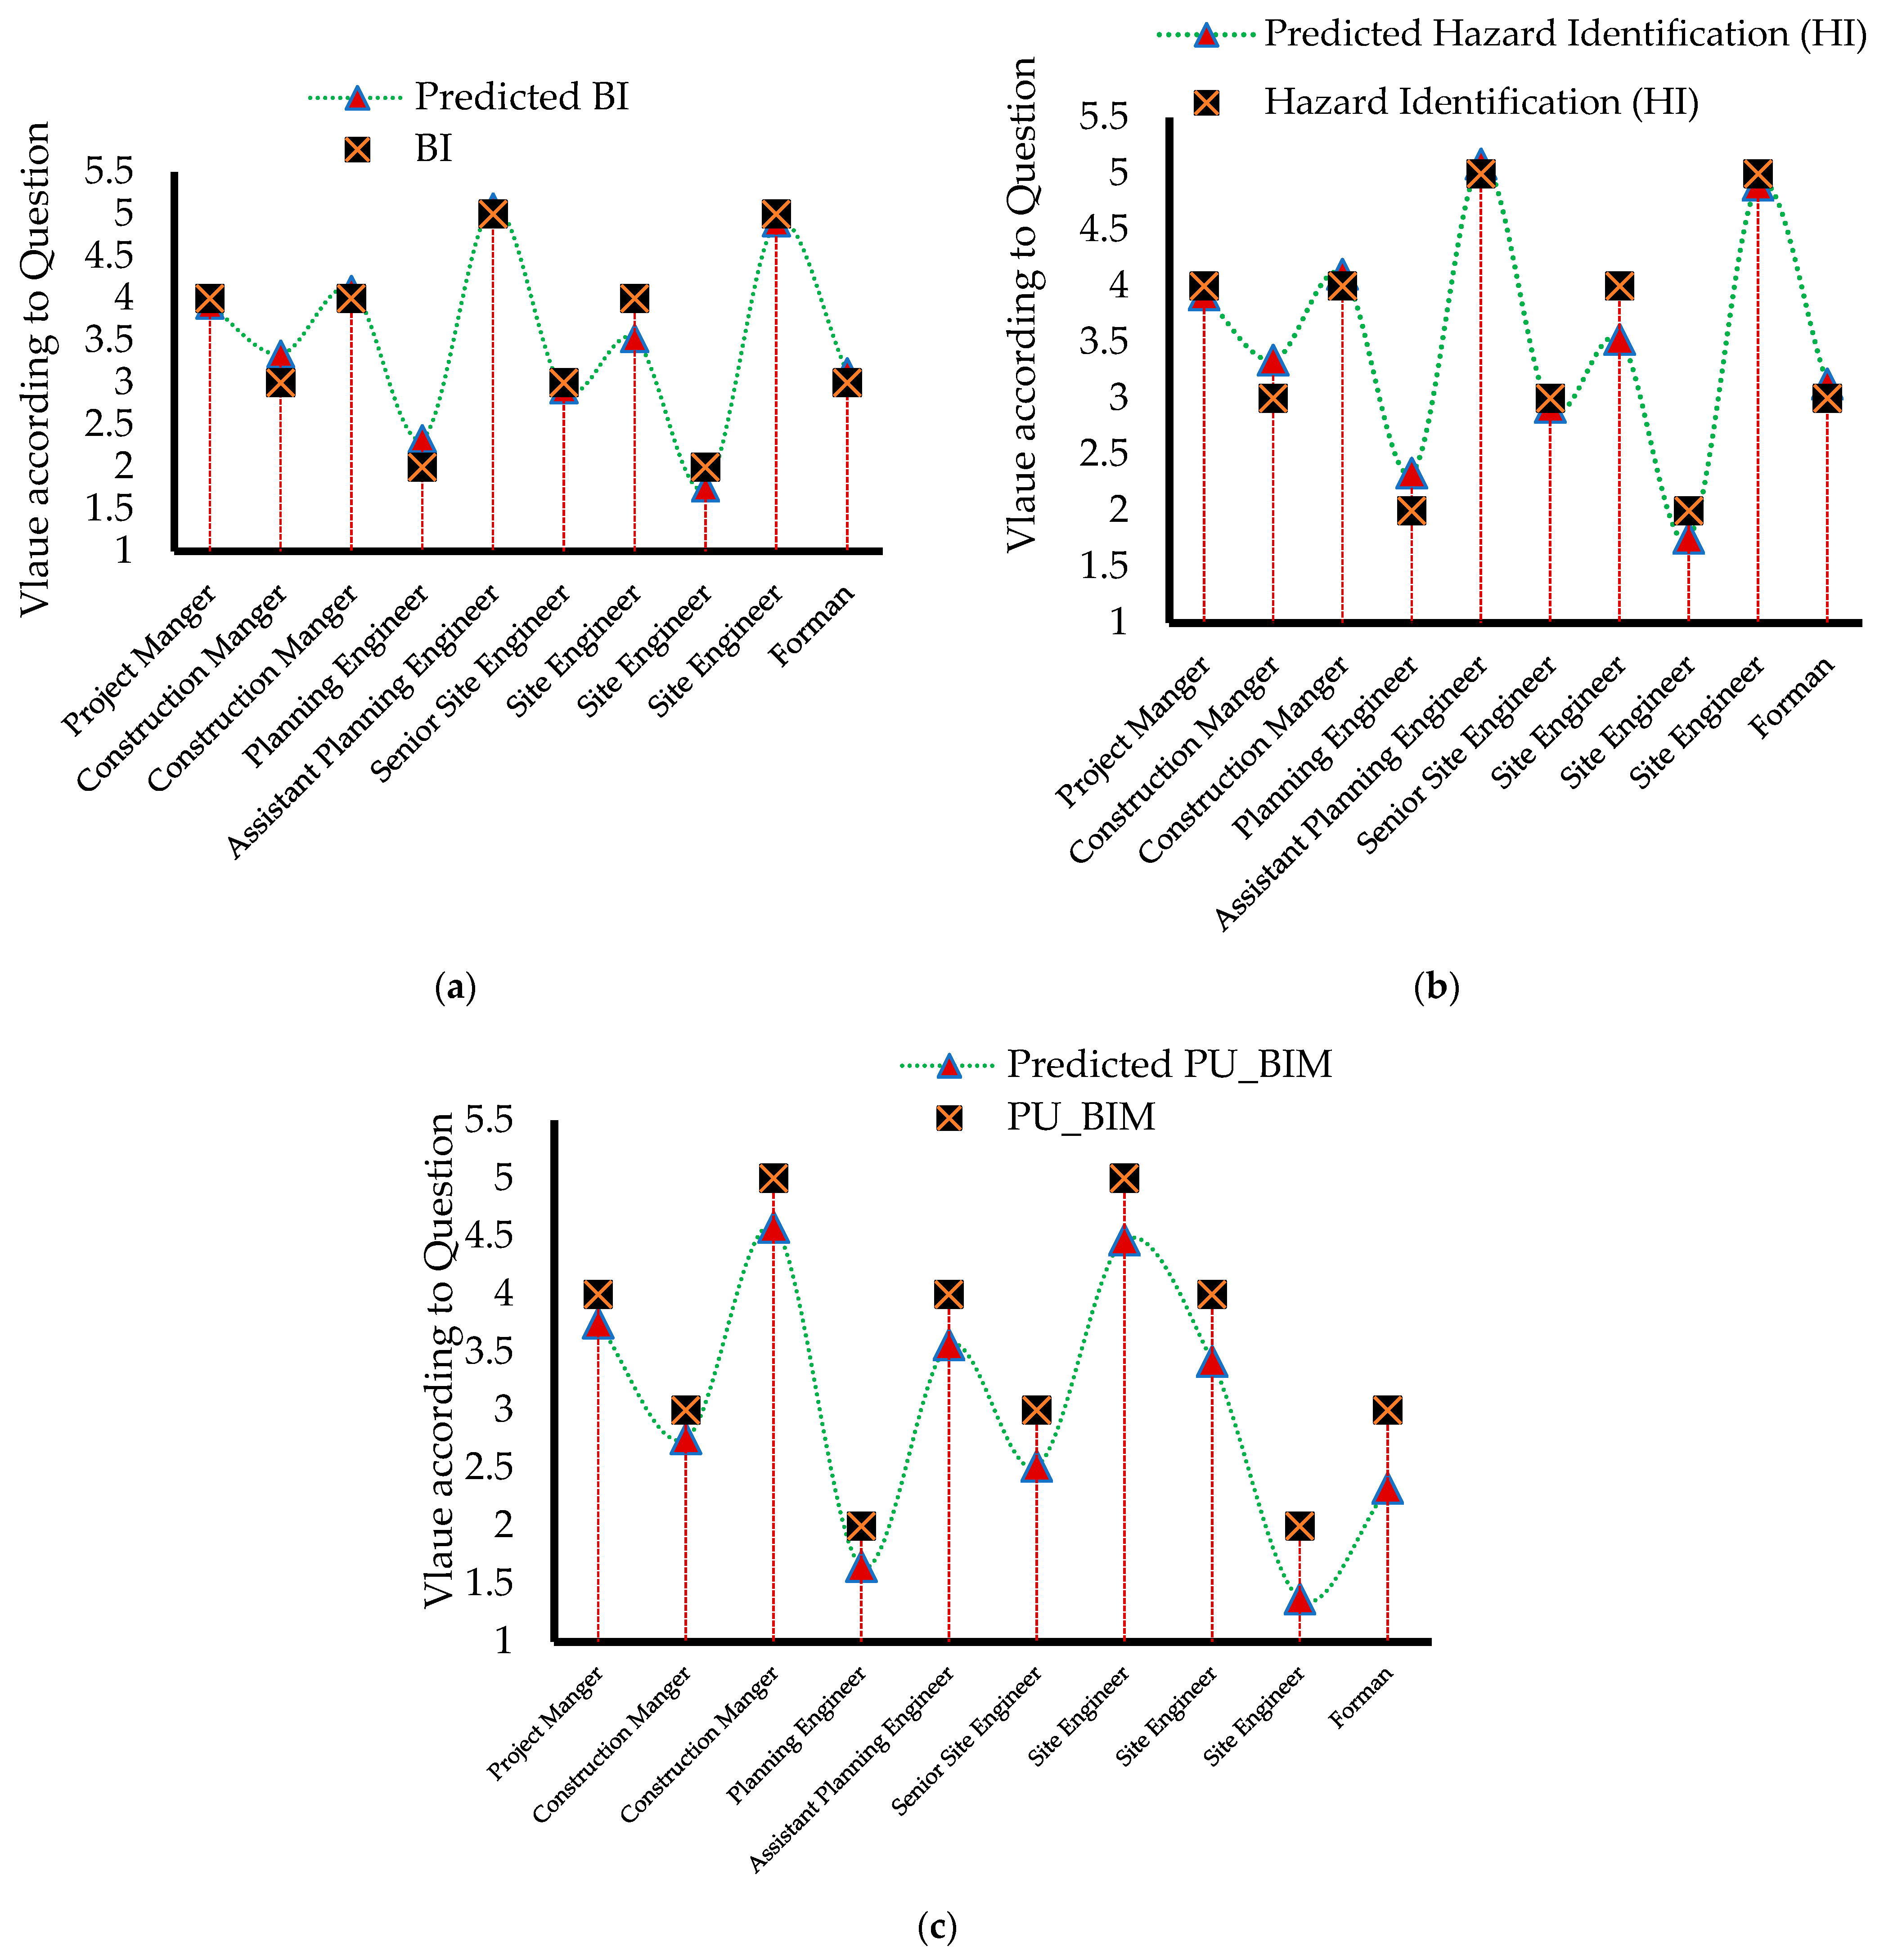
Regression analysis was used to examine the relationship between dependent and independent variables. Multiple regression models were created using Microsoft Excel 2020 with (dependent variables: B I , H I , and P U B I M ) as the outcome and (independent variables: P U ,   P E O U ,   A T U ,   P E O U ,   S A ,   E x p ,   B A R R ,   T R , and O C ) as predictors, as shown in Figure 8. The model was assessed for overall significance using the t-stat, and the contribution of individual predictors was assessed based on standardized beta coefficients and p-values. The main effects of the regression analysis are shown in Table 10, where p < 0.05. Among all predictors, ( B I , H I , and P U B I M ) showed a statistically significant effect (p < 0.05). The assumptions of linearity, independence, homogeneity of variance, and normality of the residuals were tested and found satisfactory.
The result of the multi-regression analysis provides the relationship between the dependent variables (Behavioral Intention (BI), Hazard Identification (HI), and Stakeholder Perception (SP)) and the independent variables ( P U ,   P E O U ,   A T U ,   P E O U ,   S A ,   E x p ,   B A R R ,   T R , and O C ) based on the survey data of the respondents in terms of coefficient estimates, statistical significance, predictive power, and model fit. The regression coefficient represents the expected change in a dependent variable with respect to a one-unit change in the independent variable, holding all other variables constant. The statistical significance of BI, HI, and SP with the corresponding independent variable was found to be positive signs: 0.0003471, 0.00034, and 2.46229E-50, respectively. The p-values of the independent variables are shown in Table 11, according to the literature study [66,67,68,69,70], to be less the 0.01, which shows strong evidence of a highly statistically significant level.
The overall fit of three models (BI, HI, and SP) was evaluated using R-squared and adjusted R-squared statistics. The models of BI, HI, and SP yielded an R2 value of 0.9454835, 0.9454835, and 0.9980125, respectively, as the same method was followed by published work [66,67,68,69,70], implying that the approximate percentage of variance of the dependent variable is explained by the set of independent variables included in the model. The Multiple R values shown in Table 10, representing the correlation between the survey data and predicted data of the dependent variables, BI, HI, and SP, were 0.97235975, 0.97235975, and 0.97235975, respectively, reflecting a strong positive linear relationship and are graphically shown in Figure 8. The standard errors (seen in Table 11) of BI, HI, and SP were 0.3088752, 0.3088752, and 0.2618594, respectively, suggesting a dispersion of the observed values around the predictive regression line. This indicates a reasonably precise model, with predictions falling within an acceptable range of the observed outcomes.
After the determination of coefficients, Equations (1)–(3) become
B I = 1.39 + 0.396 P U + 0.582 P E O U + 0.396 A T U + 0.30887
H I = 1.3928 + 0.3969 P U + 0.3955 P E O U + 0.5822 S A + 0.30887
P U B I M = 1.10 E 15 8.30 E 17 P E 5.08 E 17 P E O U 6.20 E 17 E x p   +   1.10 E 16 B A R R + T R + O C + 0.2618
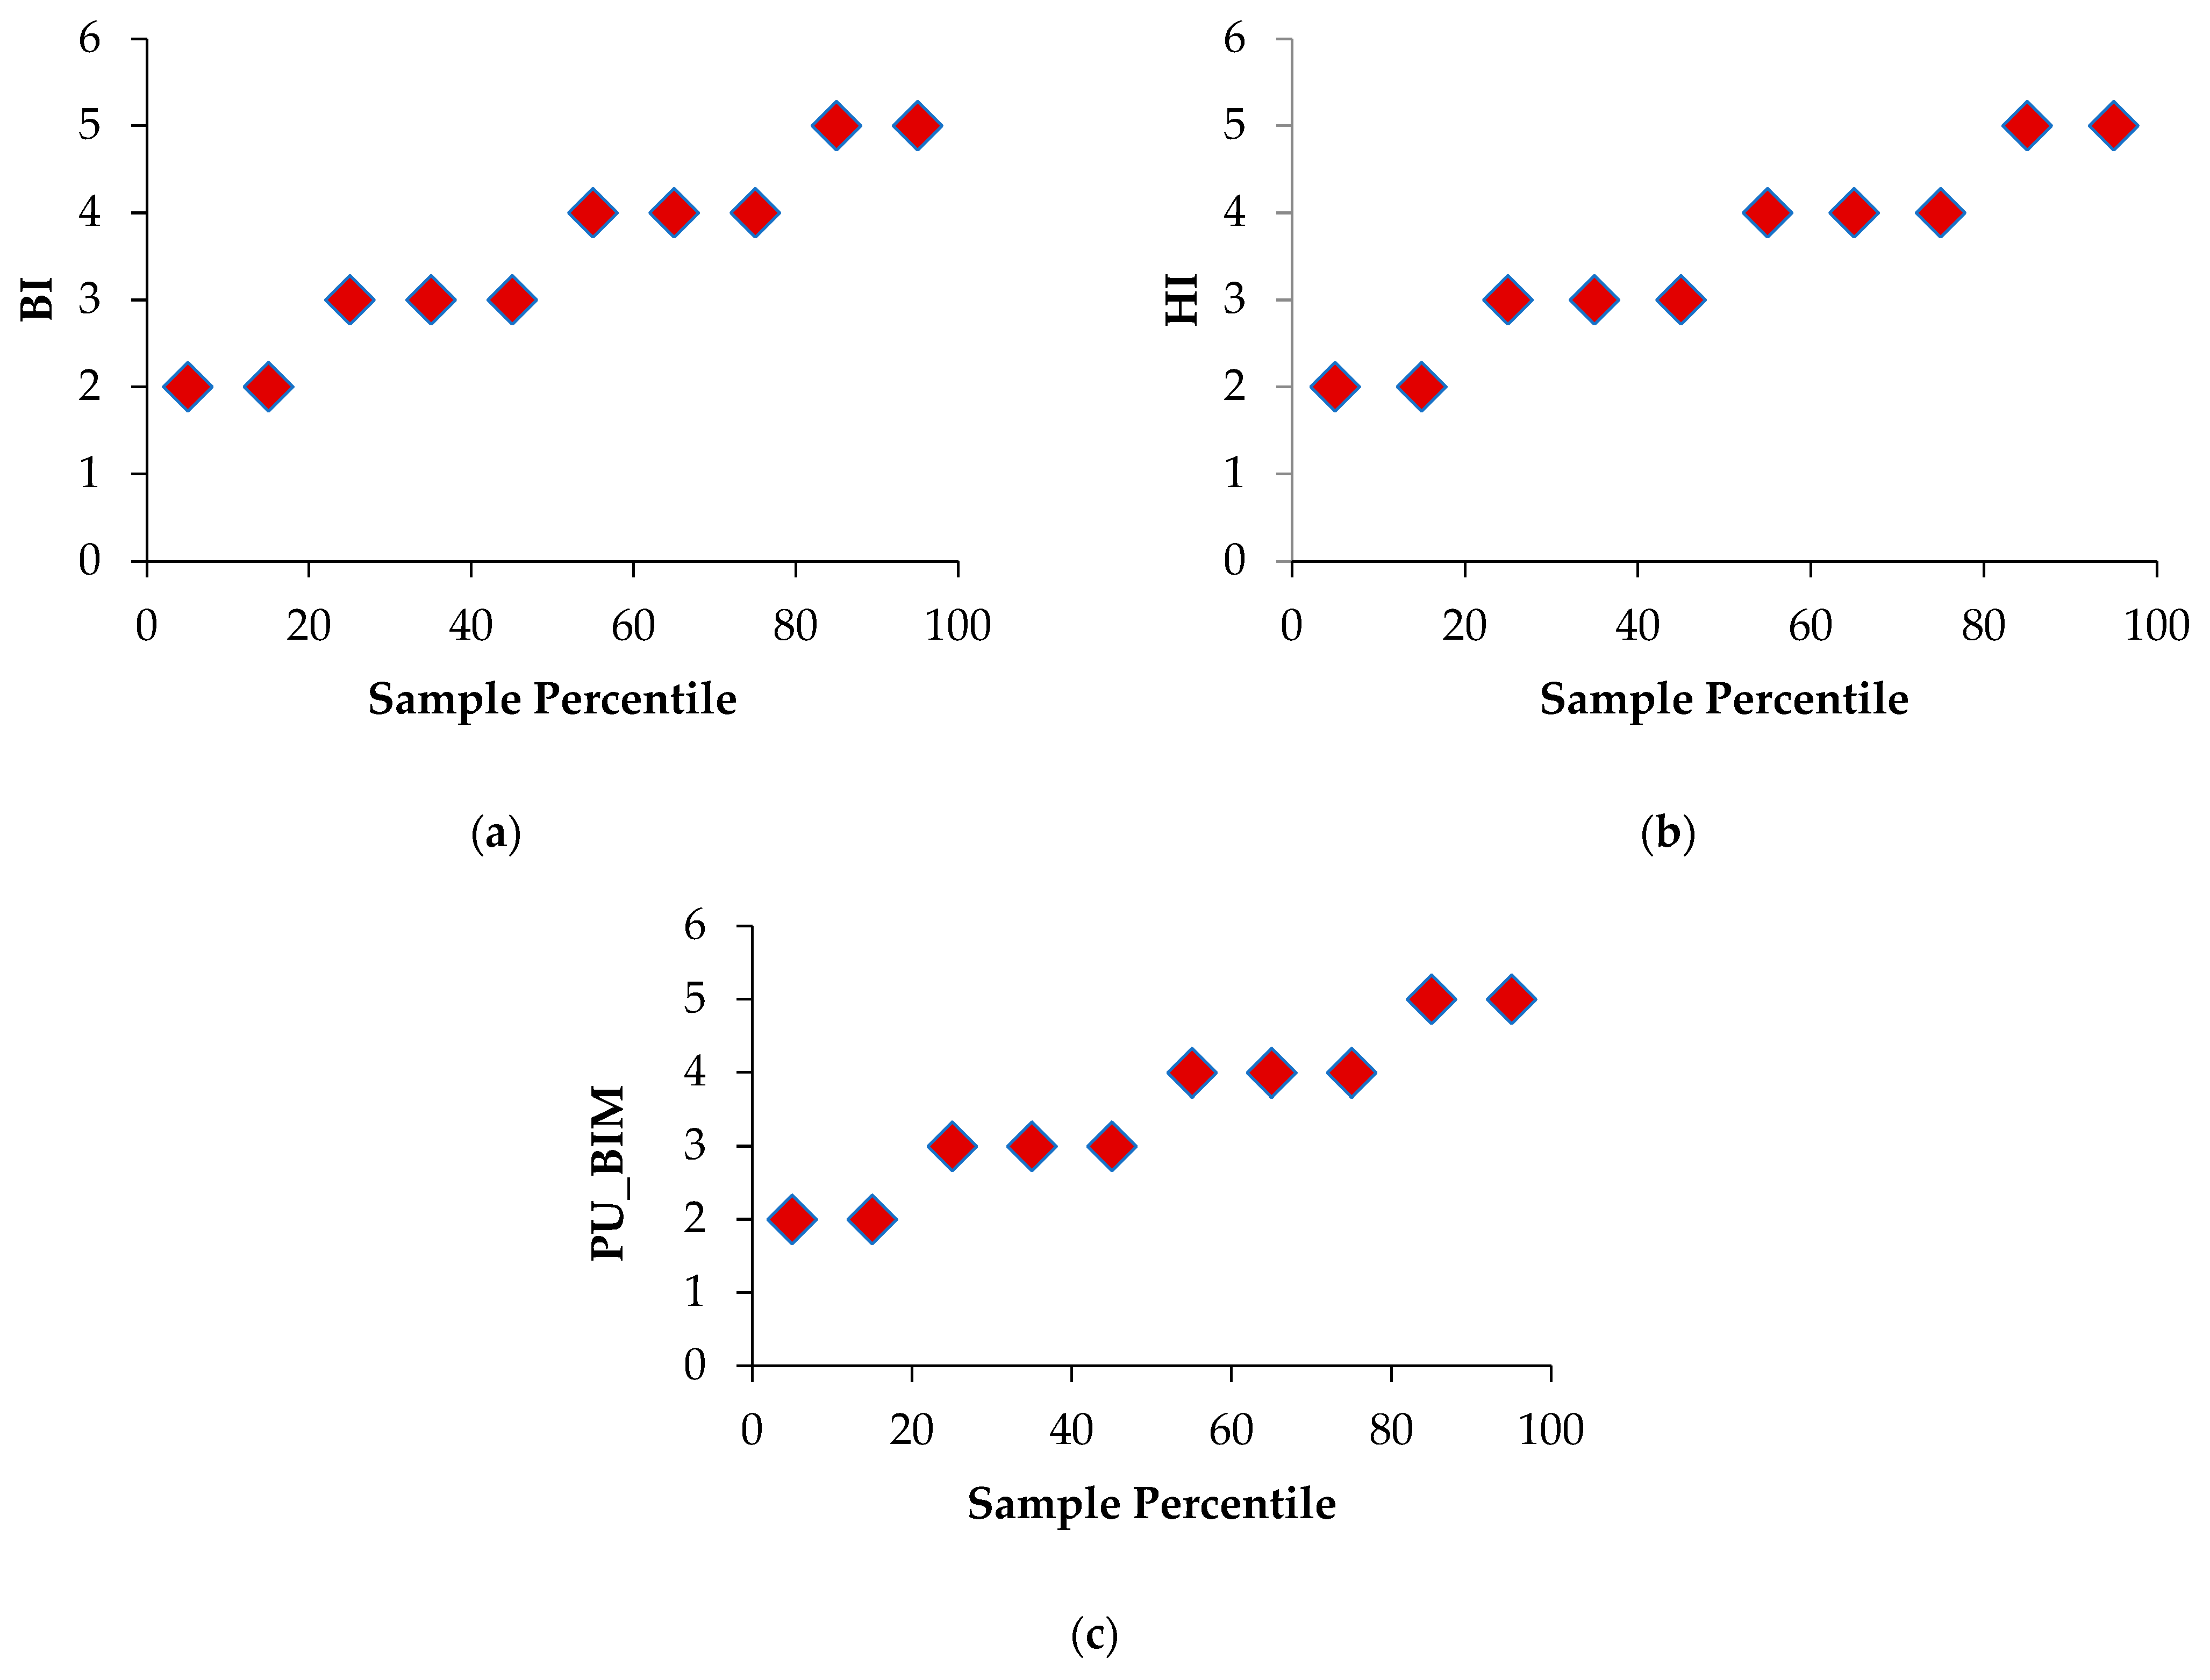
Normal probability percentile regression analyses were conducted to assess the distribution and trends of responses related to Stakeholder Perception (SP), Hazard Identification (HI), and Behavioral Intention (BI) in the context of BIM and TAM adoption, as shown in Figure 9. The analysis showed that the response values continued to gradually increase across percentiles for all three variables, reflecting a normal distribution pattern. In the lower percentiles (5th to 25th), the responses were concentrated around ratings of 2 to 3, indicating low levels of agreement or acceptance. As percentiles increased from 35th to 65th, the rating values stabilized around 3 to 4, representing moderate levels of perception and intention. Finally, in the higher percentiles (75th to 95th), the responses converged to higher ratings of 4 to 5, indicating high levels of agreement and positive attitudes toward BIM-related practices. All three dimensions show an upward trend, indicating that the respondent percentile is positively correlated with BIM acceptance, indicating that stakeholders with higher scores tend to be more accepting of BIM, are more effective in identifying risks, and show a stronger behavioral intention to adopt the technology. The consistency of this pattern supports the robustness of the dataset and confirms the applicability of percentile-based regression methods in interpreting ordered survey data in building technology research.
The proposed framework, as shown in Figure 10, integrates both qualitative and quantitative approaches to systematically evaluate the adoption of BIM within construction projects. In the first phase, key factors such as Behavioral Intention (BI), Hazard Identification (HI), and Stakeholder Perception (SP) were identified through the literature studies and theoretical grounding in the Technology Acceptance Model (TAM). These parameters were operationalized into a structured questionnaire to capture perceptions from technical construction staff. In the second phase, the collected data were statistically analyzed using regression, variation analysis, and probability outputs to test the predictive validity of the model. Statistical significance levels (p-values), residual analysis, and Cronbach’s alpha were employed to ensure the robustness and internal consistency of the dataset, thereby enhancing the reliability of the developed database. The iterative process of verifying whether the analysis was valid or required adjustments demonstrates the framework’s adaptability. Finally, in Phase III, the validated data were translated into predictive insights for practical application in construction projects. This integration of statistical rigor with theoretical constructs ensures that the framework not only captures stakeholder perspectives but also produces actionable outcomes. By embedding the results directly within the model, the research bridges the gap between theoretical understanding and practical implementation, making the conclusions both coherent and applicable for advancing BIM-driven decision-making in construction management.

4. Conclusions

This study employed survey data and multiple regression analysis to examine the influence of user- and organization-related factors on construction safety management within an integrated BIM–TAM framework. The results showed that constructs such as Perceived Usefulness (PU), Perceived Ease of Use (PEOU), Attitude Toward Use (ATU), Trust (TR), and Organizational Culture (OC) significantly affect Behavioral Intention (BI), Hazard Identification (HI), and Stakeholder Perception (SP). The models demonstrated strong predictive power (R2 up to 0.998), confirming the robustness and practical relevance of the proposed framework.

4.1. Theoretical and Practical Implications

Theoretically, this research contributes to the literature by extending the TAM with BIM principles to explain behavioral and organizational determinants of safety management. Practically, the framework provides actionable insights for policymakers, project managers, and practitioners in risk prioritization, safety policy development, and digital transformation strategies. It also offers a structured approach for integrating technology adoption with safety culture enhancement in construction projects.

4.2. Limitations and Future Research

This study has several limitations. First, its cross-sectional design may restrict causal inferences. Second, reliance on self-reported survey data introduces potential response bias. Future studies could employ longitudinal designs, larger and more diverse samples, and mixed methods to validate and generalize the findings. Expanding the framework to include additional organizational and technological factors would further strengthen its applicability across different contexts.

5. Recommendations

Based on the findings of this study, several practical and theoretical recommendations can be developed to support the improvement of decision-making, planning, and further research related to the use of digital technology, especially in the areas of BIM (Building Information Modeling).
This study provides evidence-based guidelines that highlight the relationship between data integration, theoretical models such as the TAM, and the implementation of BIM technologies. By implementing these principles, stakeholders can maximize the use of technology, improve the profitability of the construction activities, and contribute to digital innovation.

Author Contributions

Conceptualization, A.R.A. and C.Y.; methodology, A.R.A.; software, A.R.A.; validation, A.R.A., C.Y. and A.K.; formal analysis, A.R.A.; investigation, A.R.A.; resources, A.R.A.; data curation, A.R.A.; writing—original draft preparation, A.R.A.; writing—review and editing, A.R.A. and A.K.; visualization, A.R.A.; supervision, A.R.A.; project administration, A.R.A.; funding acquisition, C.Y. All authors have read and agreed to the published version of the manuscript.

Funding

This research received no external funding.

Data Availability Statement

The data presented in this study are available on request from the corresponding author.

Acknowledgments

The authors would like to express their sincere gratitude to Chen Yuan for his invaluable supervision, guidance, and support throughout this research. Special thanks are also extended to Amir Khan for his valuable contributions as a co-author. The corresponding author, Afaq Rafi Awan, acknowledges the collaborative efforts that made this work possible.

Conflicts of Interest

The authors declare no conflict of interest.

Abbreviations

The following abbreviations are used in this manuscript:
BIMBuilding Information Model
TAMTechnology Acceptance Model
BIBehavioral Intent
PUPerceived Usefulness
PEOUPerceived Ease of Use
ATUAttitudes Toward Use
HIHazard Identification
SASafety Awareness
PUBIMPerceived Usefulness of BIM
ExpExtent to which stakeholders believe
BARRBarriers to BIM Adoption
TRTraining and Education
OCOrganizational Culture
PEPerceived Effectiveness

Appendix A

Table A1. Survey questionnaire for Behavioral Intention (BI).
Q. Nos.QuestionSymbolic Representation12345
Strongly DisagreeDisagreeNeutralAgreeStrongly Agree
1Is Behavioral Intent (BI) to adopt BIM for safety management helpful for construction work?BI
2Is Perceived Usefulness (PU) of BIM essential on a construction site?PU
3Is Perceived Ease of Use (PEOU) essential on a construction site?PEOU
4Are Attitudes Toward Use (ATU) essential on the construction site?ATU

Appendix B

Table A2. Survey questionnaire for Hazard Identification (HI).
Q. Nos.QuestionSymbolic Representation12345
Strongly DisagreeDisagreeNeutralAgreeStrongly Agree
1Is Hazard Identification (HI) essential for a construction Project?HI
2Is the Perceived Usefulness (PU) the extent to which stakeholders believe BIM can help identify risks and reduce construction risks?PU
3Is the Perceived Ease of Use (PEOU) the extent to which stakeholders believe BIM is easy to use for risk identification?PEOU
4Is Safety Awareness (SA) being leveled at the stakeholder awareness of the safety protocols and risk reduction through BIM?SA

Appendix C

Table A3. Survey questionnaire for Stakeholder Perception (SP).
Q. Nos.QuestionSymbolic Representation12345
Strongly DisagreeDisagreeNeutralAgreeStrongly Agree
1What is the impact or importance of the Perceived Usefulness of BIM for safety management in the construction sector?PUBIM
2Is Perceived Effectiveness of BIM in Risk Identification/Mitigation?PEOU
3Is the Perceived Ease of Use of BIM tools the extent to which stakeholders believe BIM is easy to use for risk identification?Exp
4How much does the impact of the Barriers to BIM Adoption (cost, technical complexity, lack of training) affect construction activities?BARR
5Is Training and Education on BIM Safety Features essential on a construction project?TR
6What is the Organizational Culture (support and willingness to adopt BIM) in the construction sector?OC
7Is the Perceived Effectiveness (PE) of BIM in Risk Identification and Mitigation essential for the construction sector?(PE)

References

  1. Cheng, E.W.L.; Ryan, N.; Kelly, S. Exploring the Perceived Influence of Safety Management Practices on Project Performance in the Construction Industry. Saf. Sci. 2012, 50, 363–369. [Google Scholar] [CrossRef]
  2. Zhou, Z.; Goh, Y.; Science, Q.L.-S. Overview and Analysis of Safety Management Studies in the Construction Industry; Elsevier: Amsterdam, The Netherlands, 2015. [Google Scholar]
  3. Jazayeri, E.; Dadi, G.B. Construction Safety Management. J. Saf. Eng. 2017, 2, 15–28. [Google Scholar]
  4. Wang, X.; Zhao, B.; Su, C. Assessing Safety Efficiency in China’s Provincial Construction Industry: Trends, Influences, and Implications. Buildings 2024, 14, 893. [Google Scholar] [CrossRef]
  5. Tam, C.M.; Zeng, S.X.; Deng, Z.M. Identifying Elements of Poor Construction Safety Management in China. Saf. Sci. 2004, 42, 569–586. [Google Scholar] [CrossRef]
  6. Segbenya, M.; Yeboah, E. Effect of Occupational Health and Safety on Employee Performance in the Ghanaian Construction Sector. Environ. Health Insights 2022, 16, 11786302221137222. [Google Scholar] [CrossRef] [PubMed]
  7. Neitzel, R.L.; Seixas, N.S.; Ren, K.K. A Review of Crane Safety in the Construction Industry. Appl. Occup. Environ. Hyg. 2001, 16, 1106–1117. [Google Scholar] [CrossRef] [PubMed]
  8. Zhou, Z.; Zhuo, W.; Cui, J.; Luan, H.; Chen, Y.; Lin, D. Developing a Deep Reinforcement Learning Model for Safety Risk Prediction at Subway Construction Sites. Reliab. Eng. Syst. Saf. 2025, 257, 110885. [Google Scholar] [CrossRef]
  9. Mol, T. Productive Safety Management; Taylor & Francis: London, UK, 2003. [Google Scholar] [CrossRef]
  10. Zhang, J.; Li, Y.; Fukuda, T.; Wang, B. Urban Safety Perception Assessments via Integrating Multimodal Large Language Models with Street View Images. Cities 2025, 165, 106122. [Google Scholar] [CrossRef]
  11. Qi, H.; Zhou, Z.; Manu, P.; Li, N. Falling Risk Analysis at Workplaces through an Accident Data-Driven Approach Based upon Hybrid Artificial Intelligence (AI) Techniques. Saf. Sci. 2025, 185, 106814. [Google Scholar] [CrossRef]
  12. Stenhoff, A.; Steadman, L.; Nevitt, S.; Benson, L.; White, R.; Hill, B. Deep Learning in the Construction Industry: A Review of Present Status and Future Innovations. J. Build. Eng. 2020, 32, 101827. [Google Scholar] [CrossRef]
  13. Torgal, F.P.; Jalali, S. Eco-Efficient Construction and Building Materials; Springer Science & Business Media: Berlin/Heidelberg, Germany, 2014. [Google Scholar] [CrossRef]
  14. Olutuase, S.O. A Study of Safety Management in the Nigerian Construction Industry. IOSR J. Bus. Manag. 2014, 16, 1–10. [Google Scholar] [CrossRef]
  15. Purohit, D.P.; Siddiqui, N.A.; Nandan, A.; Yadav, B.P. Hazard Identification and Risk Assessment in Construction Industry. Int. J. Appl. Eng. Res. 2018, 13, 7639–7667. [Google Scholar]
  16. Yiu, N.S.N.; Sze, N.N.; Chan, D.W.M. Implementation of Safety Management Systems in Hong Kong Construction Industry–A Safety Practitioner’s Perspective. J. Safety Res. 2018, 64, 1–9. [Google Scholar] [CrossRef]
  17. Zulkeflee, A.A.; Faisol, N.; Ismail, F.; Ismail, N.A.A. Qurtubi Reluctance to Change: Key Factors of Foreign Labours’ Safety Non-Compliance Behaviours. J. Constr. Dev. Ctries. 2024, 29, 23–41. [Google Scholar] [CrossRef]
  18. Guo, B.H.W.; Goh, Y.M.; Le Xin Wong, K. A System Dynamics View of a Behavior-Based Safety Program in the Construction Industry. Saf. Sci. 2018, 104, 202–215. [Google Scholar] [CrossRef]
  19. Hadikusumo, B.H.W.; Kulchartchai, O. Exploratory Study of Obstacles in Safety Culture Development in the Construction Industry: A Grounded Theory Approach. J. Constr. Dev. Ctries. 2010, 15, 45–66. [Google Scholar]
  20. Wan, A.; Gong, W.; AL-Bukhaiti, K.; Cheng, X.; Ji, X.; Ji, Y.; Ma, S. Data-Driven Early Fire Detection in Offshore Wind Turbines: A TCN-ECA Based Approach Leveraging SCADA Data. Process Saf. Environ. Prot. 2025, 200, 107373. [Google Scholar] [CrossRef]
  21. Harshit; Chaurasia, P.; Zlatanova, S.; Jain, K. Low-Cost Data, High-Quality Models: A Semi-Automated Approach to LOD3 Creation. ISPRS Int. J. Geo-Inf. 2024, 13, 119. [Google Scholar] [CrossRef]
  22. Tezel, B.A. Visual Management: An Exploration of the Concept and Its Implementation in Construction. Ph.D. Thesis, University of Salford, Salford, UK, 2011. [Google Scholar]
  23. Levin, D.Z.; Cross, R.; Abrams, L.C. The Strength of Weak Ties You Can Trust: The Mediating Role of Trust in Effective Knowledge Transfer. Acad. Manag. Proc. 2002, 2002, D1–D6. [Google Scholar] [CrossRef]
  24. Choe, S.; Leite, F. Construction Safety Planning: Site-Specific Temporal and Spatial Information Integration. Autom. Constr. 2017, 84, 335–344. [Google Scholar] [CrossRef]
  25. Bansal, V.K. Application of Geographic Information Systems in Construction Safety Planning. Int. J. Proj. Manag. 2011, 29, 66–77. [Google Scholar] [CrossRef]
  26. Martinez, J.G.; Gheisari, M.; Alarcón, L.F. UAV Integration in Current Construction Safety Planning and Monitoring Processes: Case Study of a High-Rise Building Construction Project in Chile. J. Manag. Eng. 2020, 36, 05020005. [Google Scholar] [CrossRef]
  27. Saurin, T.A.; Formoso, C.T.; Guimaraes, L.B.M. Safety and Production: An Integrated Planning and Control Model. Constr. Manag. Econ. 2004, 22, 159–169. [Google Scholar] [CrossRef]
  28. Hare, B.; Cameron, I.; Roy Duff, A. Exploring the Integration of Health and Safety with Pre-Construction Planning. Eng. Constr. Archit. Manag. 2006, 13, 438–450. [Google Scholar] [CrossRef]
  29. Hu, Z.; Chan, W.T.; Hu, H.; Xu, F. Cognitive Factors Underlying Unsafe Behaviors of Construction Workers as a Tool in Safety Management: A Review. J. Constr. Eng. Manag. 2023, 149, 03123001. [Google Scholar] [CrossRef]
  30. Saunders, F.C.; Gale, A.W.; Sherry, A.H. Conceptualising Uncertainty in Safety-Critical Projects: A Practitioner Perspective. Int. J. Proj. Manag. 2015, 33, 467–478. [Google Scholar] [CrossRef]
  31. Ranasinghe, U.; Jefferies, M.; Davis, P.; Pillay, M. Conceptualising Project Uncertainty in the Context of Building Refurbishment Safety: A Systematic Review. Buildings 2021, 11, 89. [Google Scholar] [CrossRef]
  32. Alkaissy, M.; Arashpour, M.; Ashuri, B.; Bai, Y.; Hosseini, R. Safety Management in Construction: 20 Years of Risk Modeling. Saf. Sci. 2020, 129, 104805. [Google Scholar] [CrossRef]
  33. Cao, K.; Chen, S.; Chen, Y.; Nie, B.; Li, Z. Decision Analysis of Safety Risks Pre-Control Measures for Falling Accidents in Mega Hydropower Engineering Driven by Accident Case Texts. Reliab. Eng. Syst. Saf. 2025, 261, 111120. [Google Scholar] [CrossRef]
  34. Sherratt, F.; Ivory, C. Managing “a Little Bit Unsafe”: Complexity, Construction Safety and Situational Self-Organising. Eng. Constr. Archit. Manag. 2019, 26, 2519–2534. [Google Scholar] [CrossRef]
  35. Ghaffarianhoseini, A.; Tookey, J.; Ghaffarianhoseini, A.; Naismith, N.; Azhar, S.; Efimova, O.; Raahemifar, K. Building Information Modelling (BIM) Uptake: Clear Benefits, Understanding Its Implementation, Risks and Challenges. Renew. Sustain. Energy Rev. 2017, 75, 1046–1053. [Google Scholar] [CrossRef]
  36. Cerovsek, T. A Review and Outlook for a “Building Information Model” (BIM): A Multi-Standpoint Framework for Technological Development. Adv. Eng. Informatics 2011, 25, 224–244. [Google Scholar] [CrossRef]
  37. Visartsakul, B.; Damrianant, J. A Review of Building Information Modeling and Simulation as Virtual Representations under the Digital Twin Concept. Eng. J. 2023, 27, 11–27. [Google Scholar] [CrossRef]
  38. Ding, Z.; Liu, S.; Liao, L.; Zhang, L. A Digital Construction Framework Integrating Building Information Modeling and Reverse Engineering Technologies for Renovation Projects. Autom. Constr. 2019, 102, 45–58. [Google Scholar] [CrossRef]
  39. Liu, D.; Lu, W.; Niu, Y. Extended Technology-Acceptance Model to Make Smart Construction Systems Successful. J. Constr. Eng. Manag. 2018, 144, 04018035. [Google Scholar] [CrossRef]
  40. Katebi, A.; Homami, P.; Najmeddin, M. Acceptance Model of Precast Concrete Components in Building Construction Based on Technology Acceptance Model (TAM) and Technology, Organization, and Environment (TOE) Framework. J. Build. Eng. 2022, 45, 103518. [Google Scholar] [CrossRef]
  41. Mitera-Kiełbasa, E.; Zima, K. Optimising Construction Efficiency: A Comprehensive Survey-Based Approach to Waste Identification and Recommendations with BIM and Lean Construction. Sustainability 2025, 17, 4027. [Google Scholar] [CrossRef]
  42. Salzano, A.; Cascone, S.; Zitiello, E.P.; Nicolella, M. Construction Safety and Efficiency: Integrating Building Information Modeling into Risk Management and Project Execution. Sustainability 2024, 16, 4094. [Google Scholar] [CrossRef]
  43. Liu, Z.; Lu, Y.; Peh, L.C. A Review and Scientometric Analysis of Global Building Information Modeling (BIM) Research in the Architecture, Engineering and Construction (AEC) Industry. Buildings 2019, 9, 210. [Google Scholar] [CrossRef]
  44. Zou, Y.; Kiviniemi, A.; Jones, S.W. A Review of Risk Management through BIM and BIM-Related Technologies. Saf. Sci. 2017, 97, 88–98. [Google Scholar] [CrossRef]
  45. Lin, Y.-C. Construction 3D BIM-Based Knowledge Management System: A Case Study. J. Civ. Eng. Manag. 2014, 20, 186–200. [Google Scholar] [CrossRef]
  46. Parsamehr, M.; Perera, U.S.; Dodanwala, T.C.; Perera, P.; Ruparathna, R. A Review of Construction Management Challenges and BIM-Based Solutions: Perspectives from the Schedule, Cost, Quality, and Safety Management. Asian J. Civ. Eng. 2023, 24, 353–389. [Google Scholar] [CrossRef]
  47. Pan, Y.; Zhang, L. Integrating BIM and AI for Smart Construction Management: Current Status and Future Directions. Arch. Comput. Methods Eng. 2023, 30, 1081–1110. [Google Scholar] [CrossRef]
  48. García, M.N.G.; Rodrigues, F.; Baptista, J.S. New Advances in Building Information Modeling and Engineering Management; Springer Nature: Cham, Switzerland, 2023. [Google Scholar]
  49. Zhan, C.; Fu, C.; Wu, X. Research on Collaborative Construction Management of Construction Project Based on BIM Technology. Int. J. Crit. Infrastruct. 2023, 19, 79. [Google Scholar] [CrossRef]
  50. Hire, S.; Sandbhor, S.; Ruikar, K. Bibliometric Survey for Adoption of Building Information Modeling (BIM) in Construction Industry– A Safety Perspective. Arch. Comput. Methods Eng. 2022, 29, 679–693. [Google Scholar] [CrossRef]
  51. Li, Y.; Li, Y.; Ding, Z. Building Information Modeling Applications in Civil Infrastructure: A Bibliometric Analysis from 2020 to 2024. Buildings 2024, 14, 3431. [Google Scholar] [CrossRef]
  52. Alfahham, A.F.H.; Alajeeli, H.K.B. Building a Predictive Model to Improve the Quality of Government Building Construction Projects in Iraq Using Multi Linear Regression Technique. In IOP Conference Series: Materials Science and Engineering; IOP Publishing: Bristol, UK, 2020; Volume 888. [Google Scholar] [CrossRef]
  53. Rajab, M.A.; Özay, G. Cost Estimation of Reinforced Concrete Buildings Using Neural Network and Multi Regression Analysis. Lect. Notes Civ. Eng. 2024, 481, 245–254. [Google Scholar] [CrossRef]
  54. Aleithawe, I.; Sinno, R.R.; McAnally, W.H. Right-of-Way Acquisition Duration Prediction Model for Highway Construction Projects. J. Constr. Eng. Manag. 2012, 138, 540–544. [Google Scholar] [CrossRef]
  55. Owusu Danso, F.; Adinyira, E.; Manu, P.; Agyekum, K.; Kwaku Ahadzie, D.; Badu, E. The Mediating Influence of Local Cultures on the Relationship between Factors of Safety Risk Perception and Risk-Taking Behavioural Intention of Construction Site Workers. Saf. Sci. 2022, 145, 105490. [Google Scholar] [CrossRef]
  56. Wirsbinna, A.; Grega, L.; Juenger, M. Assessing Factors Influencing Citizens’ Behavioral Intention towards Smart City Living. Smart Cities 2023, 6, 3093–3111. [Google Scholar] [CrossRef]
  57. Ghimire, A.; Imran, M.A.U.; Biswas, B.; Tiwari, A.; Saha, S. Behavioral Intention to Adopt Artificial Intelligence in Educational Institutions: A Hybrid Modeling Approach. J. Comput. Sci. Technol. Stud. 2024, 6, 56–64. [Google Scholar] [CrossRef]
  58. Liao, L.; Ye, Y.; Wei, N.; Li, H.; Fan, C. Exploring Blockchain Technology Acceptance among Non-Managerial Construction Practitioners in Shenzhen, China. Eng. Constr. Archit. Manag. 2024, 31, 2053–2076. [Google Scholar] [CrossRef]
  59. Al-Salem, S.M.; Al-Nasser, A.; Al-Dhafeeri, A.T. Multi-Variable Regression Analysis for the Solid Waste Generation in the State of Kuwait. Process Saf. Environ. Prot. 2018, 119, 172–180. [Google Scholar] [CrossRef]
  60. Chen, Y.; Qin, H.; Zhou, Z.G. A Comparative Study on Multi-Regression Analysis and BP Neural Network of PM2.5 Index. In Proceedings of the 2014 10th International Conference on Natural Computation (ICNC), Xiamen, China, 19–21 August 2014; pp. 155–159. [Google Scholar] [CrossRef]
  61. Iqbal, S.; Kamiński, M. Review Study on Mechanical Properties of Cellular Materials. Materials 2024, 17, 2682. [Google Scholar] [CrossRef]
  62. Iqbal, S.; Kamiński, M.; Ardakani, S.M.S. Uncertainty Quantification of Effective Mechanical Characteristics of Hexagonal Cellular Material. Mech. Res. Commun. 2025, 144, 104368. [Google Scholar] [CrossRef]
  63. Zhang, L.; Skibniewski, M.J.; Wu, X.; Chen, Y.; Deng, Q. A Probabilistic Approach for Safety Risk Analysis in Metro Construction. Saf. Sci. 2014, 63, 8–17. [Google Scholar] [CrossRef]
  64. Cuny, X.; Lejeune, M. Statistical Modelling and Risk Assessment. Saf. Sci. 2003, 41, 29–51. [Google Scholar] [CrossRef]
  65. Agbo, A.A. Cronbach’s Alpha: Review of Limitations and Associated Recommendations. J. Psychol. Africa 2010, 20, 233–239. [Google Scholar] [CrossRef]
  66. Vargas-alzate, Y.F.; Gonzalez-drigo, R.; Avila-haro, J.A. Multi-Regression Analysis to Enhance the Predictability of the Seismic Response of Buildings. Infrastructures 2022, 7, 51. [Google Scholar] [CrossRef]
  67. Stanislas, T.T.; Komadja, G.C.; Obianyo, I.I.; Ayeni, O.; Mahamat, A.A.; Tendo, J.F.; Savastano Junior, H. Multivariate Regression Approaches to Predict the Flexural Performance of Cellulose Fibre Reinforced Extruded Earth Bricks for Sustainable Buildings. Clean. Mater. 2023, 7, 100180. [Google Scholar] [CrossRef]
  68. Sharma, A.; Ramkrishnan, R. Parametric Optimization and Multi-Regression Analysis for Soil Nailing Using Numerical Approaches. Geotech. Geol. Eng. 2020, 38, 3505–3523. [Google Scholar] [CrossRef]
  69. Bhatti, U.A.; Tang, H.; Khan, A.; Yasin Ghadi, Y.; Bhatti, M.A.; Khan, K.A. Investigating the Nexus between Energy, Socio-Economic Factors and Environmental Pollution: A Geo-Spatial Multi Regression Approach. Gondwana Res. 2024, 130, 308–325. [Google Scholar] [CrossRef]
  70. Gjika Dhamo, E.; Puka, L.; Zaçaj, O. Forecasting Consumer Price Index (Cpi) Using Time Series Models and Multi Regression Models (Albania Case Study). In Proceedings of the 10th International Scientific Conference, Vilnius, Lithuania, 3–4 May 2018. [Google Scholar] [CrossRef]
Figure 1. Methodology flow chart.
Buildings 15 03444 g001
Figure 2. Risk matrix of Behavioral Intention (BI) as per respondent rating value.
Buildings 15 03444 g002
Figure 3. Risk matrix of Hazard Identification (HI) as per the respondent rating value.
Buildings 15 03444 g003
Figure 4. Risk matrix of Stakeholder Perception (SP) as per respondent rating value.
Buildings 15 03444 g004
Figure 5. Percentage weightage of respondents of the Perceived Usefulness (PU), Perceived Ease of Use (PEOU), Attitudes Toward Use (ATU), and Behavioral Intention (BI).
Buildings 15 03444 g005
Figure 6. Percentage weightage of respondents of Hazard Identification (HI), Perceived Usefulness (PU), Perceived Ease of Use (PEOU), and Safety Awareness (SA).
Buildings 15 03444 g006aBuildings 15 03444 g006b
Figure 7. Percentage weightage of respondents of Perceived Usefulness (PUBIM), Perceived Ease of Use (PEOU), Variable Experience (Exp), Barriers to BIM (BARR), Training (TR), Organizational Culture (OC), and Perceived Effectiveness (PE).
Buildings 15 03444 g007
Figure 8. Predicted values versus actual data of (a) Behavioral Intention (BI), (b) Hazard Identification (HI), and (c) Stakeholder Perception (SP).
Buildings 15 03444 g008
Figure 9. Normal probability plot of (a) Behavioral Intention (BI), (b) Hazard Identification (HI), and (c) Stakeholder Perception (SP).
Buildings 15 03444 g009
Figure 10. Framework of the study.
Buildings 15 03444 g010
Table 1. Literature in this study regarding the use of BIM and the TAM in the advancement of construction management.
Names of AuthorsProblem StatementData CollectionTraditional MethodAdvance MethodBIM and TAM
Mitera-Kiełbasa and Zima, 2025 [41]High levels of construction waste are affecting cost and timelinesSurvey among Polish construction contractorsConventional waste management strategiesLean construction and BIM-based waste reductionBIM supports sustainability and efficiency improvements
Salzano et al., 2024 [42]Issues in technological maturity and stakeholder collaborationCase studies and stakeholder feedbackStandard project management techniquesBIM for collaborative design and project coordinationBIM enhances communication, reduces errors, and streamlines project workflows
Liu et al., 2019 [43]Limited adoption of BIM in construction managementScreening of 166 peer-reviewed papersTraditional monitoring/control methodsBIM integration for sustainability, lean construction, and optimizationBIM improves integration, time, and cost management
Zou, Kiviniemi, and Jones, 2017 [44]Limited adoption of BIM for safety in constructionExtensive literature reviewTraditional risk management approachesBIM-based risk mitigation strategiesBIM improves safety management and risk mitigation
YC Lin, 2014 [45]Challenges in technological maturity, talent shortage, and legal regulationsAnalysis of BIM applications in various project stagesStandard project management techniquesBIM for collaborative design, clash detection, and schedule managementBIM optimizes efficiency, reduces costs, and enhances project quality
Parsamehr et al., 2023 [46]Difficulty in accessing key construction management dataLiterature review and case studiesConventional project scheduling and cost estimationBIM-based predictive decision-making frameworkBIM enhances communication, collaboration, and automated prediction models
Pan and Zhang, 2023 [47]Complexity and uncertainty in construction projectsBibliometric analysis and information analysisConventional project management techniquesAI-enhanced BIM for automation and digitalizationBIM-AI integration improves efficiency and decision-making
García, Rodrigues, and Baptista, 2023 [48]Challenges in heritage preservation and interoperabilityLiterature review and case studiesConventional project management techniquesDigital innovations in architecture, engineering, and constructionBIM improves the technical aspects of conservation and restoration
Zhan, Fu, and Wu, 2023 [49]Issues in interoperability and stakeholder collaborationAnalysis of BIM applications in various project stagesStandard project management techniquesBIM for collaborative design and project coordinationBIM enhances communication, reduces errors, and streamlines project workflows
Hire, Sandbhor, and Ruikar, 2022 [50]Limited adoption of BIM for safety in constructionBibliometric survey and analysisTraditional safety management approachesBIM-based safety planning and predictive hazard identificationBIM improves safety management and risk mitigation
Li, Li, and Ding, 2024 [51]Challenges in interoperability and stakeholder collaborationSurvey of 416 papers from Web of ScienceConventional project management techniquesBIM integration for infrastructure lifecycle managementBIM enhances efficiency, collaboration, and sustainability
Table 2. Survey data collection for Behavioral Intention (BI).
Respondent NameIs Perceived Usefulness (PU) of BIM Essential on a Construction Site? (PU)Is Perceived Ease of Use (PEOU) Essential on a Construction Site?
(PEOU)
Is Attitude Toward Use (ATU) Essential on a Construction Site?
(ATU)
Is Behavioral Intent (BI) to Adopt BIM for Safety Management Helpful for Construction Work?
(BI)
Project Manger4354
Construction Manger5243
Construction Manger3454
Planning Engineer2332
Assistant Planning Engineer5545
Senior Site Engineer3423
Site Engineer4344
Site Engineer2232
Site Engineer5455
Forman3343
Table 3. Hazard Identification (HI) site data collection of the independent variables.
Respondent NameIs Hazard Identification (HI) Essential for a Construction Project?
(HI)
Is the Perceived Usefulness (PU) the Extent to Which Stakeholders Believe BIM Can Help Identify Risks and Reduce Construction Risks?
(PU)
Is the Perceived Ease of Use (PEOU) the Extent to Which Stakeholders Believe BIM Is Easy to Use for Risk Identification?
(PEOU)
Is Safety Awareness (SA) Being Leveled at the Stakeholder Awareness of the Safety Protocols and Risk Reduction Through BIM?
(SA)
Project Manger4534
Construction Manger5423
Construction Manger3544
Planning Engineer2332
Assistant Planning Engineer5455
Senior Site Engineer3243
Site Engineer4434
Site Engineer2322
Site Engineer5545
Forman3433
Table 4. Stakeholder Perception (SP) site data collection of the independent variables.
Respondent NameHow Much Does the Impact or Importance of the Perceived Usefulness of BIM for Safety Management in the Construction Sector Matter?
(PU_BIM)
Is Perceived Effectiveness of BIM in Risk Identification/Mitigation?
PEOU
Is the Perceived Ease of Use of BIM Tools the Extent to Which Stakeholders Believe BIM Is Easy to Use for Risk Identification?
(Exp)
What Is the Impact of the Barriers to BIM Adoption (Cost, Technical Complexity, Lack of Training) on Construction Activities?
(BARR)
Is Training and Education on BIM Safety Features Essential on a Construction Project?
(TR)
What Is the Organizational Culture (Support and Willingness to Adopt BIM) in the Construction Sector?
(OC)
Is the Perceived Effectiveness (PE) of BIM in Risk Identification and Mitigation Essential for the Construction Sector?
(PE)
Project Manger4543245
Construction Manger3432433
Construction Manger5554254
Planning Engineer2232523
Assistant Planning Engineer4443344
Senior Site Engineer3332432
Site Engineer5545155
Site Engineer4453344
Site Engineer2321523
Forman3432433
Table 5. Cronbach’s alpha test value.
DescriptionBIHISP
Sum of Total Variation10.4113.6517.89
Number of Questions447
Cronbach Value 0.820.920.91
Table 6. Descriptive statistics of Behavioral Intention (BI), Hazard Identification (HI), and Stakeholder Perception (SP).
VariableMeanStandard ErrorMedianModeStandard DeviationSample VarianceKurtosisSkewnessRangeMini.Max.
BIPU3.5560.412351.2361.527778−1.6920.092325
PEOU3.3330.3333411−0.6430.107325
ATU3.7780.324440.9720.944−0.009−0.502325
BI3.4440.377331.1301.278−1.1710.176325
HIPU3.5560.412351.2361.528−1.6920.092325
PEOU3.7780.324440.9720.944−0.009−0.502325
SA3.3330.3333411−0.6430.107325
HI3.4440.377331.1301.278−1.1710.176325
SPPE3.7780.324440.9720.944−0.009−0.502325
PEOU3.5560.338331.0141.028−0.7630.270325
Exp2.6670.408221.2251.50.3490.816415
BARR3.4440.444441.3331.778−0.153−0.661415
TR3.4440.377331.1301.278−1.1710.176325
OC3.4440.294330.8820.7780.1440.214325
Table 7. Correlation variables of Behavioral Intention (BI).
VariablePUPEOUATU
PU1
PEOU0.3192981
ATU0.5330670.1531111
Table 8. Correlation variables of Hazard Identification (HI).
VariablePUPEOUSA
PU1
PEOU0.5330671
SA0.3192980.1531111
Table 9. Correlation variables of Stakeholder Perception (SP).
VariablePUBIMPEPEOUExpBARRTROC
PUBIM1
PE0.8792841
PEOU0.8518350.6476691
Exp0.9315410.7419990.7736821
BARR−0.9614−0.89387−0.75671−0.938571
TR10.8792840.8518350.931541−0.96141
OC0.7453560.7633250.6428570.773682−0.84270.7453561
Table 10. Regression statistics of Behavioral Intention (BI), Hazard Identification (HI), and Stakeholder Perception (SP).
Regression StatisticsMultiple RR SquareAdjusted R SquareStandard ErrorObservations
BI0.972359750.94548350.918225230.308875210
HI0.972359750.94548350.918225230.308875210
SP0.999005730.99801250.745528020.261859410
Table 11. Regression coefficient analysis of independent variables of Behavioral Intention (BI), Hazard Identification (HI), and Stakeholder Perception (SP).
VariableCoefficientsStandard Errort-Statp-ValueLower 95%Upper 95%Lower 95.0%Upper 95.0%
BIIntercept−1.3920.5135−2.7120.035−2.649−0.136−2.649−0.1361
PU0.3960.10813.6710.010.1320.6610.13230.661
PEOU0.5820.1155.08230.0020.3010.8620.3010.862
ATU0.3960.1223.23160.01780.0960.6950.0960.69
HIIntercept−1.39280.5135−2.71210.035−2.649−0.136−2.6493−0.1362
PU0.39690.10813.67080.01040.13230.66150.13230.6615
PEOU0.39550.12243.23160.01790.0960.6950.0960.695
SA0.58220.11455.08230.00230.30190.86250.30190.8625
SPIntercept−1.10 × 10−154.28 × 10⁻¹⁶−2.677.50 × 10−2−2.50 × 10−152.2 × 10⁻¹⁶−2.50 × 10−152.10 × 10⁻¹⁶
PE−8.30 × 10−174.35 × 10⁻¹⁷−1.911.50 × 10−1−2.21 × 10−165.5 × 10⁻¹⁷−2.20 × 10−165.50 × 10⁻¹⁷
PEOU−5.80 × 10−173.25 × 10⁻¹⁷−1.81.60 × 10−1−1.62 × 10−164.4 × 10⁻¹⁷−1.62 × 10−164.40 × 10⁻¹⁷
Exp−6.20 × 10−174.57 × 10⁻¹⁷−1.362.60 × 10−1−2.07 × 10−168.3 × 10⁻¹⁷−2.07 × 10−168.30 × 10⁻¹⁷
BARR1.10 × 10−165.60 × 10−171.91.40 × 10−1−6.70 × 10−172.8 × 10⁻¹⁶−6.77 × 10−172.80 × 10⁻¹⁶
TR18.90 × 10−171.10 × 10161.60 × 10−481111
OC7.10 × 10−173.00 × 10−172.31.00 × 10−1−2.60 × 10−171.6 × 10⁻¹⁶−2.61 × 10−171.60 × 10⁻¹⁶
Disclaimer/Publisher’s Note: The statements, opinions and data contained in all publications are solely those of the individual author(s) and contributor(s) and not of MDPI and/or the editor(s). MDPI and/or the editor(s) disclaim responsibility for any injury to people or property resulting from any ideas, methods, instructions or products referred to in the content.