Article

Study on the Axial Compression Performance of UHPC-SRC Short Columns

1
College of Civil Science and Engineering, Yangzhou University, Yangzhou 225127, China
2
Jiangsu Testing Center for Quality of Construction Engineering Co., Ltd., Nanjing 210033, China
*
Authors to whom correspondence should be addressed.
Buildings 2025, 15(19), 3442; https://doi.org/10.3390/buildings15193442
Submission received: 28 August 2025 / Revised: 16 September 2025 / Accepted: 21 September 2025 / Published: 23 September 2025
(This article belongs to the Section Building Materials, and Repair & Renovation)

Abstract

This study proposes a novel UHPC-SRC short column structure that adopts ultra-high performance concrete (UHPC) as a permanent formwork, combined with longitudinal reinforcement, stirrups, and H-shaped steel. The design aims to enhance construction efficiency and sustainability while maintaining excellent mechanical performance. A finite element model was established in ABAQUS to simulate the compressive behavior of the structure, incorporating key parameters such as reinforcement diameter, formwork thickness, and steel section strength. The results indicate that increasing the formwork thickness and strength can significantly improve the ultimate load-bearing capacity, with a thickness increase leading to an enhancement of up to 23% in ultimate load. In contrast, the reinforcement ratio and steel strength exert relatively minor effects on the overall performance. Validation against experimental data shows an average ratio of 0.963 between experimental and simulated values, indicating high model accuracy. The observed failure mode is characterized by concrete cracking and fragmentation, with longitudinal reinforcement yielding being the dominant failure mechanism. The proposed formula for calculating axial compressive bearing capacity has been verified as highly reliable, with calculation results in close agreement with finite element simulations, thereby providing strong support for engineering design and practical applications.

1. Introduction

Cast-in-place concrete structures are a long-established construction technique. Although alternative methods such as precast concrete and modular construction have developed rapidly in recent years, they remain widely used due to their unique advantages in frame structures [1,2]. These construction methods largely rely on formwork supports [3], with formwork serving as a critical component responsible for shaping and supporting the concrete [4,5] until it attains the required strength [6]. While formwork plays an essential role in cast-in-place concrete construction [7], its limitations are also evident, particularly in terms of material consumption and construction efficiency. Conventional materials such as steel, timber, and bamboo plywood are commonly used, yet they face several challenges: (1) the need for large quantities of heavy materials [8]; (2) difficulties in reusing formwork due to the diversity of building structures [9]; (3) the relatively slow development of concrete strength, which restricts formwork turnover; and (4) high wear and tear of discarded formwork, leading to resource wastage. Therefore, advancing formwork technology is crucial for improving construction efficiency and sustainability.
A promising approach is the use of a permanent formwork system, in which the formwork remains integrated with the structure after the concrete has hardened, becoming part of the load-bearing element [10,11]. Compared with conventional formwork, this method offers multiple advantages: it eliminates the need for labor-intensive formwork removal, enhances structural performance (such as flexural behavior and axial load-bearing capacity), and promotes sustainability by reducing material waste. Previous studies have investigated a variety of materials for permanent formwork, including ultra-high-performance concrete (UHPC) [12], textile-reinforced concrete (TRC) [13], and 3D-printed concrete [14]. However, these systems generally lack internal reinforcement bars or other strengthening components, and thus still present certain limitations in terms of load-carrying capacity and crack resistance.
In cast-in-place concrete construction, formwork is particularly important for vertical members such as columns [1,15], as it not only serves a shaping function but also provides enclosure and support [16]. Steel-reinforced concrete (SRC) columns are composed of structural steel and reinforced concrete [17], and owing to their high strength [18] and excellent seismic performance [19], have been widely applied in high-rise buildings. However, the disadvantage of the substantial self-weight of SRC structures remains unavoidable.
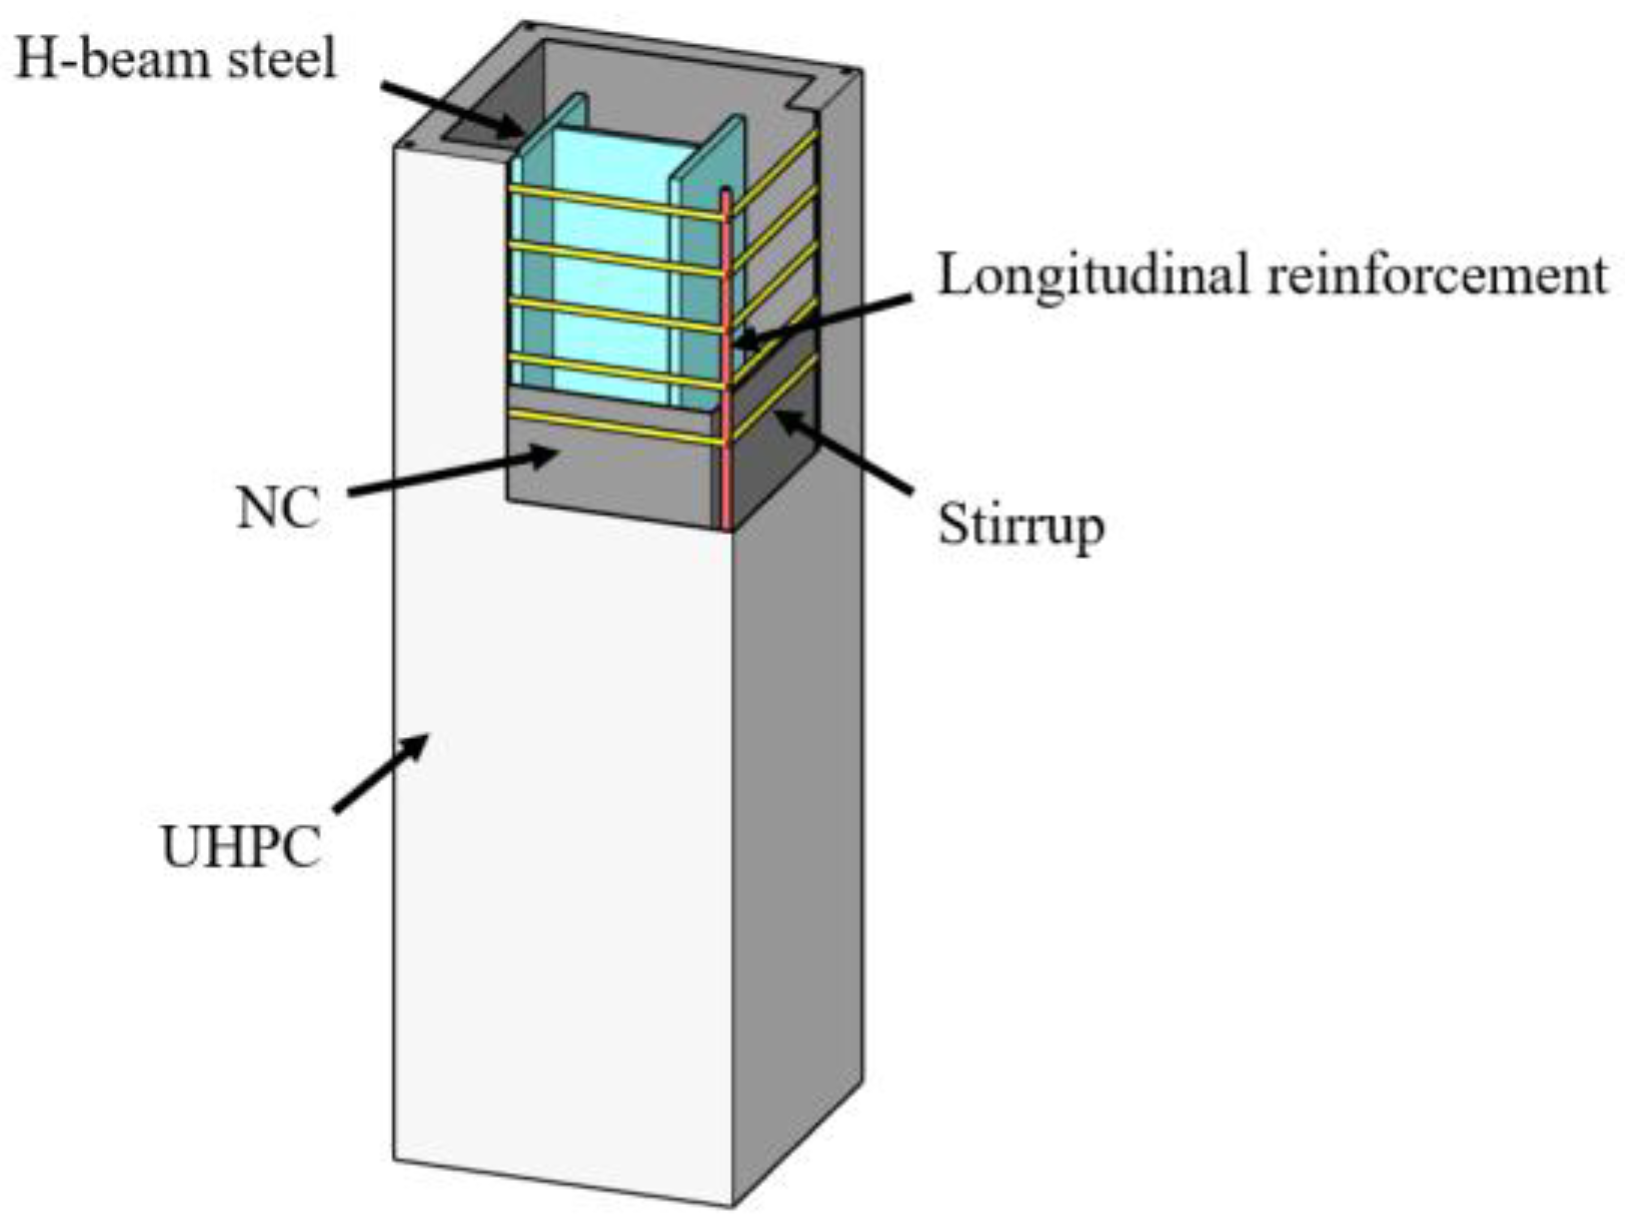
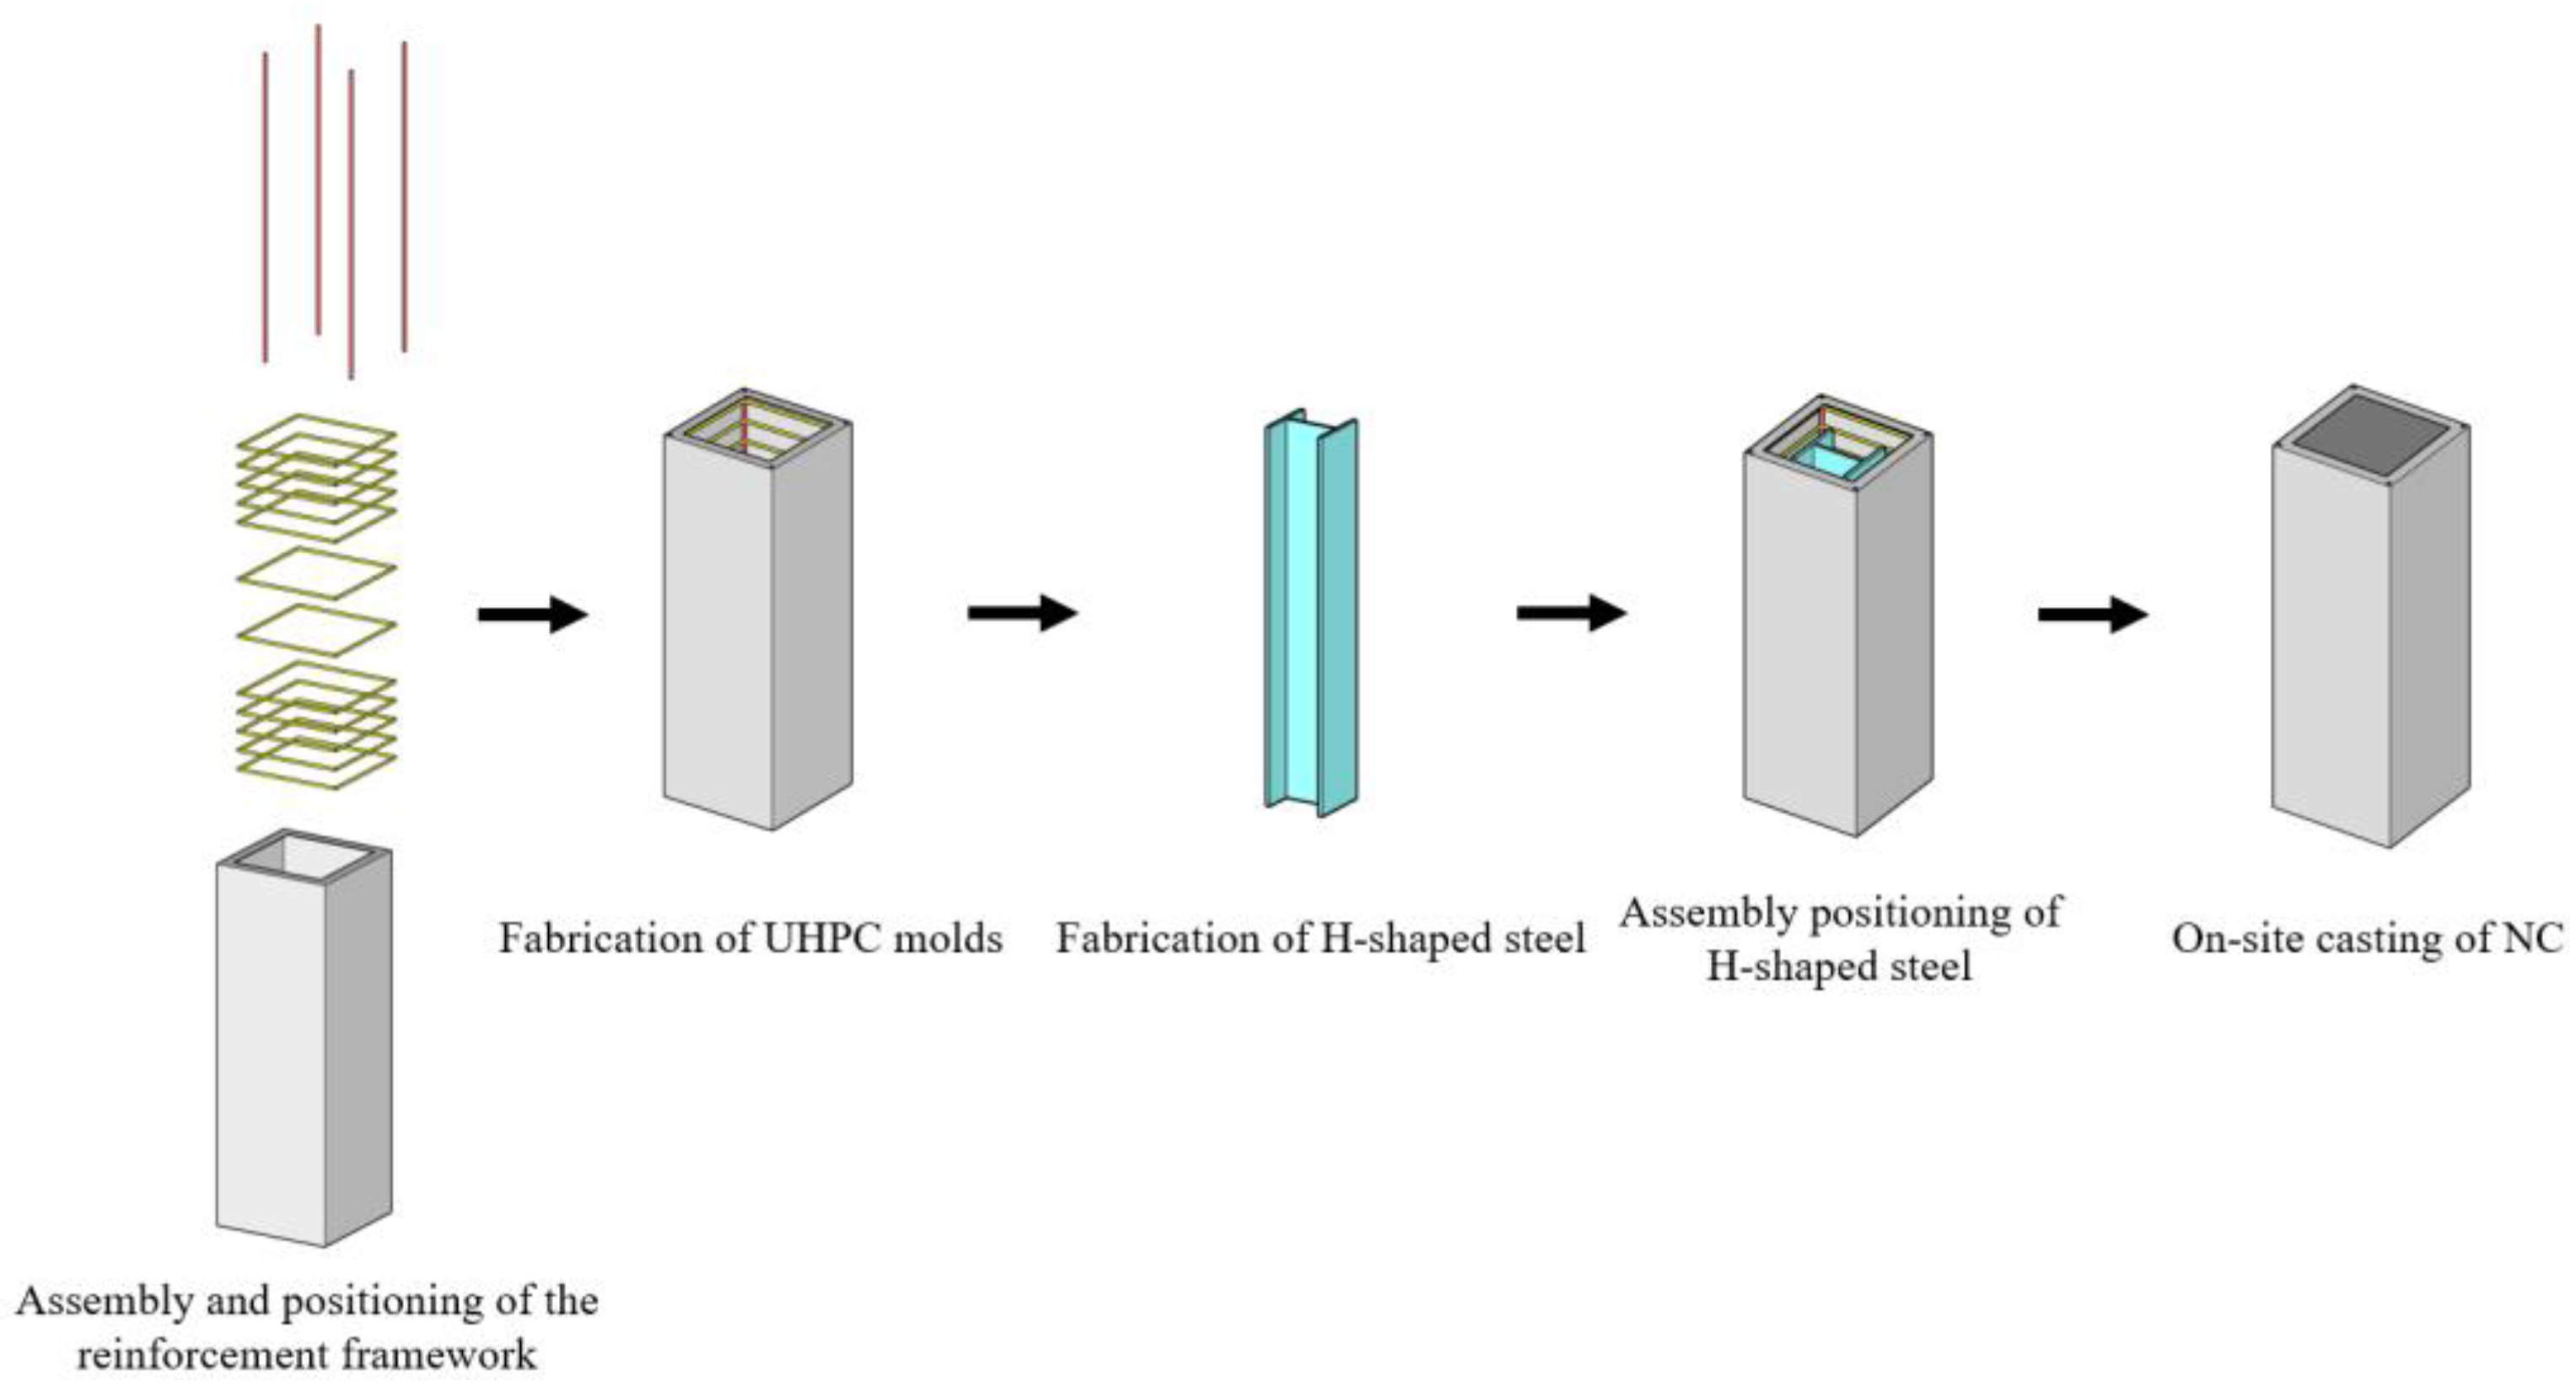
On this basis, this paper proposes a novel UHPC-SRC short-column structure. The structure consists of a UHPC permanent formwork, longitudinal reinforcement, stirrups, and H-shaped steel, forming a composite compression member. The UHPC permanent formwork does not need to be removed after construction, thereby eliminating the processes of formwork installation and dismantling, as well as effectively shortening the construction period; meanwhile, a controllable quality can be ensured during its factory prefabrication process. This innovative structure not only retains the advantage of rapid construction typical of prefabricated structures but also preserves the excellent mechanical performance of traditional cast-in-place structures. The specific configuration of the structure is shown in Figure 1, and its fabrication process is illustrated in Figure 2.
The study of permanent formwork has a long history. After the end of World War II, Germany took the lead in applying reinforced concrete as permanent formwork; in the 1980s, profiled steel sheets began to be used as permanent formwork. In 1990, some scholars proposed the use of fiber-reinforced polymer (FRP) as permanent formwork [20]; in the late 1990s, China carried out experimental research on a new structural system combining concrete with steel wire mesh [21]. However, many existing systems lack the necessary reinforcement, thereby limiting their performance.
This study addresses the limitations in existing research on the mechanical properties of UHPC-SRC short columns by establishing a finite element model to predict their compressive performance, thereby filling the research gap. The paper focuses on analyzing key parameters such as reinforcement diameter, material strength, formwork thickness, and stirrup cover thickness, and explores in depth their effects on the performance of composite columns. Ultimately, the research proposes a set of design formulas for calculating the compressive strength of such short columns, providing theoretical support and engineering references for future architectural design and applications.

2. Numerical Model of UHPC-SRC Short Columns

2.1. Constitutive Relationship

Based on the general finite element analysis software ABAQUS 2022, this study established a numerical calculation model for UHPC-SRC short columns, providing a simulation foundation for analyzing the axial compressive performance of such short columns. In ABAQUS, the concrete damaged plasticity (CDP) constitutive model was adopted. This model was originally proposed by Lubliner [22] and later improved and promoted by scholars such as Lee [23]. The CDP model can comprehensively consider the plastic deformation of concrete and the stiffness degradation caused by damage. It can also accurately describe the variation in stiffness during the unloading process [24], thereby providing a reasonable reflection of the actual mechanical behavior of concrete. Due to the distinct ductility and post-peak hardening behavior of UHPC after tensile cracking, which differs from that of conventional concrete, it is theoretically necessary to determine all parameters of the CDP model through dedicated experimental back-calculation. However, the focus of this study is on analyzing the overall structural performance of the members, rather than on a comprehensive calibration of UHPC’s constitutive parameters. To facilitate comparison with existing research findings, the geometric parameters of the CDP model were retained as the ABAQUS default values, while the stress–strain relationship was modified based on UHPC’s elastic modulus, compressive strength, and tensile strength. This approach not only ensures computational efficiency and comparability of results but also effectively reflects the overall mechanical behavior of UHPC.
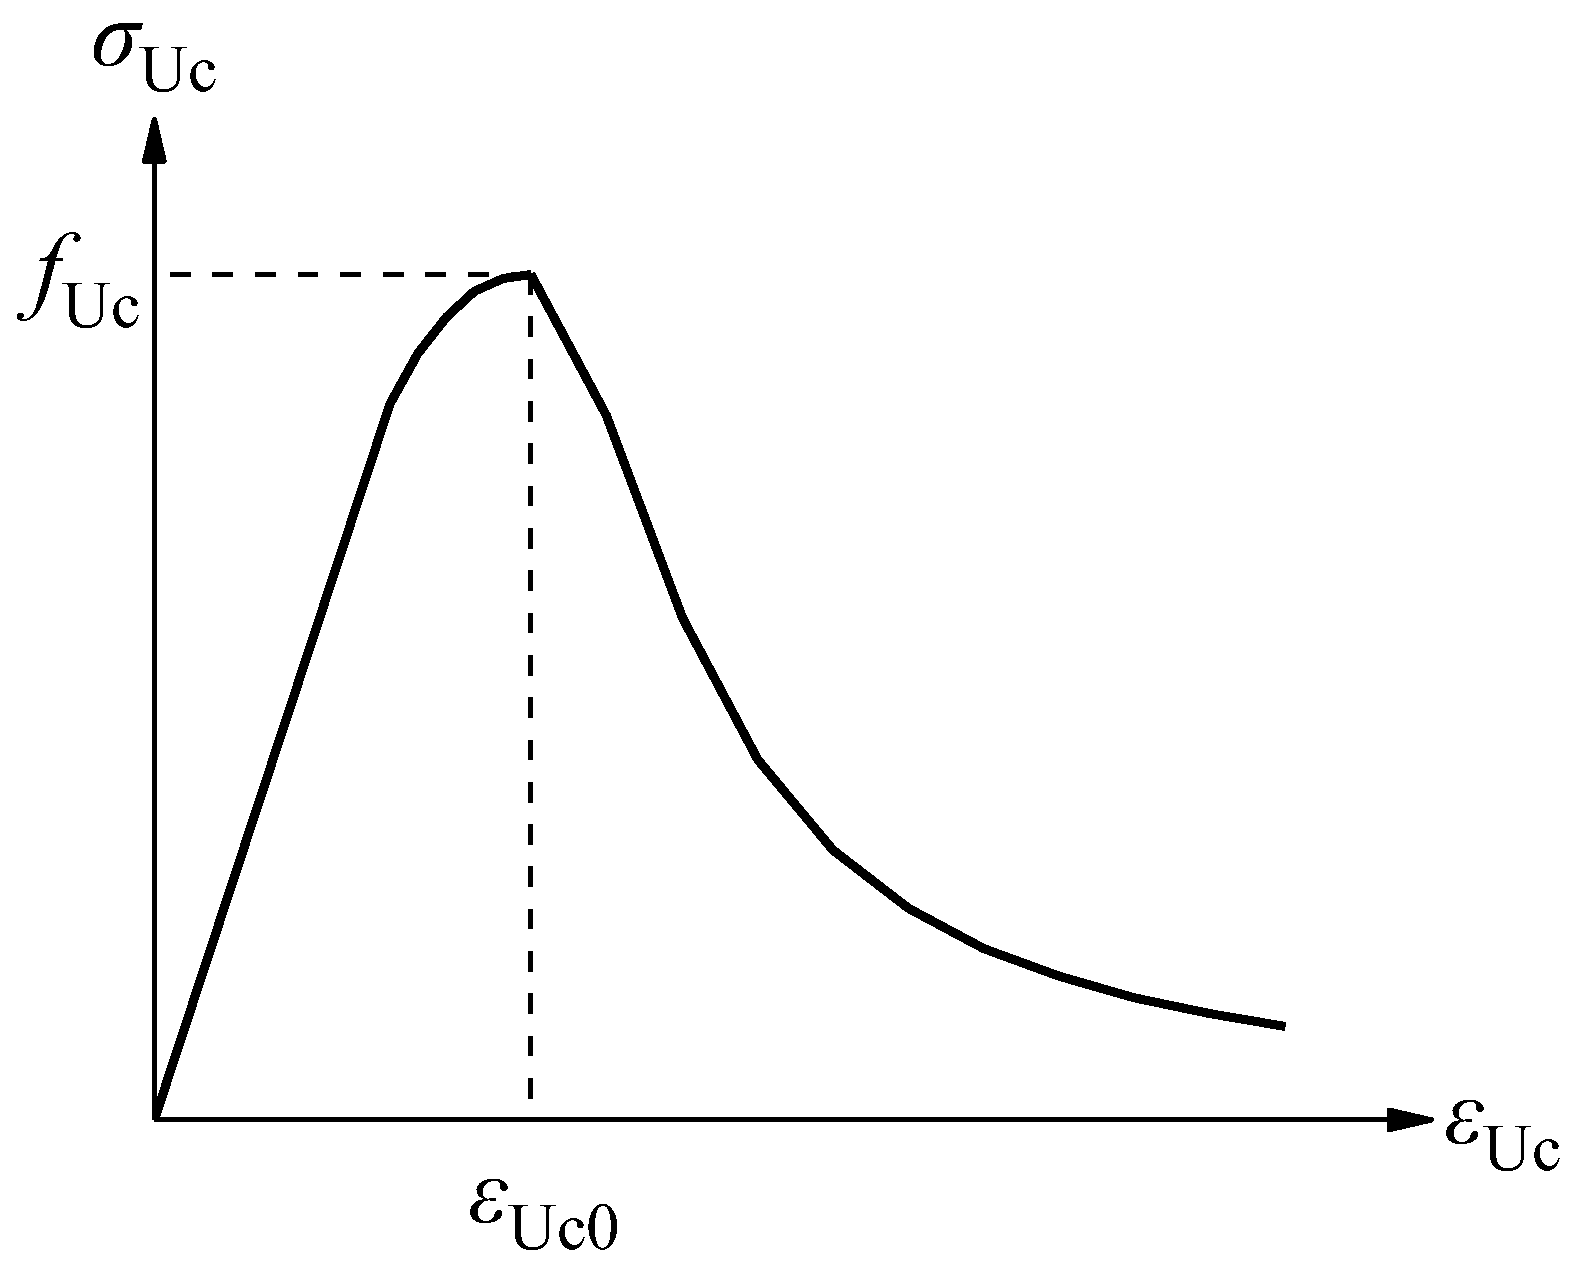
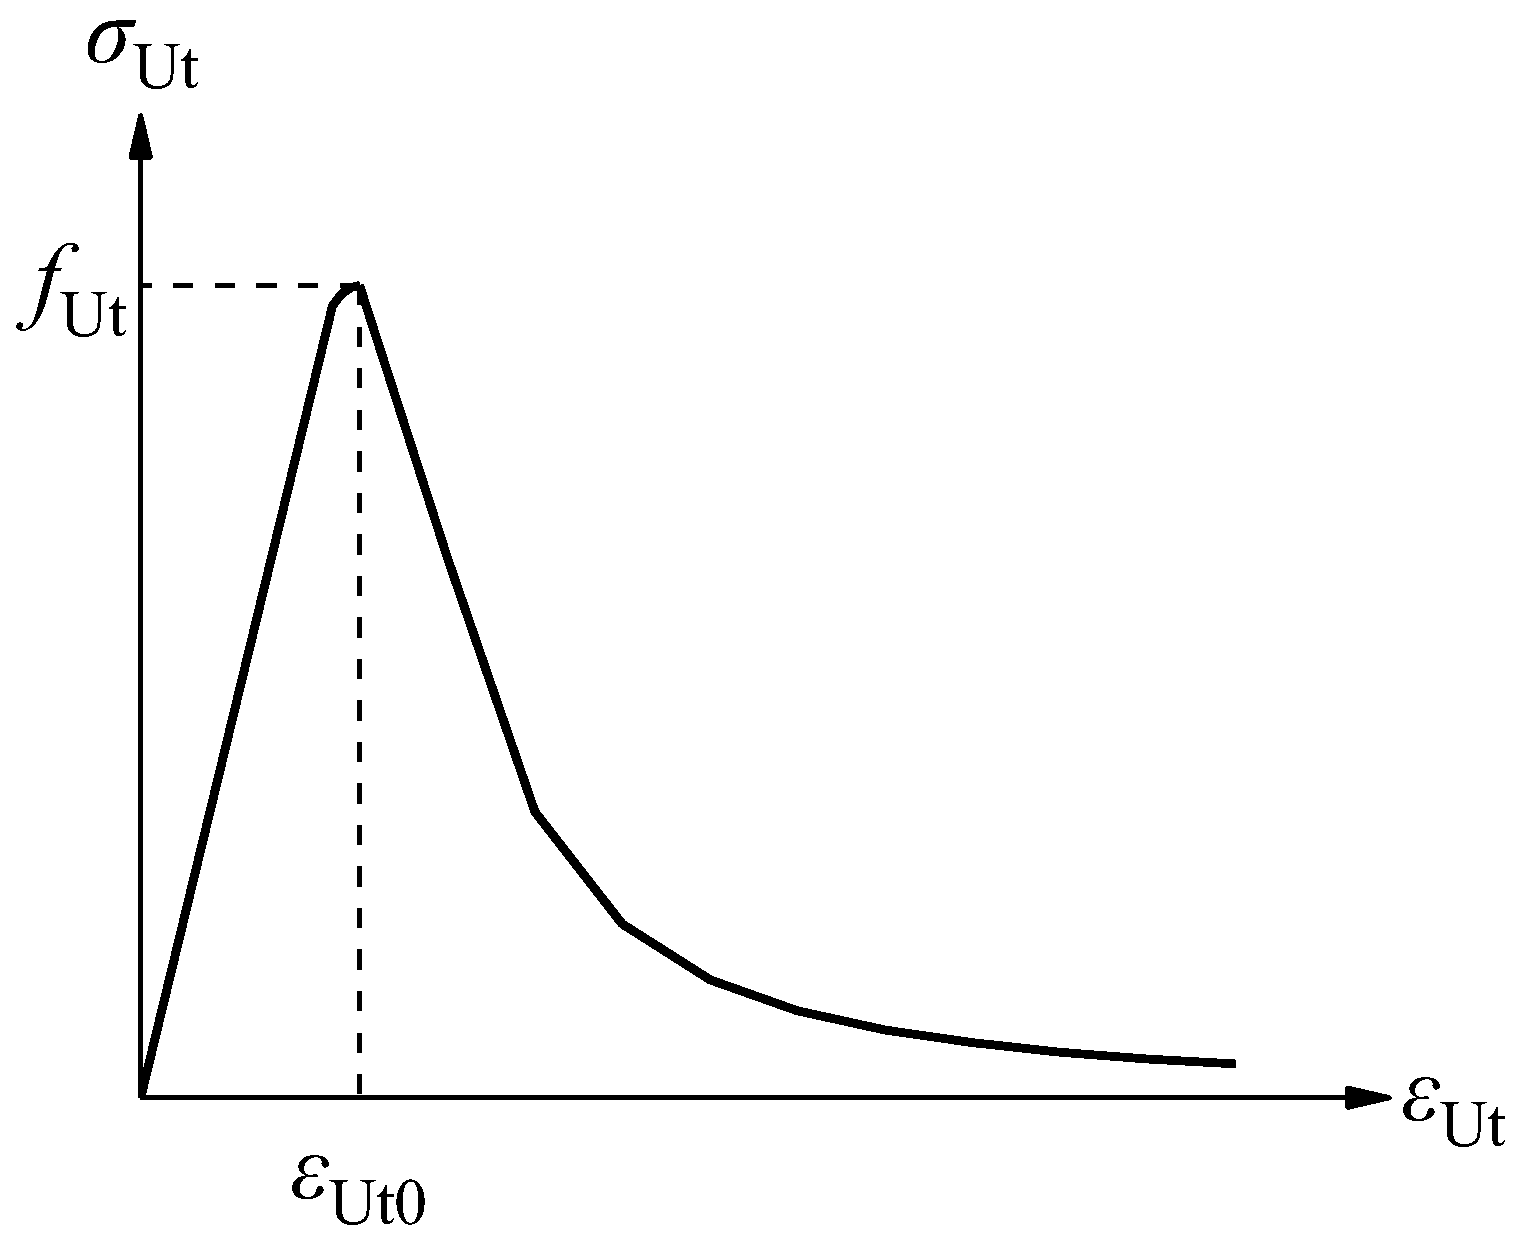
For UHPC materials, this study adopts the constitutive model proposed by Zheng [25]. Based on experimental studies of reactive powder concrete (RPC) and extensive experimental data fitting, this model establishes complete stress–strain relationships under uniaxial compression and tension, as shown in Equations (1) and (2). The model is applicable to UHPC grades of C100 and above containing steel fibers, and it can reflect the tensile performance of the material, whereby steel fibers are still able to bear tensile forces after cracking. The curves are shown in Figure 3 and Figure 4.
σ Uc f Uc = 1.55 ε Uc / ε Uc 0     1.20 ε U c / ε Uc 0 4 + 0.65 ε Uc / ε Uc 0 5 0     ε Uc / ε Uc 0   <   1 ε Uc / ε Uc 0 6 ε Uc / ε Uc 0 1 2   + ε Uc / ε Uc 0 ε Uc / ε Uc 0     1
σ Ut f Ut = 1.17 ε Ut / ε Ut 0 + 0.65 ε Ut / ε Ut 0 2 0.83 ε Ut / ε Ut 0 3   0     ε Ut / ε Ut 0   <   1 ε Ut / ε Ut 0 5.5 ε Ut / ε Ut 0 1 2.2 + ε Ut / ε Ut 0 ε Ut / ε Ut 0     1                  
In the equations, σUc and σUt denote the compressive and tensile stresses of the UHPC prism, respectively; fUc and fUt represent the compressive and tensile strengths of the UHPC prism, respectively; εUc and εUt are the compressive and tensile strains of the UHPC prism, respectively; and εUc0 and εUt0 correspond to the peak compressive and peak tensile strains of the UHPC prism, respectively. In this study, the values of the main mechanical parameters for the UHPC constitutive model are based on the relevant conversion formulas proposed by Lü et al. [26]. Specifically, the calculation methods for the compressive strength and tensile strength of the UHPC prism are given in Equations (3) and (4), respectively. The determination of peak compressive strain and peak tensile strain corresponds to Equations (5) and (6). It should be noted that fUcu in the equations represents the compressive strength of a UHPC cubic specimen with a side length of 100 mm.
f Uc = 0.88 f Ucu
f Ut = 2.14 f Uc   12.8  
ε U 0 = 377 f Uc     923   ×   10 6
ε Ut 0   = 22.9 f Ut   ×   10 6
The constitutive relationship of normal concrete (NC) adopts the segmented model proposed by Guo [27], which is suitable for NC of grades C20 to C40 and is used to describe its mechanical behavior. This model has been verified by a large number of experiments and can accurately reflect the stress characteristics of NC under different loads. Its mathematical expressions are shown in Equations (7) and (8). In the formula, σc and σt represent the compressive stress and tensile stress of the NC prism, respectively; fc and ft are the compressive strength and tensile strength of the NC prism, respectively; εc and εt are the compressive strain and tensile strain of the NC prism, respectively; ε0 and εt0 denote the peak compressive strain and peak tensile strain of the NC prism, respectively; α and β are the coefficients for the ascending and descending branches of the uniaxial compressive stress–strain curve, respectively; γ is the coefficient for the descending branch of the uniaxial tensile stress–strain curve.
σ c f c = α ε c / ε 0 + ( 3 2 α ) ε c / ε 0 2 + ( α 2 ) ε c / ε 0 3 ε c   <   ε 0 ε c / ε 0 β ε c / ε 0 1 2 + ε c / ε 0 ε c     ε 0
σ t f t = 1.2 ε t / ε t 0 0.2 ε t / ε t 0 6 ε t   <   ε t 0 ε t / ε t 0 γ ε t / ε t 0 1 1.7 + ε t / ε t 0 ε t     ε t 0    
This study adopts the model proposed by Yu et al. [28] to define the damage parameters for UHPC and NC. The damage effect only needs to be considered when the stress endured by the concrete reaches its tensile or compressive strength limit; prior to this, no cracks have formed within the material. Under uniaxial loading conditions, the damage index dc(t) of the concrete in tension and compression directions can be calculated using Equation (9).
d c ( t ) = 0 0     ε c ( t )     ε 0 ( t 0 ) 1     σ c ( t ) f c ( t ) ε c ( t )     ε 0 ( t 0 )
For the reinforcement, this study assumes that it follows the ideal elastic-plastic constitutive model. Before reaching the yield point, the reinforcement exhibits linear elastic deformation. Once the yield strength fy is attained, it enters the plastic stage, after which the stress remains at the yield strength while plastic strain continues to increase, displaying typical plastic behavior. The corresponding stress–strain relationship is given in Equation (10). In the formula, σs denotes the stress in the reinforcement; Es is the elastic modulus of the reinforcement; εs represents the strain in the reinforcement; fy and fy are both the yield strengths of the reinforcement; εy and εy are both the yield strains of the reinforcement. The relevant parameters of the CDP model in this paper are shown in Table 1.
σ s = f y ε s   <   ε y E s ε s ε y     ε s   <   ε y f y ε y     ε s
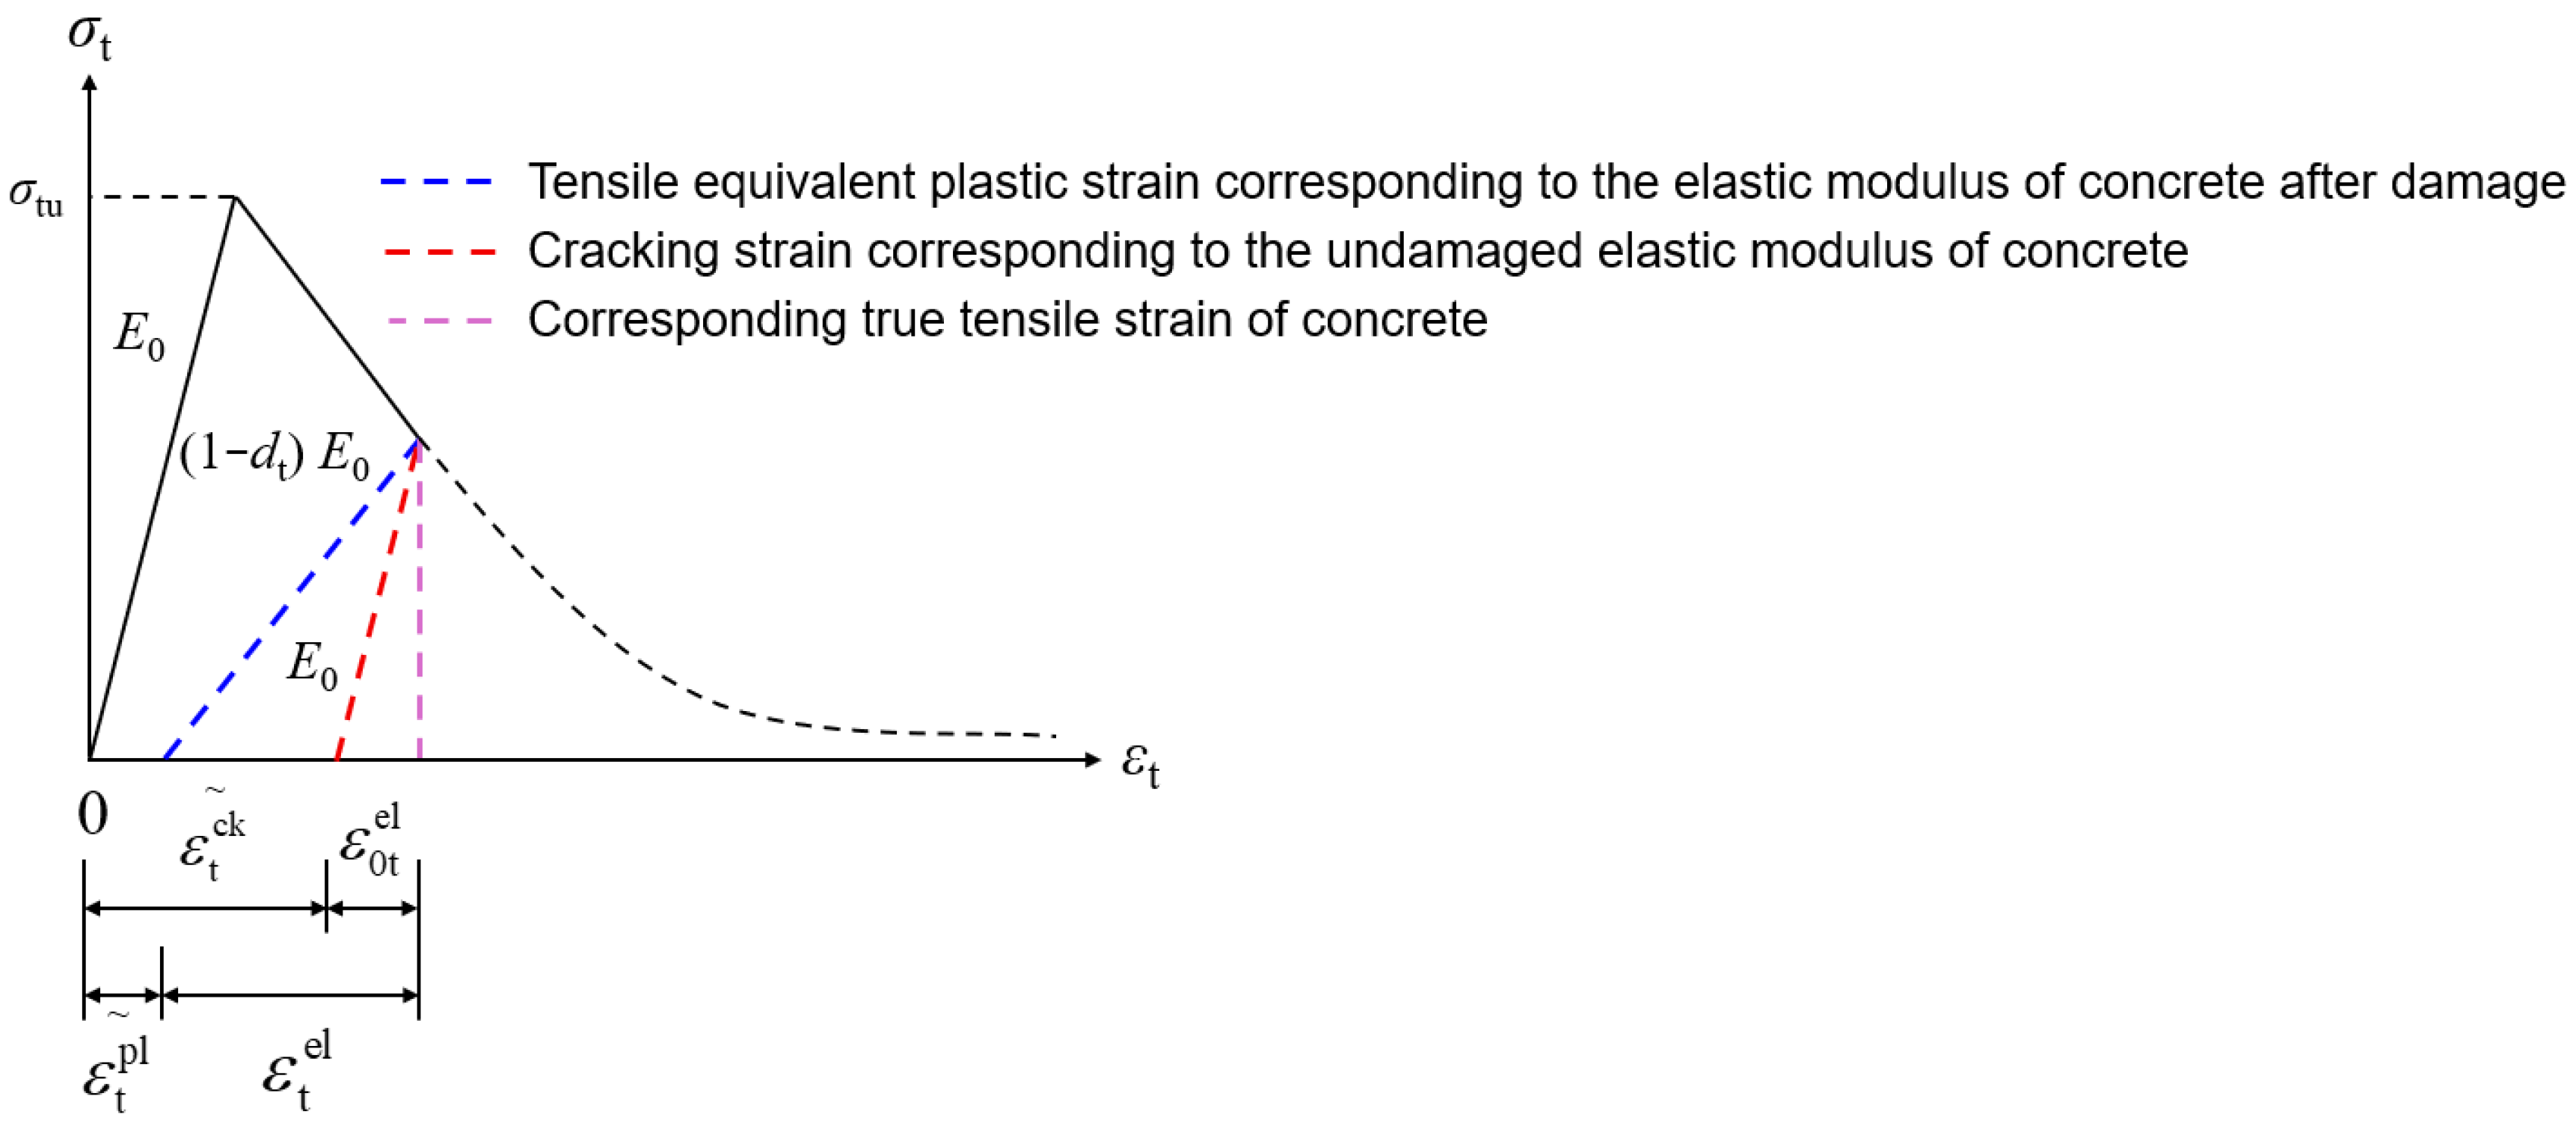
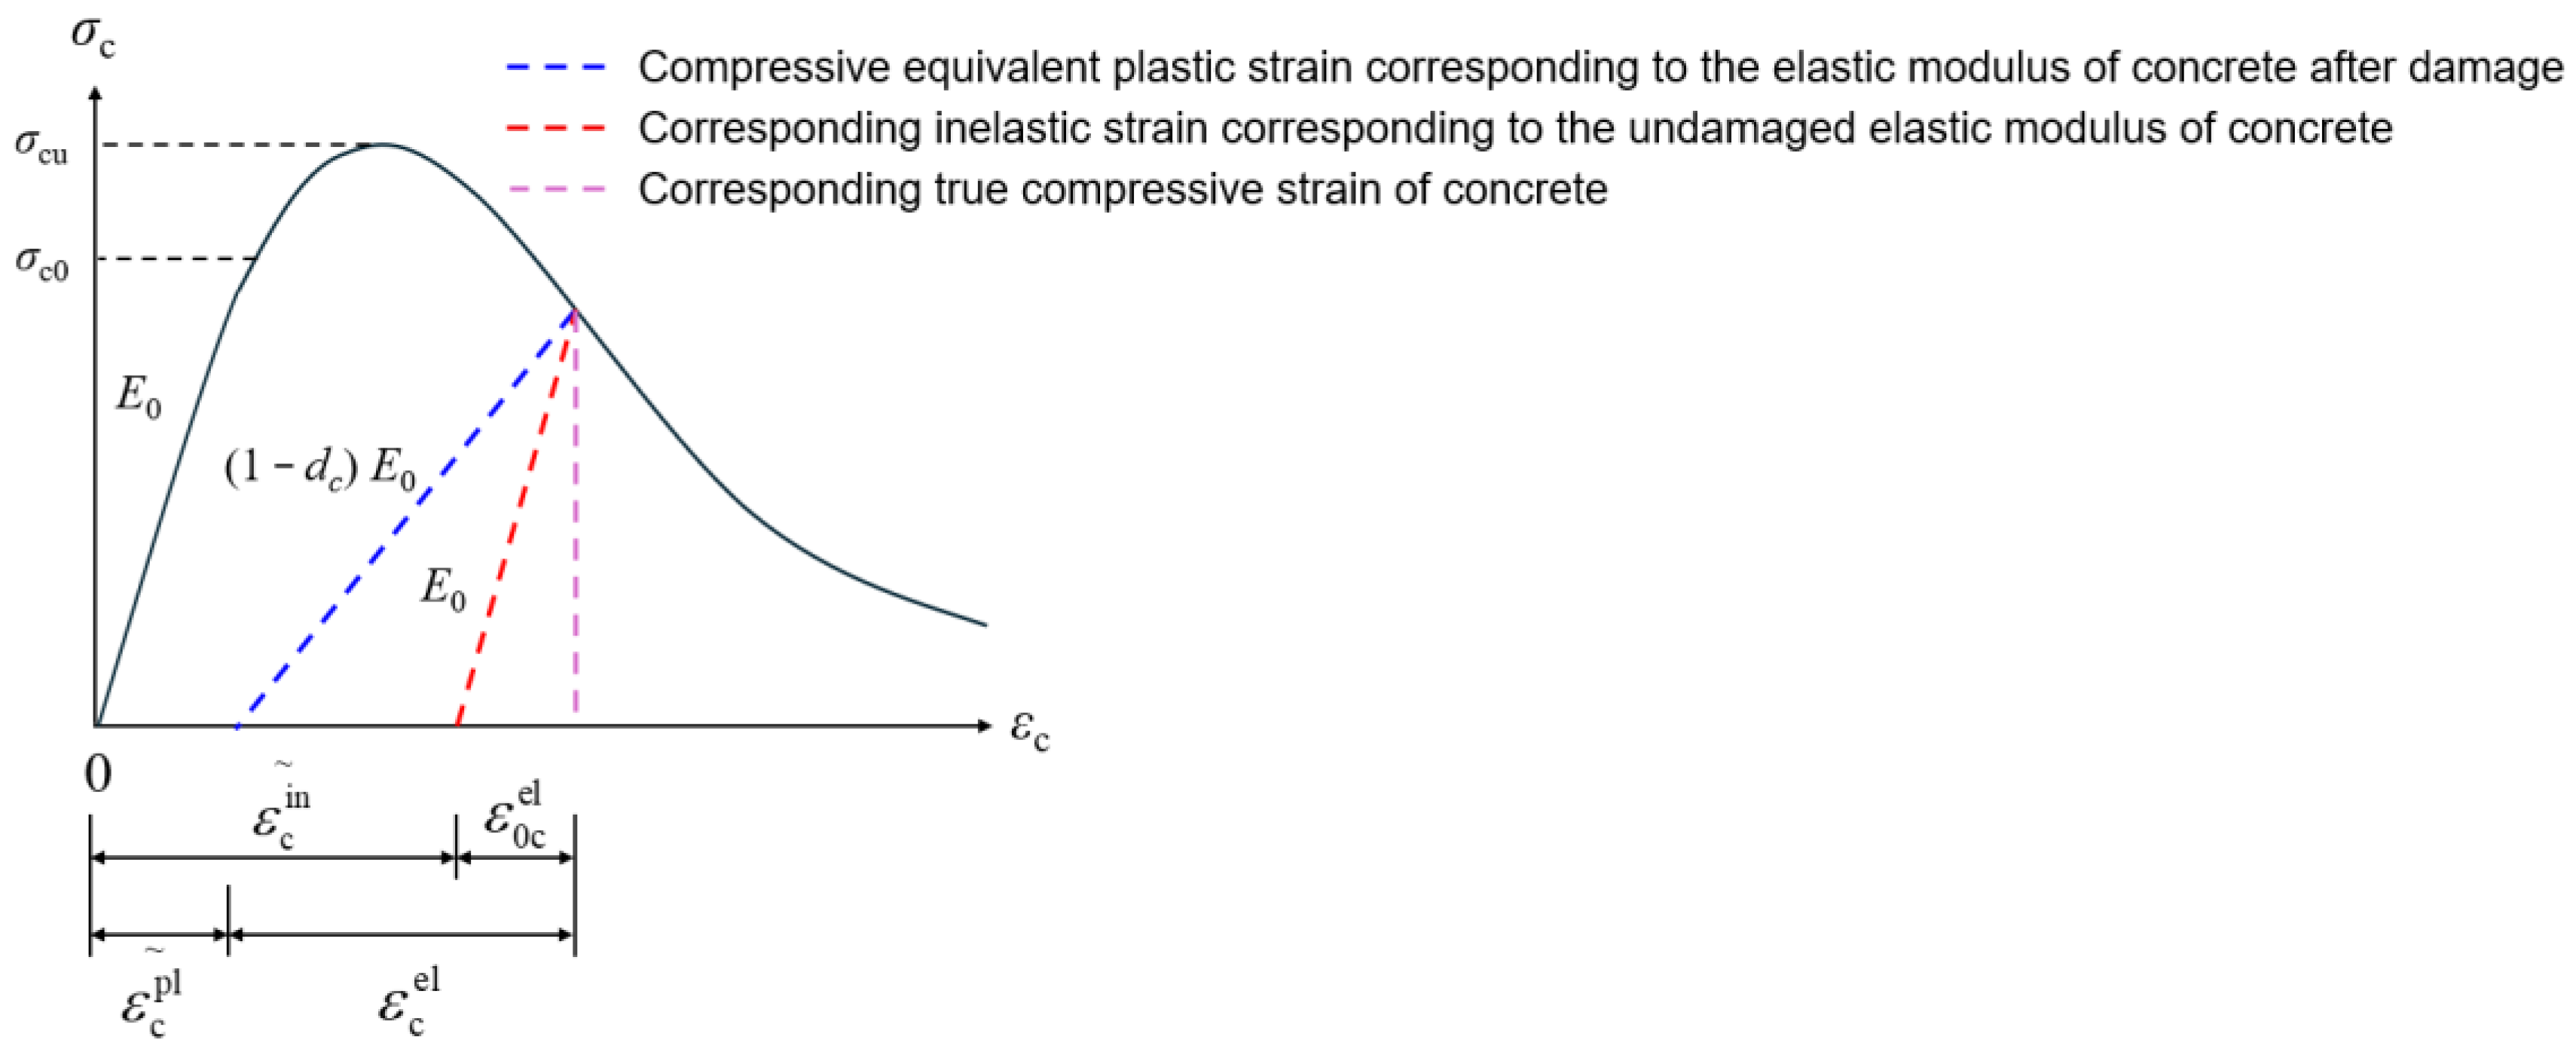
The CDP model, by introducing damage variables in combination with plasticity theory, can effectively characterize the entire transition process of concrete from the elastic stage to the plastic stage under both tensile and compressive states. When concrete is subjected to uniaxial tension or uniaxial compression, the inelastic deformation beyond the elastic range is regarded as damage, and the evolution of damage is represented and controlled by equivalent plastic strain. In the tensile case, a tensile damage factor dt is defined, and its mechanical response can be divided into the elastic stage and the stiffness degradation stage, as shown in Figure 5. In the compressive case, a compressive damage factor dc is defined, and its deformation process consists of an elastic stage, a stress hardening stage, and a softening stage, as shown in Figure 6.
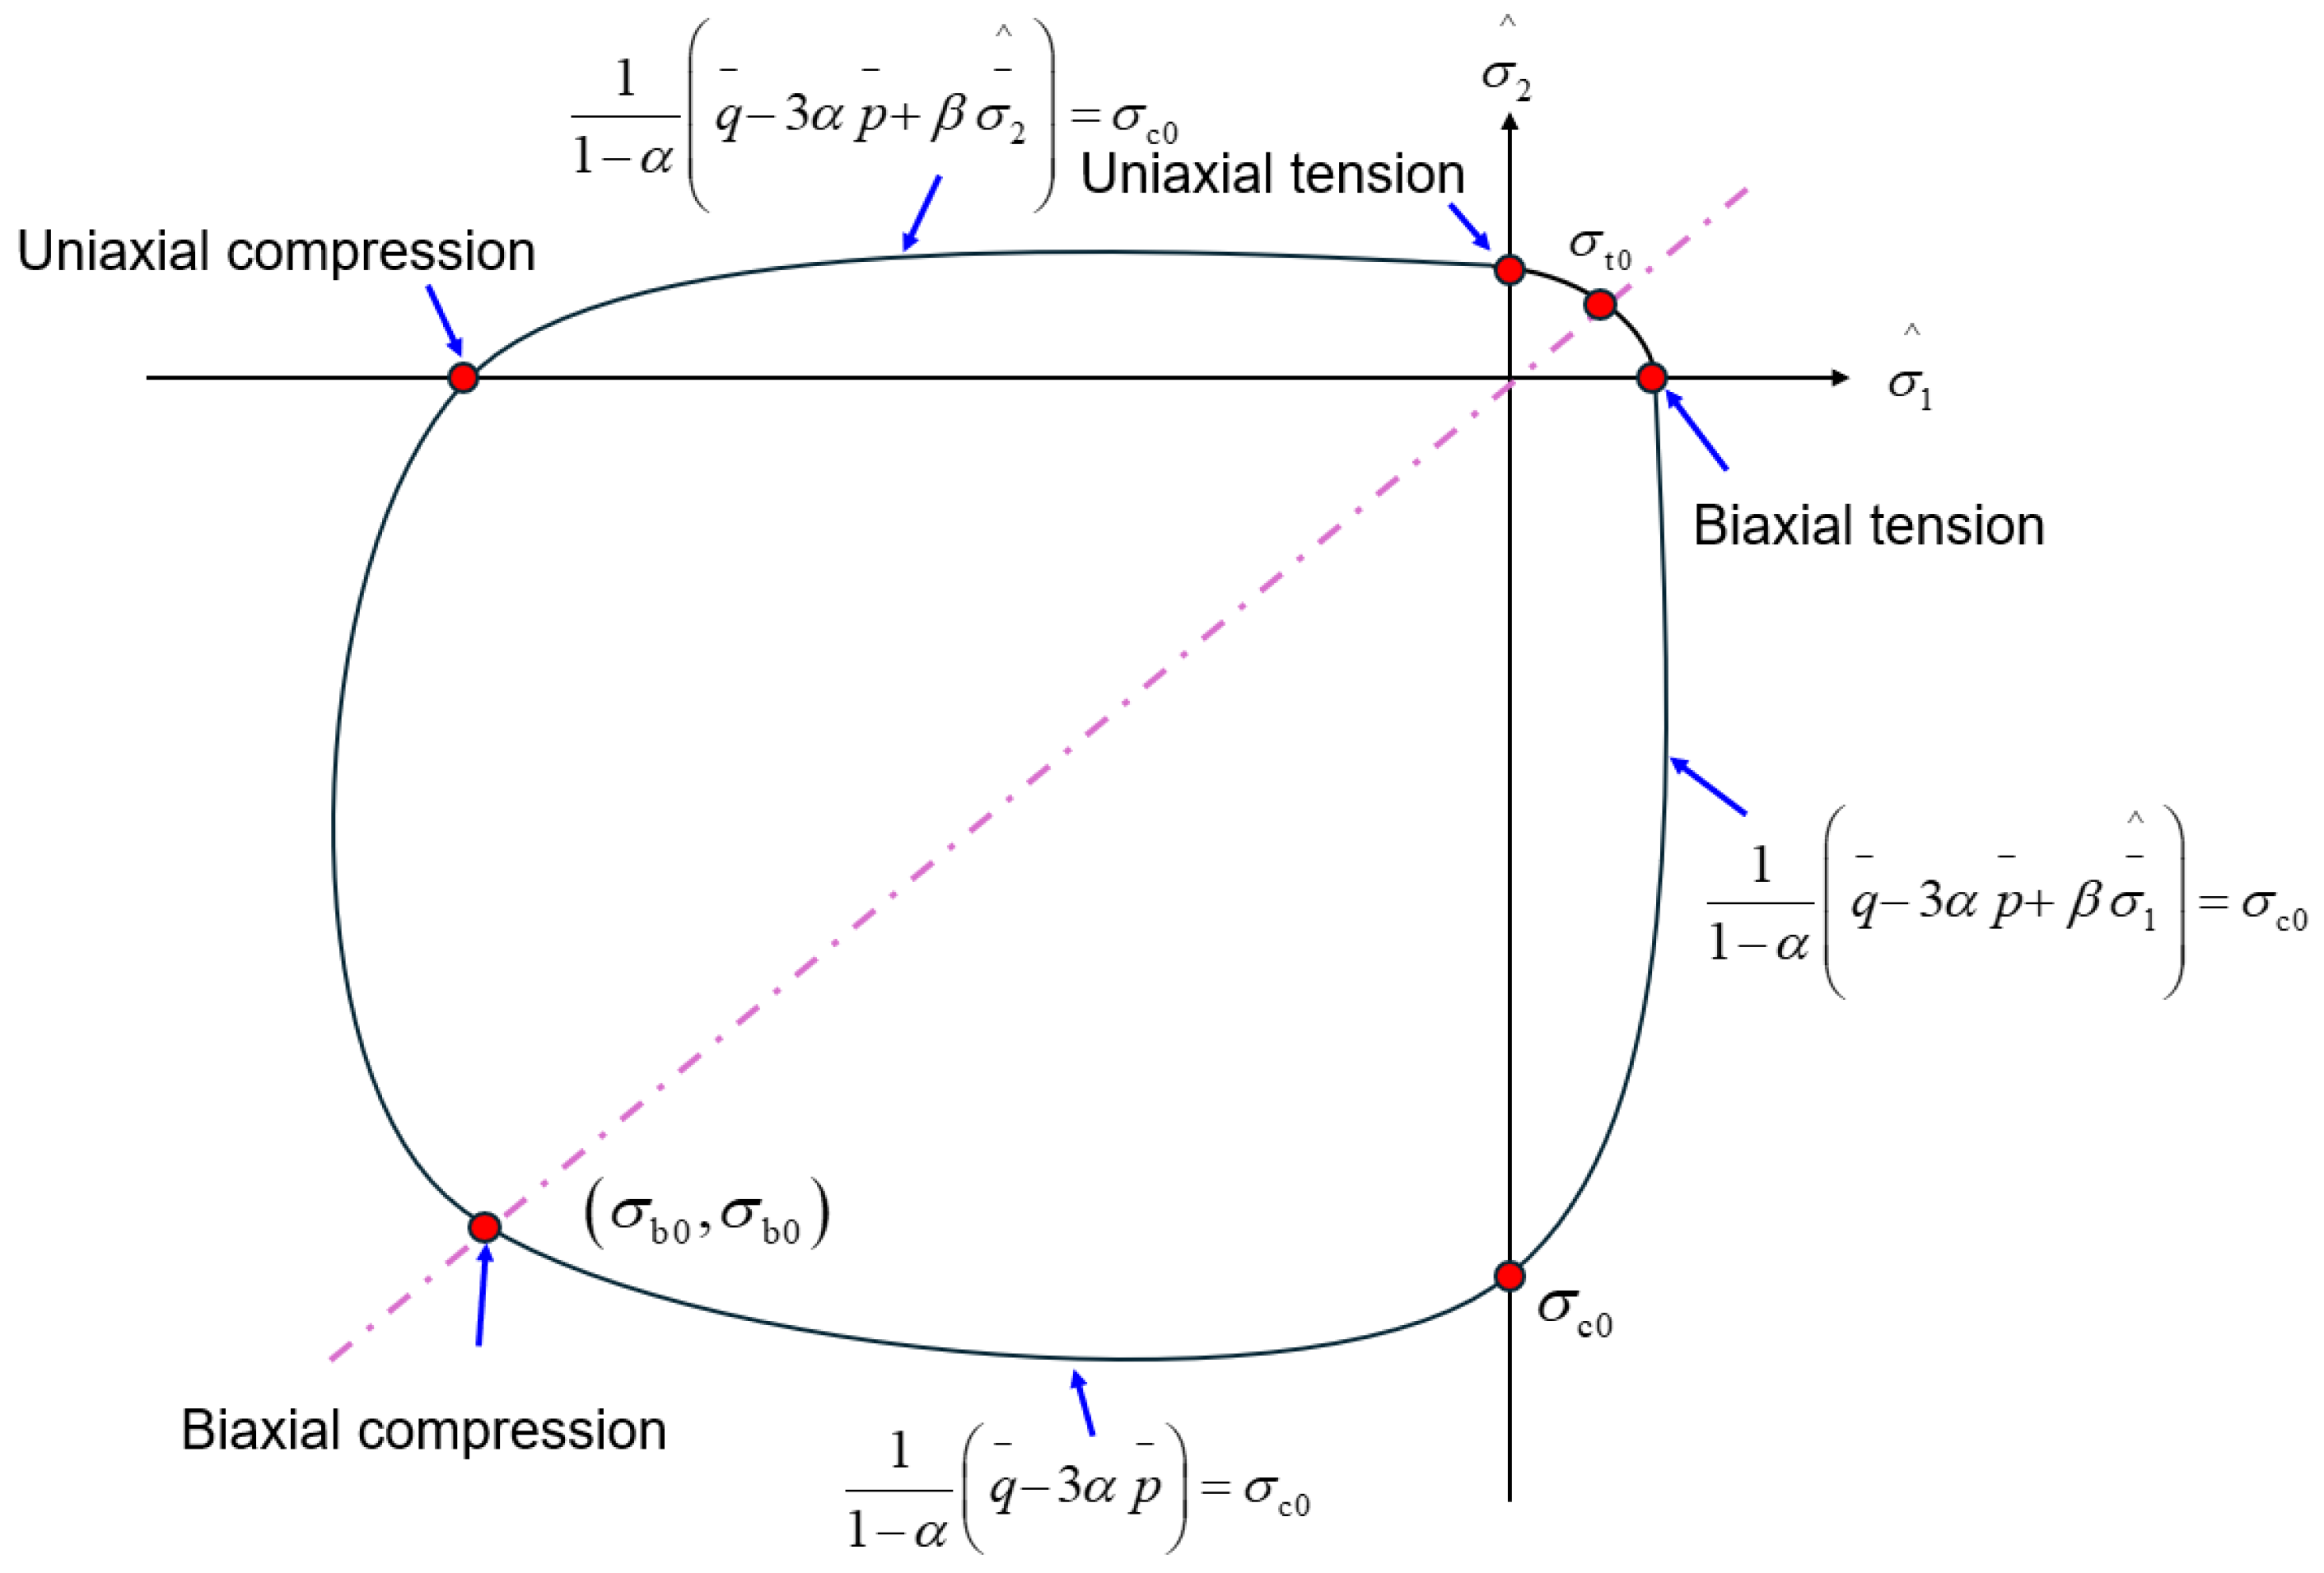
The theoretical framework of the CDP model is based on three core assumptions: the initial yield criterion, the hardening law, and the flow rule. The initial yield criterion is used to reduce a complex multiaxial stress state to an equivalent stress, which is then compared with the material’s yield strength to determine whether plastic deformation occurs. When the equivalent stress exceeds the yield strength, the material enters the plastic stage. The hardening law describes the evolution of the yield surface during plastic deformation. For example, under the Mises criterion, the yield surface expands isotropically, and the yield stresses in compression and tension are approximately equal. The flow rule defines the direction of the plastic strain increment after yielding, and its form depends on the yield surface and the hardening law. Once the first two are specified, the flow rule is consequently determined. The yield surface of the model is shown in Figure 7.
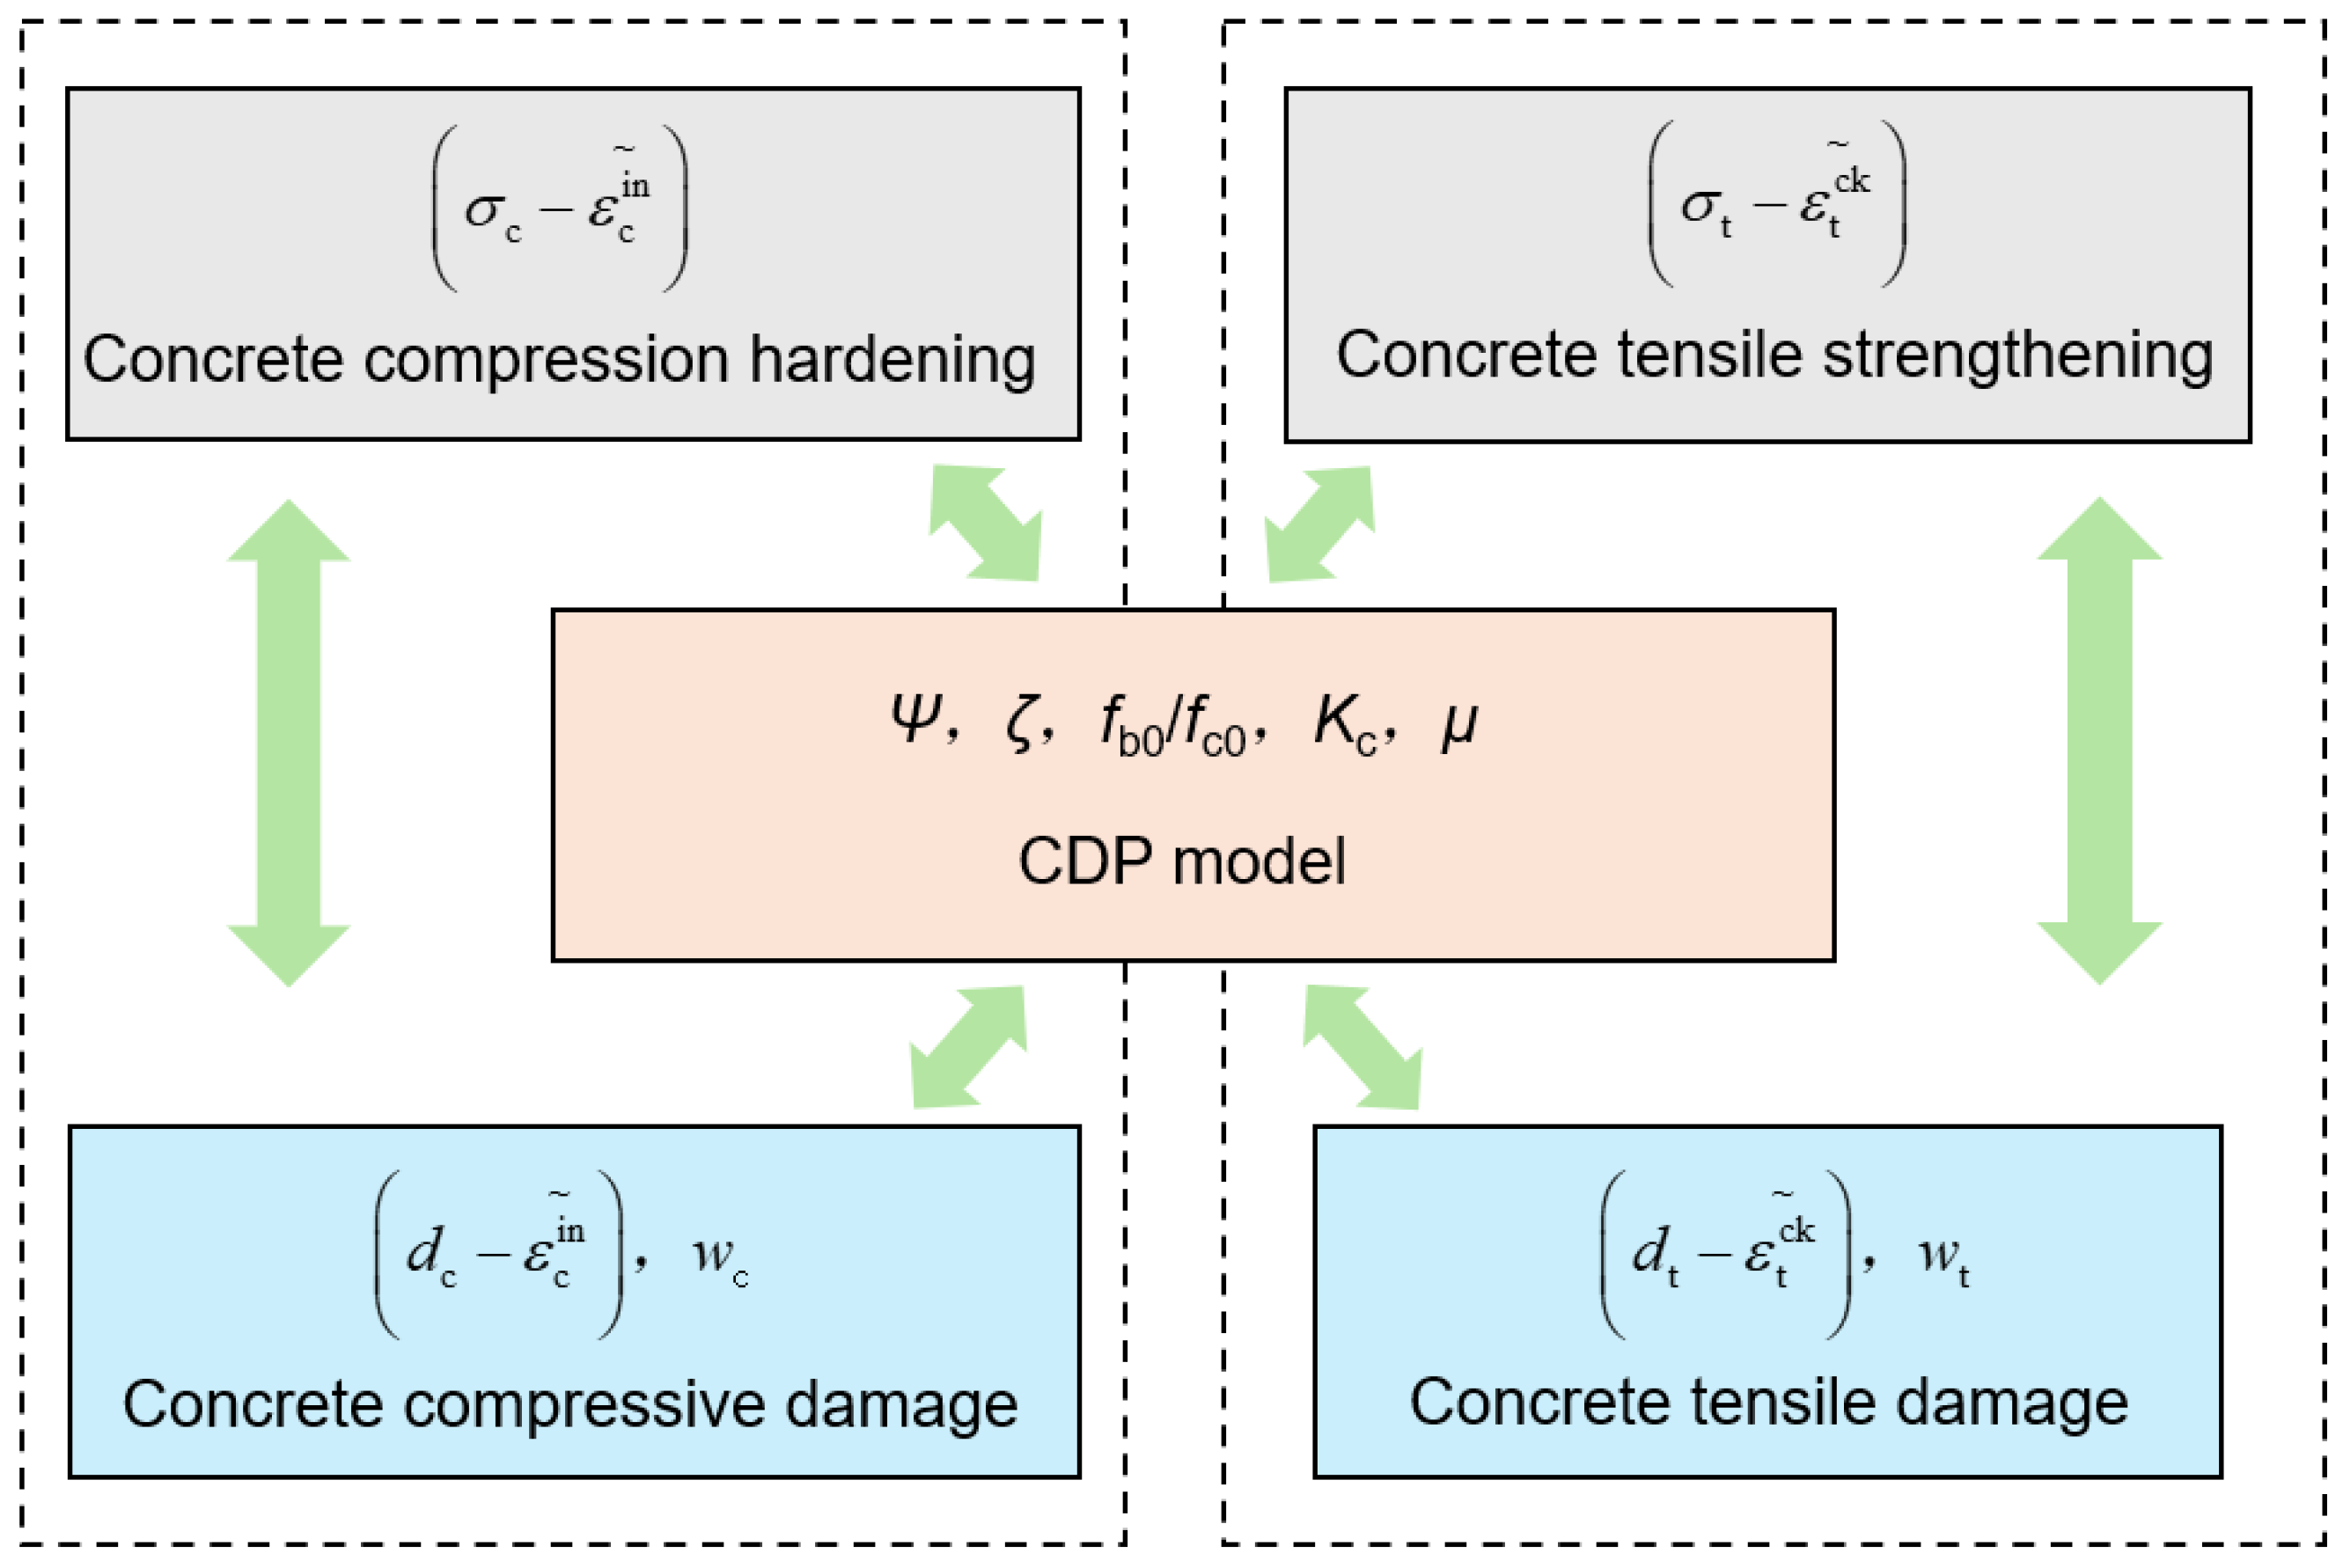
This model integrates elasticity, plasticity, and damage mechanisms in an organic manner, enabling a relatively accurate simulation of the response characteristics of concrete under loading. In terms of parameter settings, the elastic modulus E and Poisson’s ratio ν govern the deformation characteristics in the elastic stage; plasticity parameters such as dilation angle and eccentricity influence the yielding behavior; the initial yield stress ratio and invariant stress ratio determine the exact location of the yield surface; viscous parameters help improve numerical convergence during the softening stage and stiffness degradation process. Through the appropriate selection of these parameters, the CDP model can realistically reproduce the nonlinear behavior and damage evolution of concrete under loading. Parameter definitions are shown in Figure 8.

2.2. Finite Element Model

To balance computational accuracy and efficiency, the rigid cushion, UHPC formwork, cast-in-place NC layer, and H-shaped steel are all modeled using eight-node reduced integration solid elements (C3D8R). Since the primary function of the reinforcement is to withstand tension and compression, it is typically modeled using linear elements, with shear effects and complex loading conditions neglected. In this study, both the longitudinal reinforcement and stirrups are simulated using two-node three-dimensional truss elements (T3D2), in which each node possesses three degrees of freedom. This design allows for a more accurate representation of the actual structural behavior under loading.
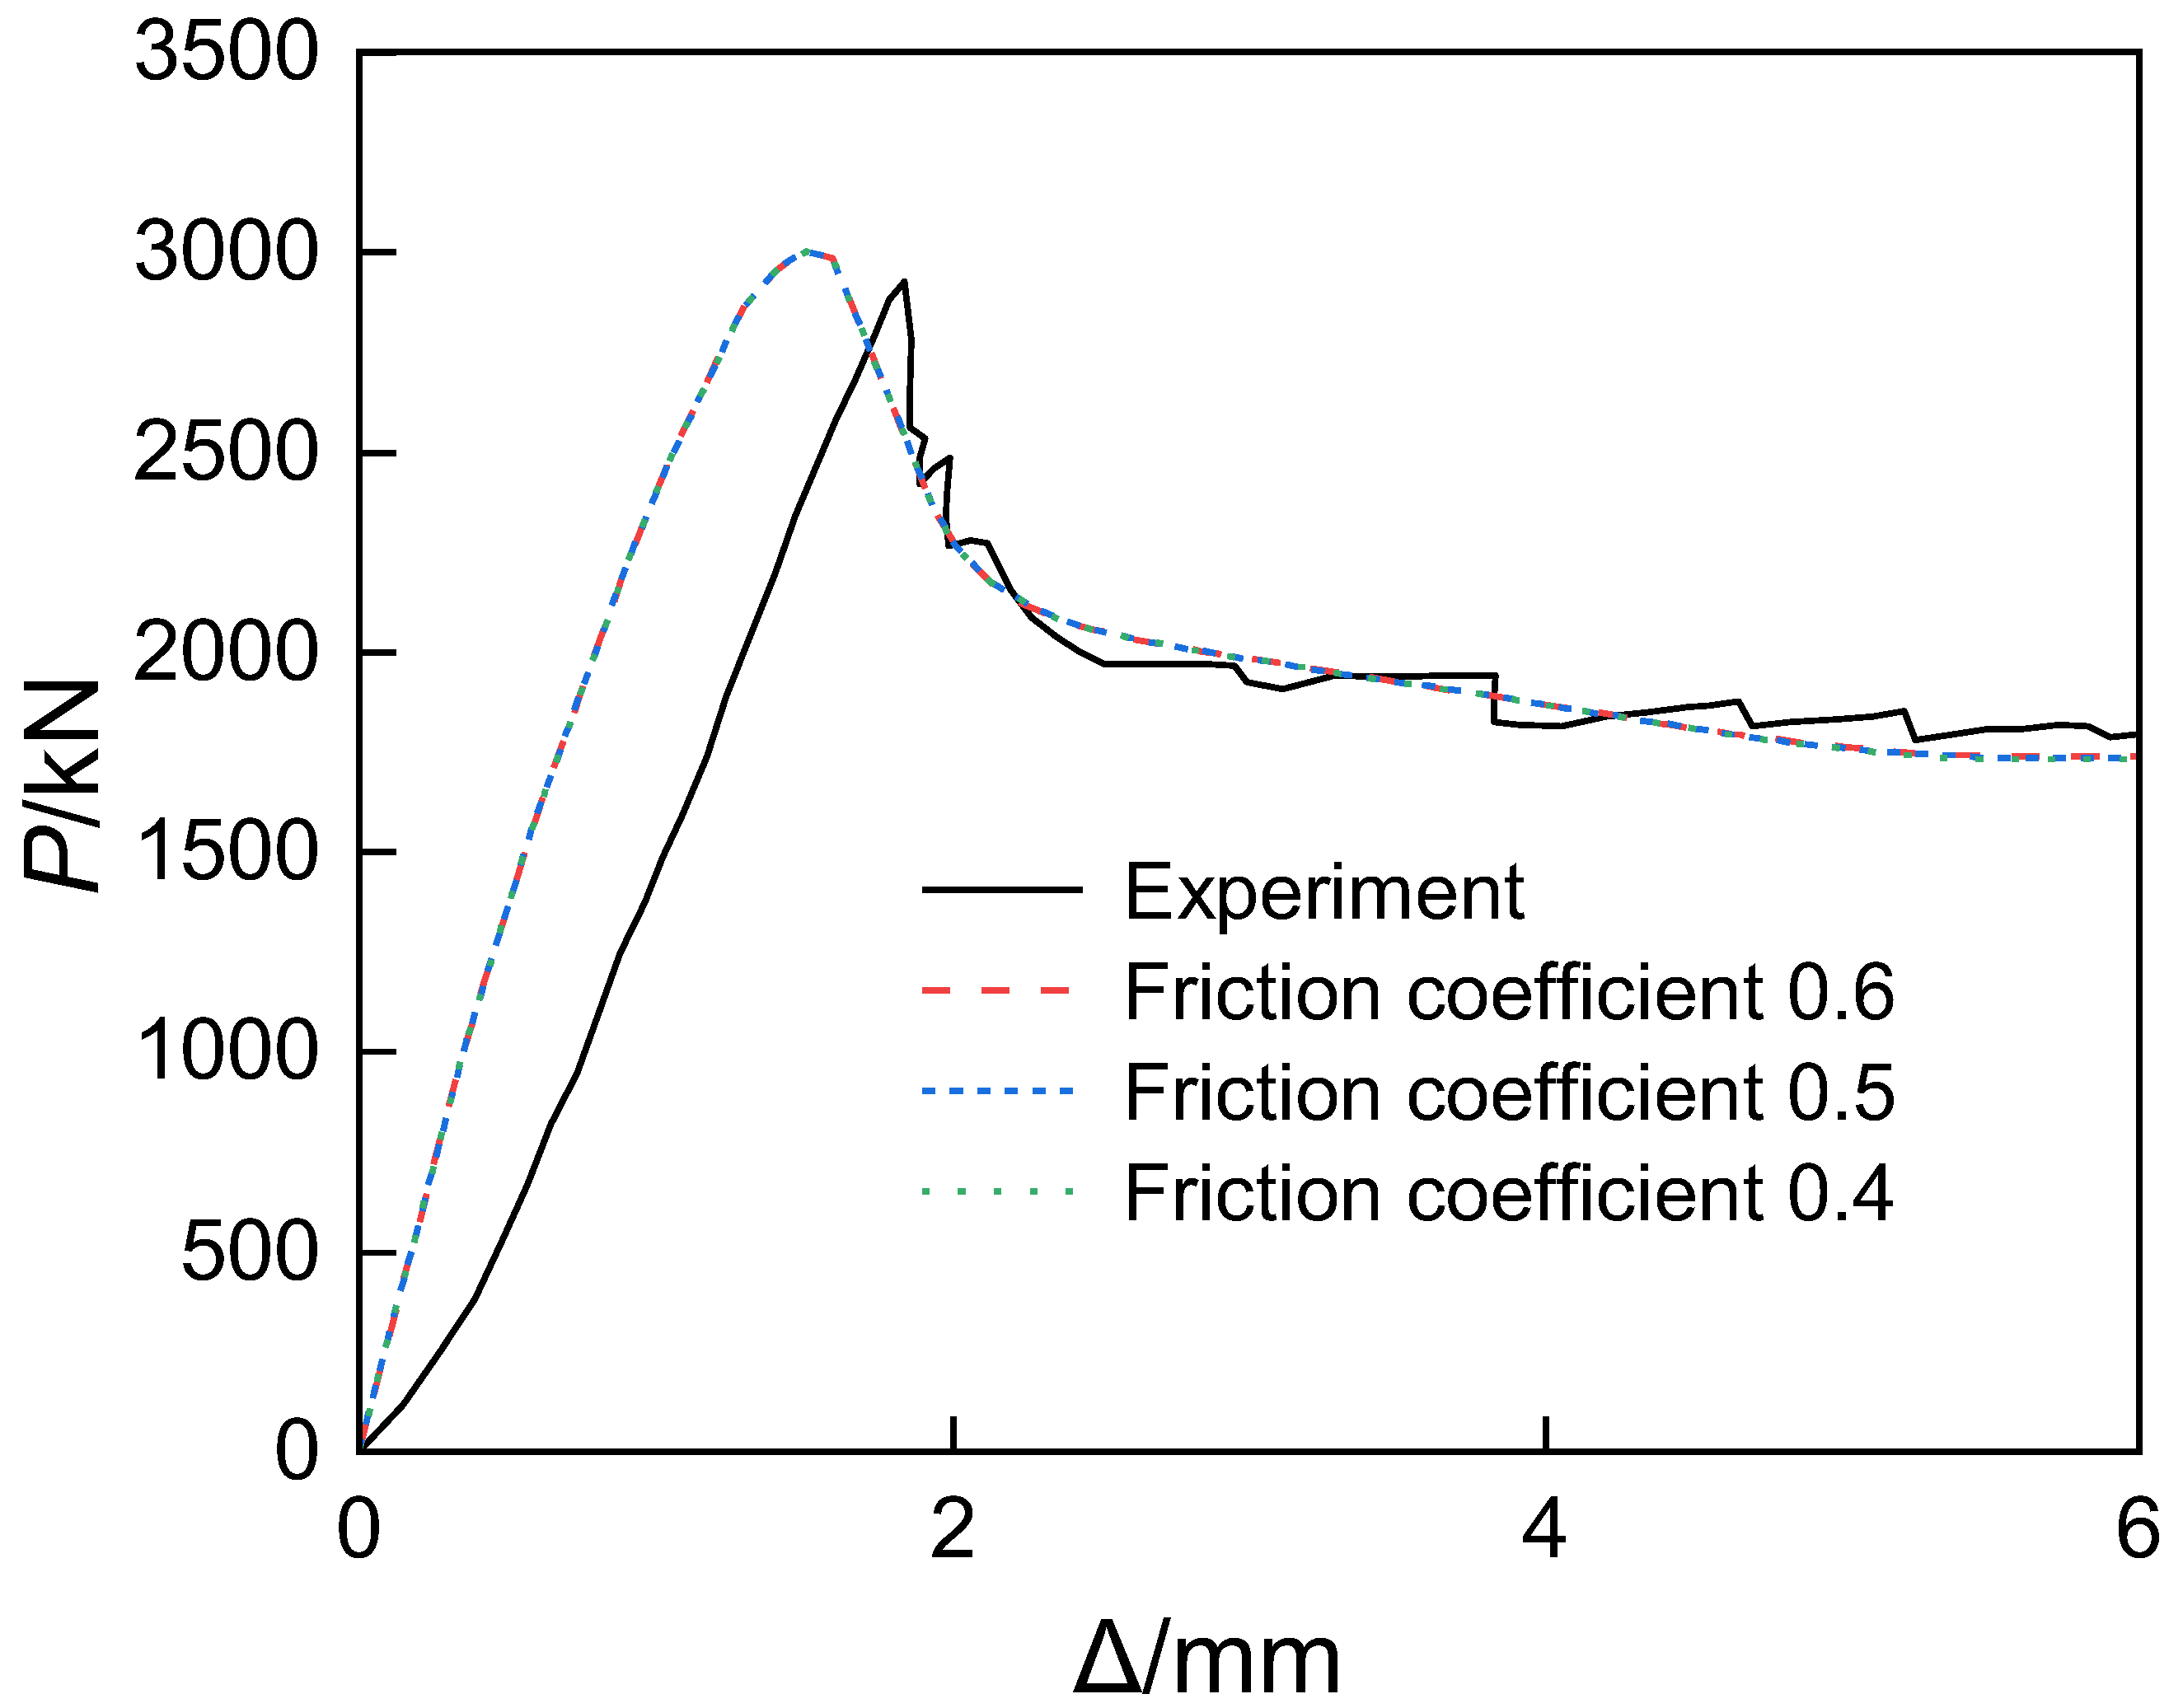
In handling the material interfaces, the interaction between the reinforcement and the surrounding concrete was defined using the Embedded Region option in ABAQUS. For the interfaces between the UHPC panel and the cast-in-place layer, as well as between the cast-in-place layer and the H-shaped steel, hard contact was adopted in the normal direction, while the Coulomb friction criterion was applied in the tangential direction, typically with a friction coefficient of 0.6 [29]. A sensitivity analysis was conducted for friction coefficients of 0.4, 0.5, and 0.6, by comparing the axial load–displacement curves of short columns, evaluating computational efficiency, and calculating the ratio of ultimate loads obtained from experiments and simulations, in order to determine the optimal friction coefficient.
The analysis results indicate that, under the three friction coefficients, the axial load–displacement curves of the short columns obtained from numerical simulations exhibit essentially the same trend and are consistent with the experimental results, as shown in Figure 9. As presented in Table 2, when the friction coefficient is 0.6, the simulation results show the highest agreement with the experiments, achieving an accuracy of 0.99, which is superior to the cases with friction coefficients of 0.5 and 0.4 (both 0.98).
In contact analysis, the accuracy of the friction coefficient directly affects the prediction of interfacial stress and deformation; therefore, higher precision implies greater reliability of the model’s mechanical response. Although the total number of incremental steps is 137 when the friction coefficient is 0.6—slightly higher than the result for 0.5—it has the fewest total iterations, only 10, indicating faster convergence per step and better algorithmic stability. In nonlinear contact analysis, reducing the number of iterations helps avoid numerical divergence and convergence difficulties.
In addition, when the friction coefficient is 0.6, the computation time is 11 min and 03 s, which is less than one minute longer than the shortest time obtained at 0.5, yet it significantly improves accuracy. From an engineering perspective, this difference in computation time is negligible. In summary, a friction coefficient of 0.6 achieves a sound balance among accuracy, convergence, and computational efficiency, while closely matching actual physical conditions. Therefore, it is the optimal parameter in this study to ensure both numerical stability and engineering reliability.
In Reference [30], the traction–separation law and the bilinear cohesive model are discussed, in which the interfacial behavior is divided into three stages: linear elastic response, damage initiation, and damage evolution. Although cohesive elements were not implemented in the present simulation in order to maintain consistency with experimental observations and meet computational efficiency requirements, we acknowledge that this method can effectively simulate progressive debonding phenomena and will consider its application in future studies.
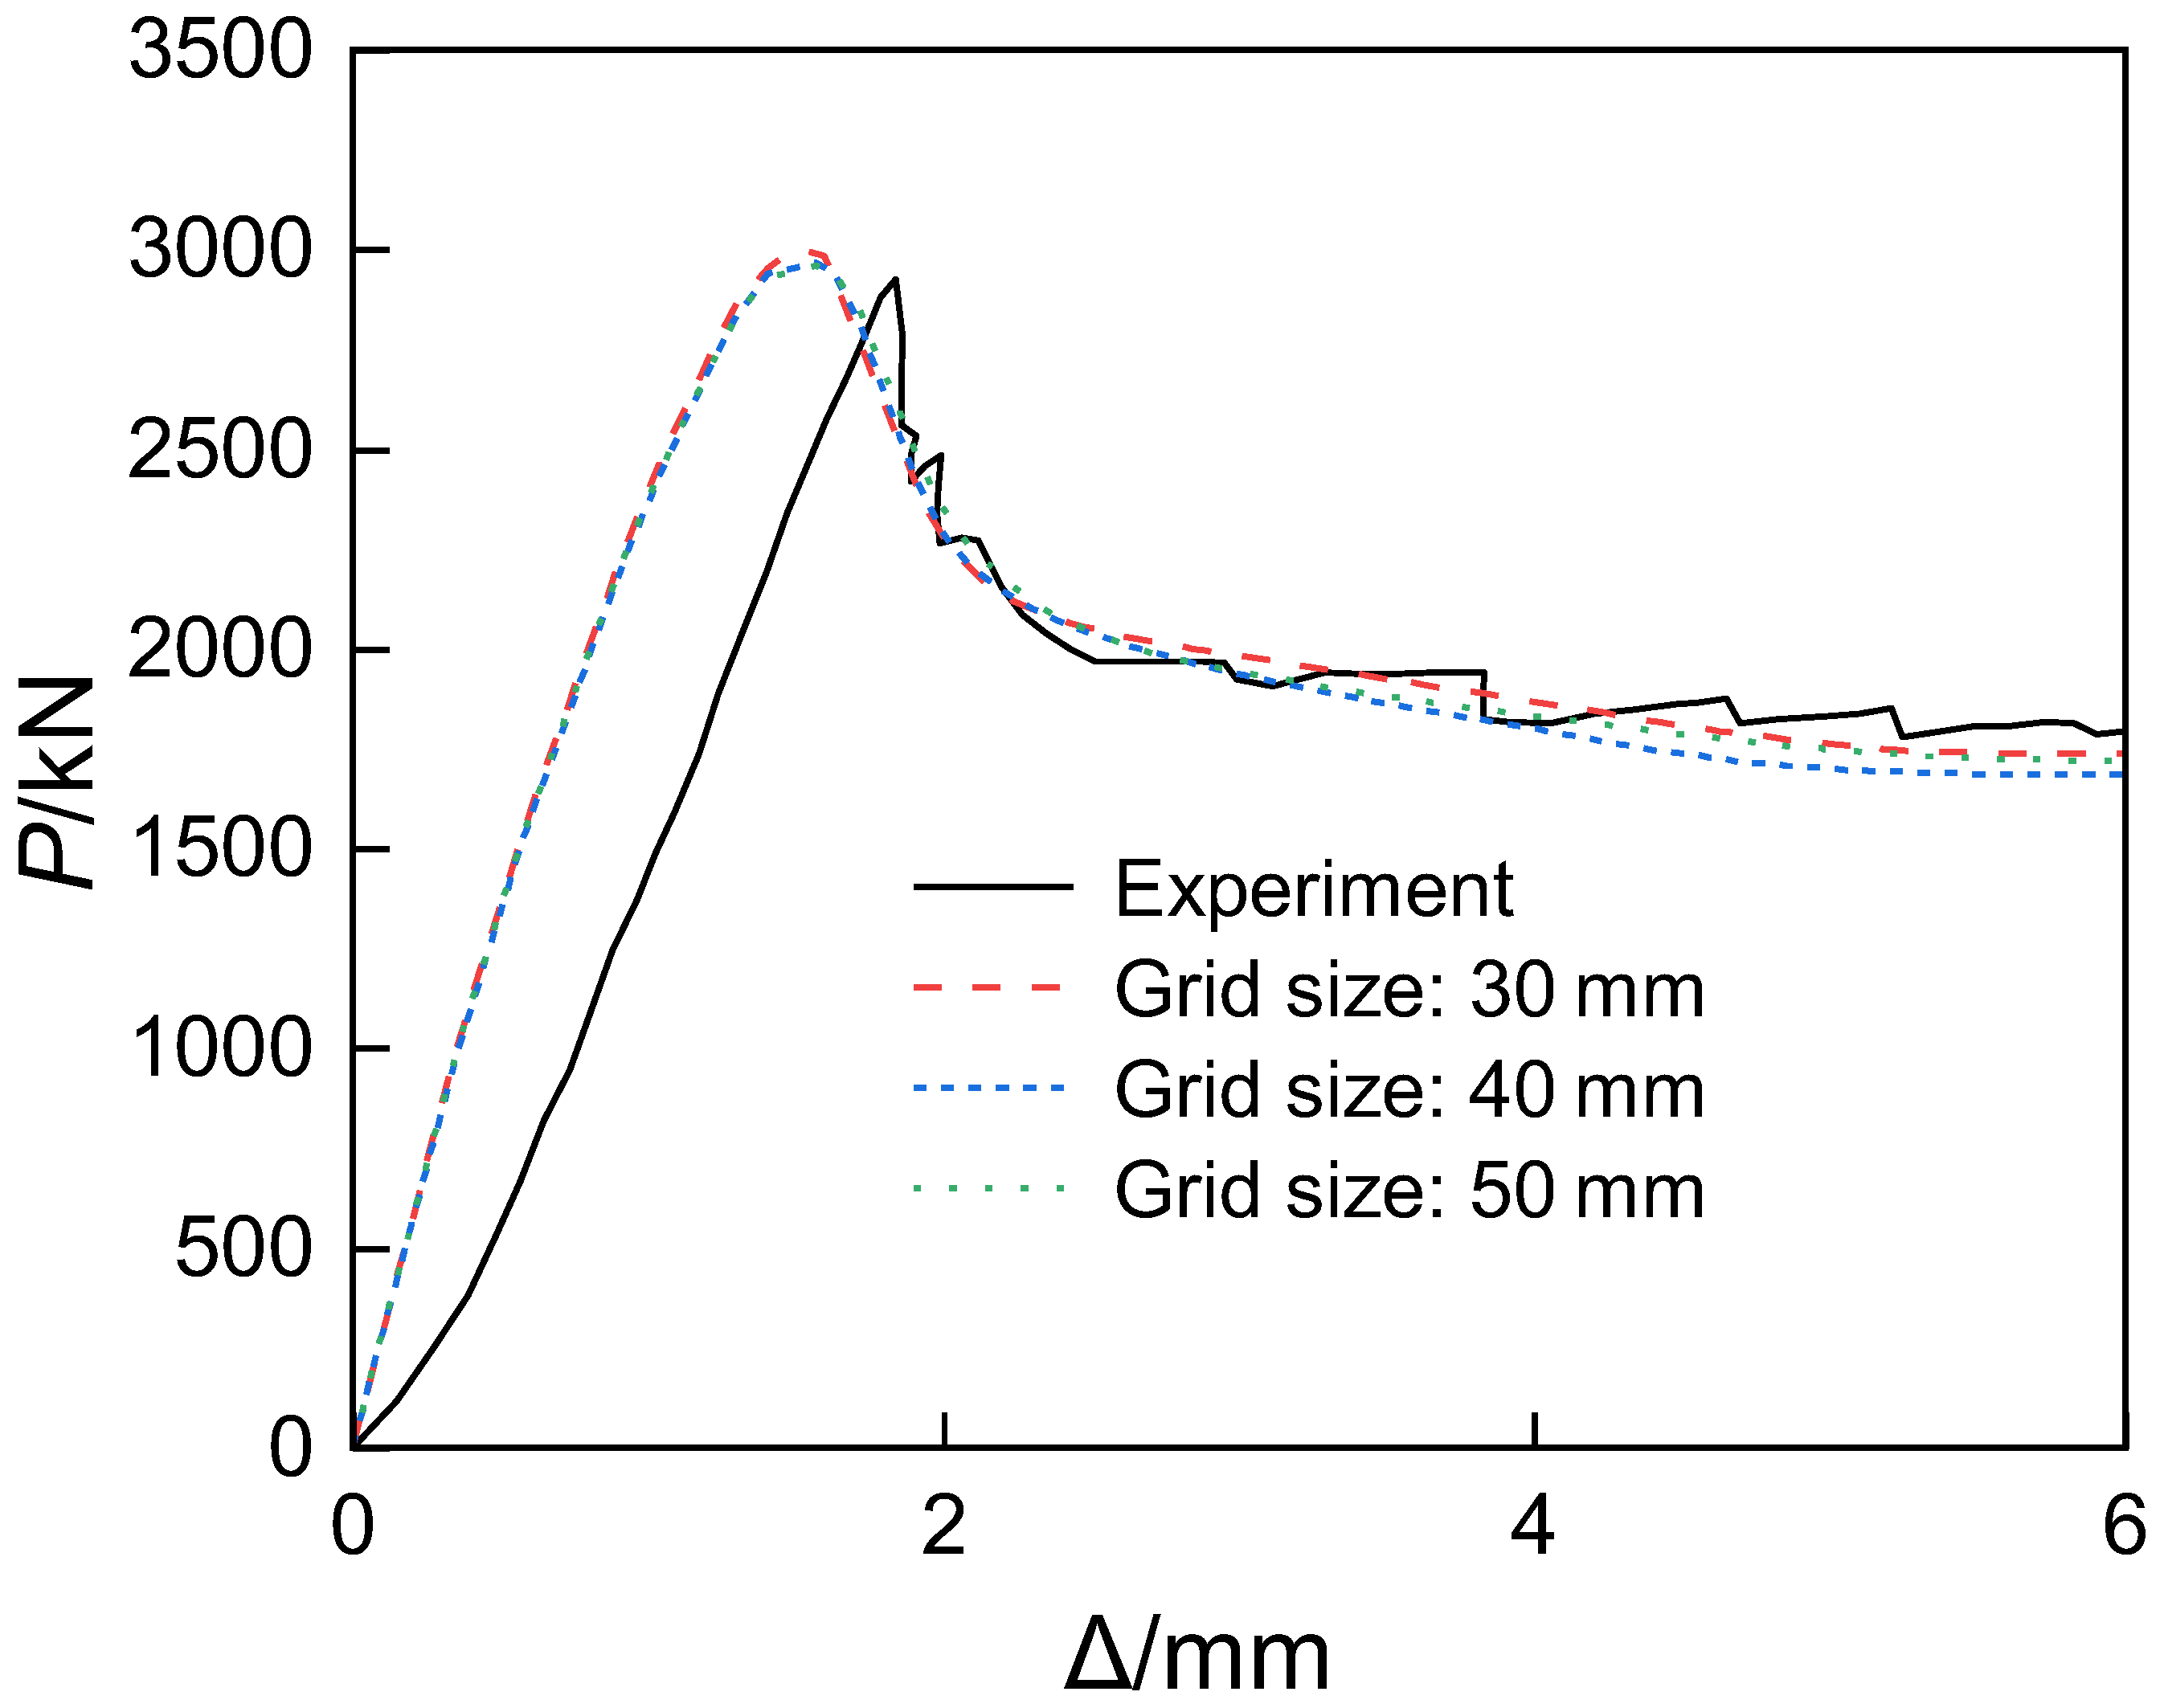
The rigid cushion blocks were connected to the surface of the short columns using a bonded contact method. To assess the influence of mesh discretization on the computational results, a sensitivity analysis was conducted by comparing three mesh sizes: 30 mm, 40 mm, and 50 mm. The results indicate that when both the concrete and structural steel adopt a mesh size of 30 mm, a desirable balance between accuracy and computational efficiency can be achieved.
As shown in Figure 10, the axial load–displacement curves of the short columns obtained from numerical simulations under the three mesh sizes exhibit essentially the same trend and agree well with the experimental curves. As can be seen from Table 3, under identical loading parameters and time increments, the differences in simulation accuracy among the three mesh sizes are minimal. However, although the 50 mm mesh contains fewer elements, it requires a significantly greater number of iterations, which may affect the convergence of large-scale computations. Overall, the influence of mesh size variation on computation time is relatively small. Taking both accuracy and convergence into account, a mesh size of 30 mm is recommended, as it can moderately reduce computation time while ensuring accuracy.
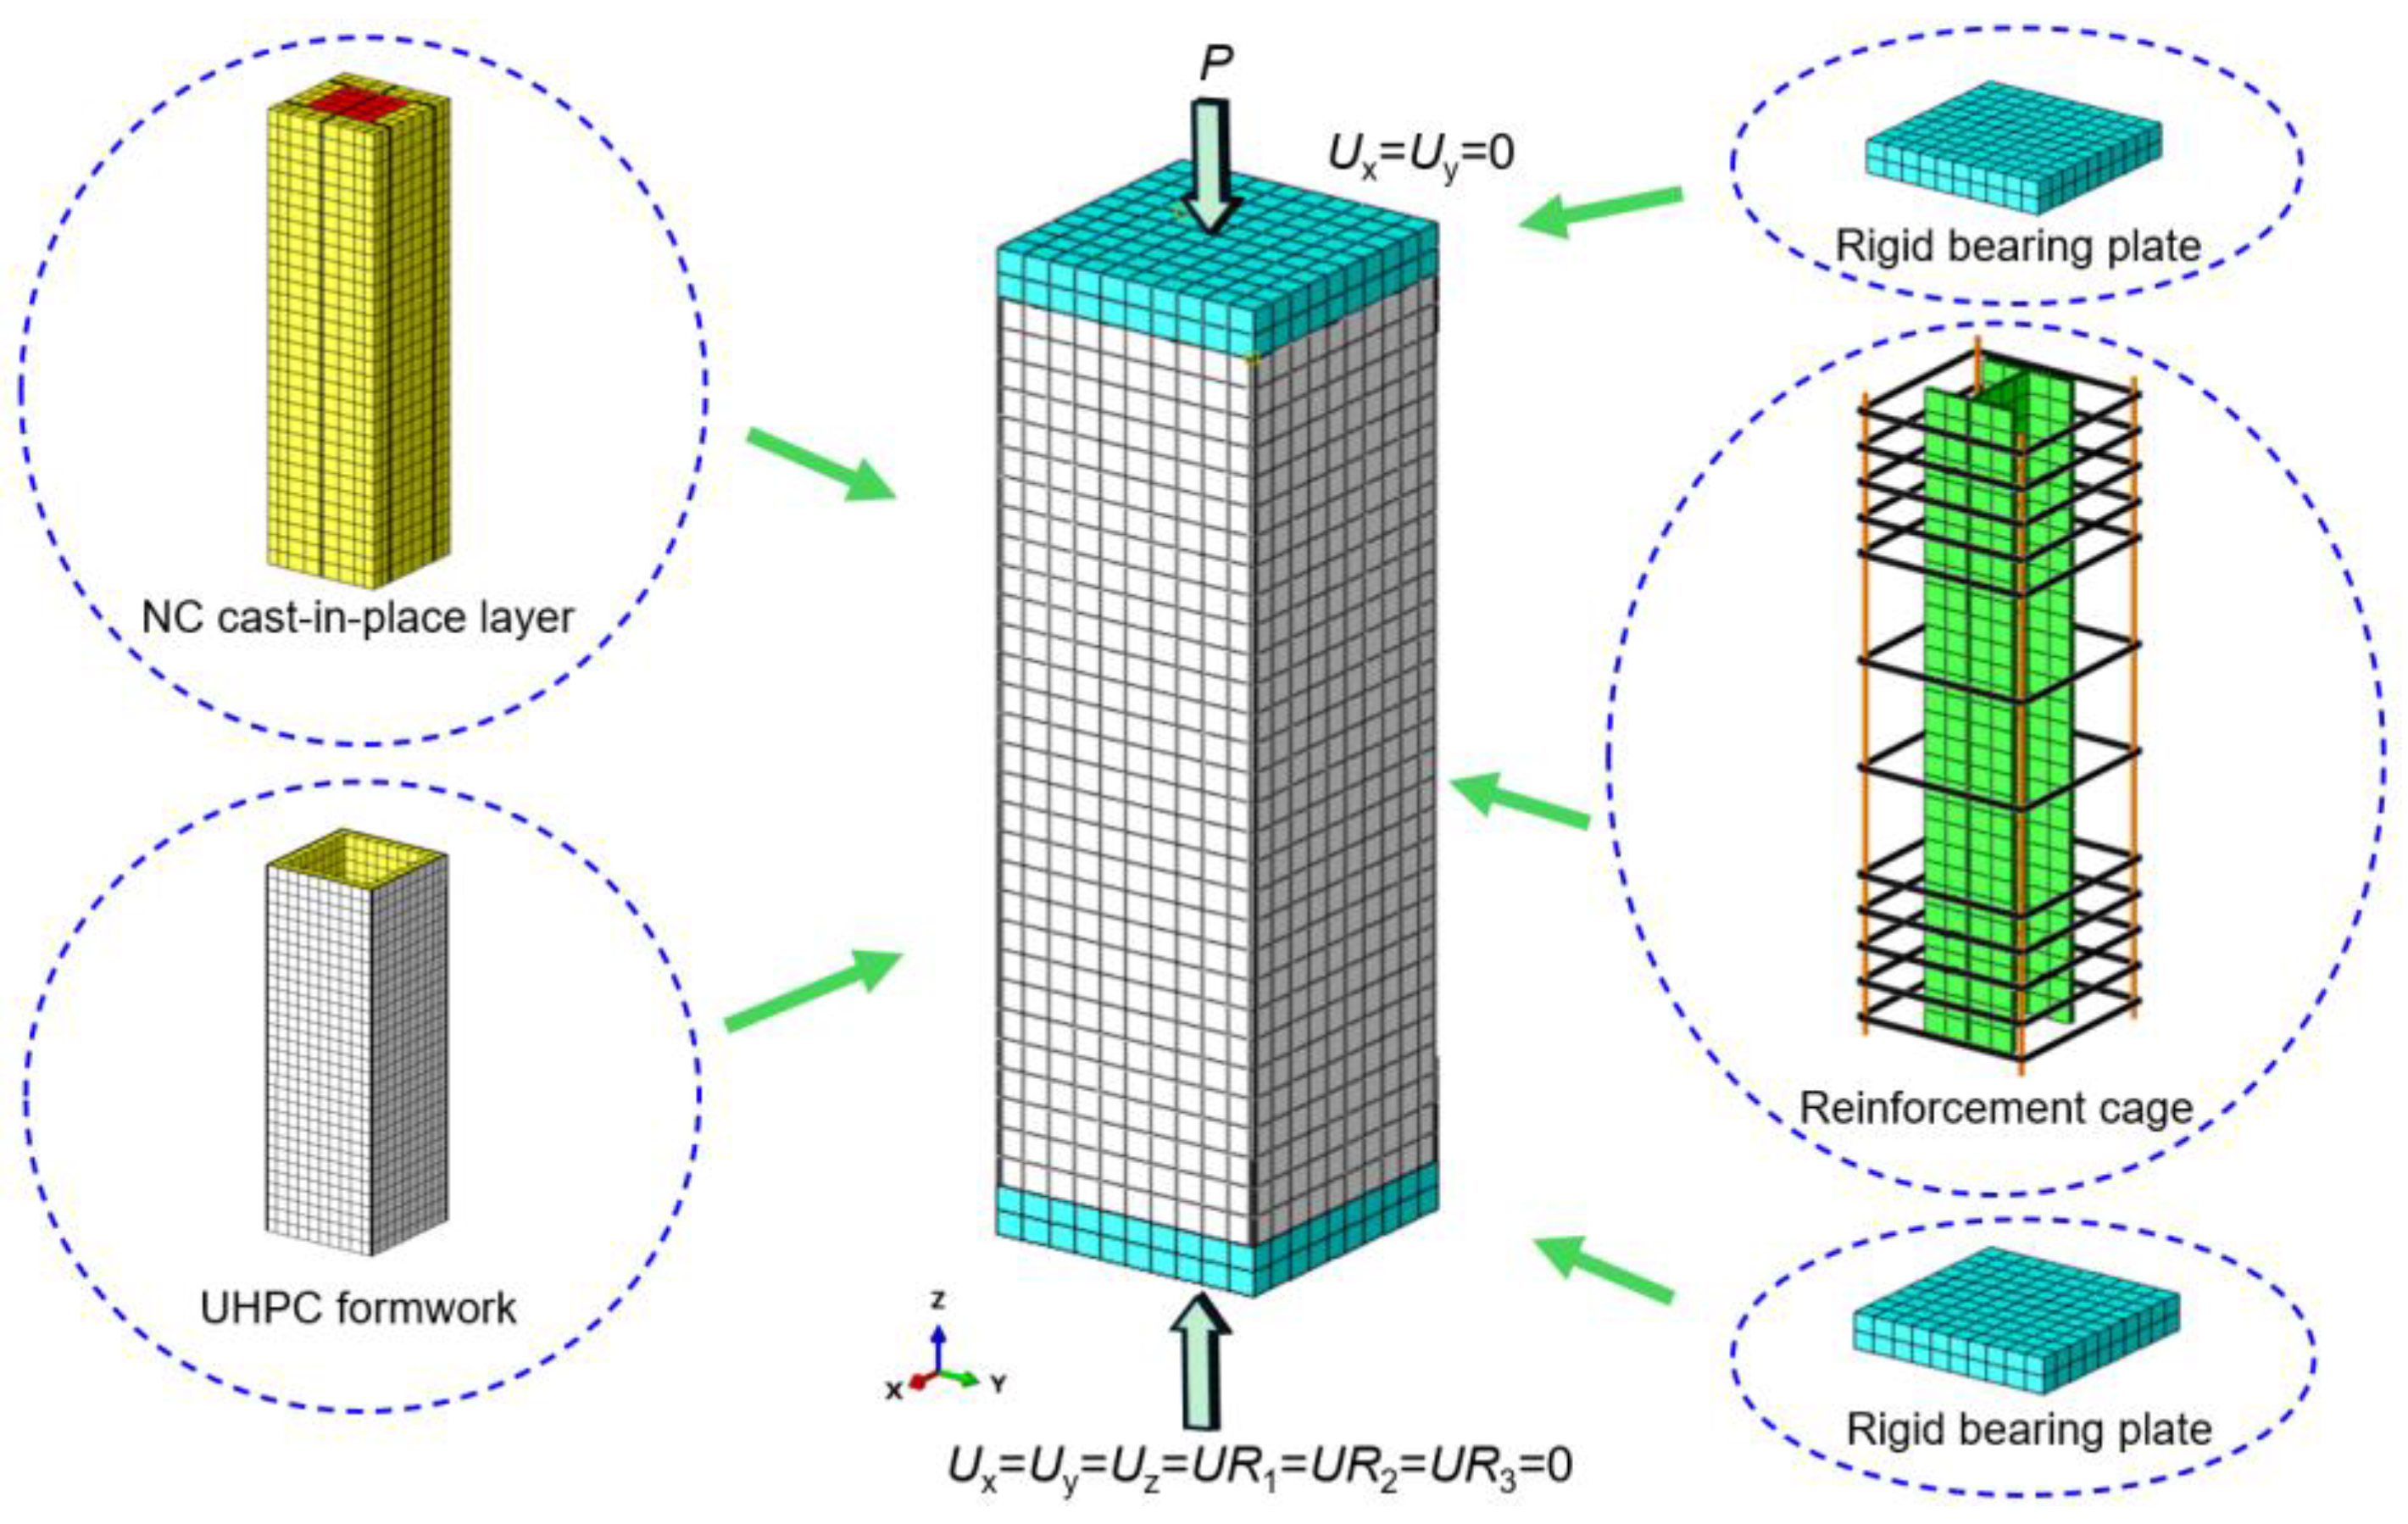
In terms of loading methods, the rigid pad at the lower end of the short column is set as a fully fixed constraint (Ux = Uy = Uz = UR1 = UR2 = UR3 = 0). The rigid pad at the upper end is supported by a sliding hinge (Ux = Uy = 0), and a downward displacement of 20 mm is applied at the reference point of the pad.
The finite element model constructed in this study enhances the accuracy and reliability of UHPC-SRC short column analysis by appropriately handling contact surfaces, uniformly discretizing the mesh, and effectively setting loading and support conditions. This model not only provides a reference for subsequent related research but also establishes a theoretical basis for design and optimization in practical engineering applications. The geometric model of the UHPC-SRC short column primarily consists of a UHPC formwork and a cast-in-place NC layer. The model includes longitudinal reinforcement, stirrups, and H-shaped steel, along with upper and lower rigid base plates, collectively forming the complete structure, as shown in Figure 11. In the ABAQUS software, after creating the longitudinal reinforcement and stirrup components, it is necessary to select all reinforcement components in the assembly module, generate their instances, and merge them while maintaining the intersection boundaries of each reinforcement. Finally, the merged reinforcement assembly is reassembled with the concrete components in the assembly module, thus preparing for subsequent analysis. According to Mirza’s division [31] of the regions of steel-restrained concrete, the white area in the figure represents unrestrained concrete, yellow represents semi-restrained concrete, and red represents highly restrained concrete.
3. Finite Element Model Validation

To verify the rationality of the established model, this paper conducted finite element analyses on structures closely related to UHPC-SRC short columns. These structures include UHPC formwork steel tube concrete composite columns, high-strength steel-UHPC short columns, and UHPC fully encased S690 high-strength steel short columns under axial compression. By comparing the results with corresponding experimental data, this study provides strong support for the theoretical foundation and validity of the numerical model developed for UHPC-SRC short columns.

3.1. UHPC Formwork-Concrete-Filled Steel Tube Composite Column

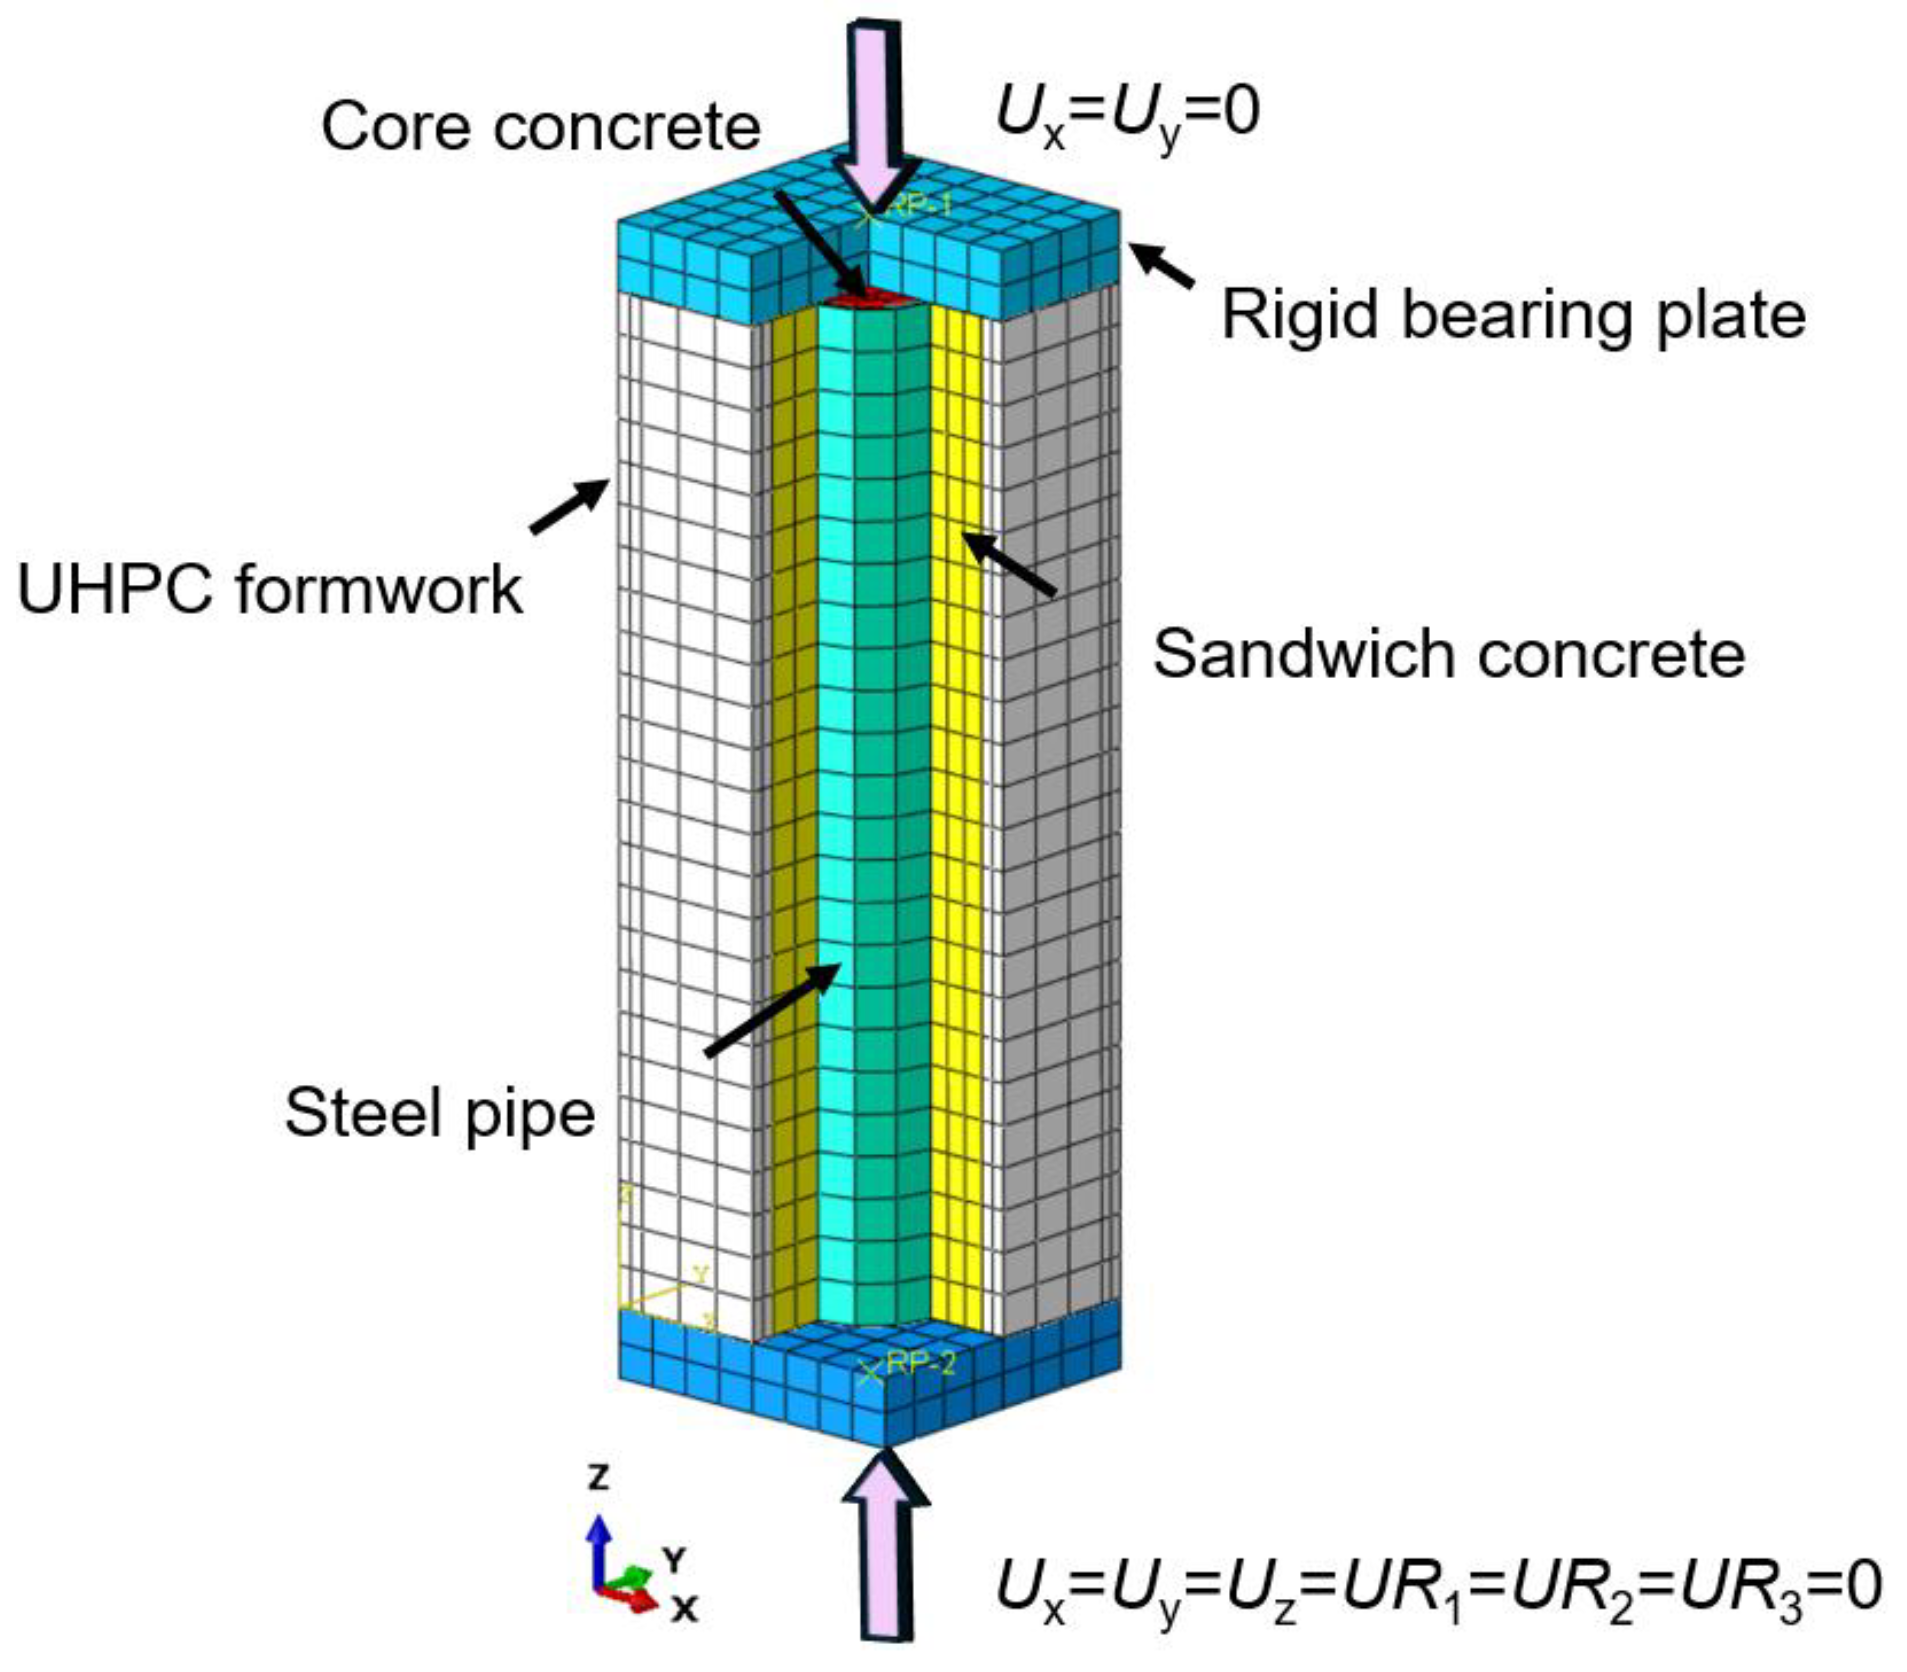
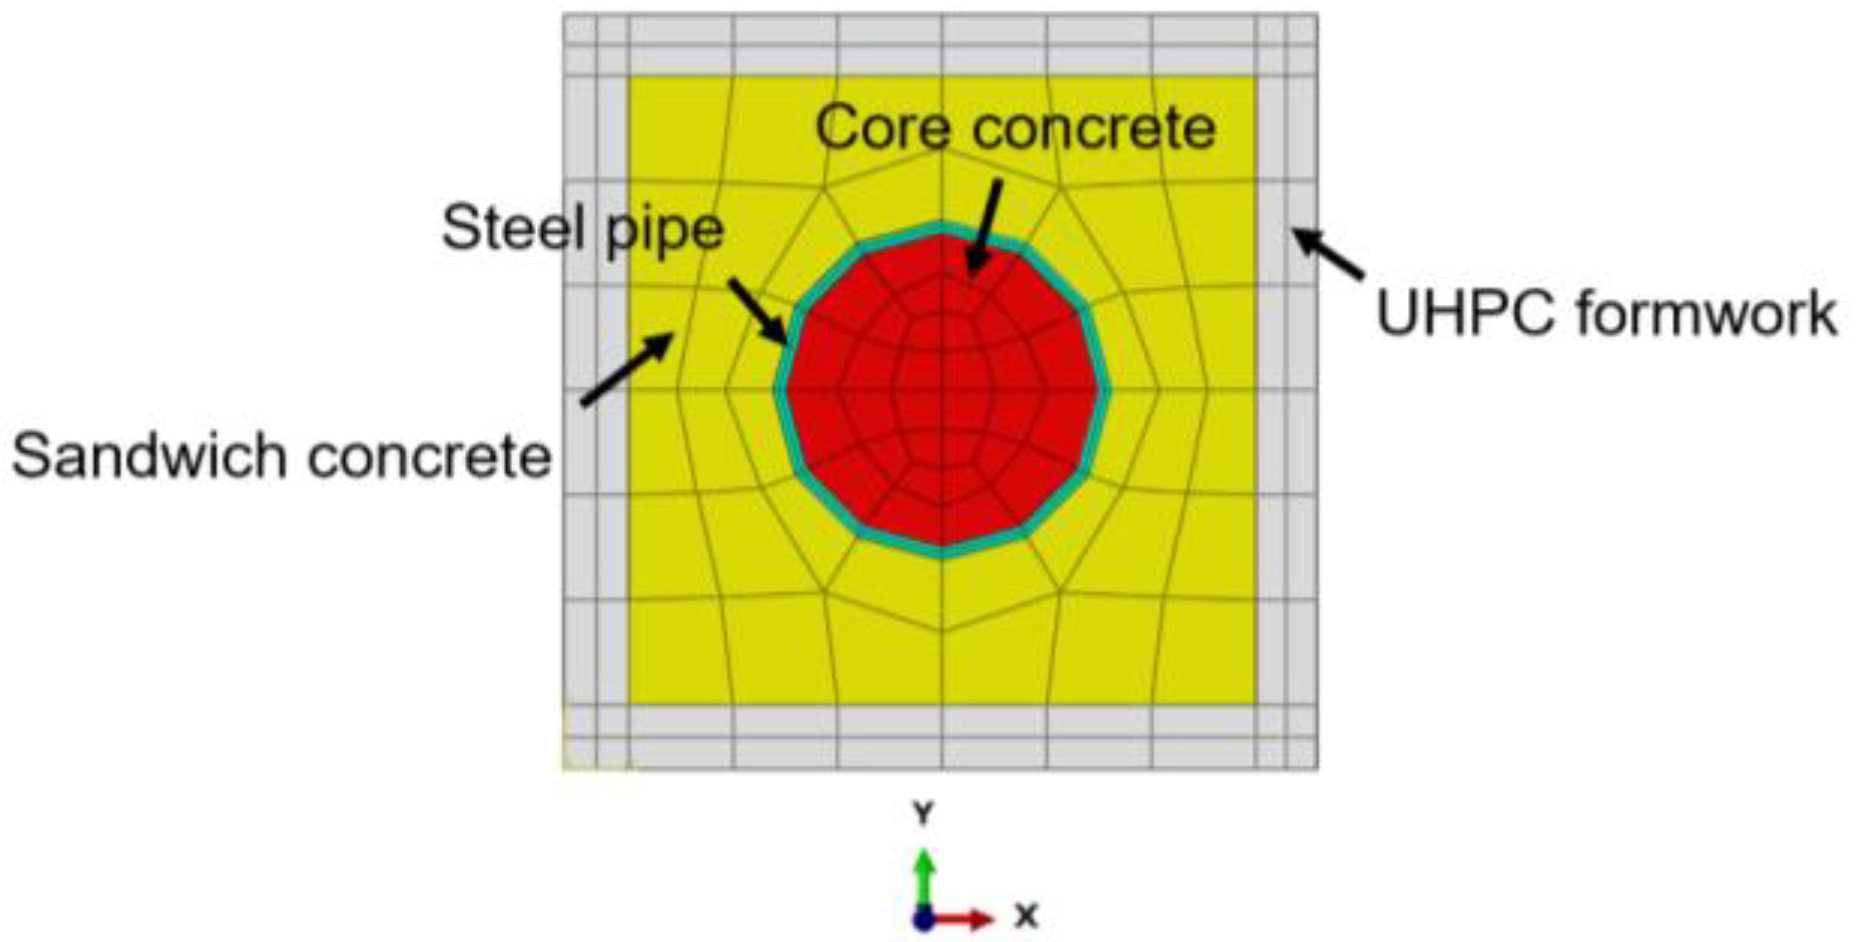
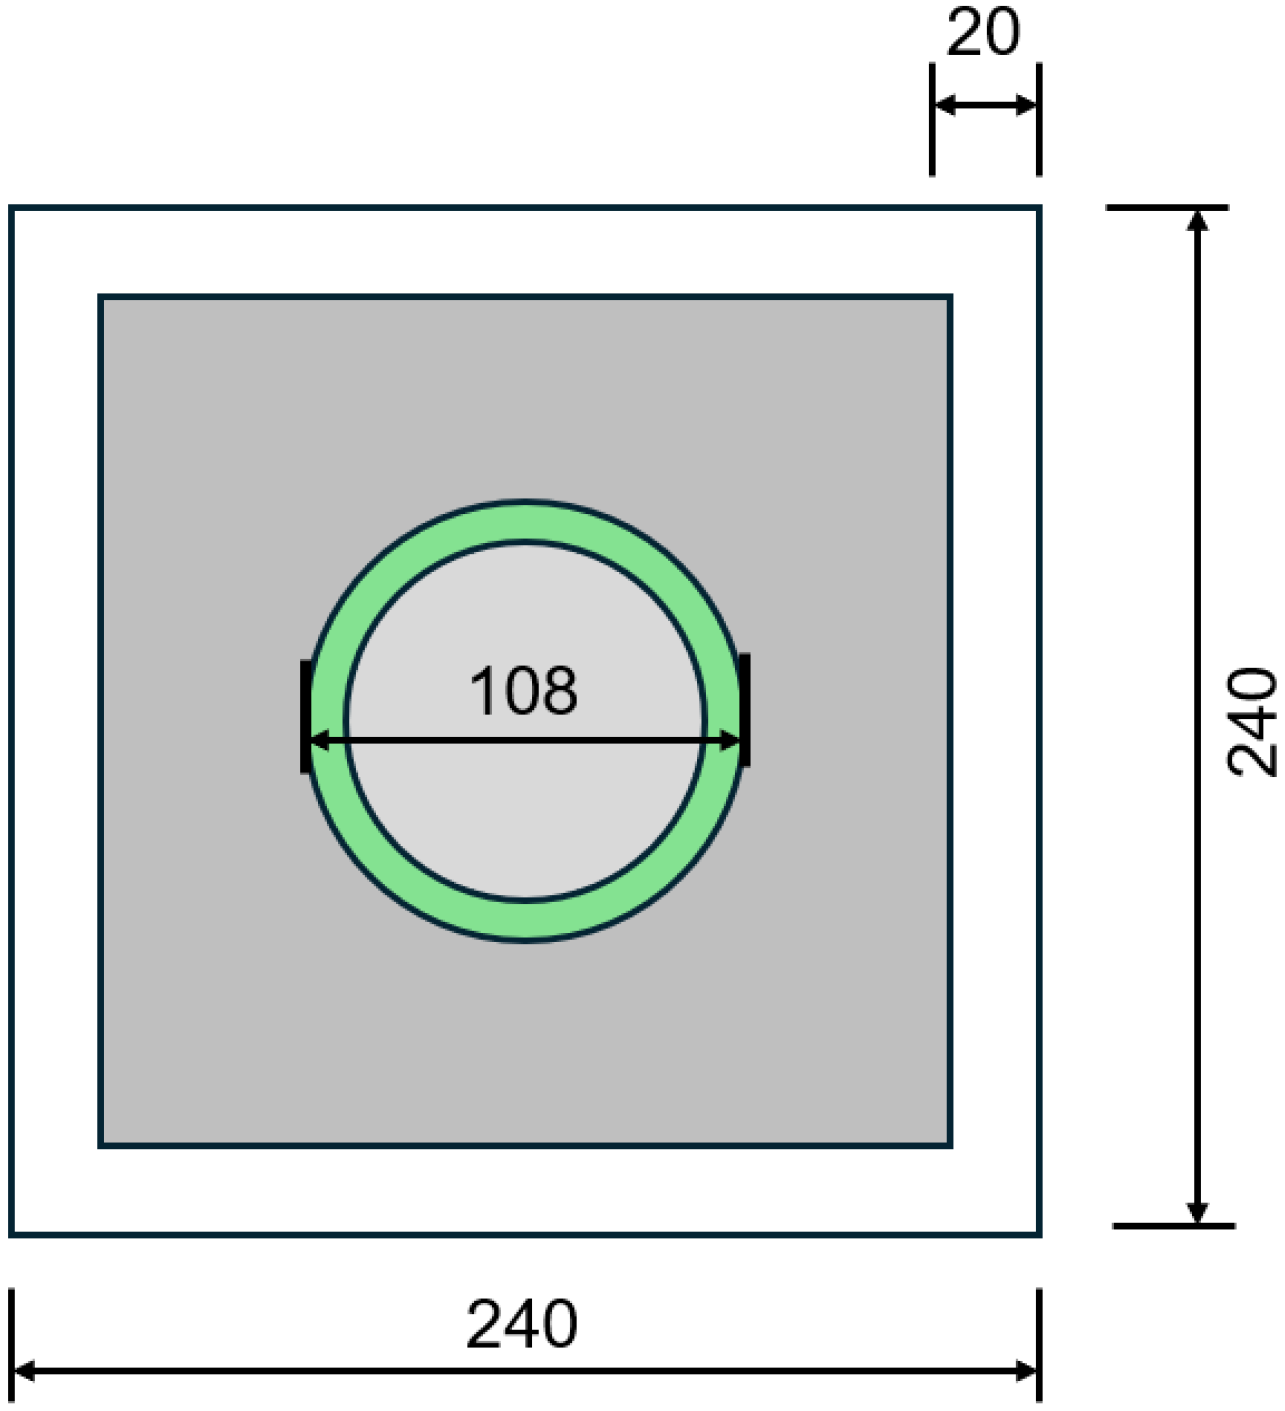
The literature [32] has conducted experimental studies on UHPC formwork–concrete-filled steel tube composite columns. In this study, specimen U-CFST-20-1-A was selected as the subject for finite element analysis. Figure 12 presents the three-dimensional schematic diagram of specimen U-CFST-20-1-A. Figure 13 shows the mesh division of the specimen. Figure 14 provides the specific cross-sectional dimensions of the specimen. The specimen has a height of 720 mm, a cross-sectional width of 240 mm, a UHPC formwork thickness of 20 mm, and a steel tube thickness of 4 mm. A rigid pad is placed at both the top and bottom ends of the specimen. The thickness of each pad is 50 mm, and the cross-sectional width is 240 mm.
In the concrete section, the UHPC formwork uses the C120 strength grade, with a measured cubic compressive strength fcu of 119.5 MPa. Both the interlayer concrete and the core concrete employ NC of C50 strength grade, with a measured cubic compressive strength fcu of 50.5 MPa. The steel tubes used in the specimens are of Q345 grade, with a measured yield strength fy of 394 MPa, an ultimate strength fst of 544 MPa, and an elastic modulus Es of 2.09 × 10⁵ MPa. The constitutive relationships for UHPC, NC, and steel tubes mentioned in this paper all comply with the relevant provisions detailed in Section 2.1.
In this study, the C3D8R element is used to simulate the UHPC formwork, interlayer concrete, core concrete, and steel tube. Regarding the treatment of material interfaces, for the three interfaces—UHPC formwork with interlayer concrete, interlayer concrete with steel tube, and steel tube with core concrete—the normal direction adopts hard contact, while the tangential direction employs the Coulomb friction criterion, with the friction coefficient set to 0.6 for all interfaces. The mesh size for both the steel tube and the concrete is set to 30 mm, aiming to strike a balance between computational efficiency and accuracy. The rigid pads are connected to the surface of the composite column through a tie constraint. The rigid pad at the bottom of the column adopts a fully fixed constraint (Ux = Uy = Uz = UR1 = UR2 = UR3 = 0), while the rigid pad at the top is supported by a sliding hinge (Ux = Uy = 0), and a downward displacement of 10 mm is applied at the reference point of the pad.
The results of finite element simulations were compared with experimental data, with a focus on the analysis of the axial load–displacement (P-Δ) curves. Figure 15 presents a comparison of the two. The initial stiffness obtained from the numerical simulation is generally slightly higher than the experimental result, but in the descending stage of the curve, the two agree well. The ultimate load measured in the test, Put, is 2939 kN, while the ultimate load obtained from the finite element simulation, PuFE, is 3001.77 kN. The ratio of the ultimate bearing capacities between the two is 0.98, indicating good agreement. Based on these ratios, it can be concluded that the numerical simulation results are highly consistent with the experimental results, demonstrating that the established finite element model has good reliability.

3.2. High-Strength Steel–UHPC Short Column

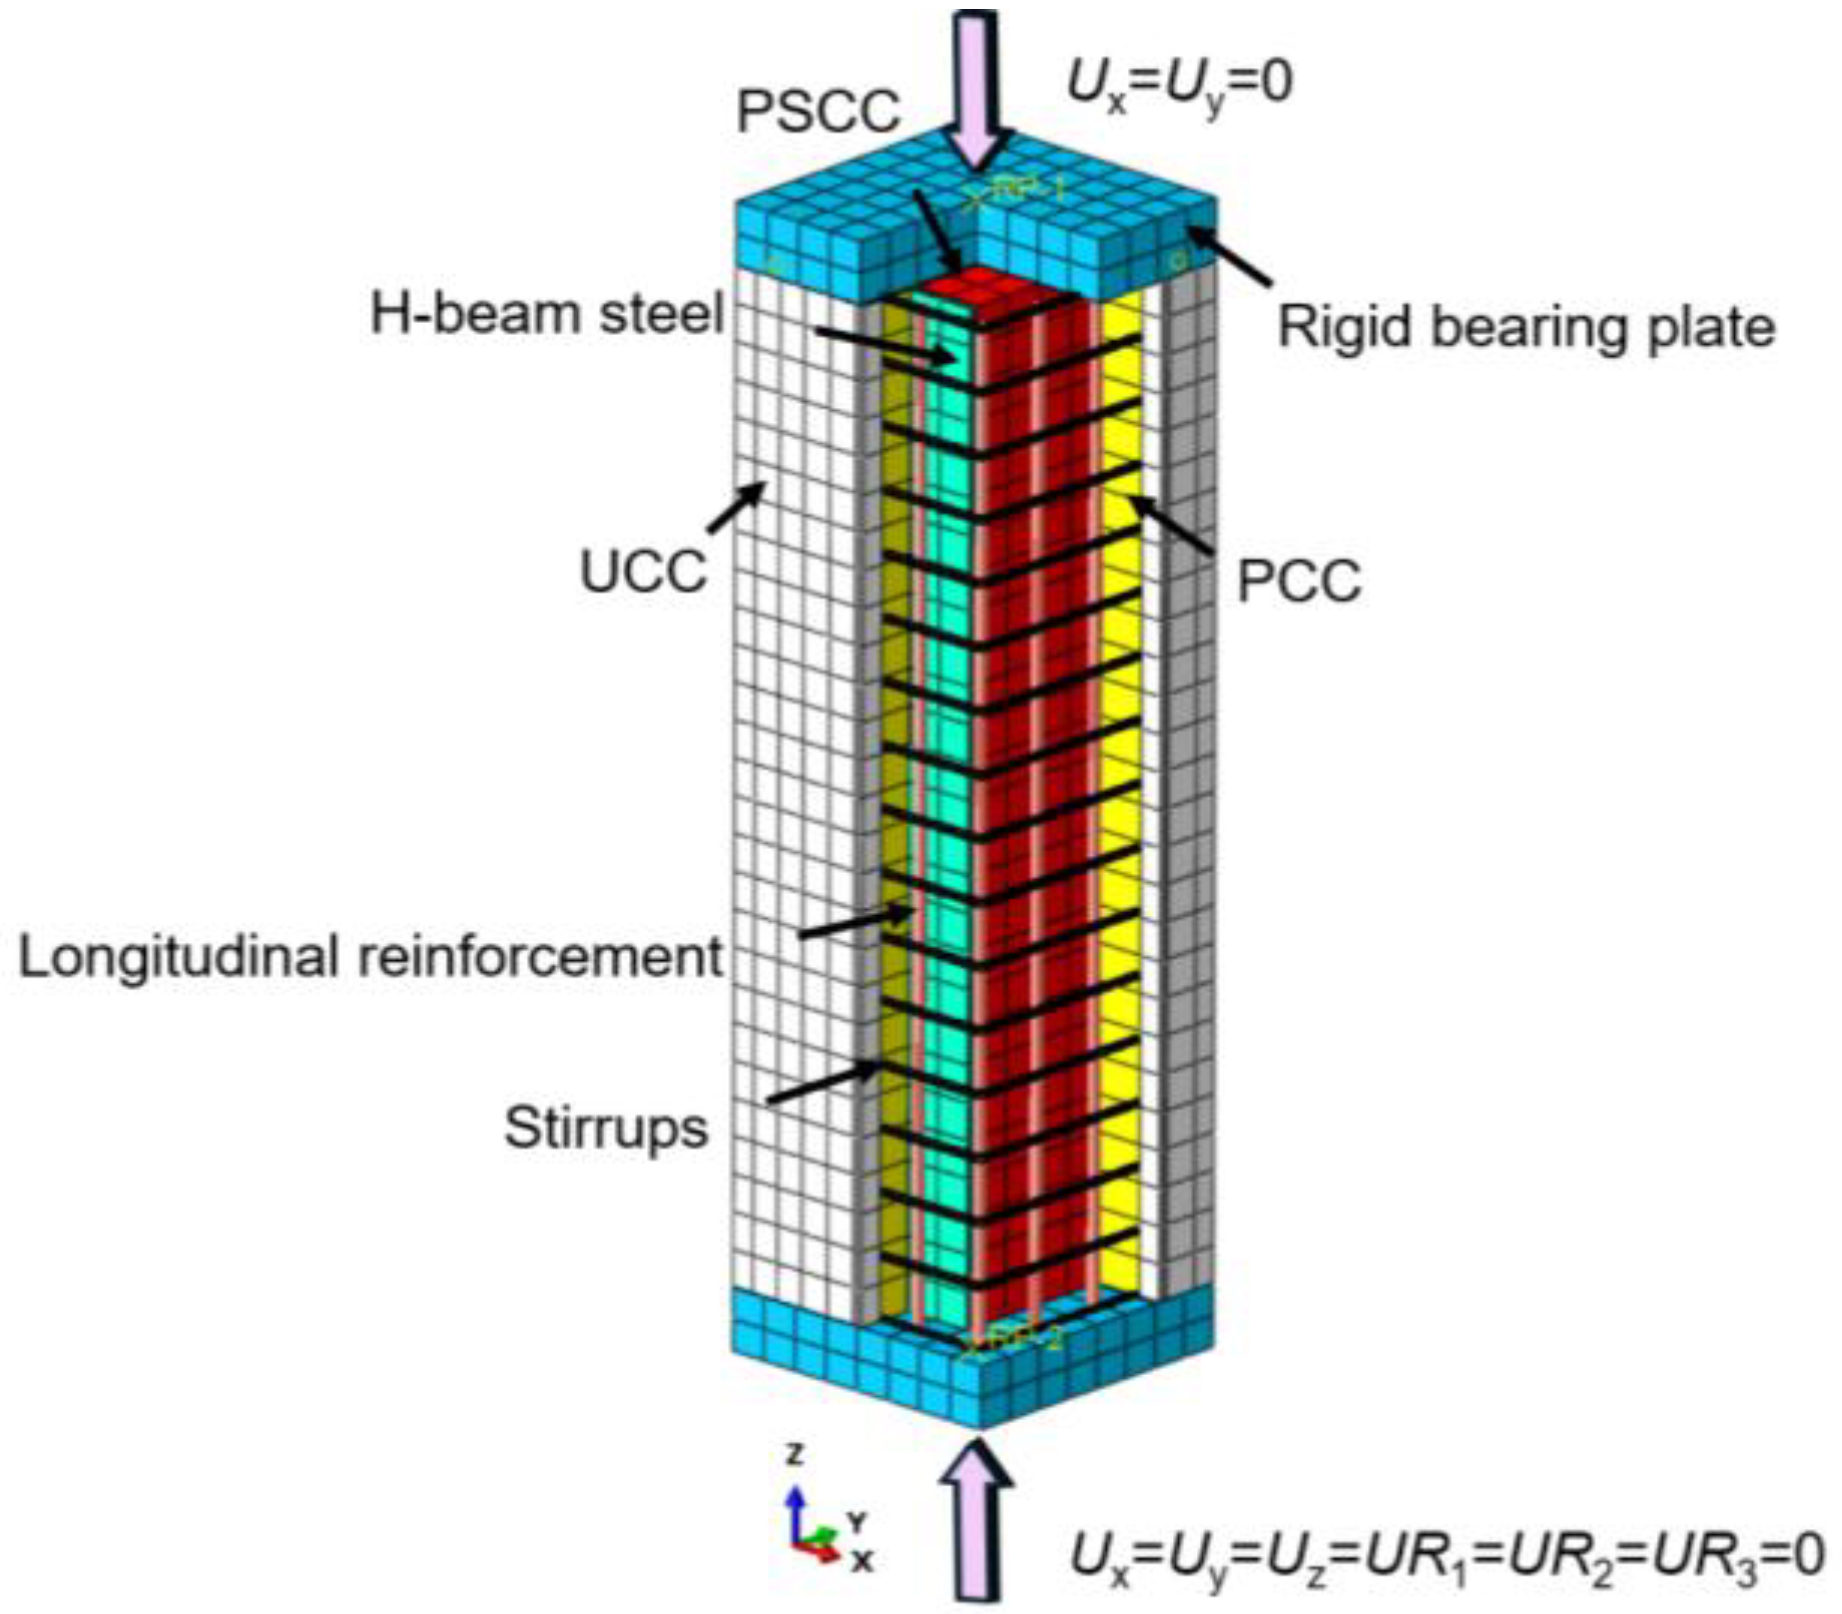
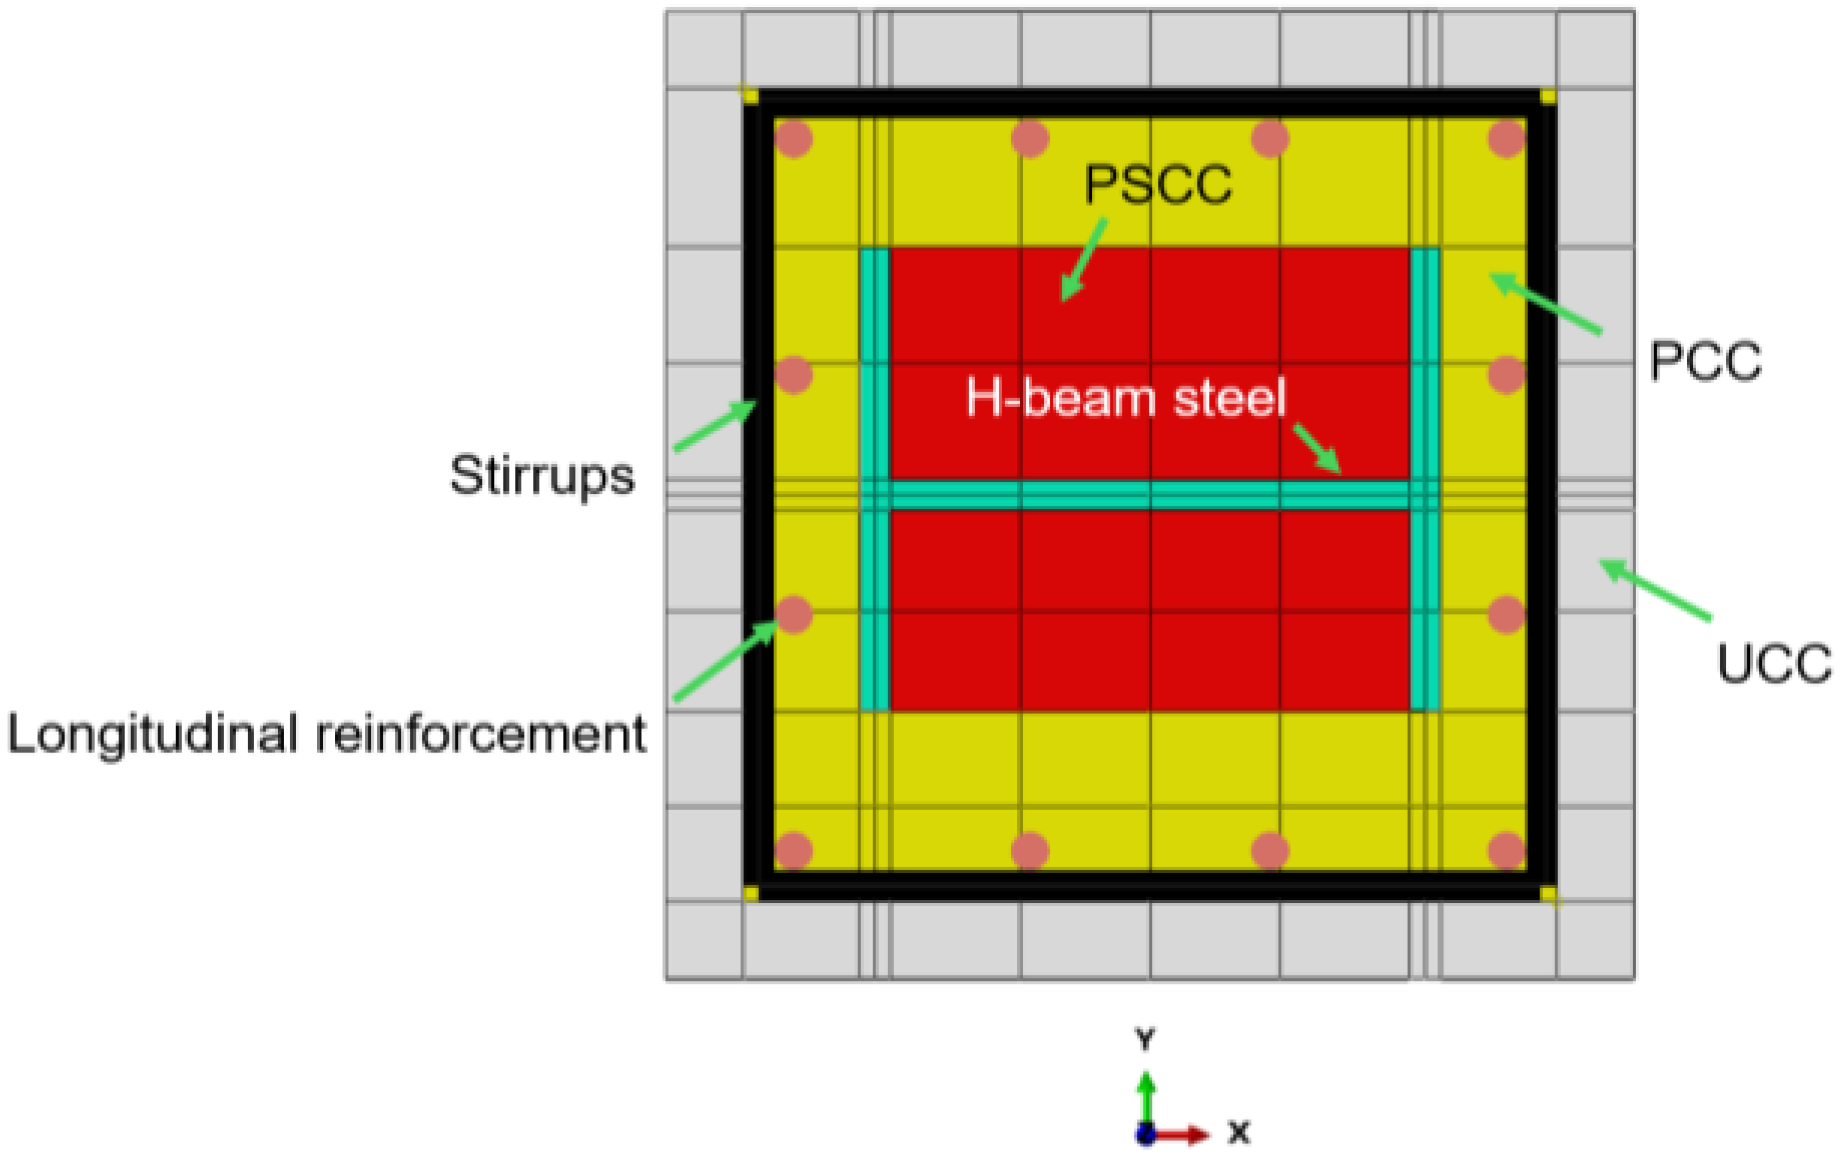
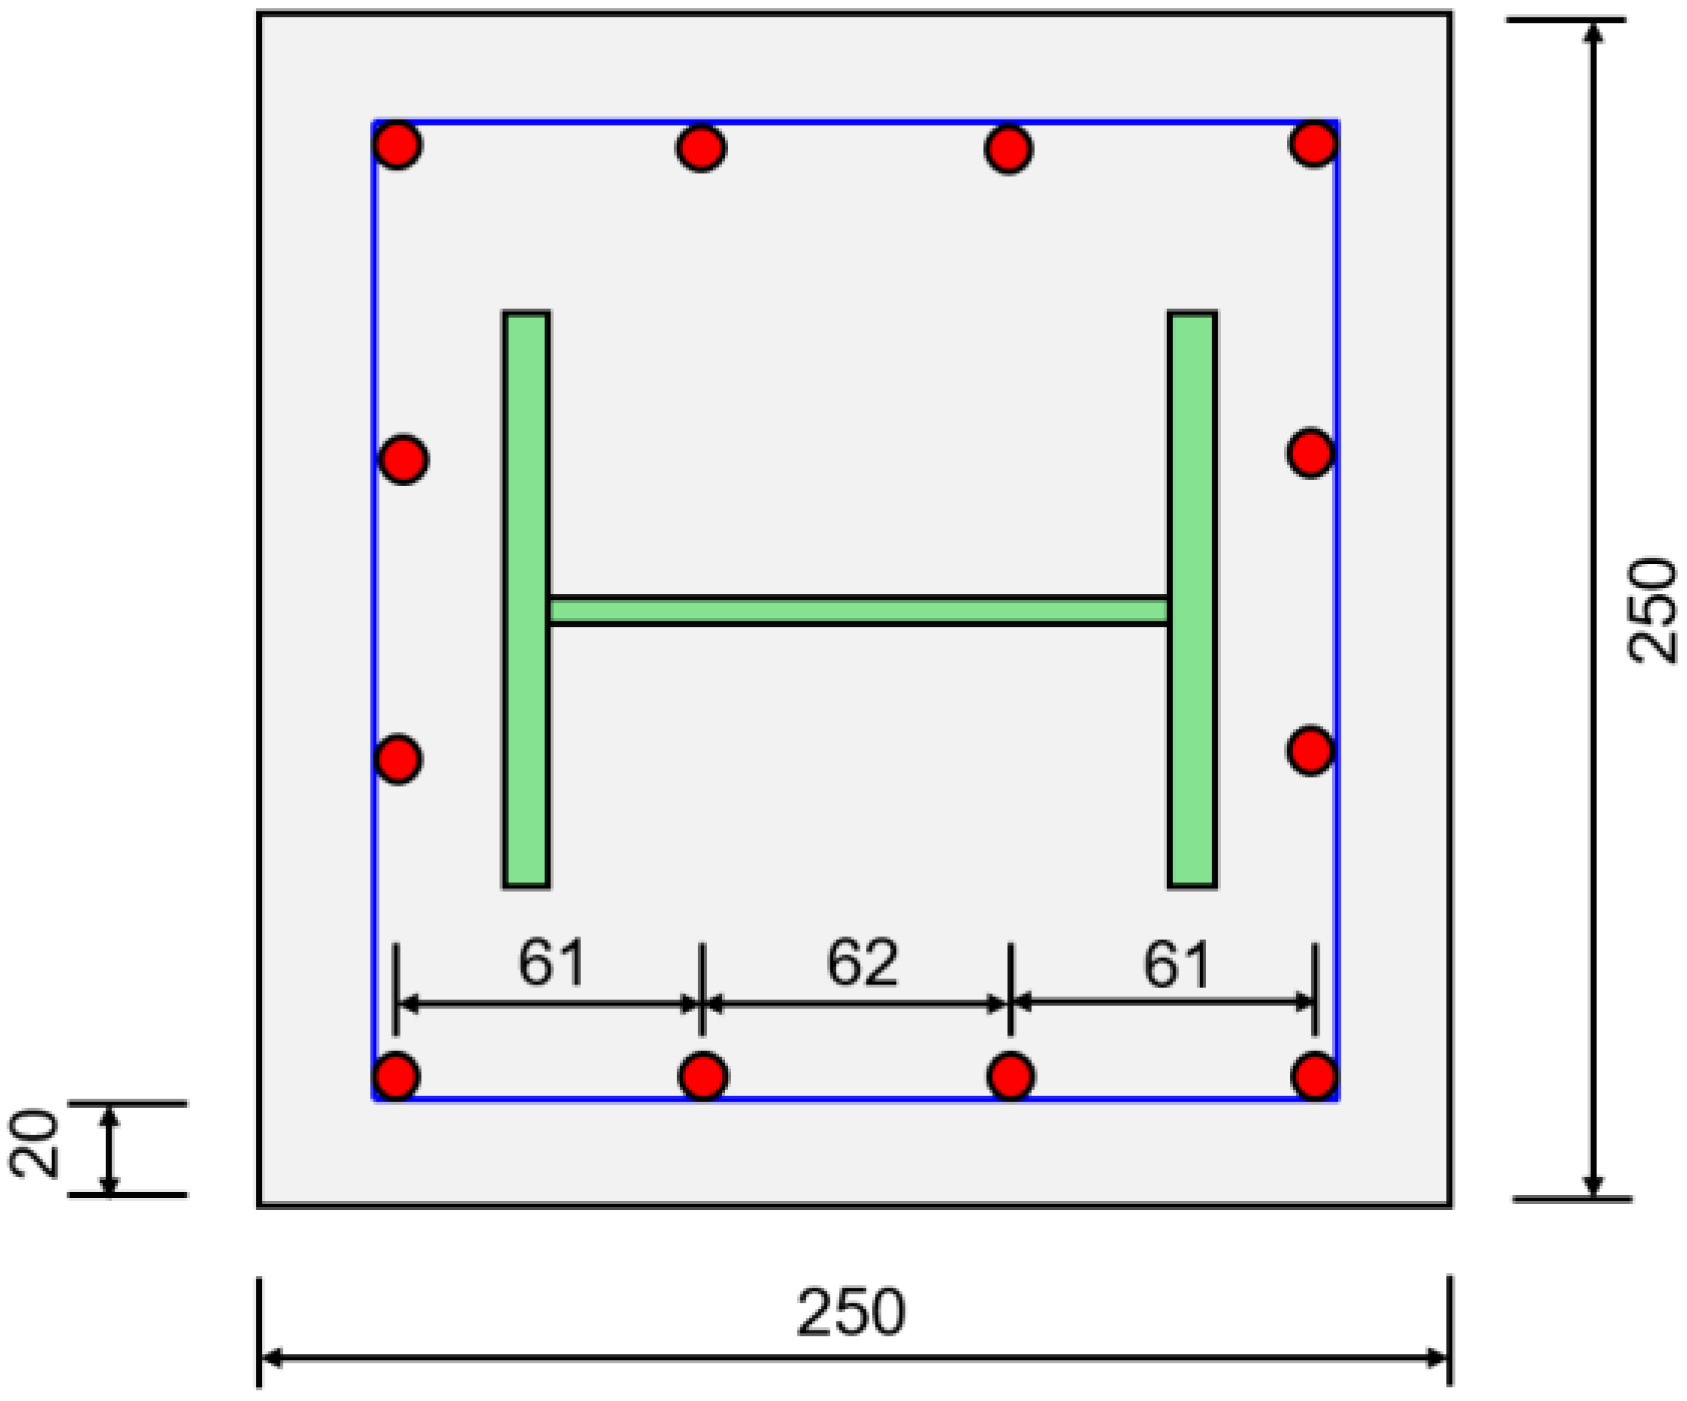
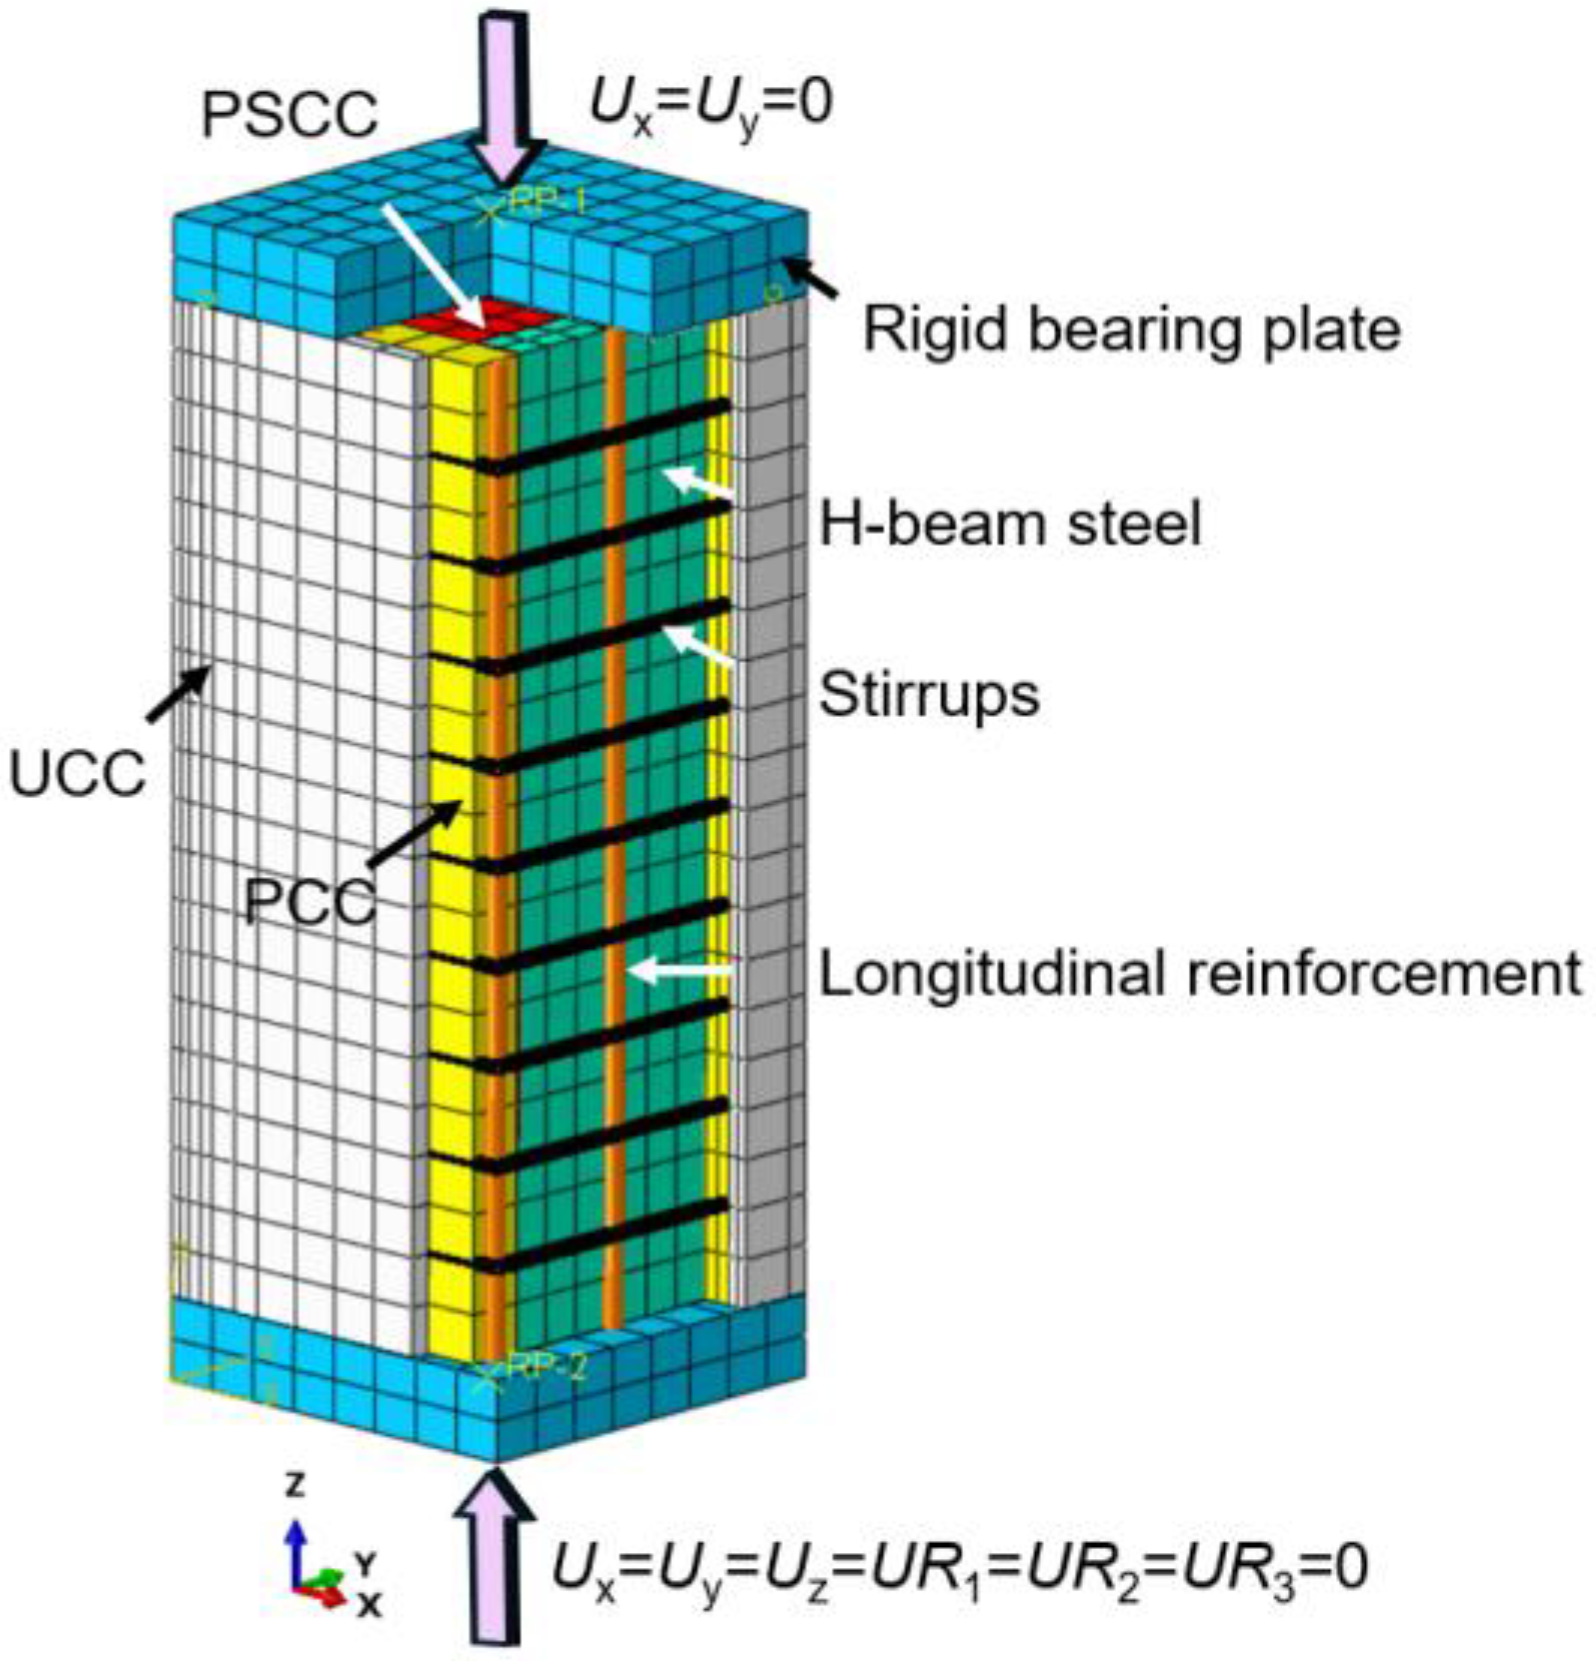
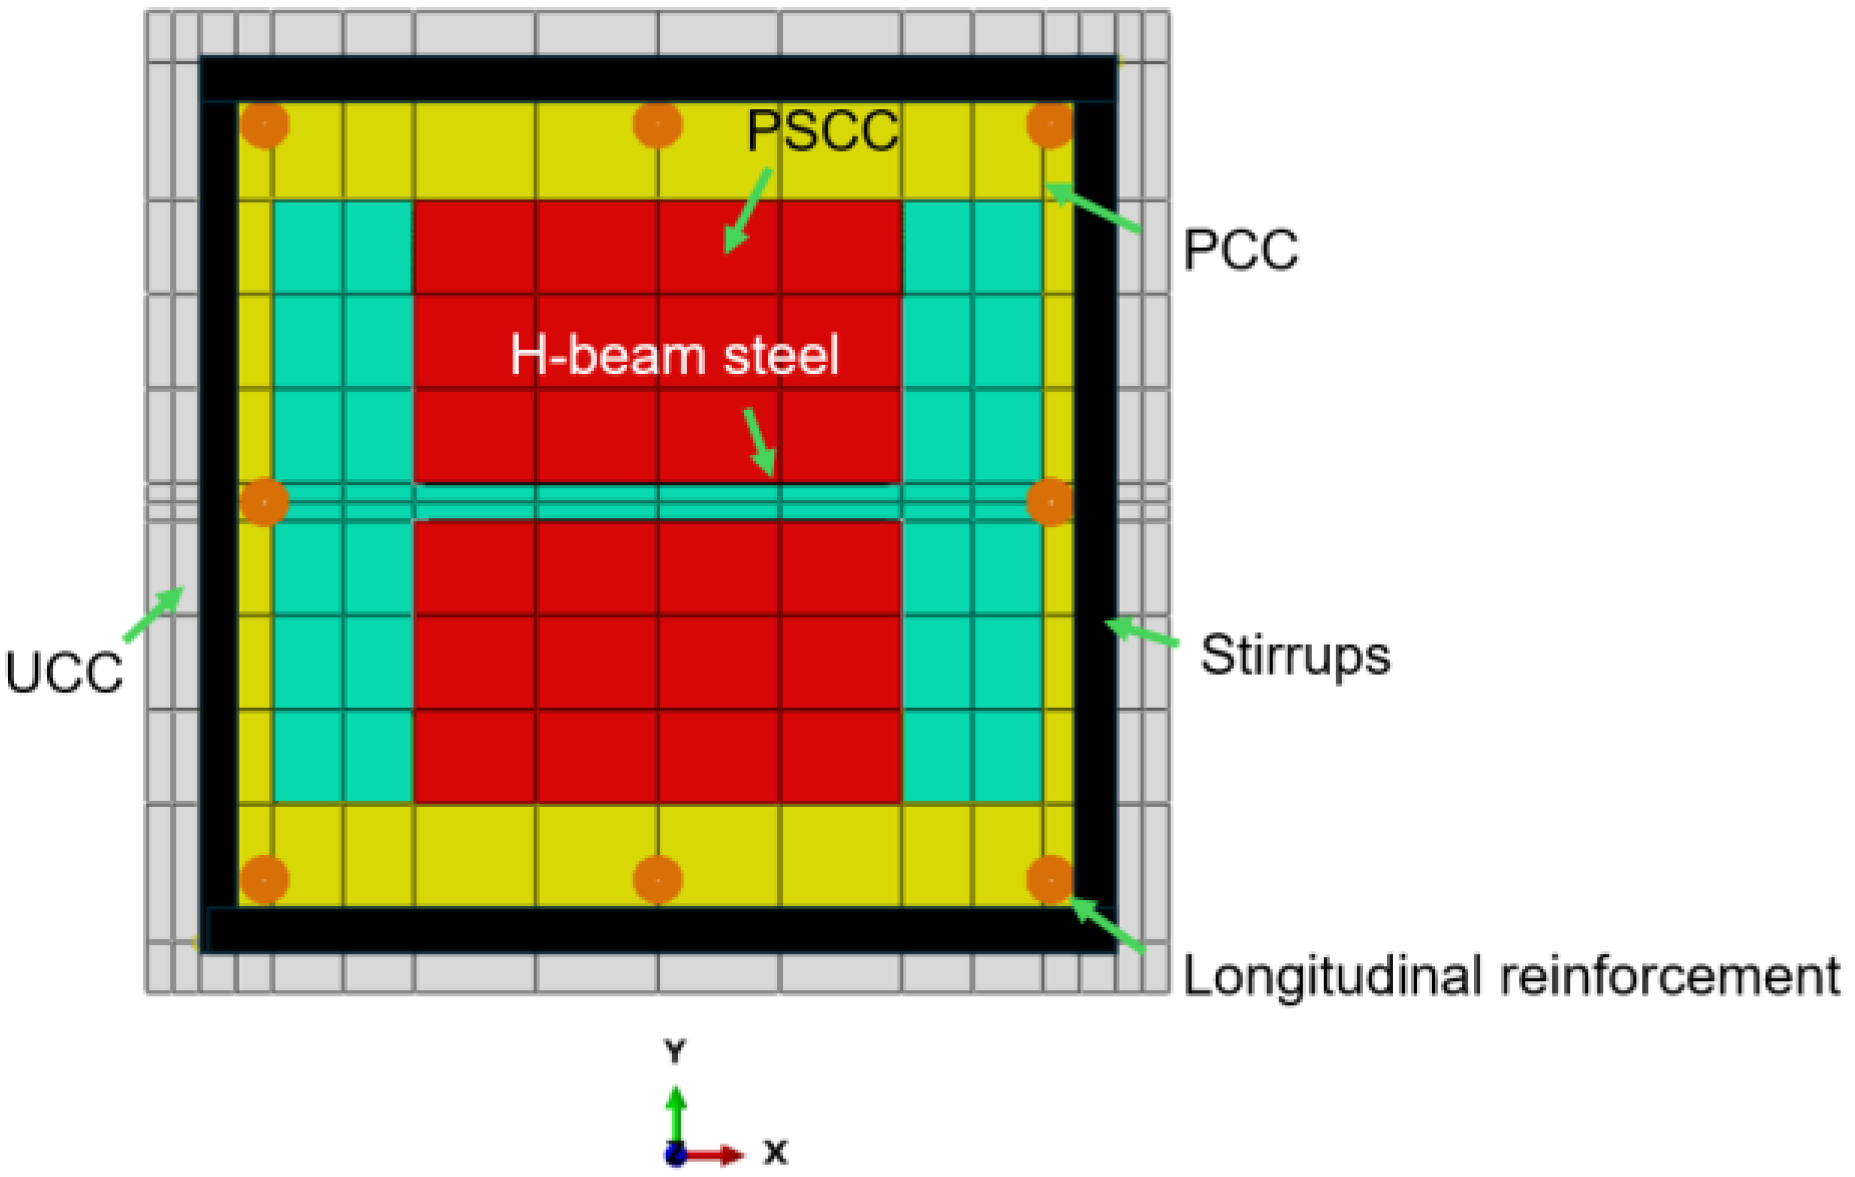
Experimental studies [33] have been conducted on high-strength steel-UHPC short columns. In this study, specimen Z-1 was selected for finite element analysis. Figure 16 presents a schematic diagram of the three-dimensional structure of the specimen, Figure 17 shows its meshing pattern, and Figure 18 provides the specific cross-sectional dimensions. Based on the degree of confinement provided by stirrups and structural steels to the concrete, the confined concrete can be classified into three categories: partially steel-confined concrete (PSCC), partially confined concrete (PCC), and unconfined concrete (UCC) [34]. The specimen has a height of 800 mm and a cross-sectional width of 250 mm. Rigid bearing plates, each with a thickness of 50 mm and a cross-sectional width of 250 mm, are placed at both the top and bottom ends of the specimen.
In the concrete section, UHPC adopts a C120 strength grade, with a measured 100 mm cube compressive strength fcm of 119.9 MPa. The steel section used in the specimen has specifications of 150 × 120 × 8 × 8 mm, steel grade Q460D, with a measured yield strength fy of 803 MPa, ultimate strength fst of 852 MPa, and elastic modulus Es of 2.03 × 10⁵ MPa. The longitudinal reinforcement consists of HRB400 rebars with a diameter of 10 mm, a measured yield strength fy of 463 MPa, ultimate strength fst of 704 MPa, and an elastic modulus Es of 1.96 × 10⁵ MPa. The stirrups are made of HTR630 grade high-strength steel bars, with a spacing of 50 mm. The measured yield strength fy is 834 MPa, the ultimate strength fst is 969 MPa, and the elastic modulus Es is 2.36 × 10⁵ MPa. The thickness of the protective layer for the outermost reinforcement is 20 mm. The constitutive relationships of UHPC, steel sections, and rebars involved in this study all comply with the relevant provisions of Section 2.1.
In this study, C3D8R elements were used to model the UHPC and steel sections, while the longitudinal and stirrup reinforcements were simulated using two-node three-dimensional truss elements (T3D2). For the material interface, hard contact was applied in the normal direction between UHPC and steel, and the Coulomb friction criterion was adopted in the tangential direction with a friction coefficient set to 0.6. The mesh size for both UHPC and steel was set to 30 mm to balance computational efficiency and accuracy. The rigid padding blocks were connected to the surface of the short column using a tie constraint. The rigid base plate at the bottom of the column was fully fixed (Ux = Uy = Uz = UR1 = UR2 = UR3 = 0), while the upper rigid base plate was supported with a sliding hinge (Ux = Uy = 0), and a downward displacement of 12 mm was applied at the reference point on the base plate.
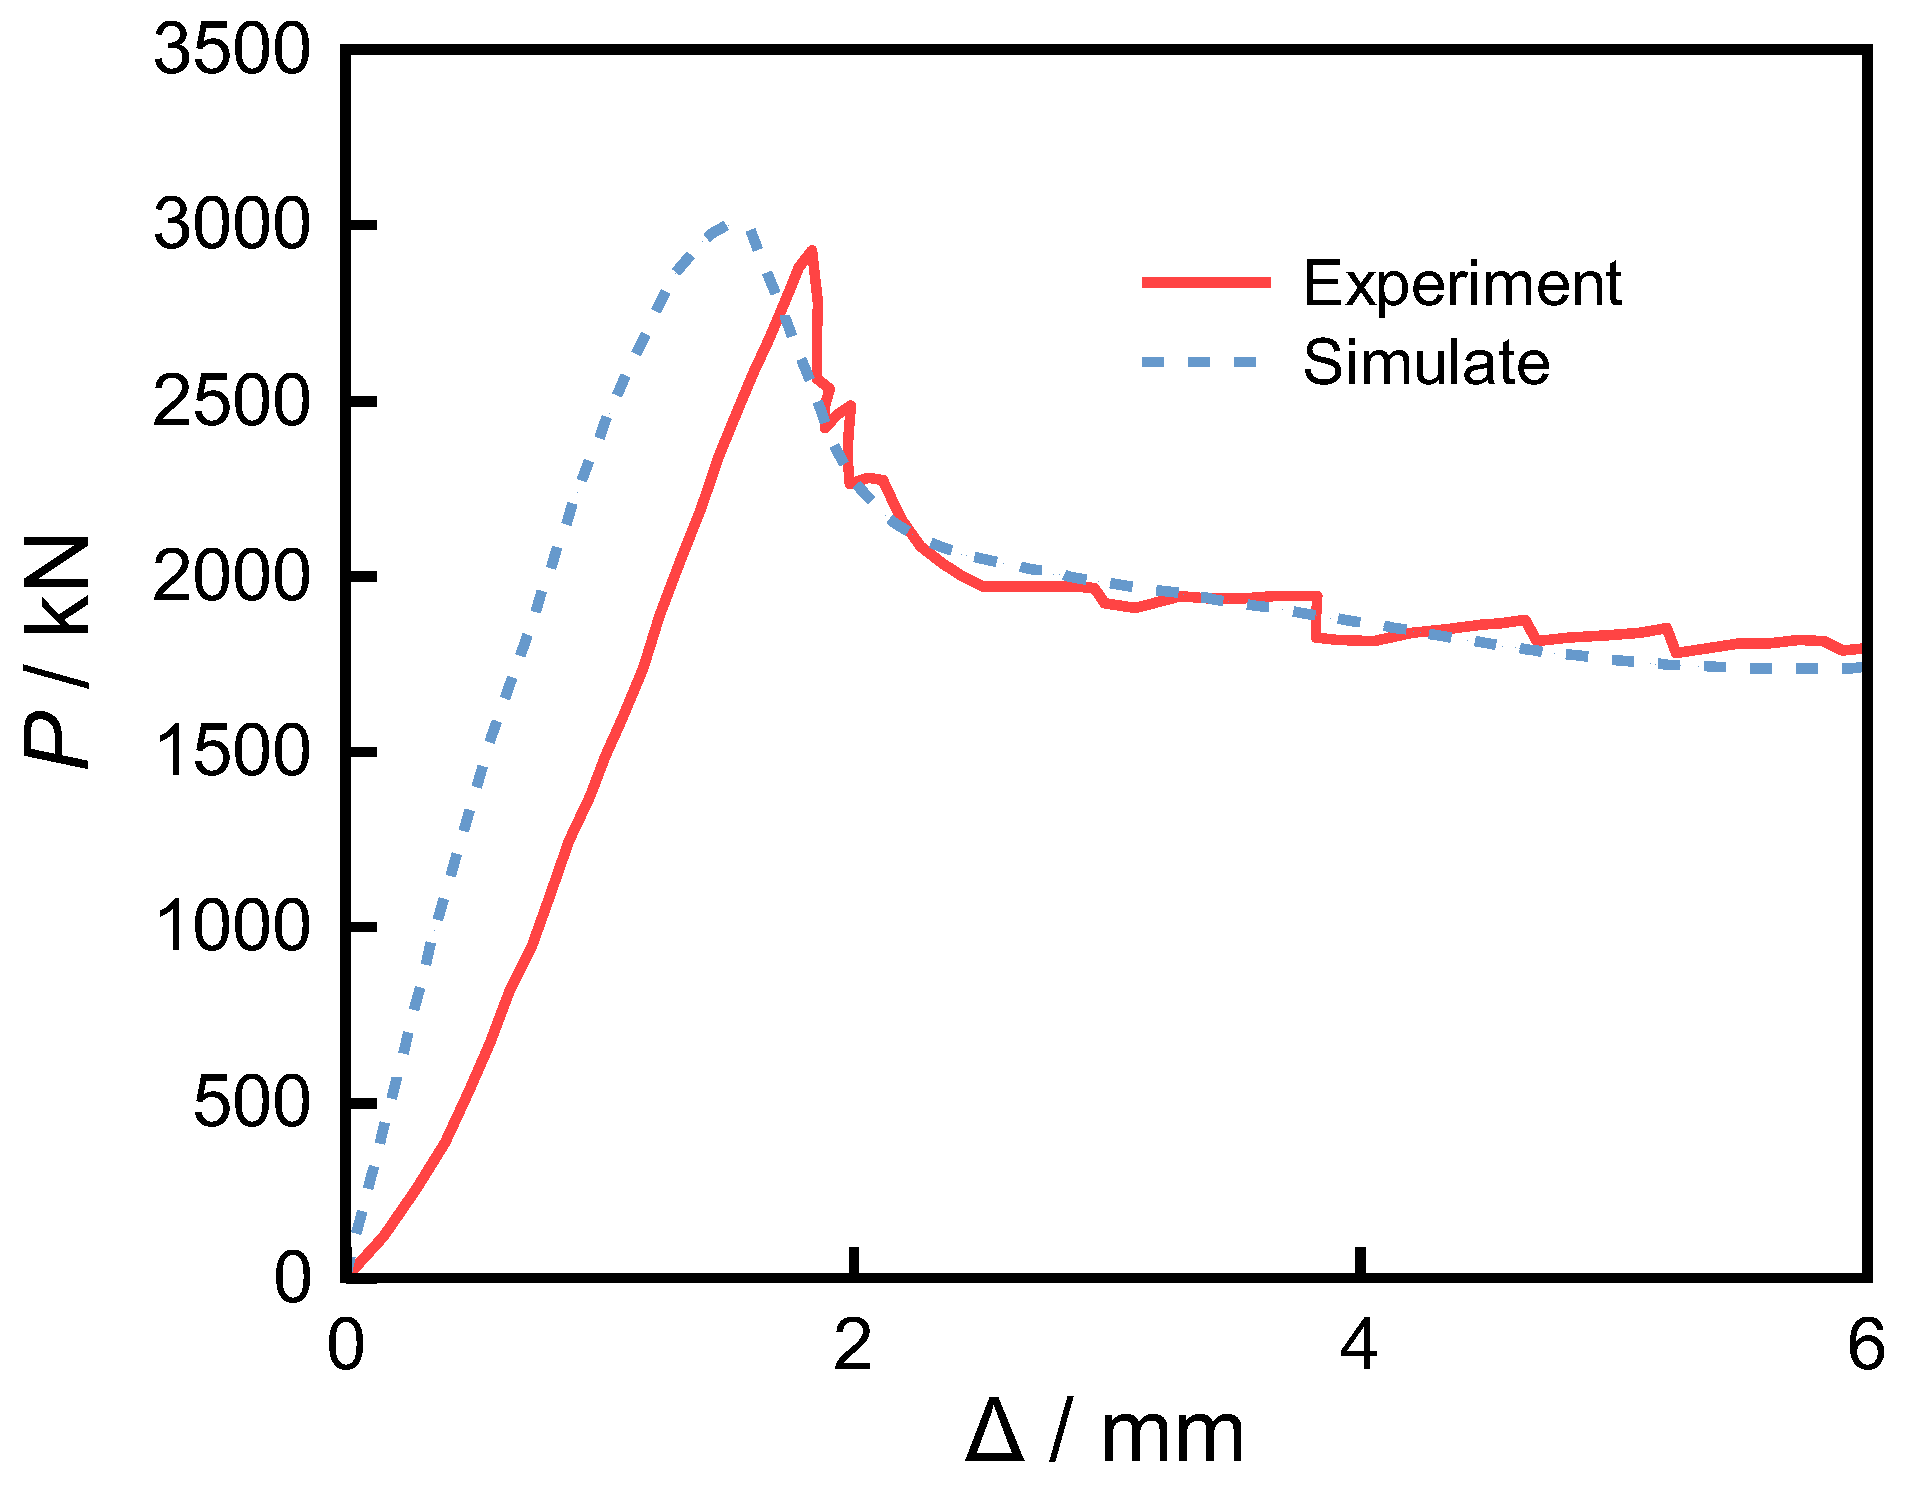
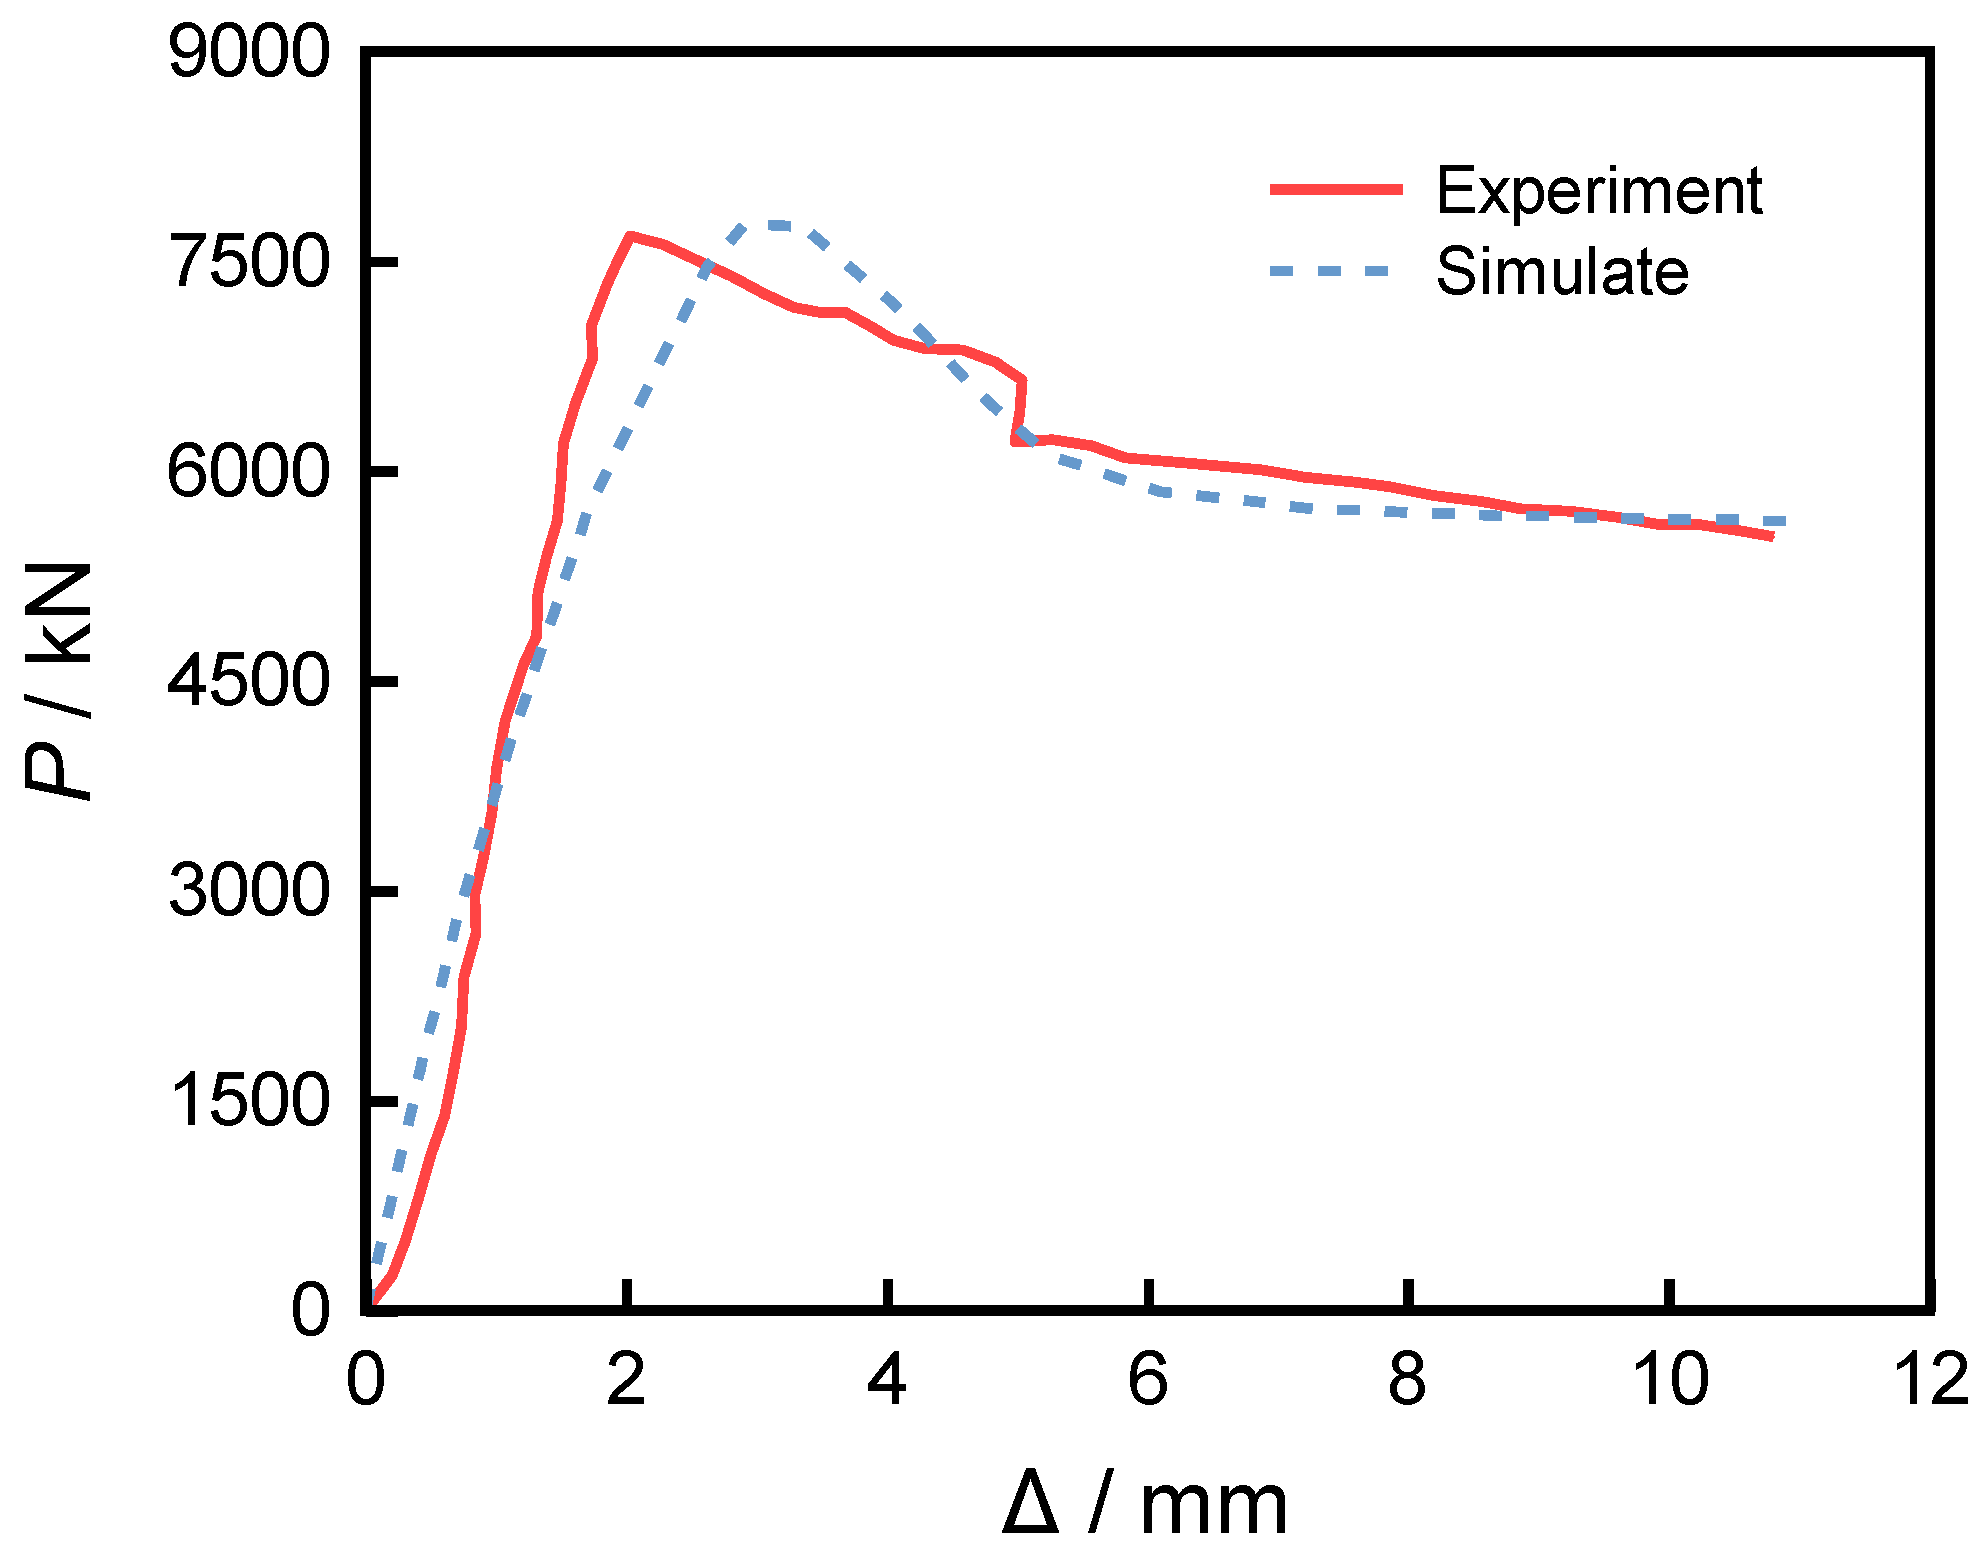
The finite element simulation results were compared with the experimental data, with a focus on analyzing the behavior of the axial load–displacement (P-Δ) curves. Figure 19 presents the comparison results between the two. As shown in the figure, the trend of the numerically simulated curve is generally consistent with that of the experimental results, both exhibiting a slanted linear form before reaching the peak value. The ultimate load measured in the experiment, Put, was 7736 kN, while the ultimate load obtained from the finite element simulation, PuFE, was 7767.04 kN, resulting in a ratio of ultimate bearing capacities of 0.99. This indicates a high level of agreement between the two sets of results, demonstrating that the established finite element model possesses good reliability.

3.3. UHPC Fully Encased S690 High-Strength Steel Short Column

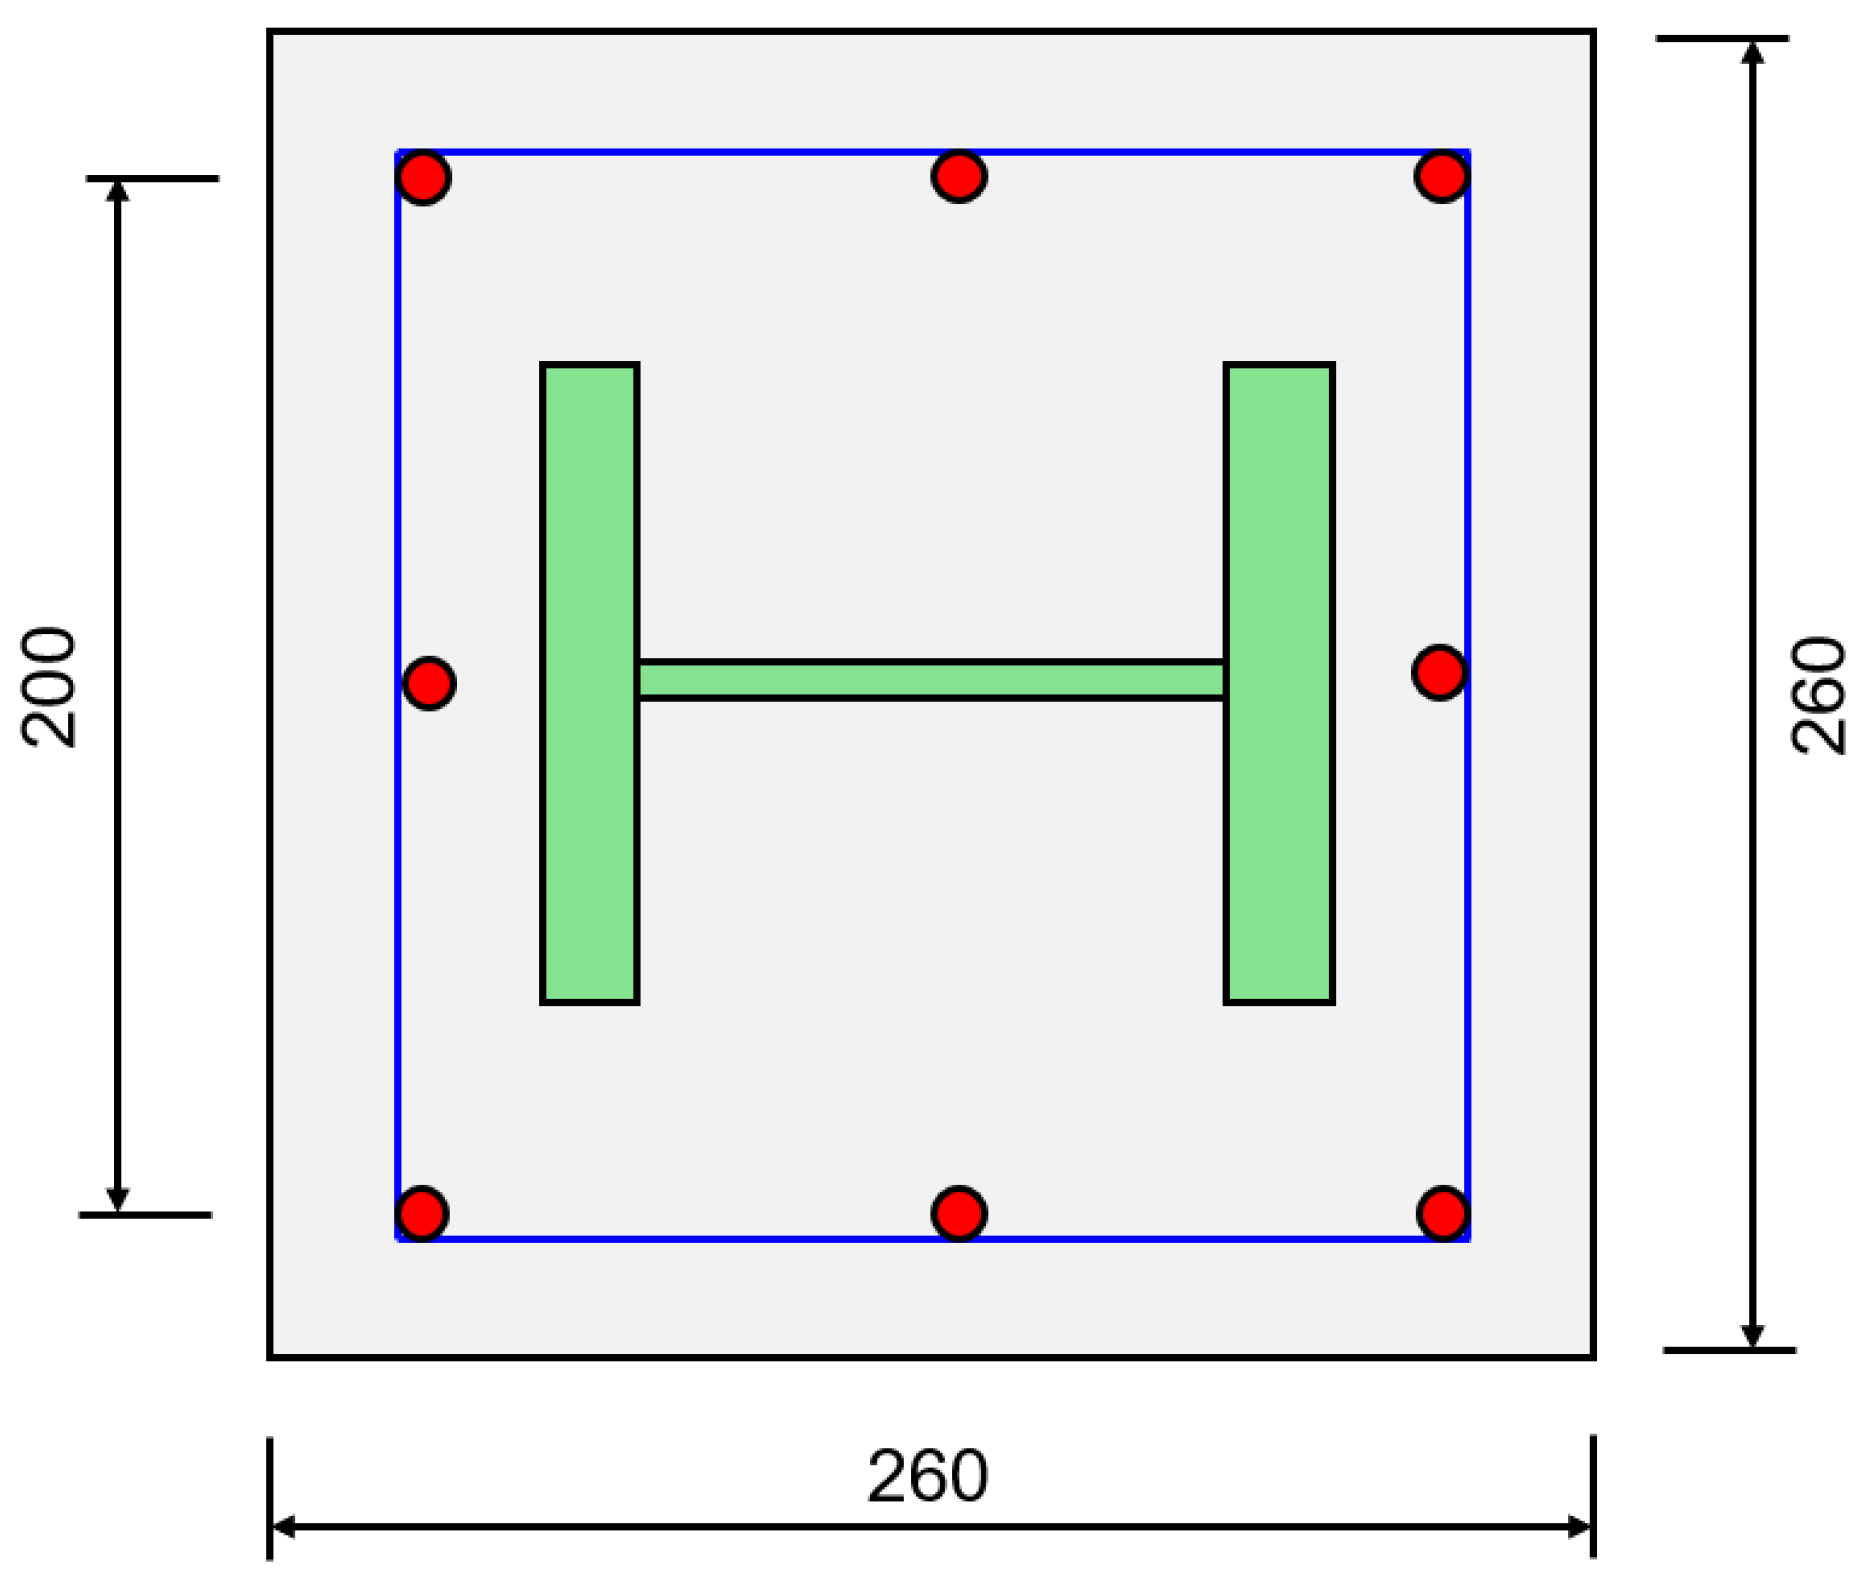
The literature [35] reports experimental studies on UHPC-encased S690 high-strength steel short columns. In this study, the specimen S690-C130-SP60-H was selected as the subject for finite element analysis. Figure 20 presents a three-dimensional structural schematic of the specimen, Figure 21 displays its mesh division, and Figure 22 provides detailed cross-sectional dimensions. According to the degree of confinement imposed by stirrups and structural steel on the concrete, the confined concrete can be categorized into three types: partially steel-confined concrete (PSCC), partially confined concrete (PCC), and unconfined concrete (UCC) [34]. The specimen has a height of 600 mm and a cross-sectional width of 260 mm. Rigid bearing plates with a thickness of 50 mm and a cross-sectional width of 260 mm are placed at both the top and bottom ends of the specimen.
For the concrete component, UHPC with a strength grade of C130 was used. The steel section employed in the specimens is specified as 196 × 160 × 10 × 36, with steel grade S690. The measured yield strength fy of the steel is 739 MPa, and its elastic modulus Es is 2.06 × 10⁵ MPa. The longitudinal reinforcement consists of HRB500 steel bars with a diameter of 13 mm, while the stirrups are HRB500 steel bars with a diameter of 10 mm, spaced at 60 mm intervals. The center-to-edge distance from the stirrups to the edges of both ends of the short column is 60 mm. The measured yield strength fy of the HRB500 steel bars is 578 MPa, and their elastic modulus Es is 2.06 × 10⁵ MPa. The thickness of the protective concrete cover for the outermost layer of steel reinforcement is 13.5 mm. The constitutive relationships of UHPC, steel sections, and reinforcement discussed in this paper all comply with the relevant provisions specified in Section 2.1.
In this study, the UHPC and steel sections were modeled using C3D8R elements, while the longitudinal reinforcement and stirrups were simulated with two-node three-dimensional truss elements (T3D2). For the treatment of material interfaces, hard contact was applied in the normal direction between UHPC and the steel section, and the Coulomb friction criterion was employed in the tangential direction with a friction coefficient of 0.6. The mesh sizes for both UHPC and the steel section were set to 30 mm to balance computational efficiency and accuracy. The rigid bearing blocks were connected to the surfaces of the short columns via tie constraints. The rigid base plate at the bottom of the column was fully fixed (Ux = Uy = Uz = UR1 = UR2 = UR3 = 0), while the upper rigid bearing plate was designed as a sliding hinge support (Ux = Uy = 0), with a downward displacement of 10 mm applied at the reference point of the bearing plate.
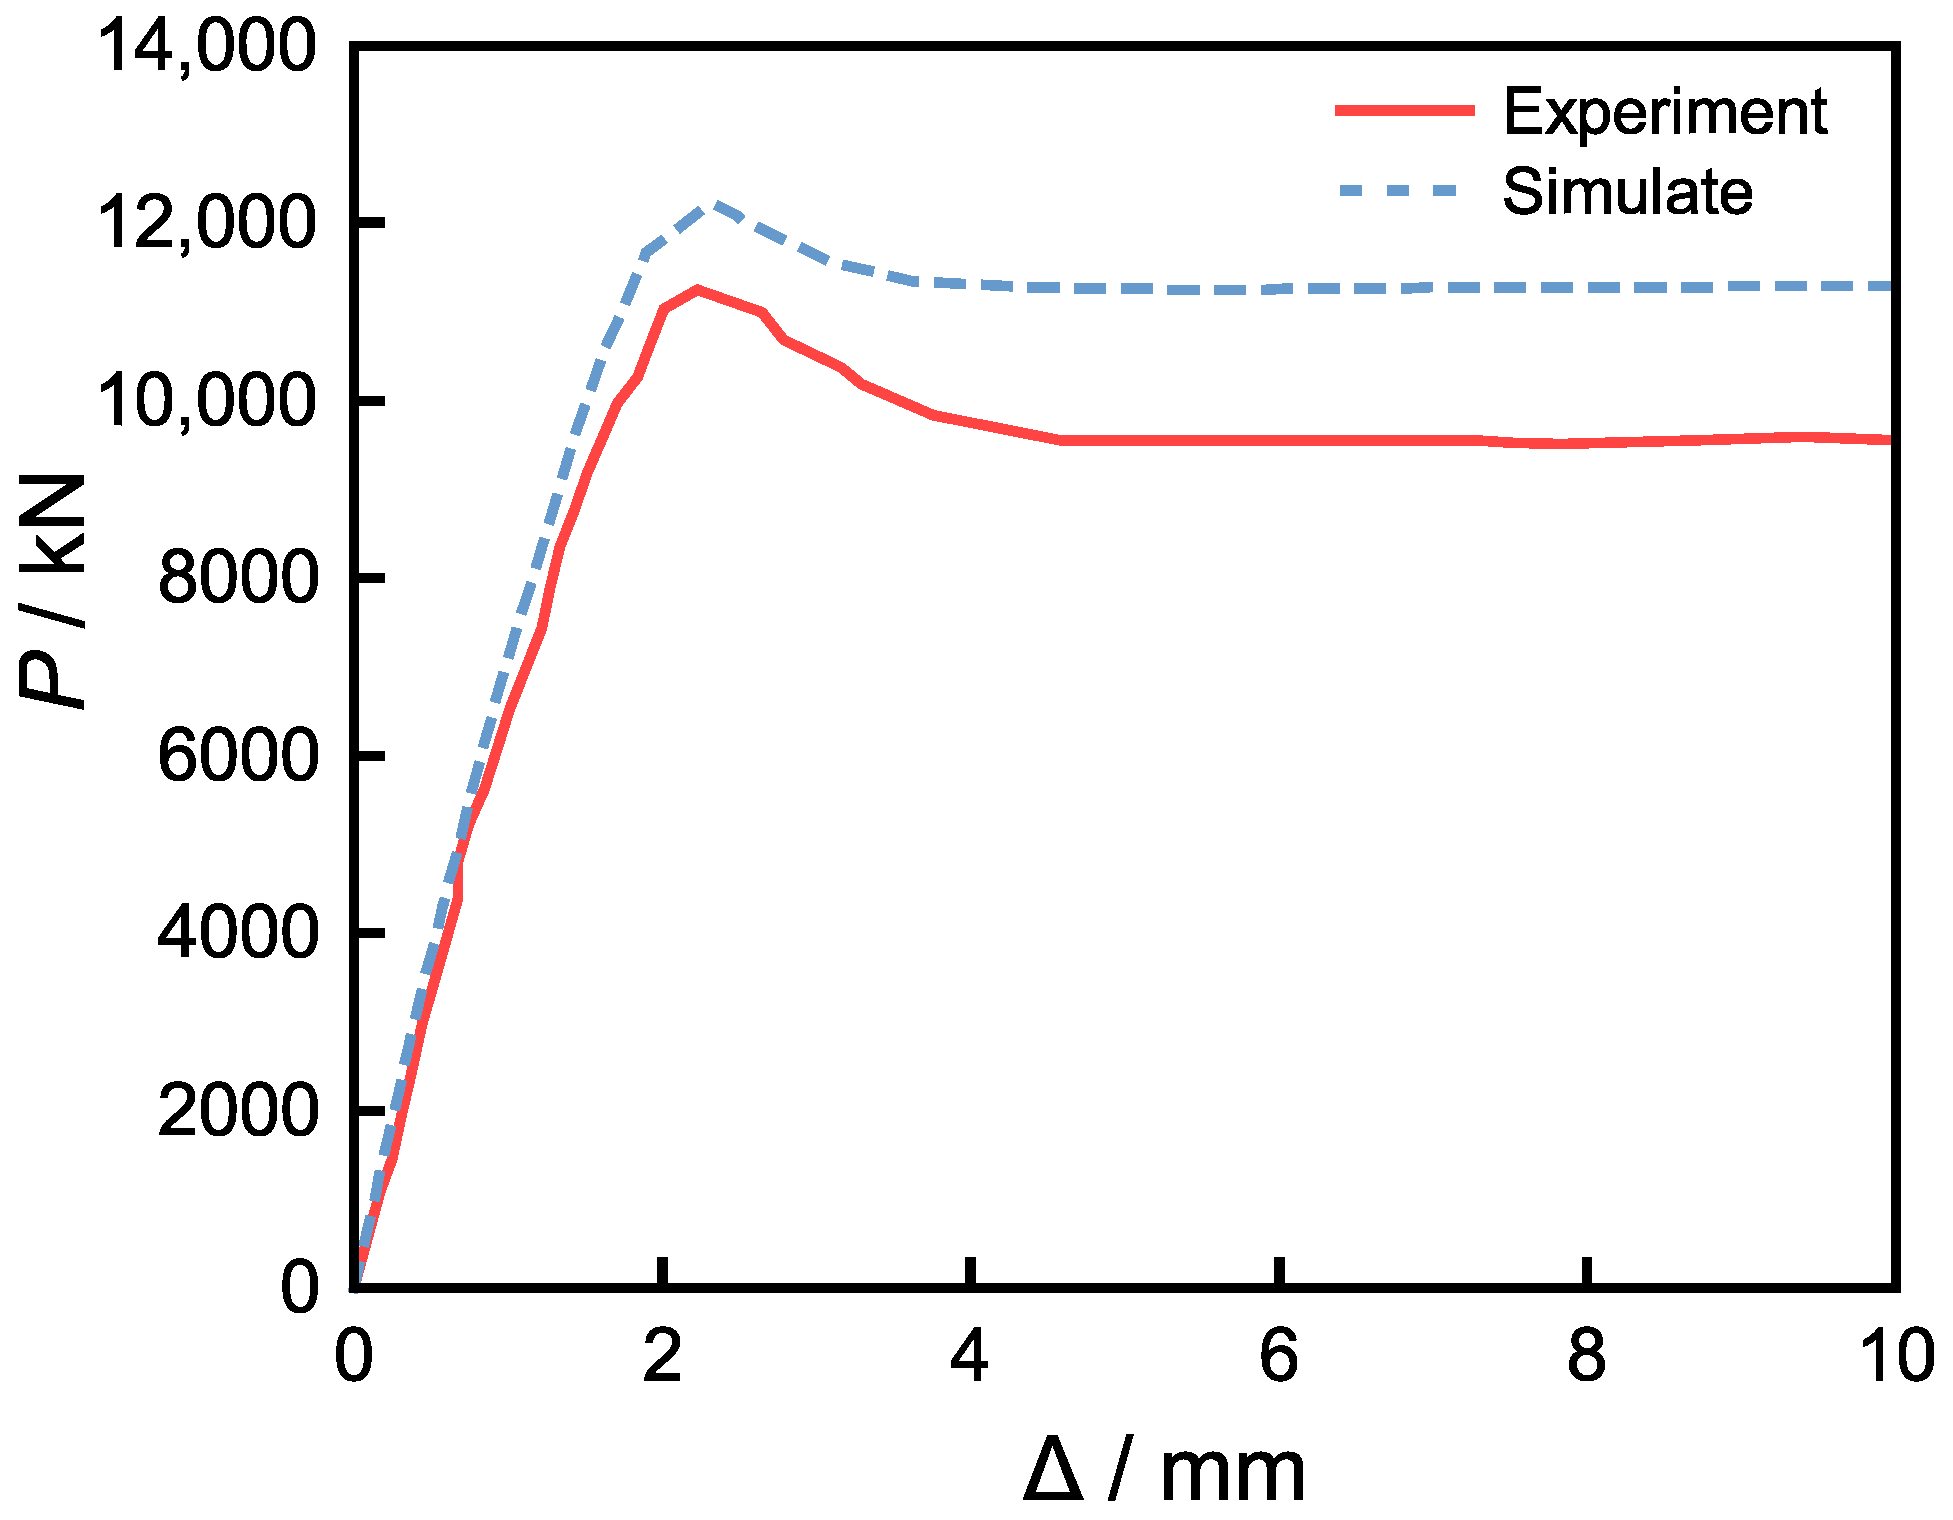
The finite element simulation results were compared with the experimental data, with particular focus on the analysis of the axial load–displacement (P-Δ) curve. Figure 23 presents the comparative results. It can be observed that the curve obtained from numerical simulation generally agrees with the experimental results, though the ultimate load and the descending branch of the curve are slightly higher than the experimental data. The experimentally measured ultimate load Put is 11,239 kN, while the finite element simulated ultimate load PuFE is 12,231.13 kN. The ratio of the two ultimate bearing capacities is 0.92. These results indicate a high degree of agreement, demonstrating that the established finite element model possesses good reliability.
Table 4 compares the experimental ultimate load Put with the finite element simulation results PuFE. As shown in the table, the average ratio of the experimental values to the simulated values is 0.963, with a standard deviation of 0.0309 and a coefficient of variation of 0.0321. These data indicate that the finite element simulation results are very close to the experimental data, demonstrating good consistency.

4. Finite Element Analysis of UHPC-SRC Short Columns

4.1. Finite Element Model Design Scheme

Thirteen finite element models of UHPC-SRC short columns were designed in this study to investigate the influence of various factors on the compressive performance of the short columns. These factors include the diameter of longitudinal reinforcement, the strength of longitudinal reinforcement, the thickness of the permanent formwork, the strength grade of the permanent formwork, the strength of the steel section, and the thickness of the stirrup protective layer.
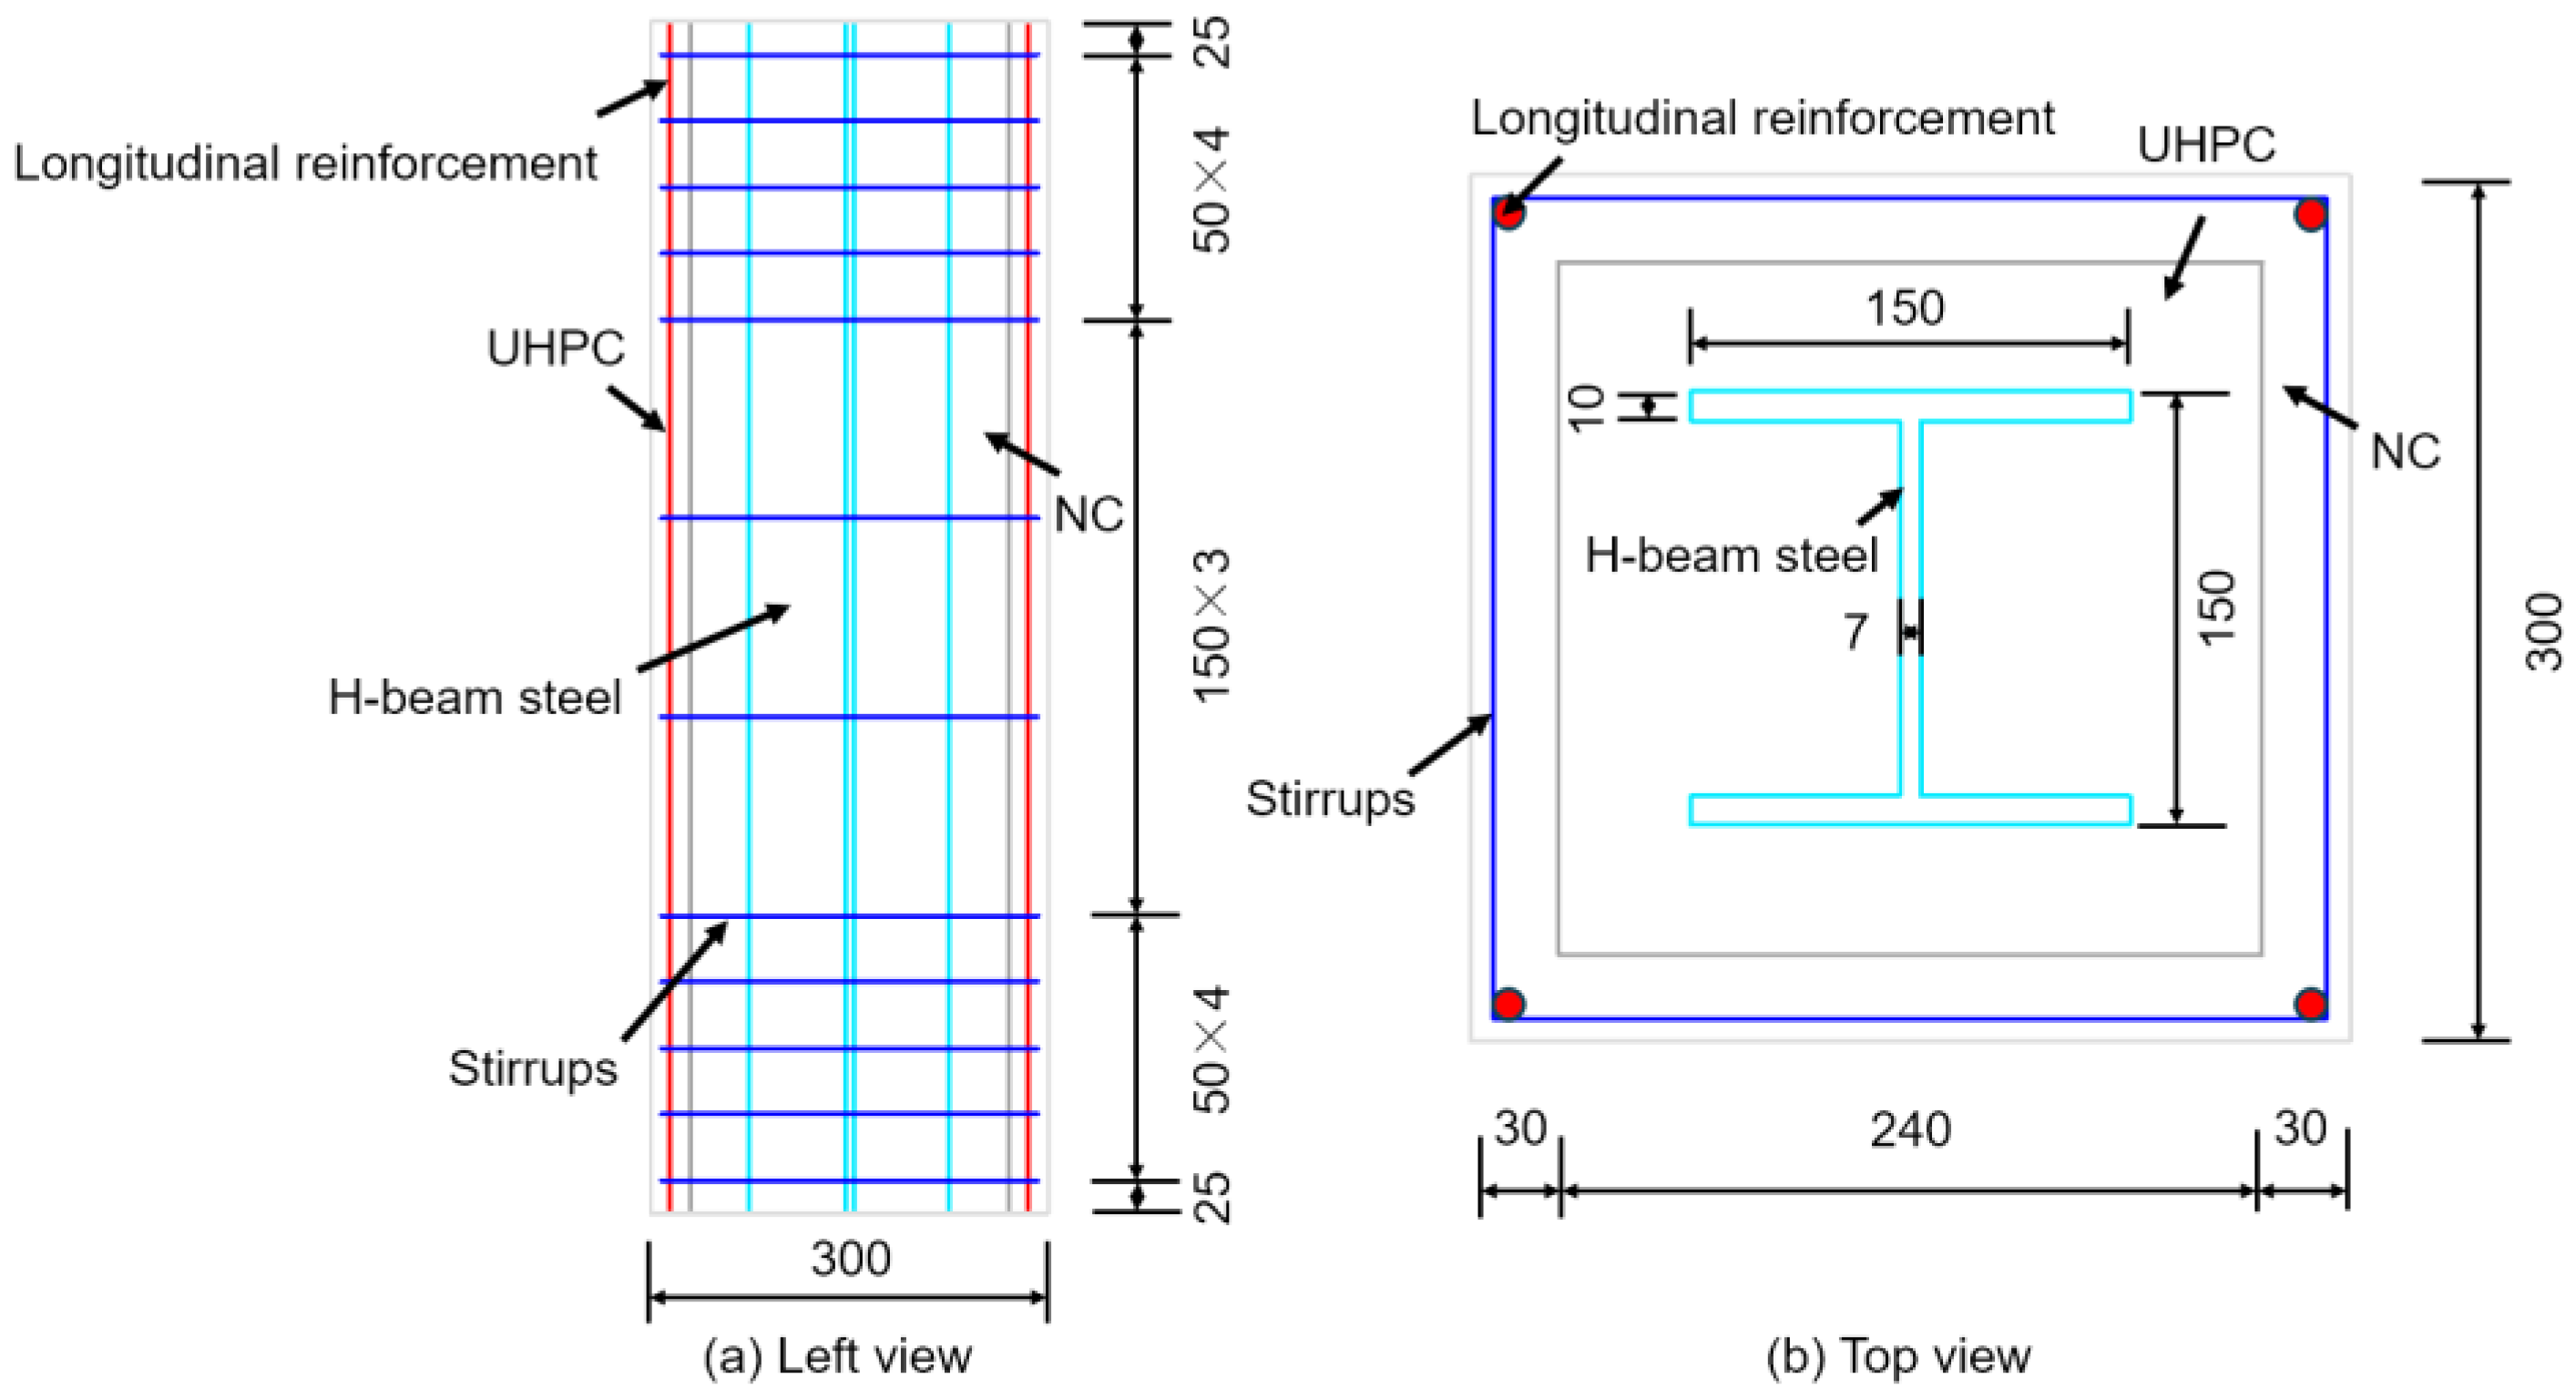
The cross-sectional width of the short column is 300 mm, and the height is 900 mm. The thickness of the UHPC formwork is 30 mm, while the cast-in-place NC layer has a cross-sectional width of 240 mm. At both the top and bottom ends of the specimen, a rigid bearing plate is installed, each with a thickness of 50 mm and a cross-sectional width of 300 mm. The strength grade of the cast-in-place concrete is C30. The built-in H-shaped steel is made of Q235 grade, with sectional dimensions of 150 × 150 × 7 × 10 mm. Four longitudinal reinforcing bars of HRB400 grade, each with a diameter of 8 mm, are arranged inside the UHPC formwork. Stirrups are placed on the outermost side of the formwork, with a protective layer thickness of 5 mm. The distance from the outer edge of the topmost and bottommost stirrups to the concrete edge is 25 mm. The stirrups use HRB400 grade steel bars with a diameter of 6 mm, and are spaced at 50 mm and 150 mm.
The axial compressive strength of UHPC and NC materials, as well as the yield strength of H-shaped steel and reinforcement bars, all adopt standard values. The elastic modulus of the reinforcement bars is 2.06 × 10⁵ MPa. A schematic diagram of the design for UHPC-SRC short columns is shown in Figure 24, and the basic design parameters of the short column models are detailed in Table 5.

4.2. Axial Load–Displacement Curve from Finite Element Analysis

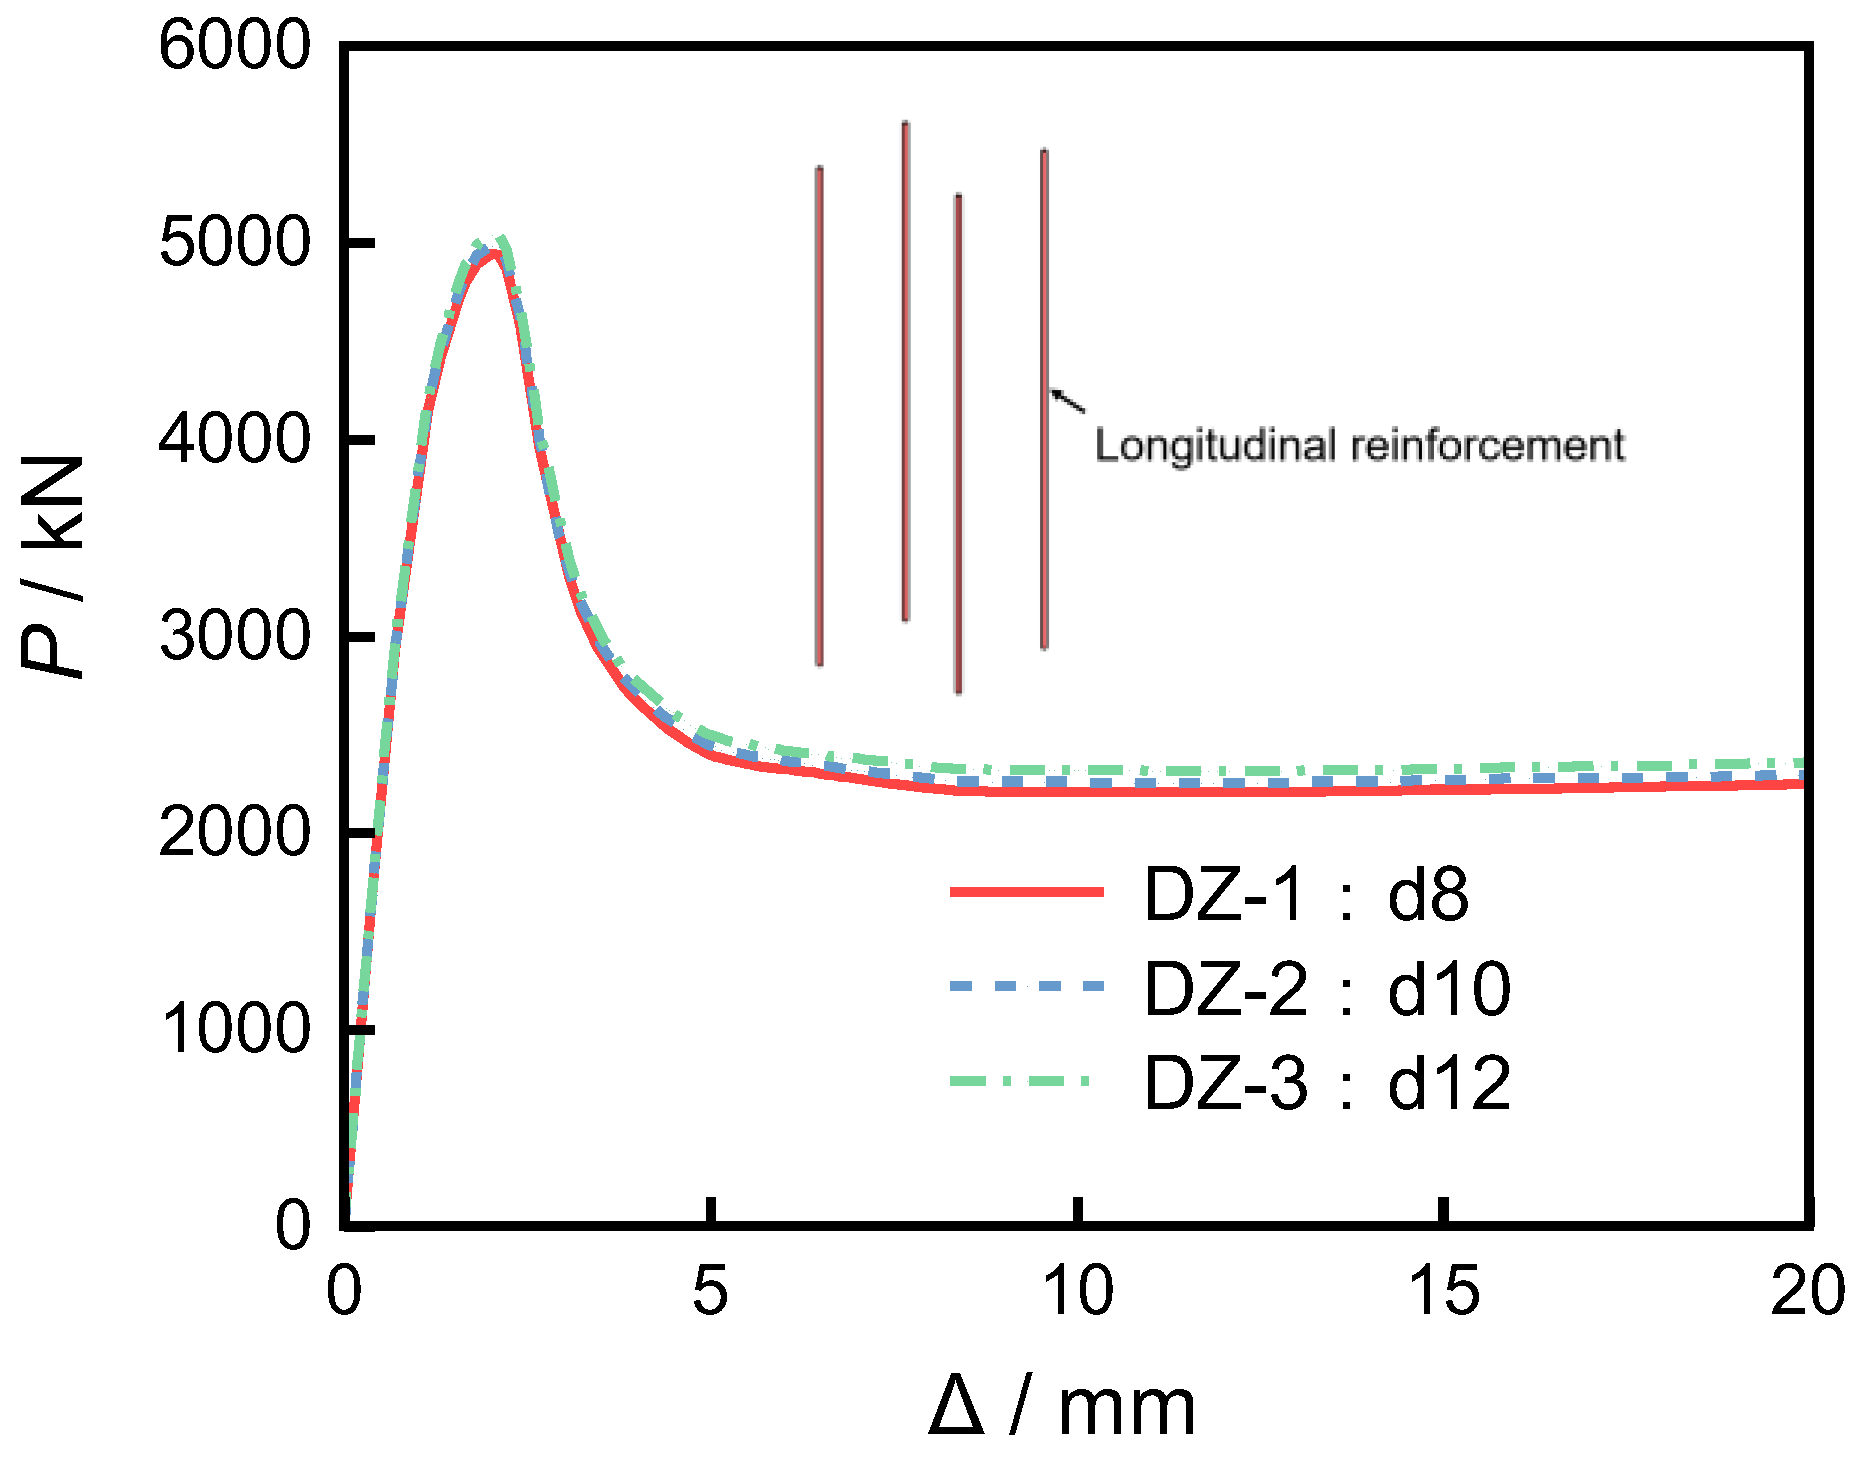
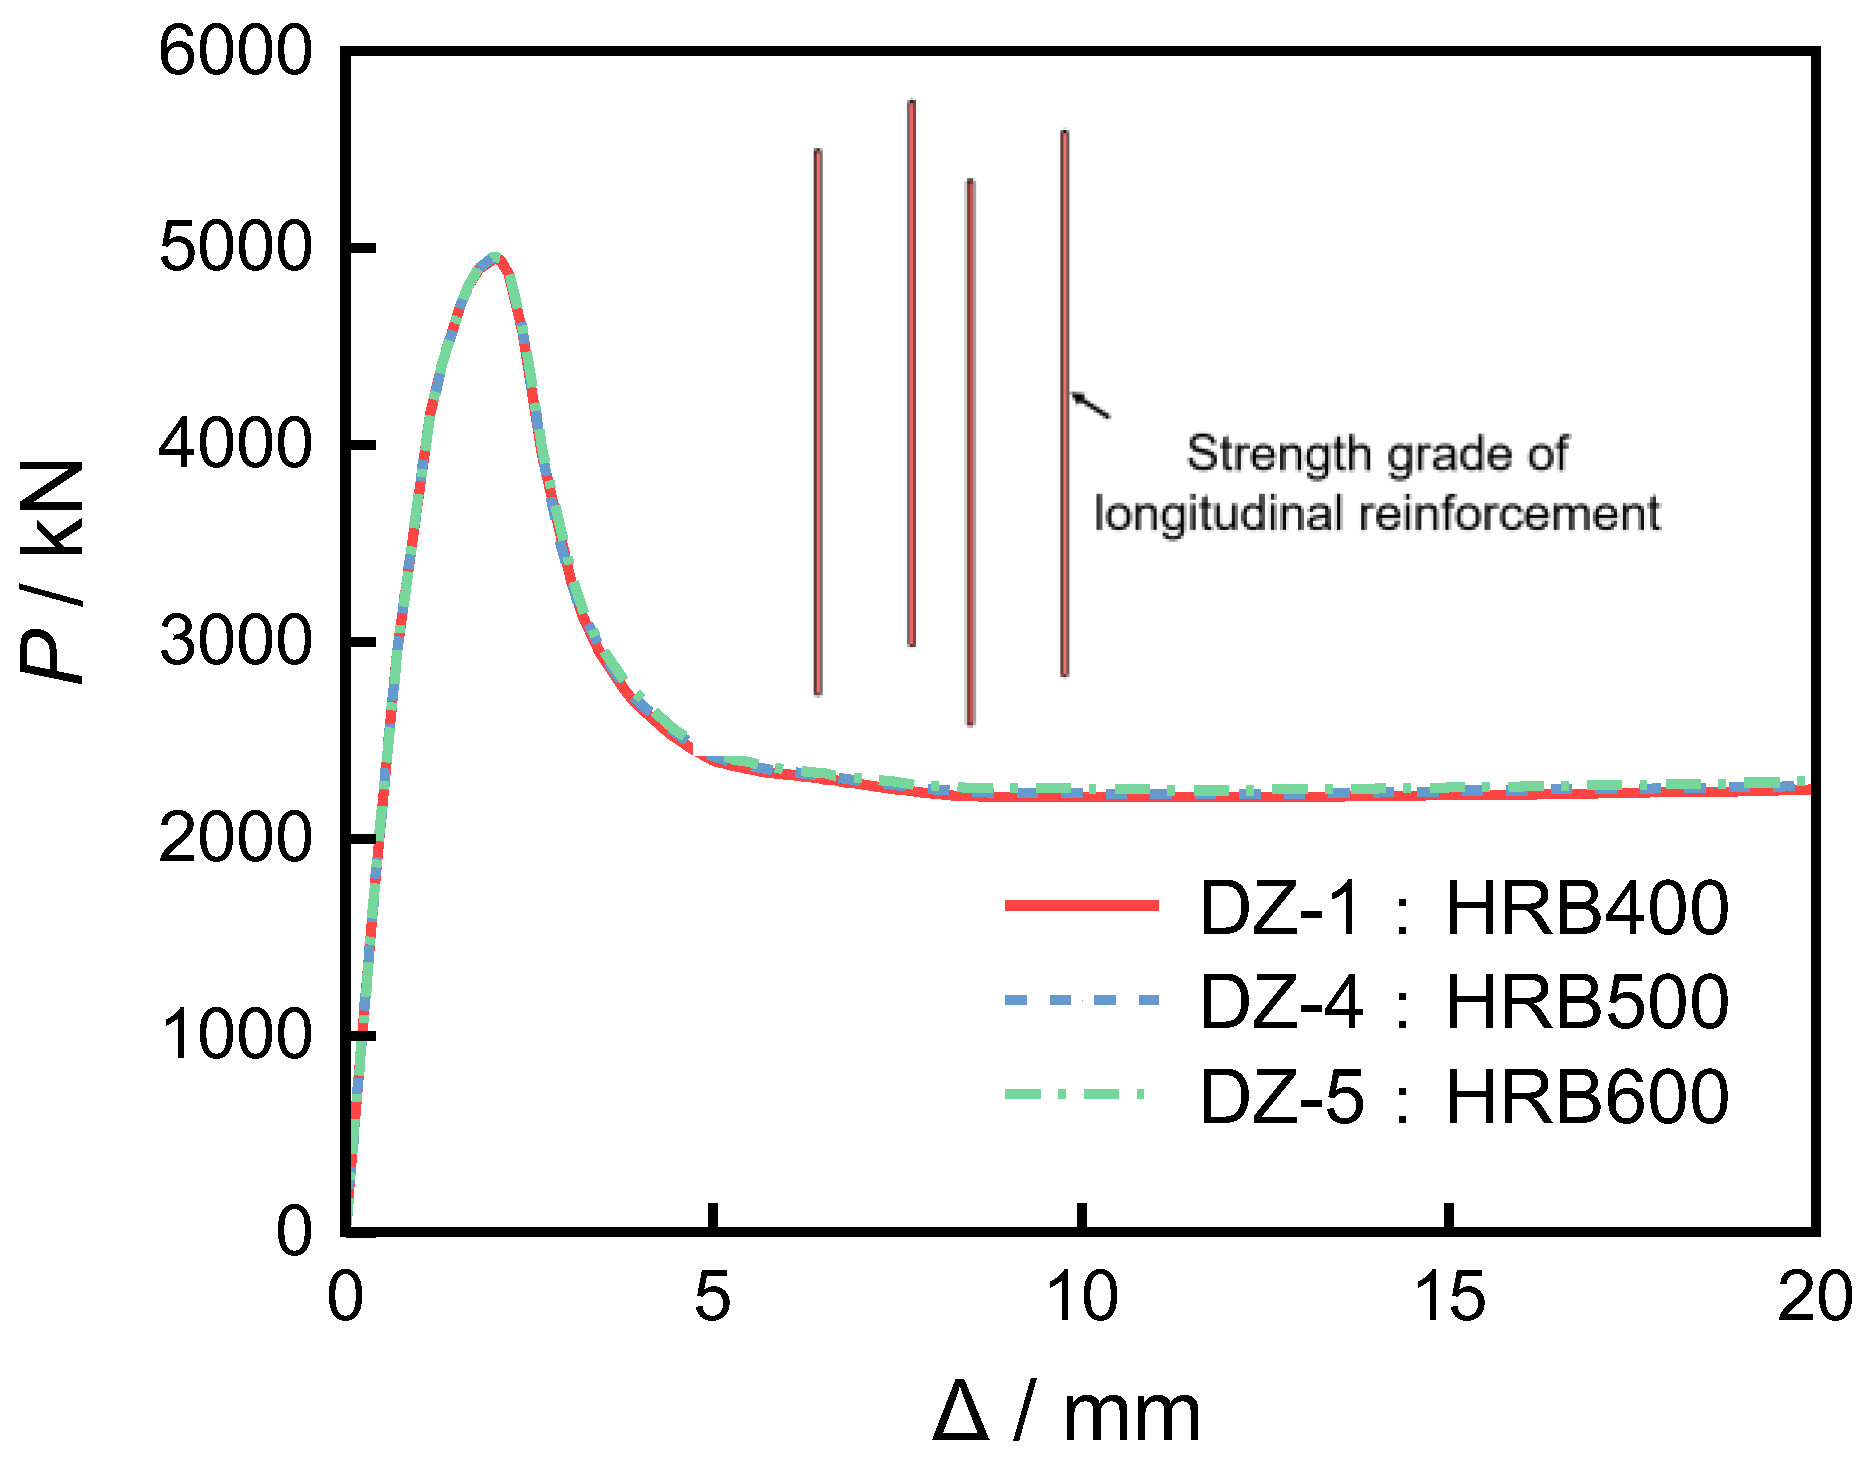
Based on the finite element model calculations, the axial load–displacement (P-Δ) curves of the 13 composite columns are shown in Figure 25, Figure 26, Figure 27, Figure 28, Figure 29 and Figure 30. Table 6 lists the ultimate loads obtained from the finite element simulations and their corresponding displacement values.

4.2.1. Longitudinal Reinforcement Ratio

Three groups of specimens, DZ-1, DZ-2, and DZ-3, were used to investigate the influence of longitudinal reinforcement ratio on the axial load–displacement curves. As shown in Figure 25, when the longitudinal reinforcement ratio increased gradually from 0.22% to 0.35% and 0.50%, the ultimate loads increased by 0.91% and 2.02%, respectively, compared to DZ-1, indicating only a slight overall improvement. This suggests that increasing the longitudinal reinforcement ratio has a limited effect on enhancing the performance of UHPC-SRC short columns.

4.2.2. Longitudinal Reinforcement Strength

Three groups of specimens, DZ-1, DZ-4, and DZ-5, were used to investigate the influence of longitudinal reinforcement strength on the axial load–displacement curves. As shown in Figure 26, as the longitudinal reinforcement strength increased sequentially from HRB400 to HRB500 and HRB600, the ultimate load increased by 0.33% and 0.47% compared to DZ-1, respectively. The overall increase is even less than the increase in the longitudinal reinforcement ratio. This indicates that improving the longitudinal reinforcement strength, similar to increasing the longitudinal reinforcement ratio, has a limited effect on the performance enhancement of UHPC-SRC short columns.

4.2.3. Thickness of Permanent Formwork

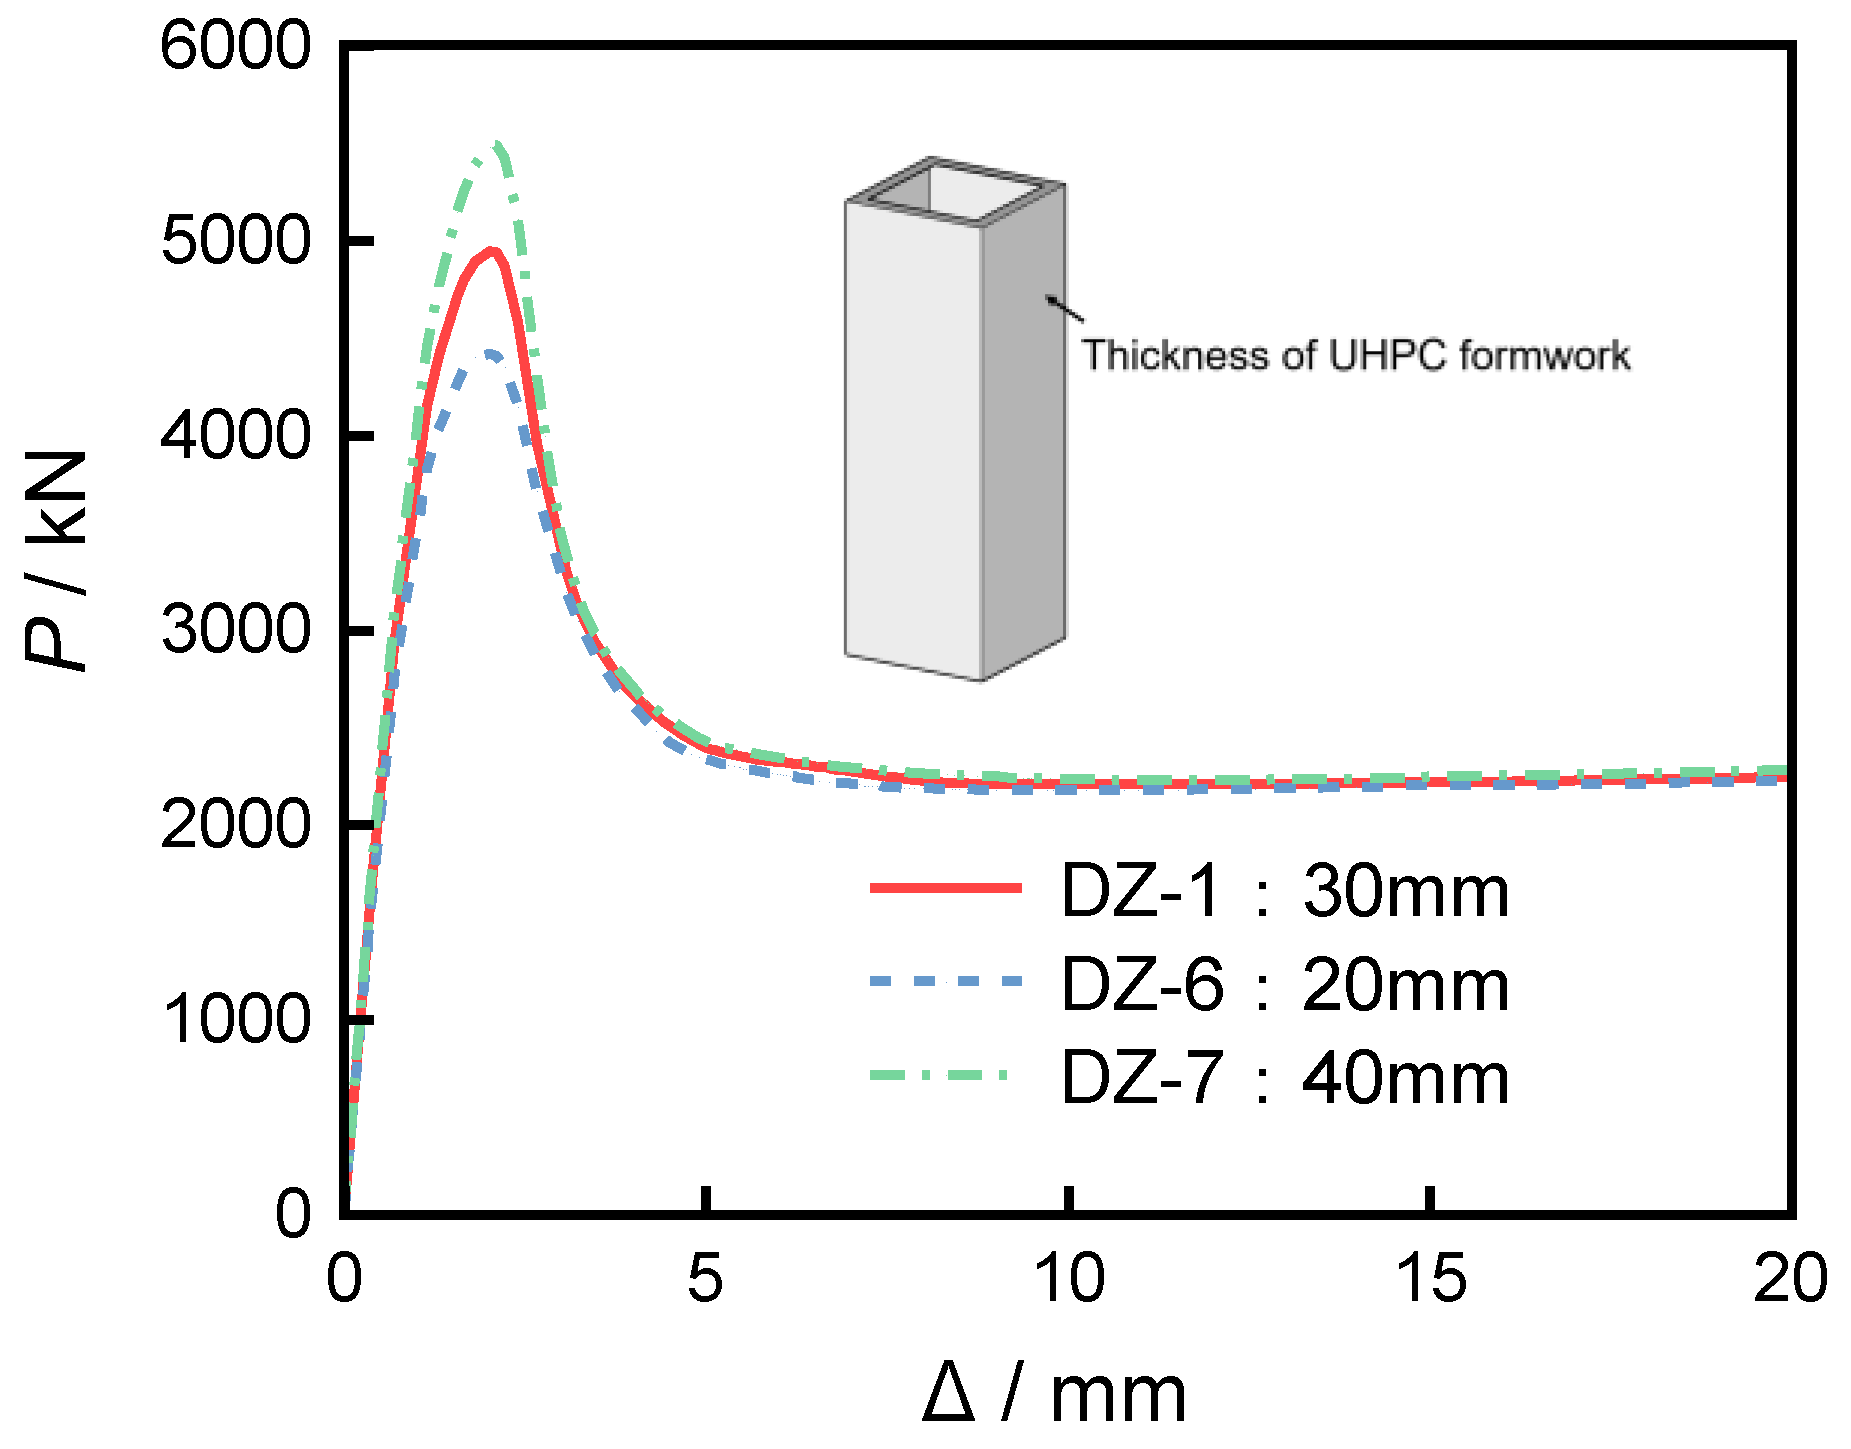
Specimens DZ-1, DZ-6, and DZ-7 were used to investigate the influence of the thickness of the permanent formwork on the axial load–displacement curves. As shown in Figure 27, when the thickness of the permanent formwork increased from 20 mm to 30 mm and 40 mm, the ultimate load was enhanced by 17.40% and 23.25%, respectively, compared to DZ-6. The steel fibers within the UHPC acted as bridges, ensuring an effective combination between UHPC and stirrups, thereby jointly bearing the radial and circumferential stresses within the composite cross-section and providing a good confinement effect. With the increase in UHPC formwork thickness, the confinement effect was further strengthened, leading to a significant improvement in the performance of UHPC-SRC short columns.

4.2.4. Strength Grade of Permanent Formwork

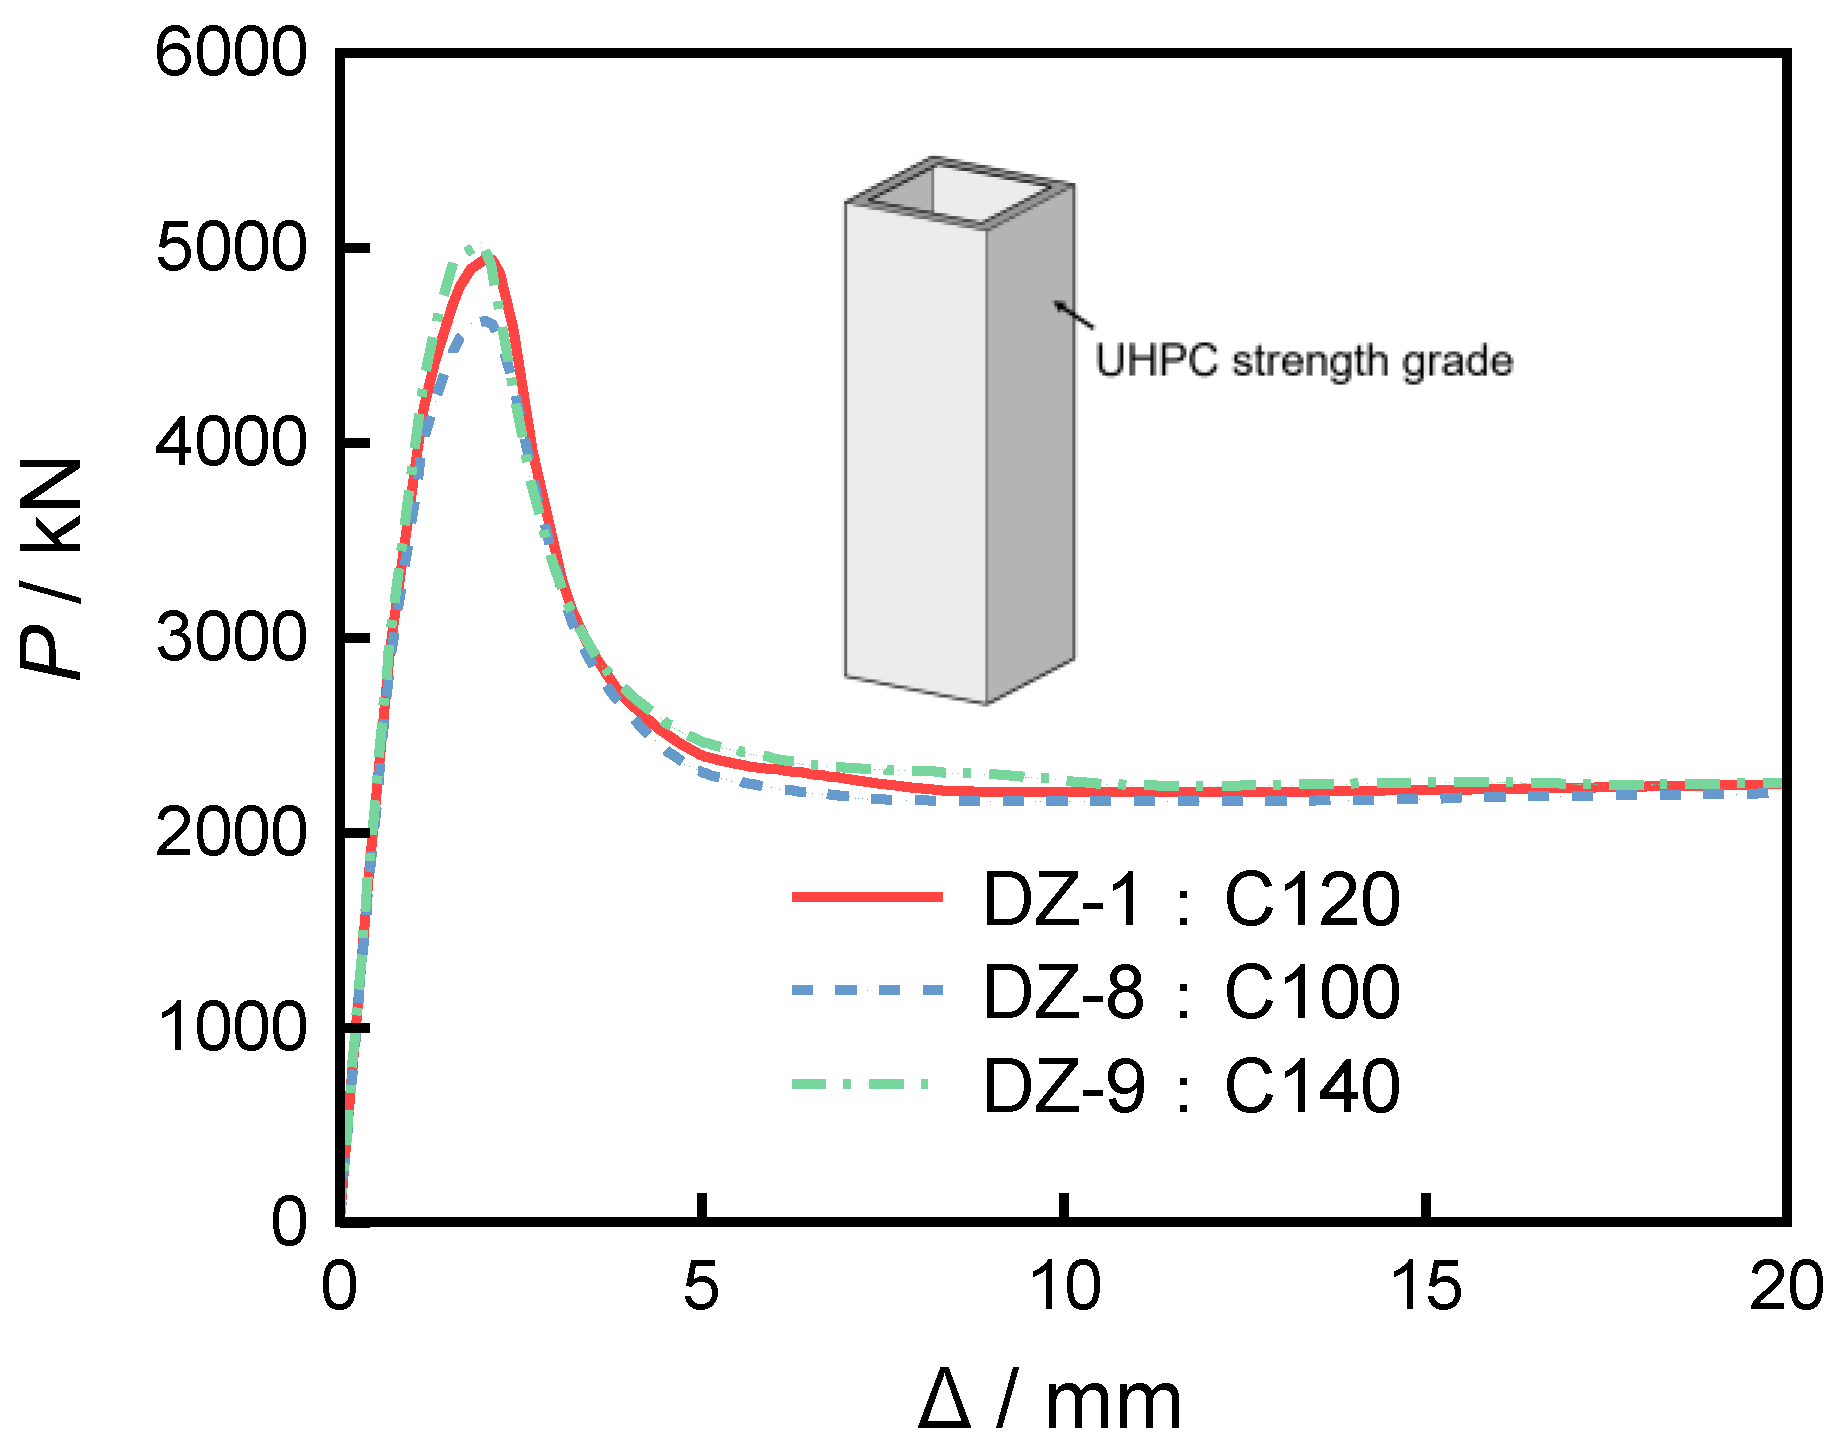
Three groups of specimens, DZ-1, DZ-8, and DZ-9, were used to investigate the influence of the strength grade of the permanent formwork on the axial load–displacement curve. As shown in Figure 28, with an increase in the formwork strength grade from C100 to C120 and C140, the ultimate load increases by 12.92% and 16.71%, respectively, compared to DZ-8. Enhancing the UHPC strength grade can effectively improve the load-bearing capacity of UHPC-SRC short columns, although its effect is slightly less significant than increasing the thickness of the permanent formwork. Additionally, increasing the UHPC strength grade results in a reduction in the ultimate displacement.

4.2.5. Steel Section Strength Grade

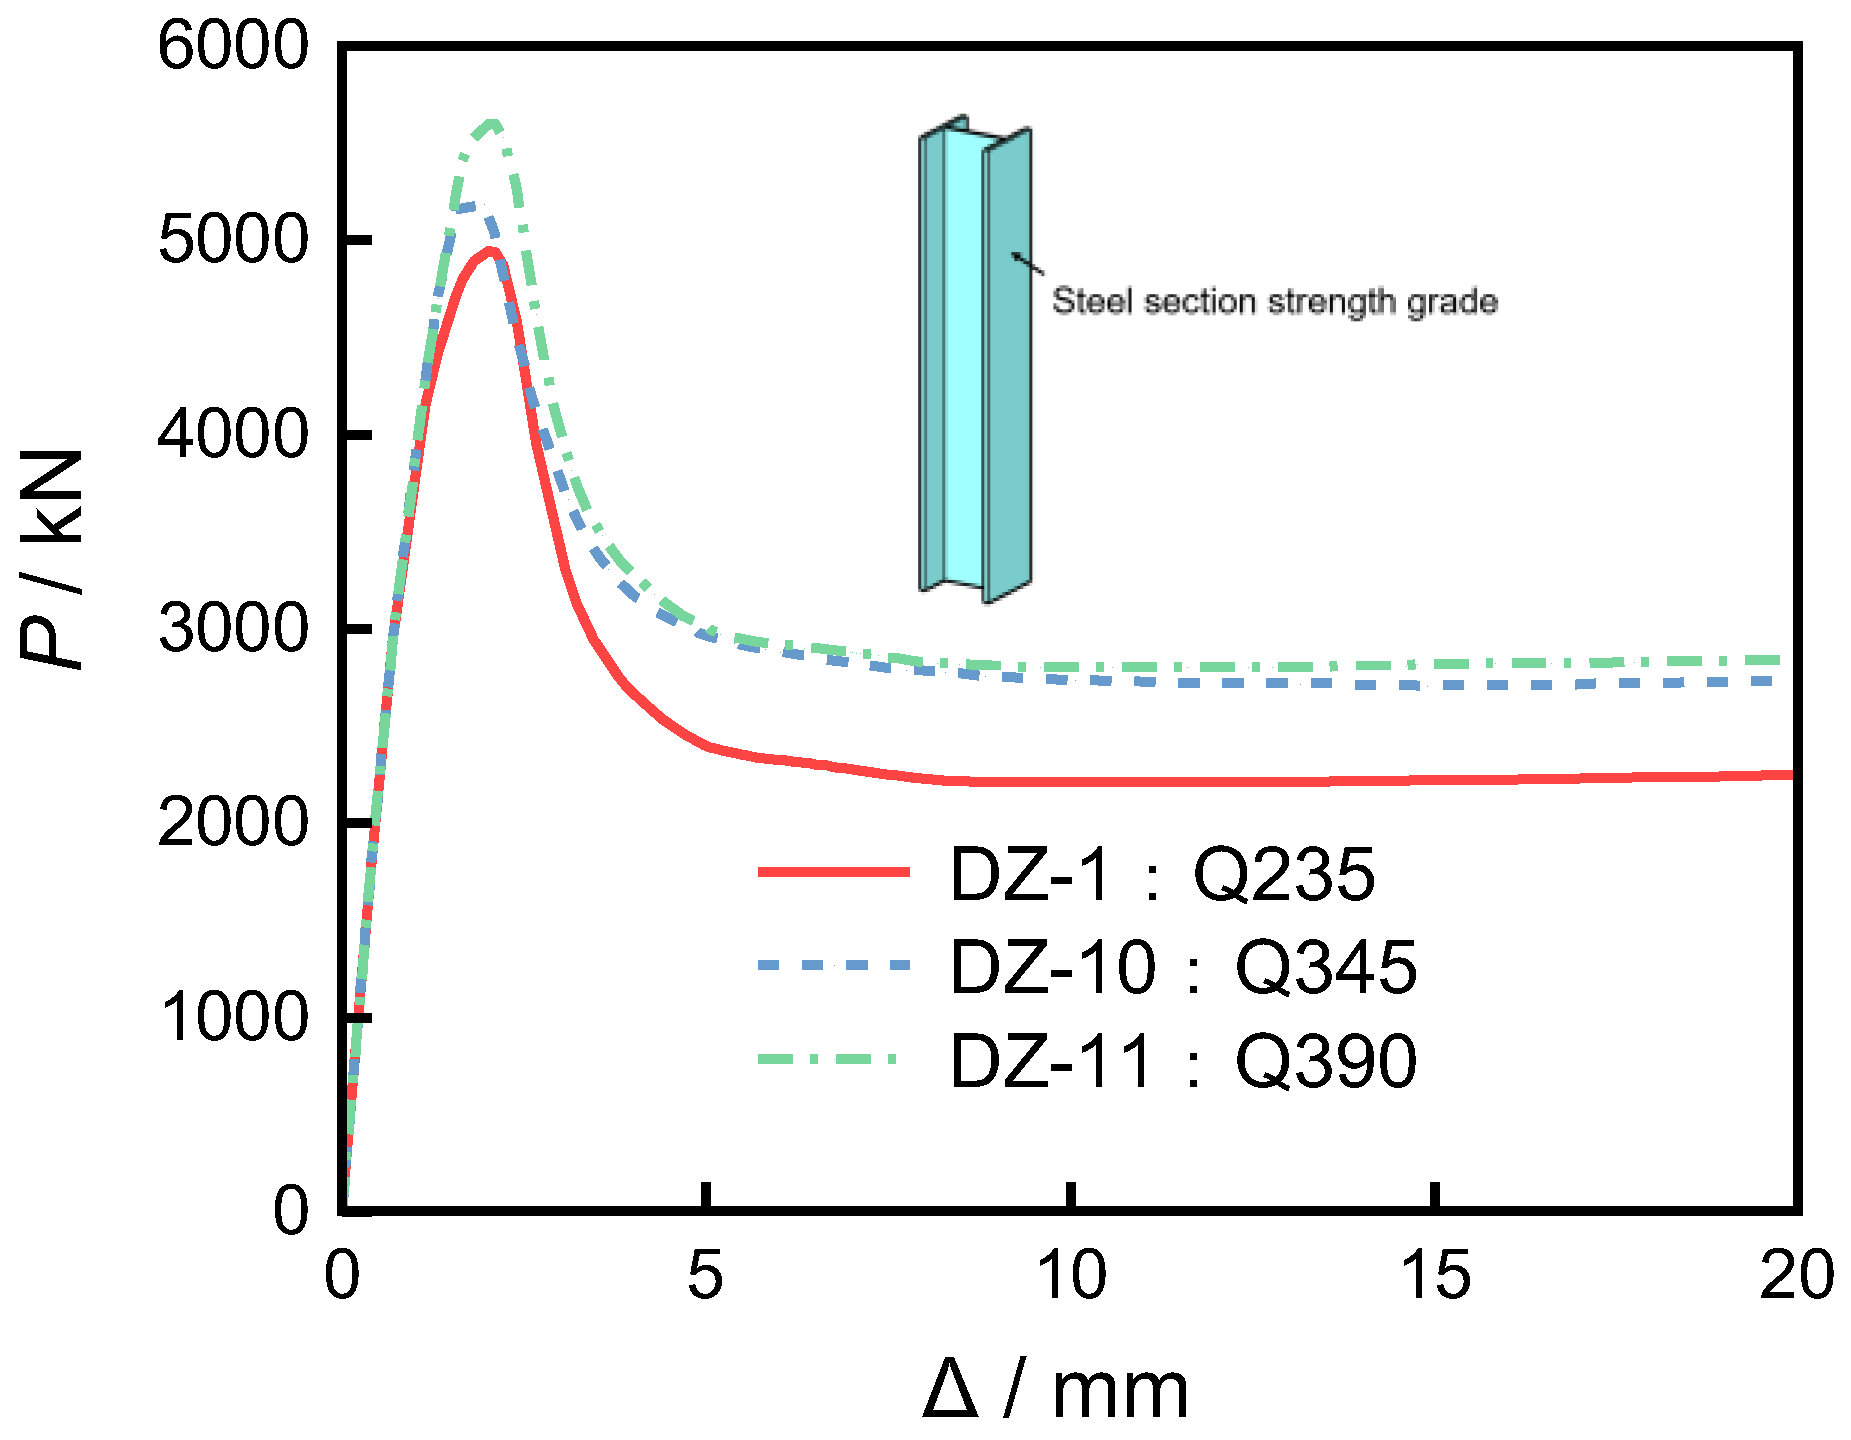
Three groups of specimens, DZ-1, DZ-10, and DZ-11, were used to investigate the effect of the strength grade of structural steel on the axial load–displacement curve. As shown in Figure 29, as the strength grade of structural steel increases from Q235 to Q345 and Q390, their ultimate loads increase by 6.57% and 8.13%, respectively, compared to DZ-1. Although increasing the strength grade of structural steel can enhance the performance of UHPC-SRC short columns, the degree of improvement is slightly less than that achieved by changing the thickness and strength grade of the permanent formwork.

4.2.6. Thickness of Stirrup Concrete Cover

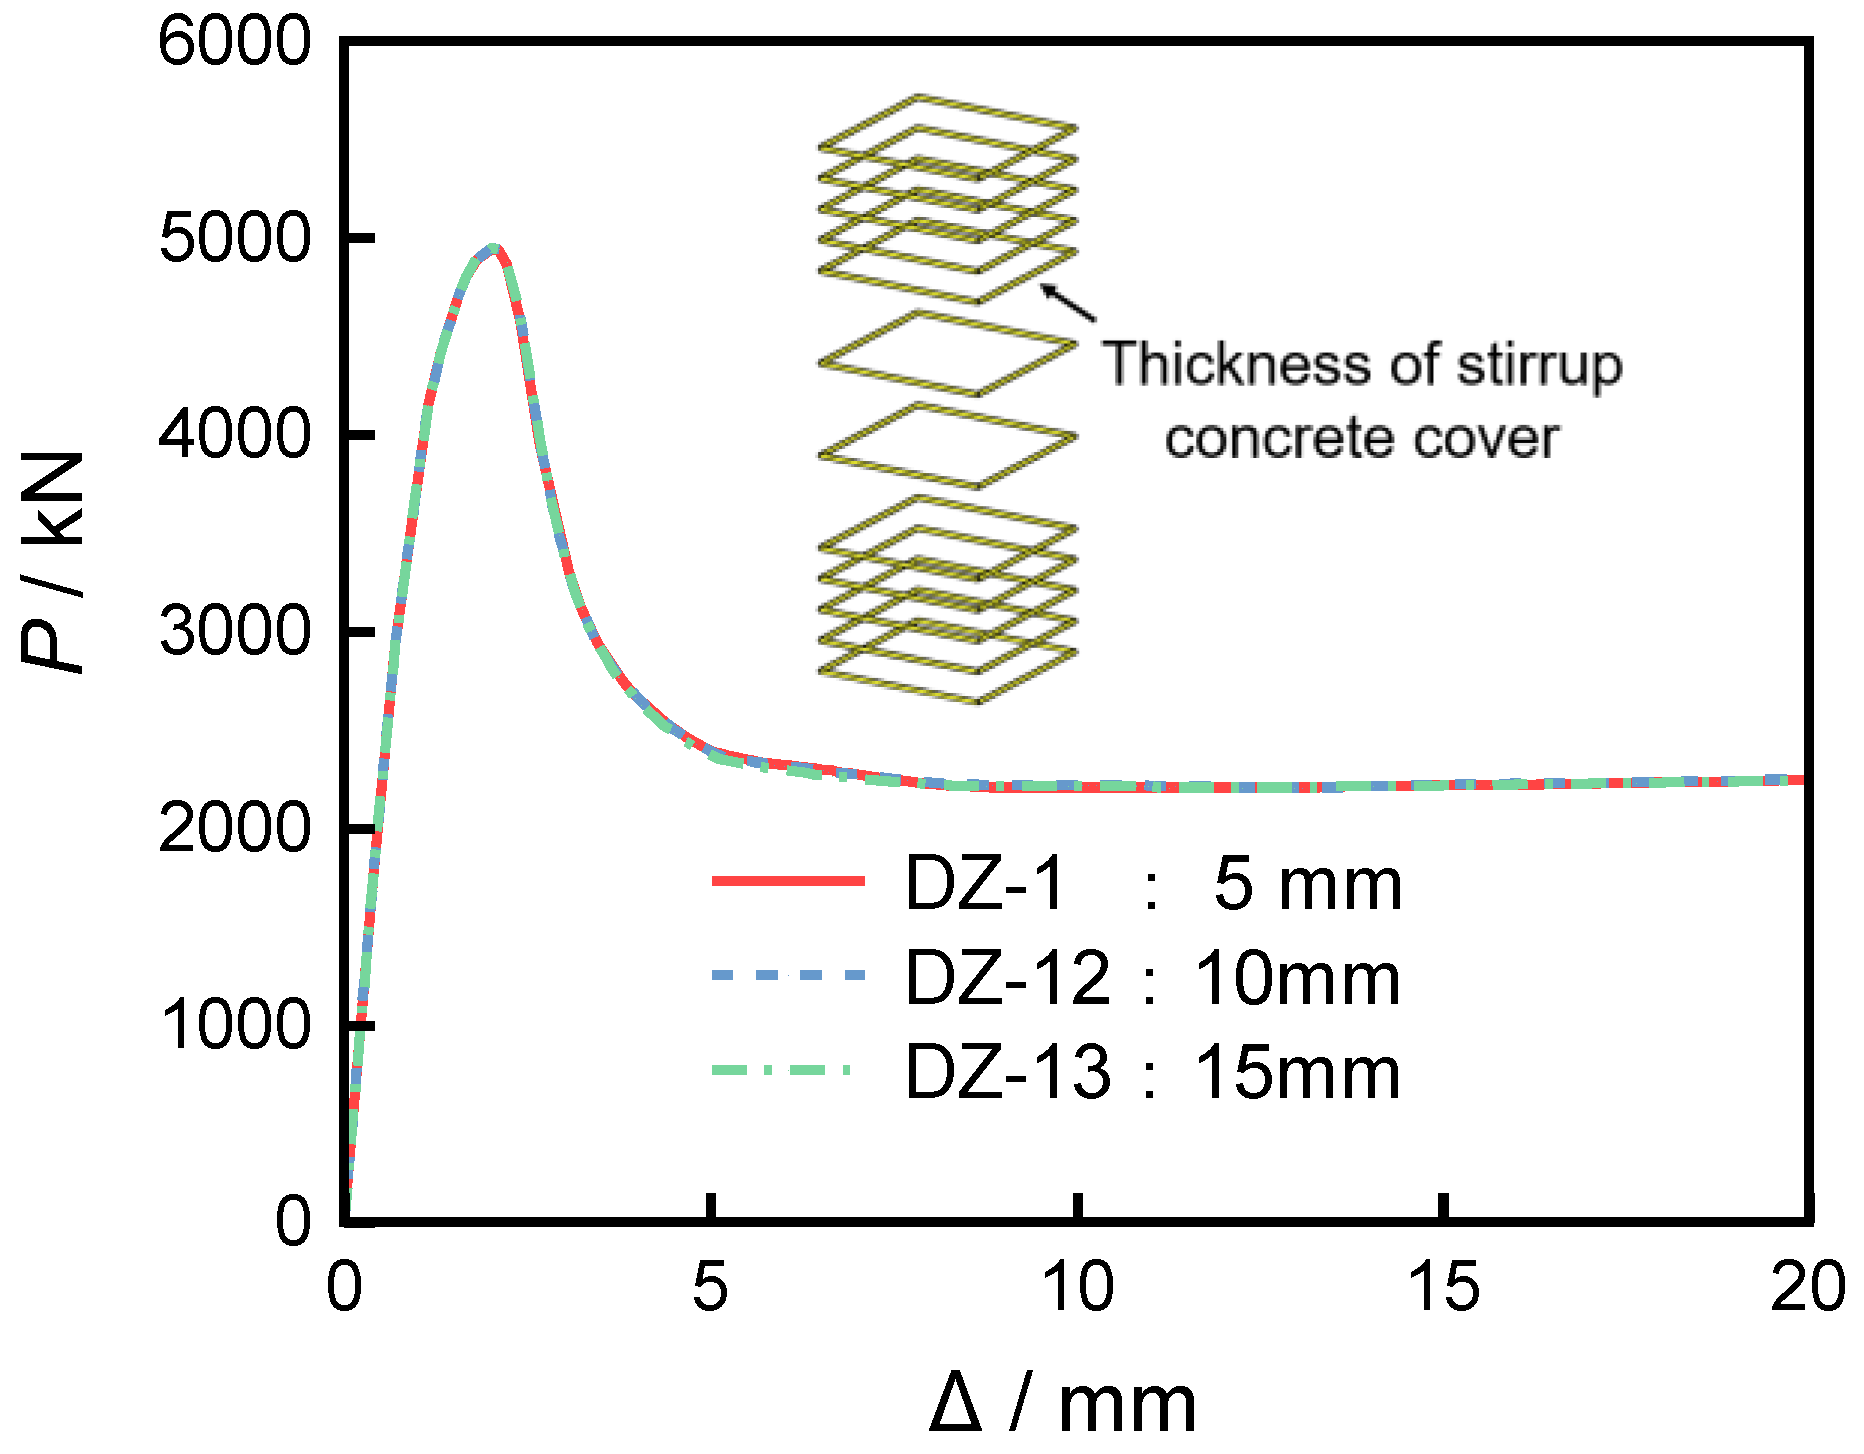
Three groups of specimens, DZ-1, DZ-12, and DZ-13, were used to investigate the effect of stirrup protective layer thickness on the axial load–displacement curve. As shown in Figure 30, when the stirrup protective layer thickness increases from 5 mm to 10 mm and 15 mm, the ultimate load decreases by 5.44% and 5.26%, respectively, compared with DZ-1. This indicates that the closer the stirrups are to the edge of the UHPC formwork, the more significant the confinement effect, resulting in a stronger restraining action.

4.3. Destructive Mode

Using specimen DZ-1 as an example, the loading process of UHPC-SRC short columns mainly includes three stages: the elastic stage without cracking, the elastoplastic stage during which the H-shaped steel yields and the short column cracks until reaching the ultimate load, and the failure stage after the ultimate load.
During the elastic stage, all materials within the cross-section of the short column are uniformly compressed and deform together. At this time, the axial load–displacement curve exhibits linear growth, and no cracks appear on the surface of the short column.
As the loading displacement increases, the H-shaped steel gradually yields, and vertical microcracks initially appear in the middle of the upper and lower ends of the short column. Subsequently, the structure enters the elastoplastic stage, during which the cracks extend and develop toward the middle, and new microcracks continuously emerge.
When the loading reaches the ultimate load, both the longitudinal reinforcement and the H-shaped steel have yielded, and an “X”-shaped crack appears in both the upper and lower parts of the middle section of the short column. At this point, the UHPC formwork and the cast-in-place NC layer both reach their ultimate compressive strain, resulting in crushing failure of the column body.
After failure, the concrete essentially withdraws from bearing the load, and the load-bearing capacity of the short column begins to decrease, with the rate of decline accelerating as displacement increases. During this stage, the load-bearing capacity of the H-shaped steel remains nearly unchanged, while the axial force taken by the longitudinal reinforcement gradually increases until the overall stress state of the short column stabilizes. At this point, the load borne by the short column is approximately 45% of the ultimate load.
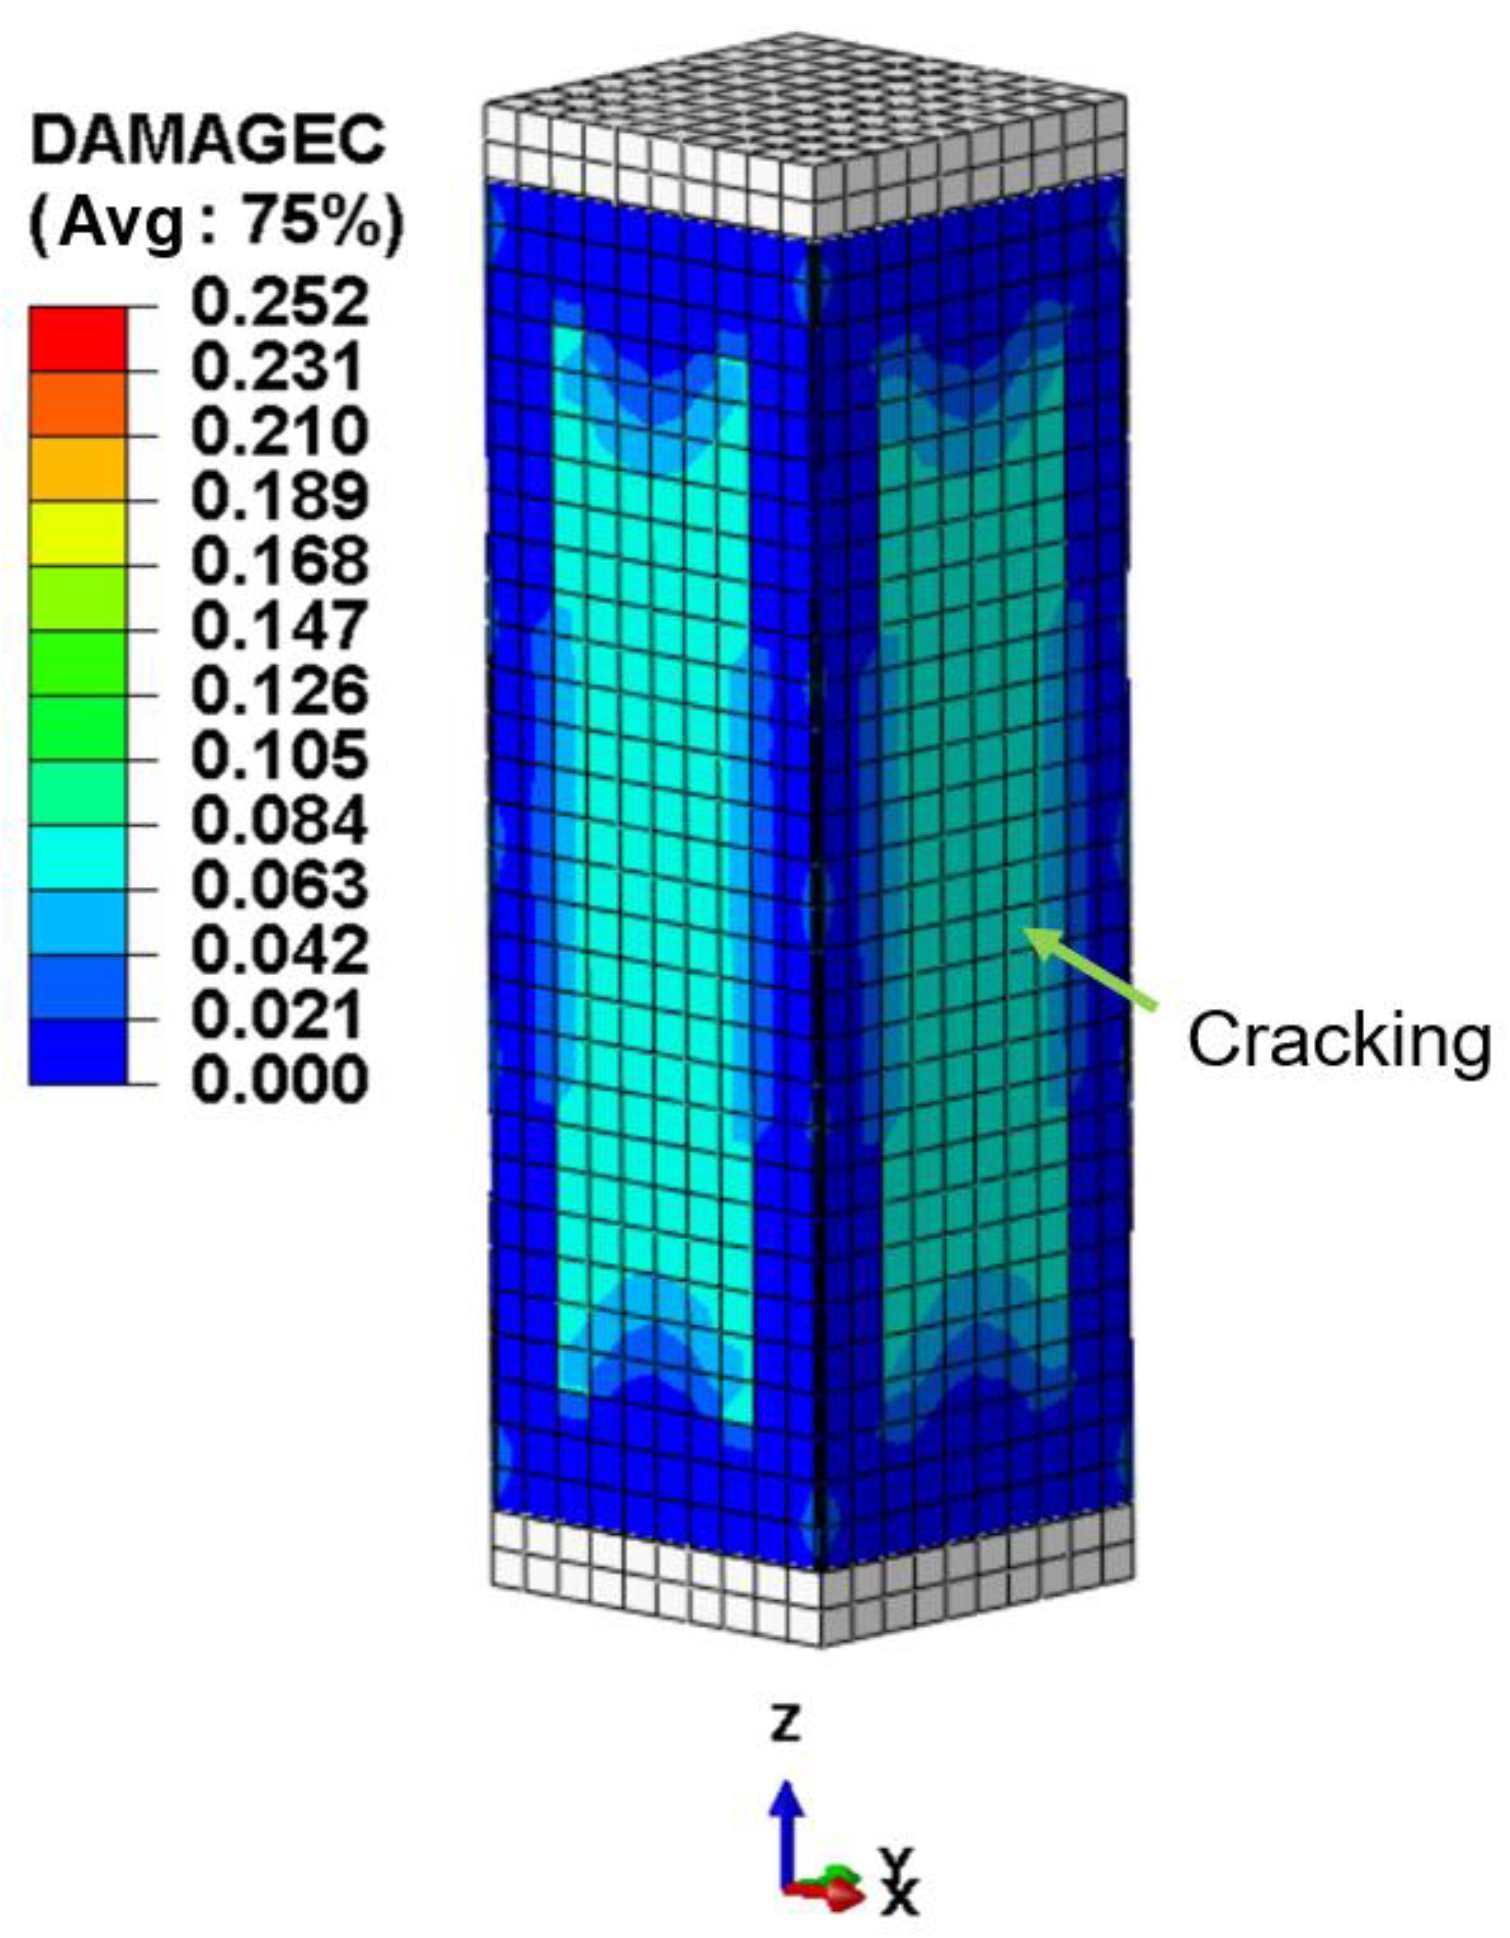
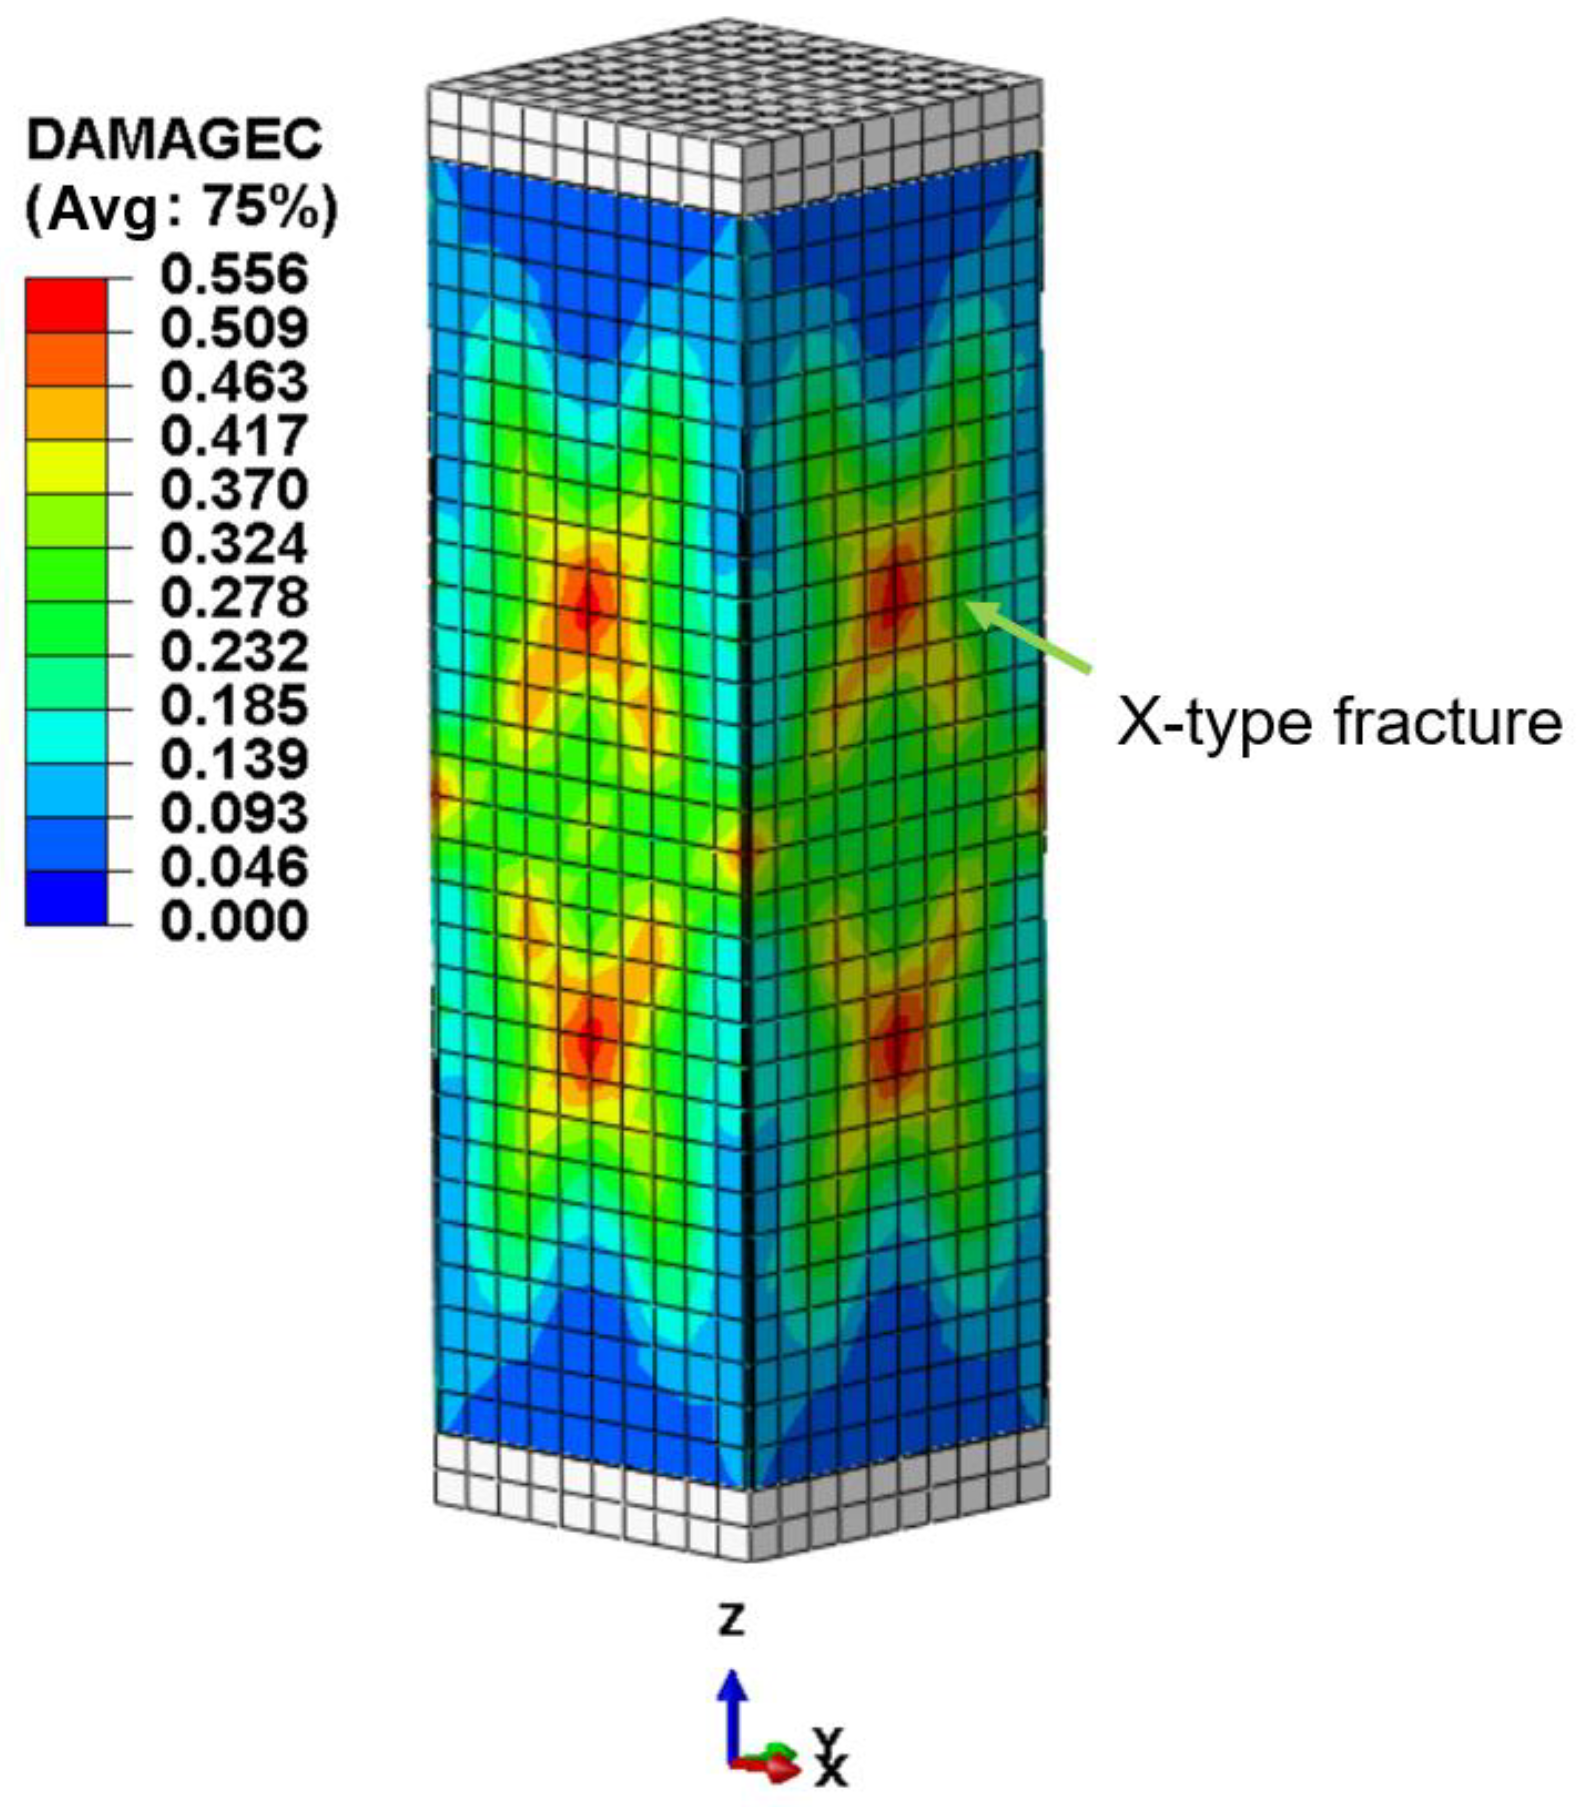
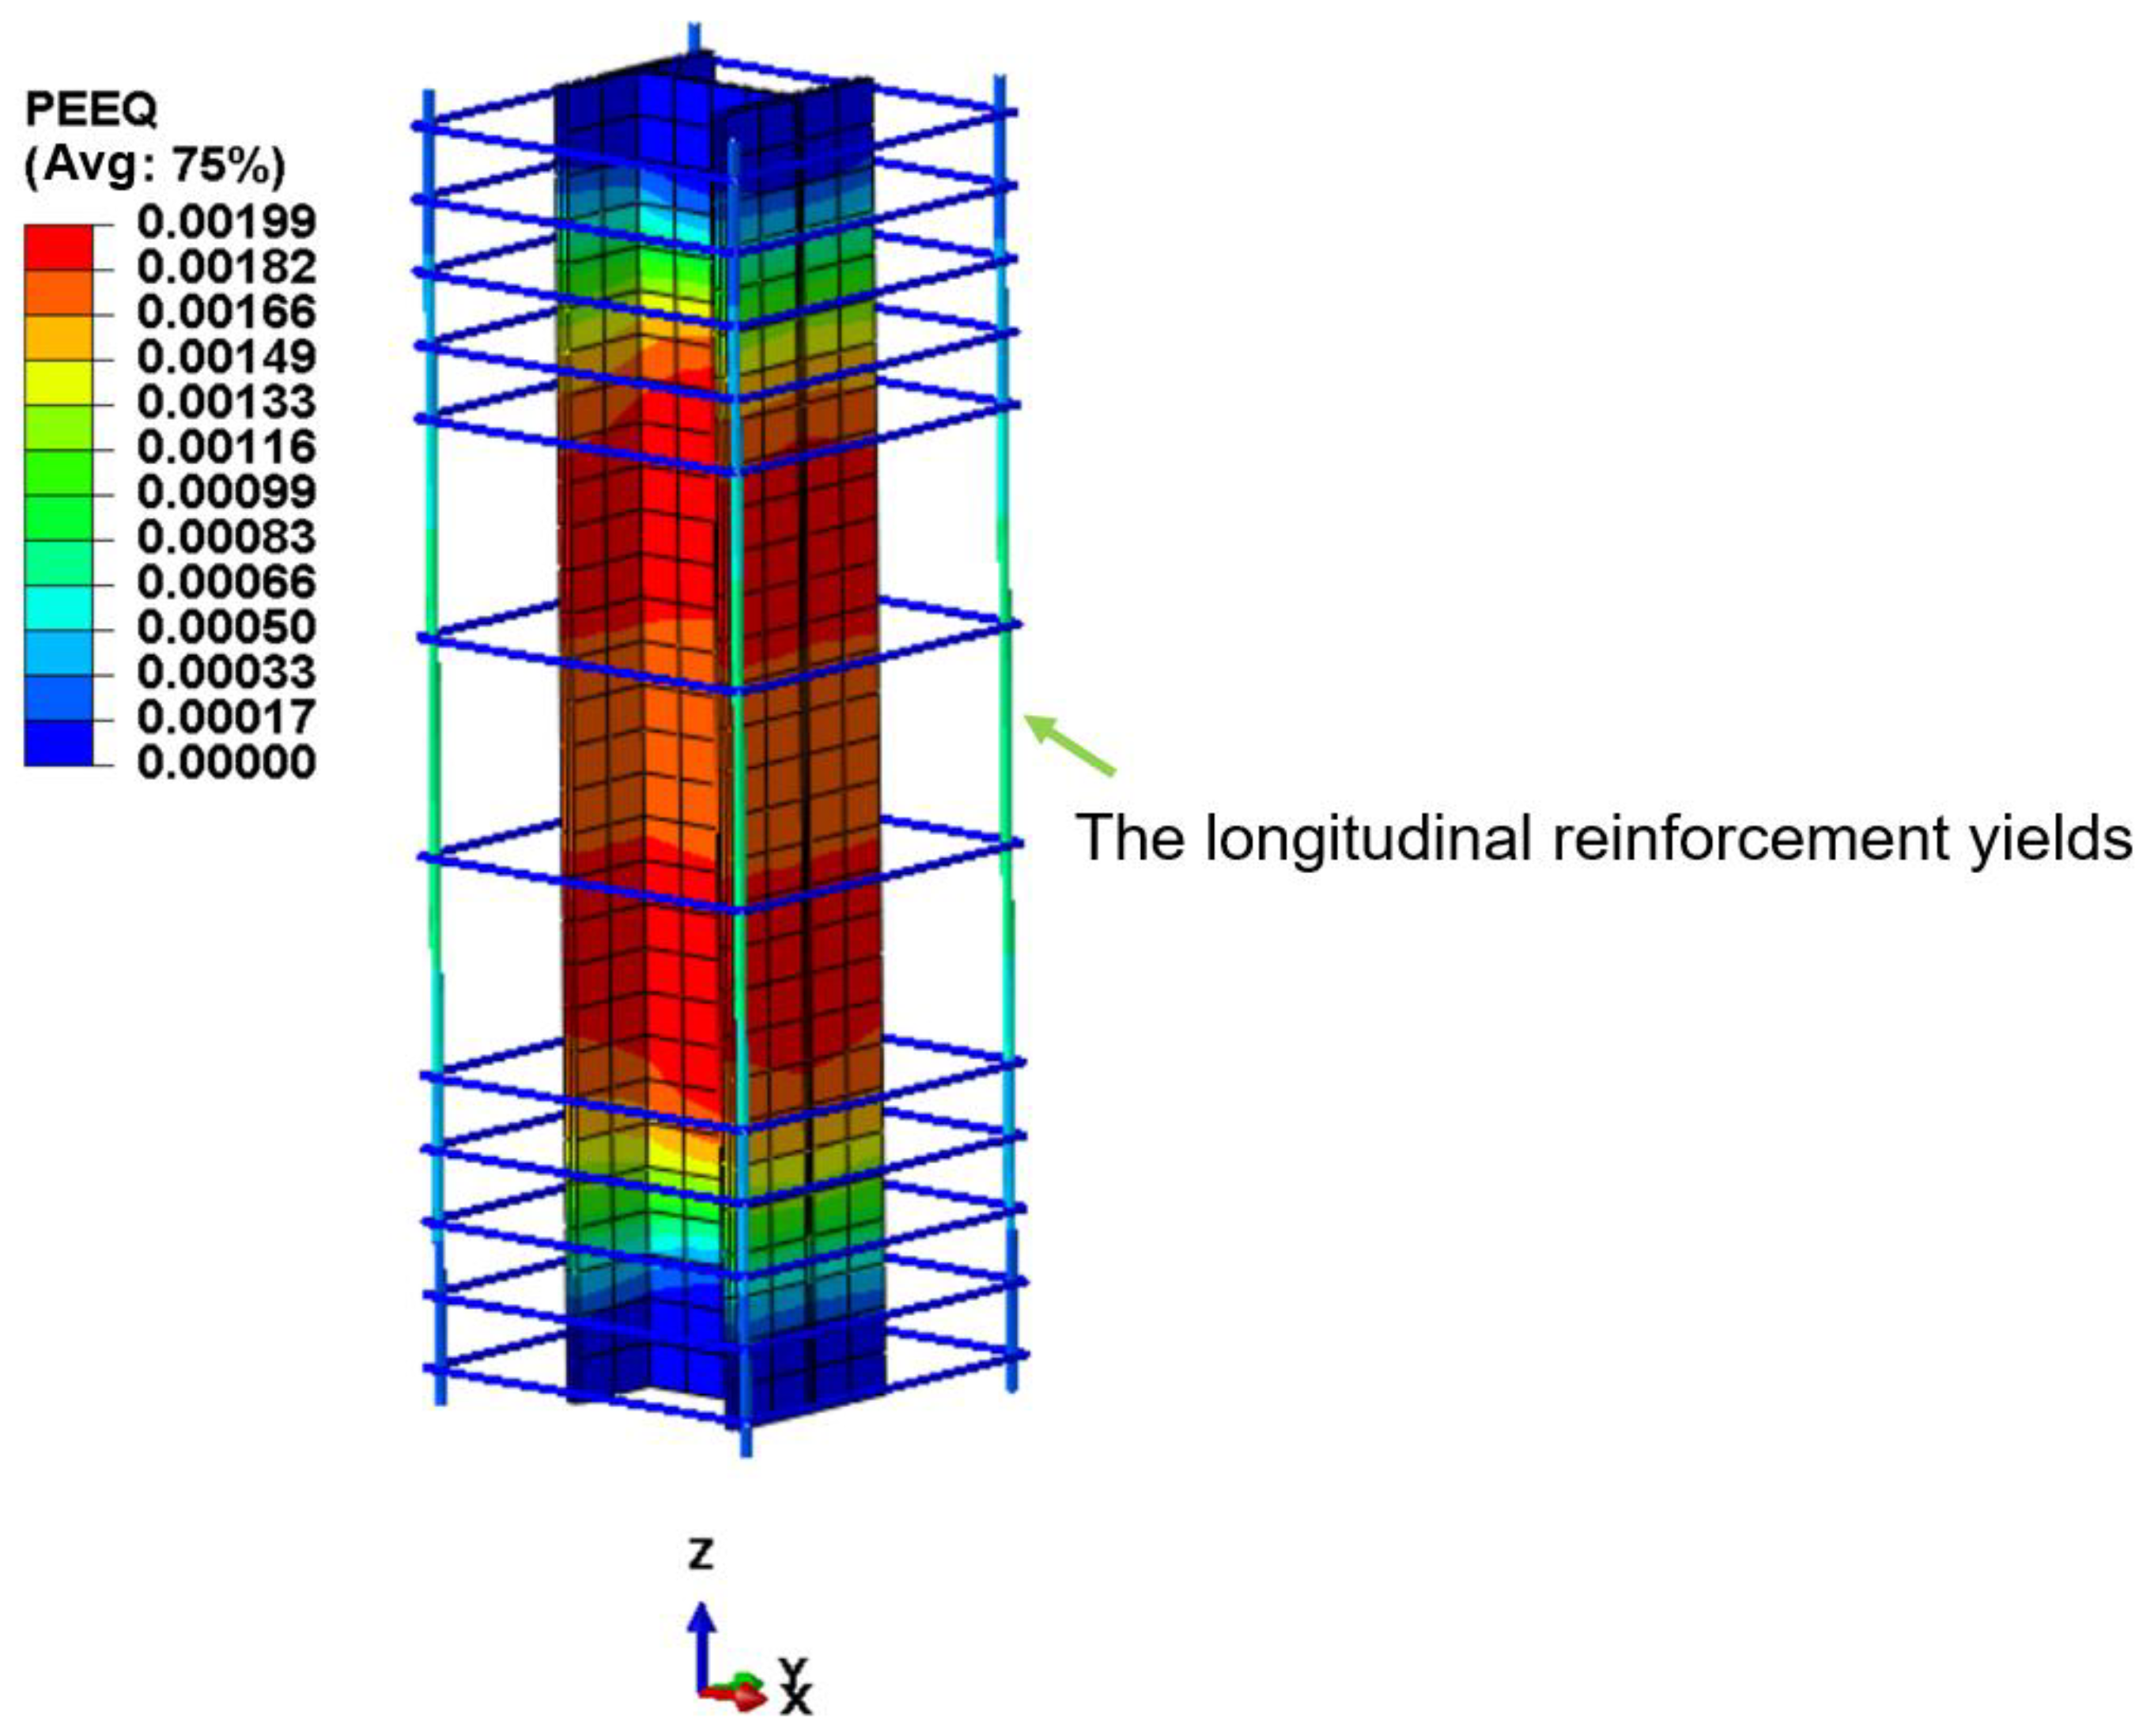
In the post-processing module of ABAQUS, the equivalent plastic strain (PEEQ) is an important indicator for evaluating the yielding state of reinforcement. When the PEEQ value exceeds zero, it indicates that the material has entered the stage of irreversible plastic deformation. By monitoring changes in PEEQ, it is possible to accurately determine whether the reinforcement has reached its yield point. The DAMAGEC variable is also a critical parameter, used to represent the compressive damage of materials. When the DAMAGEC value exceeds zero, it indicates that cracking has begun to occur in the concrete.
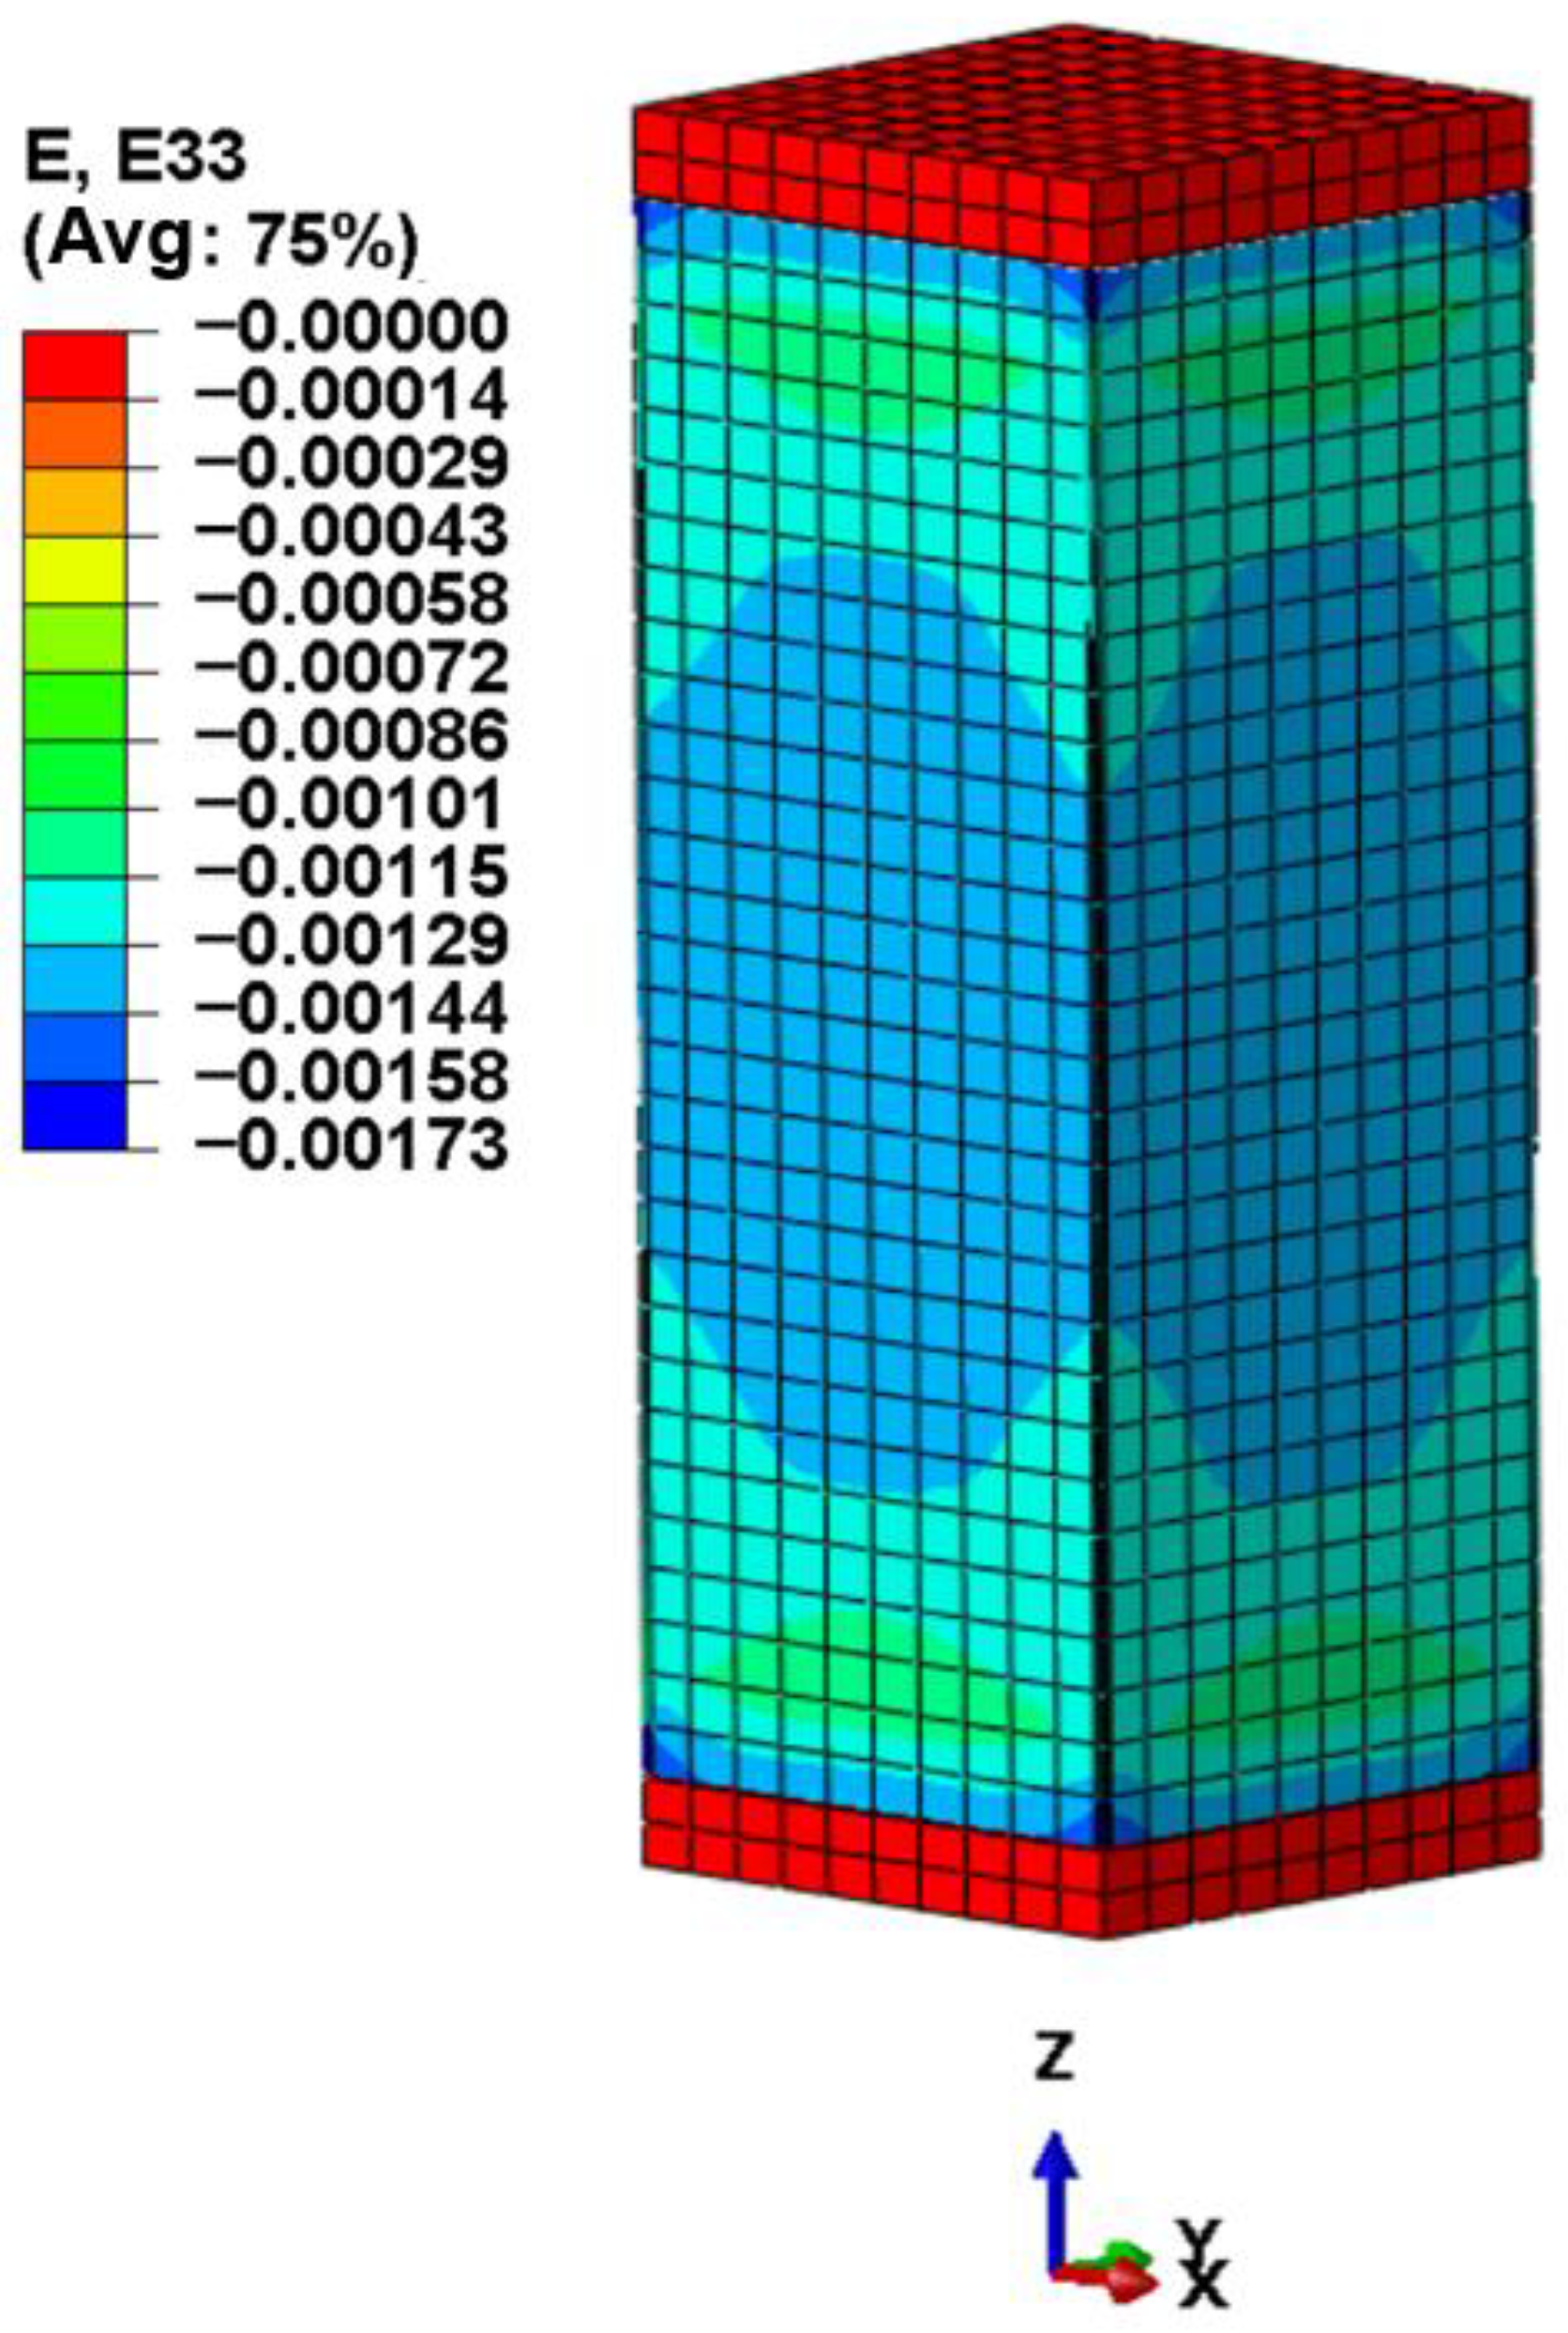
When the load increases to 4148.27 kN, the H-shaped steel yields, while the longitudinal reinforcement and stirrups have not yet yielded. At this stage, vertical microcracks appear in the middle of the upper and lower ends of the short column, as shown in Figure 31 and Figure 32. Meanwhile, the strains in both the UHPC and NC have not exceeded their ultimate compressive strains, and structural failure has not yet occurred, as shown in Figure 33.
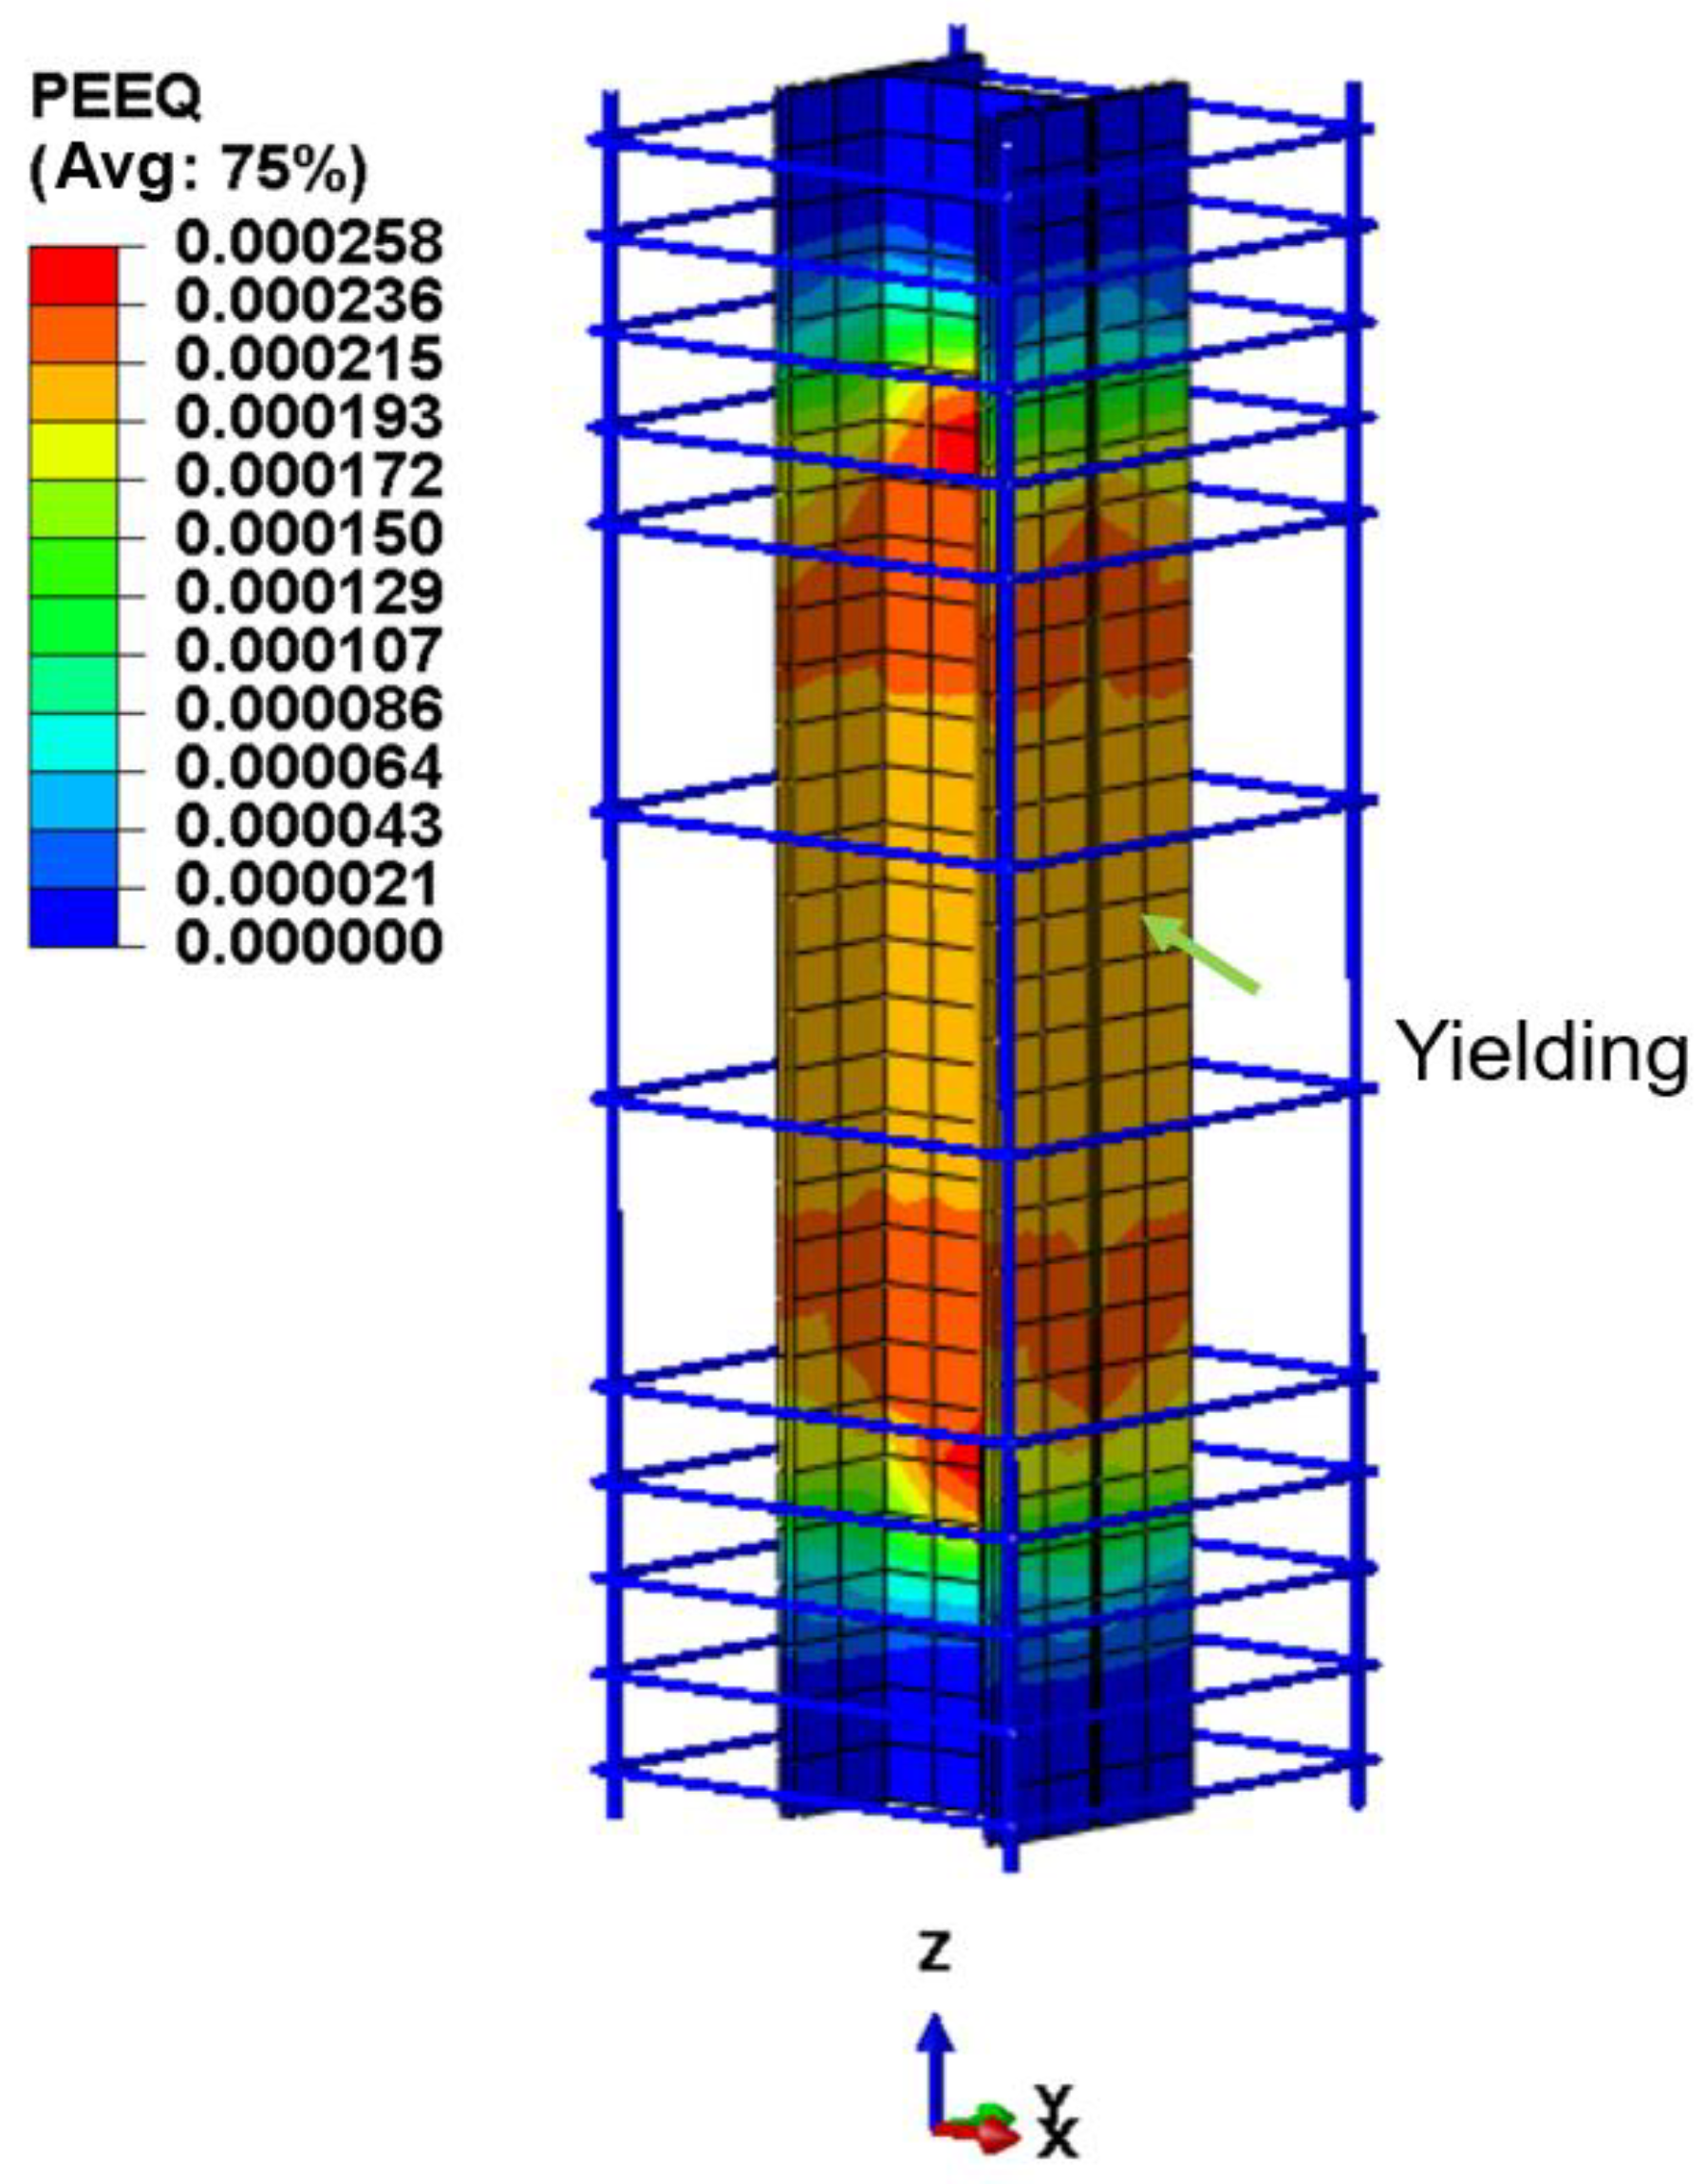
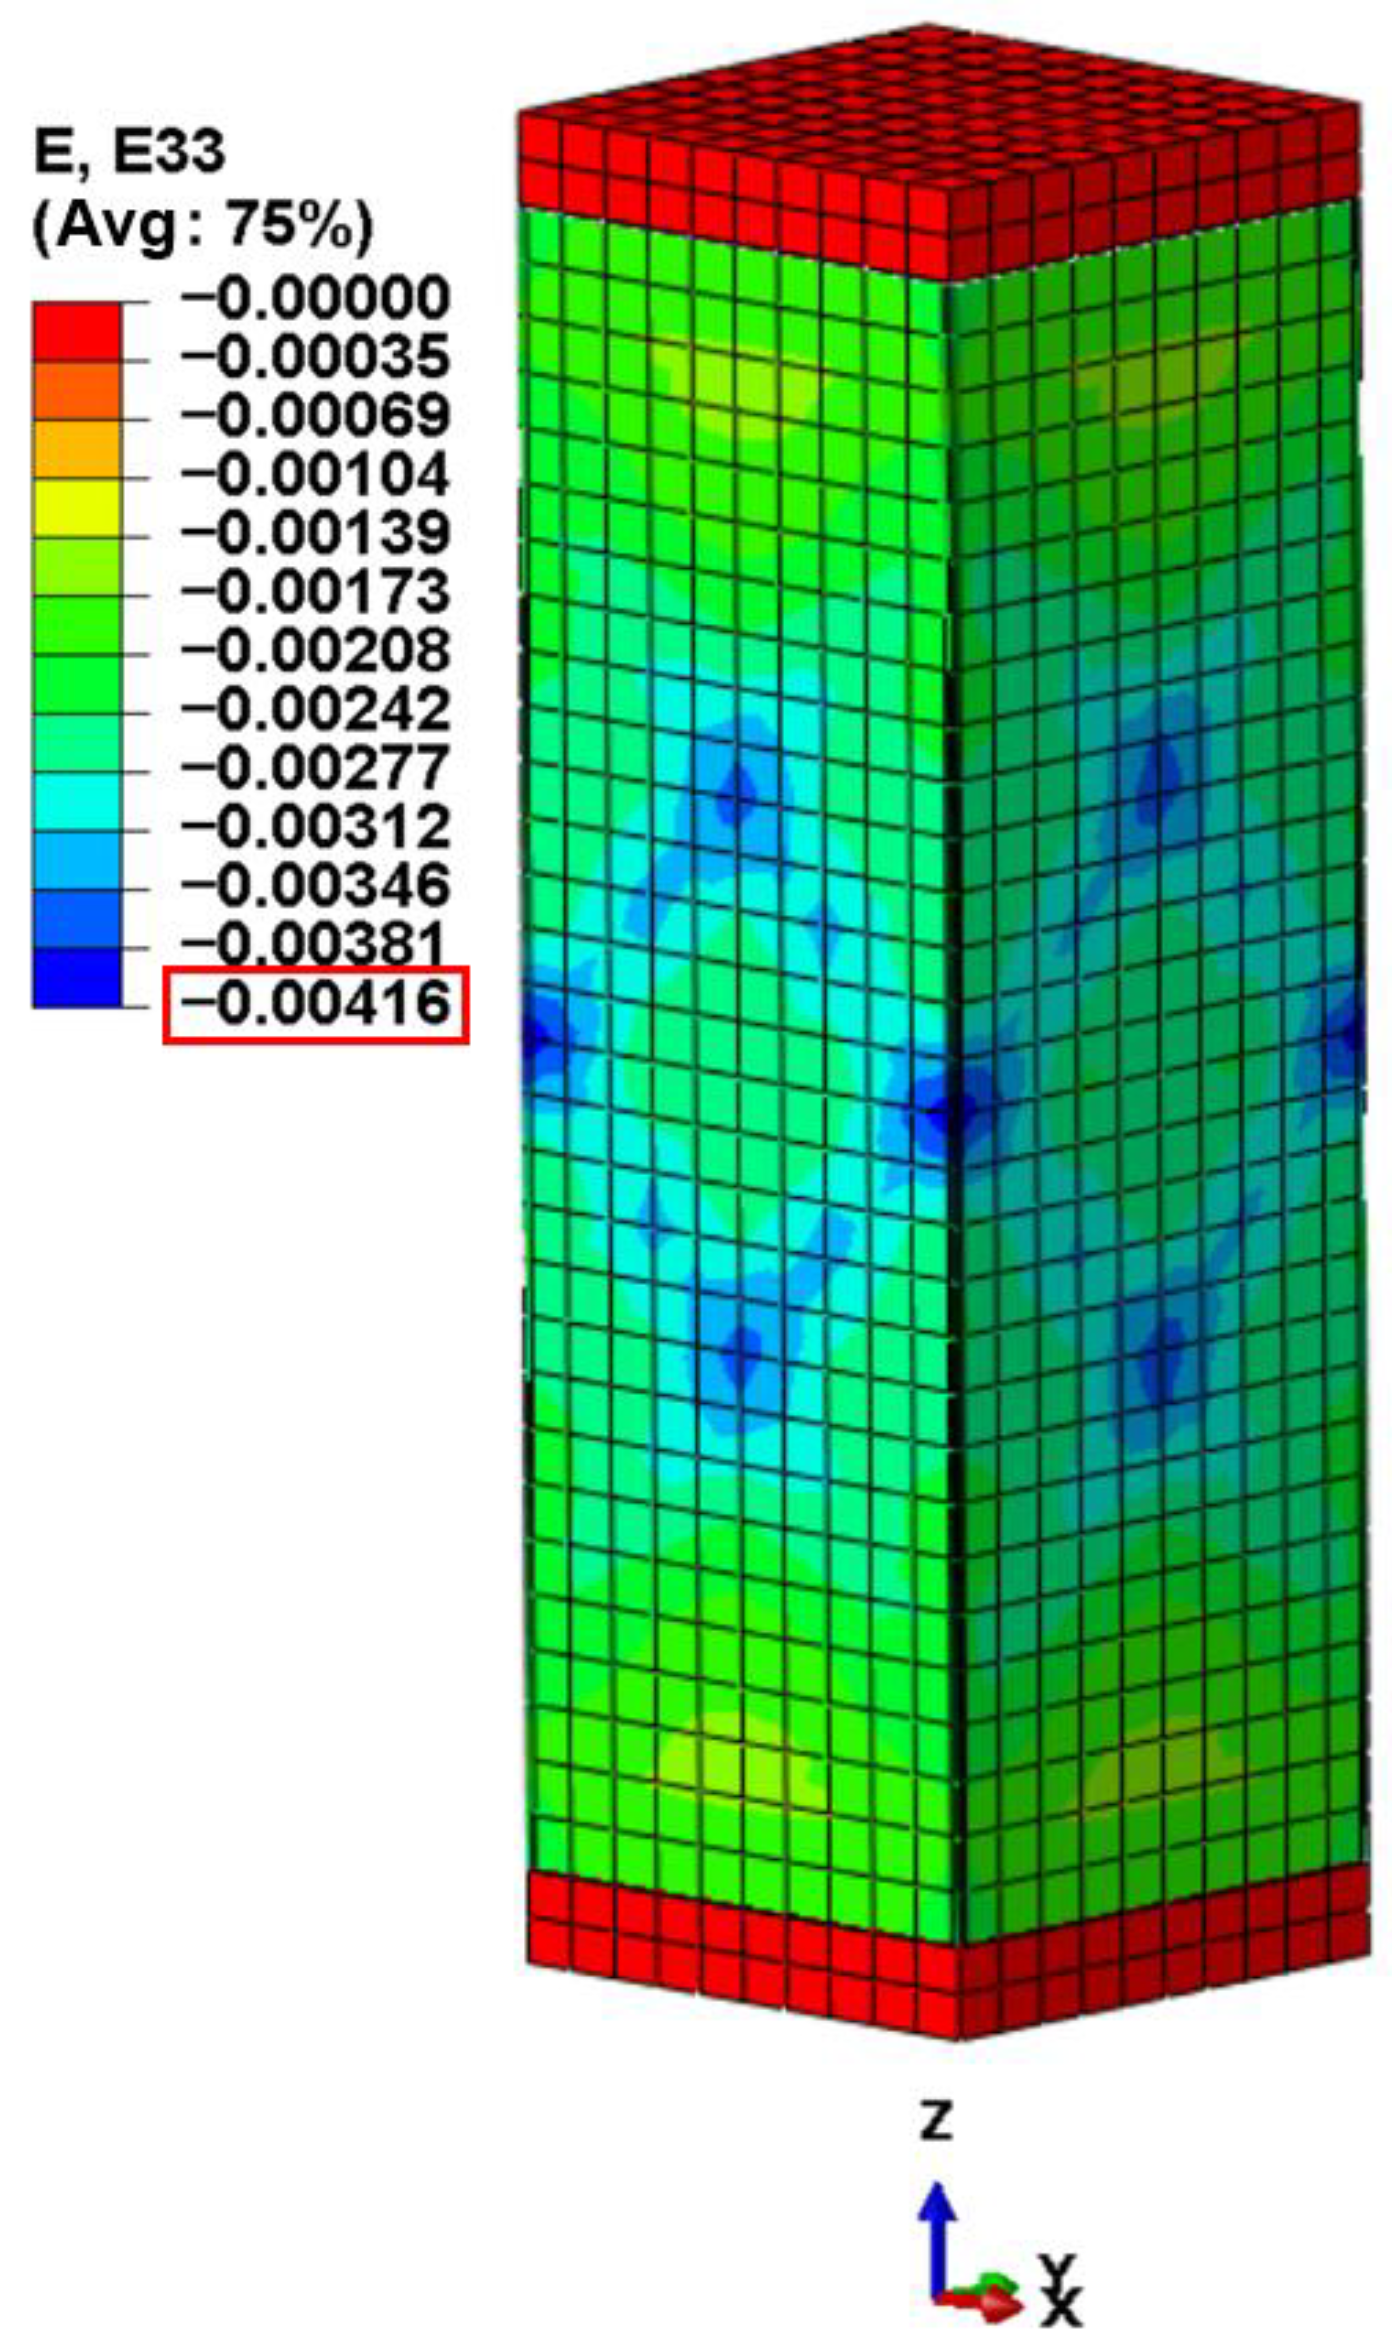
When the load increased to 4864.79 kN, an “X”-shaped crack appeared both above and below the middle of the short column, as shown in Figure 34. At this time, the longitudinal reinforcement yielded in the central region, but the stirrups had not yet yielded, as shown in Figure 35. From the strain cloud diagram along the long side of the specimen, it can be observed that the strains in both the UHPC and NC have exceeded their ultimate compressive strain values, as shown in Figure 36. The ultimate compressive strain of NC is 0.0033, and that of UHPC with a strength grade of 120 is 0.0041; therefore, the concrete experienced crushing failure.
Using UHPC as a permanent formwork can simultaneously fulfill structural functions and improve construction efficiency, thereby reducing the need for installation and removal of temporary formwork. Although UHPC has a relatively high material cost, its exceptional mechanical properties may enable a reduction in cross-sectional dimensions or a decrease in structural self-weight, thereby lowering overall construction costs and accelerating project schedules; these advantages are particularly pronounced in prefabricated building systems. UHPC–SRC columns possess high load-bearing capacity, controllable failure modes, and residual strength after peak loading, making them suitable for high-rise buildings with stringent requirements for both vertical and lateral loads. The H-shaped steel core provides stability, while the confinement effect of UHPC further enhances seismic performance, which is especially beneficial for designs in seismic regions or for high-rise buildings requiring improved ductility.

5. Calculation of the Compressive Bearing Capacity of Rectangular Sections

5.1. Basic Assumptions

The calculation of compressive bearing capacity of a normal section is based on the following assumptions: (1) The plane section assumption, i.e., from the onset of loading to specimen failure, the strain at all points along the section height of the column is distributed linearly across the section. (2) The bonding slip between the reinforcement, H-shaped steel, and concrete is neglected. (3) The confinement effects of the reinforcement cage and H-shaped steel on the concrete are not considered. (4) The influence of specimen torsion on the axial compressive bearing capacity is ignored.

5.2. Axial Compression Bearing Capacity Calculation Formula for Rectangular Sections

The calculation method for the axial compressive bearing capacity of UHPC-SRC short columns with normal sections adopts the superposition approach. Specifically, the axial forces borne separately by the longitudinal reinforcement, H-shaped steel, UHPC, and NC are summed to obtain the ultimate axial compressive capacity of the UHPC-SRC short column. At the moment of failure, the strain at each point on the failure section of the UHPC-SRC short column is identical, and all have reached the ultimate compressive strain of the UHPC-SRC short column.
The formula for calculating the compressive bearing capacity of UHPC-SRC short columns under axial load is given in Equation (11):
N u = f Uc A Uc + f c A c + f y A s + f ss A ss
In the formula, Nu represents the compressive bearing capacity of the UHPC-SRC short column; fUc is the prism compressive strength of UHPC; AUc is the net cross-sectional area of UHPC (excluding the cross-sectional area of the longitudinal reinforcement); fc is the prism compressive strength of NC; Ac is the net cross-sectional area of NC (excluding the cross-sectional area of the structural steel); fy is the yield strength of the longitudinal reinforcement; Ay is the cross-sectional area of the longitudinal reinforcement; fss is the yield strength of the structural steel; Ass is the cross-sectional area of the structural steel.

5.3. Comparison of Calculation Results

This paper presents a comparative analysis of the numerical simulation and theoretical calculation results for 13 groups of UHPC-SRC short column specimens, with detailed data shown in Table 7. The theoretical axial compressive bearing capacity Nup was calculated using Equation (11), and the simulated value NuFE was obtained via the finite element method. By calculating the ratio t = NuFE/Nup, the results show an average value of 1.008, a standard deviation of 0.0268, and a coefficient of variation of 0.0266. The findings indicate a high degree of consistency between the simulated and theoretical values, with minimal data fluctuation and low dispersion, demonstrating high reliability. Therefore, the formula for calculating the axial compressive bearing capacity of UHPC-SRC short columns proposed in this paper is considered reasonable.

6. Conclusions

In this chapter, finite element models were established for three types of short columns: UHPC formwork–concrete-filled steel tube composite columns, high-strength steel–UHPC short columns, and UHPC fully encased S690 high-strength steel short columns. By comparing the axial load–displacement curves obtained from numerical simulations with experimental results, the accuracy of the models was verified, and relevant analyses were conducted. On this basis, 13 groups of finite element simulations were carried out for UHPC-SRC short columns to investigate the effects of factors such as longitudinal reinforcement diameter, longitudinal reinforcement strength, non-removable formwork thickness, non-removable formwork strength grade, steel strength, and stirrup protective layer thickness on the axial compressive performance. Finally, a calculation formula for the axial compressive bearing capacity of normal sections was proposed to predict the axial compressive bearing capacity of UHPC-SRC short columns under central loading. Based on the numerical and formula calculation results, the following conclusions were drawn:
  • Based on the ABAQUS finite element software, three short column models were established, and the simulated axial load–displacement curves were compared with experimental data. The results show that the finite element simulations are in close agreement with the experimental data, confirming the accuracy and reliability of the simulation method.
  • Whether increasing the reinforcement ratio or enhancing the strength of the reinforcement, the improvement in ultimate load is quite limited (both less than 2%), indicating that both factors have a limited effect on enhancing the load-bearing performance of short columns.
  • Increasing the thickness of the UHPC permanent formwork or enhancing its strength grade can significantly improve the ultimate load (the ultimate load increases by more than 23% at maximum when the formwork thickness is increased, and up to 17% when the formwork strength is enhanced), with the effect of increasing formwork thickness being more pronounced. However, an increase in formwork strength leads to a slight reduction in ultimate displacement. Similarly, increasing the strength of the steel section can also enhance the ultimate bearing capacity by approximately 8%, though the effect is slightly less pronounced compared to improvements in the parameters of the permanent formwork.
  • Increasing the thickness of the stirrup protective layer leads to a decrease in ultimate load (by approximately 5%), indicating that the closer the stirrups are to the edge of the UHPC formwork, the stronger the confinement effect on the short column and the better its load-bearing performance.
  • This paper proposes a calculation formula for the axial compressive bearing capacity of UHPC-SRC short columns. The results obtained using this formula are highly consistent with those from finite element analysis, thereby providing strong theoretical support for the design of related structural components.

Author Contributions

Conceptualization, K.W.; methodology, K.W.; software, R.W.; validation, R.W.; formal analysis, R.W. and X.W.; investigation, R.W.; resources, X.W.; data curation, R.W. and X.W.; writing—original draft preparation, R.W.; writing—review and editing, K.W.; visualization, R.W.; supervision, X.W.; project administration, X.W.; funding acquisition, K.W. All authors have read and agreed to the published version of the manuscript.

Funding

The authors gratefully acknowledge the support provided by the Yangzhou University graduate research and practice innovation program (KYCX23-3541), the Science and Technology Planning Project of Yangzhou City (YZ2024223), and the Open Fund of Key Lab of Structures Dynamic Behavior and Control of the Ministry of Education by the Harbin Institute of Technology (HITCE202105).

Data Availability Statement

The original contributions presented in this study are included in the article. Further inquiries can be directed to the corresponding authors.

Conflicts of Interest

Author Ruochen Wang was employed by the company Jiangsu Testing Center for Quality of Construction Engineering Co., Ltd. The remaining authors declare that the research was conducted in the absence of any commercial or financial relationships that could be construed as a potential conflict of interest.

Nomenclature

The article involves symbols in equations.
NumberSymbol NameSymbol Explanation
1σUcCompressive Stress of UHPC Prism
2σUtTensile Stress of UHPC Prism
3fUcCompressive Strength of UHPC Prism
4fUtTensile Strength of UHPC Prism
5εUcCompressive Strain of UHPC Prism
6εUtTensile Strain of UHPC Prism
7εUc0Peak Compressive Strain of UHPC Prism
8εUt0Peak Tensile Strain of UHPC Prism
9fUcuCompressive Strength of a UHPC Cube with a Side Length of 100 mm
10σcCompressive Stress of Ordinary Concrete Prism
11σtTensile Stress of Ordinary Concrete Prism
12fcCompressive Strength of Ordinary Concrete Prism
13ftTensile Strength of Ordinary Concrete Prism
14εcCompressive Strain of Ordinary Concrete Prism
15εtTensile Strain of Ordinary Concrete Prism
16ε0Peak Compressive Strain of Ordinary Concrete Prism
17εt0Peak Tensile Strain of Ordinary Concrete Prism
18αCoefficient of the Ascending Branch of the Uniaxial Compression Curve
19βCoefficient of the Descending Branch of the Uniaxial Compression Curve
20γCoefficient of the Descending Branch of the Uniaxial Tension Curve
21σsReinforcement Stress
22EsElastic Modulus of Reinforcement
23εsReinforcement Strain
24fyTensile Yield Strength of Reinforcement
25fyCompressive Yield Strength of Reinforcement
26εyTensile Yield Strain of Reinforcement
27εyCompressive Yield Strain of Reinforcement
28AUcNet Cross-Sectional Area of UHPC (excluding the cross-sectional area of longitudinal reinforcement)
29AcNet Cross-Sectional Area of NC (excluding the cross-sectional area of structural steel)
30AyCross-Sectional Area of Longitudinal Reinforcement
31fssCompressive Yield Strength of Structural Steel
32AssCross-Sectional Area of Structural Steel

References

  1. Breccolotti, M.; Gentile, S.; Tommasini, M.; Materazzi, A.L.; Bonfigli, M.F.; Pasqualini, B.; Colone, V.; Gianesini, M. Beam-Column Joints in Continuous RC Frames: Comparison between Cast-in-Situ and Precast Solutions. Eng. Struct. 2016, 127, 129–144. [Google Scholar] [CrossRef]
  2. Chen, H.; Yang, C.; Ou, J.; Zhao, B.; Li, C.; Li, C. Experimental Study on Seismic Performance of Modular Cast-in-Situ Coupled Shear Wall with LRC Infill Wall. J. Build. Eng. 2023, 72, 106613. [Google Scholar] [CrossRef]
  3. Manoj Philip, A.; Ramesh Kannan, M. Constructability Assessment of Cast In-Situ, Precast and Modular Reinforced Concrete Structures. Mater. Today Proc. 2021, 45, 6011–6015. [Google Scholar] [CrossRef]
  4. Qiu, M.; Qian, Y.; Sun, Y.; Leung, C.K.Y. Flexural Performance of Concrete Beams via 3D Printing Stay-in-Place Formwork Followed by Casting of Normal Concrete. J. Sustain. Cem.-Based Mater. 2025, 14, 417–430. [Google Scholar] [CrossRef]
  5. Barak, R.; Jeong, Y.-S.; Sacks, R.; Eastman, C.M. Unique Requirements of Building Information Modeling for Cast-in-Place Reinforced Concrete. J. Comput. Civ. Eng. 2009, 23, 64–74. [Google Scholar] [CrossRef]
  6. Shi, F.-W.; Sun, C.-H.; Liu, X.-G.; Wang, H.; Zong, L. Flexural Behavior of Prefabricated Composite Beam with Cast-in-Situ UHPC: Experimental and Numerical Studies. Structures 2022, 45, 670–684. [Google Scholar] [CrossRef]
  7. Devènes, J.; Brütting, J.; Küpfer, C.; Bastien-Masse, M.; Fivet, C. Re:Crete—Reuse of Concrete Blocks from Cast-in-Place Building to Arch Footbridge. Structures 2022, 43, 1854–1867. [Google Scholar] [CrossRef]
  8. Burger, J.; Lloret-Fritschi, E.; Scotto, F.; Demoulin, T.; Gebhard, L.; Mata-Falcón, J.; Gramazio, F.; Kohler, M.; Flatt, R.J. Eggshell: Ultra-Thin Three-Dimensional Printed Formwork for Concrete Structures. 3D Print. Addit. Manuf. 2020, 7, 48–59. [Google Scholar] [CrossRef]
  9. Neudecker, S.; Bruns, C.; Gerbers, R.; Heyn, J.; Dietrich, F.; Dröder, K.; Raatz, A.; Kloft, H. A New Robotic Spray Technology for Generative Manufacturing of Complex Concrete Structures without Formwork. Procedia CIRP 2016, 43, 333–338. [Google Scholar] [CrossRef]
  10. Wang, Q.; Wang, T.; Yu, L.; Tian, J. Experimental Study of Cast-in-Situ Concrete Composite Beam with Wire Mesh Permanent Formwork. In Proceedings of the 2011 International Conference on Multimedia Technology, Hangzhou, China, 26–28 July 2011; pp. 4425–4428. [Google Scholar]
  11. Wang, P.; Huang, J.; Tao, Y.; Shi, Q.; Rong, C. Seismic Performance of Reinforced Concrete Columns with an Assembled UHPC Stay-in-Place Formwork. Eng. Struct. 2022, 272, 115003. [Google Scholar] [CrossRef]
  12. Weng, K.-F.; Zhu, J.-X.; Huang, B.-T.; Dai, J.-G.; Chen, J.-F. Interfacial Shear Behavior between Prefabricated Strain-Hardening Ultra-High-Performance Concrete (SH-UHPC) and Cast-in-Place Concrete. Eng. Struct. 2025, 325, 119405. [Google Scholar] [CrossRef]
  13. Li, S.; Yin, S.; Wang, C.; Yang, Y. Research on the Bonding Performance of TRC Permanent Formwork and Cast-in-Place Concrete. Eng. Struct. 2021, 235, 112021. [Google Scholar] [CrossRef]
  14. Han, Y.; Yang, Z.; Ding, T.; Xiao, J. Environmental and Economic Assessment on 3D Printed Buildings with Recycled Concrete. J. Clean. Prod. 2021, 278, 123884. [Google Scholar] [CrossRef]
  15. Li, S.; Wang, J.; Yu, Z.; Li, Y.; Guo, H. Study on the Bearing Capacity of Steel Formwork Concrete Columns. Buildings 2023, 13, 820. [Google Scholar] [CrossRef]
  16. Tian, H.; Zhou, Z.; Zhang, Y.; Wei, Y. Axial Behavior of Reinforced Concrete Column with Ultra-High Performance Concrete Stay-in-Place Formwork. Eng. Struct. 2020, 210, 110403. [Google Scholar] [CrossRef]
  17. Han, L.-H.; Tan, Q.-H.; Song, T.-Y. Fire Performance of Steel Reinforced Concrete Columns. J. Struct. Eng. 2015, 141, 4014128. [Google Scholar] [CrossRef]
  18. Mostafa, M.M.A.; Wu, T.; Liu, X.; Fu, B. The Composite Steel Reinforced Concrete Column under Axial and Seismic Loads: A Review. Int. J. Steel Struct. 2019, 19, 1969–1987. [Google Scholar] [CrossRef]
  19. Motter, C.J.; Fields, D.C.; Hooper, J.D.; Klemencic, R.; Wallace, J.W. Steel-Reinforced Concrete Coupling Beams. I: Testing. J. Struct. Eng. 2017, 143, 4016191. [Google Scholar] [CrossRef]
  20. Hall, J.E.; Mottram, J.T. Combined FRP Reinforcement and Permanent Formwork for Concrete Members. J. Compos. Constr. 1998, 2, 78–86. [Google Scholar] [CrossRef]
  21. Wu, W.; Cui, Q.; Yang, X. A New Attempt Using Steel Wire Mesh Concrete Formwork as Permanent Formwork. Build. Technol. Dev. 1999, 26, 27–29, 18. [Google Scholar]
  22. Lubliner, J.; Oliver, J.; Oller, S.; Onate, E. A Plastic-Damage Model for Concrete. Int. J. Solids Struct. 1989, 25, 299–326. [Google Scholar] [CrossRef]
  23. Lee, J.; Fenves, G.L. Plastic-Damage Model for Cyclic Loading of Concrete Structures. J. Eng. Mech. 1998, 124, 892–900. [Google Scholar] [CrossRef]
  24. Zhang, T. Evaluation and Application of Typical Material Models Used in FE Modelling Under Monotonic and Cyclic Loading Conditions. Ph.D. Thesis, Kunming University of Science & Technology, Kunming, China, 2020. [Google Scholar]
  25. Zheng, W.; Li, L.; Lu, S. Experimental Research on Mechanical Performance of Normal Section of Reinforced Reactive Powder Concrete Beam. J. Build. Struct. 2011, 32, 125–134. [Google Scholar] [CrossRef]
  26. Lv, X.; Wang, Y.; Fu, C.; Zheng, W. Basic Mechanical Property Indexes of Reactive Powder Concrete. J. Harbin Inst. Technol. 2014, 46, 1–9. [Google Scholar]
  27. Guo, Z. Strength and Deformation of Concrete: Experimental Basis and Constitutive Relationships; Tsinghua University Press: Beijing, China, 1997. [Google Scholar]
  28. Yu, T.; Teng, J.G.; Wong, Y.L.; Dong, S.L. Finite Element Modeling of Confined Concrete-II: Plastic-Damage Model. Eng. Struct. 2010, 32, 680–691. [Google Scholar] [CrossRef]
  29. Ren, Z.; Wang, D. Behavior of Round-Ended Concrete-Filled Steel Tube Stub Column with Different Central Angles under Axial Load. J. Archit. Civ. Eng. 2020, 37, 77–87. [Google Scholar]
  30. Deng, N.; Liu, X.; Zhao, H.; Deng, Y. Interfacial Adhesion and Optimization of Ultra-High-Performance Concrete-Filled Steel Tube Columns Containing Welded Rebar Rings. Structures 2025, 75, 108729. [Google Scholar] [CrossRef]
  31. Mirza, S.A.; Skrabek, B.W. Statistical Analysis of Slender Composite Beam-Column Strength. J. Struct. Eng. 1992, 118, 1312–1332. [Google Scholar] [CrossRef]
  32. Ren, Z.; Zhang, C.; Li, Q.; Li, P. Research on Axial Compressive Performance of UHPC Formwork—CFST Composite Short Column. J. Wuhan Univ. Technol. 2022, 44, 49–57. [Google Scholar]
  33. Liu, Z.; Zhou, Z.; Xue, J.; Mao, D. Experimental Study and Finite Element Analysis on Axial Compression Performance of High Strength Steel Reinforced Ultra-High Performance Concrete Short Column. Eng. Mech. 2024, 41, 211–227. [Google Scholar]
  34. Fan, G.; Wang, Y.; Li, Q.; Wang, D.; Yang, J. Study on Dynamic Behavior of Precast and Partial Steel Beam- Column Joint under Different Axial Compression Ratios. Concrete 2022, 8, 45–50. [Google Scholar]
  35. Wei, G.; Wang, Z.; Li, T. Analysis of Axial Compression of Ultra High Performance-Concrete Encased S690 High Strength Steel Short Column. J. Wuhan Univ. Technol. 2024, 46, 63–69. [Google Scholar]
Figure 1. Schematic diagram of the structure of the UHPC-SRC short column.
Buildings 15 03442 g001
Figure 2. Flowchart of UHPC-SRC short column fabrication.
Buildings 15 03442 g002
Figure 3. Uniaxial compressive stress–strain curve of UHPC.
Buildings 15 03442 g003
Figure 4. Uniaxial tensile stress–strain curve of UHPC.
Buildings 15 03442 g004
Figure 5. Tensile stress–strain relationship of the concrete plastic damage model.
Buildings 15 03442 g005
Figure 6. Compressive stress–strain relationship of the concrete plastic damage model.
Buildings 15 03442 g006
Figure 7. Yield surface under plane stress condition.
Buildings 15 03442 g007
Figure 8. Definition of CDP model parameters.
Buildings 15 03442 g008
Figure 9. Axial load–displacement curves for different friction coefficients.
Buildings 15 03442 g009
Figure 10. Axial load–displacement curves for different mesh sizes.
Buildings 15 03442 g010
Figure 11. Finite element model of UHPC-SRC short columns.
Buildings 15 03442 g011
Figure 12. Three-dimensional structural schematic diagram of specimen U-CFST-20-1-A.
Buildings 15 03442 g012
Figure 13. Schematic diagram of mesh division for specimen U-CFST-20-1-A.
Buildings 15 03442 g013
Figure 14. Section dimensions of specimen U-CFST-20-1-A (unit: mm).
Buildings 15 03442 g014
Figure 15. Axial load–displacement curve test values and simulation values of specimen U-CFST-20-1-A.
Buildings 15 03442 g015
Figure 16. Three-dimensional structural schematic diagram of specimen Z-1.
Buildings 15 03442 g016
Figure 17. Schematic diagram of mesh division for specimen Z-1.
Buildings 15 03442 g017
Figure 18. Section dimensions of specimen Z-1 (unit: mm).
Buildings 15 03442 g018
Figure 19. Axial load–displacement curve test values and simulation values of specimen Z-1.
Buildings 15 03442 g019
Figure 20. Three-dimensional structural schematic diagram of specimen S690-C130-SP60-H.
Buildings 15 03442 g020
Figure 21. Schematic diagram of mesh division for specimen S690-C130-SP60-H.
Buildings 15 03442 g021
Figure 22. Section dimensions of specimen S690-C130-SP60-H (unit: mm).
Buildings 15 03442 g022
Figure 23. Axial load–displacement curve test values and simulation values of specimen S690-C130-SP60-H.
Buildings 15 03442 g023
Figure 24. Design schematic diagram of the UHPC-SRC short column.
Buildings 15 03442 g024
Figure 25. Diameter of longitudinal reinforcement.
Buildings 15 03442 g025
Figure 26. Longitudinal reinforcement strength.
Buildings 15 03442 g026
Figure 27. Thickness of permanent formwork.
Buildings 15 03442 g027
Figure 28. Strength grade of permanent formwork.
Buildings 15 03442 g028
Figure 29. Steel section strength grade.
Buildings 15 03442 g029
Figure 30. Thickness of stirrup concrete cover.
Buildings 15 03442 g030
Figure 31. The H-shaped steel yields.
Buildings 15 03442 g031
Figure 32. The short column cracks.
Buildings 15 03442 g032
Figure 33. Strain cloud diagram in the longitudinal direction of the specimen.
Buildings 15 03442 g033
Figure 34. Damage cloud map under compressive load at ultimate capacity.
Buildings 15 03442 g034
Figure 35. Equivalent plastic strain contour map of the reinforced cage under ultimate load.
Buildings 15 03442 g035
Figure 36. Strain cloud diagram of the specimen along the long side under ultimate load.
Buildings 15 03442 g036
Table 1. CDP model parameter settings.
Ψζfb0/fc0Kcμ
30°0.11.160.66670.005
Table 2. Friction coefficient sensitivity analysis.
Mesh SizeTotal Increment StepsTotal Number of IterationsTime IncrementComputation TimeAccuracy (Experiment/Simulation)
0.6137100.050611 min 03 s0.99
0.5123130.050610 min 08 s0.98
0.4134130.050610 min 50 s0.98
Table 3. Grid size sensitivity analysis.
Grid SizeTotal Increment StepsTotal Number of IterationsTime IncrementComputation TimeAccuracy (Experiment/Simulation)
30137100.050611 min 03 s0.99
40159100.050611 min 37 s0.99
50149170.050611 min 05 s0.99
Table 4. Comparison of ultimate load results.
Specimen NamePut/kNPuFE/kNPut/PuFE
U-CFST-20-1-A29393001.770.98
Z-177367767.040.99
S690-C130-SP60-H11,23912,231.130.92
Table 5. Basic parameter settings for short column model design.
Specimen NameDiameter of Longitudinal Reinforcement/mmLongitudinal Reinforcement StrengthThickness of Permanent Formwork/mmStrength Grade of Permanent FormworkSteel Section Strength GradeThickness of Stirrup Concrete Cover/mm
DZ-18HRB40030C120Q2355
DZ-210HRB40030C120Q2355
DZ-312HRB40030C120Q2355
DZ-48HRB50030C120Q2355
DZ-58HRB60030C120Q2355
DZ-68HRB40020C120Q2355
DZ-78HRB40040C120Q2355
DZ-88HRB40030C100Q2355
DZ-98HRB40030C140Q2355
DZ-108HRB40030C120Q3455
DZ-118HRB40030C120Q3905
DZ-128HRB40030C120Q23510
DZ-138HRB40030C120Q23515
Table 6. The simulation results of the finite element analysis.
Specimen NameUltimate Load/kNUltimate Displacement/mm
DZ-14864.792.22
DZ-24908.912.22
DZ-34962.922.22
DZ-44880.672.22
DZ-54887.762.22
DZ-64143.852.85
DZ-75107.342.40
DZ-84308.242.40
DZ-95028.101.95
DZ-105184.401.95
DZ-115260.432.40
DZ-124600.312.40
DZ-134608.892.40
Table 7. Comparison between calculated and simulated compressive bearing capacities of UHPC-SRC short columns.
Specimen NameNup/kNNuFE/kNNuFE/Nup
DZ-14707.444864.791.034
DZ-24740.424908.911.036
DZ-34784.354962.921.037
DZ-44724.544880.671.033
DZ-54744.644887.761.030
DZ-64088.924143.851.013
DZ-75270.725107.340.969
DZ-84200.884308.241.026
DZ-95222.205028.100.963
DZ-105134.545184.401.010
DZ-115310.495260.430.991
DZ-124704.444600.310.978
DZ-134704.444608.890.980
Disclaimer/Publisher’s Note: The statements, opinions and data contained in all publications are solely those of the individual author(s) and contributor(s) and not of MDPI and/or the editor(s). MDPI and/or the editor(s) disclaim responsibility for any injury to people or property resulting from any ideas, methods, instructions or products referred to in the content.