Review

Porosity and Permeability in Construction Materials as Key Parameters for Their Durability and Performance: A Review

by
Almudena Ortiz-Marqués
1,*,
Pablo Caldevilla
1,
Eryk Goldmann
2,
Małgorzata Safuta
2,
María Fernández-Raga
3 and
Marcin Górski
2
1
Department of Mining Technology, Topography and Structures, University of León, 24007 León, Spain
2
Department of Structural Engineering, Silesian University of Technology, 44-100 Gliwice, Poland
3
Department of Applied Physics and Chemistry, University of León, 24007 León, Spain
*
Author to whom correspondence should be addressed.
Buildings 2025, 15(18), 3422; https://doi.org/10.3390/buildings15183422
Submission received: 12 July 2025 / Revised: 14 August 2025 / Accepted: 22 August 2025 / Published: 22 September 2025

Abstract

This review provides a comprehensive examination of porosity and permeability as key parameters governing the durability and performance of construction materials, including natural stone, mortar, concrete, and other cementitious composites. It highlights the pivotal role of pore structure in transport phenomena and degradation mechanisms, examining how the variations in pore architecture, encompassing total vs. effective porosity, pore size distribution, and pore connectivity, dictate a material’s response to environmental stressors. A comparative evaluation of advanced pore characterization techniques is presented, including helium pycnometry, mercury intrusion porosimetry (MIP), nitrogen adsorption (BET/BJH), nuclear magnetic resonance (NMR) relaxometry, and imaging methods such as optical microscopy, scanning electron microscopy (SEM), and X-ray micro-computed tomography (micro-CT). Furthermore, it assesses how these porosity and permeability characteristics influence durability-related processes like freeze–thaw cycling, chloride ingress, sulphate attack, and carbonation. Case studies are discussed in which various additives have been employed to refine the pore structure of cement-based materials, and pervious concrete is highlighted as an example where deliberately high porosity and permeability confer functional benefits (e.g., enhanced drainage). Overall, these insights underscore the importance of tailoring porosity and permeability in material design to enhance durability and sustainability in construction engineering.

1. Introduction

A central challenge for the circular economy, intensified by global change, is to develop durable materials that minimize life-cycle maintenance costs and reduce environmental impacts. Addressing this challenge requires, among other measures, extending the service life of construction materials and mitigating degradation mechanisms to optimize resource use, reduce the frequency of corrective interventions, and minimize the life-cycle environmental footprint.
Stone degradation can be framed as the interaction between applied actions (mechanical, thermal–hygric, and chemical) and the stone’s resistance, which is variable between stone types (Equation (1)) [1]. Viles et al. (2013) [1] classify the actions of stone decay into physical and chemical categories. These actions are manifested through the environmental conditions acting on buildings and often operate in the presence of, and are modulated by, biological agents. As formalized in Equation (1), degradation occurs when the driving actions exceed the material resistances, leading to disintegration and/or chemical alteration:
D e t e r i o r a t i o n = F o r c e s R e s i s t a n c e s
Equation (1) The deterioration relation between forces and resistances.
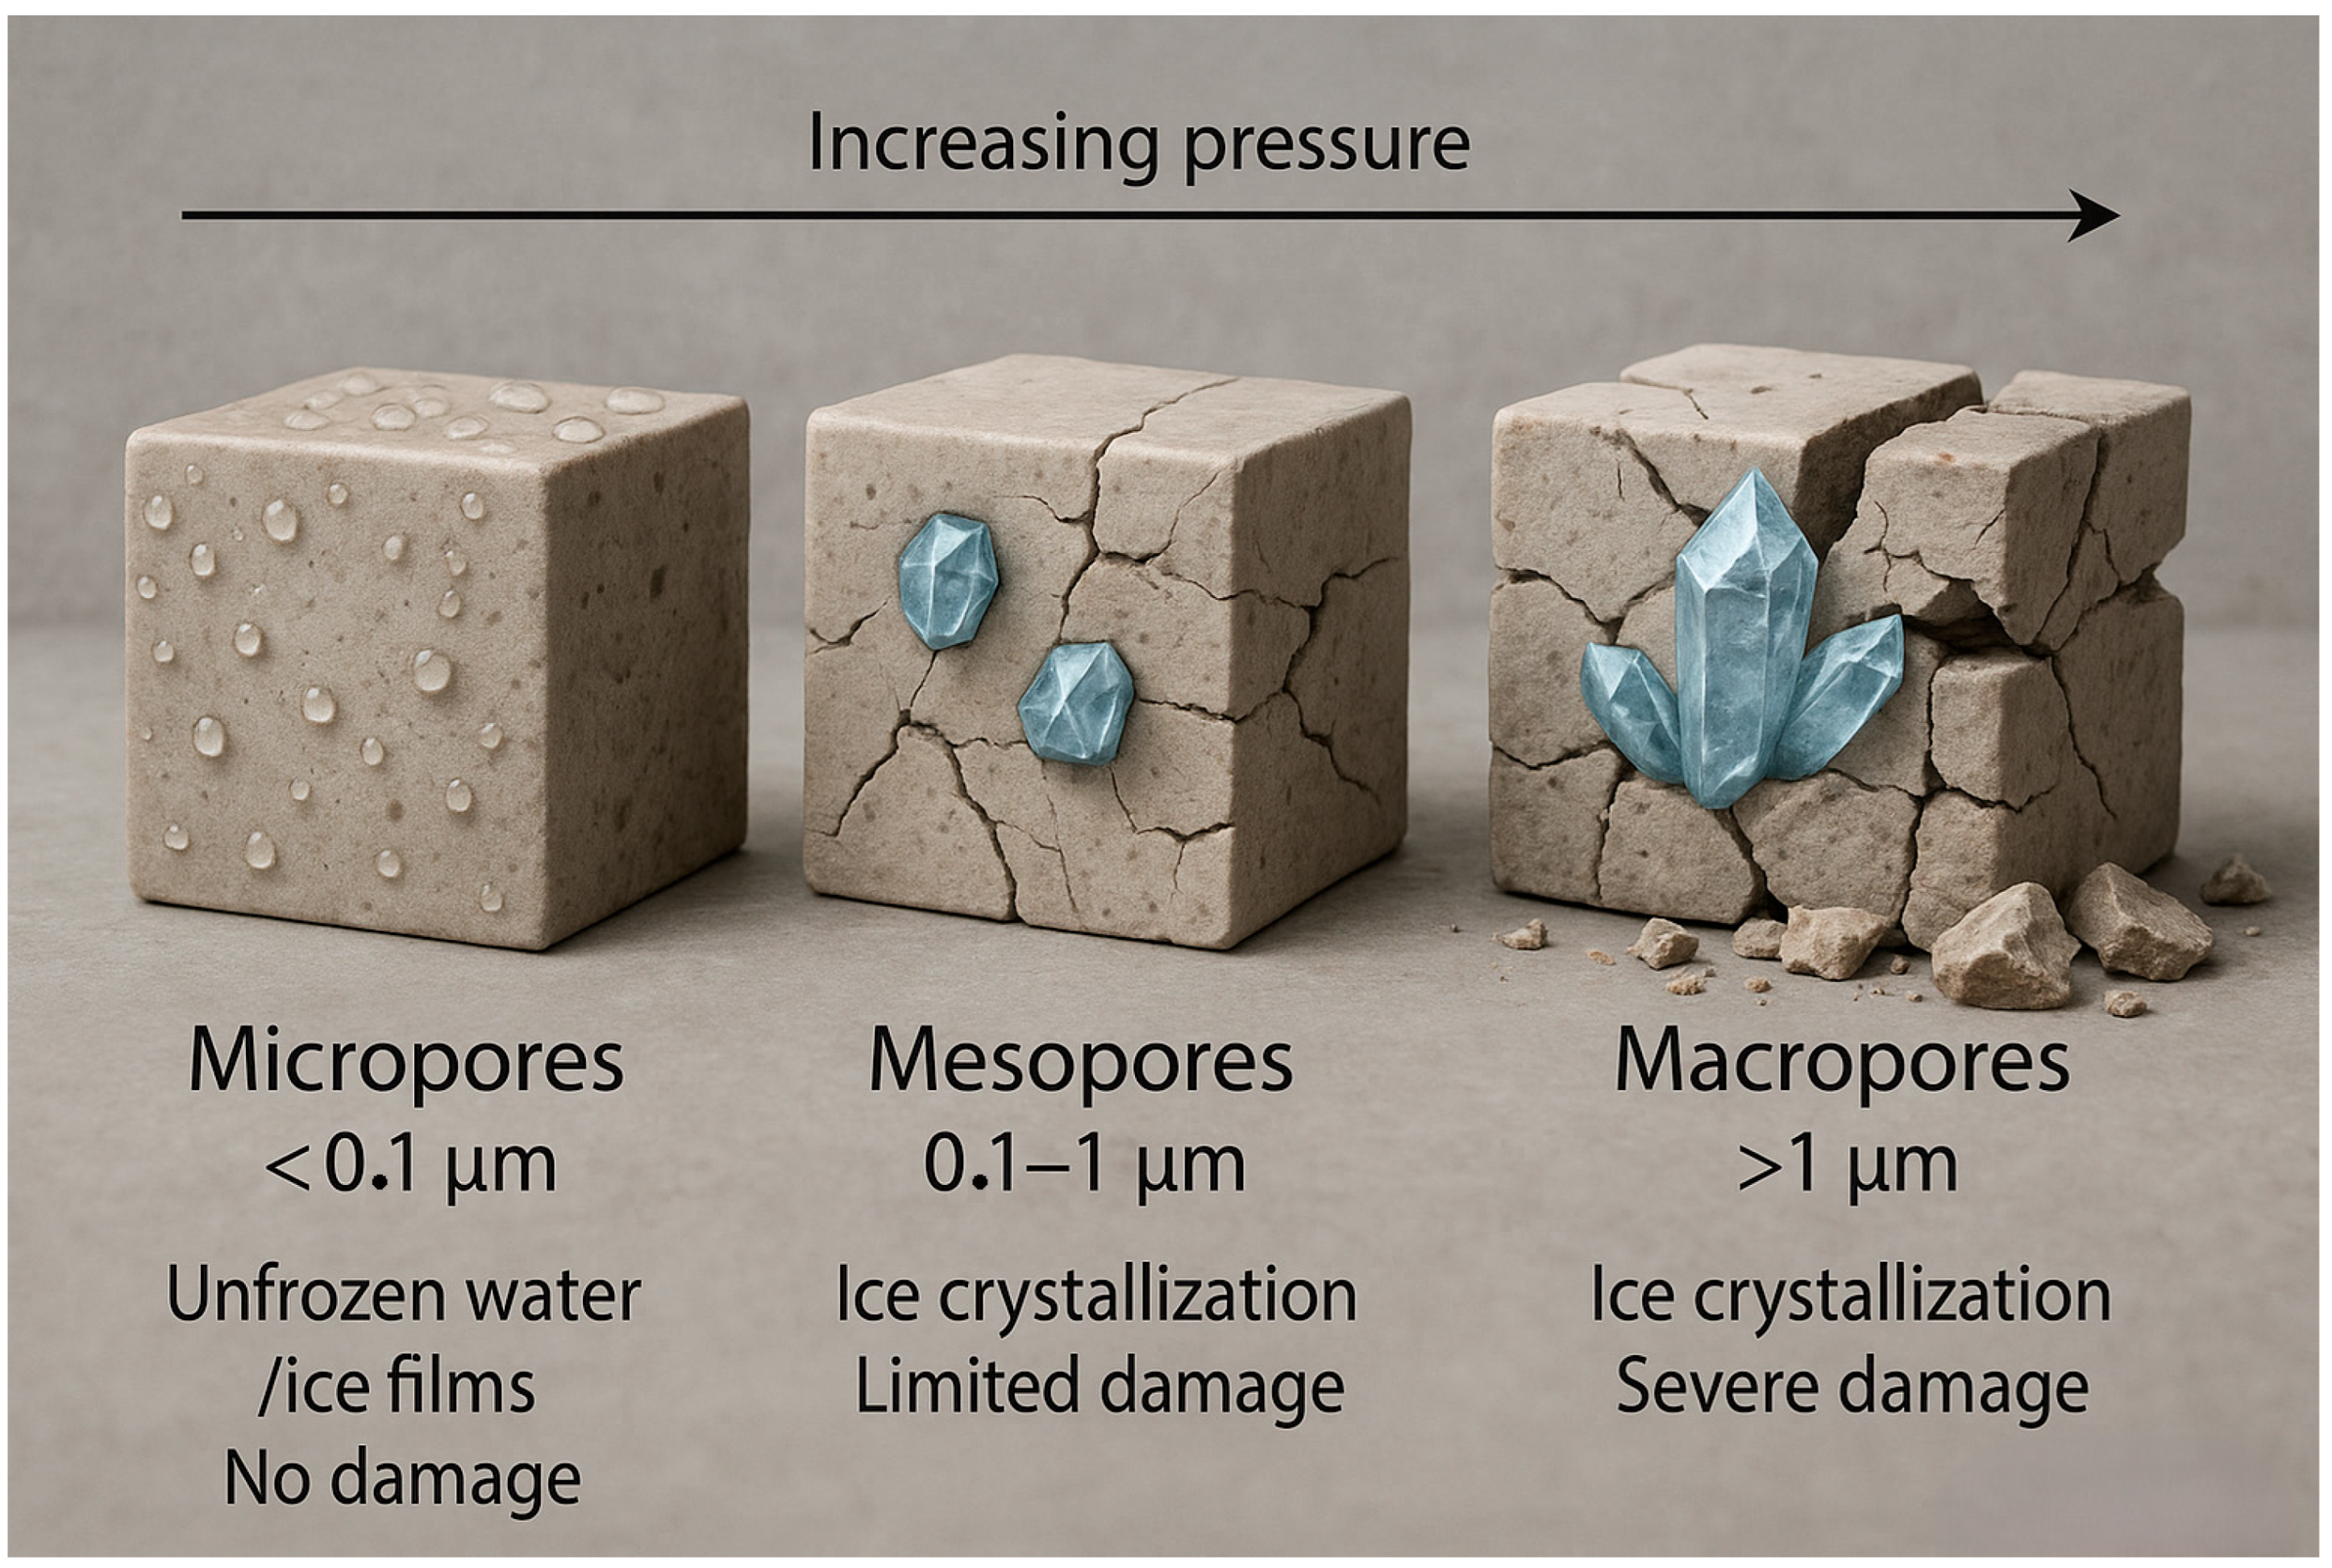
Chemical and physical drivers rarely act in isolation, with water often serving as the coupling agent. The aim of preventive stone conservation is to slow deterioration either by reducing the driving forces (via environmental control) or by enhancing the stone’s resistance through treatment. In practice, however, the force–resistance relationship is both dynamic and recursive: a change in one variable alters the other, feeding back into the system and prompting new transformations. These recursive interactions usually exhibit nonlinear behaviour with critical thresholds: below a given limit, durability remains high, but the continued action of the forces can exceed that threshold and precipitate an abrupt loss of durability, even without changes in boundary conditions. Likewise, studies of freeze–thaw action [2,3] cryogenic freeze–thaw cycles consistently indicate the existence of these critical thresholds.
Durability is defined, in this context, as a material’s capacity to maintain, throughout its service life, an acceptable level of mechanical, physicochemical, functional, esthetic, and safety performance when subjected to the physical, chemical, and biological actions of its exposure environment, without requiring maintenance interventions other than those planned. Durability is considered to end when the material reaches a Serviceability Limit State (SLS) or an Ultimate Limit State (ULS).
Under projected global-change scenarios, environmental drivers such as moisture, pollution, and temperature will diminish the material’s resistance, so that future exposures to the same levels of forcing become increasingly destructive. The ensuing damage can, in turn, alter the stone’s structure or chemical composition, modifying its response to subsequent stresses. The system thus becomes self-reinforcing: each degradation episode may facilitate, or even accelerate, the next one. The multiscale interaction of these mechanisms culminates in multiscale degradation, understood as the hierarchical progression of damage from the atomic level (dissolution/precipitation) to the microstructural (microcracking) and, ultimately, to the structural level, with loss of load-bearing capacity [4].
Viles et al. [1] established a clear relationship between stone durability and its porous attributes, particularly porosity and permeability. Their analysis highlights that pore structure, including pore size distribution, connectivity, and accessibility, plays a decisive role in the resistance of stone to deterioration, particularly through mechanisms such as salt crystallization and water ingress. Stones with high connected porosity enable more efficient transport of moisture and dissolved salts, thereby facilitating both physical and chemical weathering mechanisms. Viles et al. [1] also mentioned metrics such as the total connected porosity index and the microporosity (micropore) index, which correlate with susceptibility to salt-induced alteration. In sum, the authors argue that higher porosity and greater permeability tend to reduce the durability of stone by promoting greater interaction with environmental agents of deterioration. Consequently, a comprehensive understanding of these properties is indispensable for accurate prediction of the long-term performance of these materials in conservation and construction contexts [5,6].
Similarly, the mechanical performance and durability of concrete are primarily controlled by the pore system, its volume, size distribution, and connectivity, within the cement paste and aggregates, as well as in the interfacial transition zone (ITZ) [7,8]. It is also well established [9] that concrete durability depends directly on its transport properties, especially permeability and diffusion. Throughout its service life, concrete structures undergo various degradation processes brought about by mechanical loading, thermal actions, and chemical agents. The most important degrading factors in case of concrete structures are chlorides, sulphates, and carbonation caused by CO2 diffusion. All of these factors are present, to varying degrees, under the service conditions of ordinary and reinforced concrete structures. In addition to deterioration of the concrete matrix, they pose a substantial risk of steel reinforcement corrosion. Because reinforcement is integral to most structural elements, exposure to these factors can initiate reinforcement corrosion and subsequent structural failure, endangering human life. Recent investigations [10,11] show strong correlations among effective porosity, permeability, and the apparent diffusion coefficients of chloride and CO2, thereby supporting their use in service-life modelling.
This study offers an integrated, cross-material synthesis of how porosity and permeability control the durability and mechanical behaviour of natural stone, concrete, and mortar. The review combines experimental evidence, multiscale modelling, and recent advances in porous-microstructure design and engineering. To this end, we survey state-of-the-art measurement techniques: X-ray microcomputed tomography (micro-CT), nuclear magnetic resonance (NMR), scanning electron microscopy (SEM), and optical microscopy [12,13], among others, and relate these techniques to key degradation mechanisms, chloride ingress, sulphate attack, and carbonation. Case studies demonstrate strategies to reduce porosity and permeability in stone, concrete, and mortar via mineral additions, industrial by-products, and nanomaterials, showcasing modern approaches for enhancing material performance. By combining experimental results with theoretical models, we identify the dominant physical mechanisms, select the most suitable characterization methods, and derive practical implications for material design and conservation across diverse construction contexts. In doing so, this work addresses a critical gap in the durability literature.

2. Porosity and Permeability: Fundamental Definitions and Characterization Methods

2.1. Porosity

Porosity is a bulk parameter defined as the ratio of a material’s total pore volume to its total specimen or rock volume. Rock porosity can be classified according to the degree of connectivity to the exterior. Open, connected, or effective porosity refers to the pore volume that maintains some level of interconnection with the external environment, allowing fluids to flow through it. By contrast, closed, isolated, or non-connected porosity refers to the pore volume that lacks any communication with the exterior [14].
Open porosity, in particular, plays a decisive role in material degradation because it is directly connected with the environment. For this reason, its characterization is crucial for assessing the durability of stone, concrete, and mortar against external agents and, consequently, for determining their suitability for a given application. The very nature of open porosity means that the most informative characterization techniques rely on the mobility of various fluids, chiefly mercury intrusion porosimetry, water, and nitrogen-gas adsorption, capillary uptake tests, and helium pycnometry, among others.
Total porosity is defined as the volume fraction representing all void spaces in a porous material (e.g., rock, soil, concrete, mortar, porous polymer, or ceramic), regardless of whether those pores are interconnected with one another or with the exterior (Equation (2)). It is a dimensionless quantity (often reported as a percentage) applicable to both rigid and deformable porous media. It encompasses macropores, micropores, microcracks and cracks, fractures, dead-end (blind) pores cavities, and any internal void capable of being occupied by fluids.
n t = V p o r e s   ( i n t e r c o n n e c t e d + i s o l a t e d ) V t   ( 0 n t 1 )
Equation (2) Total porosity, where
Vpores—volume of interconnected and isolated pores;
Vt—bulk volume.
Effective porosity is defined as the ratio of the volume of interconnected pore space to the total (bulk) volume of the material (Equation (3)). In other words, it includes only those voids that permit fluid transport under a pressure gradient. It excludes isolated pores, dead-end cavities, and occluded/filled pores that do not participate in fluid-phase flow. In concretes, mortars, and rocks used as construction materials, effective porosity controls the transport of water, salts, and aggressive agents and the mechanical strength under load, thereby governing their durability.
n e = V i c V t ( 0 n e 1 )
Equation (3) Effective porosity, where,
Vic—volume of interconnected pores;
Vt—bulk volume.

2.2. Principal Techniques for Determining the Porosity of Porous Materials (Rocks, Mortars, and Concrete)

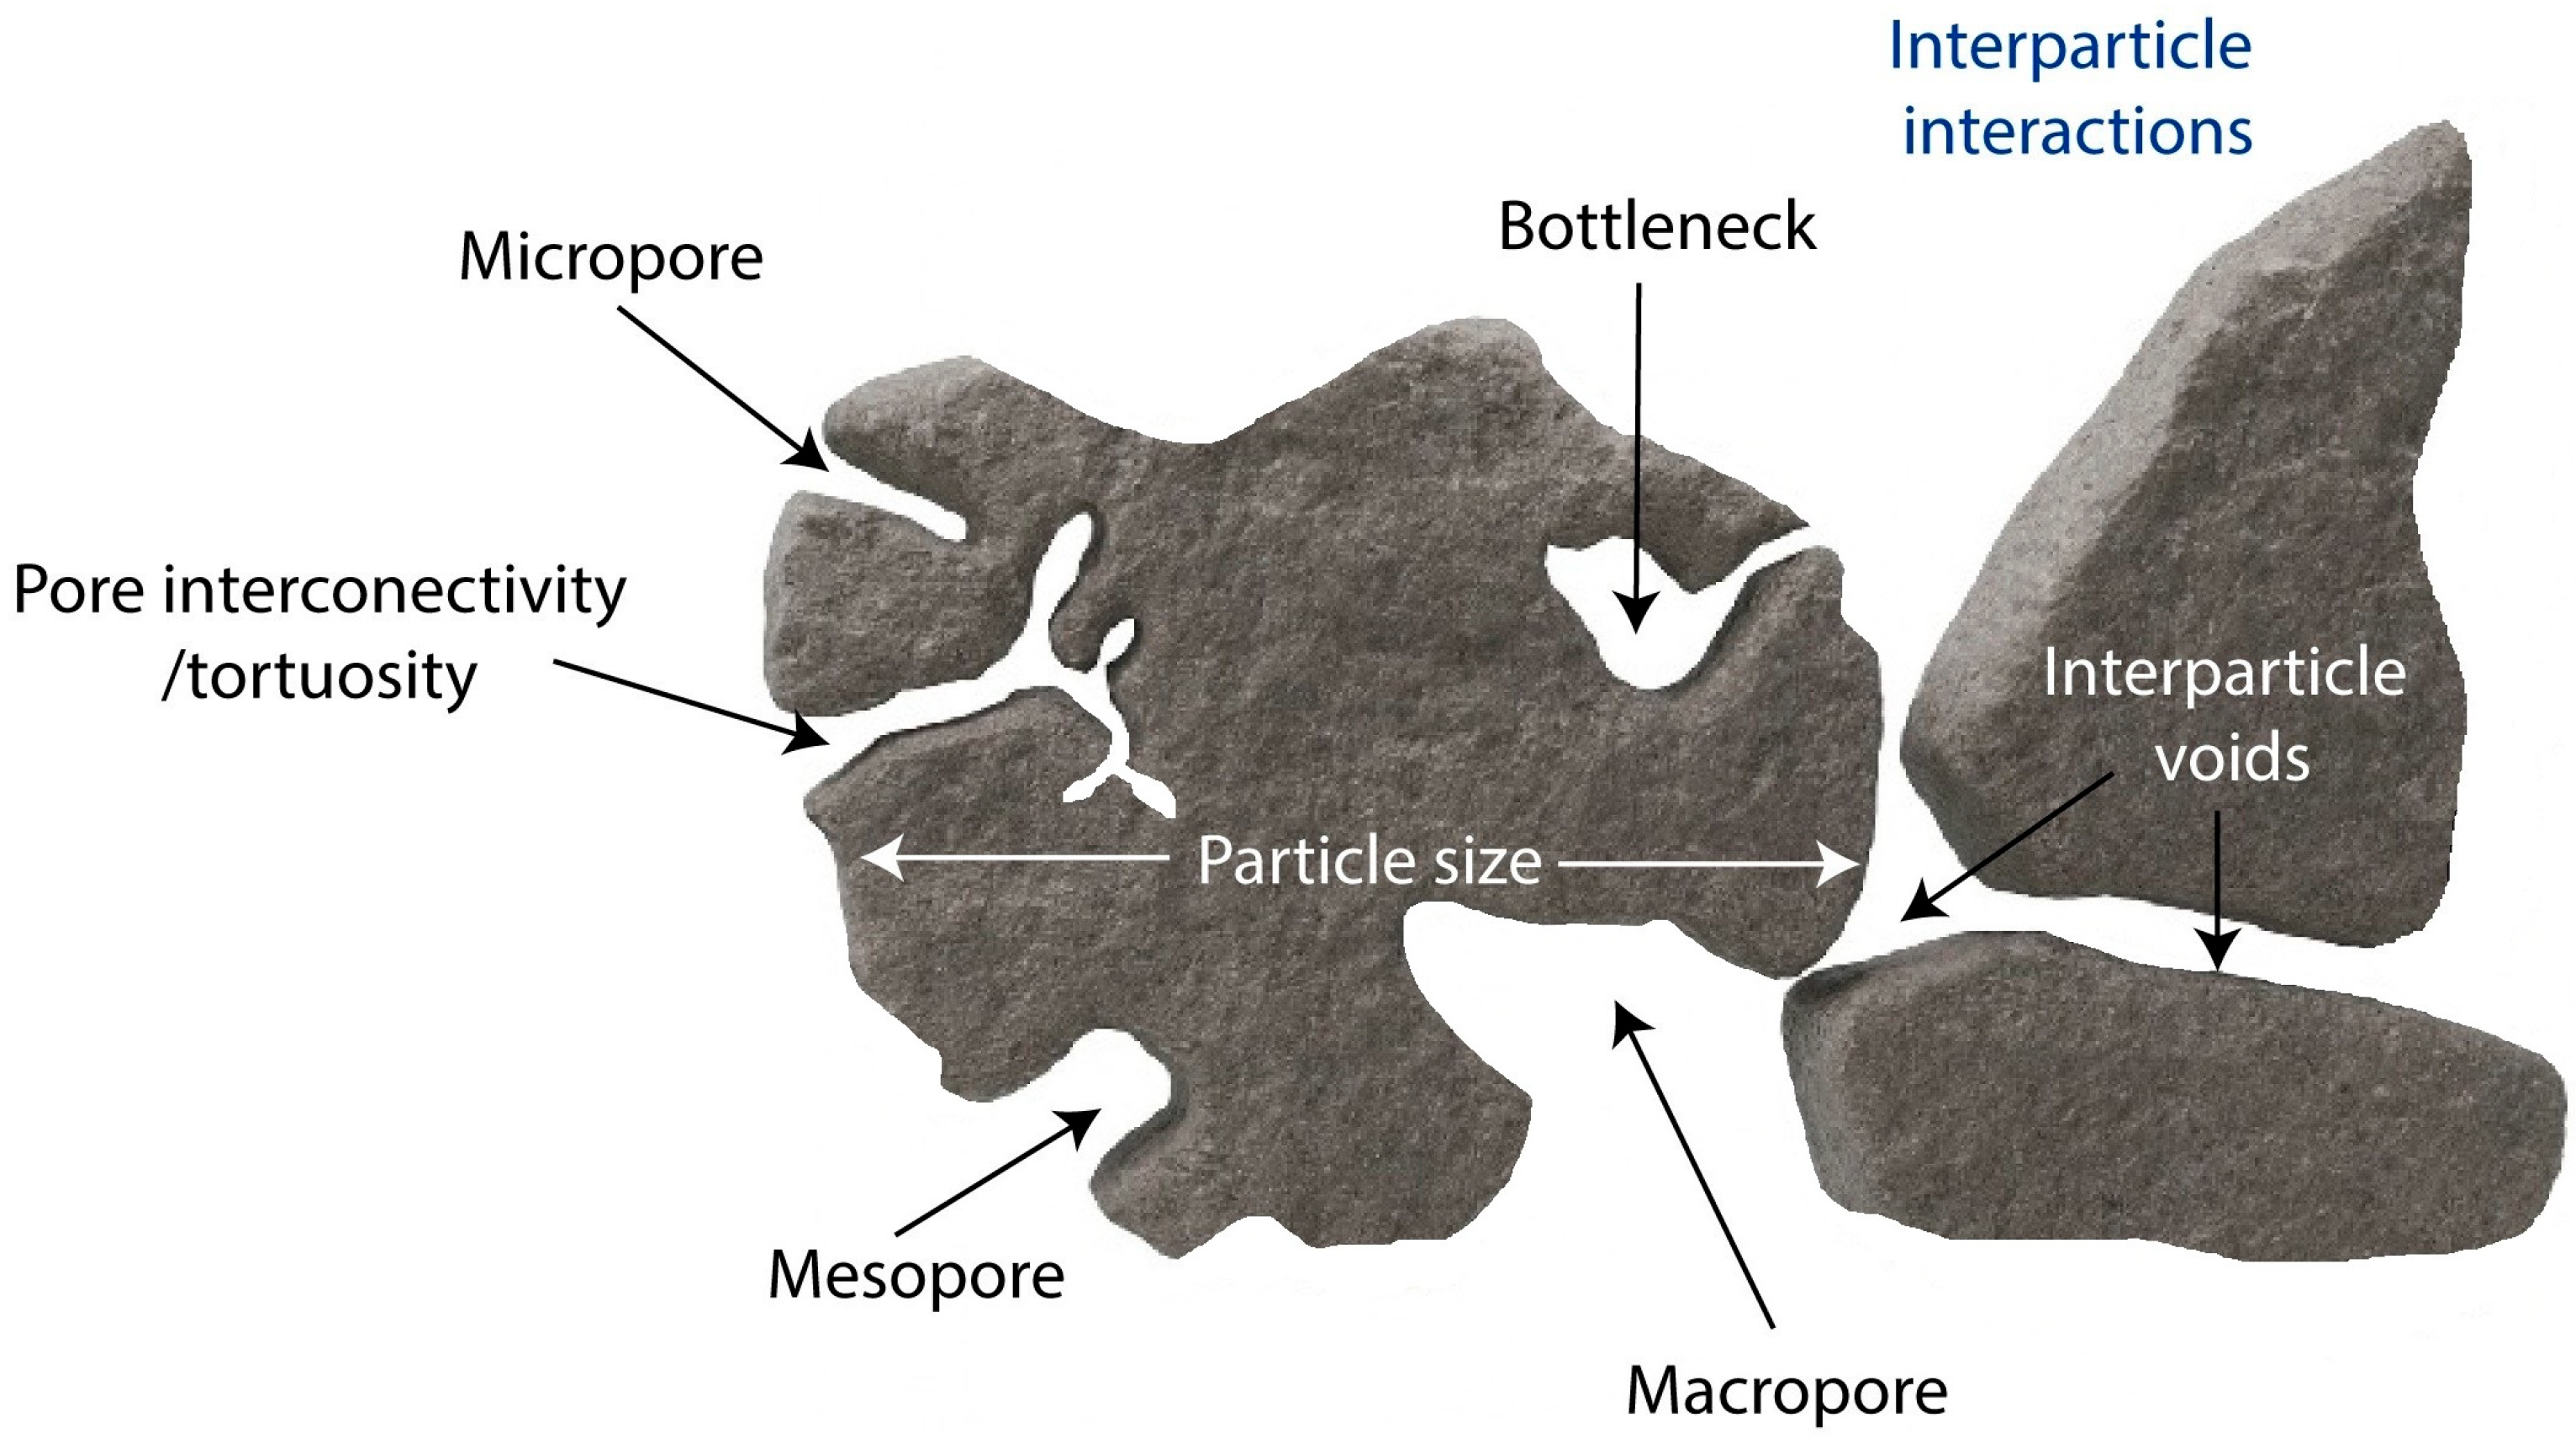
A variety of measurement techniques can be employed to determine a material’s porosity. They are typically classified according to the pore scale of interest, micropores (≈0–2 nm in diameter), mesopores (≈2–50 nm), and macropores (>50 nm), as well as the nature of the specimen and the study’s objective (e.g., durability design, corrosion or chemical-attack monitoring, or multiscale modelling).

2.2.1. Helium Pycnometry

Helium pycnometry is regarded as one of the most accurate non-destructive techniques for determining effective (i.e., connected) porosity, since it employs the gas-displacement method to measure both volume and skeletal density (Figure 1). The skeletal density (ρskel) is defined as the density calculated from the volume of the solid phase with the closed pores (Equation (4)); this is precisely the value measured with a helium pycnometer. The density obtained is very close to the true (intrinsic) density of the rock. The expression used is:
ρ s k e l = m V s k e l = m V s + V c p
Equation (4) Skeletal density of porous materials, where
m—mass of the sample;
Vskel—volume of the solid phase;
Vs—volume of solids;
Vcp—volume of closed pores.
Porosity is determined with this technique by measuring the true volume of the solid phase (excluding voids that are open to the exterior) and comparing it with the specimen’s total volume (Equation (5)). Because helium is inert, highly diffusive, and possesses a very small molecular size capable of penetrating microscopic pores, it yields an exceptionally precise estimate of the solid-matrix volume. The applicable pore size range is roughly 0.1 nm to 100 µm.
n = V t V s V c p V t
Equation (5) Porosity determined using helium pycnometry.
All of the variables as described above.
The technique rests on Boyle–Mariotte’s law (P1∙V1 = P2∙V2 at constant temperature) and on Archimedes’ principle, which states that, at constant temperature, the volume occupied by a gas is inversely proportional to its pressure.
In practice [15], a solid specimen is placed within a chamber of known volume containing a fixed amount of helium gas. Since helium does not penetrate the solid phase of the material, the specimen effectively displaces a volume that would otherwise be accessible to the gas. By measuring the pressure change before and after the sample is introduced, and applying Boyle–Mariotte’s law, the displaced solid volume can be accurately determined. The procedure integrates the ideal gas law with the principle of mass conservation for the gas phase.

2.2.2. Mercury Intrusion Porosimetry (MIP)

Mercury Intrusion Porosimetry has become a standardized technique for characterizing a wide range of solid and particulate materials (Figure 2). At the maximum operating pressure, approximately 400 MPa, mercury can penetrate pores as small as 3.6 nm. Consequently, the method is unsuitable for assessing micropores and the finest mesopores. The use of mercury is justified because gas-adsorption techniques do not allow measurement of large pores (>200–300 nm). Thus, MIP spans an approximate measurement window from 3.6 nm to 950 µm. In summary, it provides an efficient and standardized quantification of the open-pore fraction and its architecture within the size range that actually governs the behaviour of rocks, concretes, and mortars.
In most inorganic solids, mercury exhibits a contact angle θ ≈ 130–140°, i.e., it does not wet the surface (θ > 90°). Accordingly, pore entry requires applying an external pressure sufficient to overcome the capillary suction (negative capillary pressure) arising from this non-wettability.
The technique is founded on the Washburn equation, where ΔP denotes the overpressure required to force mercury intrusion into a pore of radius r (Equation (6)). The surface tension of the liquid mercury is represented by γ, and θ is the contact angle between the mercury and the specimen under examination.
P r = 2 γ c o s θ
Equation (6) Washburn equation for MIP procedure, where
ΔP—overpressure applied during testing;
r—pore radius;
γ—surface tension of mercury;
θ—contact angle between mercury and the sample material.
The surface tension of mercury, γ, is typically taken as 480 N m−1, while the contact angle is assumed to be θ = 140°. Pressure, P, is usually expressed in MPa and the pore radius, r, in µm. According to the preceding equation, each pressure level (P) corresponds to a specific pore radius (r).
Mercury initially penetrates the larger pores and, as the applied pressure rises, progressively intrudes into smaller ones. A transducer continuously records the volume of mercury entering the specimen, producing a “volume-versus-pressure” curve. By applying the Washburn equation, each pressure datum is converted to an equivalent pore radius, thereby generating a “radius-versus-volume” plot. From this second curve one can derive the pore size distribution, total pore area and volume, pore-network architecture, and the access-neck diameter, that is, the size of the throats interconnecting the pores (deduced from the radius corresponding to the pressure at which mercury first begins to enter those voids) [16,17,18].
The ASTM standard that sets out the mercury intrusion porosimetry (MIP) procedure is ASTM D4404 [19], “Standard Test Method for Determination of Pore Volume and Pore Volume Distribution of Soil and Rock by Mercury Intrusion Porosimetry” and its fundaments (Table 1).
The principal limitations of this technique (Table 2) are, first, that it cannot access closed porosity and therefore probes only the open-pore fraction [20]. Diamond [21] demonstrated that mercury intrusion porosimetry is unsuitable for cementitious materials, and Rigby [22] further noted that the high pressures required to force intrusion can micro-fracture concretes, ceramics, or soft polymers, thereby distorting the intrusion–extrusion curve. Additional drawbacks noted by Zeng et al. [23] include contact hysteresis, the “ink-bottle” effect, and the simultaneous compression of both the fluid and the specimen under pressure. These phenomena introduce artefacts into the extrusion curve and increase the uncertainty of the final data, making post-measurement corrections necessary. Moreover, the method is destructive, and the well-known toxicity of mercury demands strict handling protocols.
Mercury intrusion porosimetry (MIP) is a highly versatile technique for characterizing mesopores and macropores, as it exploits the capillary relationship that links the applied pressure to the pore-throat radius. Its principal strength lies in the broad accessible size range and the rapid acquisition of data. However, rigorous interpretation requires recognizing (and, where possible, correcting) the method’s implicit assumptions (cylindrical pore geometry, constant contact angle, and a rigid matrix), as well as the phenomena that can bias the measurement, including the ink-bottle effect, hysteresis, and solid compression.

2.2.3. Gas Adsorption–Desorption Characterization (Typically N2 at 77 K) and BET/BJH Analysis Methods

The nitrogen adsorption–desorption technique at 77 K yields an isotherm from which key porous characteristics can be extracted. The slope of the isotherm in the low-pressure region is used to determine the specific surface area via Brunauer–Emmett–Teller (BET) analysis, while the desorption branch provides insight into the mesoporous structure (approximately 2–50 nm) through the Barrett–Joyner–Halenda (BJH) method.
A single test performed in accordance with ASTM Standards D4222 [24], D3663 [25], and D4641 [26] enables comprehensive characterization of a material’s porous structure without altering the specimen. The method provides key parameters including specific surface area, total mesopore volume, average pore diameter, and the size distribution of pores and pore throats [17].
One of the principal advantages of this method lies in the high sensitivity of the BET model, which converts the quantity of adsorbed N2 into specific surface area with a resolution unattainable by more “macroscopic” techniques. Likewise, the BJH algorithm is extensively applied to materials in which mesopores control permeability or reaction kinetics (e.g., catalysts, modified cements, and aerogels).
The method assumes independent cylindrical pores and is reliable for “open” mesopores; it shows limitations in networks with narrow throats, in systems where the tensile strength of the condensed liquid becomes relevant, or when micropores (<2 nm) predominate, situations for which alternative, technique-specific models are preferable. Moreover, the procedure does not characterize macropores, and thorough degassing of the specimen is mandatory.

2.2.4. T2/T1 Relaxation NMR for Porosity Characterization

Nuclear magnetic resonance (NMR) probes the dynamics of the nuclear spins of a fluid saturating a specimen. T1 (spin–lattice) is the time the spins need to exchange energy with the lattice and return to equilibrium, whereas T2 (spin–spin) is the time over which the spins lose mutual coherence owing to their interactions with one another and with pore surfaces [4].
In a porous solid, fluid molecules collide with the pore walls, and each collision accelerates relaxation. The higher the surface-to-volume ratio (S/V), that is, the smaller the pore, the shorter the resulting T2 (and, to a lesser extent, T1).
It can simultaneously, rapidly, and non-destructively yield the total porosity, the fraction of pores in the 10 nm–100 µm range, and an estimate of the sample’s permeability. The technique is fast and non-destructive, permitting in situ recordings. Its principal limitations are that it does not detect closed pores and requires expensive instrumentation together with mathematically demanding data analysis.
Zhao et al. [27] applied this technique to cement pastes and mortars containing organic admixtures, estimating the total porosity with less than 5% error relative to MIP; they also showed that the admixture opened mesopores in the 10–30 nm range.
Robert et al. [28] reported the development of an NMR testing protocol for determining reservoir petrophysical properties using drill cuttings. The capacity to assess porosity rapidly via NMR on cuttings offers a cost-effective and efficient alternative to traditional core-analysis methods. Ultimately, harnessing NMR on drill cuttings could revolutionize the acquisition of critical reservoir-management data, enabling more informed decision-making in the energy sector.
Tang et al. [29] employed low-field nuclear magnetic resonance (NMR) to track the early-age hydration of cementitious materials containing mineral admixtures (MAs) by monitoring the transverse relaxation time T2. In parallel, they gauged the admixtures’ effect on mechanical performance through compressive and flexural strength tests. The results indicate that during the first 0–7 days of hydration, evaporated water progressively migrates into smaller pores with greater confinement, while total porosity decreases continuously, an effect amplified by the presence of MAs. The addition of MAs also lowers early-age strength, with a similar order of influence observed for fly ash, silica fume, and slag.

2.2.5. Imaging Techniques and Digital Analysis

Advanced imaging techniques have become indispensable for characterizing the porosity, microstructure, and damage in stone materials (both natural and engineered). Key methods include scanning electron microscopy (SEM), focused ion beam SEM tomography (FIB-SEM), X-ray micro-computed tomography (micro-CT, including synchrotron-based μCT), confocal laser scanning microscopy (CLSM), and modern digital analysis tools such as deep learning-assisted image segmentation. Each technique provides unique insights at different scales, from nanometre-resolution two-dimensional (2D) images to three-dimensional (3D) volumetric data, enabling a comprehensive understanding of stone materials’ internal structure and deterioration state.
Optical Microscopy
Optical microscopy, particularly petrographic microscopy, remains a classical, yet widely used, technique for microstructural characterization of geological and construction materials. Examination of resin-impregnated thin sections allows qualitative and quantitative identification of pores, as well as of the mineral phases or constituent components of the material [30]. The optical contrast between the solid matrix and the dyed resin-filled pores facilitates both visual and digital discrimination of phases in images acquired under transmitted or reflected light.
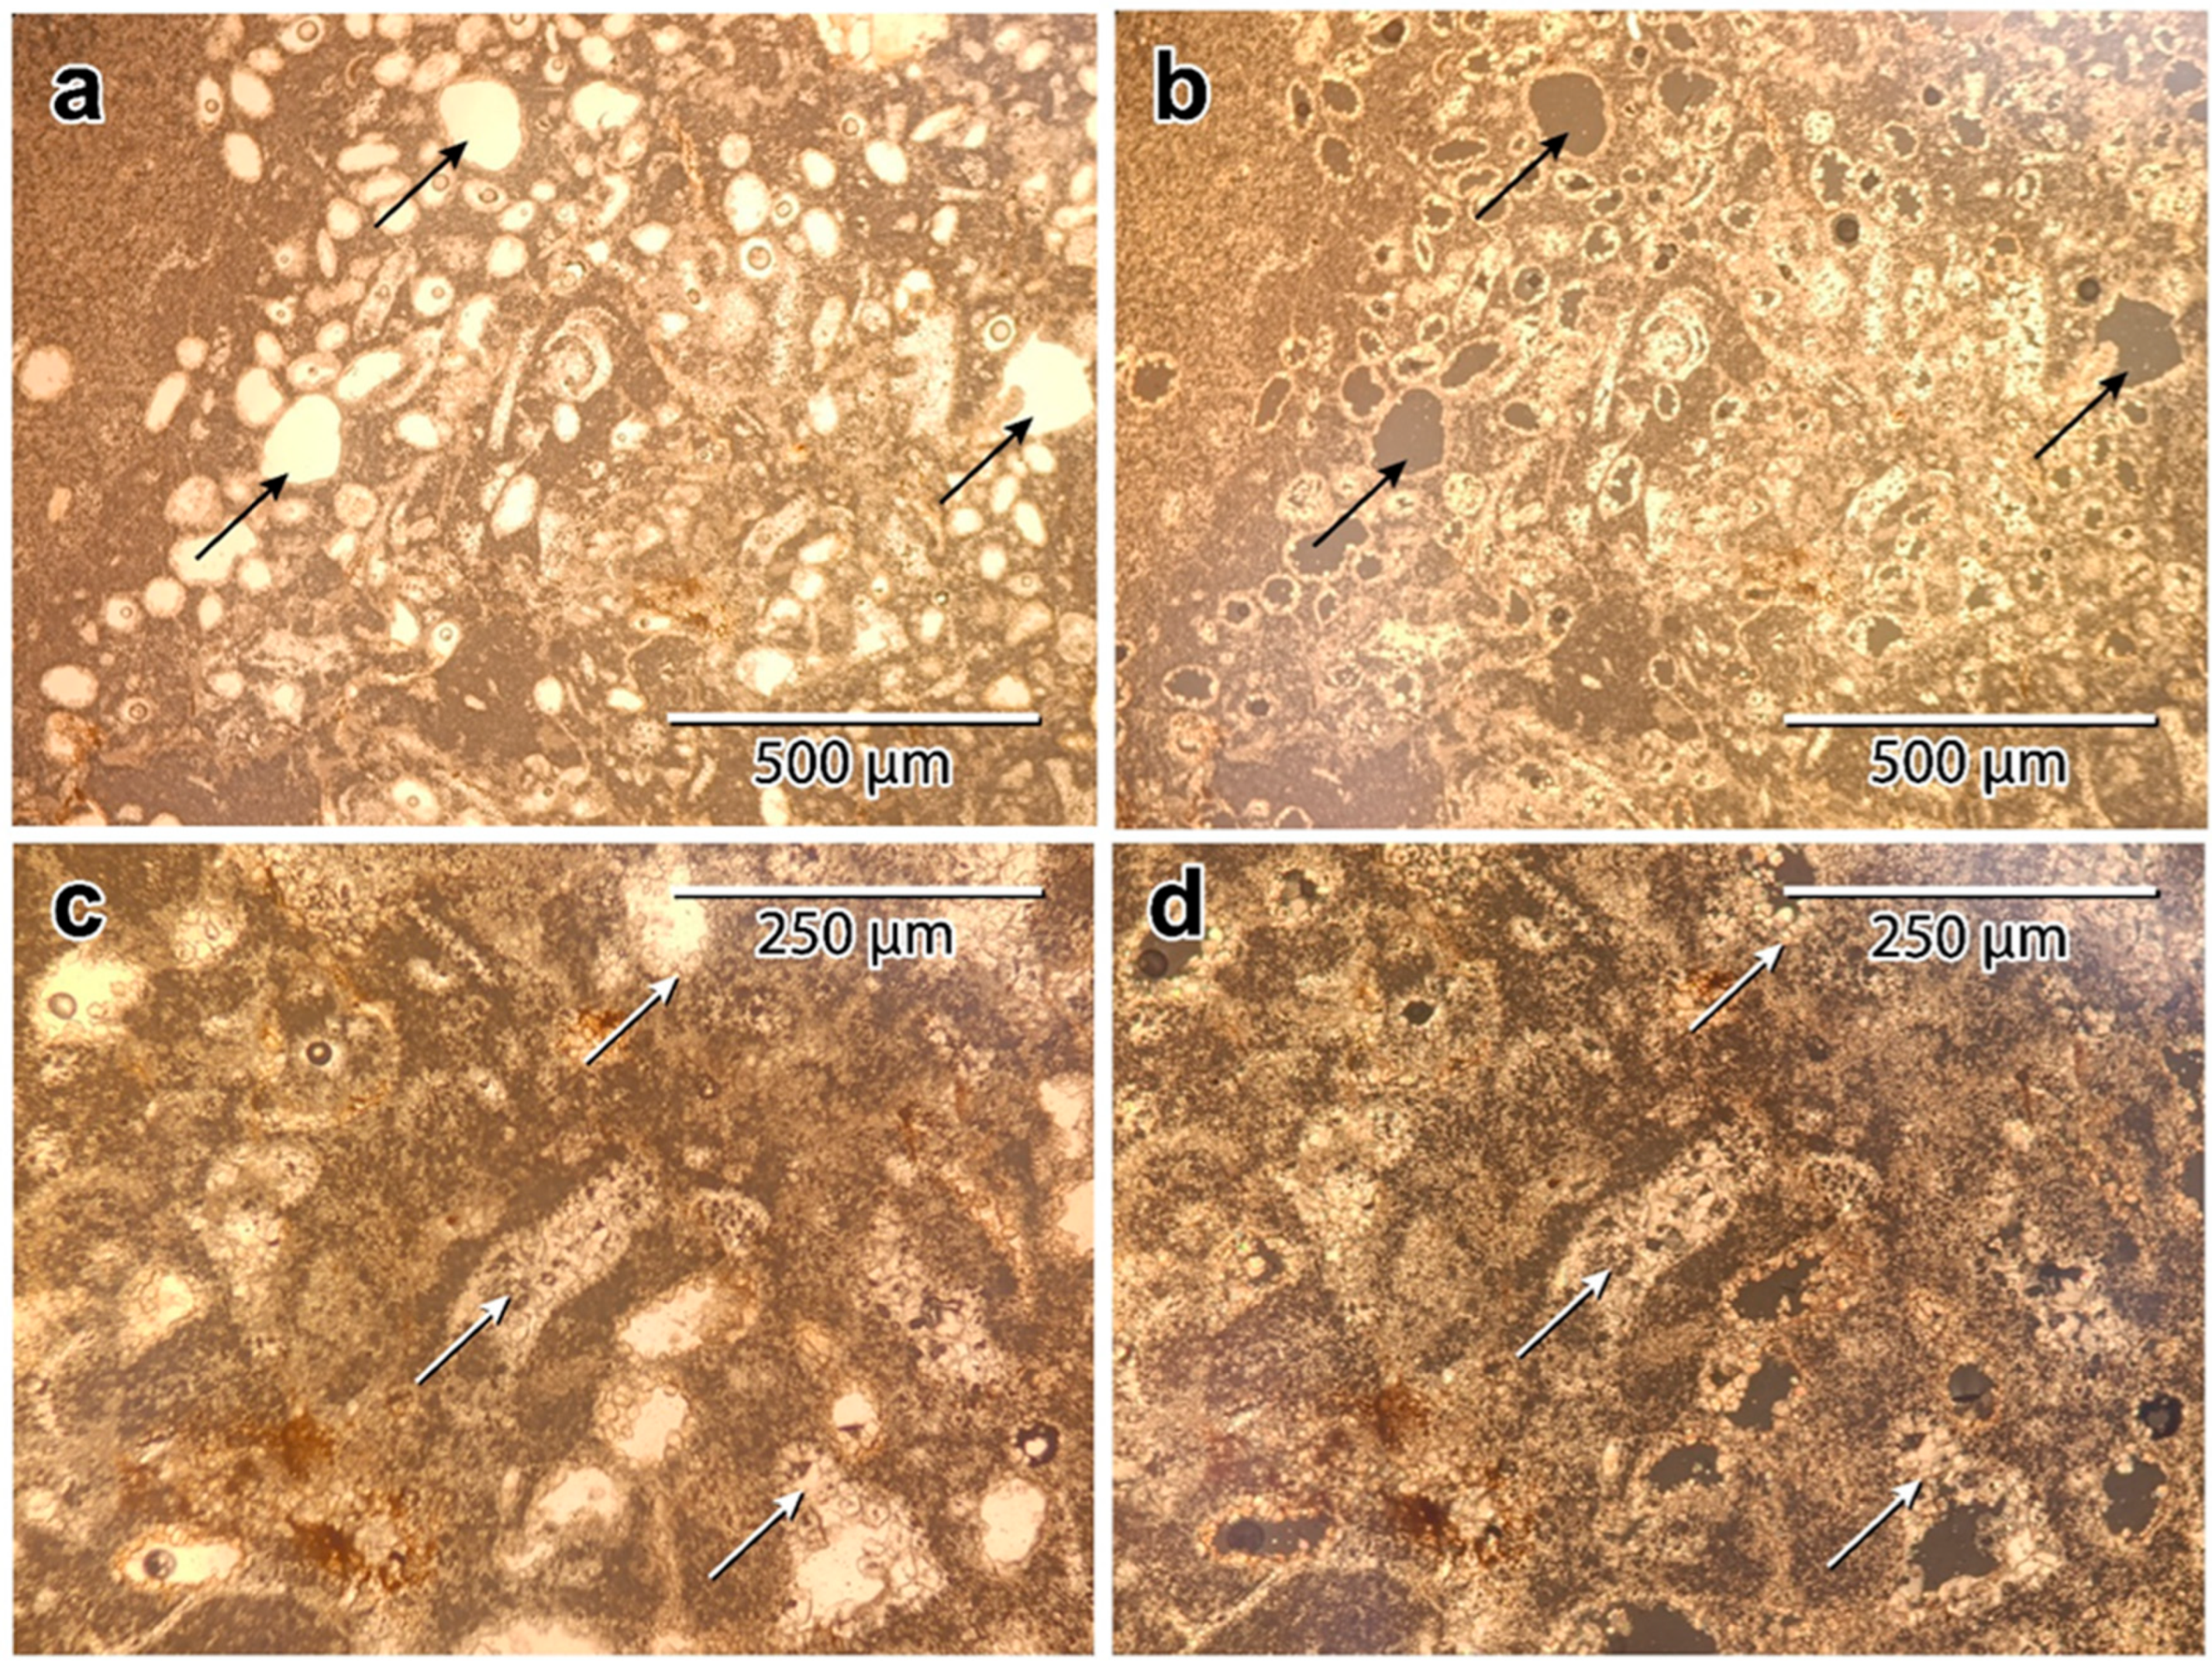
The measurement of the void fraction relies on preparing thin sections (typically 30 µm thick) impregnated with a coloured resin (commonly blue or red) that infiltrates the accessible pores. After preparation, digital images are captured with an optical microscope at magnifications of roughly 25× and 200×, chosen according to the anticipated pore size [30,31] (Figure 3). Subsequent digital-image analysis with specialized software segments the resin-filled and matrix regions using colour or intensity thresholds, thereby enabling automatic quantification of the visible porosity [32].
The range of pores that can be detected by optical microscopy depends chiefly on the system’s optical resolution and the pixel size of the digital camera used. In general, the technique can discern pores larger than ~1 µm, although high-resolution cameras can extend reliable detection down to the 0.5–1 µm interval [31]. Pores smaller than this range are not visible because of the inherent limits imposed by the wavelength of light and optical resolution, one of the main drawbacks of optical microscopy when compared with electron-based techniques [33].
SEM
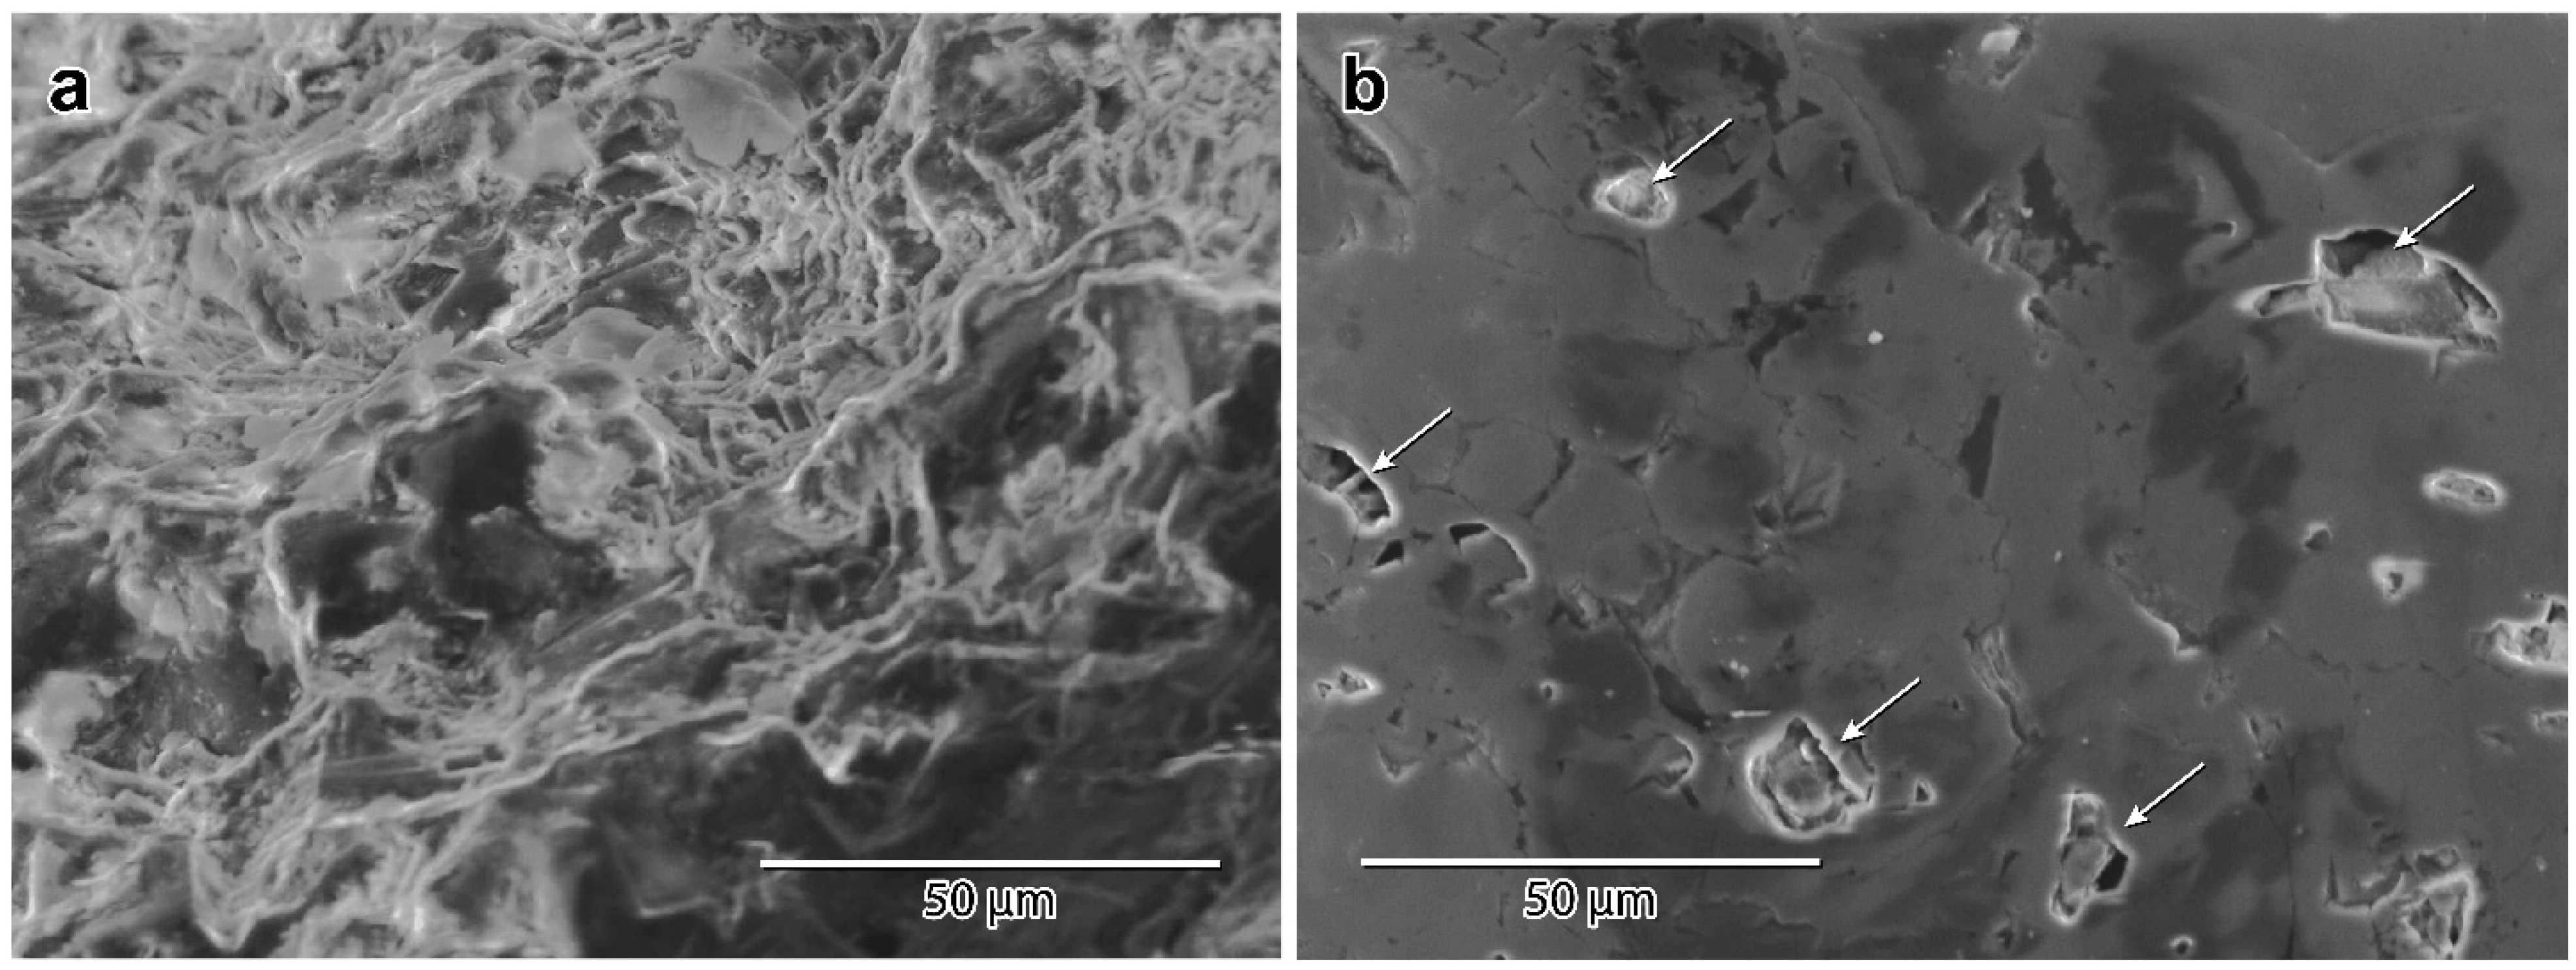
Scanning electron microscopy (SEM) operated in backscattered-electron (BSE) mode is widely employed for microstructural characterization and porosity quantification in solid materials. For porosity analysis, the technique permits measurement of the visible void fraction on a resin-impregnated polished section, yielding high-resolution two-dimensional images in which solid phases and voids display distinct grey levels because of their differences in atomic number and electron density [34] (Figure 4). Pores filled with epoxy resin appear as dark regions in the BSE images, whereas the solid matrix shows up in lighter tones.
Void-fraction quantification is carried out through a workflow comprising proper specimen preparation, image acquisition under controlled conditions, grey-level calibration, and digital-image segmentation [35]. Preparation involves vacuum impregnation of the sample with a low-atomic-number resin, subsequent cutting and polishing of the section, and deposition of a conductive coating (carbon or gold). Images are then typically acquired at accelerating voltages of 10–20 kV, at which the BSE contrast is sufficient to discriminate clearly between the matrix and the voids [34].
Image segmentation is a critical step for accurate quantification. Whereas early studies relied on simple approaches such as manual thresholding or the “overflow” method [33], recent work has shown that automatic routines based on type-II regression or adaptive thresholds markedly improve reproducibility and minimize operator bias [36]. These algorithms determine, in a robust fashion, the grey-level values that separate the impregnating resin from the solid matrix, even in highly heterogeneous materials.
The SEM/BSE technique can detect pores roughly from 0.05 µm up to several hundred micrometres, depending on the microscope’s resolution and the pixel size of the acquired image [34]. Pores smaller than the pixel dimension are not resolved directly, but their presence can be inferred from a reduction in the matrix’s mean grey level, so-called “sub-pixel” porosity [35]. To identify pores below 0.05 µm or to characterize the three-dimensional connectivity of the pore network, it is necessary to combine SEM/BSE with complementary methods such as micro-CT tomography or mercury intrusion porosimetry (MIP) [37].
Among the chief strengths of this technique are its high spatial resolution, the potential for fully automated analysis via image-processing software, and the generation of local porosity-distribution maps, which make it possible to evaluate the material’s microstructural heterogeneity [38]. It also yields quantitative information on the shape, size, and orientation of individual pores, parameters that are essential for modelling fluid transport or predicting the material’s mechanical properties [36].
Nevertheless, the technique has several important limitations. First, it yields only two-dimensional measurements and therefore provides no direct information on the three-dimensional connectivity of the pore network or on closed pores that do not intersect the analyzed surface [34]. Second, the quantitative results are highly sensitive to SEM operating parameters, such as accelerating voltage, beam current, and magnification level, which can alter image contrast by as much as ±30% if not properly controlled [35]. Finally, specimen preparation is critical: polishing defects, incomplete resin impregnation, or coating artefacts can introduce significant errors.
Although no dedicated ISO or ASTM standard currently exists for porosity quantification by SEM/BSE, widely accepted best practices nonetheless include prior grey-level calibration, the validation of the segmentation through automated statistical methods, and cross-comparison with complementary techniques when warranted [37]. Recent studies have standardized the use of type-II regression alongside calibrated automatic segmentations, thereby providing this methodology with greater objectivity and robustness [36].
In conclusion, SEM operated in BSE mode on resin-impregnated polished sections is a robust and versatile technique for quantifying visible porosity in solid materials, covering pore sizes from tens of nanometres to hundreds of micrometres. Its effective application requires meticulous specimen preparation, tightly controlled acquisition parameters, and calibrated automated segmentation, making it particularly valuable for characterizing heterogeneous materials such as cements, rocks, ceramics, and fibre-reinforced polymers.
Among the advantages of optical microscopy are its accessibility, comparatively low cost, rapid sample preparation, and the ability to combine porosity analysis with mineral identification under cross-polarized light [30]. It also allows statistical examination of large areas through mosaic imaging or automated scanning [31]. This technique is especially useful for heterogeneous materials such as rocks, mortars, cements, and traditional ceramics.
Nevertheless, the method has several key limitations. Because it is intrinsically two-dimensional, it cannot evaluate the three-dimensional connectivity of the pore network, nor can it detect closed pores that do not intersect the section surface [32]. Segmentation quality may also be affected by chromatic variability within the mineral matrix and by polishing artefacts or incomplete impregnation. Moreover, its spatial resolution is lower than that of electron microscopy, which limits its use in the analysis of micro- and nanopores [39].
With respect to standardization, the methodology for petrographic analysis is set out in documents such as ASTM C1721-22 [40] and in practical guides like the ISRM Suggested Methods [32]. These references describe the procedures for preparing thin sections, impregnating them with coloured resin, and the principles of quantitative assessment, whether by point counting or digital image analysis.
In conclusion, optical microscopy applied to resin-impregnated thin sections is an effective and robust technique for two-dimensional quantification of visible porosity in the micrometre range. Its value lies in its accessibility, ease of implementation, and capacity to integrate porosimetric characterization with mineralogical petrographic analysis. Nevertheless, for the investigation of finer pores or full three-dimensional characterization, it should be supplemented with higher-resolution methods such as SEM/BSE or X-ray micro-computed tomography.
In conclusion, optical microscopy applied to resin-impregnated thin sections is an effective and robust technique for two-dimensional quantification of visible porosity in the micrometre range. Its value lies in its accessibility, ease of implementation, and capacity to integrate porosimetric characterization with mineralogical petrographic analysis. Nevertheless, for the investigation of finer pores or full three-dimensional characterization, it should be supplemented with higher-resolution methods such as SEM/BSE or X ray micro computed tomography.
Focused Ion Beam–SEM (FIB-SEM)
Focused Ion Beam–SEM (FIB-SEM) combines an ion beam with electron microscopy to achieve in situ serial sectioning and imaging of stone samples at the nanometre scale. This technique bridges the resolution gap between micro-CT and TEM tomography. In FIB-SEM tomography, a focused ion beam progressively mills away thin slices of the sample, while the SEM column captures images of each newly exposed surface, yielding a 3D reconstruction of the stone’s internal microstructure. Liu et al. [41] demonstrated the power of FIB-SEM on geological materials by imaging a highly porous diatomite and an experimentally reacted olivine, reconstructing their pore networks in 3D with a resolution of just a few nanometers. This methodological study highlighted key processing steps (image alignment, artefact correction, segmentation) needed to quantitatively analyze stone pore architecture via FIB-SEM. In applied research on engineered stone, FIB-SEM has proven invaluable for characterizing interfaces and degradation. For instance, Schmid et al. [42] used FIB-SEM nanotomography to examine the steel–concrete interface in reinforced concrete, resolving capillary pores ~30–50 nm in size that influence moisture and ion transport. Their 3D FIB-SEM images, segmented into solid and void phases, revealed pore connectivity and anisotropy in the interfacial transition zone, information critical for modelling corrosion processes. These examples show that FIB-SEM provides an unprecedented look at stone microstructures (natural or artificial) at the nano- to microscale, capturing features like nanopores, mineral interfaces, and microcracks that are beyond the reach of traditional SEM or micro-CT.
X-Ray Micro-Computed Tomography (Micro-CT)
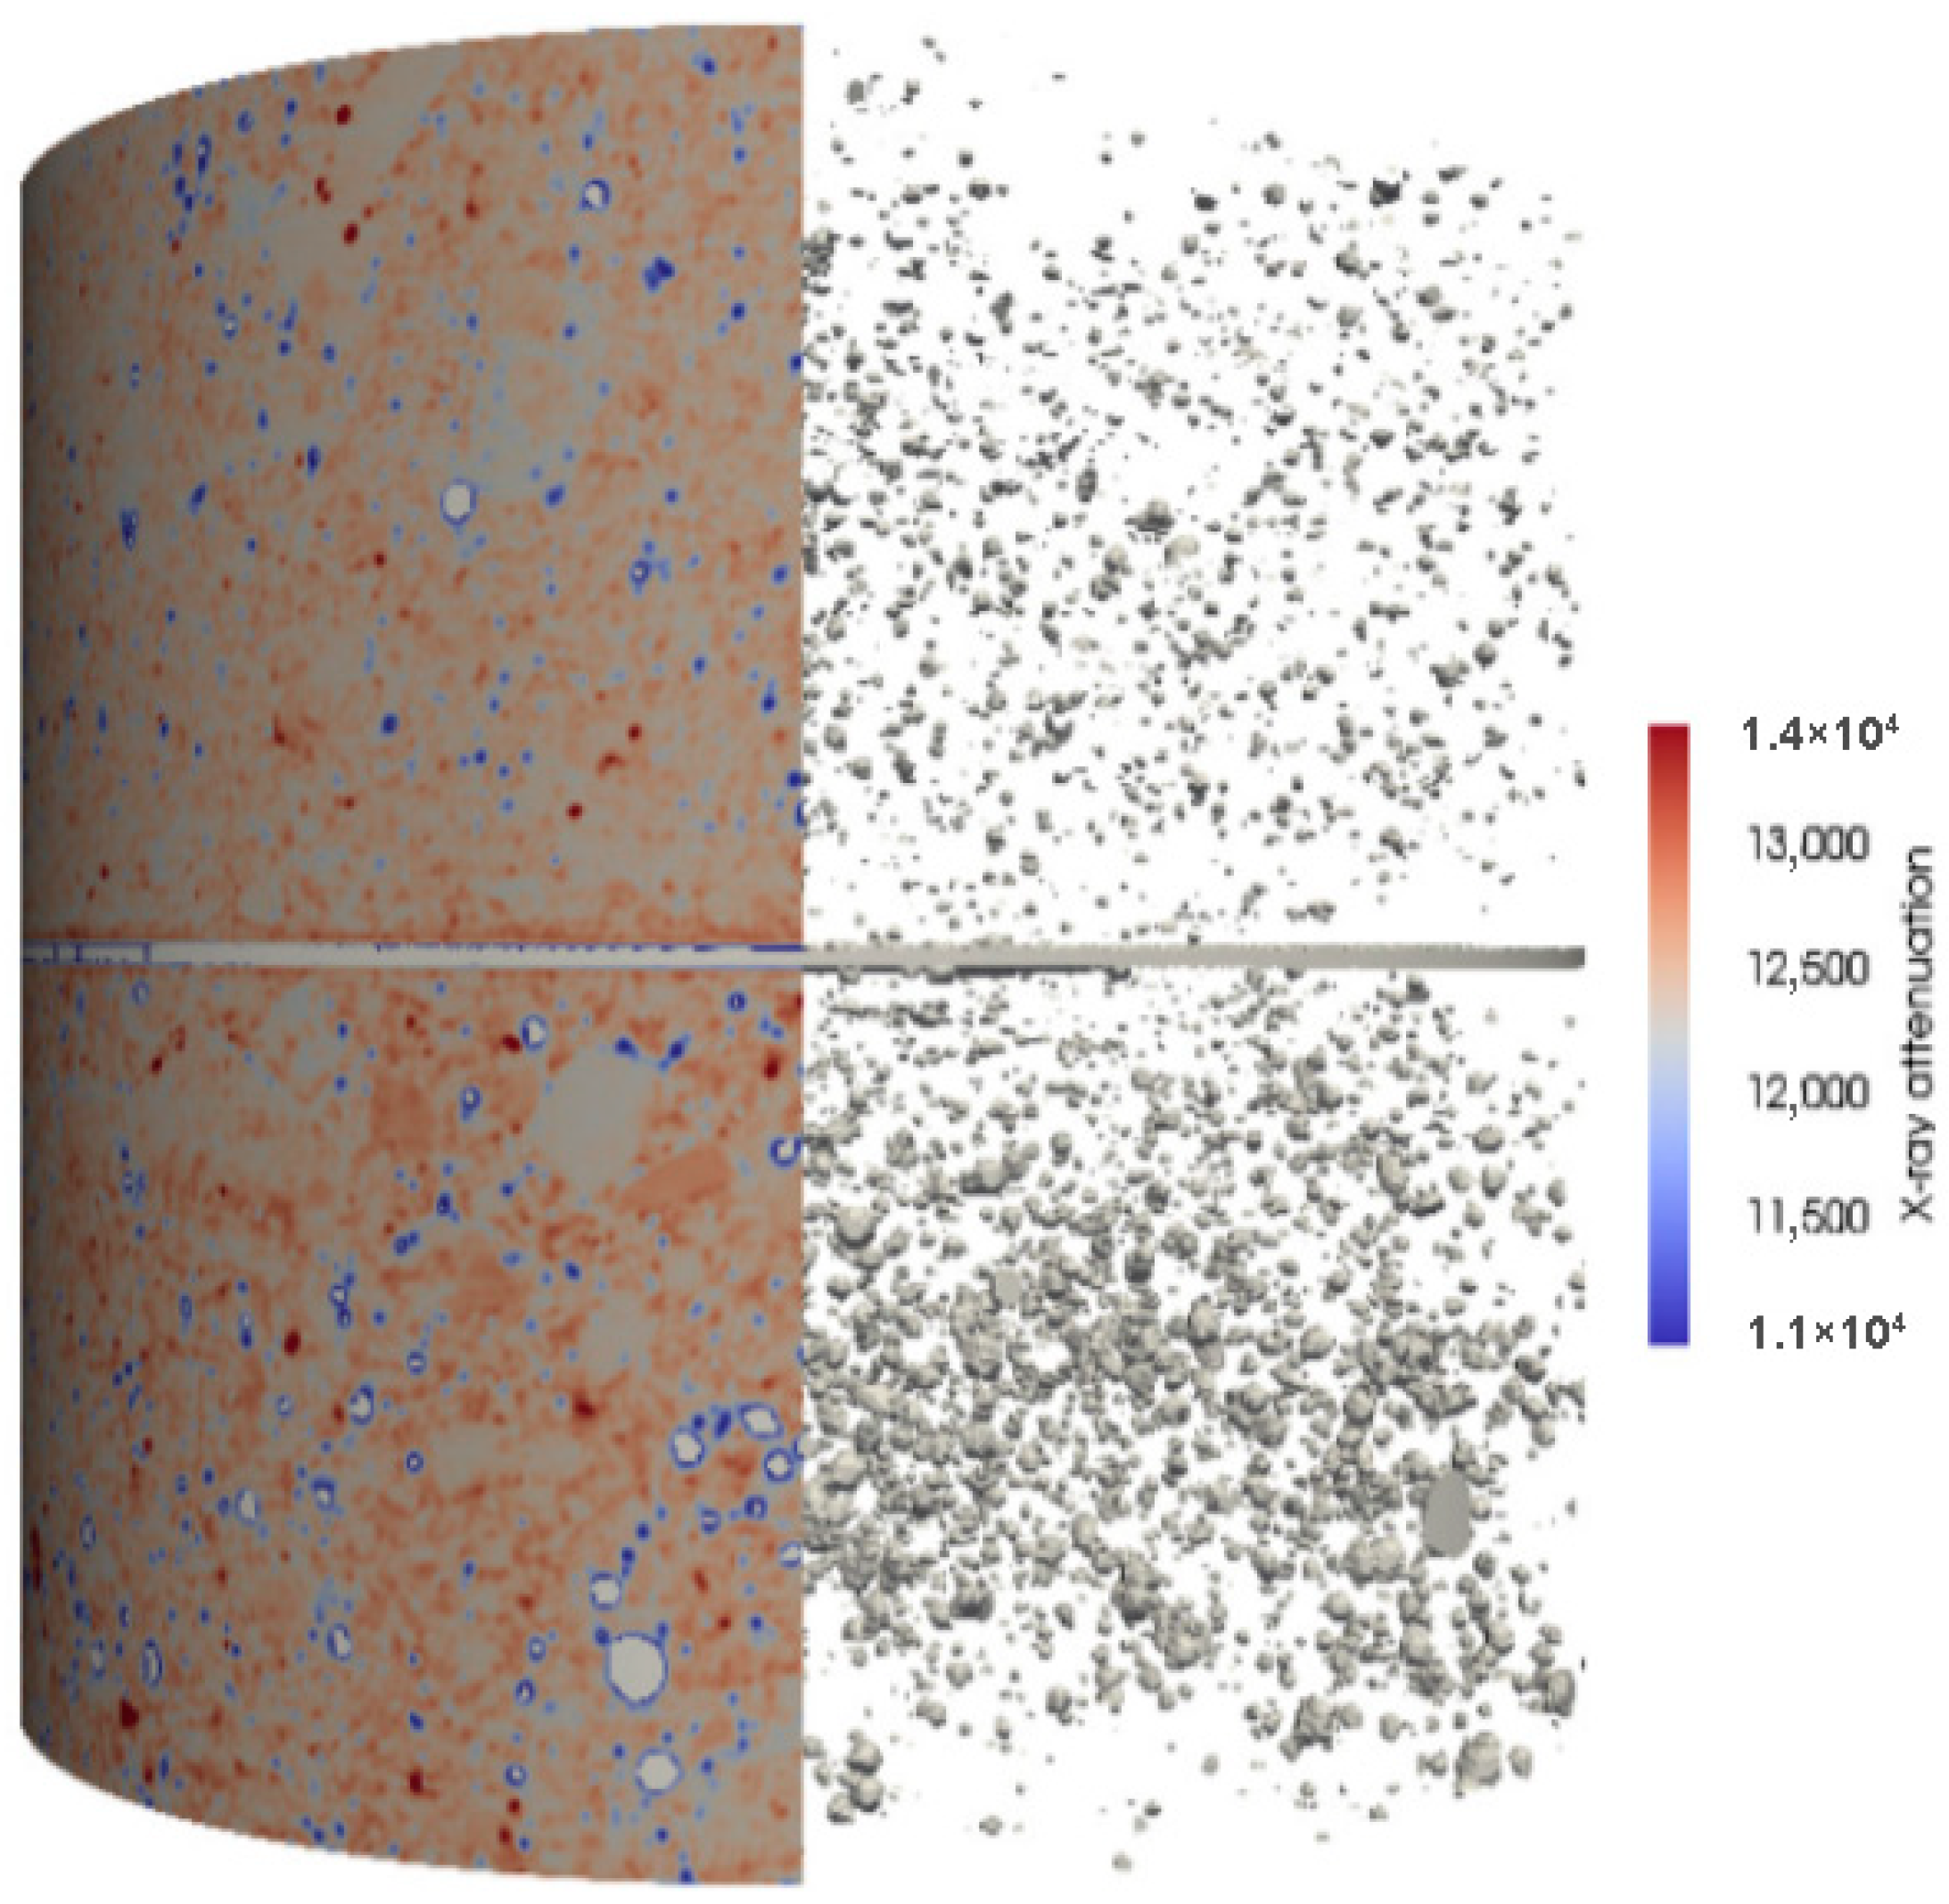
X-ray micro-CT is a non-destructive 3D imaging technique that has revolutionized the analysis of stone materials by revealing internal structures such as pores, cracks, and inclusions in three dimensions. In micro-CT, hundreds to thousands of X-ray projections are acquired around the sample and computationally reconstructed into a volumetric image, where each voxel’s grayscale corresponds to material density. The result is a high-resolution 3D model of the stone’s interior, often with voxel sizes on the order of a few microns (and even sub-micron with synchrotron-based CT). Reedy and Reedy [43] recently demonstrated a high-resolution micro-CT workflow for historic brick materials, optimizing scan parameters and 3D image analysis protocols to characterize pore networks in weathered bricks. By scanning small samples for improved resolution and using image segmentation (assisted by machine learning) to distinguish voids from matrix, they quantified key pore metrics, such as pore volume fraction, connectivity, size distribution, and accessibility, which govern the durability of the brick. Such methodological advances underscore micro-CT’s value in conservation science for assessing deterioration and treatment efficacy. In parallel, micro-CT has been applied to in situ damage studies on natural stone. De Kock et al. [44] employed time-lapse micro-CT to monitor freeze–thaw cycling in a porous limestone, capturing the initiation and propagation of micro-fractures due to ice crystallization in real time. Their micro-CT observations showed a developing fracture network upon cooling to sub-freezing temperatures, with cracks forming along preferential water uptake pathways in the rock. This experiment, conducted at an 80 s temporal resolution, highlighted how continuous 3D imaging can provide insight into deterioration mechanisms like frost damage that were previously inferred only post-mortem. From pore structure characterization to in situ weathering experiments, micro-CT has become an essential tool in stone research, allowing scientists and engineers to virtually “slice” through stone and extract quantitative data on its internal features without destroying valuable samples.
Confocal Laser Scanning Microscopy (CLSM)
Confocal Laser Scanning Microscopy is an optical imaging technique that has emerged as a powerful complementary tool for 3D surface and microstructure analysis of stone materials. In cultural heritage diagnostics, confocal microscopy is valued as an in-depth morphometric method, enabling three-dimensional reconstruction of a stone sample’s surface or near-surface features with micrometre resolution. By focusing a laser and detecting only in-focus reflected or fluorescent light, CLSM optically “slices” the sample, producing a stack of images that can be rendered into a 3D model of surface topography or internal structures in translucent sections. One key application is the visualization of porosity and crack networks using fluorescent dyes. For example, researchers have impregnated stone or mortar samples with fluorescently tagged resins and then used confocal imaging to map the 3D pore structure and micro-cracks. This approach was pioneered in studies of cement paste and marble, where pores and micro-fractures down to ~0.2 µm were imaged by filling them with fluorescent epoxy and optically sectioning the material. A recent advancement by Hassan et al. [45] combined fluorescent pore casting with CLSM to characterize microporosity in a tight carbonate rock. In their method, the stone’s pore space is first saturated with epoxy resin mixed with fluorophores and cured. The bulk rock is then dissolved (acid-etched) to leave behind a free-standing fluorescent cast of the pore network, which can be imaged in 3D by confocal microscopy with excellent contrast. By comparing confocal images before and after etching and cross-validating with micro-CT, they confirmed that the high-resolution CLSM visualization of the pore cast accurately represented the original pore structure (Figure 5).
CLSM has also seen applied use in monitoring surface weathering and treatment penetration. In stone conservation research, confocal imaging in reflectance mode has been used to measure surface roughness changes due to salt crystallization or bio-colonization, and in fluorescence mode to track the depth penetration of consolidants labelled with fluorescent markers. While the penetration depth of confocal optics in stone is limited (on the order of tens of microns for opaque rocks), its ability to provide true 3D data at the microscale—without physical sectioning—makes it a unique and valuable technique for stone material analysis, especially when used in tandem with other methods like SEM or micro-CT.
Deep Learning-Assisted Segmentation
The proliferation of high-resolution imaging techniques for stone materials has led to a deluge of complex 2D and 3D data, and deep learning methods are increasingly being employed to interpret these images. Deep learning-assisted segmentation refers to using convolutional neural networks (CNNs) and other machine learning models to automatically identify and label features (phases) in images, for example, differentiating pore space from solid matrix in a micro-CT scan of stone, or segmenting mineral phases in a petrographic image. Traditional segmentation techniques (thresholding, region-growing, etc.) often require significant user input and struggle with image noise and artefact variation. In contrast, CNN-based segmentation can learn to recognize intricate textural features and produce consistent, unbiased results. Phan et al. [46] developed a deep learning tool to fully automate segmentation of 3D micro-CT images of rocks, training a U-ResNet–based network on diverse sandstone and carbonate datasets. The resulting model was robust against typical micro-CT noise/artefacts and outperformed even expert users in accurately partitioning void and solid phases. By eliminating the need for manual pre-processing (like filtering) and reducing operator bias, such deep learning approaches greatly accelerate the analysis pipeline while improving reproducibility. The benefits have been demonstrated quantitatively: Niu et al. [47] showed that a CNN-trained segmentation of sandstone micro-CT images yielded pore size distributions and permeability estimates with far less variance than those from traditional semi-automatic thresholding methods. In their study, the CNN was trained using “ground-truth” labels derived from pairing micro-CT slices with higher-resolution SEM images, allowing it to learn features of grain and pore that generalize across samples. The CNN-segmented datasets produced consistent porosity and permeability values, whereas user-dependent thresholding led to a wide spread of results. Deep learning segmentation is not limited to binary pore mapping; recent work has applied multi-class CNN models (e.g., U-Net variants) to distinguish mineralogical components in petrographic images and even to super-resolve coarse X-ray images of concrete or stone by inferring fine textures lost to imaging limits. As an example, relevant to engineered stone, researchers have trained CNNs to segment 2D micrographs of concrete into aggregate, cement paste, and air voids, enabling automated quantitative analysis of phase fractions and crack propagation. Overall, the integration of deep learning into stone imaging markedly enhances our ability to extract meaningful information from complex datasets—whether it is identifying micro-cracks in a weathered sculpture via digital photographs or computing the pore network topology of a building stone from 3D tomography. This data-driven revolution allows for more rigorous comparisons and modelling of material degradation, and it is quickly becoming part of the standard toolkit in materials science and geoscience research on stone materials.
Each technique varies in resolution, sample size, destructiveness, and dimensionality, making them best used combined to achieve a multiscale, deep understanding of stone pore structures. Main characteristics, strengths, and limitations of the described techniques are shown in Table 3.

2.3. Permeability (k)

Permeability is a physical property intrinsic to porous media that quantifies the ease with which a fluid (liquid or gas) can move through the material’s pore network under an applied pressure gradient [10]. Mathematically, it is defined based on Darcy’s law (Equation (7)):
Q = k A μ P L
Equation (7) Darcy’s law, where
Q—volumetric flow rate;
k—proportionality constant;
A—area of the cross-section;
µ—viscosity of the fluid;
ΔP—pressure drop;
L—flow length.
Intrinsic permeability depends solely on the geometry and connectivity of the pore system (size, shape, tortuosity) and is expressed in units of area (m2 or darcies) [11]. Hydraulic permeability, or the coefficient of permeability, additionally incorporates fluid properties (density and viscosity) and is usually reported in m∙s−1.
Critical percolation thresholds:
The permeability (k) of a porous medium remains essentially zero (k ≤ 10–20 m2) until the fraction of interconnected pores exceeds the percolation threshold. In porous-media mechanics, the percolation value (or percolation threshold) is the minimum volume fraction (or probability) of effectively interconnected pores that first allows the existence of an “infinite cluster”: a continuous network that spans the entire material and provides a hydraulically viable pathway between the two opposite faces of the specimen.
In very-low-porosity rocks (compact sandstones, massive basalts, intact granites) the threshold is reached at a connected porosity of ≈2–3%; below this value, pores form isolated domains and flow is negligible. Once it is exceeded, an infinite percolating cluster forms and k increases by several orders of magnitude.
In cementitious matrices, the transition is observed when the continuous capillary porosity reaches ~18–20 vol% or, equivalently, when the pore-entry radius of the narrowest constriction exceeds the critical pore entry radius of 120–300 nm (Katz–Thompson criterion). Beyond the percolation threshold, the dependence given in Equation ( k a 2 ( ϕ ϕ c ) m captures the steep (near-exponential) rise in permeability, so that slight variations in connectivity, caused, for example, by microcracking or desaturation, can change k by 2–3 orders of magnitude, which explains the abrupt response to the ingress of water, chlorides, or CO2.

2.4. Tortuosity, Capillary Suction, and the Mechanisms Governing Fluid Transport in Porous Media

2.4.1. Tortuosity

Tortuosity (τ) is a dimensionless parameter defined as the ratio of the actual path length traversed by a fluid or solute within a porous network to the straight-line distance between the same two points (Equation (8)). Therefore, high tortuosity signifies more convoluted pathways and correspondingly greater resistance to flow or diffusion through the porous medium.
τ = L a c t u a l L g e o m   ( τ 1 )
Equation (8) Mathematical expression for determining tortuosity, where
τ—Tortuosity, a dimensionless coefficient measuring the elongation of internal pathways relative to the straight-line distance;
Lactual—The effective length traversed by the fluid within the porous network as it follows its sinuous path. It is obtained by integrating the actual trajectory over the entire porous medium;
Lgeom—Euclidean (straight-line) distance between the specified entry and exit points.
Relationship with permeability:
Intrinsic permeability (k), defined as the capacity of a porous medium to allow fluid transmission under a pressure gradient, depends not only on effective porosity (n) and pore size but also significantly on the geometric connectivity of the pore network. Classical formulations, such as the Carman–Kozeny model (Equation (9)), explicitly incorporate tortuosity to account for these geometric complexities
k = n e 3 C τ 2 S v 2
Equation (9) Carman–Kozeny model, where
k—Intrinsic permeability;
ne—Effective (or connected) porosity;
τ—Tortuosity;
Sv—Specific surface area (internal pore surface area per unit volume of solid). It represents the frictional resistance offered by the pore walls;
C—Kozeny factor (an empirical constant encompassing the shape and distribution of the pores).
An increase in tortuosity (τ) implies longer and/or more convoluted fluid flow paths, resulting in elevated frictional head losses. Consequently, intrinsic permeability (k) decreases approximately in inverse proportion to the square of tortuosity (τ2).
High tortuosity values indicate labyrinthine porous networks characterized by bottlenecks and microcracks.
In practice, measuring tortuosity offers a more sensitive metric than total porosity for predicting ionic diffusion, sorptivity, and service life under chemical attack.
Techniques such as 3D µ-CT tomography, NMR spin-relaxation, and inverse fitting of diffusion tests enable the estimation of tortuosity with micrometre-scale resolution, thereby strengthening multiscale durability models for heritage stones, concretes, and mortars.
Some authors distinguish between geometric tortuosity, which measures the effective path length, and diffusive or hydraulic tortuosity, related to the effective transport coefficient. In homogeneous media under laminar flow, they coincide, but they diverge when pore throats or wall-adsorption phenomena are present.

2.4.2. Capillary Suction

Capillary suction refers to the negative pressure, relative to atmospheric pressure, generated within the pores of a material when a liquid wets the pore walls. This phenomenon arises from the curvature of the liquid meniscus, creating a force that draws fluid into the porous structure. The magnitude of capillary suction increases as the radius of curvature decreases; consequently, smaller pores induce greater suction forces compared to larger pores. This relationship is quantitatively described by the Laplace–Washburn equation (Equation (10)):
P c = 2 γ c o s θ r
Equation (10) Laplace–Washburn equation, where
γ—It is the surface tension of the fluid;
θ—It is the contact angle with the porous wall;
r—It is the pore’s hydraulic radius.
This pressure, inherent to porous media, serves as the driving force for liquid absorption and capillary rise, controls the degree of saturation, and governs key transport phenomena, including sorptivity and ionic (salt) migration.

2.4.3. Mechanisms of Fluid Transport in Porous Media

These mechanisms constitute the physical processes governing the movement of liquids or gases within the pore network. Fundamentally, they can be categorized as follows:
Advection
The transport mechanism by which a fluid is conveyed in bulk through a porous medium under the action of a hydraulic potential gradient, comprising piezometric pressure and gravitational head, is governed by Darcy’s law in terms of its volumetric flow (Equation (11)):
q = k µ H
Equation (11) Darcy’s law, where
q—It is the discharge vector (m·s−1);
k—It is the intrinsic permeability (m2);
µ—It denotes the dynamic viscosity of the fluid, expressed in pascal-seconds (Pa·s);
H—Hydraulic potential (m).
Unlike diffusion, advection transports mass at the average velocity of the fluid flow. In most rocks, concretes, and soils, advective transport typically occurs under laminar flow conditions (Re ≪ 1), and its magnitude is directly proportional to the intrinsic permeability (k) and the hydraulic gradient (∇H).
Diffusion
Diffusion is the transport mechanism whereby molecules or ions migrate through a porous medium driven exclusively by concentration gradients, or, equivalently, gradients in chemical potential from a thermodynamic standpoint, in the absence of bulk fluid movement. The corresponding diffusive mass flux is quantitatively expressed by Fick’s law (Equation (12)):
J d i f = D e C
Equation (12) Fick’s law, where
Jdif—It is the diffusive flux (mol·m−2·s−1);
De—Effective diffusion coefficient;
C—Concentration.
Unlike advection, diffusion transports mass at velocities on the order of micrometres per second and dominates when pressure gradients are null or permeability is very low.
Dispersion
Dispersion is a transport mechanism that arises from the combined effects of advection (mean fluid flow), molecular diffusion, and local velocity variations induced by the heterogeneity of the pore structure. It results in a spreading of the concentration front that surpasses the extent predicted by molecular diffusion alone.
Capillary Flow
Capillary flow refers to the movement of a liquid within a porous medium driven by capillary pressure gradients (suction), which originate from the curvature of the liquid–air meniscus. This type of flow is transient in nature and is characteristic of partially saturated porous media.
Osmosis and Electro-Osmosis
Osmosis and electro-osmosis are coupled transport mechanisms governed by physicochemical interactions between the fluid, dissolved species, and pore surfaces. Unlike advective flow, these processes do not require a hydraulic pressure gradient; their driving force is primarily chemical and electrical in nature. In dense cementitious materials and expansive clays, the combination of high tortuosity, low intrinsic permeability (k), and electrically charged pore surfaces causes osmosis and electro-osmosis to dominate fluid migration, often surpassing classical Darcy-type advection.
The relative contribution of each transport mechanism varies as a function of porosity, tortuosity, degree of saturation, and fluid properties. These factors collectively govern the permeability and mass transfer behaviour of the porous medium.

2.5. Principal Techniques for Measuring the Permeability of Porous Materials (Rocks, Mortars, and Concrete)

2.5.1. Permeability Determination Under Steady-State Flow Conditions (Darcy’s Law)

The group of methods that rely on Darcy’s law (1856) for permeability assessment measure the volumetric flow rate in steady-state conditions. One of the most commonly used approaches is nitrogen-gas permeability testing that exploits the Klinkenberg effect. A nitrogen permeameter with Klinkenberg correction provides rapid measurements, high sensitivity, and thermodynamic precision. Accordingly, when the goal is to determine the intrinsic permeability of dense materials without altering their microstructure, it remains among the most effective and reliable techniques [48,49].
Because nitrogen behaves as a compressible fluid, Darcy’s law for gases, under steady-state, laminar flow, and isothermal conditions, can be written as Equation (13):
k N 2 =   µ N 2 · Q N 2 · L · p a t m A · p · p m
Equation (13) Darcy’s law for gases, where
k N 2 —permeability to N2 at a given mean pressure, in darcies (D);
µ N 2 —dynamic viscosity of N2, in centipoise (cP);
Q N 2 —volumetric N2 flow rate, in cubic centimetres per second (cm3 s−1);
L —length of the cylindrical specimen, in centimetres (cm);
p a t m —atmospheric (reference) pressure, in atmospheres (atm);
A —cross-sectional area of the cylinder, in square centimetres (cm2);
p —pressure differential along the cylinder, in atmospheres (atm);
p m —mean pressure, in atmospheres (atm).
Gas permeability measured at different pressures exceeds the corresponding liquid permeability and decreases as the mean pressure rises owing to the Klinkenberg effect: gases, with their lower viscosity and molecular size, experience “slip flow” along fine pore walls, especially at low pressures. Applying the Klinkenberg correction yields the equivalent permeability (k), which matches the liquid permeability [50,51]. This experimentally straightforward laboratory procedure allows the liquid permeability of dense rocks to be estimated with high precision [52].
ISO 4022:2018 [53]. Permeable Sintered Metal Materials. Determination of Fluid Permeability sets out the universal test method for porous materials (sintered metals) using compressed gases. Likewise, API RP 40 [54] (2nd ed., 1998)—Recommended Practices for Core Analysis, Chapter 6 “Permeability Determination” supplies linearity criteria and statistical validation procedures. Finally, the RILEM TC 116-PCD/CEMBUREAU method (1999), Gas Permeability of Concrete Specimens employs O2 and N2 at 2–100 kPa, specifies pre-drying and axial sealing, and adopts a linear fit of kap versus 1/p to remove gas slippage. It is widely cited in concrete durability studies [55].
At present, European construction standards lack a harmonized method that explicitly applies the Klinkenberg correction with nitrogen (there is no dedicated UNE/EN standard). Laboratories therefore tend to follow the RILEM protocol for concrete or ISO 4022/API RP 40 for rocks and other low-permeability materials.
Among the limitations of this technique, it should be emphasized that the linear fit adopted as the initial theoretical assumption, kap = k(1 + b/p), assumes slip-controlled laminar flow through uniform cylindrical pores. In materials with micro-cracks, dual porosity, or non-Darcy (Forchheimer) behaviour, the putatively linear relationship becomes curved. Moreover, many laboratory permeameters lack sufficient resolution for ultra-low permeabilities (<10−18 m2). The method further requires fully dry specimens, because it is moisture-sensitive (nitrogen exhibits less slip in partially saturated pores).
Tanikawa et al. [56], working with sandstone and shale core plugs, compared nitrogen permeability corrected for the Klinkenberg effect against hydraulic (water) permeability, demonstrating that kgas can exceed kwater by up to an order of magnitude (i.e., by a factor of ten).
Shi et al. [57] worked with cement-based specimens, imposing a quasi-steady gas flow to determine permeability. The findings reveal that the intrinsic permeability of dry cementitious materials is modulated by the addition of limestone powder, fly ash, and aggregate. The Katz–Thompson equation can predict this permeability from capillary porosity, mean pore diameter, and pore tortuosity. In partially saturated cementitious matrices, intrinsic permeability declines as the degree of water saturation increases.
Gao et al. [58] focused on shales of the Carboniferous Hurleg Formation in the eastern Qaidam Basin. Gas permeability tests were conducted with helium and nitrogen, complemented by geochemical analyses and pore structure characterization. The slip behaviour of the gases in micro- and nanopores, together with permeability anisotropy, was examined. Helium permeability was found to be 1.81–3.56 times higher than that of nitrogen, with the disparity most pronounced at low pore pressures. This difference is ascribed to molecular-size contrasts and gas-slip effects. Whereas helium does not adsorb onto the matrix, nitrogen exhibits partial adsorption, inducing radial swelling during penetration. Horizontal permeability additionally exceeds the vertical component.
Ghanbarian et al. [59] adapted Doyen’s effective-medium approximation (EMA), originally formulated to estimate bulk electrical conductivity, b, and permeability in sandstones from rock images, to upscale b and k in tight-gas sandstones from the pore scale to the core-plug scale. Two characteristic pore sizes are first calculated: an effective hydraulic pore size and an effective electrical pore size, both derived from pore-throat size distributions determined by mercury intrusion capillary-pressure (MICP) curves and by throat connectivity. Electrical conductivity and permeability are then scaled from these characteristic sizes, together with tortuosity and porosity, assuming two alternative pore geometries: cylindrical and slit-shaped. A comparison of results for eighteen tight-gas sandstones indicates that the EMA predicts b and k more accurately when the pores are assumed to be cylindrical.
In summary, Darcy’s law-based gas permeametry with Klinkenberg correction remains a powerful and broadly applicable method for determining intrinsic permeability. Nevertheless, the above studies illustrate that its outcomes are influenced by several material-specific factors. For tight rocks, slip-flow causes gas-measured permeability (e.g., with N2) to appear up to an order of magnitude higher than liquid permeability, though applying the Klinkenberg correction reconciles this disparity and yields the true intrinsic value. In cementitious materials, permeability is modulated by mix composition (e.g., adding limestone powder or fly ash lowers pore connectivity) and drops sharply as the degree of pore water saturation increases (highlighting the need for fully dry specimens for gas testing). In nanoporous shales, the choice of gas and flow direction play a role: helium’s smaller, non-adsorbing molecules produce significantly higher apparent permeability than nitrogen at low pressures (roughly 1.8–3.6 times higher), and horizontal permeability tends to exceed vertical due to anisotropic pore structures (nitrogen also induces slight matrix swelling via adsorption). Furthermore, theoretical upscaling analyses indicate that predicting core-scale permeability and slip factors from pore size distributions is most accurate when assuming cylindrical pore geometry. Overall, while steady-state gas flow methods provide rapid, precise permeability measurements across diverse low-permeability materials, careful interpretation is required regarding slip-flow effects, pore structure heterogeneity, saturation levels, and flow regime deviations to ensure reliable comparisons and conclusions.

2.5.2. Classical Hydraulic Permeametry (Steady-State Flow with Water or Brine)

Classical hydraulic permeability is determined by fully saturating a cylindrical or prismatic specimen, sealing its lateral faces, and placing it in a cell where it is subjected to a known hydraulic-head gradient, either constant-head or falling-head, using water or brine. Once the outflow rate has stabilized (steady flow), the discharge Q, specimen length L, cross-sectional area A, and head (or pressure) difference Δh (ΔP) are recorded. After correcting the fluid viscosity for temperature, Darcy’s law is applied to obtain the intrinsic permeability k. In other words, the test quantifies how much water passes through the material under a known pressure and converts that measurement into a property intrinsic to the solid.
At present, five main standards are recognized for measuring permeability by classical hydraulic permeametry. All describe constant-head and/or falling-head variants that ultimately rely on Darcy’s law.
For soils, the relevant standard is UNE-EN ISO 17892-11:2020 ≡ ISO 17892-11:2019 [60], Geotechnical investigation and testing, laboratory testing of soil. Part 11: Permeability. Low-permeability soils and soft rocks are assessed with ASTM D5084-24 [61], Hydraulic Conductivity of Saturated Porous Materials Using a Flexible-Wall Permeameter. Granular soils follow ASTM D2434-68 (2020 reapproved) [62], Permeability of Granular Soils (Constant Head). Compacted materials, i.e., in situ treatable soils, are covered by ASTM D5856-15 (reinstated 2024) [63], Hydraulic Conductivity Using a Rigid-Wall Compaction-Mold Permeameter, while hardened concrete is evaluated under EN 12390-8:2019 [64], Depth of Penetration of Water under Pressure.
A major drawback of this method is its requirement for complete saturation, as even a single trapped air bubble can reduce k by a factor of 5 to 40 [65]. The technique is ill-suited to very-low-permeability materials: achieving steady state takes so long that constant-head testing becomes impracticable. Instrumental accuracy also degrades below roughly 0.01 m of head difference, while excessively large gradients may violate the laminar-flow assumption and induce non-Darcy behaviour [66].

2.5.3. Transient-Pressure Methods (Gas or Liquid)

In transient-pressure tests, the specimen, previously saturated, or dry when gas is used, is clamped between two chambers of known volume. An instantaneous initial pressure step, ΔP0, is imposed between the upstream and downstream reservoirs, after which the valves are closed, isolating the system. The subsequent pressure relaxation in both chambers is monitored, typically exhibiting a “mono-” or “bi-exponential” decline until equilibrium is attained [67]. By solving the diffusion equation for the specific boundary conditions and chamber volumes (Brace-type pulse–decay or Jones–Roszelle pressure–pulse configurations), the logarithmically fitted decay constant, τ, is linked to the intrinsic permeability. For gas testing, a Klinkenberg correction is applied at low mean pressures. Hence, without awaiting steady state, k can be determined within minutes or hours and under mild gradients, rendering the method ideal for ultra-low-permeability materials or for situations where only small sample volumes are available [68].
The recognized standards that frame transient-pressure techniques, pulse–decay, slug tests, borehole water pressure tests, and the like, are essentially the following: ASTM D4631-18, in situ Pressure Pulse Testing for Estimating Transmissivity and Storage Coefficient in Very-Low-Permeability Rocks. ASTM D4044/D4044M-15, Field Procedure for Slug Tests (Instantaneous Head Change) in Aquifers, together with the companion analytical methods ASTM D4104/D4104M-20 [69] (transmissivity in overdamped systems) and ASTM D5912-20 [70] (hydraulic conductivity in unconfined aquifers). ISO 22282 [71], Geohydraulic Testing, and API RP 40 (2nd ed., 1998), Recommended Practice for Core Analysis, whose Chapter 6 describes pulse–decay and other gas- or liquid-based transient permeability tests.
Pressure-transient testing is rapid and sample-efficient, yet it bears several limitations. First, the method loses sensitivity in comparatively permeable materials (≈10−13 m2 or higher), because the pressure pulse dissipates before the transducers can resolve its transient behaviour; when gas is used, further corrections must be applied for Klinkenberg slip and for gas storage within lines and chambers. Second, the analysis assumes one-dimensional diffusion in a homogeneous medium. Should the specimen contain fractures, permeability anisotropy, or undergo physicochemical changes during the test, such as desorption or clay swelling, the pressure–time response typically becomes multi-exponential, and the derived permeability is non-unique. Finally, because steady state is never achieved, the test lacks an internal mass-balance check. Systematic errors therefore surface only when results are compared with alternative laboratory techniques or in situ measurements.
Wang et al. [72] optimized the initial pulse stage to shorten the test duration working with ultra-low-permeability rock. They also quantify Klinkenberg-slip errors and line-compressibility effects through numerical modelling [73]. Liu et al. [74] demonstrated how heterogeneity alters the pressure–relaxation curve by using three-dimensional slug-test modelling.

2.5.4. Imaging and Indirect Correlations

Permeability determination by imaging and indirect correlations starts with acquiring a three-dimensional microstructural model, typically via X-ray micro-computed tomography (µ-CT) or T2 nuclear magnetic resonance (NMR) relaxometry, which discretizes the material into solid-phase and pore voxels. After segmentation and filtering, statistical descriptors of the pore network (porosity, throat-size distribution and connectivity, tortuosity factor, etc.) are extracted. The resulting “digital twin” is then exploited in two ways. First, direct steady-state flow simulations, usually with lattice Boltzmann or Stokes–Brinkman schemes, yield the pressure gradient and, through Darcy’s law, the effective permeability. Second, empirical correlations link the geometric descriptors to k. The technique avoids handling real fluids and can resolve extremely low permeabilities (<10−20 m2), but its validity depends on image resolution and on how representative the scanned volume is of the material at the macroscopic scale.
Intrinsic permeability is calculated via Stokes–Brinkman flow simulations on tomograms acquired in accordance with ISO 15708-3 [75], with uncertainties quantified under VDI/VDE 2630-2.1. The resulting values are compared with physical measurements conducted in accordance with ASTM E1814 [76] and API RP 40.
To ensure the metrological traceability of intrinsic permeability derived from Stokes–Brinkman simulations, the workflow should be strengthened as follows:
  • Acquisition of X-ray micro-computed tomography (μCT) in accordance with ISO 15708-3, performing geometric calibration of the system and verifying the effective resolution using reference standards.
  • Document the preprocessing and segmentation stages, maintaining a reproducible record of all parameters used.
  • Generate the computational domain and define boundary conditions consistent with the planned experimental comparison.
  • Solve the Stokes–Brinkman model to determine the full permeability tensor, verifying convergence with respect to the representative elementary volume (REV) size and the mesh discretization.
  • Benchmark the numerical results against physical tests performed in accordance with ASTM and API standards (e.g., core permeametry per API RP 40), matching, as far as possible, the stress state, saturation, temperature, and flow regime, including the Klinkenberg correction for gas flow. This coherently closes the image → simulation → experiment loop.
The integration of ISO 15708-3 (image quality), VDI/VDE 2630-2.1 (tomographic uncertainty quantification), and ASTM/API protocols (traceability of physical testing) offers the following:
  • A consistent alignment of the assumptions applied in the digital model and laboratory experiments.
  • Comparability across laboratories and experimental campaigns.
  • Cross-validation that uncovers segmentation or boundary-definition biases in the simulation and deviations arising from experimental sample preparation.
  • Industrial and regulatory acceptance by placing the digital twin and the experimental data within recognized standards frameworks.
In summary, Stokes–Brinkman simulation informed by standardized industrial tomography (ISO 15708-3) provides a quantitative route to estimate the intrinsic permeability of ultra-low-permeability materials and its anisotropy. When integrated with the established ASTM and API experimental protocols, it yields results that are more robust, traceable, and transferable between laboratory and field, while also identifying and constraining the principal sources of uncertainty that influence the final value of k.
Arns et al. [77] showed that high-precision numerical micro-permeametry can be performed on digitized three-dimensional images of sedimentary rocks. Because the required sample volume is extremely small, petrophysical properties can be predicted from core material unsuitable for conventional laboratory testing, such as drill cuttings, sidewall cores, or damaged plugs. Fluid-flow permeability simulations conducted on microtomographic images of Fontainebleau sandstone, with volumes below 1 mm3, agree closely with experimental measurements across a broad porosity range.
Drawing on relaxation–time distribution images (which encode pore geometry), Timur [78] calibrated empirical coefficients for more than 100 sandstones, showing that permeability can be inferred from magnetic “images” without real fluid flow and within minutes, provided a suitable reference database exists. The Timur–Coates equation is the cornerstone of NMR-based indirect-correlation methods.

2.5.5. Field Infiltration Testing Technique

In low-impact in situ infiltration tests, such as the Guelph permeameter [79], the double-ring infiltrometer, or the borehole infiltration test, a small cylindrical cavity or metal ring is inserted into the soil with minimal excavation to preserve pore structure and continuity. A constant water level is then established and maintained in the cavity by means of a graduated reservoir or a Mariotte head, so that the predominantly vertical flow is controlled and radially constrained. After an initial transient, the inflow rate reaches a quasi-steady state, which is monitored as the volumetric decline per unit time. This steady discharge, together with the known cavity geometry and the applied piezometric head, is fed into analytical solutions, most commonly the Reynolds and Elrick [80] formulations for three-dimensional divergent flow, that separate saturated hydraulic conductivity from gravitational effects and from the conductance of the adjacent unsaturated zone. The result is a saturated permeability value representative of the soil volume surrounding the inflow well, less disturbed than in laboratory tests and therefore more faithful to service conditions, although its accuracy depends critically on local homogeneity, precise control of the water level, and an accurate estimate of the initial matric suction.
This technique is ideally suited to agricultural soils and shallow foundations, although its applicability is constrained when the groundwater table lies at considerable depth.
Mohanty et al. [81] evaluated the variability of saturated hydraulic conductivity (Kₛ) at four depths (15, 30, 60, and 90 cm) across five locations within a glacial till soil of the Nicollet–Clarion association (Nicollet: fine-loamy, mixed, mesic, Aquic Hapludoll. Clarion: fine-loamy, mixed, mesic, Typic Hapludoll). Kₛ was measured in situ by four infiltration methods: the Guelph permeameter, the velocity permeameter, the disc permeameter, and the double-ring infiltrometer. Complementary laboratory determinations were performed on “undisturbed” soil cores taken from the same sites and depths. The Guelph permeameter returned the lowest Kₛ values, likely owing to its small sampling volume, whereas the disc permeameter and the double-ring method produced the highest values with the least variability, presumably because of their larger zone of influence. The greatest variability in shallow-core Kₛ appears to stem from the presence or absence of open macropores. Overall, the most comparable Kₛ estimates were obtained with the velocity permeameter and the laboratory constant-head permeameter.
Ghibus T. et al. [82] presented a multi-test protocol for urban soils and analyze the statistical consistency among infiltration methods, recommending convergence criteria for saturated hydraulic conductivity k in heterogeneous media.
In summary, the principal techniques for measuring permeability each serve distinct contexts. Steady-state gas permeametry with Klinkenberg correction offers fast, precise results for dry, low-permeability materials; while classical hydraulic methods are better suited to saturated specimens but become impractical at very low permeabilities. Transient-pressure tests allow rapid estimation of k without steady flow, ideal for tight materials, though sensitive to flow regime assumptions. Imaging-based approaches provide microstructurally informed estimates but require careful calibration. Field infiltration methods, though less controlled, capture in situ conditions with minimal disturbance. Table 4 summarizes the key features, limitations, and applicability of each technique.

2.6. Knowledge Gaps in the Characterization and Fundamental Understanding of Porosity and Permeability

2.6.1. Three-Dimensional Connectivity and Tortuosity of the Pore Network

While porosity quantifies the void fraction within a material, it does not capture the geometrical attributes that govern fluid flow. For instance, a highly porous medium with poor interconnectivity may exhibit negligible permeability. Accurate prediction of permeability and fluid transport behaviour requires advanced techniques capable of reconstructing the three-dimensional pore architecture. This includes the integration of X-ray micro-computed tomography (µ-CT), nuclear magnetic resonance (NMR), artificial intelligence (AI), and pore-network flow modelling to quantify pore connectivity and tortuosity with high spatial resolution and fidelity.

2.6.2. Thermo-Hydro-Mechanical-Chemical (THMC) Coupling

Coupling refers to the mutual and simultaneous interaction among thermal, hydraulic, mechanical, and chemical processes. Deformation and stress states modify the pore and fracture network, thereby altering permeability. Conversely, fluid flow and pore pressure evolve in response to the changing geometry of these voids. Fluid movement also facilitates the transport of reactants and reaction products, while chemical reactions can alter the material’s strength and deformability. This integrated, multiphysics perspective is essential for accurately predicting the real behaviour of construction materials. However, robust models capable of capturing this co-evolution in real time remain underdeveloped.

2.6.3. Temporal Scales and Transitions

These refer to the characteristic timeframes over which different processes occur-ranging from minutes (e.g., capillary imbibition) to decades (e.g., weathering processes involving the combined physical, chemical, and biological actions that progressively alter a material’s microstructure at both the surface and internal levels). Transitions denote the points at which the dominant transport or degradation mechanism shifts to another governed by different dynamics. Despite their importance, comprehensive in situ datasets that bridge laboratory-scale observations with long-term field performance are still lacking.

2.6.4. Long-Term Effects of Nano- and Microstructural Additives

This refers to the impact of incorporating nano- or micro-scale particles, fibres, or lamellae into a matrix material (e.g., concrete, mortar, or reconstituted stone). Such additives contribute to void filling, pore structure refinement, and act as nucleation sites for hydration products or as reinforcing bridges. These mechanisms enhance matrix density and mechanical strength, reduce permeability, and delay the onset of degradation processes. However, critical aspects such as additive dispersion, interactions with aggressive ions, and long-term durability remain insufficiently quantified.

2.6.5. Standardization and Comparability of Testing

The lack of standardized testing protocols that regulate critical variables, such as applied hydraulic pressure, exposure duration, degree of saturation, and concurrent mechanical loading, undermines the reproducibility of experimental data across laboratories. This, in turn, poses significant limitations for the rigorous calibration and validation of predictive models.

2.6.6. Influence of Salts, Climatic Cycles, and Biocolonization

This refers to the combined effects of salt crystallization and dissolution, hygrothermal expansion and contraction induced by humidity–temperature cycles, and the growth of biological agents (such as algae, fungi, and bacteria) within the pore network of materials. These processes can open, block, or interconnect pores and microcracks, thereby modifying the effective porosity and, consequently, influencing both permeability and long-term durability. Existing models typically address these factors in isolation, which limits their ability to capture synergistic interactions and undermines the reliability of predictions concerning the evolution of porosity and permeability.

2.6.7. Upscaling

Upscaling refers to the process of extrapolating porosity and permeability properties measured on small specimens or core samples to larger scales, such as structural elements, walls, or entire infrastructures. This is commonly achieved through modelling approaches and the application of correction factors that account for heterogeneities, anisotropy, and actual service conditions. However, few studies have validated these models on real-world structures (e.g., façades, tunnels), and the integration of lithological variability, construction joints, and accumulated damage remains an open and unresolved challenge.

3. Influence on the Material’s Durability and Performance

3.1. Water Absorption and Freeze–Thaw Resistance

Natural stone durability under freeze–thaw conditions is fundamentally influenced by its porosity and permeability, which control water ingress, retention, and ice-induced stress [15,83]. Low-porosity stones, such as some granites and marbles, typically demonstrate high resistance to freeze–thaw degradation, although microcracking has been observed even in granites with porosity as low as 1.7% [84]. In contrast, weathered granites with porosity exceeding 4.5% show noticeable surface deterioration, albeit without deep fracturing [84].
Pore size distribution further defines freeze–thaw behaviour. Stones dominated by micropores (<0.1 μm) are more resistant because water remains unfrozen or forms ice films that do not generate disruptive pressures [2]. However, mesopores (0.1–1 μm) and macropores (>1 μm) allow more significant ice crystallization, promoting internal damage and pore coalescence, dramatically reducing stone durability [85] (Figure 6).
Capillary absorption is closely tied to porosity and serves as a proxy for evaluating frost resistance. Stones with open porosity >2% typically exhibit more than 10% loss in compressive strength after ~168 freeze–thaw cycles, although visual appearance is not significantly degraded [86,87].
Experimental results confirm that repeated freeze–thaw cycles cause an increase in total porosity and a shift in pore size distribution. Mercury intrusion porosimetry (MIP) analyses on sandstone reveal that after 60 cycles, the volume of macropores increases by 19–81%, with concomitant reductions of 7–38% in compressive strength and 6–41% in Young’s modulus [85].
Permeability, while initially beneficial for water drainage, deteriorates under freeze–thaw conditions due to crack formation and pore collapse. For example, sandstone samples have shown permeability decreases of ~69% after 20 cycles, highlighting freeze-induced structural breakdown [88].
Changes in thermal properties also indicate structural evolution. Non-destructive thermographic analyses have demonstrated increases in thermal conductivity and effusivity during cycling, consistent with rising porosity and internal cracking [84,89]. Similarly, ultrasonic P-wave velocity measurements decrease progressively, indicating the propagation of microcracks and mechanical weakening [86,90].
The underlying mechanism of freeze–thaw deterioration can be summarized in stages: (1) capillary absorption of water into connected pores, (2) water freezing and expanding by ~9%, (3) internal stress causing crack initiation and propagation, and (4) increased porosity and permeability, facilitating further water ingress and accelerating damage [83,91].

3.2. Degradation Under Corrosive Media

Permeability of gas can accelerate chemical degradation processes, such as sulphate and chloride attack or carbonation in concrete [92]. The transport of corrosive media, including chloride and sulphate ions and CO2 depends mainly on the diffusion in the matrix and to some extent on their dissolution in the pore water solution. These properties are linked with the pore structure of the matrix, especially its tortuosity [93] and the permeability of the cement-based material, which also influences the transport of ions in the matrix. In case of gaseous media, pores filled with water can also slow down their diffusion, which is an important factor regarding the rate of corrosive processes.
In porous media like cement matrix, the diffusion of gases can be described using Fick’s second law Equation (14):
ϕ t = D 2 ϕ x 2
Equation (14) Fick’s second law, where
φ—concentration [mol/m3];
t—time [s];
D—diffusion coefficient [m2/s];
x—position [m].
The value of the diffusion coefficient in concrete depends on the part of the composite to which it refers to. A different value will be attributed to the ions present in the pore solution, a steady-state coefficient, and if referring to the presence of chloride ions in the mass of concrete or cement, the non-steady-state coefficient will be used. Despite this, a general definition of the diffusion coefficient can be stated as “the rate of transfer of the diffusing substance across a unit area divided by the gradient of concentration at the section” [94] and expressed using Equation (15):
D = F c / t
Equation (15) Definition of diffusion coefficient, where
F —flow [mol/m2*s];
c / t —gradient of concentration.
As the diffusion of corrosive media in concrete takes place mainly in the pore system, the area of section can be referred to as the area of pores in a considered part of the matrix. Moreover, as it is considered that some of the chloride ions can be bound by the cement matrix, the concentration and rate of bound to unbound chloride ions are directly linked with the porosity of concrete [94].
Chloride-induced corrosion is mainly linked with the degradation of the reinforcement in reinforced concrete structures. When the chloride ions reach the reinforcing steel by diffusion through pore structure, they can cause a pitting corrosion of rebars. This mechanism depends on the diffusive coefficients, porosity, and the shape of pore structure in the cement matrix. Products of the rebar corrosion have significantly higher volume and cause internal cracking of concrete. Moreover, chloride ions can react with hydration products to form expansive and difficult-to-solve products, for example, calcium chloride. Again, these products, having a larger volume compared to substrates, cause internal cracks to appear. Chloride diffusivity in concrete was correlated to its porosity in [95], mainly for pores with diameters in the range of 100–1000 nm, while its gas permeability was more related to pores with diameters in the range of 10–1000 nm. The transfer of moisture and, with it, chloride ions, was also pointed out as a largely important factor coupling concrete porosity with its durability aspects [96]. A detailed mathematical model was developed and backed by experimental data to link porosity, permeability, and the threat of chloride-induced corrosion in both saturated and non-saturated concrete.
Sulphate attack on cement-based materials begins with the reaction of sulphate ions with the hydration products and cement constituents. The resulting products are highly expansive and cause cracks to occur inside of the matrix [97]. Especially aluminate phases are susceptible as they can react with sulphates to produce ettringite, and on a small scale, gypsum, which impose a significant pressure during crystallization and cause internal cracking of the cement matrix. For this effect to occur, a significant confinement it the pore structure is needed for the forming ettringite crystals to cause pressure instead of growing in a relatively free space of larger pores [97]. Considering this, the pore size distribution can also be an important factor while assessing the sulphate-induced degradation of the cement matrix. As theorized in [98] the presence of small, capillary pores near smaller concentrations of monosulphate phases can distribute the pressure from growing ettringite more evenly and reduce the internal pressure. On the other hand, with more free space for growth in large pores, less pressure is exerted on the matrix and the upper side of the spectrum of pore size distribution might be favourable. Moreover, as stated in [99], they also need to grow from a solution supersaturated with sulphates. This requirement closely links sulphate-induced corrosion with porosity and the pore structure of the cement matrix, while the requirement for supersaturation of the solution is easier to comply with if the permeability of the concrete is high.
Porosity and permeability are especially crucial in case of carbonation. The process of carbonation begins with the diffusion of CO2 through pores in the cement matrix which then dissolves in water present in the pores and form negative ions HCO3 and CO32−. These ions interact with hydration products, mainly Portlandite Ca(OH)2, to create calcium carbonate and reduce the alkalinity of the cement matrix. In reinforced concrete, high alkalinity ensures the corrosive protection of the reinforcement and is vital to its durability.
The depth and rate of carbonation depend on temperature and relative humidity, alongisde CO2 concentration. Assuming that in most cases of natural working conditions of structures, the concentration of CO2 does not vary much, humidity and temperature become more important factors in the process. Moreover, diffusion mechanism in the cement matrix is linked with total porosity, the diameter of pores and their saturation, as it is significantly slowed by the presence of water in pores [100,101]. Another important factor is the tortuosity of the pore system, which can influence the CO2 diffusion mechanics [93] regardless of chemical composition and other physical properties.
The relation between porosity of the cement-based material and carbonation can also be considered from another perspective. A high porosity of the cement matrix can promote the diffusion of CO2 and increase the rate of carbonation; however, the transformation of portlandite into calcium carbonate results in a higher volume of products, which densify the microstructure of the cement-based materials [101].
Described degradation mechanisms highlight the influence of porosity and permeability for each of the main corrosive factors for cement-based materials. These mechanisms are more complex and depend on various other factors including the mineral composition of cement, composition of mixes and external factors such as temperature, humidity, concentration of corrosive medium and exposition conditions. A brief comparison the analyzed results is presented in Table 5.

4. Case Studies of Natural and Cementitious Materials

4.1. Natural Stones

Porosity and permeability are fundamental physical properties that significantly influence the durability and performance of natural stones used in construction. These properties govern the movement of fluids within stone structures, which in turn affects processes such as freeze–thaw weathering, salt crystallization, and chemical attack. Variations in mineral composition, grain size, fabric, and pore connectivity across different stone types lead to distinct behaviours under environmental stressors. This review synthesizes current findings on porosity and permeability across key natural stones—granite, limestone, marble, basalt, and sandstone—emphasizing experimental case studies that provide insight into their durability in built environments.
Granite, an igneous stone widely used in construction, typically exhibits low porosity and permeability due to its interlocking crystalline structure. However, its durability is compromised under freeze–thaw and thermal cycling conditions, which promote microcrack development along grain boundaries. Chen et al. [102] demonstrated that granite’s gas permeability increased markedly after exposure to sub-zero temperatures, as newly formed microcracks enhanced pore connectivity. Using nuclear magnetic resonance (NMR), they revealed an increase in both total porosity and the proportion of connected pores post-treatment. Similarly, Wu [103] found that heat treatment between 50 and 800 °C resulted in progressive permeability increases due to thermally induced microfracturing, with X-ray CT confirming the formation of fracture networks. These findings highlight that while granite’s initial impermeability offers protection, its performance can degrade under cyclic environmental conditions.
Limestone, a sedimentary stone composed largely of calcite, exhibits greater variability in porosity and permeability, depending on its depositional texture and surface treatments. Blanco Rafaela and Gris Pulpis limestones were compared by García-del-Cura et al. [104], finding that the micritic and polished Blanco Rafaela exhibited superior resistance to freeze–thaw damage due to its lower effective porosity and less connected pore system. The Gris Pulpis variant, with a grainier texture and higher porosity, showed more significant degradation. Laskaridis et al. [105] further evaluated Greek limestones subjected to 48 freeze–thaw cycles, reporting a 17–25% decline in flexural strength. Their results correlated strength loss with increased porosity and pore interconnectivity, confirming the vulnerability of calcitic limestones to physical weathering when microstructures are open or poorly consolidated.
Marble, a metamorphosed form of limestone, generally has a dense crystalline texture that confers low porosity and high durability. Laskaridis et al. [105] extended their freeze–thaw tests to Greek marbles, observing that both calcitic and dolomitic marbles showed minimal strength loss (<9%) under the same conditions. Dolomitic marbles performed slightly better, and damage was mostly limited to pre-existing fractures rather than new pore formation. The study highlights the significance of petrographic texture, specifically granoblastic versus foliated structures, in influencing marble’s response to environmental cycles.
Basalt, particularly the vesicular variety common in volcanic regions, presents a contrasting case. Despite relatively high porosity due to gas bubble voids, permeability often remains low when vesicles are unconnected. Al-Harthi et al. [106] analyzed vesicular basalts from Saudi Arabia and found porosity levels up to 25%. However, low permeability was maintained because most vesicles were isolated. Mechanical tests revealed an inverse correlation between porosity and compressive strength, indicating that even unconnected pores can weaken the stone’s structural integrity.
Sandstone, another sedimentary rock, typically exhibits high porosity and permeability due to its granular composition and intergranular pore networks. It is particularly susceptible to degradation under freeze–thaw and salt weathering conditions. For instance, Wang et al. [107] recorded a doubling of porosity in fine sandstone after 120 freeze–thaw cycles, with values rising from approximately 1.6% to 3.3%. Concurrently, longitudinal wave velocity decreased, indicating internal damage. Some authors employed NMR and fractal analysis to show that freeze–thaw cycles promoted the coalescence of micropores into larger fractures, further enhancing permeability and weakening the stone [108]. These results confirm that sandstone’s high initial permeability makes it especially vulnerable to rapid deterioration in harsh environments.
A comparative analysis of these case studies reveals that stone durability is not solely a function of initial porosity or permeability but also depends on pore connectivity, mineralogical composition, and microstructural features. Granite and marble perform well initially but can deteriorate due to microcracking under environmental stress. Limestone’s performance varies with texture and finishing, while basalt’s durability depends on the degree of vesicle connectivity. Sandstone, although easy to quarry and work with, requires careful application in climates prone to freeze–thaw cycles or salt exposure.
A deeper understanding of these properties enables better prediction of long-term performance and informs conservation strategies for historic and contemporary stone-built structures.

4.2. Concrete and Cement-Based Materials

Modern cementitious composites have seen performance improvements via additives and mix design modifications that refine the pore network. A wide variety of additions, including mineral and waste materials, have been used to improve the pore structure and densify the cement matrix. An important concept of using fractal theory to describe the pore network has also gained popularity. It is based around the measurement of fractal dimension of the pore structure and produces numerical value of the dimension, usually between 2 and 3. The higher the dimension, the more complex the pore structure and higher the porosity. However, since it is based on a theoretical mathematical model, its robustness in comparison with the experimental results is still limited.
Regarding the durability and corrosion resistance, an example of the large influence of permeability and porosity on the chloride attack resistance was highlighted by Lifshitz Sherzer et al. [109]. In their case study example, they modelled a concrete wall embedded in the Dead Sea, under a strong brine attack containing a high concentration of chloride ions. Detailed modelling of the degradation mechanism with crack analysis of the confined concrete wall revealed how pore structure relates to the severity of the effects of chloride-induced corrosion. The pores were at first collapsed and then filled by expansive products of chloride attack. The permeability of the concrete was also pointed out as one of the factors promoting the degradation through highly salinized water.
Gan et al. [110] investigated a case study of a very specific working conditions of concrete used for dams in an area with sulphate-rich water. Combined with large temperature variations a degrading mechanism called the action of salt freezing is created. Their experimental results have correlated porosity acquired from 3D scanning using computed tomography with the deterioration mechanism of concrete specimen. The results shown an increase in porosity by 7.30% after eight cycles of freeze–thawing combined with sulphate attack. The fractal model of the porosity, using fractal dimension as a descriptor, showed a negative correlation of porosity with compressive strength meaning that the higher the porosity, the lower the compressive strength. Pore size distribution changed during the exposition cycles and shifted to the right, indicating that the smaller pores experienced cracks early on under combined sulphate and freeze–thaw exposition which could imply that smaller pore size has a negative effect on the durability under this kind of attack.
As discussed in Section 3.2, the relationship between the porosity of the cement-based material and carbonation can change during the course of the process. In the research by Ren et al. [111], the accelerated carbonation tests caused the reduction in porosity and pore structure of mortars while also reducing their permeability by up to 40% which confers some beneficial effects in terms of further corrosive processes but still presents a threat to the reinforcement due to the reduction in pH. Tong et al. [112] applied fractal theory to link carbonation depth with porosity and gas permeability of concrete samples drilled from a historical structure which underwent carbonation under natural conditions over the years of its lifespan. The strong correlation between fractal dimension and pore size distribution, as well as oxygen diffusion coefficient, highlights an important link between these properties and the durability of concrete under carbonation [113,114].
Thanks to the modern testing methodologies and modelling approaches, the influence of porosity on the deterioration of cement-based materials can be more robustly considered. However, models based on fractal theory are still a relatively new approach in modelling of pore networks in the cement matrix and need more verification with experimental results to increase their reliability, especially for modelling porosity changes under corrosive media, complex and dynamic processes which both influence and are influenced by the pore structure.
A model of total porosity, permeability, and compressive strength of concrete with silica fume addition based on fractal theory was proposed by Lü et al. [115]. Based on the laboratory tests using MIP and scanning electron microscopy (SEM), a relationship between the fractal size of pores and compressive strength, porosity, and permeability was drawn. Thanks to the addition of pozzolanic silica fume and its filler effect, the permeability and fractal dimension of the concrete were reduced, while the compressive strength increased. The proposed modelling implies that with an increase in fractal dimension, compressive strength reduces linearly because of a larger median pore size, while also reducing the permeability in a nonlinear way.
Studies by Gao et al. [116] have shown a significant reduction in porosity and refinement of pore structure through the addition of mineral fillers into recycled aggregate concrete. A significant reduction in capillary pores was observed with the addition of silica fume, fly ash, and mineral powder through the pozzolanic effect of the additions. The effect, illustrated in Figure 7, causes the growth of an additional C-S-H phase in the cementitious matrix. The newly created hydration products densify the structure and reduce its porosity. Moreover, a filler effect can be observed for silica fume spheres, which fill in the pores in a physical way.
Also, fly ash alone as a replacement material for cement shows an improvement in porosity and chloride permeability of concrete [117], which is again attributed to its contribution in the hydration reaction.
A similar study concerning supplementary cementitious materials (SCMs) was carried out by Kewalramani and Khartabil [118]. They have noted a reduction in the porosity of concrete with the replacement of 50% of cement with ground granulated blast furnace slag by 15.79%, and with the additional replacement with 5% of micro-silica, the reduction in porosity was 36.84%. These results were attributed to additional hydration of the SCMs, which took place after the hydration of Portland cement and partially filled the pores with new hydration products. Furthermore, this reduction in porosity also increased the resistance to chloride penetration, which in the test of rapid chloride permeability was improved by up to 85.15%.
Zhang et al. [119] developed a surface protection material based on cement mortar with the addition of nano-silica and silica fume. These additions greatly improved the hydration reaction of the mortars and through densification of the C-S-H phase and the filler effect reduced their porosity by up to 7% and refined the pore sizes, which allows the material to be used as a protective layer from chloride ingression. As pointed out in the study, in case of a connection between two types of concrete, the porosity of the interfacial transmission zone (ITZ) is a crucial factor for materials’ durability. In the study, the porosity of ITZ was improved, which allowed for the developed material to be used as a protective layer for the concrete.
The effect of waste materials such as plastic waste aggregate on the porosity of cement-based materials was also a subject of study by Chao et al. [120]. They used a machine learning approach to predict porosity and gas permeability of cement mortars with various amounts of the recycled plastic aggregate. The results of modelling were in a good agreement with the experimental findings and revealed that increasing the dosage of waste aggregate leads to a higher porosity in the mortars.
Presented examples show a variety of modifications of the concrete composition to reduce and refine its porosity. Multiple mineral additions and supplementary cementitious materials are used and show a good agreement between studies which use their pozzolanic and filler properties to improve upon porosity of concrete mixes. Important research directions focus also on the porosity of concretes using waste materials or recycled aggregates. These directions are especially important, given the current trends of more ecological and sustainable construction. Engineered cementitious composites designed as protective layers for concrete structures have also been developed. These aim to improve the durability of existing structures by providing an additional protective layer. This direction might be important for further development of high performing rehabilitation and repair materials.
Another example of linking the performance of concrete and its permeability is the creation of pervious concrete. These types of concrete are specifically designed for high permeability and are an example of utilizing high permeability in a practical context. The design procedures and research on pervious concrete aim to counteract the negative impact of high permeability on the durability of these materials [121]. It can also confer various benefits for the urban environment including the reduction in noise from traffic, reduction in urban heat island effects and aid in the drainage during increasingly heavy rains (Figure 8).
Unlike structural concrete, pervious concrete is mainly used as a paving material and does not require high mechanical strength. It is also subjected to different types of corrosive media, mainly water, which can freeze in the pores and chlorides coming from solutions used for winter maintenance. The performance of pervious concrete is largely connected with its pore structure and characteristics which influence the permeability. A detailed, experimentally driven approach to this relation was explored by Shan et al. [122], who used modelling aided by computed tomography to draw clear correlations between pore characteristics and permeability for a more robust design of pervious concrete. Mehrabi et al. [123] undertook an attempt to design a more sustainable pervious concrete. They have tested a large variety of mixes to include recycled aggregates and waste plastic fibres to include these waste materials in the design process and achieved a mix with satisfying mechanical and permeability parameters. Pervious concrete presents an opportunity to leverage high permeability to improve the quality of road infrastructure (Table 6). While most studies claim that pervious concretes maintain their basic engineering properties, more in-depth research is needed to understand the trade-off between intentionally high permeability and other important properties such as mechanical strength and durability. The use of waste materials should also be explored in pervious concrete to further enhance its environmental benefits.

5. Recent Advances: Nanomaterials and Pore System Engineering

Nowadays, one of the most promising strategies for the optimization and improvement of concrete performance is introducing novel functional additives into cement composites. In particular, the development of nano-engineered cement composites became a veritable breakthrough in concrete science. Among others, nanomaterials, such as carbon-based nanomaterials (graphene derivatives, carbon nanotubes), nano-silica or nano-titania, have become the most studied ones worldwide.
The effect of graphene-family materials on the transport properties and permeability of cement composites has been studied by various research groups over the last decades. In general, the addition of graphene may increase the tortuosity of paths and refine the porosity of hardened composites. Therefore, in comparison to plain composites, the resistance of graphene-based cement materials to water infiltration, carbonation, and ingress of harmful ions may be highly improved. Jiang et al. [124] have reported a considerable reduction in permeable porosity of cement composites by 52% with the incorporation of 0.05 wt.% of graphene. Many authors [125,126,127] have also demonstrated the beneficial effect of graphene oxide (GO) addition on the porosity and barrier properties of cement composites. The reinforcing mechanism originates mostly from the accelerating effect of GO on cement hydration and the regulation of the morphology of hydrated crystals. Zeng et al. [125] have measured the water penetration depth and the relative permeability reduced by 56% and 80%, respectively, in cement composites incorporating 0.06 wt.% of GO. Moreover, graphene nanoplatelets may also positively influence the barrier properties of cement composites due to their large aspect ratio and multi-layered morphology, thus resulting in the refined pore system of hardened mortars [128]. Du and Pang have stated that the addition of 2.5% of GNPs may increase the resistance of cement mortar to water permeability, as well as chloride diffusion and migration by 30–70%. Similarly, Win et al. [129] have investigated the effect of GNPs on the properties of calcium aluminate cement composites, showing that the GNP loading of 0.3 wt.% has greatly influenced the 28-day volume of permeable voids in hardened composites by decreasing it by 63%. These results have been associated with the filling phenomena of GNPs.
Notably, another type of carbon-based nanomaterials, carbon nanotubes (CNTs), has also proved to positively affect the transport properties of cement composites. The CNT addition may lead to the reduced sorptivity and gas permeability of hardened composites due to the refinement of pores [130,131]. Moreover, Gao et al. [132] have reported on the effect of CNTs on the interfacial transition zone (ITZ) of concrete. The dosage of nanomaterials, even as low as 0.024 wt.%–0.04 wt.%, has notably enhanced the ITZ hardness and significantly decreased the ITZ width (by 30%), as well as the abrasion crack width in the ITZ (by 35%). As a result, the impermeability of the composites has been enhanced by 11–36%. Interestingly, the reinforcing effect of CNTs strongly depends on the water-to-cement (W/C) ratio of the composites, and is the most effective in concrete with a W/C ratio of 0.4.
Interestingly, Gao et al. [133] have developed GO-CNT hybrid in order to obtain highly impermeable cement pastes. This hybrid material has enhanced the impermeability of cement composites from 14% to 64% due to its reinforcing effect on the composites’ porosity, being a result of the accelerated hydration with nanomaterials playing a role of nucleation sites for hydration products.
Another group of nanomaterials that can play a major role in improving the permeability of cement composites are spherically shaped nanomaterials, such as nano-silica and nano-titania. The incorporation of nano-SiO2 can lead to the reduction in the pore radius, thus decreasing water sorptivity and hindering the diffusion of aggressive ions [134,135]. Fundamentally, nano-silica, used as a nano-reinforcement in cement composites, shows the nucleation effect, pozzolanic activity, and filling phenomena [136,137]. Its particles can react with calcium hydroxide produced during cement hydration to form additional C-S-H phase [134]. Importantly, Bai et al. [135] have observed various reinforcing effects of nano-silica on the permeability of cement composites with different water-to-cement ratios: for a low W/C ratio, nano-silica particles have mainly increased the tortuosity of pore system, while in the case of a high W/C ratio, the connectivity of pore structure has been mostly reduced.
Additionally, some studies [137,138] have also shown a great potential of the application of nano-titania in cement composites with improved transport properties and permeability. Shafaei et al. [138] have demonstrated significant reductions, by 32% and 27%, in the permeability of cement mortars with 2.5 wt.% and 3.5 wt.% addition of nano-TiO2, respectively. The authors have notably observed refined pores of cement mortars with the total average porosity decreased by 60.1% and 54.2%, respectively. The modification of the pore system has been attributed to the promotion of early hydration and higher formation of the C-S-H gel. Moreover, nano-TiO2 can act as a nano-filler of voids and defects within cement matrix, leading to denser and more uniform pore structure [137] (Figure 9).
The application of nanomaterials that influence the microstructure of cement-based materials on a microscopic level can effectively improve and refine the pore structure of the cement matrix. By utilizing filler and nucleation effects, as well as becoming a physical barrier for harmful ions, the addition of nanomaterials can positively influence the durability of cementitious composites. Literature findings are mostly coherent when it comes to the positive influence of nanomaterials on porosity; however, as with most of the research concerning the use of nanomaterials in cement systems, several major concerns are still to be addressed. Most of the nanomaterials are usually expensive, and even if dosages used in cement-based composites are relatively small, economic issues might arise when considering large volumes of the materials required for practical applications. Moreover, for carbon nanomaterials, there are multiple problems with their proper dispersion in the cement matrix with currently used procedures not being easily scalable to industrial applications. Since the use of nanomaterials in cementitious composites is still a relatively new concept, there are not many studies considering their long-time influence. The positive influence on porosity and pore structure should not change with time; however, durability and corrosive tests are usually performed using accelerated techniques which might not fully reflect the behaviour of the material under real, long-term exposure conditions.
The main advantages of using nanomaterials for pore structure refinement can be summarized as follows:
  • Improvement in total porosity through filler effect;
  • Positive influence on hydration reaction which also reduces porosity;
  • Creation of physical barrier for intruding harmful ions.
The main challenges for use of nanomaterials can be summed as:
  • Possible high costs despite relatively low dosages;
  • Problems with scaling up the production, including dispersion in cement matrix;
  • Not enough data on long-term behaviour under natural corrosive conditions.

6. Conclusions

This review has demonstrated that porosity and permeability are critical microstructural parameters that govern the transport behaviour and durability of construction materials, including natural stones, mortars, concretes, and cementitious composites. The pore architecture, specifically total and effective porosity, pore size distribution, and connectivity, determine the extent to which fluids and aggressive agents can infiltrate and damage these materials.
Degradation mechanisms such as freeze–thaw deterioration, chloride ingress, sulphate attack, and carbonation are strongly linked to the permeability and connectivity of the pore network. High total porosity alone is not necessarily detrimental; rather, the size, continuity, and tortuosity of pores play decisive roles in defining how materials respond to environmental stress. A dense, well-refined pore structure generally enhances resistance to fluid transport and prolongs service life.
This review also compared a range of experimental methods for porosity and permeability characterization. Each technique, helium pycnometry, mercury intrusion porosimetry, nitrogen adsorption (BET/BJH), NMR relaxometry, optical microscopy, SEM, micro-CT, and CLSM offers unique advantages at specific pore size scales. When used in combination, they provide a comprehensive, multiscale understanding of material microstructure, which is essential for modelling and prediction.
Case studies highlight how material performance can be significantly improved by modifying the pore structure through mineral admixtures (e.g., silica fume, fly ash, slag), nanomaterials, and recycled or waste-based components. These additives reduce pore connectivity, refine the pore size distribution, and ultimately enhance durability. Pervious concrete, on the other hand, illustrates a scenario where high permeability is functionally desirable, provided it is controlled to avoid excessive structural degradation.
Despite these advancements, several challenges remain. Long-term performance under real environmental conditions, especially for nano-enhanced or recycled-material concretes, requires further validation. Additionally, there is a growing need for integrating microstructural parameters into durability design models and service-life prediction tools. Standardized protocols for combining characterization methods and translating laboratory data into field-relevant metrics are also lacking. Further research considering the long-term effects of nanomaterial addition on the porosity and durability-related properties of cement composites is also needed. Moreover, the application of nanomaterials in real scale structures requires further development of the low-cost synthesis methods, as well as efficient dispersion protocols.
In conclusion, porosity and permeability must be treated not as secondary attributes, but as central design parameters in the development and conservation of construction materials. A multiscale, interdisciplinary approach bridging experimental characterization, material science, and durability modelling is essential for engineering materials with both functional performance and long-term resilience. This is especially crucial in today’s changing climate, where harsh weather conditions are becoming increasingly frequent.

Author Contributions

Conceptualization, A.O.-M. and M.F.-R.; methodology, A.O.-M. and M.G.; software, A.O.-M., P.C. and E.G.; validation, A.O.-M., P.C., E.G., M.S., M.F.-R. and M.G.; formal analysis, A.O.-M., E.G. and M.G.; investigation, A.O.-M., E.G., M.S. and P.C.; resources, A.O.-M., E.G., M.G. and P.C.; data curation, A.O.-M.; writing—original draft preparation, A.O.-M.; writing—review and editing, A.O.-M. and P.C.; visualization, A.O.-M. and M.S.; supervision, A.O.-M., M.F.-R. and M.G.; project administration, A.O.-M.; funding acquisition, M.G., A.O.-M., M.F.-R. and P.C. All authors have read and agreed to the published version of the manuscript.

Funding

This research was funded by “Ministerio de Ciencia, Innovación y Universidades (Real Decreto 1059/2021, 30 November 2021) and the European Education and Culture Executive Agency (Project: 101004049—EURECA-PRO—EAC-A02-2019/EAC-A02-2019-1)”. This research received no external funding for APC.

Acknowledgments

The authors wish to thank the continued support of the Fundación Ciudad de la Energía–CIUDEN.

Conflicts of Interest

The authors declare no conflict of interest.

References

  1. Viles, H.A. The Dynamic Setting for 21st Century Stone Deterioration and Conservation. Available online: http://qjegh.lyellcollection.org/ (accessed on 21 August 2025).
  2. Deprez, M.; De Kock, T.; De Schutter, G.; Cnudde, V. A Review on Freeze-Thaw Action and Weathering of Rocks. Earth Sci. Rev. 2020, 203, 103143. [Google Scholar] [CrossRef]
  3. Zhou, D.; Liu, J.; Cheng, L.; An, S.; Huo, L. Pore Structures and Deterioration Mechanism of Concrete after Cryogenic Freeze-Thaw Cycles: Effects of Moisture Contents and Aggregates. J. Build. Eng. 2024, 96, 110620. [Google Scholar] [CrossRef]
  4. Liu, B.; Liu, Q.; Liu, X.; Liu, Q.; Wang, X. Mechanical and Microstructural Characteristics and Damage Constitutive Model of Limestone under Acid Corrosion. J. Build. Eng. 2025, 108, 112903. [Google Scholar] [CrossRef]
  5. Kudasik, M.; Anioł, Ł.; Gajda, A.; Pajdak, A. Influence of Confining Pressure on Permeability and Structural Properties of Selected Sedimentary, Igneous, and Metamorphic Rocks. Bull. Eng. Geol. Environ. 2023, 82, 455. [Google Scholar] [CrossRef]
  6. Hoseini, M.; Bindiganavile, V.; Banthia, N. The Effect of Mechanical Stress on Permeability of Concrete: A Review. Cem. Concr. Compos. 2009, 31, 213–220. [Google Scholar] [CrossRef]
  7. Li, W.; Zhou, Y.; Yin, J.; Peng, Y.; Wang, Y.; Tang, S.; Shi, Y.; Wang, Y.; Wang, L. Thermodynamics-Based Simulations of the Hydration of Low-Heat Portland Cement and the Compensatory Effect of Magnesium Oxide Admixtures. J. Zhejiang Univ. Sci. A 2025, 26, 305–319. [Google Scholar] [CrossRef]
  8. Yu, W.; Zhou, Y.; Zhao, Z.; Li, Y.; Long, Y.; Tang, S. Simulation of Low-Heat Portland Cement Permeability and Thermal Conductivity Using Thermodynamics. Proc. Inst. Civ. Eng.-Transp. 2025, in press. [Google Scholar] [CrossRef]
  9. Broomfield, J.P. Corrosion of Steel in Concrete; CRC Press: London, UK, 2022. [Google Scholar] [CrossRef]
  10. Abreu Araujo, L.; Rebolledo Ramos, N.; Torres Martín, J.E.; Chinchón-Payá, S.; Sánchez Montero, J.; Lample Carreras, R.M.; Vera-Agullo, J.; Jimenez-Vicaria, J.D. Concrete Gas Permeability: Implications for Hydrogen Storage Applications. Appl. Sci. 2024, 14, 6408. [Google Scholar] [CrossRef]
  11. van der Merwe, J.E. Towards the Estimation of Concrete Intrinsic Permeability. Cem. Concr. Res. 2022, 159, 106885. [Google Scholar] [CrossRef]
  12. Wang, J.; Lu, S.; Zhang, P.; Zhi, Q.; Huang, H. Pore Distribution Characteristics of Different Lithofacies Shales: Evidence from Scanning Electron Microscopy. Processes 2023, 11, 1120. [Google Scholar] [CrossRef]
  13. Ali, A.; Zhang, N.; Santos, R.M. Mineral Characterization Using Scanning Electron Microscopy (SEM): A Review of the Fundamentals, Advancements, and Research Directions. Appl. Sci. 2023, 13, 12600. [Google Scholar] [CrossRef]
  14. Dullien, F.A.L.; Brenner, H. Porous Media: Fluid Transport and Pore Structure; Academic Press: Cambridge, MA, USA, 2012. [Google Scholar]
  15. Beck, K.; Rozenbaum, O.; Al-Mukhtar, M.; Plançon, A. Multi-Scale Characterisation of monument limestones. In Proceedings of the 6th International Symposium on the Conservation of Monuments in the Mediterranean Basin, Lisbon, Portugal, 7–10 April 2004; pp. 1–6. [Google Scholar]
  16. Instrument Models. Poremaster® & Poremaster® GT User Guide (Operating Manual); Quantachrome Instruments: Boynton Beach, FL, USA, 2009. [Google Scholar]
  17. Wang, L.; Song, X.; Yang, H.; Wang, L.; Tang, S.; Wu, B.; Mao, W. Pore Structural and Fractal Analysis of the Effects of MgO Reactivity and Dosage on Permeability and F–T Resistance of Concrete. Fractal Fract. 2022, 6, 113. [Google Scholar] [CrossRef]
  18. Ordóñez, S.; Fort, R.; Garcia del Cura, M.A. Pore Size Distribution and the Durability of a Porous Limestone. Q. J. Eng. Geol. 1997, 30, 221–230. [Google Scholar] [CrossRef]
  19. ASTM D4404; Standard Test Method for Determination of Pore Volume and Pore Volume Distribution of Soil and Rock by Mercury Intrusion Porosimetry. ASTM International: West Conshohocken, PA, USA, 2025.
  20. Muller, A.C.A.; Scrivener, K.L. A Reassessment of Mercury Intrusion Porosimetry by Comparison with 1H NMR Relaxometry. Cem. Concr. Res. 2017, 100, 350–360. [Google Scholar] [CrossRef]
  21. Chatterji, S. A Discussion of the Paper “Mercury Porosimetry: An Inappropriate Method for the Measurement of Pore Size Distributions in Cement-Based Materials” by S. Diamond. Cem. Concr. Res. 2001, 31, 1657–1658. [Google Scholar] [CrossRef]
  22. Rigby, S.P. Uses of Gas Sorption and Mercury Porosimetry Methods in Studies of Heritage Materials. Heritage 2025, 8, 132. [Google Scholar] [CrossRef]
  23. Zeng, Q.; Chen, S.; Yang, P.; Peng, Y.; Wang, J.; Zhou, C.; Wang, Z.; Yan, D. Reassessment of Mercury Intrusion Porosimetry for Characterizing the Pore Structure of Cement-Based Porous Materials by Monitoring the Mercury Entrapments with X-Ray Computed Tomography. Cem. Concr. Compos. 2020, 113, 103726. [Google Scholar] [CrossRef]
  24. ASTM D4222-20; Standard Test Method for Determination of Nitrogen Adsorption and Desorption Isotherms of Catalysts and Catalyst Carriers by Static Volumetric Measurements. ASTM International: West Conshohocken, PA, USA, 2020.
  25. ASTM D3663-20; Standard Test Method for Surface Area of Catalysts and Catalyst Carriers. ASTM International: West Conshohocken, PA, USA, 2020.
  26. ASTM D4641-17; Standard Practice for Calculation of Pore Size Distributions of Catalysts and Catalyst Carriers from Nitrogen Desorption Isotherms. ASTM International: West Conshohocken, PA, USA, 2017.
  27. Zhao, L.; Feng, P.; Hong, J.; Liu, Q.; Geng, G. Improved Low-Field NMR Porosity Characterization of Cementitious Materials Containing Water-Soluble Organic Admixtures. Cem. Concr. Compos. 2024, 153, 105732. [Google Scholar] [CrossRef]
  28. Robert, E.; Saleh, F.K.; Teodoriu, C. Revolutionizing Reservoir Management: Real-Time Petrophysical Analysis with NMR Technology of Drill Cuttings. Available online: https://pangea.stanford.edu/ERE/db/GeoConf/papers/SGW/2024/Robert.pdf (accessed on 21 August 2025).
  29. Tang, Y.J.; Shan, Z.Q.; Yin, G.J.; Miao, L.; Wang, S.S.; Zhang, Z.Y. Low-Field Nuclear Magnetic Resonance Investigation on Early Hydration Characterization of Cement Paste Mixed with Mineral Admixtures. Buildings 2023, 13, 2318. [Google Scholar] [CrossRef]
  30. Stroeven, P.; Le, N.L.; Sluys, L.J.; He, H. Porosimetry by Double-Random Multiple Tree Structuring in Virtual Concrete. Image Anal. Ster. Stereol. 2012, 31, 55–63. [Google Scholar] [CrossRef]
  31. Zhu, P.; Dong, Y.; Chen, M.; Li, Z.; Han, B.; Wang, J.; Cui, Y. Quantitative Evaluation of Pore Structure from Mineralogical and Diagenetic Information Extracted from Well Logs in Tight Sandstone Reservoirs. J. Nat. Gas. Sci. Eng. 2020, 80, 103376. [Google Scholar] [CrossRef]
  32. Ulusay, R.; Hudson, J.A. The Complete ISRM Suggested Methods for Rock Characterization, Testing and Monitoring: 1974–2006; Ulusay, R., Hudson, J.A., Eds.; International Society for Rock Mechanics (ISRM): Ankara, Turkey, 2007. [Google Scholar]
  33. Scrivener, K.L. The Use of Backscattered Electron Microscopy and Image Analysis to Study the Porosity of Cement Paste. In Material Research Society Symposium; Roberts, L.R., Skalny, J.P., Eds.; Materials Research Society (MRS): Boston, MA, USA, 1989; Volume 137, pp. 129–140. [Google Scholar]
  34. Scrivener, K.L.; Lyon, A.K.C.; Laugesen, F.P. The Interfacial Transition Zone (ITZ) Between Cement Paste and Aggregate in Concrete. Interface Sci. 2004, 12, 411–421. [Google Scholar] [CrossRef]
  35. Sorbier, L.; Poncet, H.; Lecocq, V.; Maillet, G.; Moula, M.; Le Corre, V. Local Porosity Measurement from Scanning Electron Microscopy Images in the Backscattered Electrons Mode. Microsc. Microanal. 2021, 27, 20–27. [Google Scholar] [CrossRef]
  36. Żak, A.M.; Wieczorek, A.; Chowaniec, A.; Sadowski, Ł. Segmentation of Pores in Cementitious Materials Based on Backscattered Electron Measurements: A New Proposal of Regression-Based Approach for Threshold Estimation. Constr. Build. Mater. 2023, 368, 130419. [Google Scholar] [CrossRef]
  37. Salvini, S.; Coletti, C.; Maritan, L.; Massironi, M.; Balsamo, F.; Mazzoli, C. Exploring the Pore System of Carbonate Rocks through a Multi-Analytical Approach. Environ. Earth Sci. 2023, 82, 564. [Google Scholar] [CrossRef]
  38. Buckman, J.; Bankole, S.A.; Zihms, S.; Lewis, H.; Couples, G.; Corbett, P.W.M. Quantifying Porosity through Automated Image Collection and Batch Image Processing: Case Study of Three Carbonates and an Aragonite Cemented Sandstone. Geosciences 2017, 7, 70. [Google Scholar] [CrossRef]
  39. Scrivener, K.; Snellings, R.; Lothenbach, B. (Eds.) A Practical Guide to Microstructural Analysis of Cementitious Materials, 1st ed.; CRC Press: Boca Raton, FL, USA, 2016. [Google Scholar] [CrossRef]
  40. ASTM C1721-22; Standard Guide for Petrographic Examination of Dimension Stone. ASTM International: West Conshohocken, PA, USA, 2022.
  41. Liu, Y.; King, H.E.; van Huis, M.A.; Drury, M.R.; Plümper, O. Nano-Tomography of Porous Geological Materials Using Focused Ion Beam-Scanning Electron Microscopy. Minerals 2016, 6, 104. [Google Scholar] [CrossRef]
  42. Schmid, T.; Ruffray, N.; Griffa, M.; Zhang, Z.; Isgor, O.B.; Angst, U.M. Probing the Steel-Concrete Interface Microstructure Using FIB-SEM Nanotomography. Mater. Struct. Mater. Constr. 2025, 58, 75. [Google Scholar] [CrossRef]
  43. Reedy, C.L.; Reedy, C.L. High-Resolution Micro-CT with 3D Image Analysis for Porosity Characterization of Historic Bricks. Herit. Sci. 2022, 10, 83. [Google Scholar] [CrossRef]
  44. De Kock, T.; Boone, M.A.; De Schryver, T.; Van Stappen, J.; Derluyn, H.; Masschaele, B.; De Schutter, G.; Cnudde, V. A Pore-Scale Study of Fracture Dynamics in Rock Using X-Ray Micro CT Under Ambient Freeze–Thaw Cycling. Environ. Sci. Technol. 2015, 49, 2867–2874. [Google Scholar] [CrossRef]
  45. Hassan, A.; Yutkin, M.; Chandra, V.; Patzek, T. Quality Evaluation of Epoxy Pore Casts Using Silicon Micromodels: Application to Confocal Imaging of Carbonate Samples. Appl. Sci. 2021, 11, 5557. [Google Scholar] [CrossRef]
  46. Phan, J.; Ruspini, L.C.; Lindseth, F. Automatic Segmentation Tool for 3D Digital Rocks by Deep Learning. Sci. Rep. 2021, 11, 19123. [Google Scholar] [CrossRef]
  47. Niu, Y.; Mostaghimi, P.; Shabaninejad, M.; Swietojanski, P.; Armstrong, R.T. Digital Rock Segmentation for Petrophysical Analysis With Reduced User Bias Using Convolutional Neural Networks. Water Resour. Res. 2020, 56, e2019WR026597. [Google Scholar] [CrossRef]
  48. Shen, Y.; Su, J.; Qin, Q.; Chen, H. Comparative Study on Applicability of Permeability Testing Methods in Shale Reservoirs. ACS Omega 2021, 6, 24176–24184. [Google Scholar] [CrossRef]
  49. Carles, P.; Egermann, P.; Lenormand, R.; Lombard, J.M. Sca2007-07 Low Permeability Measurements using steady-state and transient methods. In Proceedings of the International Symposium of the SCA, Calgary, AB, Canada, 10–13 September 2007. [Google Scholar]
  50. Tanikawa, W.; Shimamoto, T. Klinkenberg Effect for Gas Permeability and Its Comparison to Water Permeability for Porous Sedimentary Rocks. Hydrol. Earth Syst. Sci. Discuss. 2006, 3, 1315–1338. [Google Scholar] [CrossRef]
  51. Xiao, W.; Bernabé, Y.; Evans, B.; Mok, U.; Zhao, J.; Ren, X.; Chen, M. Klinkenberg Effect and Effective Pressure for Gas Permeability of Tight Sandstones. J. Geophys. Res. Solid Earth 2019, 124, 1412–1429. [Google Scholar] [CrossRef]
  52. Ahmad, I.; Ahmad, M.; Ali, I. Klinkenberg-Corrected and Water Permeability Correlation for a Sarawak Carbonate Field. Fluids 2021, 6, 339. [Google Scholar] [CrossRef]
  53. ISO 4022:2018; Permeable sintered metal materials—Determination of fluid permeability. ISO (International Organization for Standardization): Geneva, Switzerland, 2018.
  54. API RP 40; Recommended Practices for Core Analysis. American Petroleum Institute (API): Washington, DC, USA, 1998.
  55. RILEM TC 116-PCD: Permeability of Concrete as a Criterion of Its Durability. Available online: https://www.rilem.net/groupe/116-pcd-permeability-of-concrete-as-a-criterion-of-its-durability-116 (accessed on 21 August 2025).
  56. Tanikawa, W.; Shimamoto, T. Comparison of Klinkenberg-Corrected Gas Permeability and Water Permeability in Sedimentary Rocks. Int. J. Rock Mech. Min. Sci. 2009, 46, 229–238, Correction to Int. J. Rock Mech. Min. Sci. 2009, 46, 1394–1395. http://doi.org/10.1016/j.ijrmms.2009.08.001. [Google Scholar] [CrossRef]
  57. Shi, J.; Qian, R.; Wang, D.; Liu, Z.; Chun, Q.; Zhang, Y. Experimental Study on Gas Permeability of Cement-Based Materials. Cem. Concr. Compos. 2022, 129, 104491. [Google Scholar] [CrossRef]
  58. Gao, J.; Li, Z.; Wei, M.; Zhang, C. Experimental Study on the Klinkenberg Effect for Gas Permeability in Carboniferous Shales, Eastern Qaidam Basin, China. Energy Explor. Exploit. 2024, 42, 1386–1407. [Google Scholar] [CrossRef]
  59. Ghanbarian, B.; Torres-Verdín, C.; Lake, L.W.; Marder, M. Gas Permeability in Unconventional Tight Sandstones: Scaling up from Pore to Core. J. Pet. Sci. Eng. 2019, 173, 1163–1172. [Google Scholar] [CrossRef]
  60. ISO 17892-11:2019; Geotechnical Investigation and Testing—Laboratory Testing of Soil—Part 11: Permeability Tests. ISO (International Organization for Standardization): Geneva, Switzerland, 2019.
  61. ASTM D5084-24; Standard Test Methods for Measurement of Hydraulic Conductivity of Saturated Porous Materials Using a Flexible Wall Permeamete. ASTM International: West Conshohocken, PA, USA, 2024.
  62. D2434-68; Standard Test Method for Permeability of Granular Soils (Constant Head). ASTM International: West Conshohocken, PA, USA, 2020.
  63. ASTM D5856-15; Standard Test Method for Measurement of Hydraulic Conductivity of Porous Material Using a Rigid-Wall, Compaction-Mold Permeameter. ASTM International: West Conshohocken, PA, USA, 2015.
  64. EN 12390-8:2019; Testing hardened concrete—Part 8: Depth of Penetration of Water Under Pressure. The European Committee for Standardization (CEN): Brussels, Belgium, 2019.
  65. Nijp, J.J.; Metselaar, K.; Limpens, J.; Gooren, H.P.A.; van der Zee, S.E.A.T.M. A Modification of the Constant-Head Permeameter to Measure Saturated Hydraulic Conductivity of Highly Permeable Media. MethodsX 2017, 4, 134–142. [Google Scholar] [CrossRef]
  66. Singh, K.; Camulli, H.; Bradley, J. Sediment Size Effects on Non-Darcy Flow: Insights from Izbash Equation and Forchheimer Inertial Coefficient Analysis. Hydrogeol. J. 2024, 32, 1853–1871. [Google Scholar] [CrossRef]
  67. Zhao, Y.; Zhang, K.; Wang, C.; Bi, J. A Large Pressure Pulse Decay Method to Simultaneously Measure Permeability and Compressibility of Tight Rocks. J. Nat. Gas. Sci. Eng. 2022, 98, 104395. [Google Scholar] [CrossRef]
  68. Zhang, T.; Hu, Q.; Ghanbarian, B.; Elsworth, D.; Lu, Z. A Pulse-Decay Method for Low (Matrix) Permeability Analyses of Granular Rock. Hydrol. Earth Syst. Sci. 2023, 27, 4453–4465. [Google Scholar] [CrossRef]
  69. ASTM D4104/D4104M-20; Standard Practice (Analytical Procedures) for Determining Transmissivity of Nonleaky Confined Aquifers by Overdamped Well Response to Instantaneous Change in Head (Slug Tests). ASTM International: West Conshohocken, PA, USA, 2020.
  70. ASTM D5912-20; Standard Practice for Determining Hydraulic Conductivity of an Unconfined Aquifer by Overdamped Well Response to Instantaneous Change in Head. ASTM International: West Conshohocken, PA, USA, 2020.
  71. ISO 22282-1:2012; Geotechnical Investigation and Testing—Geohydraulic Testing—Part 1: General Rules. ISO (International Organization for Standardization): Geneva, Switzerland, 2012.
  72. Wang, Y.; Nolte, S.; Gaus, G.; Tian, Z.; Amann-Hildenbrand, A.; Krooss, B.; Wang, M. An Early-Time Solution of Pulse-Decay Method for Permeability Measurement of Tight Rocks. J. Geophys. Res. Solid. Earth 2021, 126, e2021JB022422. [Google Scholar] [CrossRef]
  73. Wang, Y.; Tian, Z.; Nolte, S.; Amann-Hildenbrand, A.; Krooss, B.M.; Wang, M. Reassessment of Transient Permeability Measurement for Tight Rocks: The Role of Boundary and Initial Conditions. J. Nat. Gas. Sci. Eng. 2021, 95, 104173. [Google Scholar] [CrossRef]
  74. Liu, Q.; Hu, L.; Bayer, P.; Xing, Y.; Qiu, P.; Ptak, T.; Hu, R. A Numerical Study of Slug Tests in a Three-Dimensional Heterogeneous Porous Aquifer Considering Well Inertial Effects. Water Resour. Res. 2020, 56, e2020WR027155. [Google Scholar] [CrossRef]
  75. ISO 15708-3; Non-Destructive Testing—Radiation Methods for Computed Tomography—Part 3: Operation and Interpretation. ISO (International Organization for Standardization): Geneva, Switzerland, 2025.
  76. E1814; Standard Practice for Computed Tomographic (CT) Examination of Castings. ASTM International: West Conshohocken, PA, USA, 2025.
  77. Arns, C.H.; Knackstedt, M.A.; Pinczewski, W.V.; Martys, N.S. Virtual Permeametry on Microtomographic Images. J. Pet. Sci. Eng. 2004, 45, 41–46. [Google Scholar] [CrossRef]
  78. Timur, A. Pulsed Nuclear Magnetic Resonance Studies of Porosity, Movable Fluid, and Permeability of Sandstones. J. Pet. Technol. 1969, 21, 775–786. [Google Scholar] [CrossRef]
  79. SoilMoisture Equipment Corp. Operating Instructions Guelph Permeameter. 2012. Available online: https://www.soilmoisture.com (accessed on 21 August 2025).
  80. Reynolds, W.D.; Elrick, D.E. In Situ Measurement of Field-Saturated Hydraulic Conductivity, Sorptivity, and the α-Parameter Using the Guelph Permeameter. Soil. Sci. 1985, 140, 292–302. [Google Scholar] [CrossRef]
  81. Mohanty, B.P.; Kanwar, R.S.; Everts, C.J. Comparison of Saturated Hydraulic Conductivity Measurement Methods for a Glacial-Till Soil. Soil Sci. Soc. Am. J. 1994, 58, 672–677. [Google Scholar] [CrossRef]
  82. Ghibus, T.; Gaitanaru, D. A Statistical Approach for the Assessment of Saturated Hydraulic Conductivity Values of Unsaturated Urban Soils Obtained by Field Infiltration Tests. Water 2024, 16, 1908. [Google Scholar] [CrossRef]
  83. Benavente, D.; Pla, C.; Cueto, N.; Galvañ, S.; Martínez-Martínez, J.; García-del-Cura, M.A.; Ordóñez, S. Predicting Water Permeability in Sedimentary Rocks from Capillary Imbibition and Pore Structure. Eng. Geol. 2015, 195, 301–311. [Google Scholar] [CrossRef]
  84. Alves, C.; Figueiredo, C.A.M.; Sanjurjo-Sánchez, J.; Hernández, A.C. Effects of Water on Natural Stone in the Built Environment—A Review. Geosciences 2021, 11, 459. [Google Scholar] [CrossRef]
  85. Chen, L.; Li, K.; Song, G.; Zhang, D.; Liu, C. Effect of Freeze–Thaw Cycle on Physical and Mechanical Properties and Damage Characteristics of Sandstone. Sci. Rep. 2021, 11, 12315. [Google Scholar] [CrossRef]
  86. Török, Á.; Szemerey-Kiss, B. Freeze-Thaw Durability of Repair Mortars and Porous Limestone: Compatibility Issues. Prog. Earth Planet. Sci. 2019, 6, 42. [Google Scholar] [CrossRef]
  87. Vercher, J.; Borràs, J.G.; Lerma, C.; Mas, Á.; Gil, E. Estimation by Capillary Water Absorption Method to Building Natural Stones’ Durability against Freeze-Thaw. Constr. Build. Mater. 2024, 427, 136215. [Google Scholar] [CrossRef]
  88. Li, B.; Zhang, L.; Wei, J.; Ren, Y. Pore Damage Properties and Permeability Change of Coal Caused by Freeze-Thaw Action of Liquid Nitrogen. Adv. Civ. Eng. 2018, 2018, 5076391. [Google Scholar] [CrossRef]
  89. Gökçe, M.V.; Ince, I.; Fener, M.; Taşkiran, T.; Kayabali, K. The Effects of Freeze-Thaw (F-T) Cycles on the Gödene Travertine Used in Historical Structures in Konya (Turkey). Cold Reg. Sci. Technol. 2016, 127, 65–75. [Google Scholar] [CrossRef]
  90. Draebing, D.; Krautblatter, M. P-Wave Velocity Changes in Freezing Hard Low-Porosity Rocks: A Laboratory-Based Time-Average Model. Cryosphere 2012, 6, 1163–1174. [Google Scholar] [CrossRef]
  91. Hori, M.; Hidenori, M. Micromechanical Analysis on Deterioration Due to Freezing and Thawing in Porous Brittle Materials. Int. J. Eng. Sci. 1998, 36, 511–522. [Google Scholar] [CrossRef]
  92. Rusheng, Q.; Yunsheng, Z.; Yu, Z.; Chuanqing, F.; Cheng, L.; Lin, Y.; Guojian, L. Various Gas Transport Properties in Concrete Considering Transporting Mechanisms and Testing Methods-A Review. Constr. Build. Mater. 2023, 389, 131636. [Google Scholar] [CrossRef]
  93. Shah, V.; Mackechnie, J.; Scott, A. Determination of Carbonation Resistance of Concrete through a Combination of Cement Content and Tortuosity. J. Build. Eng. 2022, 60, 105176. [Google Scholar] [CrossRef]
  94. Andrade, C. Concepts on the Chloride Diffusion Coefficient. In Proceedings of the Third International RILEM Workshop on Testing and Modelling Chloride Ingress into Concrete, Madrid, Spain, 9–10 September 2002; pp. 1–15. [Google Scholar]
  95. Zhang, J.; Bian, F.; Zhang, Y.; Fang, Z.; Fu, C.; Guo, J. Effect of Pore Structures on Gas Permeability and Chloride Diffusivity of Concrete. Constr. Build. Mater. 2018, 163, 402–413. [Google Scholar] [CrossRef]
  96. Dehwah, O.H.A.; Xi, Y. Theoretical Model for the Coupling Effect of Moisture Transport on Chloride Penetration in Concrete. Cem. Concr. Res. 2024, 177, 107431. [Google Scholar] [CrossRef]
  97. Ragoug, R.; Metalssi, O.O.; Barberon, F.; Torrenti, J.M.; Roussel, N.; Divet, L.; d’Espinose de Lacaillerie, J.B. Durability of Cement Pastes Exposed to External Sulfate Attack and Leaching: Physical and Chemical Aspects. Cem. Concr. Res. 2019, 116, 134–145. [Google Scholar] [CrossRef]
  98. Feng, P.; Garboczi, E.J.; Miao, C.; Bullard, J.W. Microstructural Origins of Cement Paste Degradation by External Sulfate Attack. Constr. Build. Mater. 2015, 96, 391–403. [Google Scholar] [CrossRef]
  99. Yu, C.; Sun, W.; Scrivener, K. Mechanism of Expansion of Mortars Immersed in Sodium Sulfate Solutions. Cem. Concr. Res. 2013, 43, 105–111. [Google Scholar] [CrossRef]
  100. Zhang, C.; Li, J.; Yu, M.; Lu, Y.; Liu, S. Mechanism and Performance Control Methods of Sulfate Attack on Concrete: A Review. Materials 2024, 17, 4836. [Google Scholar] [CrossRef]
  101. Shah, V.; Bishnoi, S. Understanding the Process of Carbonation in Concrete Using Numerical Modeling. J. Adv. Concr. Technol. 2021, 19, 1148–1161. [Google Scholar] [CrossRef]
  102. Chen, W.; Wang, P.; Liang, Y. Experimental Study on the Influence of Low Temperature on the Gas Permeability of Granite. Appl. Sci. 2025, 15, 5447. [Google Scholar] [CrossRef]
  103. Wu, J. Experimental Study on Gas Permeability Semiempirical Model of Granite after Heat Treatment. Adv. Civ. Eng. 2022, 2022, 2812413. [Google Scholar] [CrossRef]
  104. García-del-Cura, M.A.; Benavente, D.; Bernabéu, A.; Martínez-Martínez, J. The Effect of Surface Finishes on Outdoor Granite and Limestone Pavers. Mater. Construcción 2007, 58, 289–290. [Google Scholar] [CrossRef]
  105. Laskaridis, K.; Arapakou, A.; Patronis, M.; Papatrechas, C.; Kouseris, I. Effect of Freeze–Thaw Cycles on the Flexural Strength of Greek Natural Stones. Mater. Proc. 2024, 15, 72. [Google Scholar] [CrossRef]
  106. Al-Harthi, A.A.; Al-Amri, R.M.; Shehata, W.M. The Porosity and Engineering Properties of Vesicular Basalt in Saudi Arabia. Eng. Geol. 1999, 54, 313–320. [Google Scholar] [CrossRef]
  107. Wang, L.; Chen, X.; Zhang, W.; Tian, Y.; Xu, S. Study on Changes in Physical and Mechanical Properties and Integrity Decay of Sandstone Subjected to Freeze–Thaw Cycling. Appl. Sci. 2023, 13, 7316. [Google Scholar] [CrossRef]
  108. Xiong, X.; Gao, F.; Li, J.; Zhou, K.; Yang, C. Pore Structure Evolution Characteristics and Damage Mechanism of Sandstone Subjected to Freeze–Thaw Cycle Treatment: Insights from Low-Field Nuclear Magnetic Resonance Testing and Fractal Theory. Fractal Fract. 2025, 9, 293. [Google Scholar] [CrossRef]
  109. Lifshitz Sherzer, G.; Ye, G.; Schlangen, E.; Kovler, K. The Role of Porosity on Degradation of Concrete under Severe Internal and External Brine Attack in Confined Conditions. Constr. Build. Mater. 2022, 341, 127721. [Google Scholar] [CrossRef]
  110. Gan, L.; Xu, W.; Shen, Z.; Xu, L.; Zhang, W.; Zhang, H.; Abbas, M.A.; Chen, G. Experimental and Numerical Investigations on Damage Evolution of Concrete under Sulfate Attack and Freeze-Thaw Cycles. J. Build. Eng. 2023, 71, 106469. [Google Scholar] [CrossRef]
  111. Ren, F.; Chen, X.; Zeng, Q.; Zhou, C. Effects of Pure Carbonation on Pore Structure and Water Permeability of White Cement Mortars. Cement 2022, 9, 8. [Google Scholar] [CrossRef]
  112. Tong, Y.; Li, Z.; Li, M.; Wang, J.; Seibou, A.-O.; Ye, J. Study on Effect of Pore Structure on the Permeability of Concrete after a Century Natural Carbonation. J. Asian Archit. Build. Eng. 2023, 22, 2867–2875. [Google Scholar] [CrossRef]
  113. Huang, Z.; Luo, Y.; Zhang, W.; Ye, Z.; Li, Z.; Liang, Y. Thermal Insulation and High-Temperature Resistant Cement-Based Materials with Different Pore Structure Characteristics: Performance and High-Temperature Testing. J. Build. Eng. 2025, 101, 111839. [Google Scholar] [CrossRef]
  114. Peng, Y.; Tang, S.; Huang, J.; Tang, C.; Wang, L.; Liu, Y. Fractal Analysis on Pore Structure and Modeling of Hydration of Magnesium Phosphate Cement Paste. Fractal Fract. 2022, 6, 337. [Google Scholar] [CrossRef]
  115. Lü, Q.; Qiu, Q.; Zheng, J.; Wang, J.; Zeng, Q. Fractal Dimension of Concrete Incorporating Silica Fume and Its Correlations to Pore Structure, Strength and Permeability. Constr. Build. Mater. 2019, 228, 116986. [Google Scholar] [CrossRef]
  116. Gao, S.; Ji, Y.; Qin, Z.; Zhang, H.; Xing, F.; Liu, A. A Comprehensive Analysis of Pore Structures and Performances of Mineral Admixtures Modified Recycled Aggregate Concrete Based on Experiment and Theory. Constr. Build. Mater. 2022, 358, 129451. [Google Scholar] [CrossRef]
  117. Saha, A.K. Effect of Class F Fly Ash on the Durability Properties of Concrete. Sustain. Environ. Res. 2018, 28, 25–31. [Google Scholar] [CrossRef]
  118. Kewalramani, M.; Khartabil, A. Porosity Evaluation of Concrete Containing Supplementary Cementitious Materials for Durability Assessment through Volume of Permeable Voids and Water Immersion Conditions. Buildings 2021, 11, 378. [Google Scholar] [CrossRef]
  119. Zhang, B.; Tan, H.; Shen, W.; Xu, G.; Ma, B.; Ji, X. Nano-Silica and Silica Fume Modified Cement Mortar Used as Surface Protection Material to Enhance the Impermeability. Cem. Concr. Compos. 2018, 92, 7–17. [Google Scholar] [CrossRef]
  120. Chao, Z.; Wang, H.; Hu, S.; Wang, M.; Xu, S.; Zhang, W. Permeability and Porosity of Light-Weight Concrete with Plastic Waste Aggregate: Experimental Study and Machine Learning Modelling. Constr. Build. Mater. 2024, 411, 134465. [Google Scholar] [CrossRef]
  121. Xie, N.; Akin, M.; Shi, X. Permeable Concrete Pavements: A Review of Environmental Benefits and Durability. J. Clean. Prod. 2019, 210, 1605–1621. [Google Scholar] [CrossRef]
  122. Shan, J.; Zhang, Y.; Wu, S.; Lin, Z.; Li, L.; Wu, Q. Pore Characteristics of Pervious Concrete and Their Influence on Permeability Attributes. Constr. Build. Mater. 2022, 327, 126874. [Google Scholar] [CrossRef]
  123. Mehrabi, P.; Shariati, M.; Kabirifar, K.; Jarrah, M.; Rasekh, H.; Trung, N.T.; Shariati, A.; Jahandari, S. Effect of Pumice Powder and Nano-Clay on the Strength and Permeability of Fiber-Reinforced Pervious Concrete Incorporating Recycled Concrete Aggregate. Constr. Build. Mater. 2021, 287, 122652. [Google Scholar] [CrossRef]
  124. Jiang, Z.; Atilhan, M.; Ozbulut, O.E. Exploring Optimal Dispersion Process Parameters for Fabrication of Graphene-Reinforced Cement Composites. Constr. Build. Mater. 2023, 372, 130805. [Google Scholar] [CrossRef]
  125. Zeng, H.; Lai, Y.; Qu, S.; Yu, F. Effect of Graphene Oxide on Permeability of Cement Materials: An Experimental and Theoretical Perspective. J. Build. Eng. 2021, 41, 102326. [Google Scholar] [CrossRef]
  126. Yang, J.; Ye, C.; Wen, L.; Yu, B.; Tao, W.; Yang, Z.; Yuan, S. Study on the Microscale Structure and Sulfate Attack Resistance of Cement Mortars Containing Graphene Oxide Nanoplatelets. J. Build. Eng. 2023, 78, 107727. [Google Scholar] [CrossRef]
  127. Luo, J.; Zhou, C.; Li, W.; Chen, S.; Korayem, A.H.; Duan, W. Using Graphene Oxide to Improve Physical Property and Control ASR Expansion of Cement Mortar. Constr. Build. Mater. 2021, 307, 125006. [Google Scholar] [CrossRef]
  128. Du, H.; Pang, S.D. Enhancement of Barrier Properties of Cement Mortar with Graphene Nanoplatelet. Cem. Concr. Res. 2015, 76, 10–19. [Google Scholar] [CrossRef]
  129. Win, T.T.; Prasittisopin, L.; Jongvivatsakul, P.; Likitlersuang, S. Investigating the Synergistic Effect of Graphene Nanoplatelets and Fly Ash on the Mechanical Properties and Microstructure of Calcium Aluminate Cement Composites. J. Build. Eng. 2023, 78, 107710. [Google Scholar] [CrossRef]
  130. Alafogianni, P.; Dassios, K.; Tsakiroglou, C.D.; Matikas, T.E.; Barkoula, N.M. Effect of CNT Addition and Dispersive Agents on the Transport Properties and Microstructure of Cement Mortars. Constr. Build. Mater. 2019, 197, 251–261. [Google Scholar] [CrossRef]
  131. Li, L.; Jing, H.; Gao, Y.; Hu, T.; Meng, Y.; Fu, G. Influence of Methylcellulose on the Impermeability Properties of Carbon Nanotube-Based Cement Pastes at Different Water-to-Cement Ratios. Constr. Build. Mater. 2020, 244, 118403. [Google Scholar] [CrossRef]
  132. Gao, Y.; Jing, H.; Zhou, Z.; Shi, X.; Li, L.; Fu, G. Roles of Carbon Nanotubes in Reinforcing the Interfacial Transition Zone and Impermeability of Concrete under Different Water-to-Cement Ratios. Constr. Build. Mater. 2021, 272, 121664. [Google Scholar] [CrossRef]
  133. Gao, Y.; Jing, H.; Zhou, Z.; Chen, W.; Du, M.; Du, Y. Reinforced Impermeability of Cementitious Composites Using Graphene Oxide-Carbon Nanotube Hybrid under Different Water-to-Cement Ratios. Constr. Build. Mater. 2019, 222, 610–621. [Google Scholar] [CrossRef]
  134. Chen, H.; Feng, P.; Du, Y.; Jiang, J.; Sun, W. The Effect of Superhydrophobic Nano-Silica Particles on the Transport and Mechanical Properties of Hardened Cement Pastes. Constr. Build. Mater. 2018, 182, 620–628. [Google Scholar] [CrossRef]
  135. Bai, S.; Yu, L.; Guan, X.; Li, H.; Ou, J. Study on the Long-Term Chloride Permeability of Nano-Silica Modified Cement Pastes Cured at Negative Temperature. J. Build. Eng. 2022, 57, 104854. [Google Scholar] [CrossRef]
  136. Ramezanianpour, A.A.; Mortezaei, M.; Mirvalad, S. Synergic Effect of Nano-Silica and Natural Pozzolans on Transport and Mechanical Properties of Blended Cement Mortars. J. Build. Eng. 2021, 44, 102667. [Google Scholar] [CrossRef]
  137. Bai, S.; Yu, L.; Guan, X.; Li, H.; Ou, J. Comparative Study on Effects of Pozzolanic Nano-SiO2 and Non-Pozzolanic Nano-TiO2 on the Microstructure and Macro Properties of Cement Paste Subjected to Early-Age Frost Attack. Cold Reg. Sci. Technol. 2023, 210, 103841. [Google Scholar] [CrossRef]
  138. Shafaei, D.; Yang, S.; Berlouis, L.; Minto, J. Multiscale Pore Structure Analysis of Nano Titanium Dioxide Cement Mortar Composite. Mater. Today Commun. 2020, 22, 100779. [Google Scholar] [CrossRef]
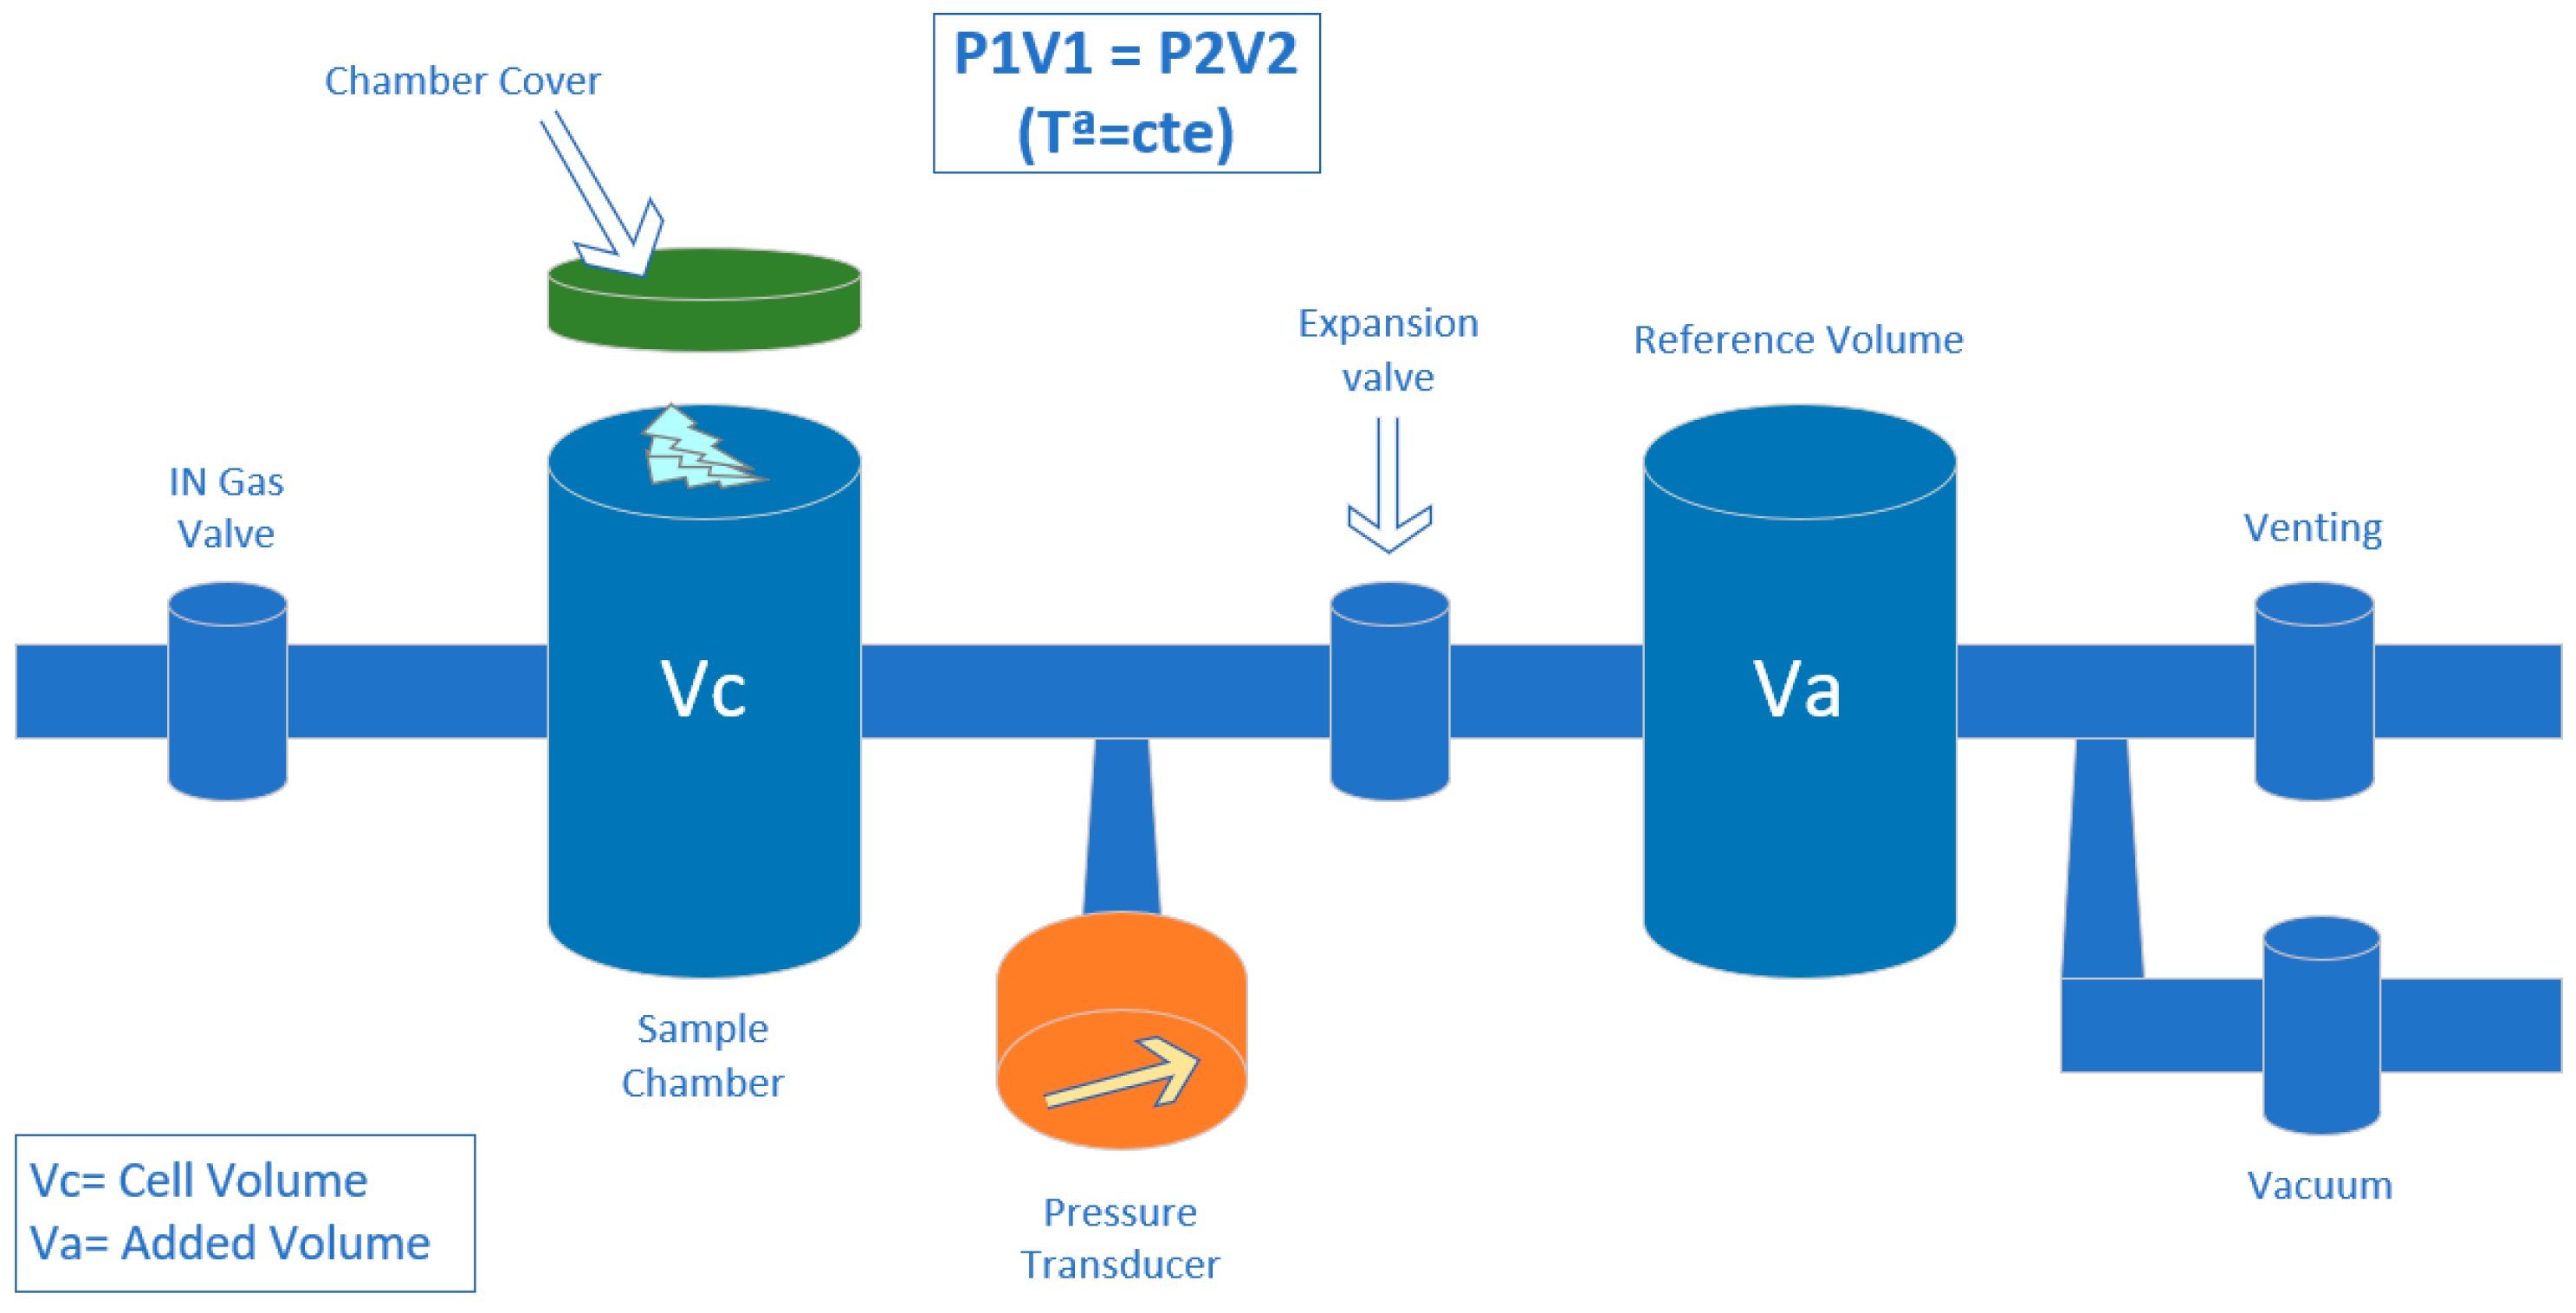
Figure 1. Schematic representation of a helium pycnometer.
Buildings 15 03422 g001
Figure 2. Pore structure of a material.
Buildings 15 03422 g002
Figure 3. Microphotographs of limestone samples obtained with optical microscopy. (a,c): parallel Nicols; (b,d): crossed Nicols. (a,b) are images of the same section; (c,d) are images from the same section. Pores are observed (black arrows) and are partially filled with calcite crystals (white arrows).
Buildings 15 03422 g003
Figure 4. SEM microphotographs of a limestone sample. (a) Unpolished sample. No pores are distinguishable. (b) Polished sample showing pores (white arrows).
Buildings 15 03422 g004
Figure 5. Confocal images of the etched epoxy pore cast of Indiana limestone, where the solid represents the pore space and the etched away grains are white. (A) Resolution of 1.6 µm per pixel; total size of 2.3 mm × 2.3 mm × 0.33 mm. (B) Resolution of 0.34 µm per pixel for the total size of 0.7 mm × 0.7 mm × 0.9 mm. The higher resolution CLSM images allowed detecting types of microporosity: the micritic intragranular microporosity (IGM) can be seen within the grains. The micrite cement (MC) can be seen along the rims of allochems. The inter-particle (IP) pores are the relatively large voids at the junctions of the allochems. Reprinted from Hassan et al. [45].
Buildings 15 03422 g005
Figure 6. Relationship between pore size and freeze–thaw behaviour of stones. Larger pore sizes promote ice crystallization, resulting in higher pressures that fracture the stone.
Buildings 15 03422 g006
Figure 7. An example of pore refinement mechanism in concrete with recycled aggregates and the addition of silica fume (a) With recycled aggregate (RAC) (b) Recycled aggregate with silica fume (SF) (c) Detail of silica fume example [116].
Buildings 15 03422 g007
Figure 8. Examples of pervious concrete usage as a paving material [107].
Buildings 15 03422 g008
Figure 9. Three-dimensional visualization of the porosity of plain cement mortar (bottom) and cement mortar containing 2.5 wt.% of nano-TiO2. Reprinted with the permission of Elsevier from [137].
Buildings 15 03422 g009
Table 1. Fundamental assumptions of the method.
AssumptionImplication/Potential Deviation
Cylindrical pore (or circular throat)The Washburn equation is strictly valid only for cylindrical pore throats, because complex geometries modify the pressure-to-radius P → r conversion
Constant contact angle and surface tension γθ and γ are assumed invariant with pressure and surface chemistry. Coatings, impurities, or heterogeneous surface energies alter θ
Rigid structureThe solid matrix is assumed incompressible. In soft solids (e.g., silica gels and aerogels), elastic compression modifies the intrusion curve
Nonwetting condition. Quasistatic flowPartial wetting phenomena are neglected, and capillary equilibrium is assumed. At high intrusion-pressurization rates, hysteresis increases
Mercury assumed incompressibleIntroduces a small error (<1%) at 400 MPa, generally neglected
Table 2. Principal limitations.
EffectInterpretational Consequence
Ink-bottle effectIf a wide pore communicates with the exterior through a narrow throat, the intrusion pressure records the throat (small r), whereas the wider portion fills a much larger volume. Upon depressurization, extrusion is governed by the throat and hysteresis appears. The actual cavity size remains hidden.
Interparticle porosity intrusionInterparticle voids fill first and can mask the intraparticle porosity distribution. This is usually mitigated by applying a pressure cutoff (e.g., 30–100 kPa) to exclude that volume.
Hysteresis and entrapped mercuryA fraction of Hg remains trapped during pressure decrease (“entrapment”), particularly under rapid depressurization. This complicates the determination of the extruded volume and the quantification of open versus blind (dead-end) pores.
Compressibility of the samplePowders or foams may compact prior to intrusion, artificially reducing the accessible volume and shifting the intrusion curve.
Lower pore size limit (≈3–4 nm)Micropores are not detected. Complement with gas adsorption (N2, Ar, CO2).
Assumption of homogeneous wettabilitySurface-treated materials (e.g., silanes and organics) locally alter θ, introducing a systematic error in r.
Table 3. Summary of the main techniques used for porosity assessment with their strengths and limitations.
TechniqueType of TechniqueApplicable Pore Size and TypeStrengthsLimitationsDestructive
Helium PycnometrySkeletal Density by Gas Displacement~0.1 nm–100 µm (Micropores to Macropores)High precision; non-destructive; indirect methodNo pore size distribution; excludes open voidsNo
Mercury Intrusion Porosimetry (MIP)Pore Size by Mercury Pressure Invasion~3.6 nm–950 µm (Mesopores to Macropores)Wide pore range; connectivity characterizationDestructive; toxic; assumes cylindrical pores; no info on closed porosityYes
N2 Adsorption (BET/BJH)Surface Area and Mesopores by Gas Adsorption~2–50 nm (Mesopores)High sensitivity; surface area and pore volume; non-destructiveNot suitable for macropores; degassing required; limited in micropores (<2 nm)No
NMR RelaxometryPore Distribution by Magnetic Resonance~10 nm–100 µm (Mesopores to Macropores)Non-destructive; total porosity and distributionExpensive equipment; complex interpretation; no info on closed poresNo
Optical MicroscopySurface Pore Observation by Light Microscopy>1 µm (Macropores)Simple; low cost; visual and digital analysis; mineral IDNo 3D info; polish quality affects results; limited to visible poresYes (thin-section preparation)
SEM (Scanning Electron Microscopy)Pore Geometry by Electron Imaging~0.05 µm–100s µm (Mesopores to Macropores)High-resolution 2D imaging; shape and orientation analysis; automatableSmall field of view; 2D only; sample prep required; no closed poresYes (sample preparation)
FIB-SEM Tomography3D Serial Sectioning by Focused Ion Beam + SEM~10 nm–50 µm (Micro- to Mesopores)Nanometre 3D resolution; pore morphology and connectivity; closed pores visualizedSmall sample volume; time-consuming; destructiveYes
Synchrotron µCT (SRµCT)X-ray Tomography with Synchrotron Radiation~50 nm–100 µm (Micro- to Macropores)High-resolution 3D imaging; phase contrast; non-destructive; in situ studies possibleLimited access to synchrotron; data-intensive; sample size limitedNo
CLSM (Confocal Laser Scanning Microscopy)Optical 3D Imaging by Laser Scanning~0.3–5 µm (Visible Pores)Optical 3D imaging; hydrated sample possible; non-destructive; fastLimited depth penetration; resolution limited by opticsNo
Deep Learning SegmentationDigital Image Analysis by Neural NetworksVaries (depends on image input)Robust, automated pore segmentation; adaptable to noisy data; minimal user biasRequires training data; model generalization variesNo (applies to image post-processing)
X-ray Ptychography/Nano-CTCoherent Diffraction/Nano-resolution CT~10–100 nm (Micropores)Ultra-high resolution; access to closed pores; no sectioning requiredVery limited availability; sample size very small; complex data processingNo
Table 4. Summary of the main techniques used for permeability assessment with their strengths and limitations.
TechniqueType of TechniqueApplicable Pore Size and TypeStrengthsLimitationsDestructive
Gas Permeametry (N2, He)Steady-State Flow via Darcy’s Law (with Klinkenberg Correction)~10−21 to 10−14 m2 (Nanopores to Micropores)High sensitivity and resolution; ideal for dense, dry specimens; provides intrinsic permeability; rapid testingAssumes cylindrical pores and laminar flow; inaccurate for cracked or saturated materials; not reliable below ~10−18 m2 without advanced setupsNo
Classical Hydraulic PermeametrySteady-State Flow with Water or Brine~10−18 to 10−12 m2 (Micropores to Mesopores)Direct measurement; applicable to soils, rocks, concretes; standardized across materialsRequires full saturation; sensitive to air bubbles; very slow for low-k materialsNo
Transient Pressure Methods (Pulse/Slug Tests)Pressure–Relaxation Analysis (Gas or Liquid)~10−22 to 10−13 m2 (Ultralow to Low Permeability)Rapid and sample-efficient; ideal for tight materials; no steady-state neededLoses accuracy for high-k materials; non-unique response in fractured or heterogeneous media; lacks mass-balance checkNo
Image-Based (e.g., µCT + Simulation)Digital Twin via Stokes–Brinkman Simulation<10−20 m2 (Nanopores to Micropores)Non-invasive; resolves anisotropy; works with very small or damaged samplesDepends on image quality, segmentation accuracy, and assumptions; validation requiredNo
NMR Relaxometry and Indirect CorrelationsMagnetic Relaxation Mapping + Empirical ModelsMaterial dependent; calibrated to known samplesFast; no real flow required; applicable to microporous rocks and concreteRequires calibration dataset; not direct; lower reliability for certificationNo
Field Infiltration (e.g., Guelph, Ring Infiltrometer)In situ Quasi-Steady Flow~10−14 to 10−10 m2 (Soils to Aggregates)Minimal disturbance; captures real-field conditions; fast for shallow layersSensitive to soil heterogeneity, surface conditions, and water level controlNo
Table 5. Summary of the influence of porosity and permeability on degradation mechanisms of cement-based materials.
Degradation MechanismInfluence of PorosityInfluence of Permeability
Freeze–thaw
-
Higher porosity increases water absorption and retention, elevating ice-induced stress during freeze cycles;
-
Stones with micropores (<0.1 μm) are more resistant (water does not freeze easily);
-
Mesopores/macropores enable ice crystallization, promoting internal cracking;
-
Repeated cycles increase total porosity and shift pore size distribution.
-
Initial permeability may assist drainage but deteriorates as cracks form;
-
Freeze–thaw cycling reduces permeability due to pore collapse and structural damage;
-
Increased permeability after cracking accelerates further water ingress and degradation.
Chloride attack
-
High porosity increases diffusion rate of chloride ions;
-
Open pore structure allows for an easier access of chlorides to reinforcement;
-
Expansive products can cause cracks when growing in confined pore space.
-
High permeability promotes movement of chloride ions with water.
Sulphate attack
-
Larger pore size allows for easier growth of corrosion products;
-
Higher crystallization pressure is exerted in small pore diameters.
-
High permeability allows for an easier infiltration of sulphate water solutions;
-
High permeability allows for easier oversaturation of pore solution with sulphate ions
Carbonation
-
Open pore structure and higher porosity allow for easier CO2 diffusion;
-
Porosity can be reduced throughout the carbonation due to calcite formation.
-
With high permeability and more water in pore solution CO2 can dissolve easily.
Table 6. Key concepts described in the case study for cementitious materials.
ConceptBenefitsChallenges
Fractal theory in modelling porosityA detailed mathematical model which provides clear numerical comparisonMore experimental evidence is needed to make models more robust
Considering porosity in modelling of concrete degradationA more complex model including an important factor of porosityOptimization of modelling approaches, more experimental evidence
Controlling of porosity through mix designMultiple well-established and reliable additionsMix design of ecological concretes with waste materials is complex
Pervious concreteA way of using high permeability in a beneficial wayA more complex mix design to combine high permeability with other properties
Disclaimer/Publisher’s Note: The statements, opinions and data contained in all publications are solely those of the individual author(s) and contributor(s) and not of MDPI and/or the editor(s). MDPI and/or the editor(s) disclaim responsibility for any injury to people or property resulting from any ideas, methods, instructions or products referred to in the content.