Article

External Temperature Distribution and Characteristics of Building-Integrated Photovoltaics (BIPV) Under Summer High-Temperature Conditions

1
School of Architecture and Urban Planning, Shandong Jianzhu University, Jinan 250101, China
2
School of Art, Shandong Jianzhu University, Jinan 250101, China
*
Author to whom correspondence should be addressed.
Buildings 2025, 15(18), 3415; https://doi.org/10.3390/buildings15183415
Submission received: 8 August 2025 / Revised: 15 September 2025 / Accepted: 17 September 2025 / Published: 22 September 2025

Abstract

This study investigates the external environmental temperature distribution of a small single-story BIPV building on a university campus in Jinan City, Shandong Province, China, under the most adverse summer high-temperature conditions. The temporal and spatial distribution characteristics and variation patterns of building external temperature are analyzed. The results indicated the following: (1) During summer high-temperature days, the peak temperature of the BIPV photovoltaic surface reached 52.4 °C, which is 17.4 °C higher than the ambient temperature. (2) External measurement points exhibited significant daytime heating (+2.86 °C) and nighttime cooling (average relative temperature increment of −1.52 °C). (3) Complex nonlinear temperature gradient variations existed within the 10–100 cm range from the surface, with localized heat accumulation occurring around 60 cm, where 77% of high-temperature days show temperature gradient anomalies. (4) Based on dimensionless analysis, a modified Richardson criterion for BIPV buildings is established: Ri < 0.3 represents building-geometry-dominated mechanisms, and Ri > 0.7 represents thermal-plume-dominated mechanisms. The critical values occur earlier than in classical theory. (5) Solar radiation and wind speed are key factors affecting temperature distribution, with more pronounced local heat accumulation under low-wind-speed conditions. This study provides scientific evidence for BIPV building performance optimization and environmental control.

1. Introduction

Climate change and biodiversity loss represent the two most serious contemporary crises. Carbon emission reduction, as an important measure to mitigate global warming, has become a crucial task for economic, social, and technological development worldwide. According to statistics, the building sector remains a key driver of the climate crisis, consuming 32% of global energy and contributing to 34% of global CO2 emissions. Building sector carbon emissions have consistently remained at high levels. Currently, utilizing solar photovoltaic power generation has become the optimal pathway for building energy conservation and decarbonization, particularly Building-Integrated Photovoltaics (BIPV) [1], which has gradually emerged as an innovative solution that achieves both energy production and architectural aesthetics.
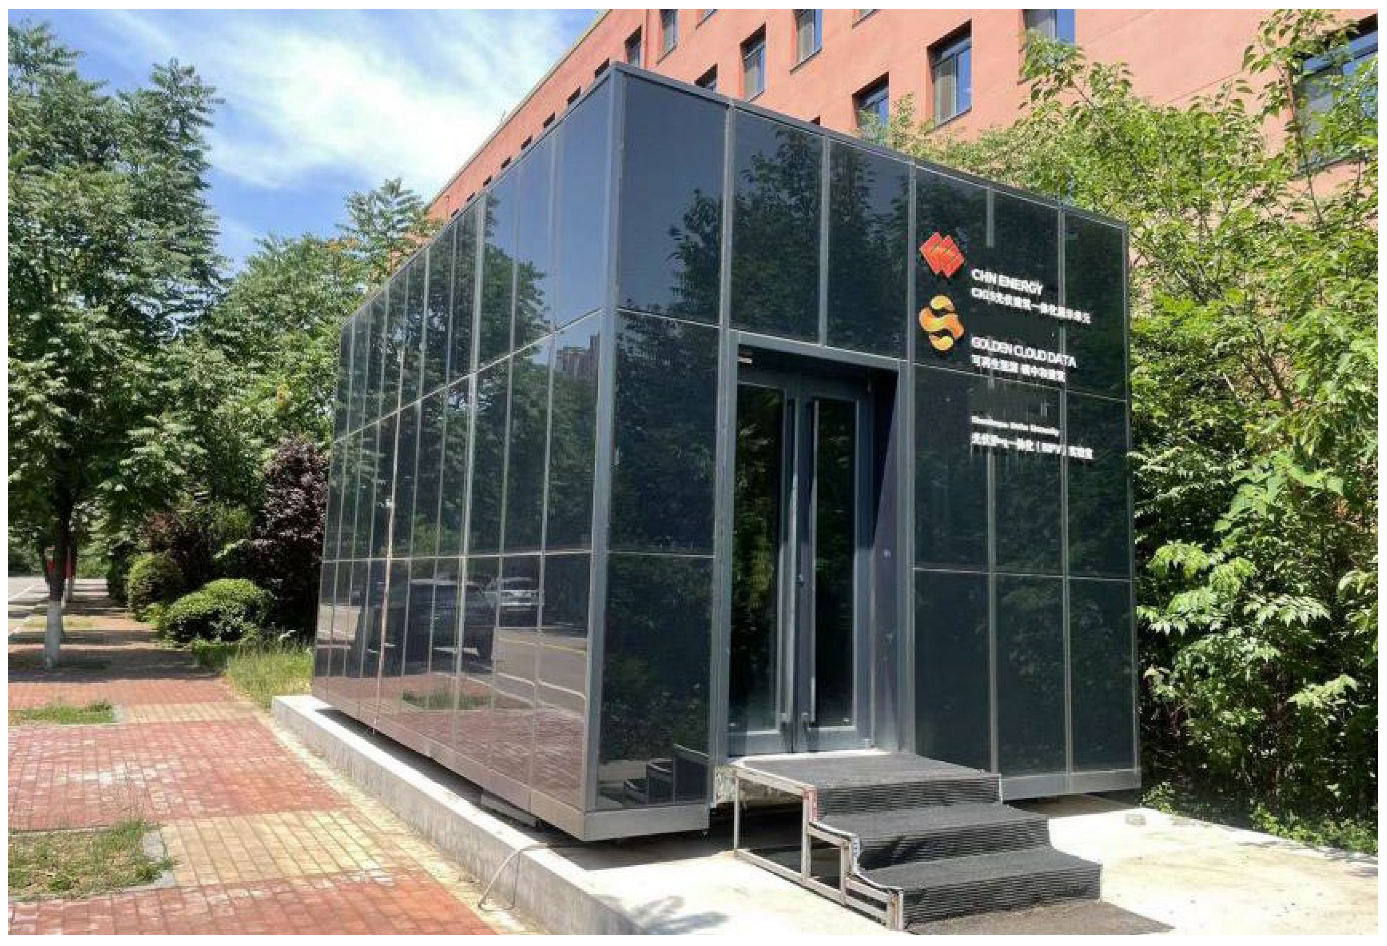
Unlike Building-Applied Photovoltaics (BAPV), BIPV (Figure 1) utilizes building roofs, facades, and other components to directly integrate PV modules as part of the building envelope, achieving efficient utilization of building exterior surfaces while converting solar energy into electrical energy through PV modules, realizing building “self-generation and self-consumption” [2]. Among these applications, BIPV facade applications have significant potential in curtain wall buildings and high-density urban spaces. However, BIPV building development faces numerous challenges, particularly thermal effects. Since building envelopes integrate PV modules—dark, heat-absorbing materials—the heat generation from PV modules directly affects both indoor and outdoor environments, especially during summer high-temperature weather.
Research on the interaction between building PV systems and surrounding environments is generally conducted through experimental studies [3], field measurement studies [4], fluid mechanics and thermodynamics theoretical analysis [5], and model simulation studies [6]. Among these research methods, studies on individual BIPV buildings typically employ field measurements or combinations of field measurements with theoretical analysis, while regional or urban-scale studies generally utilize computational simulation methods due to the lack of experimental samples. Computational simulations are also based on algorithms generated from extensive theoretical and experimental results. Therefore, measurement studies based on actual buildings hold significant theoretical importance for research development in this field.
In thermal effects and temperature distribution research for PV buildings (collectively referring to BIPV and BAPV), some studies conclude that PV buildings cause surrounding warming and even exacerbate urban heat islands. For example, Berardi et al. [7] and Brown et al. [8] both demonstrated that PV systems caused outdoor temperature increases. Vassiliades et al. [9] investigated differences before and after building facade-integrated PV systems, finding that PV replacement of original facades led to 1–2 °C temperature increases in surrounding areas, though without major regional thermal environment impacts. Roeleveld et al. [6] also found through field measurements that “the addition of PV to the white roof resulted in a daytime increase in sensible flux by more than a factor of 10,” indirectly leading to increased summer air conditioning energy consumption. Fassbender et al. [10] demonstrated not only +1.35 K daytime heating effects but also −1.19 K nighttime cooling effects of building PV systems. Additional studies by Sailor et al. [11] and Elhabodi et al. [12] indicated that building PV systems exacerbate urban heat island effects “because of their nature of low albedo and heat dispersion” by altering building surface reflectivity. These studies demonstrated that building PV systems have heating effects on surrounding environments, while nighttime effects require clarification.
Another portion of research in this field concludes that PV buildings reduce surrounding temperatures and mitigate urban heat islands. Refs. [13,14,15] demonstrated, using Sydney, Japan, and Paris regions as examples, that building PV system deployment achieves both daytime and nighttime cooling effects. Through meteorological modeling of Los Angeles areas, Taha [16] found that large-scale PV deployment has no adverse effects on air temperature and urban heat islands, with large-area PV panel deployment exceeding 10% conversion efficiency, producing cooling effects. Other literature [17,18] also clarified positive benefits brought by PV systems in PV buildings, though rarely considering enhancement or reduction effects on positive benefits due to photovoltaic thermal effects [19], which represents one of the purposes and significances of this study.
The contradictory research conclusions stem from several key differences. First, research methodologies vary significantly. Field measurement studies [7,8,9,10,11] predominantly show heating effects. In contrast, large-scale numerical simulations [14,15,16,17,18] tend to show cooling effects. Field measurements capture localized thermal effects better. Large-scale simulations focus more on regional energy balance. Second, there are variations in climatic conditions. Findings supporting heating effects predominantly originate from hot, arid regions [7,8], whereas studies indicating cooling effects often involve relatively temperate climates [13,15], suggesting climate conditions may be a key moderating factor. Third, there are building type variations. BIPV and BAPV buildings exhibit fundamentally different thermal behaviors due to their distinct integration methods. While BAPV studies dominate the literature, their findings cannot be directly extrapolated to BIPV buildings.
Several issues emerge from this literature review. First, current BIPV external temperature characteristics lack clear explanations. The results are often contradictory, and spatial temperature distribution studies lack sufficient detail. Second, many related studies focus on rooftop PV mounting systems, lacking BIPV building PV systems, particularly facade PV system case studies. Finally, the temperature response mechanisms under the most adverse conditions of extreme summer high-temperature weather remain unclear. Therefore, this paper uses a single-story BIPV building with facade photovoltaics as an experimental platform to conduct external temperature measurements under summer high-temperature weather, aiming to understand the most adverse “thermal” impacts of BIPV buildings. The research content holds theoretical significance for building optimization design, thermal environment improvement, and system energy efficiency enhancement.

2. Data and Methods

2.1. Measurement Object

The measurement object is located within a university campus in Jinan, Shandong Province, China. It serves as an experimental platform jointly established by the National Energy Administration and the university. The experimental building is a regular single-story BIPV building with dimensions of 3.9 m in height, 6.6 m in length, and 4 m in width (Figure 2). As shown in Figure 2, the building’s south side is adjacent to a pedestrian crosswalk with a 2 m width and red permeable paving. During summer, the building’s north side is surrounded by trees and shrubs, with partial vegetation blocking on the east and west sides.
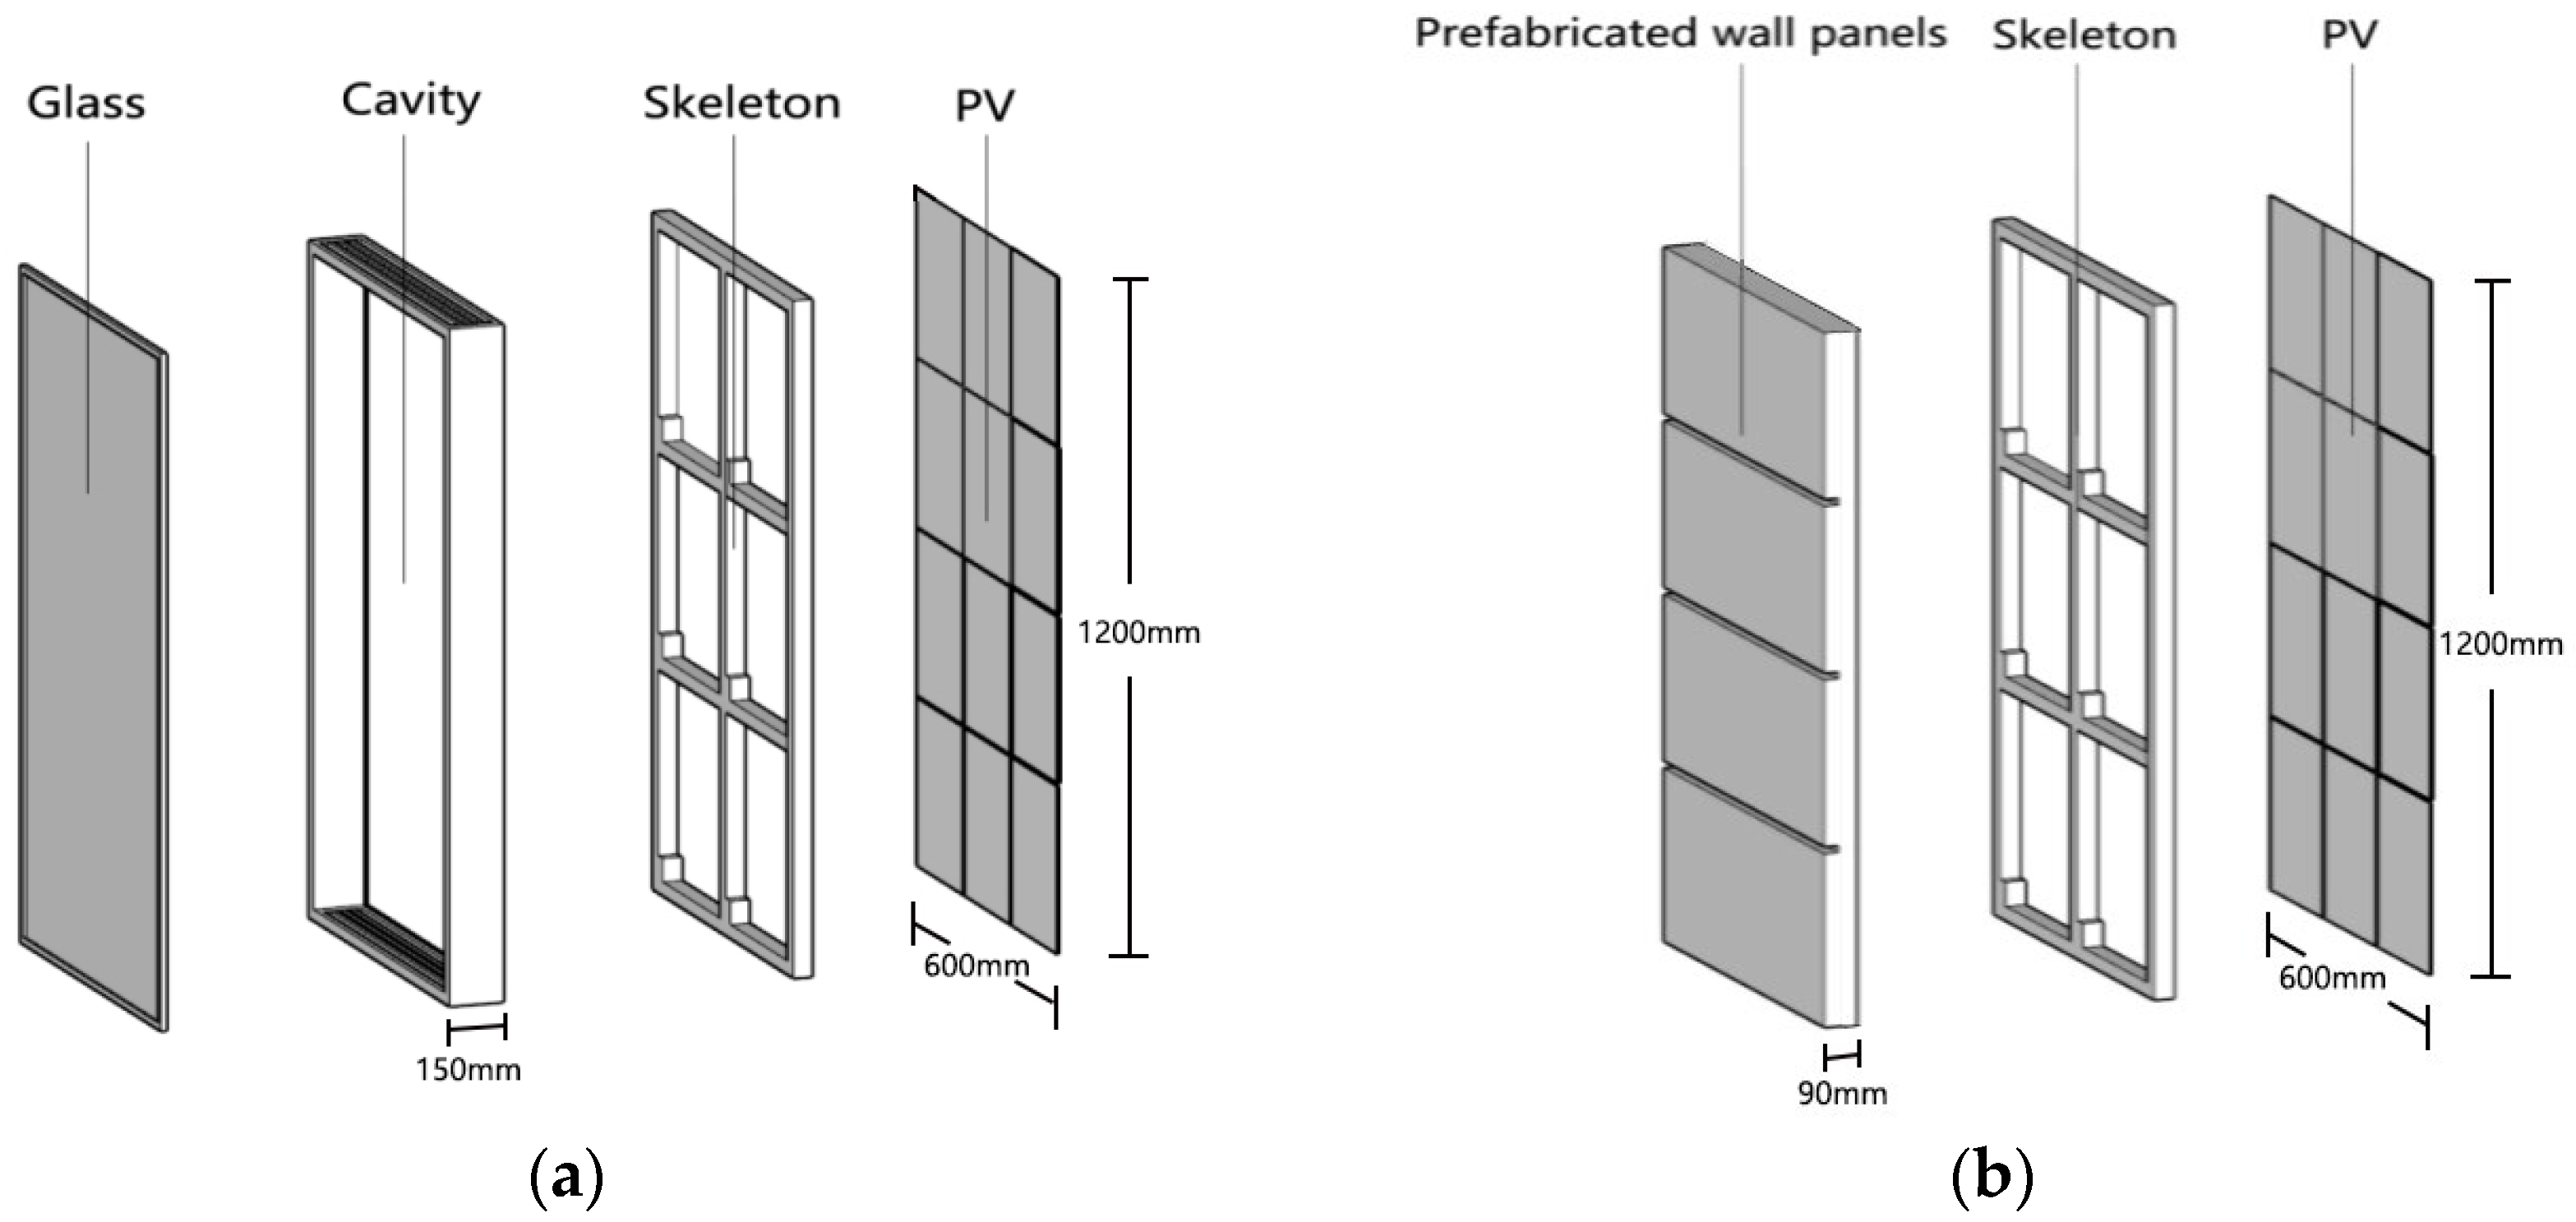
The building’s roof employs a steel-structured modular roof system, with two photovoltaic panels positioned at the central location on the roof. The building’s exterior facade employs two structural forms for installing copper indium gallium selenide solar PV modules with 16% conversion efficiency. The individual PV module dimensions are 600 mm × 1200 mm. The south facade features a PV–air gap–glass curtain wall structure with louvers at the top and bottom of the air gap, while the other three facades utilize PV–prefabricated wall panel structures (Figure 3).

2.2. Measurement Scheme

2.2.1. Measurement Instruments

The measurement utilized the following instruments and auxiliary materials: outdoor small weather station, non-contact thermometer, temperature sensors (Figure 4), outdoor waterproof tape, aluminum foil insulation tape, pipe protection sleeves, and other auxiliary materials. The temperature sensor probes have built-in ventilation and heat insulation protective covers. Auxiliary materials ensure better waterproofing and radiation interference protection for outdoor temperature measurement probes. All temperature sensors underwent two-point calibration using an ice–water mixture (0 °C) and boiling water (100 °C) before and after measuring.
Table 1 summarizes the measurement parameter information for sensors used in the study.

2.2.2. Measurement Point Layout

The measurement consists of two parts, outdoor temperature measurement and building PV module surface measurement:
(1)
Outdoor parameter measurement:
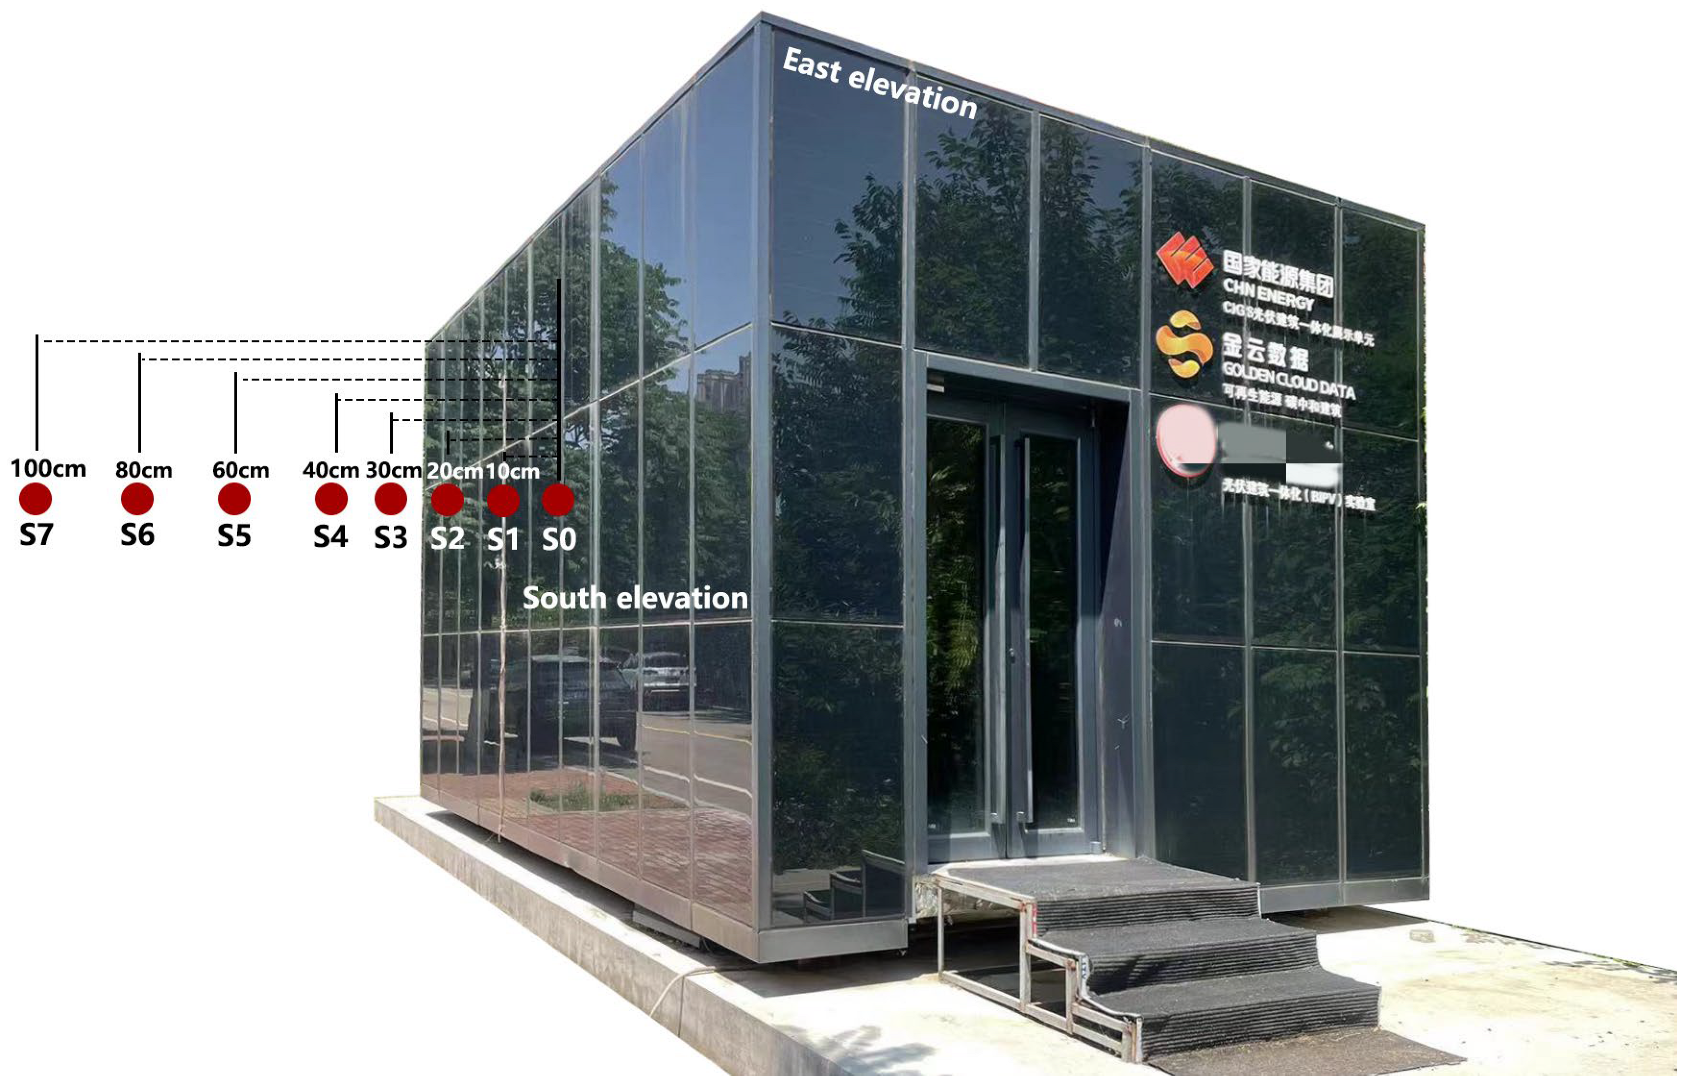
Outdoor parameter measurement includes outdoor environmental meteorological parameter collection and building external temperature data collection. Outdoor environmental meteorological parameters are collected through outdoor weather stations to understand climate characteristics of the building’s location environment. The collected environmental temperature, wind speed, and solar radiation are represented as T, V, and G, respectively. Outdoor temperature measurement uses temperature sensors on the south facade exterior, 2 m above ground level, with horizontal measurement points at distances of 10 cm, 20 cm, 30 cm, 40 cm, 60 cm, 80 cm, and 100 cm from the building exterior surface, named S1, S2, S3, S4, S5, S6, and S7, respectively, totaling 7 measurement points (Figure 5).
The selection of measurement distances is based on three considerations: (1) Building aerodynamics theory: According to established principles of building flow separation, critical flow transition occurs at a distance of 0.1–0.2 H from the vertical facade [20], where H represents building height (3.9 m). This corresponds to an actual measurement range of 39–78 cm, so the set 0–100 cm range covers the key thermal flow variation zone. (2) General thermal boundary layer patterns: The thermal boundary layer for building photovoltaic applications typically extends outward approximately 2.0 m from the heated surface [10]. The south facade of the experimental subject directly adjoins the sidewalk. Due to sidewalk width constraints, measurement points could not extend to the roadway area. Effects beyond this range can be obtained through mathematical modeling or numerical simulation based on established measurement patterns. (3) Preliminary observation: Initial pre-experimental tests indicated that measurement points beyond 100 cm were minimally affected by the heated surface, gradually approaching ambient conditions.
The distribution and names of the measurement points are shown in Table 2.
(2)
Building PV module surface temperature measurement:
A measurement point is installed on the building’s south facade PV exterior surface and named S0 (Figure 5). Direct installation of measurement points would cause problems. Temperature probes and tape would shade the PV modules. This would lead to measurement errors. Therefore, the south facade measurement used non-contact thermometry.

2.3. Measurement Time and Data Processing

2.3.1. Measurement Time and Spatial Classification

This study’s measurement period covered 1–31 August 2024, for a total of 31 days during summer, with data collection set at 10 min intervals. This paper defines days with maximum daily temperatures ≥ 35 °C as high-temperature days (Chinese meteorological industry standard). During the measurement period, 7 high-temperature days were recorded and classified according to temperature–radiation–wind speed factors (Table 3). As shown in the table, August 3 and August 24 both have high maximum temperatures but significant differences in radiation and wind speed. Since radiation and wind speed are important factors affecting external temperature distribution, these two days are selected as typical days A and B for in-depth analysis. Typical day A is characterized by high temperature–high radiation–high wind speed, while typical day B features high temperature–low radiation–low wind speed.
Daily data are divided into daytime and nighttime periods and characteristic periods. Daytime and nighttime periods are divided as follows: daytime includes 06:00–20:00, and nighttime includes 20:00–06:00. Characteristic periods within the daytime are divided as follows: heating period (06:00–13:00), high-temperature period (13:00–17:00), and evening cooling period (17:00–20:00). Based on the above content, measurement time is classified as follows:
  • High-temperature days: 7 days;
  • Typical high-temperature days: 2 days;
  • Day/night periods: 2 periods;
  • Characteristic periods: 3 periods.
Additionally, measurement points are spatially classified according to the distance from the building exterior facade PV surface:
  • Near surface: 0~10 cm;
  • Short distance: 10~40 cm;
  • Medium distance: 40~80 cm;
  • Long distance: >80 cm.
The seven measurement points provide adequate spatial resolution for capturing thermal gradient variations. A high-density measurement interval of 10 cm is employed at depths between 10 and 40 cm to capture rapid temperature changes near the surface. Meanwhile, a wider interval of 20 cm is used at depths between 40 and 100 cm, sufficient to record the gradual recovery of temperature toward ambient conditions.

2.3.2. Data Collection and Processing

This paper treats 10 min interval data as raw data, with hourly temperatures represented by averages of six 10 min data points within each hour as initial data, effectively reducing data volume while ensuring data source reliability and comprehensiveness. The measurement collected 1008 raw data points, forming 168 initial data points. The collected data underwent standardized preprocessing according to requirements, yielding the following data types for subsequent analysis:
  • Daily maximum temperature, daily minimum temperature, and average temperature.
  • Daily temperature variation rate: This is the variation amplitude between maximum and minimum temperatures.
  • Relative temperature increment: This is the difference between the measurement point temperature and simultaneous ambient temperature.
  • Heating/cooling rate: This is the ratio of the temperature difference to time over a period.
  • Temperature gradient: This is the ratio of the temperature difference between adjacent measurement points to distance.

3. Results

3.1. Overall Thermal Effects on High-Temperature Days

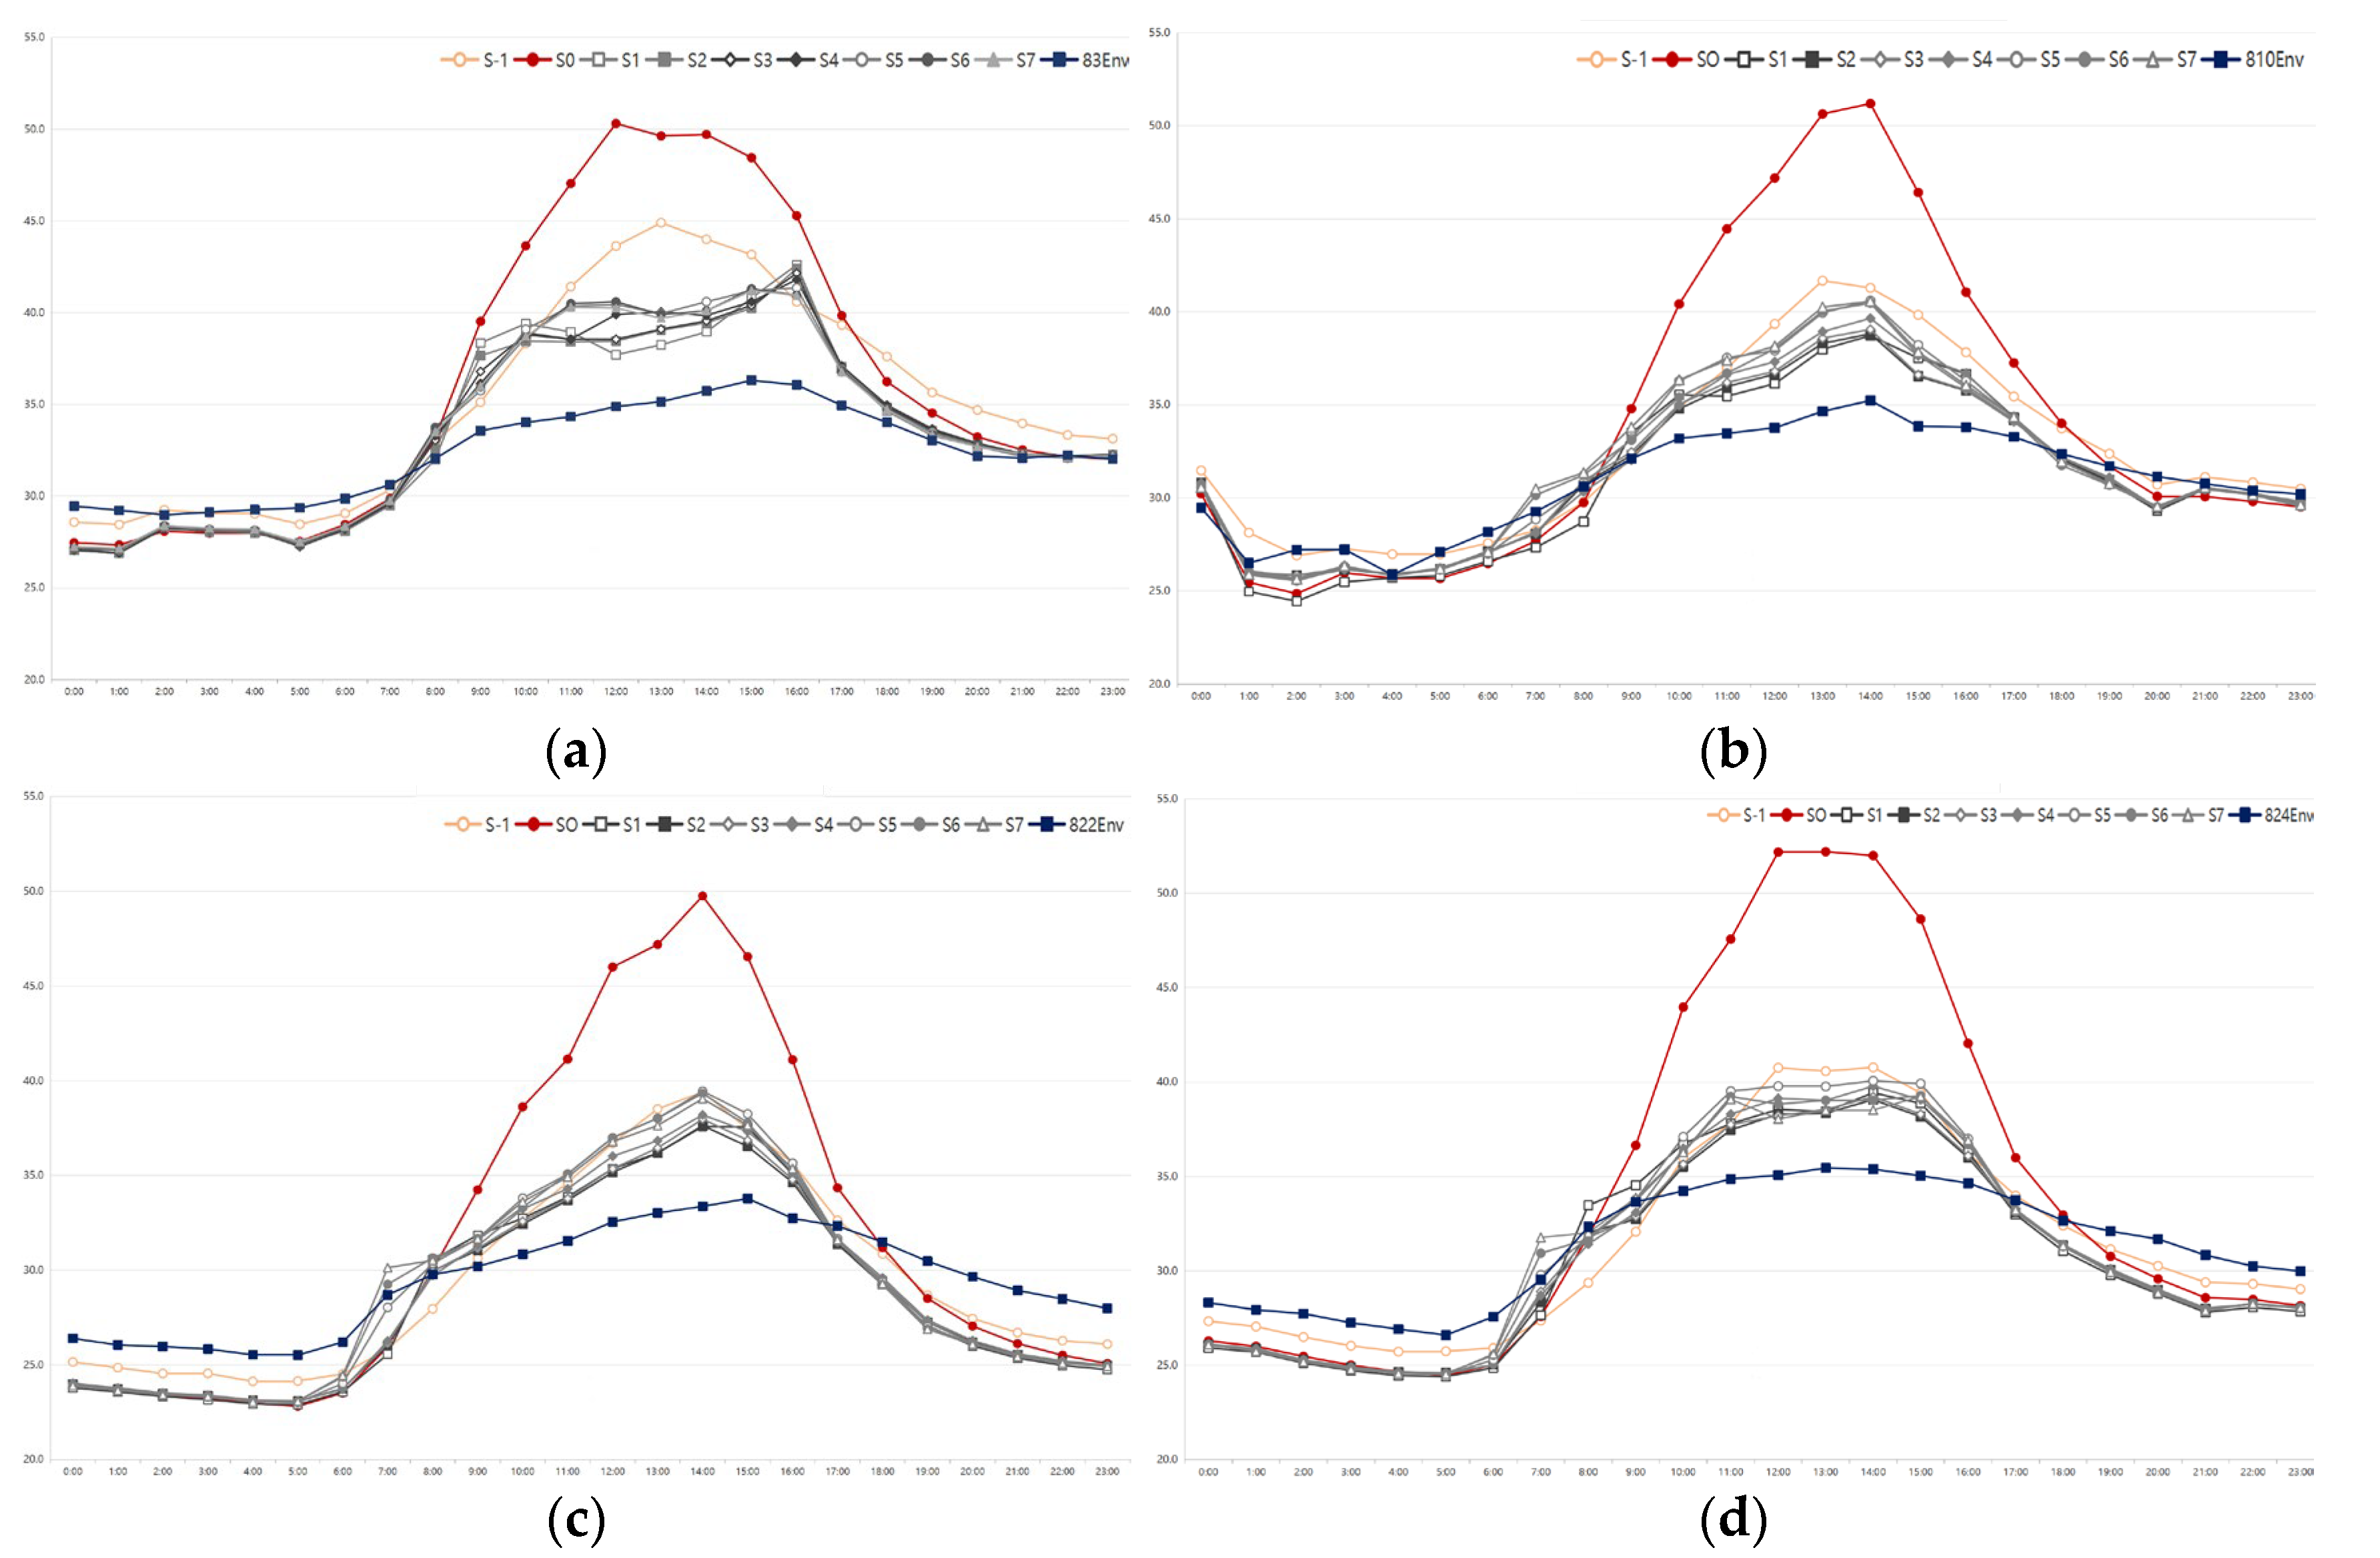
Figure 6 shows daily temperature curves for four high-temperature days, clearly illustrating the temporal characteristics of the temperature distribution. Red curves represent PV surface temperature S0, blue curves represent ambient air temperature T, and gray curves represent building exterior measurement point temperatures S1~S7. The seven-day temperature curves showed that during summer high-temperature days, the BIPV external temperature distribution exhibited the following characteristics:
  • Daytime heating effect (DHE):
During daytime periods (06:00–20:00), measurement point temperatures are generally higher than simultaneous ambient temperatures. External measurement points showed average relative temperature increments of 2.65~3.35 °C, with an overall average relative temperature increment of 2.86 °C, exhibiting heating effects. Maximum heating effects occur during 12:00~16:00, with peak relative temperature increments reaching 6.5 °C.
2.
Nighttime cooling effect (NCE):
During nighttime periods (20:00–06:00), measurement point temperatures show differences from ambient temperatures ranging from −2.86 to 0.08 °C, with an average relative temperature increment of −1.52 °C, demonstrating overall cooling effects.
3.
Surface temperature characteristics:
BIPV surface daily maximum temperatures ranged from 49.8 to 52.4 °C, averaging 51.2 °C, with surface temperatures averaging 15.7 °C higher than ambient temperatures. The surface temperature daily ranges were significantly larger than the ambient temperature daily ranges.
4.
Net thermal effect intensity (NTE):
The net thermal effect intensity ranges from 0.07 to 3.43 °C, with net thermal effects significantly correlated with the daytime heating effect intensity. The NTE is the sum of the average daytime relative temperature increment and the average nighttime relative temperature increment, expressed as follows:
N T E = Δ T d + Δ T n
ΔTd is the average daytime relative temperature increment (°C), and ΔTn is the average nighttime relative temperature increment (°C); positive values indicate heating, while negative values indicate cooling.

3.2. Temperature Temporal Distribution Under High-Temperature Weather

3.2.1. Daytime Temperature Variation

During the daytime, building surrounding ambient air is significantly heated above the environmental air temperature. Typical day A shows relative temperature increments of 2.5~2.9 °C in the 10–100 cm region, while typical day B shows relative temperature increments of 0.7~1.6 °C. Figure 7 shows important relationships between the two typical days. Both relative temperature increments and absolute temperatures were higher on day A than on day B. This indicates a strong correlation between the external air temperature and radiation intensity. The following analyzes daytime periods divided into three characteristic periods.
The characteristic periods are as follows:
  • Heating period (6:00–13:00):
During the heating period, all measurement point temperatures continuously rise. Typical day A shows surface heating rates of 3.1 °C/h and external measurement point heating rates of 1.4–1.7 °C/h. Typical day B shows surface heating rates of 3.9 °C/h and external measurement point heating rates of 1.8–2.1 °C/h, as shown in Figure 8a. Despite typical day A having higher average radiation intensity than typical day B, typical day B measurement point heating rates are generally higher than those of typical day A, indicating that wind speed has an inhibitory effect on surface and external temperature rises. This inhibitory effect gradually weakens with increasing distance and nearly disappears at 100 cm. Both typical days show that differences between external measurement point temperatures and ambient temperatures gradually increase during heating, indicating that BIPV thermal effects intensify with increasing solar radiation.
2.
High-temperature period (13:00–17:00):
During the high-temperature period, the temperature distribution reaches daily peaks and remains relatively stable. Typical day A external measurement points showed relative ambient temperature increments of 3.1~6.5 °C, averaging 4.63 °C. Typical day B shows relative temperature increments of 1.4~4.9 °C, averaging 3.28 °C. External measurement point average temperatures and relative temperature increments for typical day A are generally higher than those for typical day B (Figure 9), indicating that high-temperature period relative temperature increments are primarily influenced by solar radiation. Additionally, surface temperatures reach peaks during this stage: 50.3 °C for typical day A and 52.2 °C for typical day B. Typical day A surface temperatures are lower than those of typical day B, while surrounding external air measurement point temperatures show opposite trends. This phenomenon may stem from two primary causes: (1) Surface forced convection effect: Under high wind speeds, the forced convective heat transfer coefficient of the BIPV surface significantly increases, leading to a decrease in surface temperature. (2) Horizontal heat transfer: At low wind speeds, heat generated by the building surface primarily diffuses through vertical natural convection. At high wind speeds, however, heat is increasingly transferred horizontally to distant areas via horizontal forced convection, causing temperatures to rise in regions beyond the surface.
3.
Evening cooling period (17:00–20:00):
During the cooling period, all measurement point temperatures showed declining trends but maintained positive temperature differences relative to the ambient temperature. Heat accumulated during the day was being slowly released, a phenomenon attributable to the substantial heat capacity of PV, demonstrating the thermal inertia characteristic of BIPV buildings. Measurement point cooling rates are shown in Figure 8b.

3.2.2. Nighttime Temperature Temporal Distribution

During the nighttime (20:00–06:00 next day), typical day A external measurement points showed nighttime average temperatures basically identical to the ambient air temperature, even producing weak heating effects. Typical day B demonstrated clear and stable cooling effects, with measurement points averaging 2.0~2.2 °C lower than the ambient temperature, as shown in Figure 10a. As shown in Figure 10b, since external measurement point cooling rates are generally within −0.15 °C/h after 22:00, temperature differences gradually decrease, and the temperature distribution becomes uniform, basically indicating that external thermal effects have dissipated.

3.2.3. Temporal Distribution Characteristics of Temperature

Through analysis of the temporal temperature distribution for two typical days, key characteristics and patterns of BIPV external temperature distribution under high-temperature weather can be summarized:
  • Thermal response lag:
“Thermal response lag (TRH)” is defined as the difference between peak temperature occurrence times at different distance measurement points and the surface temperature peak time, representing thermal response lag characteristics of external measurement points relative to PV surface thermal effects. Table 4 lists the TRH values for different measurement points on two typical days. This difference indicates that thermal response lag effects are primarily related to the daytime solar radiation intensity, with effects on the thermal response lag gradually weakening as the distance from the exterior surface increases.
2.
Thermal inertia:
“Thermal inertia (TI)” is defined as the time required for PV skin and external measurement point temperatures to decrease to near-ambient temperature (±0.2 °C), starting from 17:00 during the daytime cooling period. It represents the ability of BIPV systems to maintain heat and temperature after heating. For typical day A, the PV skin TI is approximately 6 h, and the external measurement point TI is approximately 5 h. For typical day B, the PV skin TI is approximately 1 h, and the external measurement point TI is <1 h. The TI values fully demonstrate that under high-radiation and high-wind-speed conditions, BIPV systems generate external heat with greater thermal inertia and stronger system heat storage capacity, with skin thermal inertia typically lasting longer than that of external air.
3.
Comprehensive thermal effect comparison:
Typical day A showed +3.35 °C daytime heating effects and +0.08 °C weak nighttime heating effects, resulting in +3.43 °C net thermal effects. Typical day B showed +2.85 °C daytime heating effects and −2.04 °C nighttime cooling effects, resulting in +0.81 °C net thermal effects. This indicated significant differences in net thermal effects produced by BIPV under different meteorological conditions.

3.3. Temperature Spatial Distribution Under High-Temperature Weather

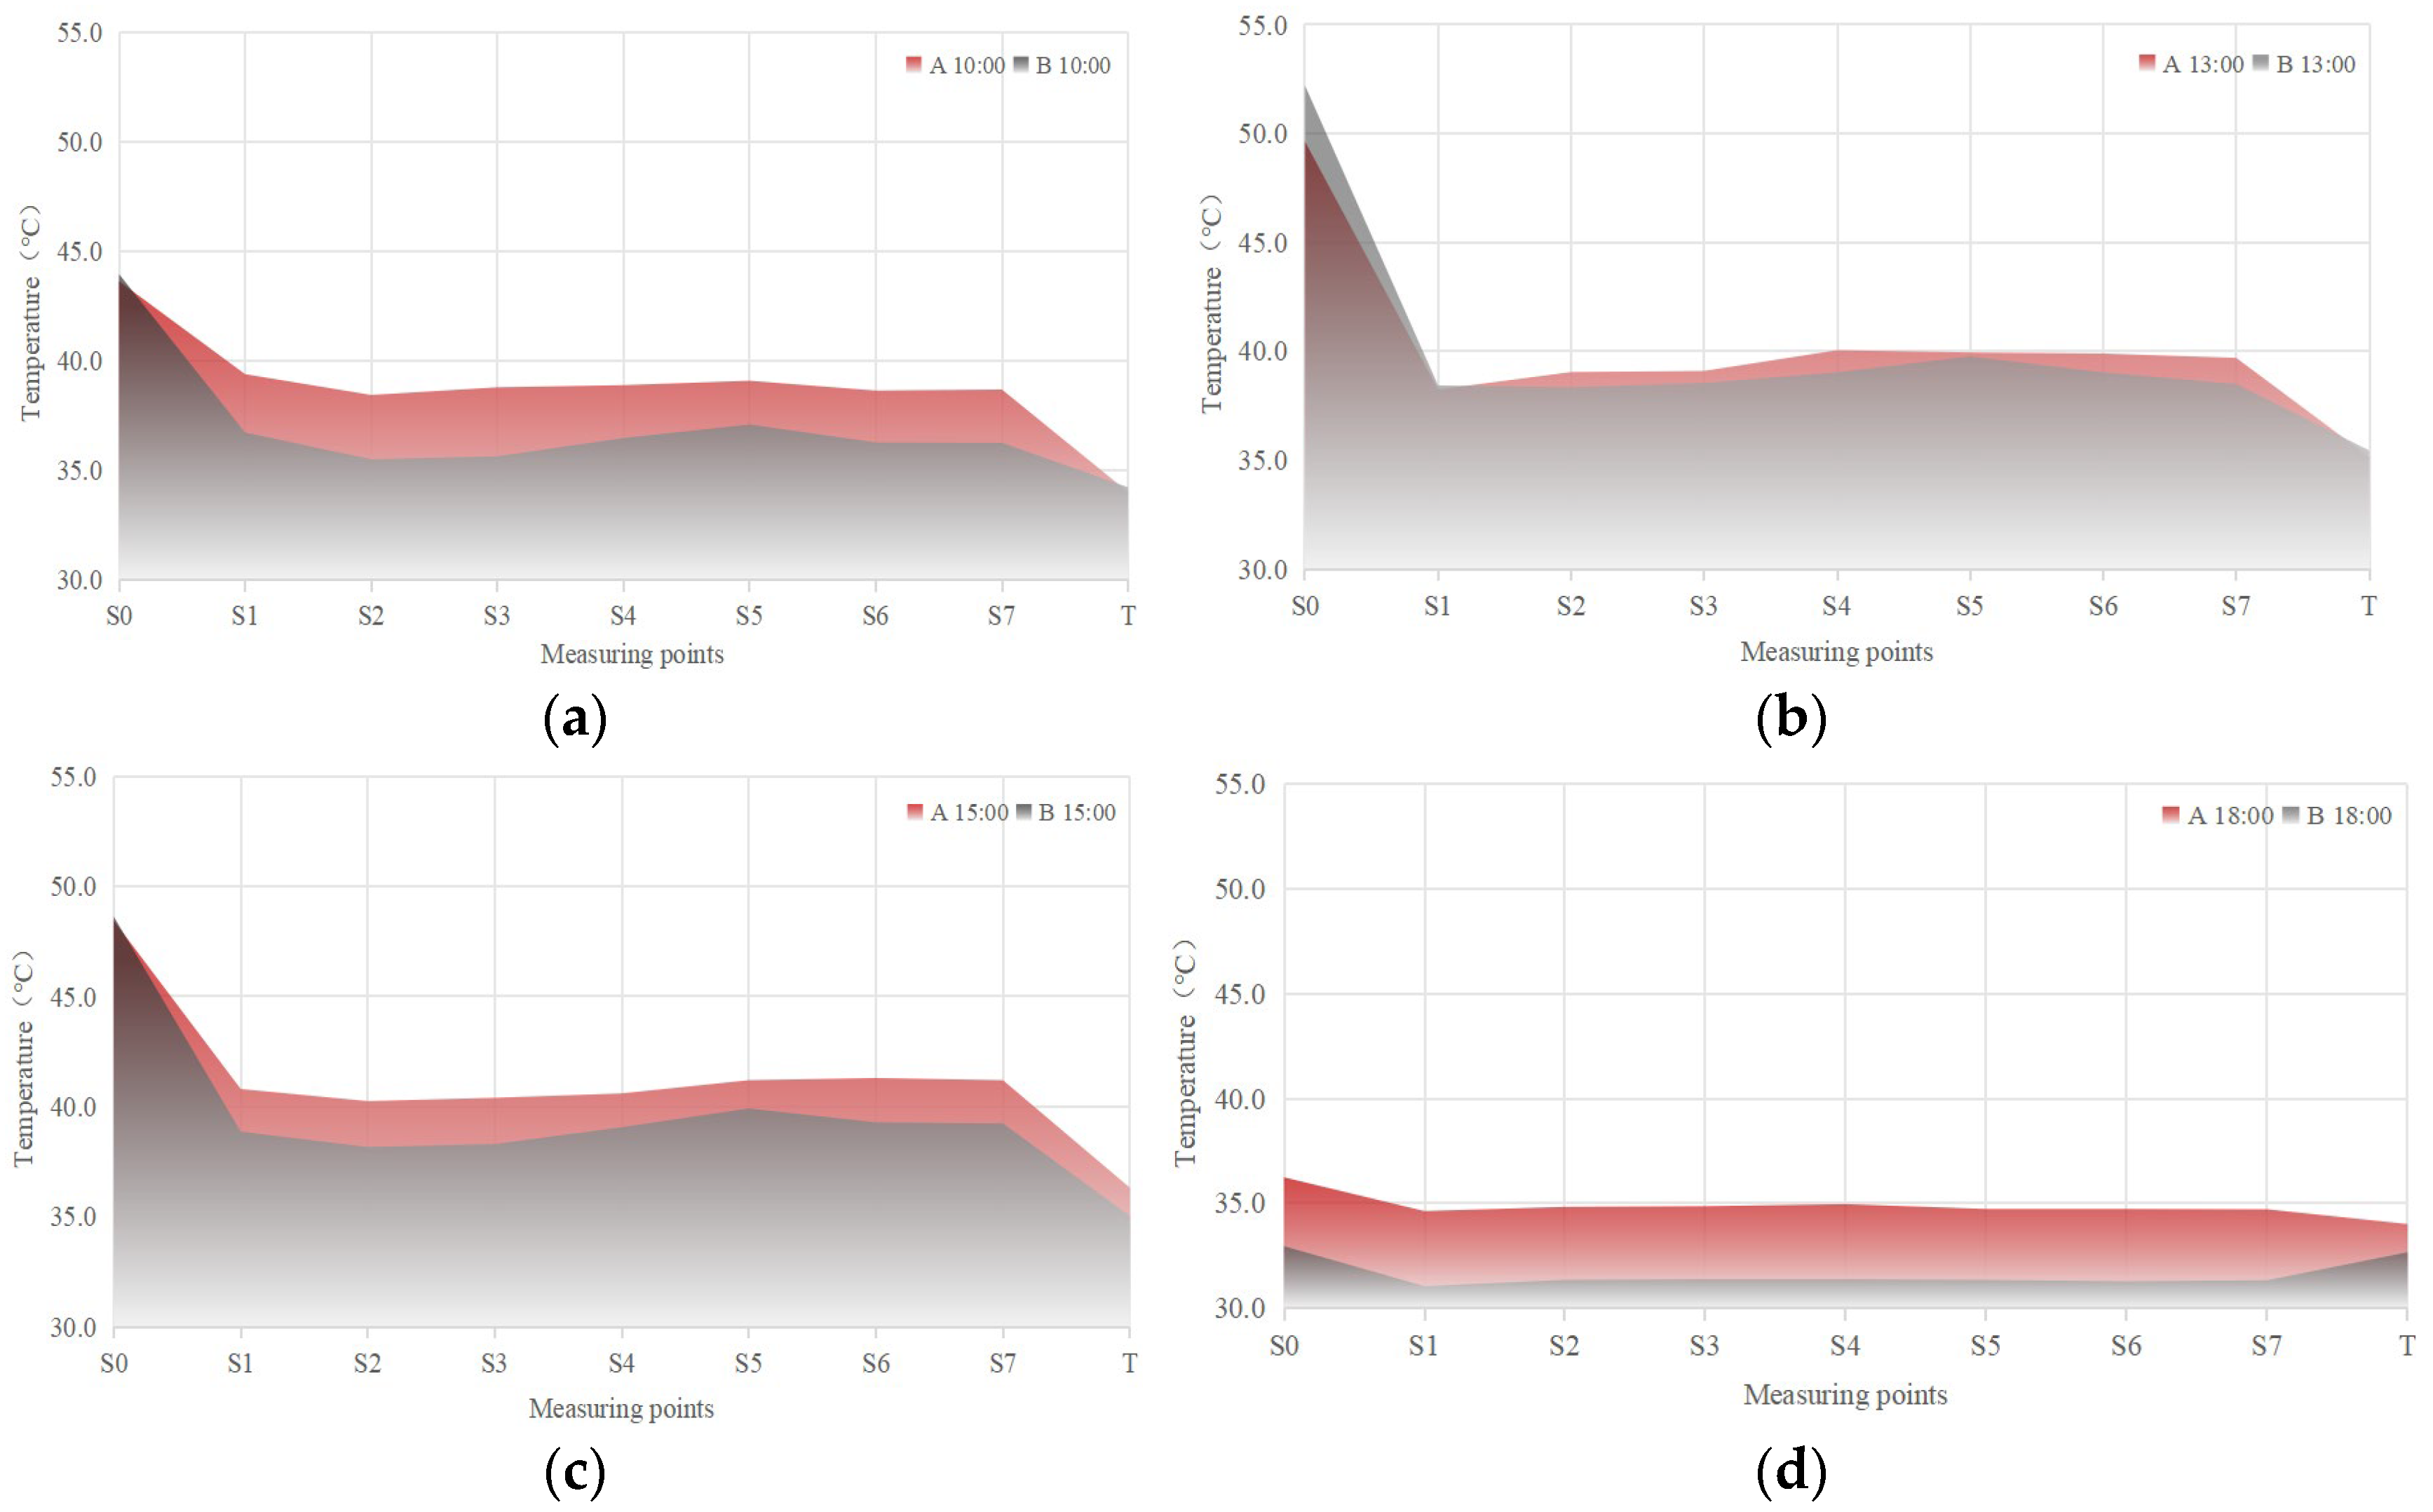
Figure 11 presents temperature spatiotemporal distribution heat maps for typical days A and B, showing that for daytime external temperature spatial distribution, PV surface temperatures are highest, and external spatial measurement point temperatures are also at high levels, but local high-temperature zones form between 40 and 80 cm from the surface, indicating that BIPV external heat transfer does not have a simple exponential decay pattern but exhibits complex nonlinear characteristics.

3.3.1. Daytime Temperature Spatial Distribution

To analyze daytime temperature spatial distribution characteristics, Figure 12 shows temperature–distance profile diagrams for four representative times (10:00, 13:00, 15:00, 18:00) on two typical days. The spatial distribution profiles at different daytime times demonstrated clear nonlinear characteristics in external temperature, with temperature differences between typical days A and B undergoing decrease–increase processes, indicating that under high-temperature day weather conditions, temperature peaks have limits, with radiation and wind speed having more significant effects at times other than peak moments.
Through analysis of temperature–distance profiles at different times, the following spatial distribution characteristics can be summarized: Near-surface steep decline zone (0–10 cm): Here, temperature drops rapidly with distance, forming maximum temperature gradients. Short-distance fluctuation zone (10–40 cm): Here, temperature steadily rises. Medium-distance heat accumulation zone (40–80 cm): Here, temperature may show local increases, manifesting as heat accumulation. Long-distance gradual decline zone (80–100 cm): Here, temperature gradually decreases, approaching ambient temperature. These complex spatial distribution characteristics indicate that external thermal effects involve composite actions of multiple heat transfer mechanisms and should not be explained by simple heat diffusion models.
As shown in Table 5, quantitative analysis through temperature gradients shows that the S4–S5 interval exhibits positive gradients (dT/dx > 0) during 77% of high-temperature day moments, with second-order gradients d2T/dx2 < 0, confirming the existence of heat accumulation phenomena. Local heat accumulation at S5 can be quantified as averaging 0.4–0.8 °C higher than adjacent measurement points, with more pronounced heat accumulation under low-wind-speed conditions (<2.0 m/s). To verify data reproducibility, we compared different date data under similar meteorological conditions, finding good reproducibility in temperature distribution patterns, thus confirming pattern reliability. The formation of heat accumulation phenomena may be related to the following physical mechanisms:
  • Building geometry effects: Due to right-angle geometry formed by vertical facade structures and the ground, airflow recirculation occurs at specific distances.
  • Thermal plume effects: Ascending airflow produced by heated surfaces is blocked by ambient crosswinds at medium distances, forming vortices where the heat residence time is extended.
  • Turbulent mixing effects: Interactions between near-surface small-scale thermal convection and ambient large-scale wind fields form vortex stagnation zones at specific distances, reducing heat transfer efficiency.
To verify dominant physical mechanisms of heat accumulation phenomena, Richardson numbers (Ri) are introduced for auxiliary verification. Richardson numbers are a core parameter for quantitatively characterizing atmospheric turbulence stability. They reflect the ratio between shear stress work and buoyancy work and are commonly used in engineering applications [21]:
R i = g β Δ Τ L / U 2
where g is gravitational acceleration, β is the air thermal expansion coefficient, Δ Τ is the temperature difference between the PV surface and ambient temperature, L is the characteristic length, and U is the measured wind speed. Generally, when Ri >> 1, natural convection (buoyancy) completely dominates, while when Ri << 1, forced convection (inertial force) completely dominates. Through dimensionless analysis of high-temperature periods, typical day A Ri numbers range from 0.15 to 0.23, averaging 0.20; typical day B Ri numbers range from 0.61 to 1.40, averaging 1.19. As shown in Table 6, for further verification, dimensionless analysis was performed on 28 data time-points from high-temperature periods of seven high-temperature days, and after analyzing the Ri number variation patterns at different times on the same day, modified Richardson criteria for BIPV building external flow were determined: Ri < 0.3 for building geometry dominance, 0.3 ≤ Ri ≤ 0.7 for the mechanism transition zone, and Ri > 0.7 for thermal plume dominance. This determines that typical day A, with 100% time in Ri < 1 and even Ri < 0.3 ranges, has building geometry effects as the dominant mechanism; typical day B, with 80% time in Ri > 1 ranges, has thermal plumes as the dominant mechanism.
According to building aerodynamics theory predictions, the vertical facade flow separation point position is L/H ≈ 0.15. This study observed heat accumulation phenomena at 60 cm from the building surface, with measured results L/H = 0.154 verifying theoretical prediction accuracy.

3.3.2. Nighttime Temperature Spatial Distribution

As shown in Figure 13, compared to complex daytime conditions, the nighttime temperature spatial distribution is relatively uniform and stable without solar radiation influence, with weakened spatial nonlinear characteristics reflecting heat dissipation and temperature equilibrium processes. Comparison of typical days A and B shows that daytime heat accumulation plays a key role in whether nighttime cooling effects occur.

3.3.3. Temperature Spatial Distribution Characteristics

Through the above analysis, the main characteristics of the external temperature spatial distribution of the experimental subject were obtained:
  • Nonlinear distribution: BIPV external temperatures exhibit complex fluctuation phenomena in spatial distance rather than a linear decreasing distribution. The study used segmented methods to explain the temperature characteristics and dominant mechanisms in different distance regions.
  • Thermal influence range: Based on temperature difference analysis, the main influence range of BIPV thermal effects is 60–80 cm. Within this range, all measurement point temperatures showed significant differences from the ambient temperature, with differences gradually decreasing beyond this range and approaching ambient conditions.
  • Local heat accumulation: During high-temperature days, local temperature peaks are measured at approximately 60 cm from the surface, with average peak temperatures 0.4–0.8 °C higher than adjacent measurement points, forming local heat accumulation phenomena. Dominant mechanisms for heat accumulation under different wind speed characteristics are determined: Ri < 0.3 for building geometry dominance, 0.3 ≤ Ri ≤ 0.7 for the mechanism transition zone, and Ri > 0.7 for thermal plume dominance.
The temperature distribution patterns are diverse and complex. This indicates that BIPV external thermal effects are dynamic processes. They involve multiple heat transfer mechanisms working together. These include heat conduction, convection, and radiation. Airflow organization may also influence these processes.

3.4. Environmental Parameter Influences

Considering the complexity of real-world applications, this study was conducted under actual environmental conditions. Measurements of red permeable pavement, asphalt roads, and green vegetation surrounding the building exerted some influence on the experimental results but did not significantly alter the relative characteristics of the temperature distribution.
Surface material effects: The south-facing area utilized red permeable pavement with an albedo of approximately 0.42, whereas standard asphalt exhibited an albedo of about 0.1. Under conditions of a solar elevation angle of 60° and total radiation of 900 W/m2, the two surfaces produce a reflected radiation difference of approximately 290 W/m2. At a measurement height of 2 m, this reflected radiation can cause an additional temperature rise of about 1 °C during peak periods. However, since all measurement points are in the same environment, the relative temperature difference remains valid, with an estimated uncertainty of ±0.1 °C. Vegetation effect: Partial vegetation on the east and west sides creates asymmetric radiation conditions. Canopy coverage reduces direct solar radiation in shaded areas by approximately 60–80%, potentially causing a 2–3 °C temperature difference. However, this measurement was taken on the south facade, where vegetation influence is minimal, with a shading rate <10% during the measurement period. Nearby building influence: The closest building is >15 m away, beyond the thermal influence range identified in this study, and there are no buildings on the south side. Wind flow diversion caused by distant buildings is estimated to affect average wind speed by less than 5%, corresponding to a temperature measurement deviation of less than 0.1 °C.
All measurement points in this study share identical surface conditions, leaving relative temperature differences and gradient characteristics largely unaffected. The reliability of the core relative features analyzed—such as heat accumulation phenomena and Richardson number variations—remains unchanged.

3.4.1. Radiation Intensity Influence

The main influences of solar radiation intensity on external thermal effects are as follows: ① Solar radiation intensity effects on relative temperature increments: Solar radiation intensity is the main driving factor affecting BIPV thermal effects, influencing not only daytime heating effects but also indirectly affecting nighttime cooling effects. ② Radiation intensity effects on thermal lag effects and thermal inertia: Higher solar radiation intensifies the thermal response lag, though this gradually weakens with increasing distance from the exterior surface, while solar radiation affects PV skin thermal inertia.

3.4.2. Wind Speed Influence

By comparing the temperature characteristics of two representative dates, the primary effects of wind speed can be summarized: ① Effects on surface temperature: Increased wind speed reduces surface–ambient temperature differences, with larger surface temperature daily ranges under low-wind-speed conditions, indicating that wind speed helps stabilize surface temperatures. ② Effects on temperature spatial distribution: Increased wind speed reduces nonlinear characteristics of temperature distribution, promotes uniform heat distribution, and weakens heat accumulation phenomena at medium-distance measurement points, with wind speed having the most significant effect on temperature gradients in the surface −10 cm region. ③ Effects on thermal effect temporal characteristics: Increased wind speed shortens the thermal effect duration and accelerates nighttime temperature recovery.

3.4.3. Ambient Temperature Influence

Ambient temperature influences on BIPV external thermal effects are mainly manifested as follows: The ambient temperature primarily affects absolute temperature values at measurement points rather than relative temperature differences. The ambient temperature has relatively minor effects on temperature gradients and thermal influence ranges.

4. Discussion

4.1. Main Findings

4.1.1. Dual Characteristics of BIPV Thermal Effects

This research focused on the core objective of “temperature distribution characteristics of the external environment around BIPV buildings under high summer temperatures.” It confirmed that single-unit BIPV buildings exhibit dual thermal effects during high-temperature summer days: daytime heating and nighttime cooling. The findings revealed that on summer high-temperature days, the south-facing BIPV facade system generates an average daytime heating effect of +2.86 °C and a nighttime cooling effect of −1.52 °C, resulting in an average net thermal effect of +1.34 °C. This quantifies the intensity of BIPV’s thermal impact on the external environment. Additionally, under conditions of elevated daytime surface temperatures, the external influence extends to 60–80 cm, providing quantitative evidence for the most severe thermal environmental conditions. To some extent, the daytime heating effect should be mitigated or eliminated. Whether the dual effects of daytime heating and nighttime cooling impose additional burdens or provide benefits to buildings requires assessment based on specific architectural requirements.

4.1.2. Nonlinear Characteristics of Temperature Distribution

This study discovered that the BIPV external temperature distribution exhibited significant nonlinear characteristics and summarized spatial distribution patterns at different distances, which differ markedly from the monotonic decreasing patterns expected by traditional heat diffusion theory. Nonlinear characteristics of temperature distribution mainly stem from coupling effects of multiple heat transfer mechanisms, such as forced convection near surfaces, heat accumulation at medium distances, and natural convection at long distances, with different mechanisms playing dominant roles at different spatial scales, forming complex temperature distribution patterns. Therefore, this study suggests establishing more complex multi-mechanism coupling models to accurately describe the thermal effect state.

4.1.3. Critical Regulatory Role of Wind Speed

Solar radiation primarily drives temperature distribution, followed by wind speed and ambient temperature. Wind speed exhibits dual effects: enhanced convective heat transfer reduces surface temperatures, while increased horizontal heat transport expands thermal influence ranges. Beyond previously emphasized solar radiation influences, the important role of wind speed regulation provides new insights.

4.2. Analysis of Physical Mechanisms

4.2.1. Heat Transfer Mechanism Dominance in Spatial Distribution

Based on complete data from seven high-temperature days during high-temperature periods, this research establishes modified Richardson criteria for BIPV building external airflow. This modification reflects significant influences of spatial building geometry on heat transfer mechanisms, with mechanism transition critical values Ri ≈ 0.6–0.7 providing a more accurate theoretical basis for BIPV thermal environment design. The mechanisms are as follows:
  • Building-geometry-dominated mechanism (Ri < 0.3):
When Richardson numbers are less than 0.3, inertial forces far exceed buoyancy forces, with flow fields primarily determined by building geometry and wind fields. Based on building aerodynamics theory, vertical facades produce vortex separation at approximately 0.15 times building height from the surface (≈60 cm), highly consistent with the measured heat accumulation positions. Under this mechanism, heat accumulation intensity strongly correlates with geometric parameters, exhibiting dynamic adjustment characteristics.
  • Thermal-plume-dominated mechanism (Ri > 0.7):
When Richardson numbers exceed 0.7, buoyancy effects dominate, with ascending thermal plumes from heated surfaces forming recirculation zones at specific positions. Under this mechanism, heat accumulation intensity is relatively stable, with obvious thermal plume characteristics under low-wind-speed conditions and extended heat residence time in local regions.
  • Mechanism transition zone (0.3 ≤ Ri ≤ 0.7):
Within this range, buoyancy and inertial forces compete, causing flow field instability. Multiscale vortex interactions become main characteristics, with complex interactions between near-surface small-scale thermal convection and ambient large-scale wind fields at medium distances.
The following notes address the applicability of the modified Richardson criteria established herein:
(1)
Temperature Applicability: This study was developed under high-temperature conditions of 35–37 °C and is theoretically applicable to weather ranges with maximum temperatures of between 35 and 40 °C. Critical thresholds may deviate under extreme heat (>40 °C) or relatively mild conditions (<35 °C).
(2)
Geographic Applicability: This study was developed for a location at 36.7° N latitude. For regions with latitude differences exceeding 10°, variations in solar radiation incidence angles may affect surface temperature distribution. Adjustments should be made based on local solar elevation angles.
(3)
Building Scale Applicability: This study applies to small single-story BIPV buildings with heights of 3–6 m and aspect ratios of around 0.6–1.5. For high-rise or irregularly shaped buildings, the critical values require recalibration.

4.2.2. Heat Transfer Mechanism Evolution in Temporal Distribution

Concerning temporal distribution characteristics, BIPV building external temperatures exhibit staged temporal distribution characteristics that evolve with time progression and environmental changes: ① Thermal response stage: After solar radiation changes, PV surface temperatures respond rapidly within short time periods, reflecting the low-thermal-capacity characteristics of PV materials. ② Heat diffusion stage: Surface heat transfer to external areas requires relatively long time periods, with the discovered 2–4 h lag times reflecting heat diffusion lag phenomena. ③ Thermal equilibrium stage: BIPV building external areas require 6–8 h to reach dynamic thermal equilibrium, indicating longer time requirements for thermal equilibrium.

4.2.3. Radiation Mechanisms of Nighttime Cooling

BIPV nighttime cooling effects also involve coupling effects of multiple mechanisms, including the following: ① Longwave radiation cooling: High emissivity of PV materials provides good radiation cooling capacity, with BIPV surfaces emitting longwave radiation to the sky at night, causing surface temperature decreases. ② Synergistic effects of convective cooling: Surface temperature decreases cause natural convection that further enhances cooling effects. ③ Thermal capacity effect regulation: The building structure thermal capacity affects cooling rates. Additionally, typical day A in this study has greater thermal inertia, requiring a longer time for cooling dissipation.

4.3. Limitations of the Study

The limitations of this study are as follows:
  • Limitations of the Research Subject:
The subject of this study is a single-story, small-scale BIPV building with a modest footprint and single-function design, serving as a BIPV experimental platform for a university. Future market BIPV buildings are likely to involve multi-story or high-rise office buildings, differing significantly from the subject’s architectural type and scale. Consequently, some research conclusions may not be universally applicable. Despite these limitations, the subject remains a typical BIPV building. The research methodology and approach presented here can serve as a reference for other BIPV building types. Future studies could be conducted using suitable large-scale BIPV buildings as experimental subjects.
2.
Limitations of Measurement Design:
This study has limitations in that the measurement design did not account for the effects of air humidity and turbulence intensity. Humidity influence: Environmental humidity was monitored via a small meteorological station, with data showing relative humidity fluctuating between 50 and 60% and exhibiting typical diurnal variation patterns. Theoretically, such diurnal humidity changes may affect atmospheric radiative cooling and convective heat transfer processes. Under low-humidity conditions, longwave radiation weakens, potentially enhancing nighttime cooling effects. However, the maximum diurnal humidity difference of approximately 10–15% may cause minor fluctuations in measured temperature differences (estimated within ±0.1 °C). Given this study’s primary focus on relative temperature gradients and spatial distribution patterns, this diurnal humidity effect constitutes only a minor factor in measurement uncertainty and does not significantly impact the core conclusions regarding heat accumulation patterns and Richardson number correlations.
Turbulence Effects: This study employs 10 min averaged wind speed data without recording instantaneous wind speeds or turbulence intensity. Research has indicated that atmospheric turbulence intensity typically ranges between 0.9% and 3% under atmospheric flow conditions, where turbulence enhancement promotes heat transfer mechanisms [22]. When turbulence intensity varies by 15–20%, heat transfer coefficient errors can be controlled within 30% [23]. Thus, the relatively uniform temperature distribution observed under high wind speeds (v > 3 m/s) in this study indicated enhanced turbulent mixing. Conversely, the significant heat accumulation under low wind speeds (v < 2 m/s) suggests reduced turbulence intensity. A comprehensive analysis of potential temperature measurement uncertainties caused by turbulent effects estimates a range of ±0.2 °C to ±0.5 °C. However, despite the lack of quantitative turbulence intensity data, the study’s findings rely on relative temperature gradients between measurement points under similar turbulent conditions. Subsequent research should incorporate direct turbulence measurements to more precisely quantify these effects.

4.4. Application and Guidance Significance

4.4.1. Scientific Significance

The scientific significance of this study is as follows:
  • Understanding Physical Mechanisms:
This study established a modified Richardson criterion for BIPV external temperature distribution based on this experimental object type, providing quantitative evidence for understanding the conversion mechanism between architectural geometric effects and thermal convection effects.
2.
Revealing Heat Transfer Theory:
This study identified localized heat accumulation phenomena occurring at the 60 cm position based on this experimental object type and revealed complex multiscale turbulent heat transfer mechanisms.

4.4.2. Guidance for Engineering Projects

This study offers the following guidance:
  • BIPV Building Design Optimization Strategies:
This research developed modified Richardson criteria. Based on these criteria, we propose design strategies for different conditions. Under high wind speeds, the focus should be on controlling building geometry. Ventilation design should be strengthened at L/H ratio positions. We recommend a building spacing of ≥ 0.7 H. This reduces geometric separation effects. Under low-wind-speed environmental conditions, surface temperature regulation should be prioritized by roughening building surfaces—e.g., installing louvers or grilles—to enhance efficient heat dissipation and disrupt thermal plume recirculation. Under intermediate environmental conditions, comprehensive control strategies are needed, considering mechanism transition complexity.
2.
Urban Thermal Environment Assessment:
With large-scale BIPV building applications, their thermal effects need consideration in urban heat island effect assessments. Based on quantitative results from this research, temperature increments within 1.0 m of BIPV building exteriors can reach 1~3 °C. Therefore, in urban planning, BIPV building density and layout should be reasonably controlled, good outdoor wind environments should be created through reasonable planning and layout, and green plants should be configured around BIPV buildings to effectively utilize plant evapotranspiration cooling effects for temperature reduction.
3.
Heat Recovery and Utilization Potential:
The heat generated by BIPV systems holds significant potential for recovery and utilization. Based on thermal inertia analysis, BIPV thermal inertia is related to both the heat capacity of PV materials and the insulation layer formed by the air cavity. Installing a phase change material (PCM) thermal storage layer on the backside of PV modules or optimizing the cavity structure can shorten the thermal inertia time and reduce impacts on nighttime comfort. Additionally, due to enhanced heat storage capacity under high-radiation conditions, BIPV buildings can be integrated with heat pump systems to recover waste heat, achieving synergistic optimization of building energy consumption and the thermal environment.

5. Conclusions

Through field measurements of BIPV building external temperatures under summer high-temperature conditions, this study revealed complex spatiotemporal distribution characteristics and physical mechanisms:
(1)
This study confirmed nonlinear characteristics of BIPV external temperature distribution, with 77% of high-temperature days showing local heat accumulation phenomena approximately 60 cm from the surface, with the maximum accumulation intensity reaching 0.8 °C.
(2)
This study established modified Richardson criteria for BIPV buildings: Ri < 0.3 for building geometry dominance, 0.3 ≤ Ri ≤ 0.7 for the mechanism transition zone, and Ri > 0.7 for thermal plume dominance.
(3)
This study revealed thermal effects under different meteorological conditions. For example, the BIPV external net thermal effects were +3.43 °C on August 3 and −0.52 °C on August 22. The net thermal effects strongly correlated with meteorological conditions. This correlation resulted from varying degrees of daytime heating and nighttime cooling.
(4)
This study determined different influence mechanisms of solar radiation, wind speed, and ambient temperature on BIPV thermal effects, providing a basis for optimizing thermal environment control.

Author Contributions

Conceptualization, formal analysis, and writing—original draft, Y.Z.; investigation and resources, T.M.; methodology and data curation, Y.X. All authors have read and agreed to the published version of the manuscript.

Funding

This research was funded by “Research on the Improvement of Thermal Comfort in Elevated Stations of Jinan Rail Transit under Natural Ventilation Conditions”, grant number X24029.

Data Availability Statement

Data will be made available on request.

Conflicts of Interest

The authors declare that they have no known competing financial interests or personal relationships that could have appeared to influence the work reported in this paper.

Abbreviations

The following abbreviations are used in this manuscript:
BIPVBuilding-Integrated Photovoltaics
BAPVBuilding-Attached Photovoltaics
RiRichardson numbers

References

  1. Ding, L.; Zhu, Y.; Zheng, L.; Dai, Q.; Zhang, Z. What is the path of photovoltaic building (BIPV or BAPV) promotion?--The perspective of evolutionary games. Appl. Energy 2023, 340, 121033. [Google Scholar] [CrossRef]
  2. Shukla, A.K.; Sudhakar, K.; Baredar, P. Recent advancement in BIPV product technologies: A review. Energy Build. 2017, 140, 188–195. [Google Scholar] [CrossRef]
  3. Praveenkumar, S.; Gulakhmadov, A.; Agyekum, E.B.; Alwan, N.T.; Velkin, V.I.; Sharipov, P.; Chen, X. Experimental Study on Performance Enhancement of a Photovoltaic Module Incorporated with CPU Heat Pipe—A 5E Analysis. Sensors 2022, 22, 6367. [Google Scholar] [CrossRef] [PubMed]
  4. García-López, C.; Álvarez-Tey, G. Evaluation of the Uncertainty of Surface Temperature Measurements in Photovoltaic Modules in Outdoor Operation. Sensors 2022, 22, 5685. [Google Scholar] [CrossRef]
  5. Brito, M.C. Assessing the Impact of Photovoltaics on Rooftops and Facades in the Urban Micro-Climate. Energies 2020, 13, 2717. [Google Scholar] [CrossRef]
  6. Roeleveld, D.; Hailu, G.; Fung, A.S.; Naylor, D.; Yang, T.; Athienitis, A.K. Validation of Computational Fluid Dynamics (CFD) Model of a Building Integrated Photovoltaic/Thermal (BIPV/T) System. Energy Procedia 2015, 78, 1901–1906. [Google Scholar] [CrossRef]
  7. Berardi, U.; Graham, J. Investigation of the impacts of microclimate on PV energy efficiency and outdoor thermal comfort. Sustain. Cities Soc. 2020, 62, 102402. [Google Scholar] [CrossRef]
  8. Brown, K.E.; Baniassadi, A.; Pham, J.V.; Sailor, D.J.; Phelan, P.E. Effects of Rooftop Photovoltaics on Building Cooling Demand and Sensible Heat Flux Into the Environment for an Installation on a White Roof. ASME J. Eng. Sustain. Build. Cities 2020, 1, 021001. [Google Scholar] [CrossRef]
  9. Vassiliades, C.; Lau, K.; Moiseos, R.; Buonomano, A.; Savvides, A.; Rizzo, A. A climate sensitive design approach to BIPV: Investigating the nexus between solar energy and thermal comfort in cities in Sweden and Cyprus. Build. Environ. 2023, 243, 110681. [Google Scholar] [CrossRef]
  10. Fassbender, E.; Pytlik, S.; Rott, J.; Hemmerle, C. Impacts of Rooftop Photovoltaics on the Urban Thermal Microclimate: Metrological Investigations. Buildings 2023, 13, 2339. [Google Scholar] [CrossRef]
  11. Sailor, D.J.; Anand, J.; King, R.R. Photovoltaics in the built environment: A critical review. Energy Build. 2021, 253, 111479. [Google Scholar] [CrossRef]
  12. Elhabodi, T.S.; Yang, S.; Parker, J.; Khattak, S.; He, B.-J.; Attia, S. A review on BIPV-induced temperature effects on urban heat islands. Urban Clim. 2023, 50, 101592. [Google Scholar] [CrossRef]
  13. Ma, S.; Goldstein, M.; Pitman, A.J.; Haghdadi, N.; MacGill, I. Pricing the urban cooling benefits of solar panel deployment in Sydney, Australia. Sci. Rep. 2017, 7, srep43938. [Google Scholar] [CrossRef]
  14. Cortes, A.; Murashita, Y.; Matsuo, T.; Kondo, A.; Shimadera, H.; Inoue, Y. Numerical evaluation of the effect of photovoltaic cell installation on urban thermal environment. Sustain. Cities Soc. 2015, 19, 250–258. [Google Scholar] [CrossRef]
  15. Masson, V.; Bonhomme, M.; Salagnac, J.-L.; Briottet, X.; Lemonsu, A. Solar panels reduce both global warming and urban heat island. Front. Environ. Sci. 2014, 2, 14. [Google Scholar] [CrossRef]
  16. Taha, H. The potential for air-temperature impact from large-scale deployment of solar photovoltaic arrays in urban areas. Sol. Energy 2013, 91, 358–367. [Google Scholar] [CrossRef]
  17. Akata, A.M.E.A.; Njomo, D.; Agrawal, B. Assessment of Building Integrated Photovoltaic (BIPV) for sustainable energy performance in tropical regions of Cameroon. Renew. Sustain. Energy Rev. 2017, 80, 1138–1152. [Google Scholar] [CrossRef]
  18. Kapsalis, V.; Karamanis, D. On the effect of roof added photovoltaics on building’s energy demand. Energy Build. 2015, 108, 195–204. [Google Scholar] [CrossRef]
  19. Agathokleous, R.A.; Kalogirou, S.A. Double skin facades (DSF) and building integrated photovoltaics (BIPV): A review of configurations and heat transfer characteristics. Renew. Energy 2016, 89, 743–756. [Google Scholar] [CrossRef]
  20. Hui, Y.; Liu, J.; Wang, J.; Yang, Q. Effects of facade rib arrangement on aerodynamic characteristics and flow structure of a square cylinder. Build. Environ. 2022, 214, 108924. [Google Scholar] [CrossRef]
  21. Carruthers, D.J. Stull, R.B. 1988. An Introduction to Boundary Layer Meteorology, xiii + 666 pp. Dordrecht, Boston, London: Kluwer Academic Publishers. Price Dfl. 220.00, US $99.00, UK £64.00 (hardback). ISBN 90 277 2768 6; 90 277 2769 4 (paperback). Geol. Mag. 1989, 126, 308–309. [Google Scholar] [CrossRef]
  22. Vlahostergios, Z.; Missirlis, D.; Flouros, M.; Albanakis, C.; Yakinthos, K. Effect of turbulence intensity on the pressure drop and heat transfer in a staggered tube bundle heat exchanger. Exp. Therm. Fluid Sci. 2015, 60, 75–82. [Google Scholar] [CrossRef]
  23. Ghisalberti, L.; Kondjoyan, A. Convective heat transfer coefficients between air flow and a short cylinder. Effect of air velocity and turbulence. Effect of body shape, dimensions and position in the flow. J. Food Eng. 1999, 42, 33–44. [Google Scholar] [CrossRef]
Figure 1. BAPV and BIPV.
Buildings 15 03415 g001
Figure 2. BIPV measurement object.
Buildings 15 03415 g002
Figure 3. Two structural forms: (a) PV–air gap–glass curtain wall structure and (b) PV–prefabricated wall panels.
Buildings 15 03415 g003
Figure 4. Measuring instruments: (a) outdoor weather station; (b) non-contact infrared thermometer; and (c) temperature sensor.
Buildings 15 03415 g004
Figure 5. Measurement point layout.
Buildings 15 03415 g005
Figure 6. Temperature curves of a four high-temperature days: (a) August 3rd and (b) August 10th and (c) August 22nd and (d) August 24th.
Buildings 15 03415 g006
Figure 7. (a) Relative temperature increments of typical days A and B and (b) average temperatures of typical days A and B.
Buildings 15 03415 g007
Figure 8. (a) Heating rate and (b) cooling rate.
Buildings 15 03415 g008
Figure 9. High-temperature periods: (a) relative temperature increment and (b) average temperature.
Buildings 15 03415 g009
Figure 10. (a) Relative temperature increment at night and (b) average cooling rate from 22:00 to 06:00.
Buildings 15 03415 g010
Figure 11. Thermal distribution map of temperature in space and time: (a) typical day A and (b) typical day B.
Buildings 15 03415 g011
Figure 12. Temperature–distance profiles: (a) 10:00; (b) 13:00; (c) 15:00; and (d) 18:00.
Buildings 15 03415 g012
Figure 13. Temperature–distance profiles for representative times of night: (a) 20:00 and (b) 22:00.
Buildings 15 03415 g013
Table 1. Overview of all sensors and measurement parameters.
Sensor NameMeasurement
Parameter/Position
UnitAccuracyRangeTemporal
Resolution
Outdoor weather stationAmbient air
Temperature
±0.2 °C−40~120 °C10 min
Wind velocitym/s±0.3 m/s0.2~40.0 m/s10 min
Wind direction°//10 min
Solar radiationW/m2±5%0~2000 W10 min
Non-contact infrared thermometerPV module surface
temperature
°C±1%0~150 °C10 min
Temperature sensorSouth elevation exterior temperature°C±0.1 °C−40~80 °C10 min
Table 2. The locations and names of the measurement points.
Measurement Point LocationMeasured ParametersMeasurement Point Names
OutdoorTemperature, wind speed, solar radiationT, V, G
South-facing outerTemperatureS1, S2, S3, S4, S5, S6, S7
South elevation surfaceTemperatureS0
Table 3. Meteorological parameters for high-temperature days during measuring period.
DateValueCategorization
(Temperature–Radiation–Wind Speed)
Maximum Daytime
Temperature (°C)
Average Daytime Temperature (°C)Maximum Solar Radiation (W/m2)Average Daytime Wind Speed (m/s)
8.337.233.99053.4High–high–high
8.435.831.78813.6Low–high–high
8.1035.732.58722.5Medium–high–medium
8.1235.032.58661.9Medium–medium–low
8.2235.031.28691.6Low–medium–low
8.2335.532.98441.4Medium–medium–low
8.2436.433.37621.5High–low–low
Table 4. TRH values for external measurement points.
S1S2S3S4S5S6S7
Typical day A+4.0+4.0+4.0+4.0+4.0+3.0+3.0
Typical day B+2.0+2.0+2.0+2.0+2.0+3.0+3.0
Table 5. Spatial distribution characteristics at different distances.
Distance ZoneZone Temperature DifferenceTemperature PerformanceTemperature GradientOccurrence FrequencyDominant Mechanism
Near surface (0~10 cm)−10.46~−7.78 °CSharp temperature drop−9.26/10 cm100%Surface radiation heating and boundary layer forced convection
Short distance (10~40 cm)0.35~0.98 °CSteady rise+0.19 °C/10 cm63%Stable convective heat transfer
Medium distance (40~80 cm)−0.15~0.63 °CRise then fall0.05 °C/10 cm77%Complex flow and heat accumulation effects
Long distance
(≥80 cm)
−0.22~0.15 °CGradual decline−0.02 °C/10 cm61%Turbulent diffusion
Table 6. Ri numbers under different wind speed conditions.
Wind Speed ClassificationDaysAverage Ri NumberRi Number Interval Frequency
Ri < 0.30.3 < Ri < 0.7Ri > 0.7
High wind speed
(v > 3 m/s)
2 days0.19100%//
Medium wind speed (3 m/s > v > 2 m/s)1 day0.33<30%>70%/
Low wind speed
(1 m/s < v)
4 days0.87/<45%>55%
High wind speed (v > 3 m/s)2 days0.19100%//
Disclaimer/Publisher’s Note: The statements, opinions and data contained in all publications are solely those of the individual author(s) and contributor(s) and not of MDPI and/or the editor(s). MDPI and/or the editor(s) disclaim responsibility for any injury to people or property resulting from any ideas, methods, instructions or products referred to in the content.