Article

Optimization of Smartphone-Based Strain Measurement Algorithm Utilizing Arc-Support Line Segments

1
College of Civil Engineering and Architecture, Wenzhou University, Wenzhou 325035, China
2
Key Laboratory of Engineering and Technology for Soft Soil Foundation and Tideland Reclamation of Zhejiang Province, Wenzhou 325035, China
3
Wenzhou Key Laboratory of Traffic Piezoelectric Engineering Technology, Wenzhou 325035, China
4
Wenzhou Railway and Mass Transit Investment Group Co., Ltd., Wenzhou 325000, China
*
Author to whom correspondence should be addressed.
Buildings 2025, 15(18), 3407; https://doi.org/10.3390/buildings15183407
Submission received: 6 May 2025 / Revised: 9 August 2025 / Accepted: 15 September 2025 / Published: 20 September 2025
(This article belongs to the Section Building Structures)

Abstract

Smartphone-based strain monitoring of structural components is an emerging approach to structural health monitoring. However, the existing techniques suffer from limited accuracy and poor cross-device adaptability. This study aims to optimize the smartphone-based Micro Image Strain Sensing (MISS) method by replacing the traditional Connected Component Labeling (CCL) algorithm with the arc-support line segments (ASLS) algorithm, thereby significantly enhancing the stability and adaptability of circle detection in micro-images captured by diverse smartphones. Additionally, this study evaluates the impact of lighting conditions and lens distortion on the optimized MISS method. The experimental results demonstrate that the ASLS algorithm outperforms CCL in terms of recognition accuracy (maximum error of 0.94%) and cross-device adaptability, exhibiting greater robustness against color temperature and focal length variations. Under fluctuating lighting conditions, the strain measurement noise remains within ±0.5 με and with a maximum error of 7.0 με compared to LVDT measurements, indicating the strong adaptability of the optimized MISS method to external light changes. Barrel distortion in microscopic images induces a maximum pixel error of 5.66%, yet the final optimized MISS method achieves highly accurate strain measurements. The optimized MISS method significantly improves measurement stability and engineering applicability, enabling effective large-scale implementation for strain monitoring of civil infrastructure.

1. Introduction

The strain response is a key parameter for assessing structural damage. It can be combined with multiple response data, such as acceleration and displacement, to evaluate the global and local damage in structures [1]. This method has been widely applied to various structural systems, including bridges [2], buildings [3], pipelines [4], and tunnels [5]. Currently, the primary strain measurement methods in civil engineering include fiber optic sensors [6,7], resistive strain gauges [8], and vibrating wire strain gages [9]. However, these methods are limited by high costs and the requirement for specialized personnel, making them difficult to widely promote and apply. Smartphone-based monitoring of structural strain responses represents a novel approach in the field of structural health monitoring (SHM). Smartphones are equipped with multiple sensors, such as cameras, and their widespread availability allows for the easy capture and storage of images of structural deformation. These images can be used to derive the strain responses, a capability that has gradually attracted increasing attention from researchers in recent years.
For example, Yu and Pan [10] experimentally validated the feasibility of using smartphones combined with Digital Image Correlation (DIC) technology to measure object strain. To address the challenges posed by smartphone camera limitations, they implemented sample compensation techniques and developed parametric models to correct lens distortion and temperature-induced errors. The method was validated through strain measurements of a specimen with dimensions of 20 mm (width) × 25 mm (length), thereby demonstrating its practical utility. However, the measurement precision of this technique is currently constrained to ±56 με, and its applicability is limited to relatively small-scale structural components. The application of smartphones to monitor structural deformation has advanced further through innovative methodologies. Yu et al. [11] integrated four planar mirrors into a unified structure via 3D printing technology, enabling the division of a scene into left and right perspectives using a smartphone’s single camera. By combining this setup with stereo digital image correlation, three-dimensional deformation measurements were achieved. The experimental results demonstrated a strain error of ±300 με, which approached the accuracy of commercial systems. However, continuous imaging causes the smartphone temperature to increase, leading to instability in this method. To address this limitation, Yu et al. [12] improved the approach by altering the mirror material and increasing the distance between the smartphone and mirrors, reducing the temperature-induced errors to 4000 με. Kromanis et al. [13] employed smartphones in conjunction with the Speeded-up Robust Feature (SURF) algorithm and the Kanade–Lucas–Tomasi (KLT) algorithm to monitor the deformation of a cantilever beam (dimensions: 45 mm × 70 mm × 950 mm) under stepwise loading. Although the method successfully captured deformation patterns, further algorithmic optimization and hardware improvements are required to enhance the detection sensitivity for small strains (e.g., 235 με). Xie et al. [14] utilized smartphones combined with DIC technology to investigate strain evolution and crack propagation in a 100 mm × 100 mm × 100 mm concrete cube under compressive loading. Their results showed consistency between the measured deformation patterns and actual behavior, although the measurement precision requires improvement. Stoilov et al. [15] developed a smartphone application based on DIC algorithms, validating its capability to identify structural deformation fields.
The aforementioned studies have demonstrated the feasibility of using smartphones for structural strain measurement; however, they remain constrained by limited precision and small-scale measurements, rendering them inapplicable to large-scale civil structures. To address these limitations, our research team proposed a novel high-precision strain measurement method that integrates a smartphone with a sensor device equipped with a smartphone microscope, which can precisely measure the average surface strain of engineering structures [16,17]. This method first captures a series of micro-images of the deformation of a microscope-equipped strain sensor using a smartphone. Subsequently, the SURF algorithm was employed to identify the pixel displacements of the feature points within the micro-images. Concurrently, the Connected Component Labeling (CCL) algorithm was used to detect the pixel diameter of fixed-size circles (1 mm in diameter) within the images to calibrate the actual size of a single pixel. This calibration enabled the calculation of the actual displacement of the feature points within the micro-images. By combining these data, the actual displacements of the characteristic points within the micro-images were quantified. Finally, the average strain of the structure between the two supports of the strain sensor was calculated [18]. The proposed approach can be referred to as the Micro Image Strain Sensing (MISS) method. The experimental results indicate that the strain measured by the MISS method deviates from the data obtained using the FBG by only 4 με, demonstrating its superior measurement accuracy. In addition, the dual-marker method effectively mitigates the thermal effects caused by prolonged smartphone imaging, as validated by temperature-controlled chamber experiments. Based on those studies, Chen et al. [19] validated the reliability of this method through metal tensile tests and concrete beam bending tests and successfully measured the deformation process of a simply supported beam. Chen et al. [20] further developed a novel strain sensor to enable non-real-time monitoring and recording of the maximum peak tensile/compressive strain of a structure. This innovation facilitates rapid post-earthquake damage assessment and demonstrates that the MISS method can achieve rapid acquisition of structural strain response parameters with high measurement precision, making it easily scalable for widespread applications.
Despite these advancements, the CCL algorithm employed in the MISS method has limitations. Specifically, CCL relies on binary thresholding to identify a fixed-size circular region (diameter: 1 mm) within micro-images for pixel-size calibration. This requires presetting binary thresholds and defining a pixel count range for the circular regions prior to algorithmic computation. A key advantage of the MISS method, its reliance on widely accessible smartphones for structural strain monitoring, is counterbalanced by the challenge of algorithmic adaptability across diverse smartphone models. Owing to differences in smartphone camera parameters (such as focal length and color temperature) and variations in the light intensity of their flashes, which serve as the microscope light source on the sensor, the pixel count and binary thresholds of the circular regions in the captured micro-images differ between devices, limiting the generalization capability of the algorithm. Therefore, the method needs to be optimized by applying a more versatile circular detection method to enhance cross-device compatibility.
Furthermore, manufacturing tolerances in smartphones and microscope lenses introduce inherent image distortions in micro-images. During measurement processes, variations in ambient lighting conditions (e.g., dawn, noon, dusk, and night) dynamically alter both the intensity and quality of illumination. These factors could destabilize the measurement precision of the MISS method. Consequently, it is critical to validate the impact of these factors on the measurement accuracy and stability of the method, particularly in real-world scenarios where the environmental conditions are non-ideal.
In light of these challenges, this study first employs the arc-support line segments (ASLS) algorithm, which demonstrates superior generalization capability, to achieve the automated detection of circular regions in images. Experimental validation confirmed the stability and computational efficiency of the algorithm in identifying circular diameters. Subsequently, a high-precision chessboard pattern (precision: ±1 μm, grid spacing: 0.25 mm) was utilized to quantify pixel count variations at fixed intervals within microscopic images, enabling an analysis of the impact of image distortion on the measurement accuracy of the MISS method. Finally, experiments under multi-angle lighting conditions were conducted to evaluate how variations in lighting intensity affect strain measurements using the MISS method, thereby validating the stability of the method under diverse environmental conditions.

2. Overview of the Sensor and MISS Method

The MISS method employs a smartphone to capture and analyze the deformation of a movable marker point within a microscope-equipped piston-type sensor (as illustrated in Figure 1a), thereby quantifying the structural strain responses. The piston-type sensor consists of two supports, a main structure, and a microscope. Its main structure is fabricated from two telescoping carbon fiber tubes, each connected to a bracket and, respectively, linked to movable marker 1 and fixed reference marker 2 within the miniature structures under the microscope (as illustrated in Figure 1b). When deformation occurs between the two brackets of the sensor, it triggers a displacement between movable marker 1 and fixed reference marker 2. The speeded-up robust features (SURF) algorithm precisely identifies this displacement. Dividing the displacement value by the distance between the two mounting bases of the sensor (i.e., the measurement length of the sensor) enables the calculation of the average strain on the surface of the engineering structures rigidly connected to the two brackets. Notably, the microscope mounted on the piston-type sensor incorporates a novel light-guiding structure that utilizes each smartphone’s built-in flash to provide consistent illumination for the lens system, thereby generating high-resolution and well-illuminated microscopic images. A detailed technical explanation of the sensor and method can be found in [18].
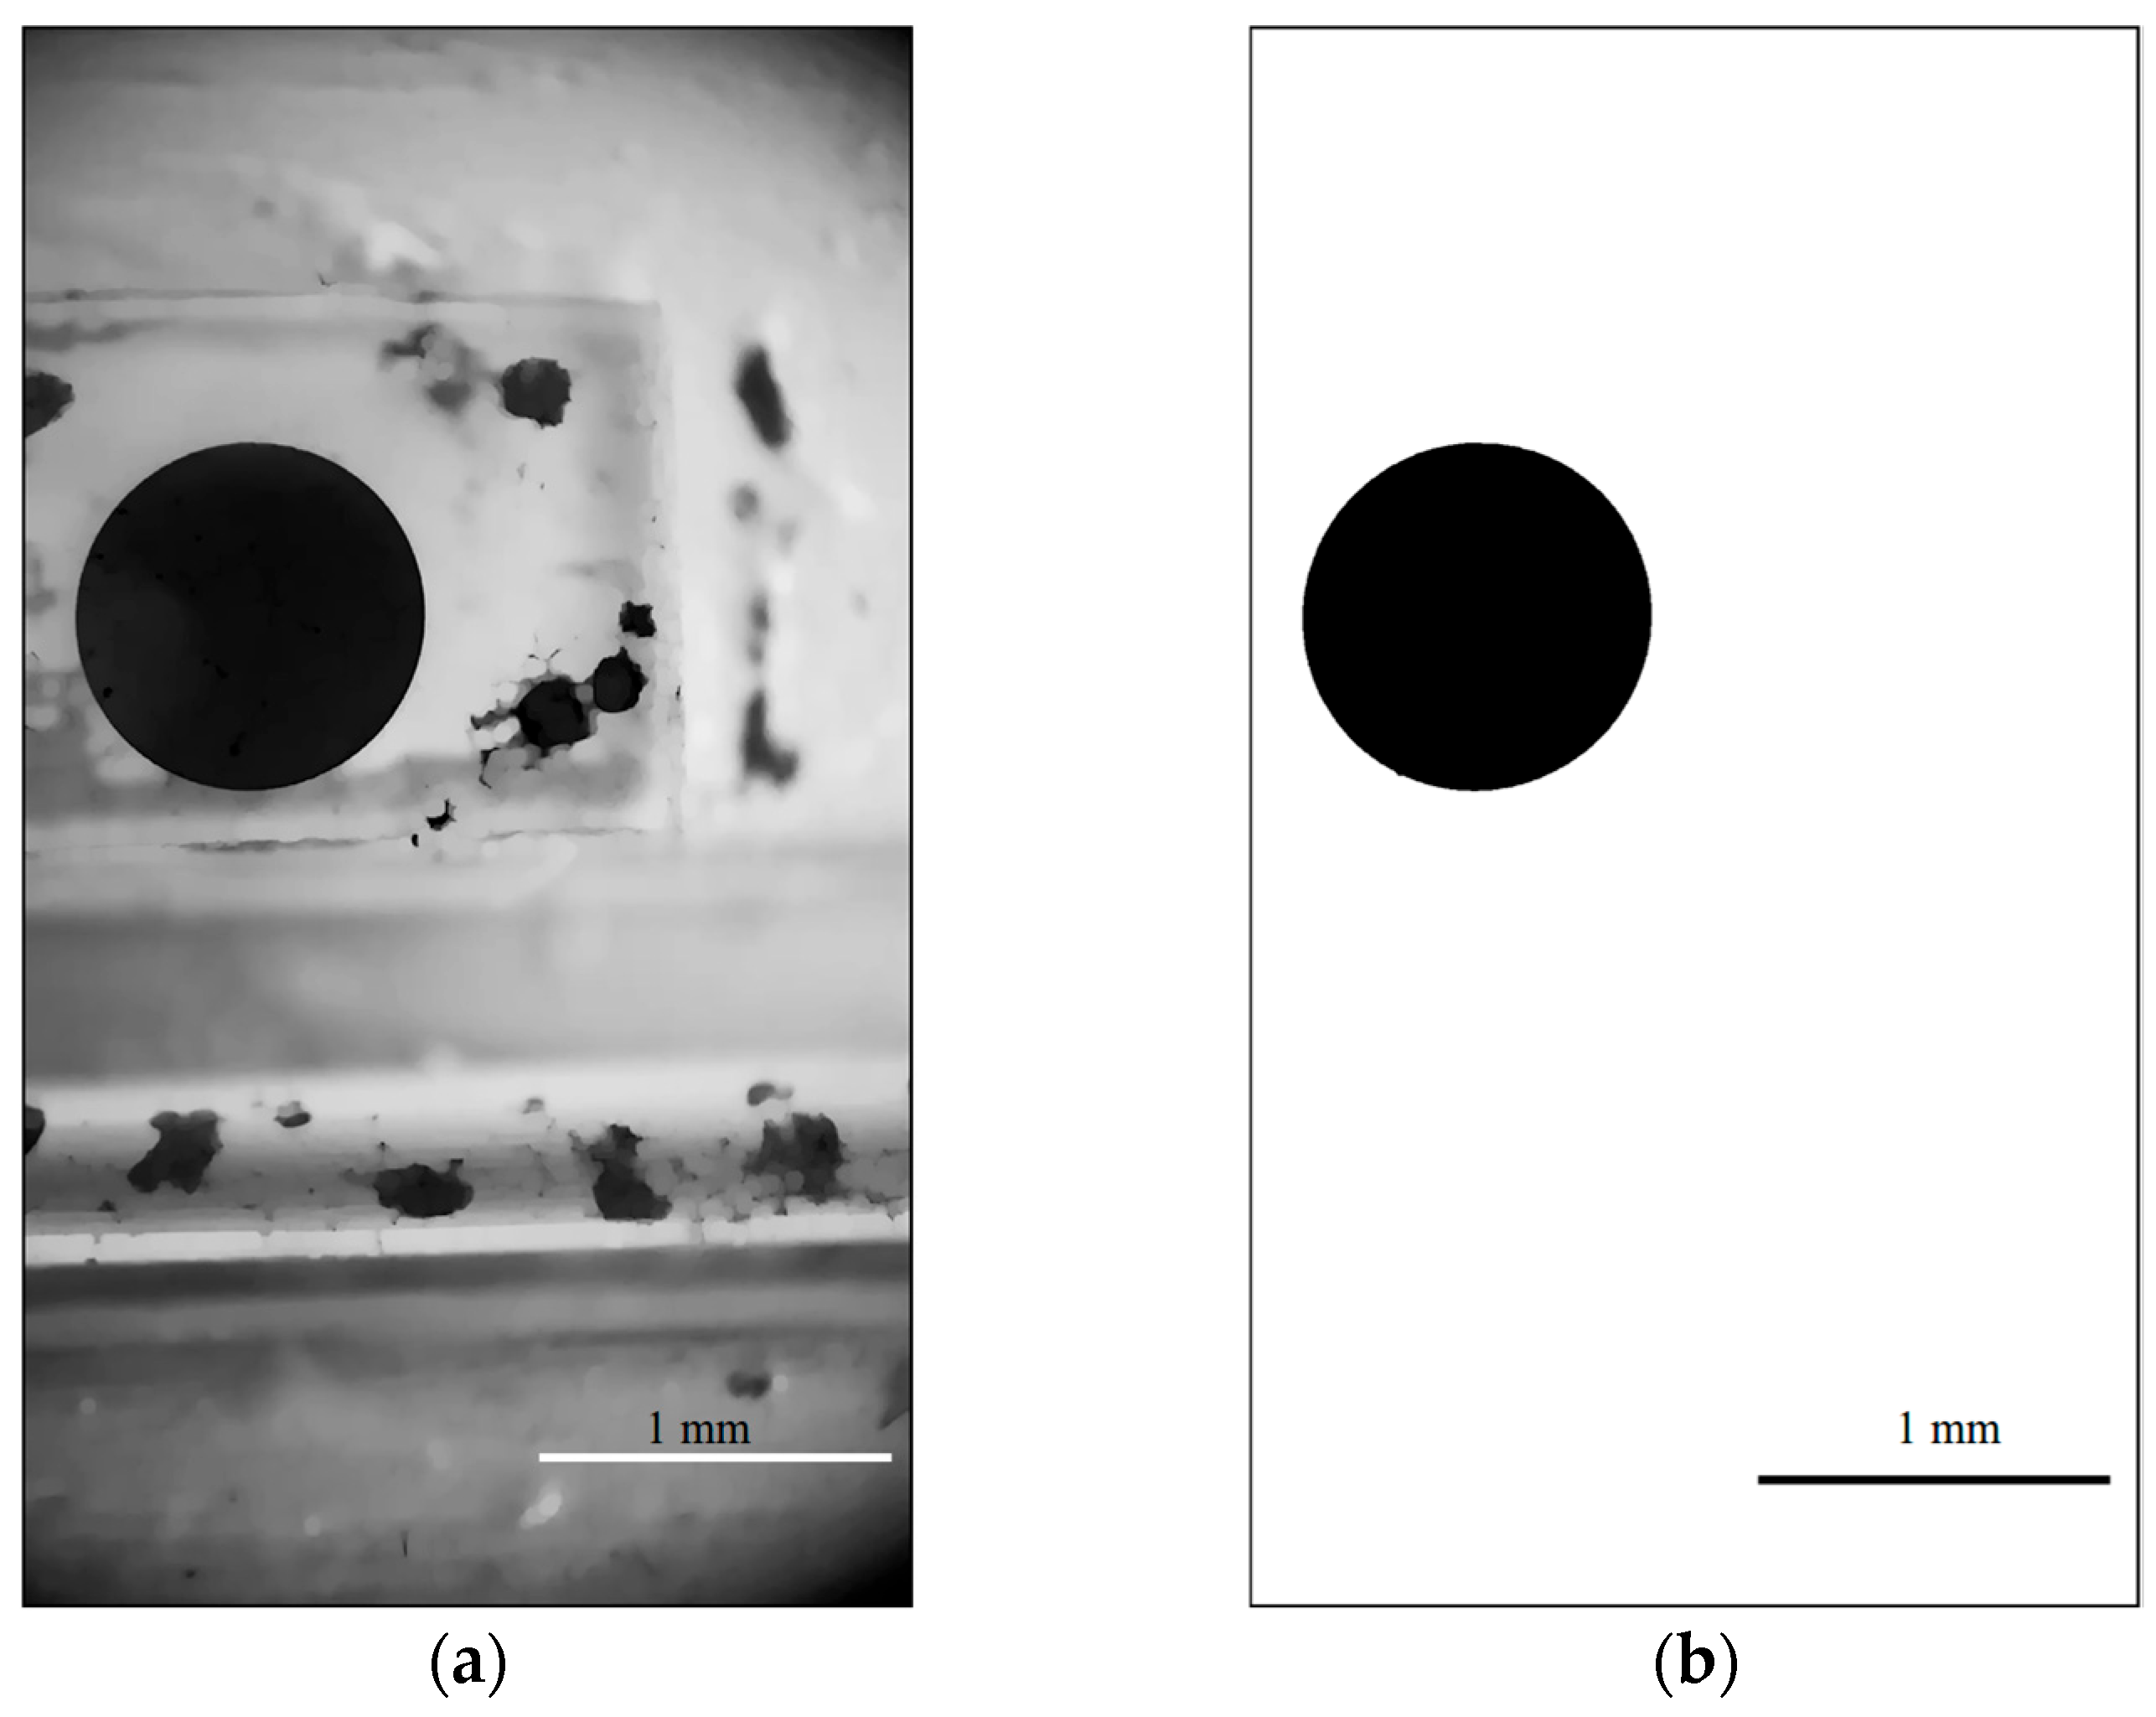
The SURF algorithm can only identify the pixel displacement between the movable marker 1 and fixed marker 2. To obtain the actual displacement between these points, the pixel scale within the microscopic image must be calibrated. By applying the CCL algorithm with predefined binarization thresholds and pixel count ranges for circular regions, the pixel diameter of a 1 mm diameter circle within the image (as illustrated in Figure 2) can be identified. This allows the calculation of the actual physical size represented by each pixel in the micro-images.

3. Introduction to the ASLS Algorithm

As previously discussed, while the CCL algorithm can identify the centroid coordinates and diameter of circular regions within micro-images, this approach requires image binarization to determine the pixel diameter of the circular features in the image. However, the CCL algorithm exhibits high sensitivity to lighting conditions and requires predefined binary thresholds and pixel count ranges for circular regions to ensure accurate detection. Furthermore, because of significant variations in the color temperature and focal length of smartphone camera sensors across different devices, the binary thresholds and pixel count ranges required for circular regions in captured micro-images must be dynamically adjusted. This dependency severely limits the cross-device generalization capability of the algorithm. Therefore, there is an urgent need to introduce an adaptive circular detection algorithm to optimize the MISS method and enhance its adaptability to diverse smartphone configurations.
Current circle detection methods for images are diverse, including the Circle Hough Transform (CHT) and its improved algorithms [21,22,23,24], Random Sample Consensus (RANSAC) [25,26,27,28], and line-segment approximation-based circle detection [29,30,31,32,33]. Among these, the line-segment detection (LSD)-based method generates an initial set of candidate circles by detecting paired linear segments. It then employs mean-shift clustering to identify the cluster centers from the initial candidate circles, which are treated as the final candidate set. These candidates are validated by analyzing the ratio between the number of edges and their radii, as well as the geometric completeness of the circles, achieving a robust circle recognition performance [30]. However, this method suffers from redundant computations, an inability to utilize gradient information, and a lack of consideration for the directional information of the center of the circle, collectively limiting its precision to meet engineering requirements.
To address these limitations, Lu et al. [31] proposed an improved circle detection algorithm based on the LSD framework, called Circle Detection by arc-support line segments (ASLS). This algorithm demonstrates exceptional robustness to variations in image intensity and color temperature and enhances detection accuracy through quadratic circle fitting, meeting industrial-grade precision standards. Consequently, this study adopts the ASLS algorithm to optimize circle detection within the MISS method.
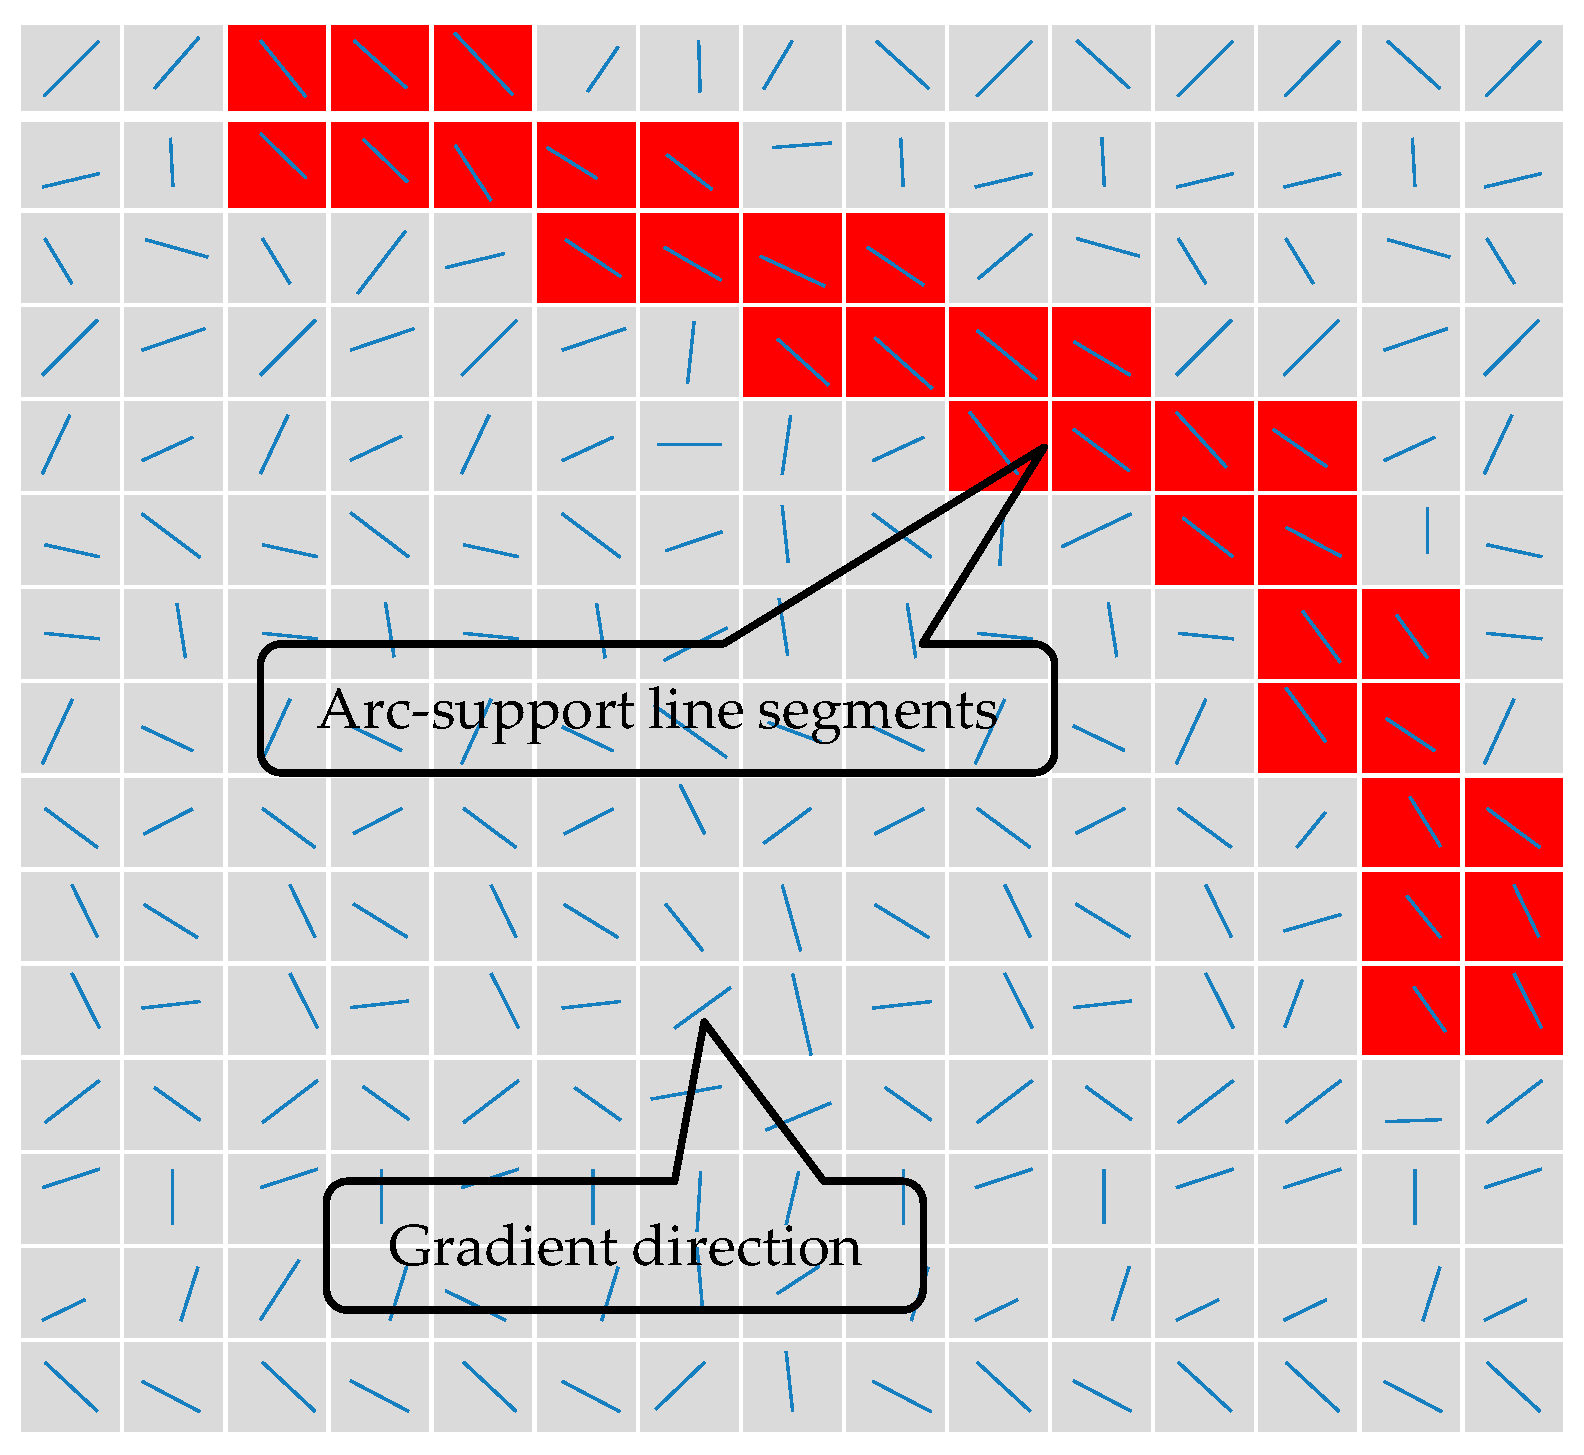
The ASLS algorithm first computes the gradient of the image to extract edge information and then identifies arc-support line segments (LS) (as illustrated in Figure 3). Subsequently, for each pair of arc-support LS, the algorithm employs polarity analysis, regional constraints, radius criteria, and in-line criteria to determine whether they can form an initial circle. Finally, the algorithm clusters the set of initial circles to generate candidate circles, which are validated to identify the circular features within the image. A detailed technical explanation of the method can be found in [31].
The ASLS algorithm requires specific parameter settings during its operation to achieve optimal detection performance for analyzing micro-images. In Section 2, we explained that the micro-images used in the MISS method employed the smartphone’s built-in flash as the light source. Despite variations in color temperature and focal length across smartphone lenses, these factors significantly affect the binarization thresholds in the CCL algorithm. They have minimal impact on the parameters of the ASLS algorithm, which requires only specific parameter configurations to accommodate micro-images captured by different smartphones (are listed in Table 1). This further demonstrates the superior adaptability of the ASLS algorithm.

4. Comparison of Circular Detection Methods

4.1. Algorithm Comparison Experimental Setup

To evaluate the performance of the two circular detection algorithms (ASLS and CCL), a comparative experiment was conducted using the apparatus shown in Figure 4.
As shown in the figure, the sensor equipped with a microscope has two supports fixed to two stages, one of which is completely stationary and the other is movable. The movable stage was connected to a stepper motor, which controlled its harmonic motion (amplitude of 0.10 mm), inducing changes in the distance between the two sensor supports to simulate dynamic strain variations on the surface of the structural components. The microscope of the sensor had a magnification range of 20–400×, a field of view diameter of 5 mm, and a resolution of 2 μm (the microscope used in the MISS method requires a minimum magnification of 20× or higher). The sensor used in the experiment had a length of 30 cm, which was designed to simulate the surface average strain of a structure with a measurement length of 30 cm. To validate the measurement accuracy of the MISS method, a Linear Variable Differential Transformer (LVDT) sensor with an accuracy of 1 μm and a measurement range of 0–2 mm was installed on one side of the movable platform to provide real-time displacement measurements.
We conducted experiments using four smartphones with varying focal lengths, color temperatures, and pixel resolutions to validate the stability and computational efficiencies of the two algorithms. These devices include older models with lower resolutions and current flagship models, broadly covering the types commonly used by the general population. We sequentially captured videos of the internal structure of the sensor using all four smartphones (due to the limited availability of magnetic mounts, only two smartphones are depicted in Figure 4) and segmented these videos into micro-images for analysis. The smartphone information, pixel resolution, and number of images derived from the four smartphone recordings are summarized in Table 2.
Owing to space constraints, Figure 5 only presents the original micro-images from Videos 1 and 2.

4.2. Detection Performance Comparison

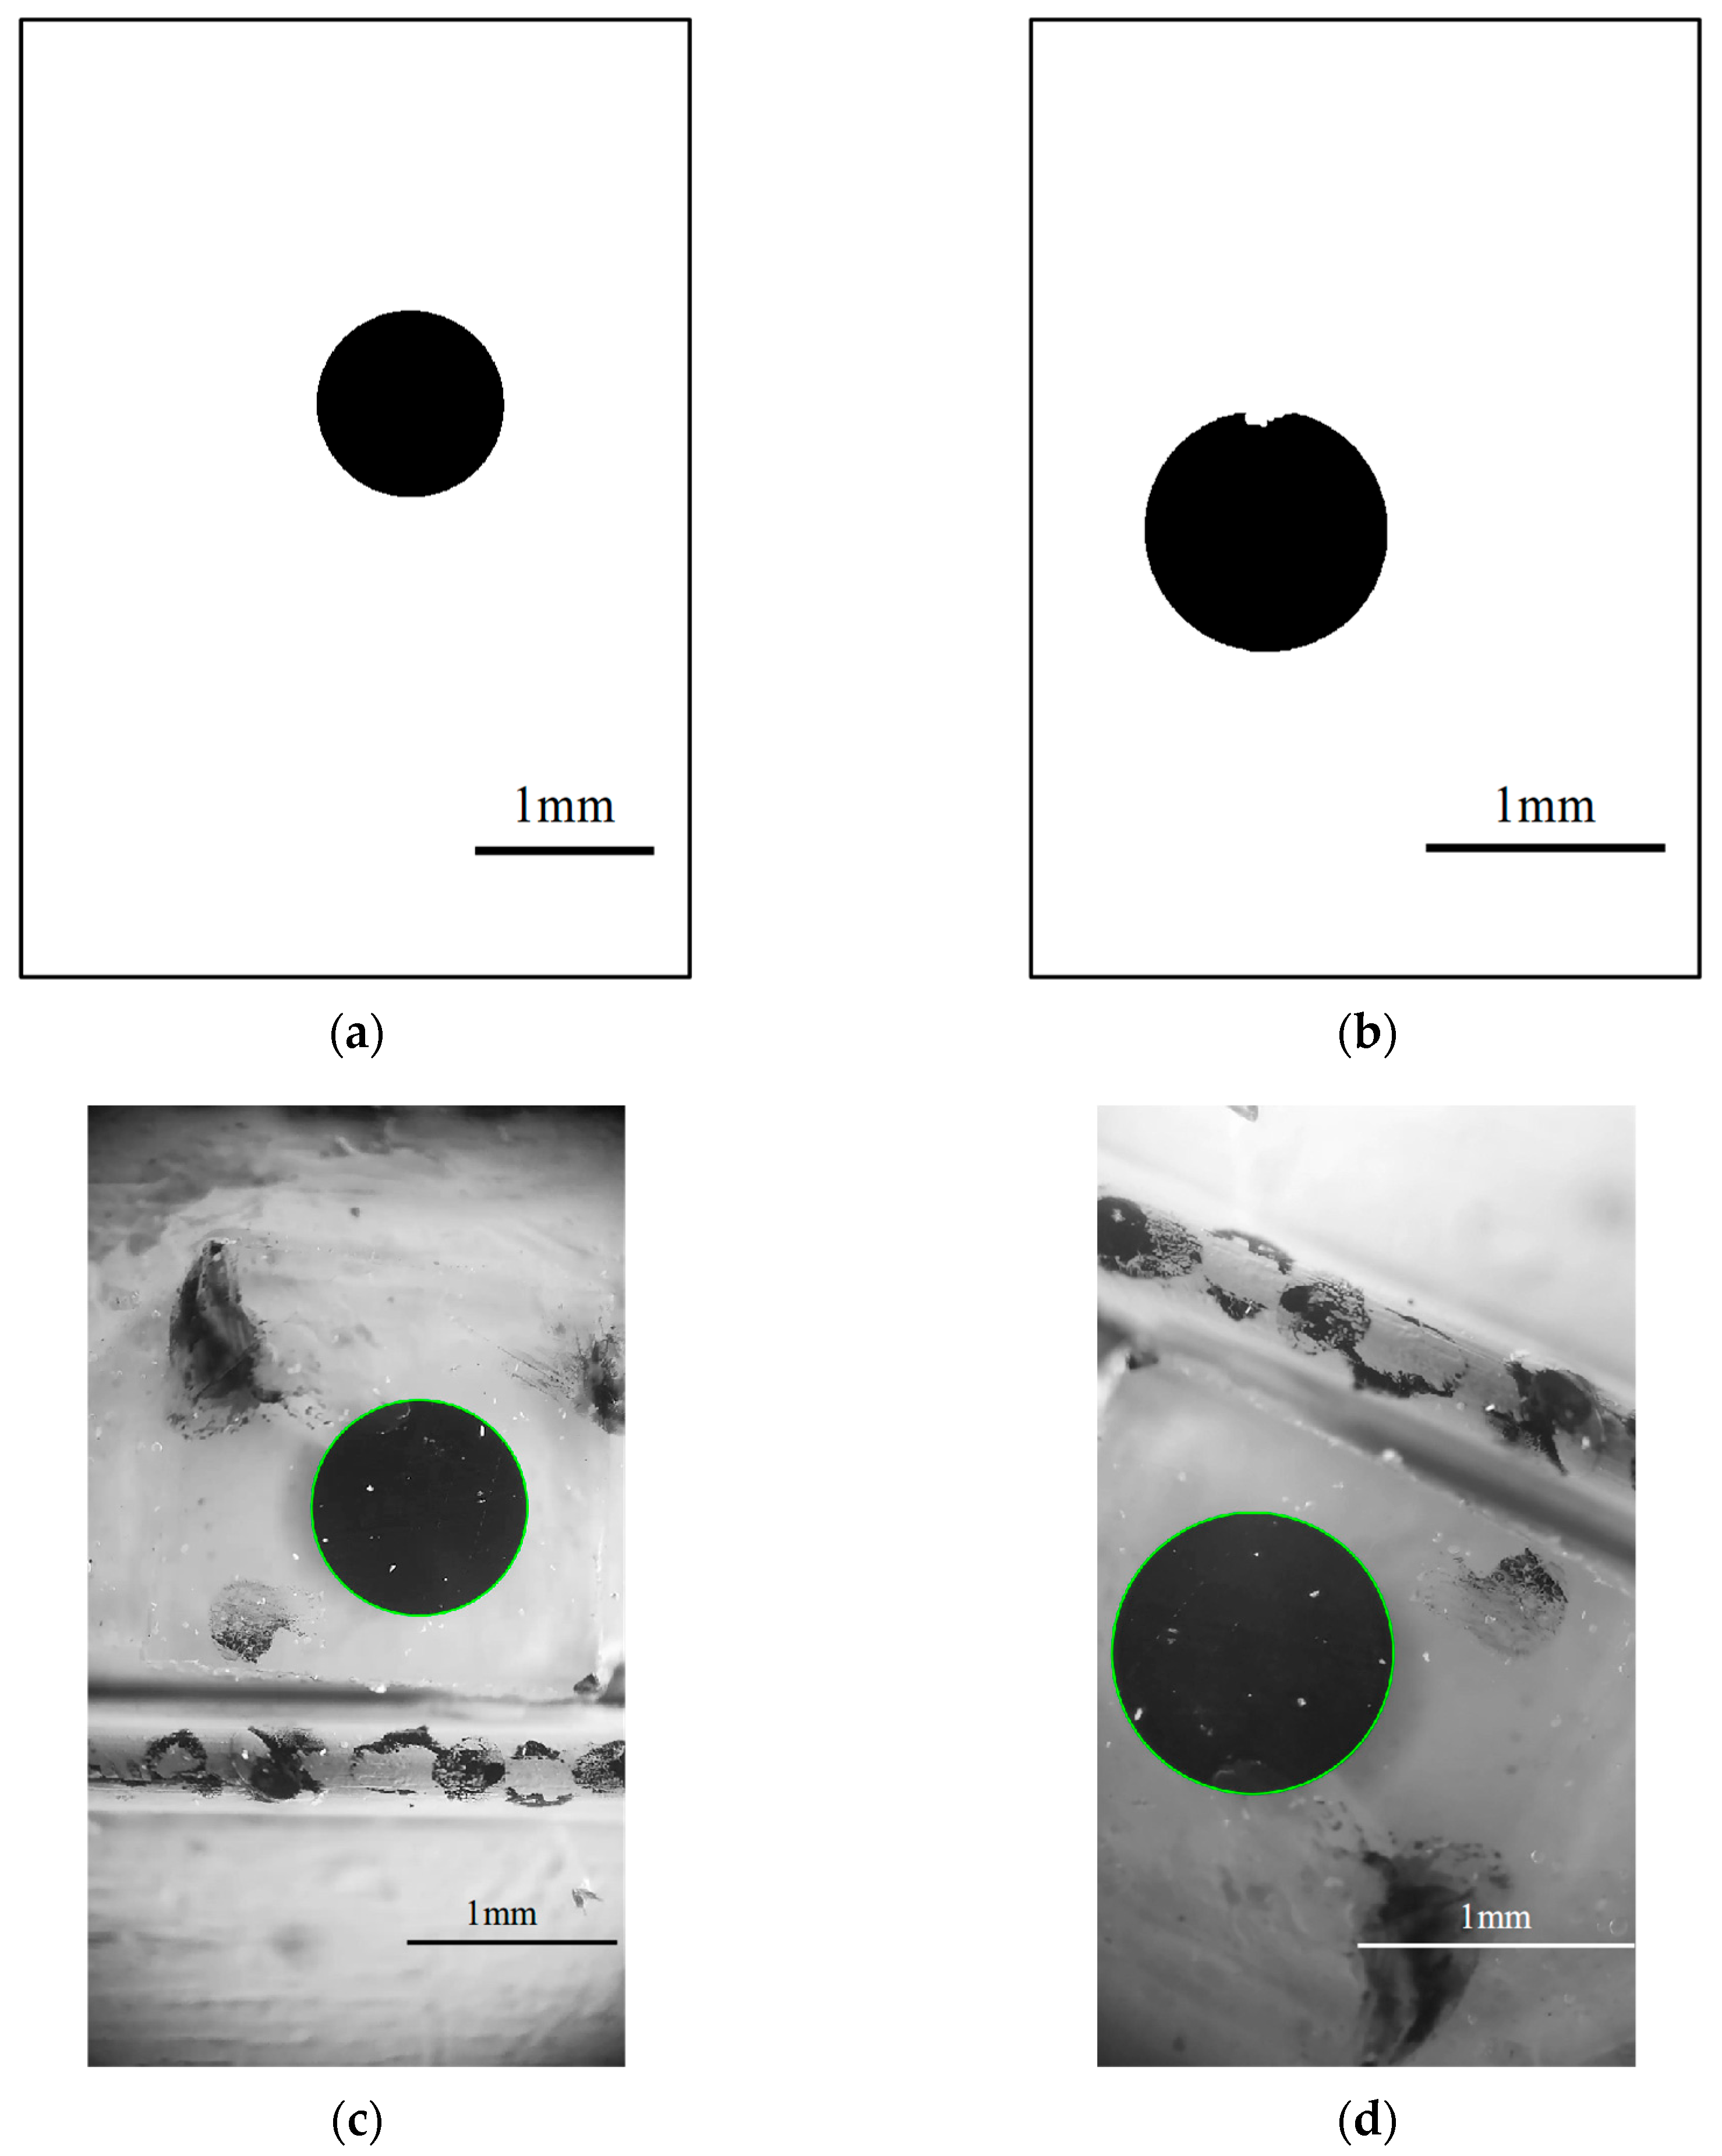
The experimental system employed a Windows platform with hardware specifications, including an Intel (R) Core (TM) Ultra 7155H 3.80 GHz CPU and 32 GB of RAM. The circular detection results depicted in Figure 6 were obtained by applying the CCL and ASLS algorithms to the original images shown in Figure 5. Specifically, Figure 6a,b shows the CCL algorithm using identical binary thresholds, and Figure 6c,d shows the ASLS algorithm with identical parameter settings.
It can be observed from the figures that compared to the detection results in Figure 6a, the outcomes of identifying circular features in the micro-image of Figure 5b using the CCL algorithm with the same binary threshold exhibit deficiencies, as shown in Figure 6b. Additionally, owing to differences in camera focal lengths, the pixel count occupied by a circle with a diameter of 1 mm in the image varies, necessitating pre-testing of pixel counts to accurately identify circular regions. These results collectively indicate that the CCL algorithm with fixed parameters struggles to detect circles in micro-images captured under varying color temperatures and focal lengths.
In contrast, the detection results in Figure 6c,d (depicted by green circles) demonstrate that the ASLS algorithm, when applied with identical parameter settings, effectively identifies circular features across micro-images with different color temperatures and focal lengths. This result was validated using data from two additional smartphones, demonstrating the robust adaptability and stability of the ASLS algorithm under diverse imaging conditions.

4.3. Computational Results Comparison

By analyzing the computational results of the two algorithms (CCL and ASLS) applied to the same experimental micro-images, the computational time and circular diameter data for both algorithms can be obtained, as summarized in Table 3.
It can be observed from Table 3 that the diameters of the circles detected from both algorithms are nearly identical, with a maximum error of only 0.94%. The CCL algorithm, which relies on image binarization, exhibits a significantly faster computational speed than the ASLS algorithm, with a six- to eight-fold time advantage. However, when employing the MISS method for measuring dynamic strain in structural analysis, smartphones are fixed in place to record videos of microscopic structures within the sensor, which are subsequently segmented into images for analysis. Because the circular features within these video frames remain static, only the first image requires an analysis to determine the circle diameter for pixel calibration, which is then applied to all subsequent images. The diameter data for both methods when analyzing the first image and all subsequent images are summarized in Table 4.
From Table 4, it can be observed that the diameter values of the detected circle in the first video image and all subsequent images are highly consistent between both methods, with a maximum error of 0.44%, thereby validating the feasibility of using the circular diameter from the first image for pixel calibration and applying it to all subsequent frames in the MISS method. In this scenario, the ASLS algorithm achieves a computational time comparable to that of the CCL algorithm for pixel calibration within the MISS method, thereby offsetting the previous computational time disadvantage observed in full-image processing.

5. Analysis of Illumination Variation Effects

5.1. Illumination Variation Experimental Setup

To analyze the robustness of the optimized MISS method to external light intensity variations, experiments were conducted using the test apparatus introduced in Section 4. The experiment was conducted during the day and night, with variations in light intensity simulated by turning the lights on and off. During the experiment, the Honor 7X recorded micro-images of the sensor, whereas the HUAWEI nova 13’s flashlight illuminated the smartphone microscope on the sensor from different angles to simulate external lighting interference. A schematic of the test setup is shown in Figure 7.
The light intensity variation tests were divided into two phases: static and dynamic. In the static testing, the stepper motor was not activated and the movable stage remained stationary. Under these conditions, theoretically, the strain measured by the sensor should be zero. If the optimized MISS method was significantly affected by light intensity variations, the measured results would deviate markedly from the expected zero value. In the dynamic testing, the stepper motor drove the movable stage to perform harmonic motion with an amplitude of 0.1 mm. The results of the optimized MISS method were compared with real-time measurements from the LVDT sensor to analyze the error between the two methods.

5.2. Static Test Results Analysis

The ASLS algorithm was employed to detect circular features in the micro-images recorded by Honor 7X and calibrate the pixel scale for real-world measurements. Subsequently, the SURF algorithm was applied to identify the feature points within the images, ultimately yielding the strain measured by the optimized MISS method. The experimental results are shown in Figure 8.
As shown in the figure, despite simulating numerous lighting interferences during the experiment, the measured data exhibited noise clustered around the zero-axis. The histogram of the noise data conformed to a normal distribution with an amplitude of ±0.5 με, the 95% confidence interval is [−0.0009, 0.0019]. The noise is likely caused by imprecision in the feature point detection. However, the microscope, which relies on continuous flashlight illumination from a smartphone during imaging, inherently mitigates the impact of external lighting variations. Consequently, the optimized MISS method demonstrated strong adaptability to fluctuations in the environmental lighting conditions.

5.3. Dynamic Test Results Analysis

Figure 9 presents the results obtained by comparing the strain measured using the optimized MISS method with the data from the LVDT.
As shown in the figure, under external lighting interference, the optimized MISS method did not exhibit abrupt fluctuations in its measurements and demonstrated good consistency with the LVDT data. This indicates that the influence of external lighting variations on the strain measured using the optimized MISS method is limited.
The dynamic test was repeated five times, and the maximum strain values measured using the two methods were subtracted to obtain the error values presented in Table 5.
As shown in the table, the maximum error between the two methods is 7.0 με, which does not exceed 2% of the measured values.
All results confirm that the ASLS algorithm outperforms CCL across different devices and under various lighting conditions. The ASLS algorithm employs an arc line segment identification technique that can achieve stable performance across diverse illumination levels and device heterogeneity. This aligns with the engineering requirements for reliable strain measurements in uncontrolled field environments. Meanwhile, the ability of ASLS to handle sub-pixel accuracy and partial occlusions ensures higher fidelity in capturing transient strain responses compared with CCL’s binary segmentation approach of CCL. CCL requires manual recalibration for each device owing to its dependency on fixed thresholds. The ASLS eliminates this constraint, enabling seamless deployment across heterogeneous smartphone models without parameter tuning. This scalability is critical for large-scale structural health monitoring.

6. Analysis of Image Distortion Effects

6.1. Forms of Distortion

Owing to manufacturing precision deviations, assembly process inaccuracies, and inherent lens characteristics, smartphone cameras and microscope lenses inevitably exhibit lens distortion, resulting in deformation and distortion in the captured micro-images. Lens distortions can typically be categorized into radial and tangential distortions. For most machine-vision applications, tangential distortion can be neglected. However, radial distortion can be further divided into barrel and pincushion distortions. To determine the type of distortion present in micro-images captured by smartphones combined with microscopes and to analyze the impact of image distortion on structural strain measurements using the MISS method, this study employed a precision chessboard pattern (ceramic material, with a precision of ± 1 μm and square size of 0.25 mm) to evaluate the distortion characteristics of micro-images. The corner points of the chessboard were identified to analyze the pixel count differences within a fixed 0.25 mm spacing in the images, thereby quantifying the distortion effects on the MISS method.
A corner point in an image refers to locations where there is a rapid intensity change in pixel grayscale, or where the curvature of the edge contours reaches a local maximum. Depending on their underlying principles, corner detection methods in images can be broadly categorized into two main classes: intensity-based detection methods, represented by algorithms such as the Harris algorithm [34] and the SUSAN algorithm [35]; and edge contour-based detection methods, exemplified by the CSS algorithm [36,37], the CPDA algorithm [38], and the CTAR algorithm [39].
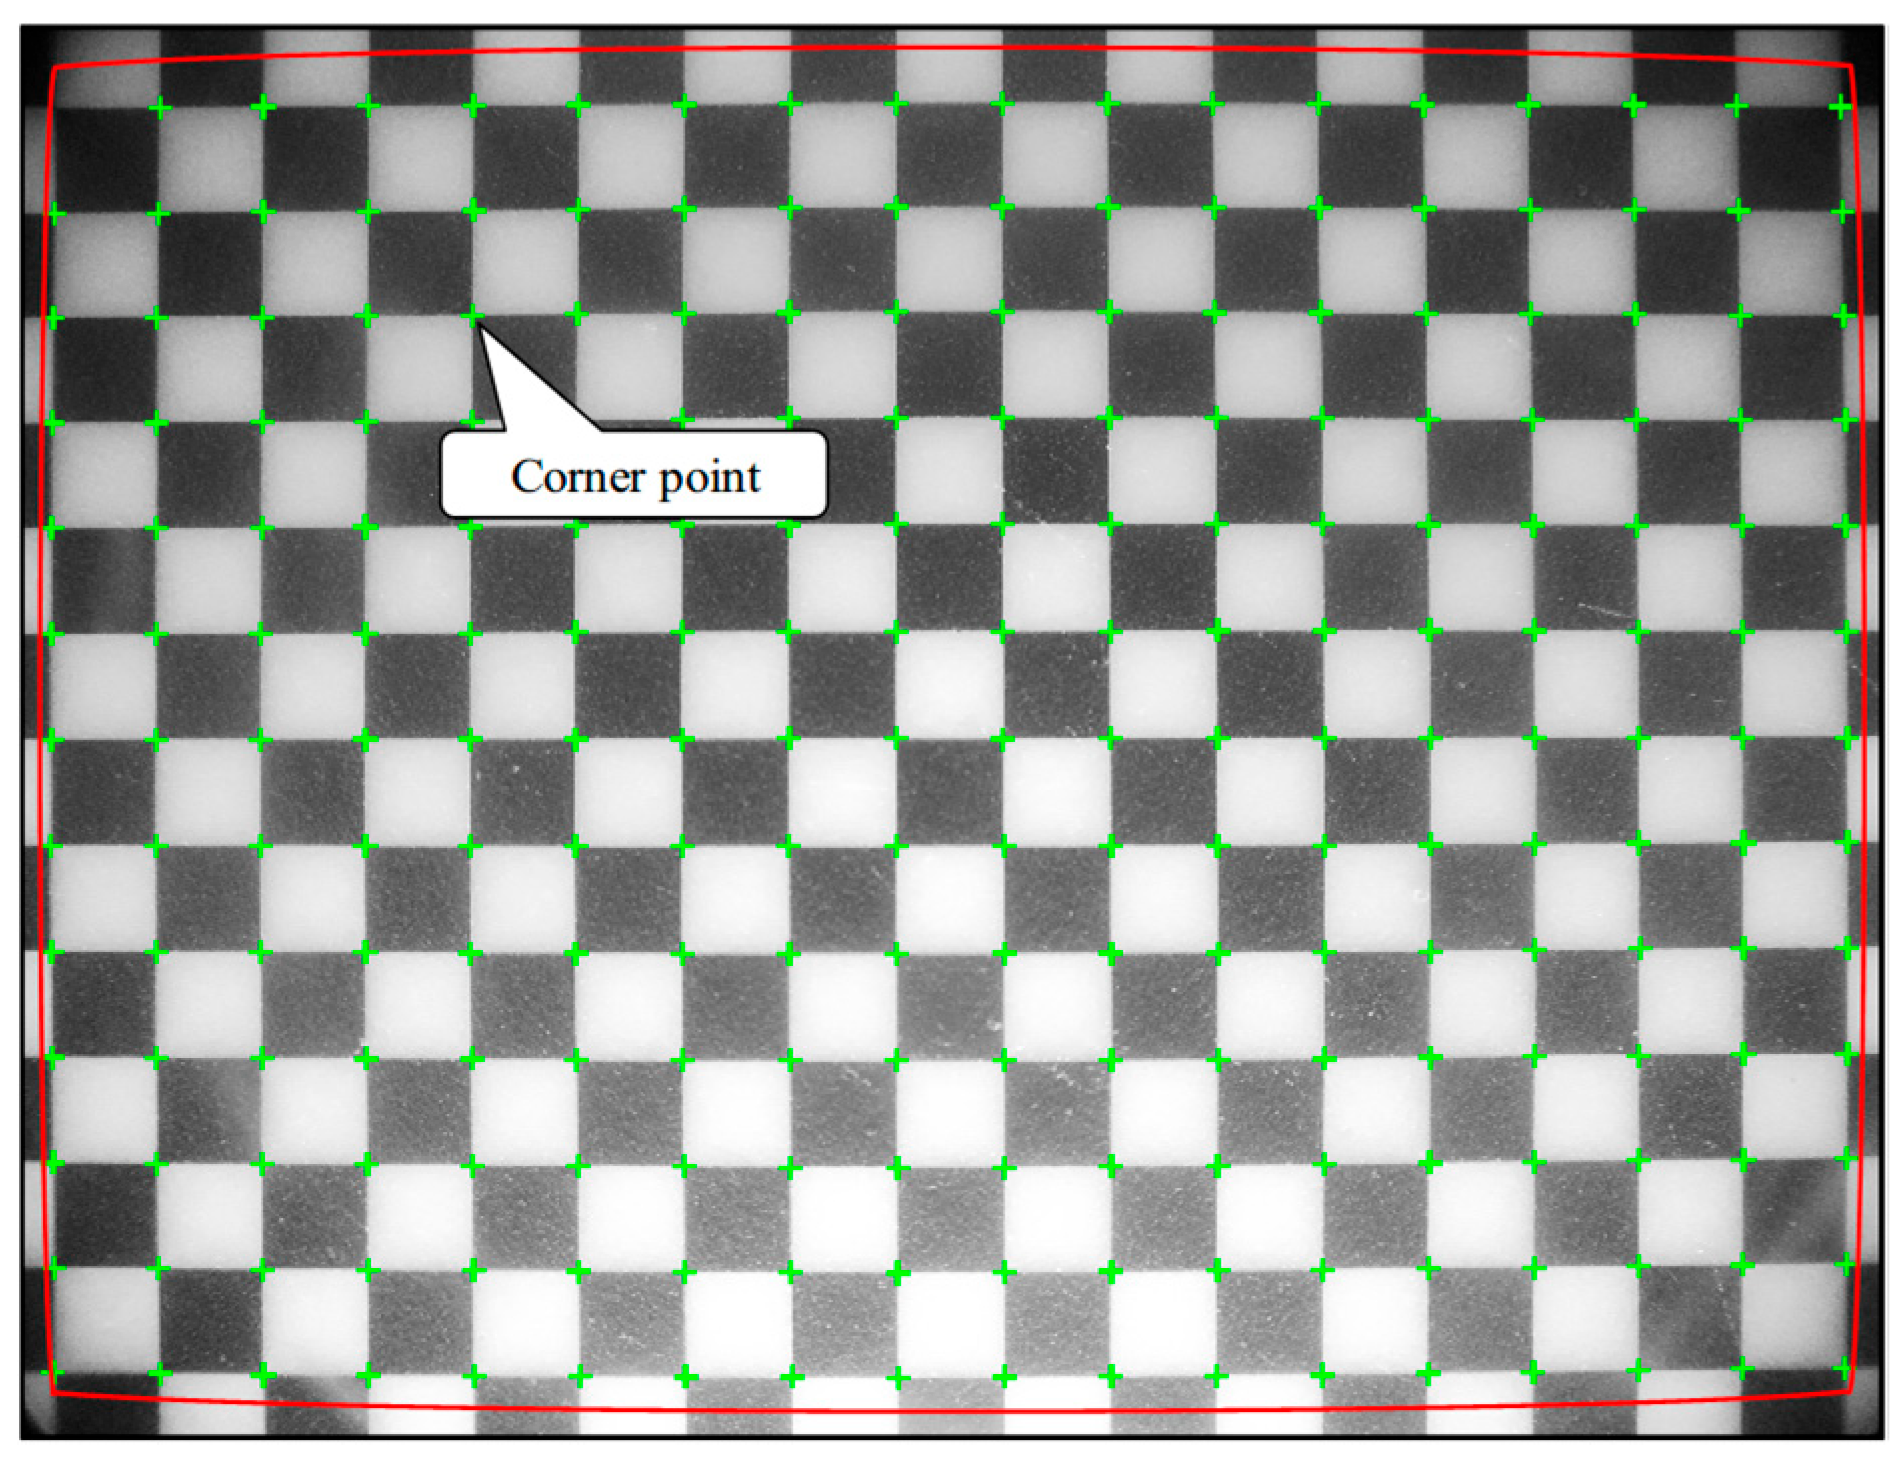
In this study, an online toolbox [40] was employed to detect corner points in chessboard pattern images. The coordinates of each corner point were identified and the number of pixels between adjacent corner points was calculated, as illustrated in Figure 10.
Observing the distortion of the chessboard pattern edges in Figure 10 (highlighted by red curves), it is evident that the microscopic image exhibits barrel distortion characterized by radial expansion from the center toward the periphery. The coordinates of the corner points between black and white squares can be effectively identified by applying corner detection methods. Subsequently, the pixel count differences between fixed-spaced corner points can be quantified by analyzing the coordinates of corner points in each row and column.

6.2. Pixel Variability

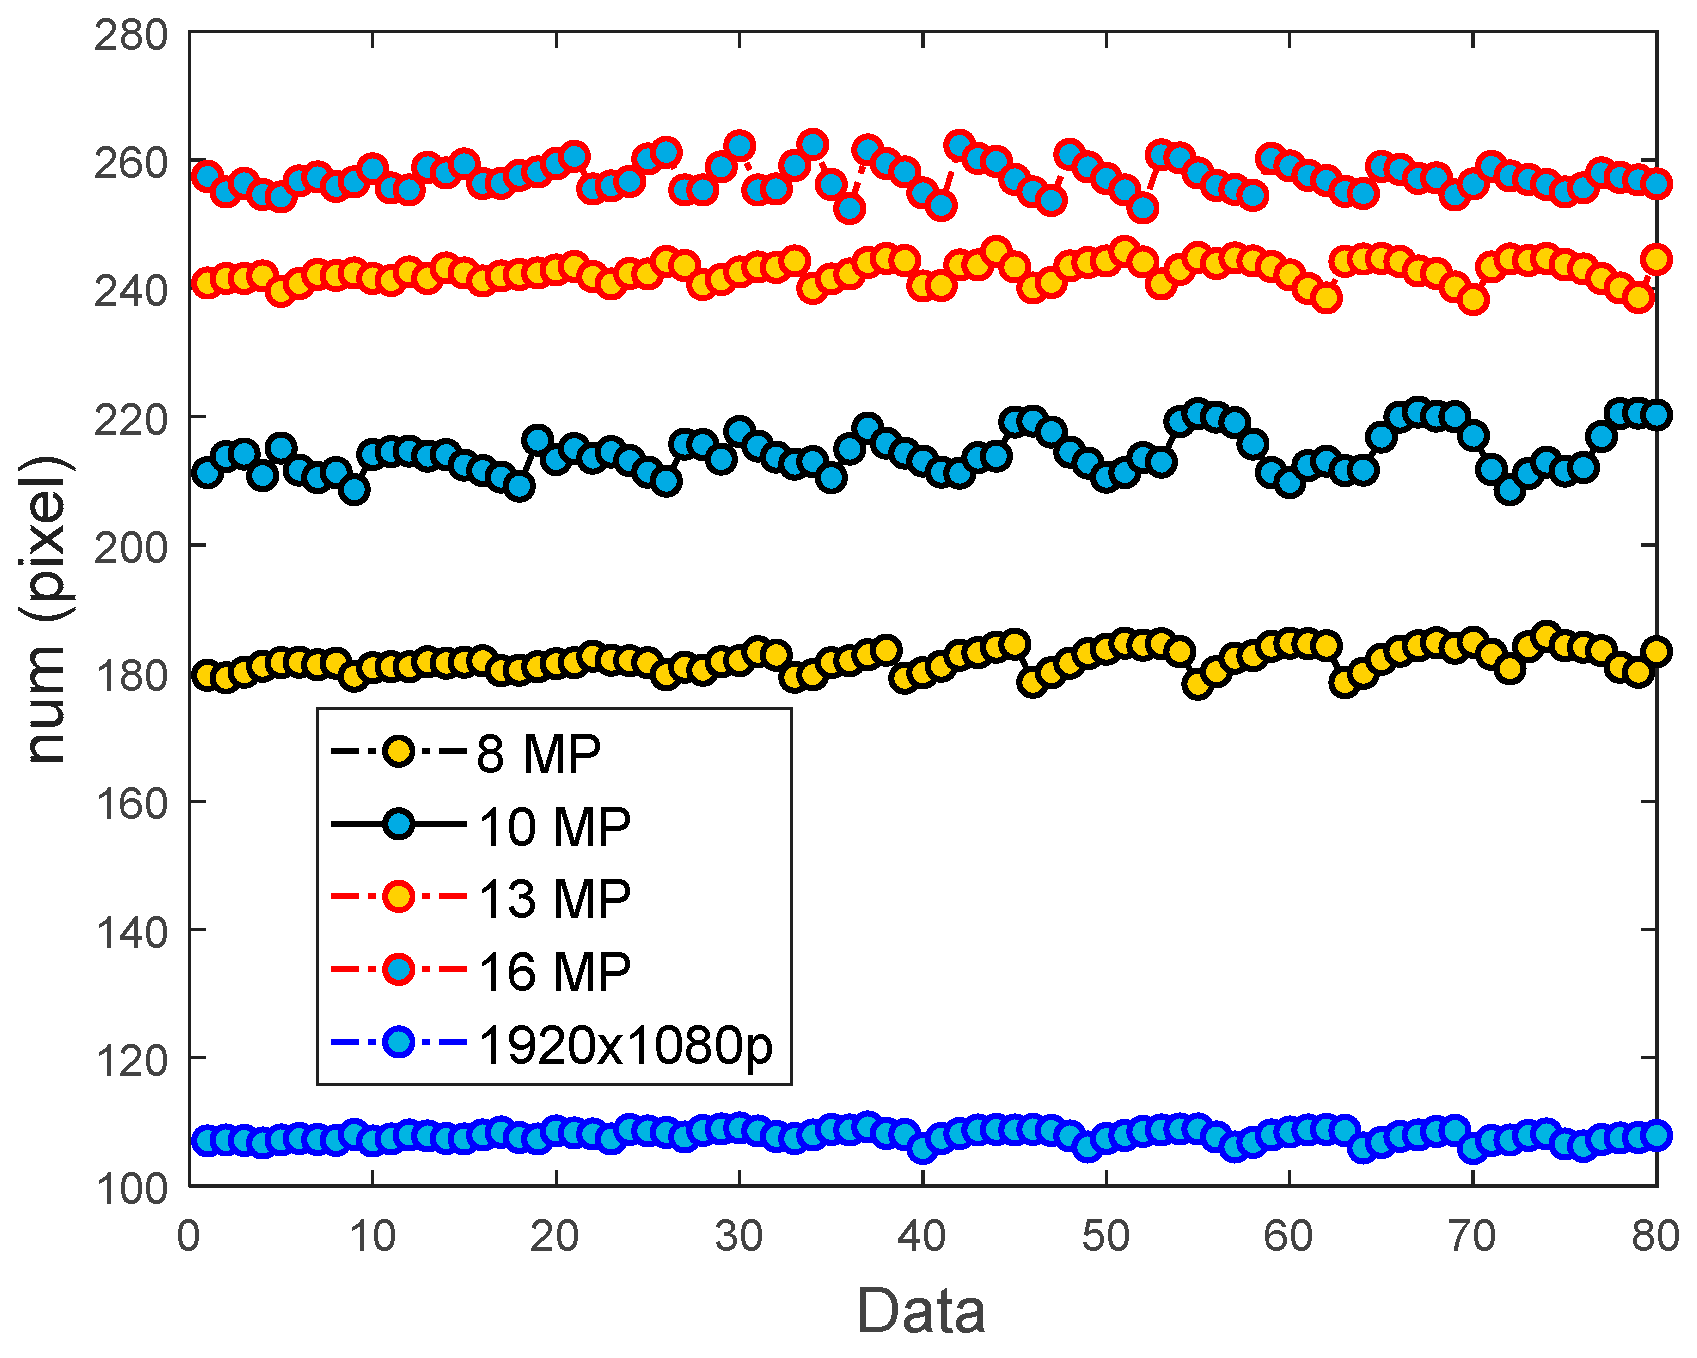
Micro-images of the chessboard pattern were captured using four smartphones (8 MP, 10MP, 13MP, and 16 MP) and video recordings at a resolution of 1920 × 1080 pixels. Subsequently, a toolbox was employed to detect the coordinates of the corner points within each image (as indicated by the green markers in Figure 10) and calculate the pixel count between adjacent corner points. The results are shown in Figure 11.
The pixel count variations caused by image distortion in equidistant intervals can be quantified by subtracting the minimum value from the maximum value of each dataset and dividing the result by the average value of the data. This allowed for an analysis of the impact of distortion on the accuracy of the MISS method. The resulting data are listed in Table 6.
As shown in the table, image distortion caused variations in the pixel count between corner points across the five types of chessboard micro-images. However, the resulting errors remained relatively small, with a maximum error of 5.6%. This variation arises from lens distortion, which introduces discrepancies in the actual pixel size within the micro-images captured by smartphones integrated with microscopes. The distortion error of 5.6% corresponds theoretically to a strain difference of approximately 40 με. However, as shown in Table 5, the maximum error was 7.0 με, which did not reach the theoretical value. This discrepancy may be attributed to the fact that movable marker point 1 identified in the MISS method occupies a larger proportion of the microscopic image (spanning the horizontal axis in Figure 1b), thereby mitigating the error.

7. Conclusions

This study analyzed and optimized a smartphone-based strain measurement method previously investigated, namely the MISS method. Experimental comparisons were conducted between a novel circular feature detection algorithm (ASLS) and the original Connected Component Labeling (CCL) algorithm used in the MISS method, focusing on their stability and computational efficiency in detecting circular diameters in micro-images. To examine the image distortion types and their algorithmic impacts, high-precision chessboard patterns (1 μm resolution) were employed for microscopic imaging and subsequent analysis. Finally, experiments were performed under daytime and nighttime conditions, simulating external lighting variations via on/off light switching and continuous flashlight illumination, to evaluate the adaptability of the MISS method to environmental light changes. The conclusions are summarized as follows:
(1) The ASLS and CCL algorithm yielded comparable circular diameter measurements in micro-images, with a maximum error of 0.94%. However, the ASLS algorithm demonstrated superior adaptability to variations in image color temperature and circular region area. Although the ASLS algorithm required a slightly longer processing time than the CCL, its computational efficiency remained practically equivalent when applied to dynamic strain measurements. Specifically, by calibrating the pixel scale using the first frame of a smartphone-recorded video, subsequent image analyses achieved a maximum error of 0.44%. This indicates that replacing the original CCL algorithm with ASLS in the MISS method does not compromise computational efficiency while enhancing adaptability.
(2) In controlled experiments with a stationary sensor subjected to fluctuating external lighting conditions, the strain measurements exhibited noise clustered around zero, conforming to a normal distribution with an amplitude of ±0.5 με. The dynamic test results demonstrate that the optimized MISS method exhibits stable and accurate measurements under external light intensity variations, with a maximum error of only 7.0 με compared to the LVDT data, meeting the requirements of practical engineering applications. This confirms that lighting variations do not significantly affect the strain measurement precision of the MISS method.
(3) Analysis of chessboard micro-images revealed that the captured images exhibited barrel distortion. The maximum error caused by distortion was determined by calculating pixel count differences between adjacent checkerboard corner points, yielding a value of 5.66%. This theoretically corresponds to an error of approximately 40 με; however, the experimental results showed a maximum error of only 7 με. This discrepancy may be attributed to the larger image span occupied by the movable marker point, which mitigated a portion of the error. Further analysis of the error evolution will be the focus of future research.
In summary, the optimized MISS method demonstrated enhanced stability and adaptability, positioning it as an ideal tool for strain response monitoring in civil infrastructure. Although the method exhibits limitations in dynamic environments involving high-frequency vibrations and faces challenges in large-scale deployment, such as environmental factors (temperature and humidity fluctuations), hybrid sensing integration, and computational efficiency (which are the focus of our future research), its robust performance across diverse conditions validates its broad applicability and potential for widespread adoption in structural health monitoring (SHM) systems.

Author Contributions

Conceptualization, Q.C. and B.X.; methodology, Q.C., C.G., S.L. and B.X.; software, Q.C. and B.X.; validation, Q.C., C.G. and S.L.; formal analysis, Q.C., C.G. and S.L.; investigation, Q.C. and C.G.; resources, C.G. and S.L.; data curation, Q.C. and B.X.; writing—original draft preparation, Q.C.; writing—review and editing, C.G., S.L. and B.X.; visualization, Q.C.; supervision, B.X.; All authors have read and agreed to the published version of the manuscript.

Funding

This research received no external funding.

Data Availability Statement

The data presented in this study are available upon request. Please contact the corresponding author.

Acknowledgments

The authors thank all the reviewers who participated in the review.

Conflicts of Interest

Authors Changfei Gou and Shengan Lu were employed by the company Wenzhou Railway and Mass Transit Investment Group Co., Ltd. The remaining authors declare that the research was conducted in the absence of any commercial or financial relationships that could be construed as a potential conflict of interest.

Abbreviations

The following abbreviations are used in this manuscript:
MISSMicro Image Strain Sensing
SURFSpeeded-up Robust Feature
CCLConnected Component Labeling
ASLSArc-Support Line Segments

References

  1. Vijayan, D.S.; Sivasuriyan, A.; Devarajan, P.; Krejsa, M.; Chalecki, M.; Żółtowski, M.; Kozarzewska, A.; Koda, E. Development of Intelligent Technologies in SHM on the Innovative Diagnosis in Civil Engineering—A Comprehensive Review. Buildings 2023, 13, 1903. [Google Scholar] [CrossRef]
  2. Zhang, B.; Ren, Y.; He, S.; Gao, Z.; Li, B.; Song, J. A Review of Methods and Applications in Structural Health Monitoring (SHM) for Bridges. Measurement 2025, 245, 116575. [Google Scholar] [CrossRef]
  3. Yang, Y.; Xu, W.; Gao, Z.; Yu, Z.; Zhang, Y. Research Progress of SHM System for Super High-Rise Buildings Based on Wireless Sensor Network and Cloud Platform. Remote Sens. 2023, 15, 1473. [Google Scholar] [CrossRef]
  4. Li, Y.; Chen, S.; Hou, Y.; Xiao, W.; Fan, L.; Cai, Z.; Wu, J.; Li, Y. Strain Response Analysis and Experimental Study of the Cross-Fault Buried Pipelines. Symmetry 2025, 17, 501. [Google Scholar] [CrossRef]
  5. Wang, T.; Shi, B.; Zhu, Y. Structural Monitoring and Performance Assessment of Shield Tunnels during the Operation Period, Based on Distributed Optical-Fiber Sensors. Symmetry 2019, 11, 940. [Google Scholar] [CrossRef]
  6. Tang, Y.; Zheng, B.; Yu, T. Crack Identification Method for Prefabricated Concrete Pavement Based on Distributed Strain Monitoring. Buildings 2024, 14, 2520. [Google Scholar] [CrossRef]
  7. Zhou, G.; Zhang, Z.; Ren, L.; Li, D.; Zhao, X. Design of Smart Cable for Distributed Cable Force Measurement in Cable Dome Structures and Its Application. Buildings 2023, 13, 2186. [Google Scholar] [CrossRef]
  8. Cui, H.; Du, H.; Zhao, F.; Hong, M. Damage Identification in a Plate Structure Based on a Cross-Direction Strain Measurement Method. Measurement 2020, 158, 107714. [Google Scholar] [CrossRef]
  9. Lee, H.M.; Choi, S.W.; Jung, D.J.; Park, H.S. Analytical Model for Estimation of Maximum Normal Stress in Steel Beam-Columns Based on Wireless Measurement of Average Strains from Vibrating Wire Strain Gages. Comput.-Aided Civ. Infrastruct. Eng. 2013, 28, 707–717. [Google Scholar] [CrossRef]
  10. Yu, L.; Pan, B. In-Plane Displacement and Strain Measurements Using a Camera Phone and Digital Image Correlation. Opt. Eng. 2014, 53, 054107. [Google Scholar] [CrossRef]
  11. Yu, L.; Tao, R.; Lubineau, G. Accurate 3D Shape, Displacement and Deformation Measurement Using a Smartphone. Sensors 2019, 19, 719. [Google Scholar] [CrossRef]
  12. Yu, L.; Bekdullayev, N.; Lubineau, G. Smartphone-Based Single-Camera Stereo-DIC System: Thermal Error Analysis and Design Recommendations. IEEE Sens. J. 2021, 21, 9567–9576. [Google Scholar] [CrossRef]
  13. Kromanis, R.; Xu, Y.; Lydon, D.; Martinez del Rincon, J.; Al-Habaibeh, A. Measuring Structural Deformations in the Laboratory Environment Using Smartphones. Front. Built Environ. 2019, 5, 44. [Google Scholar] [CrossRef]
  14. Xie, B.; Zhao, X.; Li, J.; Yan, X.; Lv, X. Research on 2D Digital Image Correlation Measurement Based on Smartphones. In Proceedings of the SPIE Smart Structures + Nondestructive Evaluation, Denver, CO, USA, 3–7 March 2019. [Google Scholar]
  15. Stoilov, G.; Pashkouleva, D.; Kavardzhikov, V. Smartphone Application for Structural Health Monitoring. IOP Conf. Ser. Mater. Sci. Eng. 2020, 951, 012026. [Google Scholar] [CrossRef]
  16. Xie, B.; Li, J.; Zhao, X. Accuracy and Sensibility Analysis of Strain Measurement Based on Microimages Captured by Smartphone with a Microscope. Struct Control. Health Monit 2021, 2, 2692. [Google Scholar] [CrossRef]
  17. Xie, B.; Li, J.; Zhao, X. Strain Measurement Based on Speeded-up Robust Feature Algorithm Applied to Microimages from a Smartphone-Based Microscope. Sensors 2020, 20, 2805. [Google Scholar] [CrossRef] [PubMed]
  18. Xie, B.; Chen, X.; Ding, M.; Zhou, G.; Zhao, X. Design and Development of a New Strain Measuring Method Based on Smartphone and Machine Vision. Measurement 2021, 182, 109724. [Google Scholar] [CrossRef]
  19. Chen, X.; Zhang, L.; Xie, B.; Zhou, G.; Zhao, X. Critical Experiments for Structural Members of Micro Image Strain Sensing Sensor Based on Smartphone and Microscope. Buildings 2022, 12, 212. [Google Scholar] [CrossRef]
  20. Chen, X.; Li, H.; Zhao, C.; Zhou, G.; Li, W.; Zhang, X.; Zhao, X. Smartphone-Based Method for Measuring Maximum Peak Tensile and Compressive Strain. Comput.-Aided Civ. Infrastruct. Eng. 2024, 39, 2330–2349. [Google Scholar] [CrossRef]
  21. Yuen, H.K.; Princen, J.; Lllingworth, J.; Kittler, J. Comparative Study of Hough Transform Methods for Circle Finding. Image Vis. Comput. 1990, 8, 71–77. [Google Scholar] [CrossRef]
  22. Shehata Hassanein, A.; Mohammad, S.; Sameer, M.; Ehab Ragab, M. A Survey on Hough Transform, Theory, Techniques and Applications. arXiv 2015, arXiv:1502.02160. [Google Scholar] [CrossRef]
  23. Zhao, C.; Fan, C.; Zhao, Z. The Center of the Circle Fitting Optimization Algorithm Based on the Hough Transform for Crane. Appl. Sci. 2022, 12, 10341. [Google Scholar] [CrossRef]
  24. Zhou, Q.; Zhang, K.; Zhang, Z.; Yu, H. Improved Randomized Hough Transform Based on Circular Power Theory. In Proceedings of the 2023 International Conference on Image Processing, Computer Vision and Machine Learning, ICICML 2023, Chengdu, China, 3–5 November 2023; pp. 288–293. [Google Scholar]
  25. Chen, T.C.; Chung, K.L. An Efficient Randomized Algorithm for Detecting Circles. Comput. Vis. Image Underst. 2001, 83, 172–191. [Google Scholar] [CrossRef]
  26. Jia, L.Q.; Peng, C.Z.; Liu, H.M.; Wang, Z.H. A Fast Randomized Circle Detection Algorithm. In Proceedings of the 4th International Congress on Image and Signal Processing, CISP 2011, Shanghai, China, 15–16 October 2011; Volume 2, pp. 820–823. [Google Scholar]
  27. Chung, K.L.; Huang, Y.H.; Shen, S.M.; Krylov, A.S.; Yurin, D.V.; Semeikina, E.V. Efficient Sampling Strategy and Refinement Strategy for Randomized Circle Detection. Pattern Recognit. 2012, 45, 252–263. [Google Scholar] [CrossRef]
  28. Huang, Y.H.; Chung, K.L.; Yang, W.N.; Chiu, S.H. Efficient Symmetry-Based Screening Strategy to Speed up Randomized Circle-Detection. Pattern Recognit. Lett. 2012, 33, 2071–2076. [Google Scholar] [CrossRef]
  29. Grompone von Gioi, R.; Jakubowicz, J.; Morel, J.-M.; Randall, G. LSD: A Line Segment Detector. Image Process. Line 2012, 2, 35–55. [Google Scholar] [CrossRef]
  30. Le, T.; Duan, Y. Circle Detection on Images by Line Segment and Circle Completeness. In Proceedings of the International Conference on Image Processing, ICIP 2016, Phoenix, AZ, USA, 25–28 September 2016; pp. 3648–3652. [Google Scholar]
  31. Lu, C.; Xia, S.; Huang, W.; Shao, M.; Fu, Y. Circle detection by arc-support line segments. In Proceedings of the 2017 IEEE International Conference on Image Processing (ICIP), Beijing, China, 17–20 September 2017; pp. 76–80. [Google Scholar]
  32. Lu, C.; Xia, S.; Shao, M.; Fu, Y. Arc-Support Line Segments Revisited: An Efficient and High-Quality Ellipse Detection. IEEE Trans. Image Process. 2019, 29, 768–781. [Google Scholar] [CrossRef] [PubMed]
  33. Liu, Y.; Deng, H.; Zhang, Z.; Xu, Q. A Fast Circle Detector with Efficient Arc Extraction. Symmetry 2022, 14, 734. [Google Scholar] [CrossRef]
  34. Harris, C.; Stephens, M. A Combined Corner and Edge Detector. In Proceedings of the AVC, Manchester, UK, 31 August–2 September 1988; pp. 23.1–23.6. [Google Scholar]
  35. Smith, S.M.; Brady, J.M. SUSAN-A New Approach to Low Level Image Processing. Int. J. Comput. Vis. 1997, 23, 45–78. [Google Scholar] [CrossRef]
  36. Awrangjeb, M.; Lu, G. Robust Image Corner Detection Based on the Chord-to-Point Distance Accumulation Technique. IEEE Trans. Multimed. 2008, 10, 1059–1072. [Google Scholar] [CrossRef]
  37. Mokhtarian, F.; Suomela, R. Robust image corner detection through curvature scale space. IEEE Trans. Pattern Anal. Mach. Intell. 1998, 20, 1376–1381. [Google Scholar] [CrossRef]
  38. Teng, S.W.; Najmus Sadat, R.M.; Lu, G. Effective and Efficient Contour-Based Corner Detectors. Pattern Recognit. 2015, 48, 2185–2197. [Google Scholar] [CrossRef]
  39. Sadat, R.M.N.; Teng, S.W.; Lu, G. An Effective and Efficient Contour-Based Corner Detector Using Simple Triangular Theory. In Proceedings of the Pacific Conference on Computer Graphics and Applications, Kaohsiung, Taiwan, 21–23 September 2011; pp. 37–42. [Google Scholar]
  40. Geiger, A.; Moosmann, F.; Car, Ö.; Schuster, B. Automatic Camera and Range Sensor Calibration using a single Shot. In Proceedings of the ICRA 2012: IEEE International Conference on Robotics and Automation, St. Paul, MN, USA, 14–18 May 2012; ISBN 9781467314053. [Google Scholar]
Figure 1. Sensor fabrication and characterization [18]. (a) Sensor photograph. (b) Internal platform details of the sensor.
Buildings 15 03407 g001
Figure 2. View of circle detection [18]. (a) Image after open operation. (b) Binarized and segmented image of the circular region.
Buildings 15 03407 g002
Figure 3. Shows the arc-support LS [31].
Buildings 15 03407 g003
Figure 4. Schematic illustration of the test setup.
Buildings 15 03407 g004
Figure 5. Schematic illustration of the micro-images. (a) Image derived from video 1; (b) Image derived from video 2.
Buildings 15 03407 g005
Figure 6. Circular feature detection results. (a) Image in Figure 5a processed using the CCL algorithm. (b) Image in Figure 5b processed using the CCL algorithm. (c) Image in Figure 5a processed using the ASLS algorithm. (d) Image in Figure 5b processed using the ASLS algorithm.
Buildings 15 03407 g006
Figure 7. Schematic illustration of the light intensity variation test.
Buildings 15 03407 g007
Figure 8. The strain data were measured using a stationary sensor under varying light conditions. (a) Daytime; (b) Nighttime.
Buildings 15 03407 g008
Figure 9. The strain data were measured using the optimized MISS method and the LVDT.
Buildings 15 03407 g009
Figure 10. Chessboard pattern micro-image and corner point detection results.
Buildings 15 03407 g010
Figure 11. Distribution of pixel counts between inner corners in micro-images of chessboard patterns with varying pixel resolutions.
Buildings 15 03407 g011
Table 1. Parameters involved in the ASLS algorithm.
ParaIllustrationValue
ξrdRadial distance tolerance10
αNormal tolerance
TniRatio of support edge pixels on a circle0.5
TacAngle of circular completeness165°
Table 2. Smartphone information and micro-image parameters.
DeviceManufacturer Name, City, and Country Main Camera Resolution
(Megapixels)
TypeFrame Rate
(Fps)
Pixel CountNumber of Images
HONOR 7XHonor Device Co., Ltd. Shenzhen, China8Video 1301920 × 12801834
HUAWEI P30proHuawei Technologies Co., Ltd. Shenzhen, China10Video 2601920 × 12803798
HUAWEI nova 13Huawei Technologies Co., Ltd. Shenzhen, China13Video 3301920 × 12801871
Redmi Note 11Xiaomi Corporation. Beijing, China16Video 4301920 × 12801975
Table 3. Computational results of circular feature detection using CCL and ASLS algorithm.
TypeCircle Detection AlgorithmNumber of ImagesCircle Diameter (Mean, in Pixels)Detection Error (Diameter)Computational Time (s)
Video 1CCL1834426.18030.27%105
ASLS1834427.3447898
Video 2CCL3798556.91130.23%249
ASLS3798555.62671698
Video 3CCL1871553.84490.94%102
ASLS1871548.6437726
Video 4CCL1975794.23640.58%110
ASLS1975789.6595783
Table 4. Comparison of detection accuracy and computational time using the CCL and ASLS algorithms when the MISS method detects circular features in the first image only.
TypeCircle Detection AlgorithmCircle Diameter (The First Image, in Pixels)Circle Diameter (Mean, in Pixels)Detection Error (Diameter)Computational Time (s)
Video 1CCL426.0778426.18030.024%123
ASLS427.0857427.34470.061%102
Video 2CCL555.7184556.91130.21%524
ASLS555.9828555.62670.064%589
Video 3CCL554.3392553.84490.089%134
ASLS548.8398548.64370.036%147
Video 4CCL790.7721794.23640.44%138
ASLS786.2929789.65950.43%154
Table 5. Peak errors of measurement results using the optimized MISS method and the LVDT.
Experiment No.Peak Value of LVDT (με)Peak Value of Smartphone (με)Error (με)
1336.3341.95.6
2336.2341.65.4
3335.1342.17.0
4335.5341.86.3
5325.4322.2−3.2
Table 6. Pixel counts between corner points and their variations across different micro-images.
Image PixelsPixel Count Between Corner Points (Maximum)Pixel Count Between Corner Points (Minimum)Pixel Count Between Corner Points (Average)Errors (Absolute)
8 MP185.7746178.2364182.15274.12%
10 MP220.7116208.5724214.46235.66%
13 MP244.3574237.4262242.50942.86%
16 MP262.4204252.4495257.27983.88%
1920 × 1280109.1786105.4875107.58913.43%
Disclaimer/Publisher’s Note: The statements, opinions and data contained in all publications are solely those of the individual author(s) and contributor(s) and not of MDPI and/or the editor(s). MDPI and/or the editor(s) disclaim responsibility for any injury to people or property resulting from any ideas, methods, instructions or products referred to in the content.