Article

Study on the Ultimate Bearing Capacity Performance of Composite Stiffened Tubular Joints

1
College of Human Settlements and Civil Engineering, Xi’an Jiao Tong University, Xi’an 710049, China
2
China Power Engineering Consulting Group, Northwest Electric Power Design Institute Co., Ltd., Xi’an 710075, China
*
Author to whom correspondence should be addressed.
Buildings 2025, 15(18), 3397; https://doi.org/10.3390/buildings15183397
Submission received: 22 August 2025 / Revised: 15 September 2025 / Accepted: 17 September 2025 / Published: 19 September 2025
(This article belongs to the Section Building Structures)

Abstract

TY-type intersecting joints are widely used in ultra-high voltage long-span transmission towers. To improve the ultimate bearing capacity of TY-type intersecting joints, this paper proposes a composite externally stiffened intersecting joint based on the TY-type joint, which involves setting vertical gusset plates and vertical stiffeners on the outer surface of the TY-type joint. In this paper, 3 different TY-type intersecting joints are designed, and experimental studies are carried out to explore the failure modes, load–displacement relationships, and plastic development laws of these different TY-type intersecting joints. The results show that stiffening measures can effectively enhance the ultimate bearing capacity and initial stiffness of the joints. Based on the experimental results, the correctness of the numerical simulation is verified. Taking the composite externally stiffened intersecting joint as the base model, 256 stiffened joint models are established, and numerical simulation is used to investigate the influence of different geometric parameters on the ultimate bearing capacity of the joints. The results indicate that: The use of gusset plates and stiffeners can significantly improve the ultimate bearing capacity and overall stiffness of the unstiffened joints; The failure mechanism of the composite stiffened joints is consistent with that of the unstiffened joints, both characterized by buckling in the core of the main pipe; The ultimate bearing capacity of the composite stiffened joints is positively correlated with the diameter ratio of the branch pipe to the main pipe, the thickness ratio of the external stiffening plate, the thickness ratio of the external stiffener, and the height ratio, while it is negatively correlated with the diameter–thickness ratio of the main pipe. The research results on the new-type intersecting joints in this paper can provide a design reference for their practical engineering applications in transmission towers.

1. Introduction

In recent years, with the construction of ultra-high voltage (UHV) transmission projects, transmission lines have been facing increasing challenges from complex terrains [1], which puts forward higher requirements for the stability and load-bearing performance of transmission tower structures [2,3]. As a key stress-bearing component, intersecting welded joints are widely used in long-span transmission towers due to their superior mechanical properties. However, there is relatively little research on the stress mechanism and ultimate bearing capacity of intersecting welded joints under complex working conditions, which restricts structural optimization and safety assessment [4].
Against the engineering background of the Long-span Transmission Tower across the Yellow River in Yan’an for the Longdong-Shandong ± 800 kV UHV DC Project—with a span of 1630 m and a tower height of 131.3 m—conventional intersecting joint forms can no longer meet the dual control requirements of design bearing capacity and deformation [5], thus necessitating the use of combined and reinforced spatial joints. Therefore, its spatial joint was simplified, and a high-bearing-capacity TY combined intersecting joint was designed, as shown in Figure 1.
To improve the mechanical performance of joints, existing studies have proposed various stiffening measures: Internal stiffening ribs and internal stiffening rings are installed to enhance the impact resistance and static performance of K or KK-type joints [6,7,8]; Insert plates and gusset plates are used to increase the bearing capacity of X or K-type joints, with corresponding calculation methods proposed [9]; External flange pipes, outer ring plates, and external stiffeners are adopted to constrain the intersection area between branch pipes and main pipes, thereby improving the ultimate bearing capacity and stiffness of X-type joints [10,11]; Research has been conducted on hot spot stress under fiber-reinforced polymer (FRP) application or corrosion scenarios, as well as on reinforcement and repair technologies [12,13,14]. In addition, new approaches such as “partial filling/grouting” have emerged in recent years. These methods improve the ultimate bearing capacity and fatigue performance of joints by enhancing the local circumferential stiffness and thickness effect of the main pipe [15,16]. Meanwhile, interpretable modeling and machine learning techniques tailored to complex geometric and parameter spaces have also been applied to predict the bearing capacity of X-type joints and explore parameter sensitivity [17]. In summary, most existing studies have focused on the efficiency-enhancing mechanisms of single measures such as “outer ring plates or flanges”, “external stiffening ribs”, or “gusset plates”. However, systematic research is still lacking regarding transmission tower TY combined joints, as well as the integrated design of composite external stiffening (external gusset plates and vertical stiffening ribs), their failure mechanisms, and unified bearing capacity models.
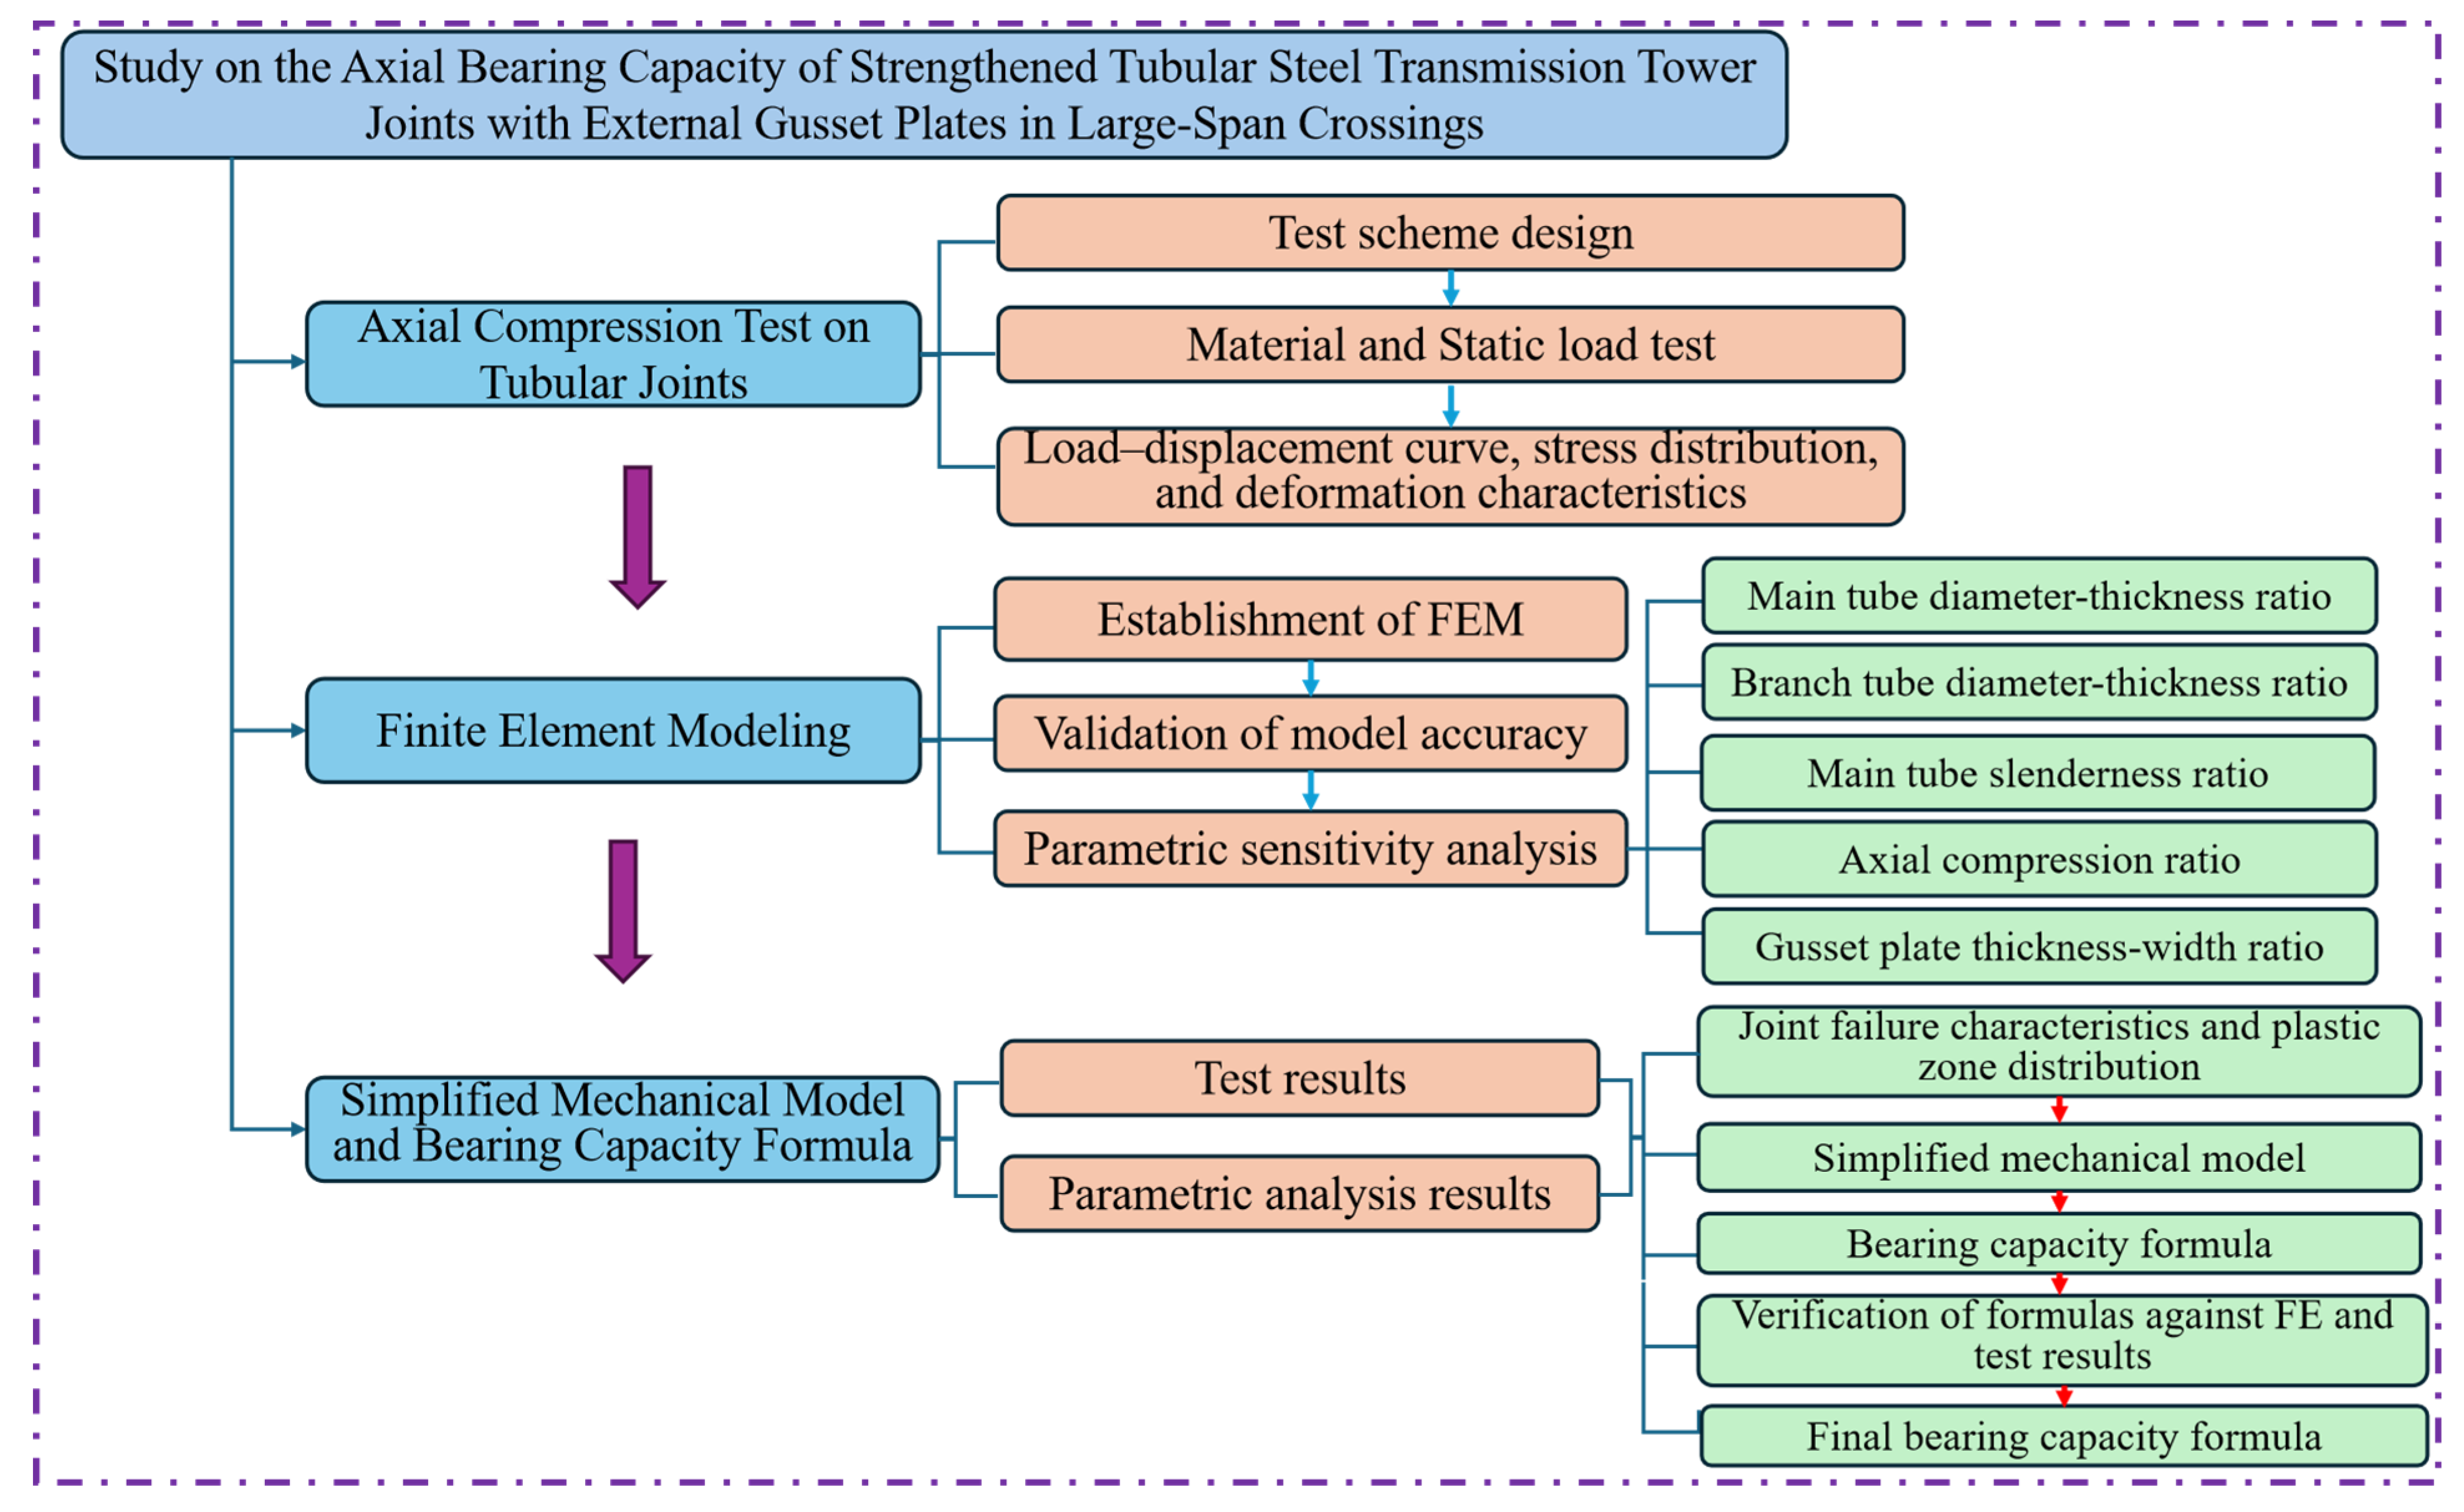
To improve the ultimate bearing capacity of intersecting joints, this paper proposes a composite externally stiffened intersecting joint, which involves installing vertical gusset plates and vertical stiffening ribs on the outer surface of the TY-type joint. To investigate its mechanical properties such as failure mode, plastic development, and ultimate bearing capacity, this study conducts relevant experiments and numerical simulations to explore the influence laws of parameters of externally stiffened gusset plates, stiffening ribs, and steel pipes on joint bearing capacity, and proposes a calculation formula for joint bearing capacity. The technical route of this study is shown in Figure 2.

2. Experimental Program

2.1. Test Units

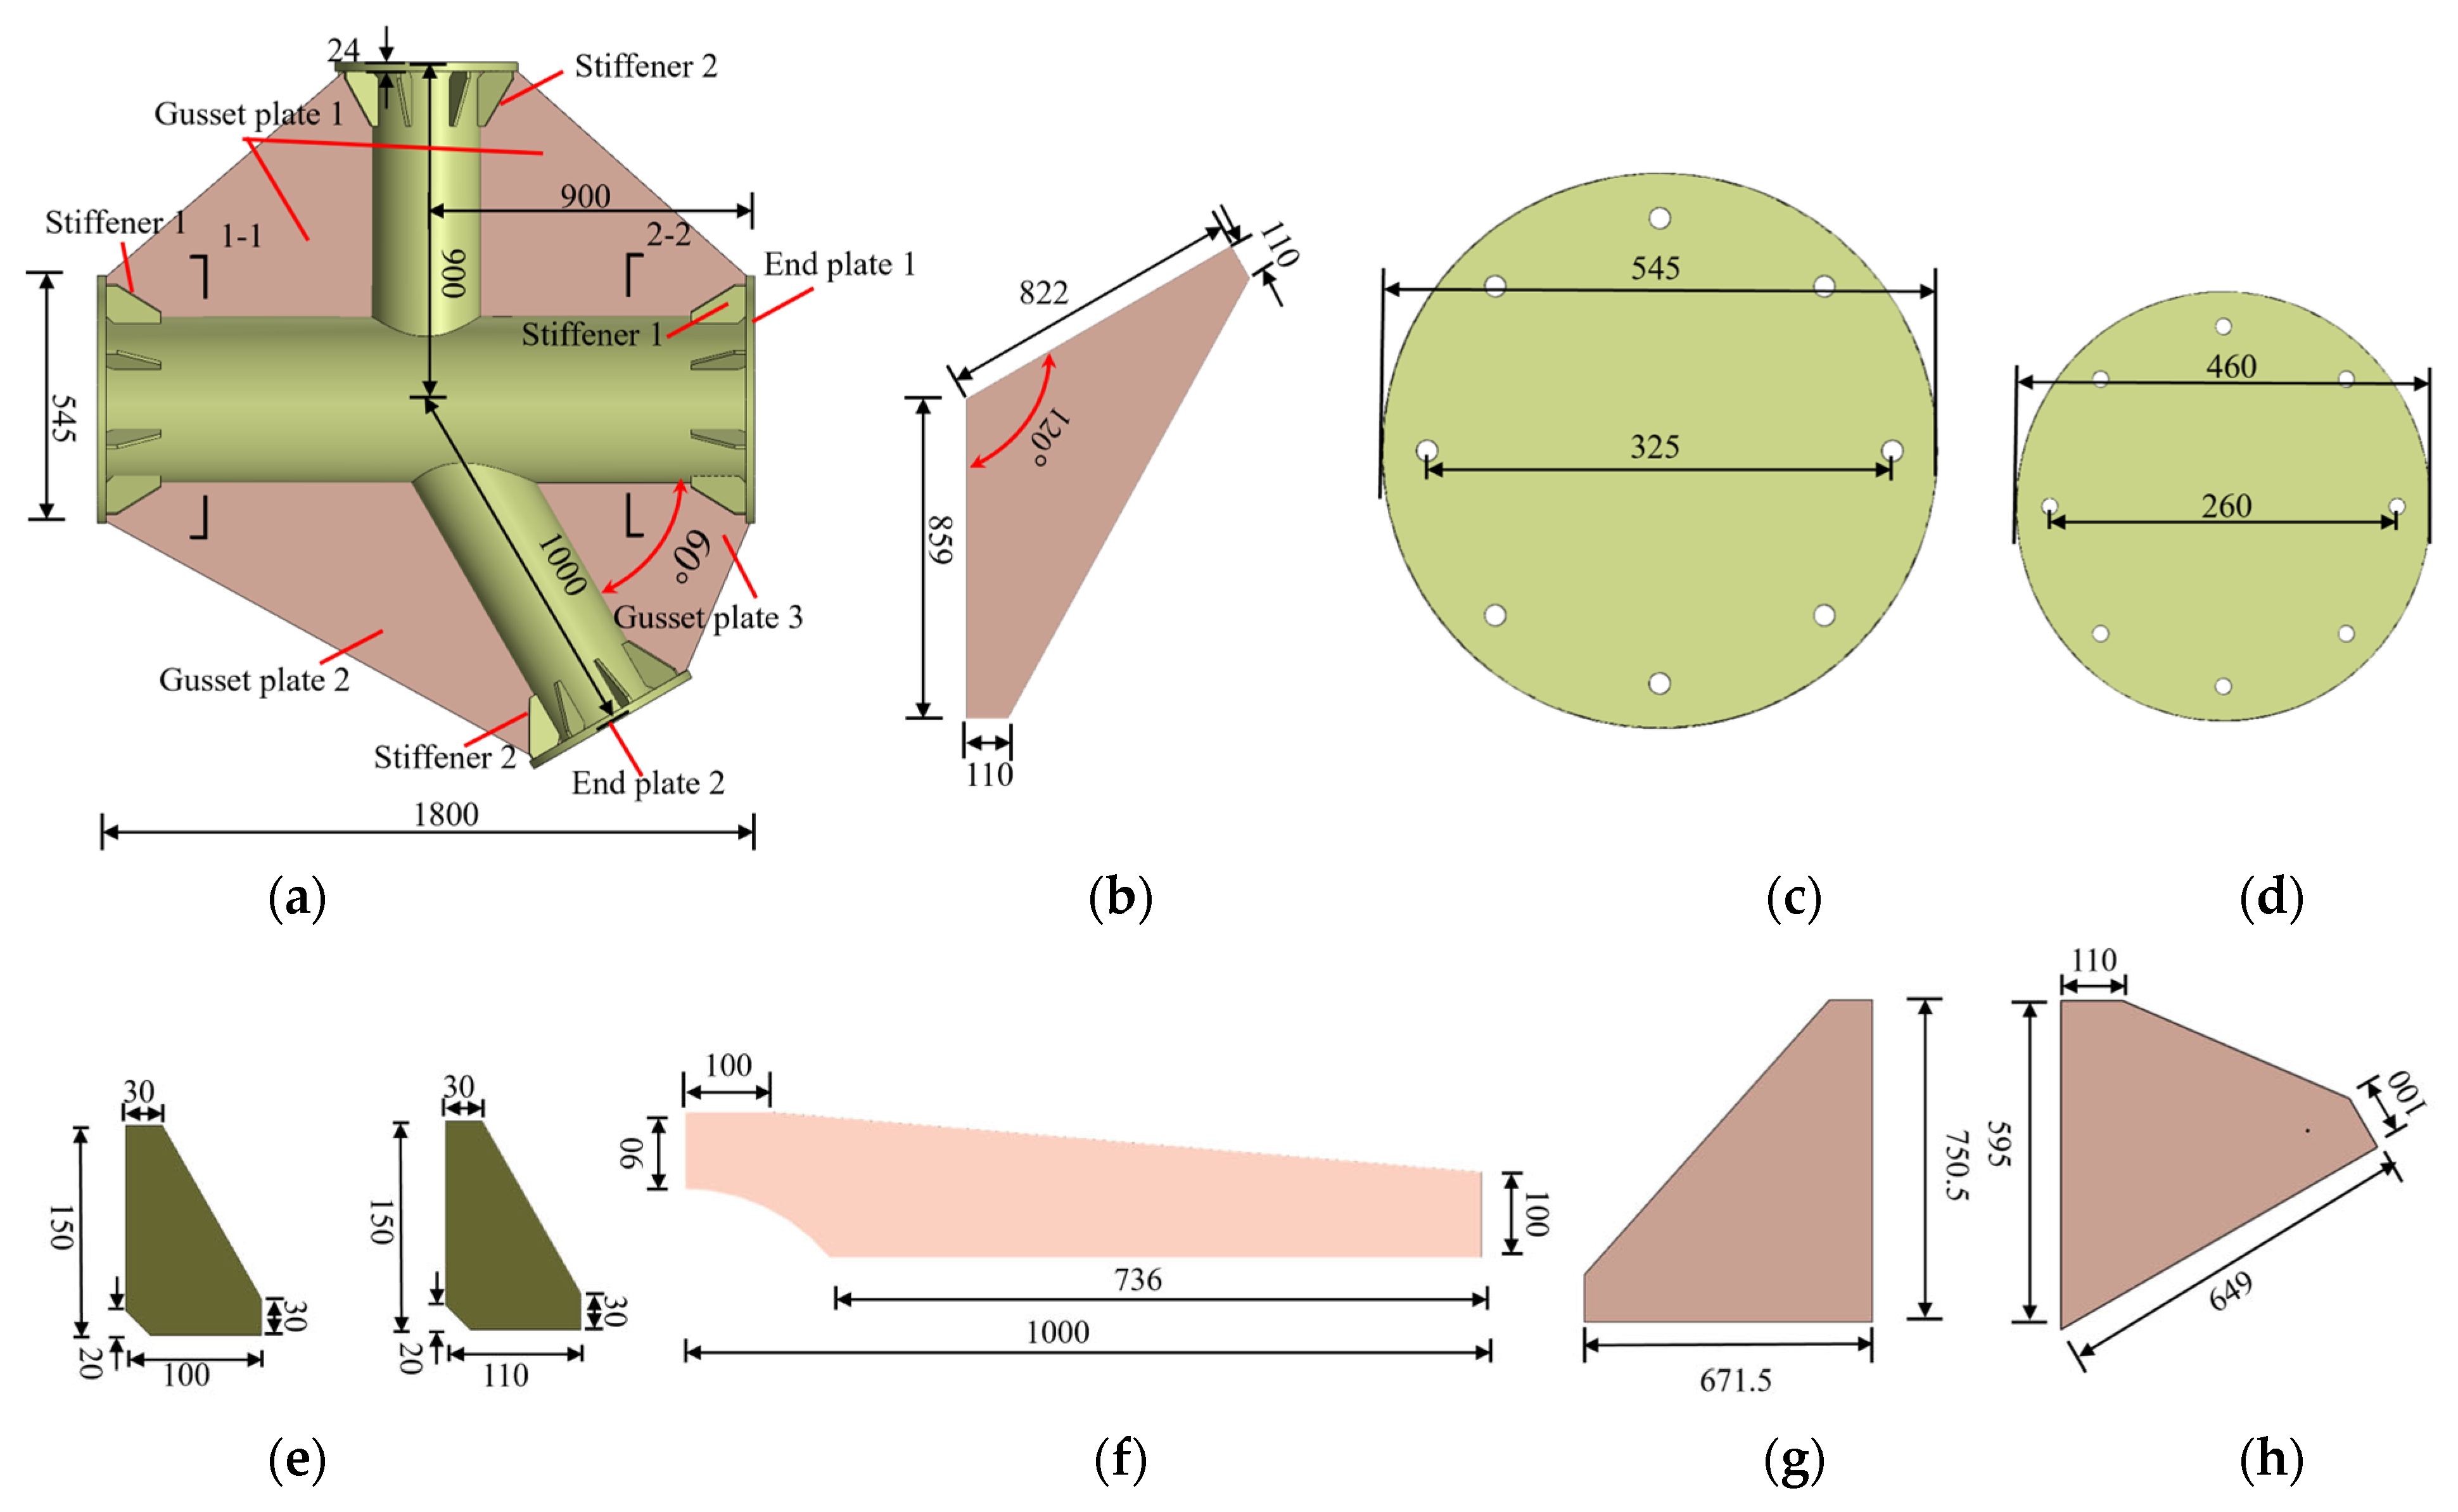
To investigate the mechanical performance of TY-type tubular joints with external stiffening ribs, this paper designs three types of specimens, namely unstiffened tubular joints, gusset-plate-stiffened tubular joints, and composite externally stiffened tubular joints. The schematic diagram of the specimens is shown in Figure 3, where ts represents the thickness of the stiffening rib, hs denotes the height of the stiffening rib, and tp stands for the thickness of the gusset plate. Each specimen has an overall length L0 of 1800 mm, with the branch pipe lengths being L1 = 900 mm and L2 = 1000 mm. The intersection of the main pipe and branch pipes is connected using groove welding with Grade I welds; the stiffening parts are welded to the joint using butt fillet welds. The specimen numbers and structural parameters are listed in Table 1, where D is the outer diameter of the main pipe, t is the thickness of the main pipe, d is diameter of branch pipe, t1 is the thickness of the branch pipe, tp is the thickness of the gusset plate, and ts is the thickness of the stiffening rib.

2.2. Material Property Test

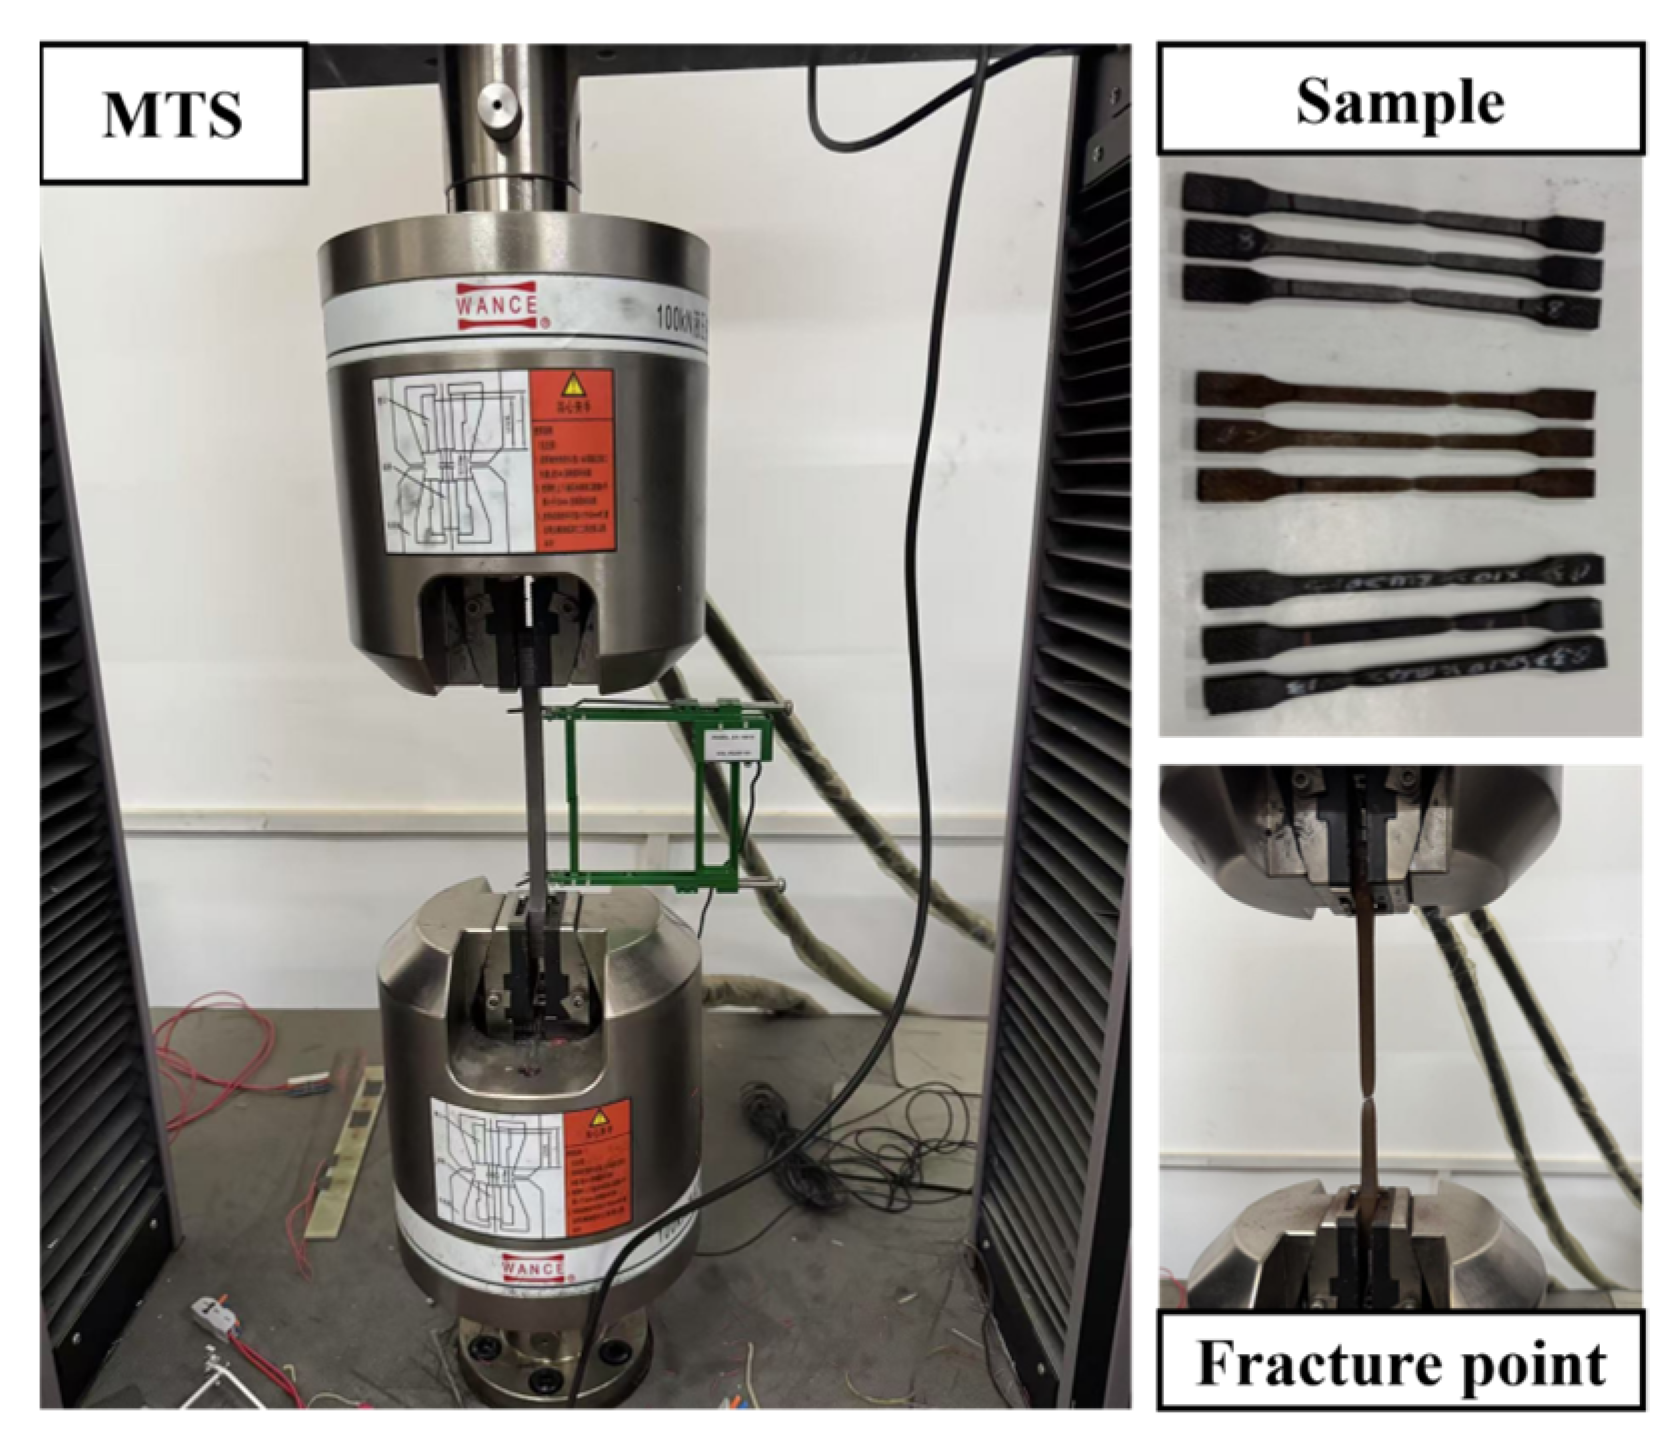
The steel used for the main pipe and branch pipe of the specimen is Q420, while the steel for the stiffening parts is Q355. To accurately obtain the mechanical properties of the specimen material, standard tensile specimens for three parts (main pipe, branch pipe, and external stiffener) were fabricated using steel from the same batch as the joint specimens. The fabrication and loading of the standard specimens comply with the requirements specified in Metallic materials—Tensile testing [18]. Three standard specimens were made for each type of material, as shown in Figure 4, and the mechanical properties of steels with different specifications are listed in Table 2. The thickness of these standard specimens is consistent with that of the joint specimens, ensuring the reliability of the test data.

2.3. Loading Device and Loading Scheme

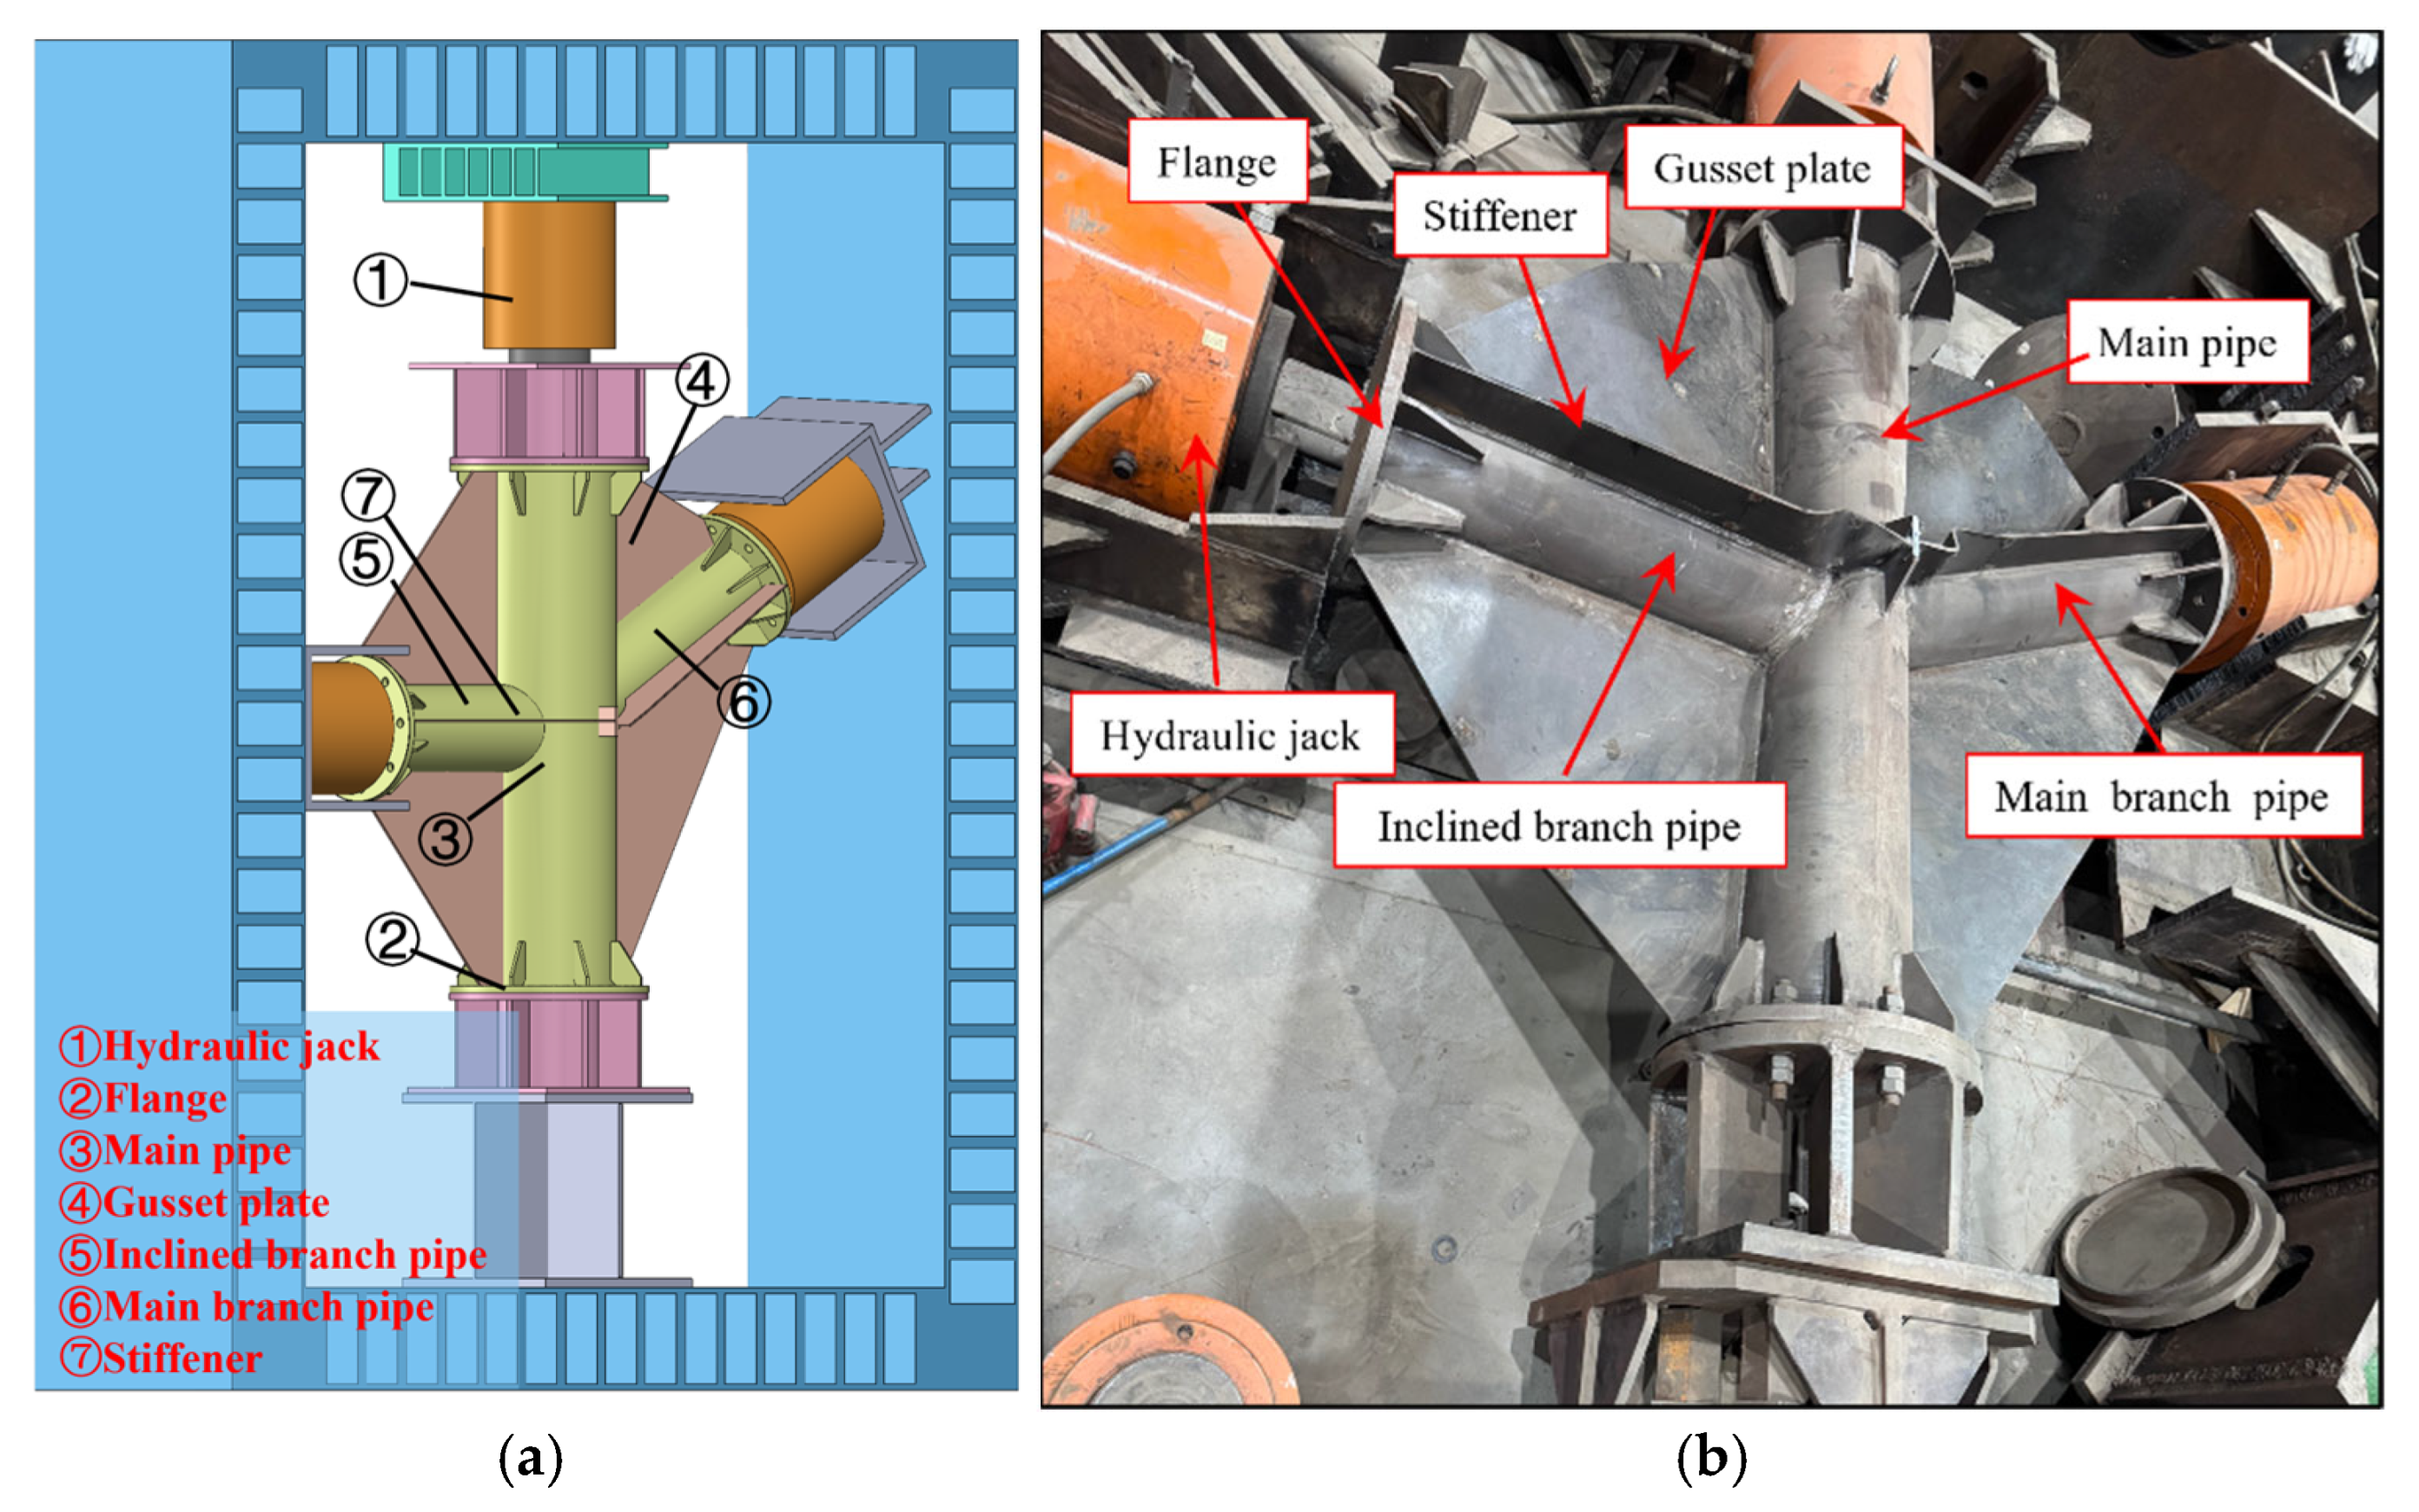
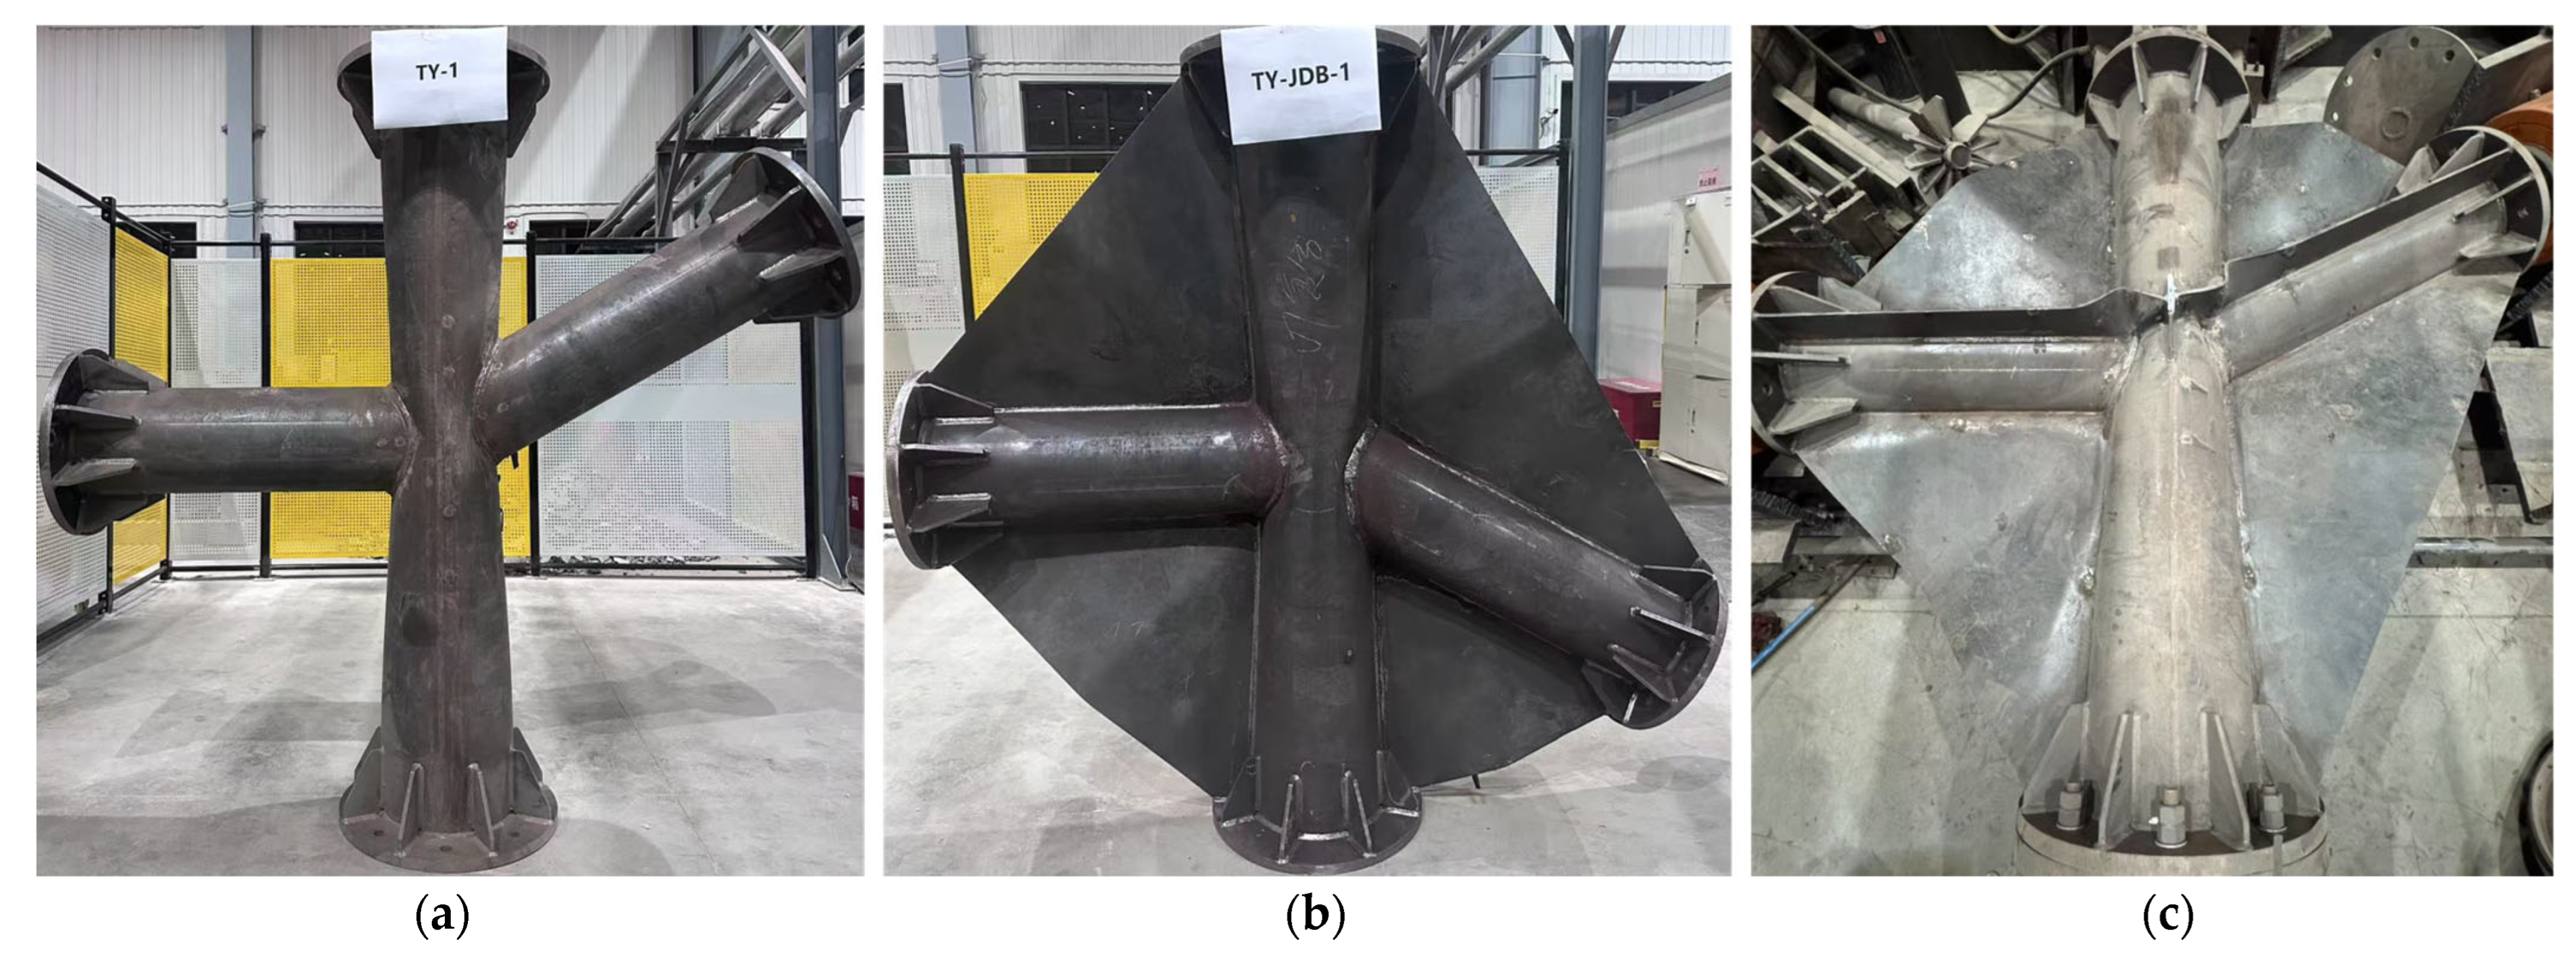
The test was conducted in the Structural Laboratory of Xi’an Jiaotong University. A self-designed self-balanced reaction frame was adopted in this test to simulate the real stress state of the joint in the transmission tower, with the loading device shown in Figure 5. The physical pictures of the three specimens are shown in Figure 6. The left end of the main pipe was fixed to the reaction frame via a flange base and bolts, while three hydraulic servo jacks were placed at the right end of the main pipe and along the directions of the two branch pipes respectively to provide axial loading forces.
During the test loading, 10% of the design load was preapplied to the main pipe and branch pipes to eliminate gaps between the specimens and the loading device. Meanwhile, the testing instruments were inspected to check whether the collected data results were complete. If no abnormalities were found, the formal loading was initiated. During the formal loading process, to satisfy the equilibrium condition of the radial horizontal force on the main pipe and avoid the influence of bending moment generated in the main pipe on the test results, the relationship between the vertical branch pipe load F1 and the inclined branch pipe load F2 should satisfy F1 = F2sinθ. The main pipe and branch pipes were loaded in stages simultaneously, with each loading stage maintained for 5 min to allow sufficient deformation of the specimens [19]. The loading process continued until the specimens showed significant deformation and could no longer bear the load, at which point the test was stopped.

2.4. Arrangement of Displacement Transducers and Strain Gauges

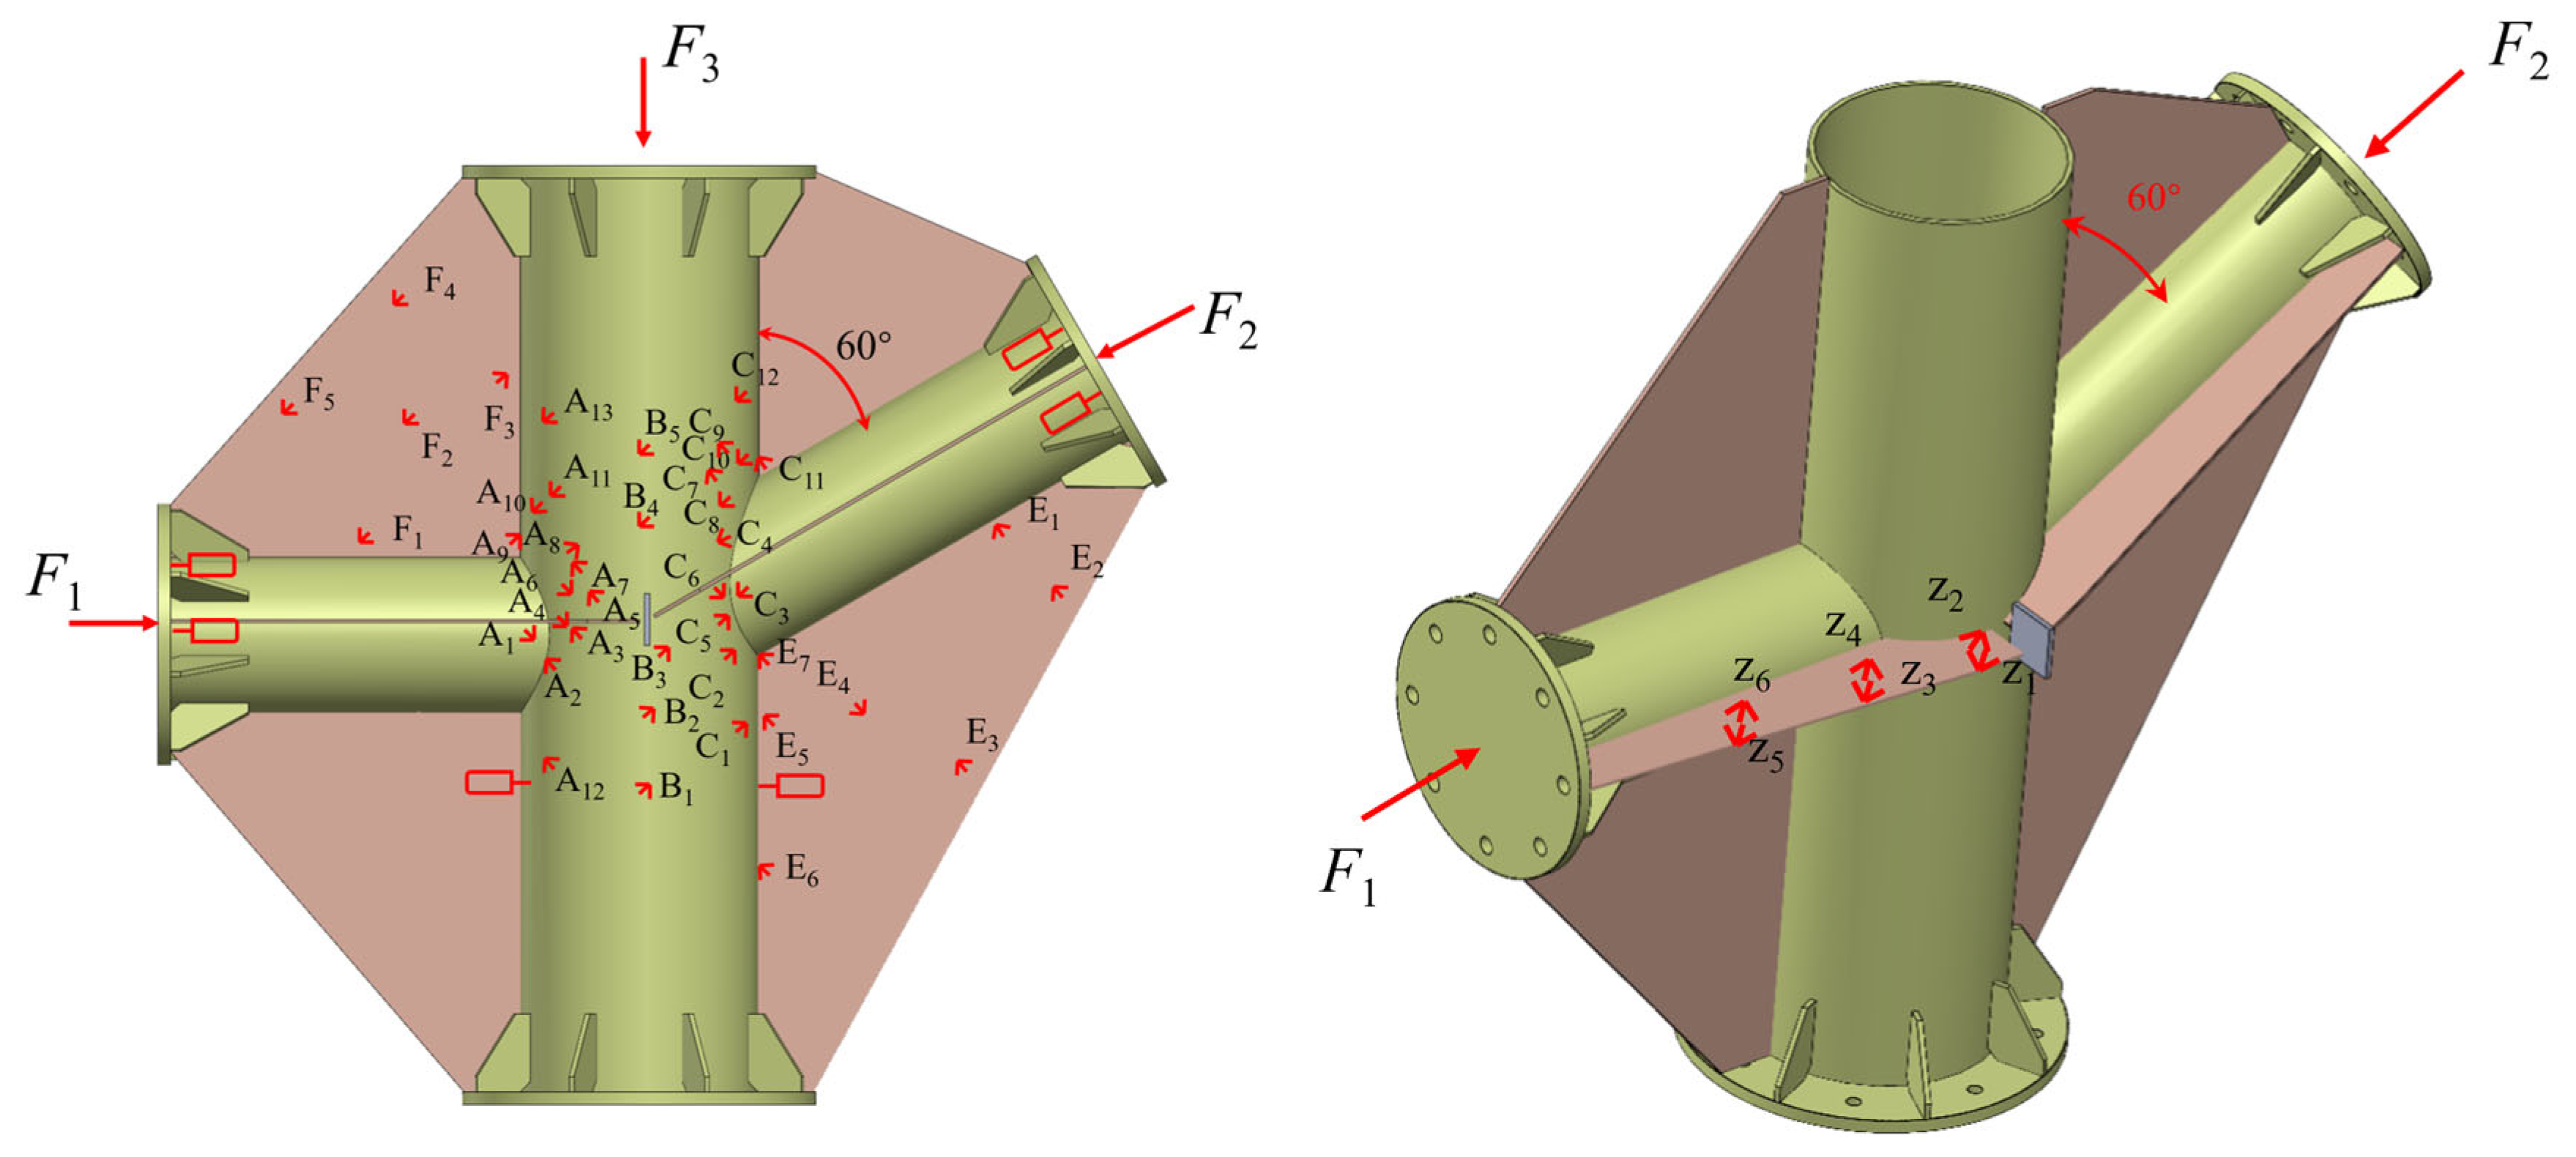
To monitor the radial deformation of the main pipe, one displacement transducer was installed at the top crown point of the main pipe and another at the opposite lower surface of the main pipe along the axis of the vertical pipe, as shown in the schematic diagram in Figure 7. The radial deformation of the main pipe was obtained by subtracting the measured values of the two displacement transducers. Triaxial strain gauges were mainly arranged near the intersection line area of the joint and on the side wall of the main pipe. In addition, for the strengthened specimens TY-JDB-1 and TY-TWO-1, strain gauges were also installed at typical positions of the gusset plates and stiffening ribs. The specific arrangement of displacement transducers and strain gauges is shown in Figure 7.

3. Test Phenomena and Failure Modes

The failure modes of each tubular joint specimen are shown in Figure 8, Figure 9 and Figure 10. The failure modes of the main pipes in the three joint specimens are basically similar, and the failure mechanism of the stiffened joints is the collaborative plastic failure of the main pipe and the gusset plate.
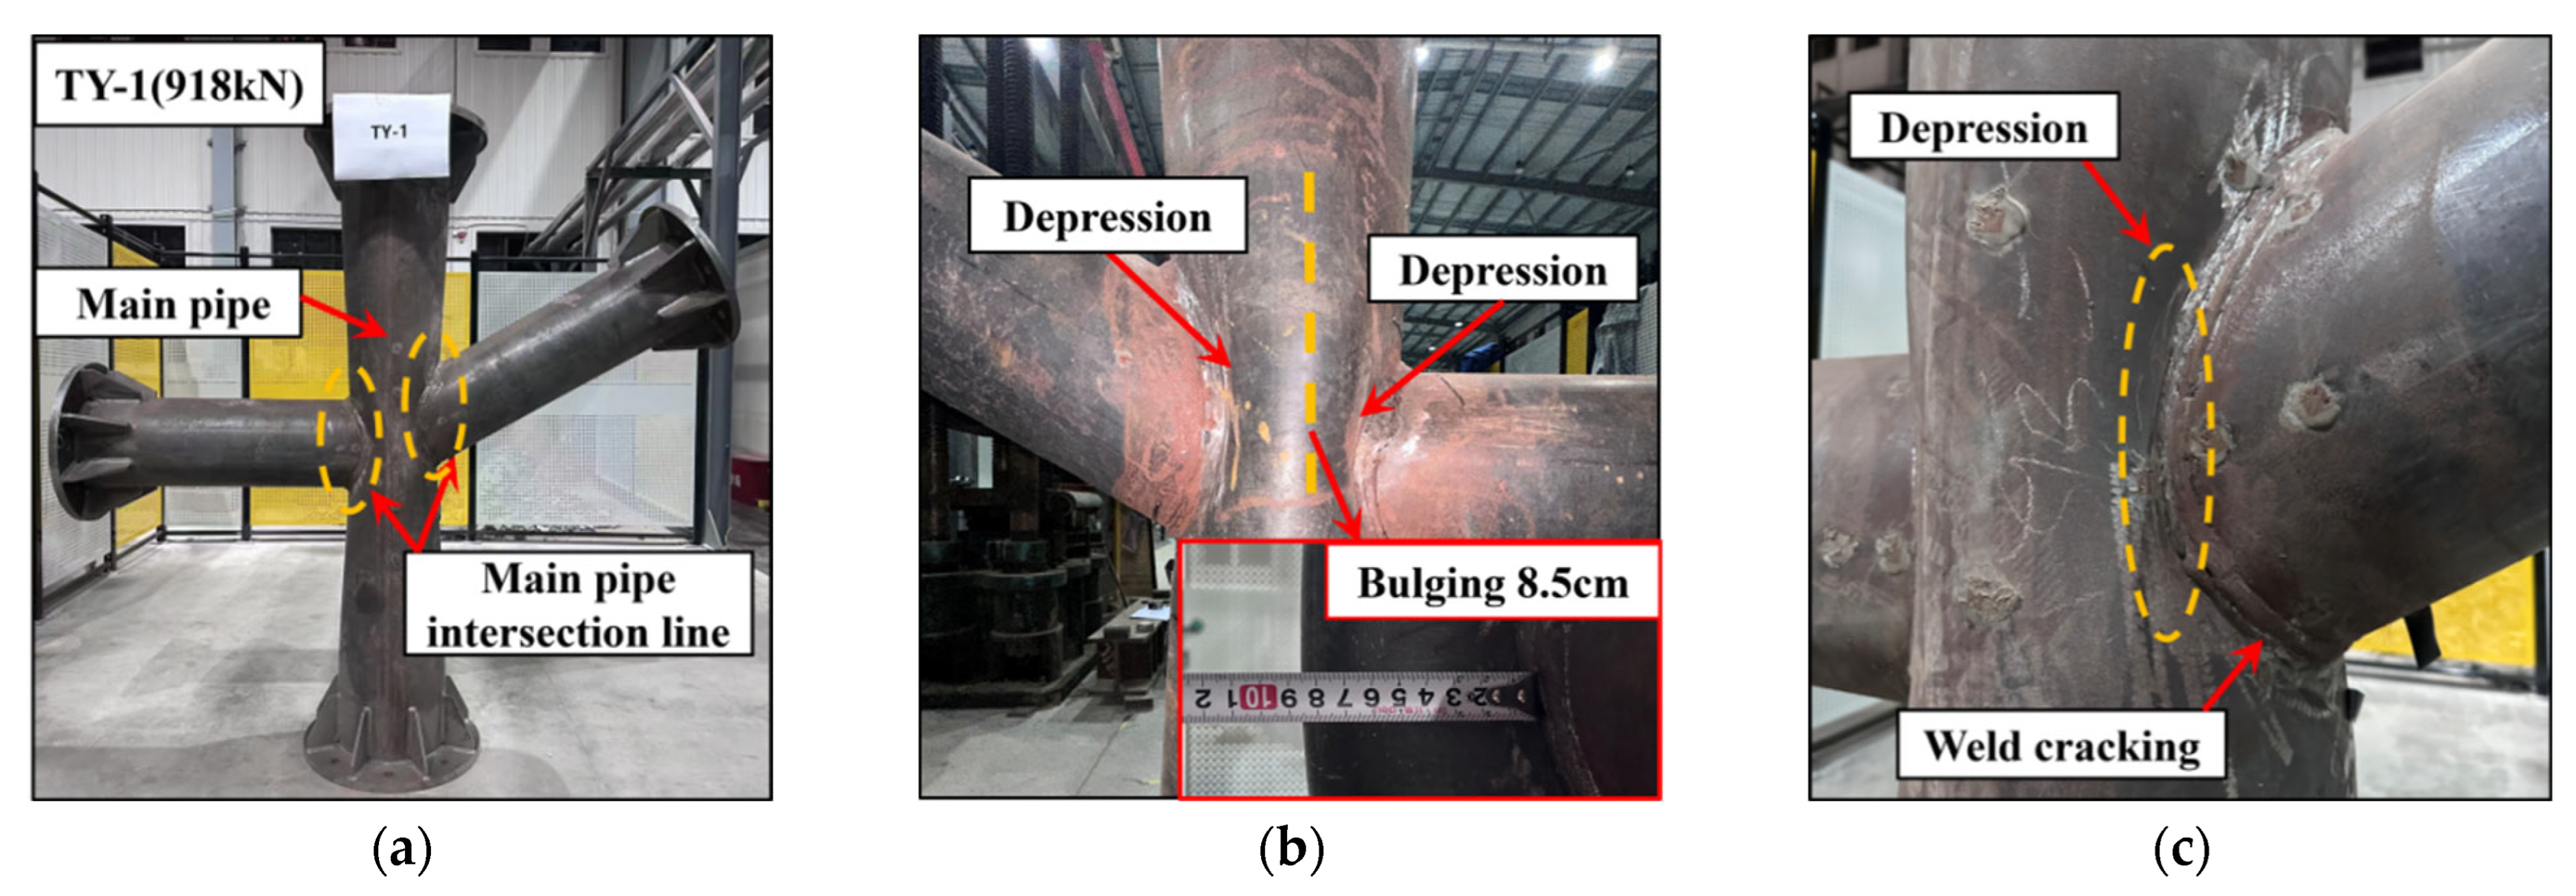
Specimen TY-1: This specimen is an unstiffened tubular joint of a pure steel beam, and its overall failure mode is shown in Figure 8a. When the specimen failed (loaded to 918 kN), obvious concave deformation occurred in the intersecting area of the main pipe in the core zone of the joint (Figure 8b). Cracks were also observed along the intersecting line, and bulging deformation appeared on the side wall of the main pipe. The distance from the intersecting line to the bulging position was 8.5 cm. Eventually, the main pipe failed due to excessive plastic deformation.
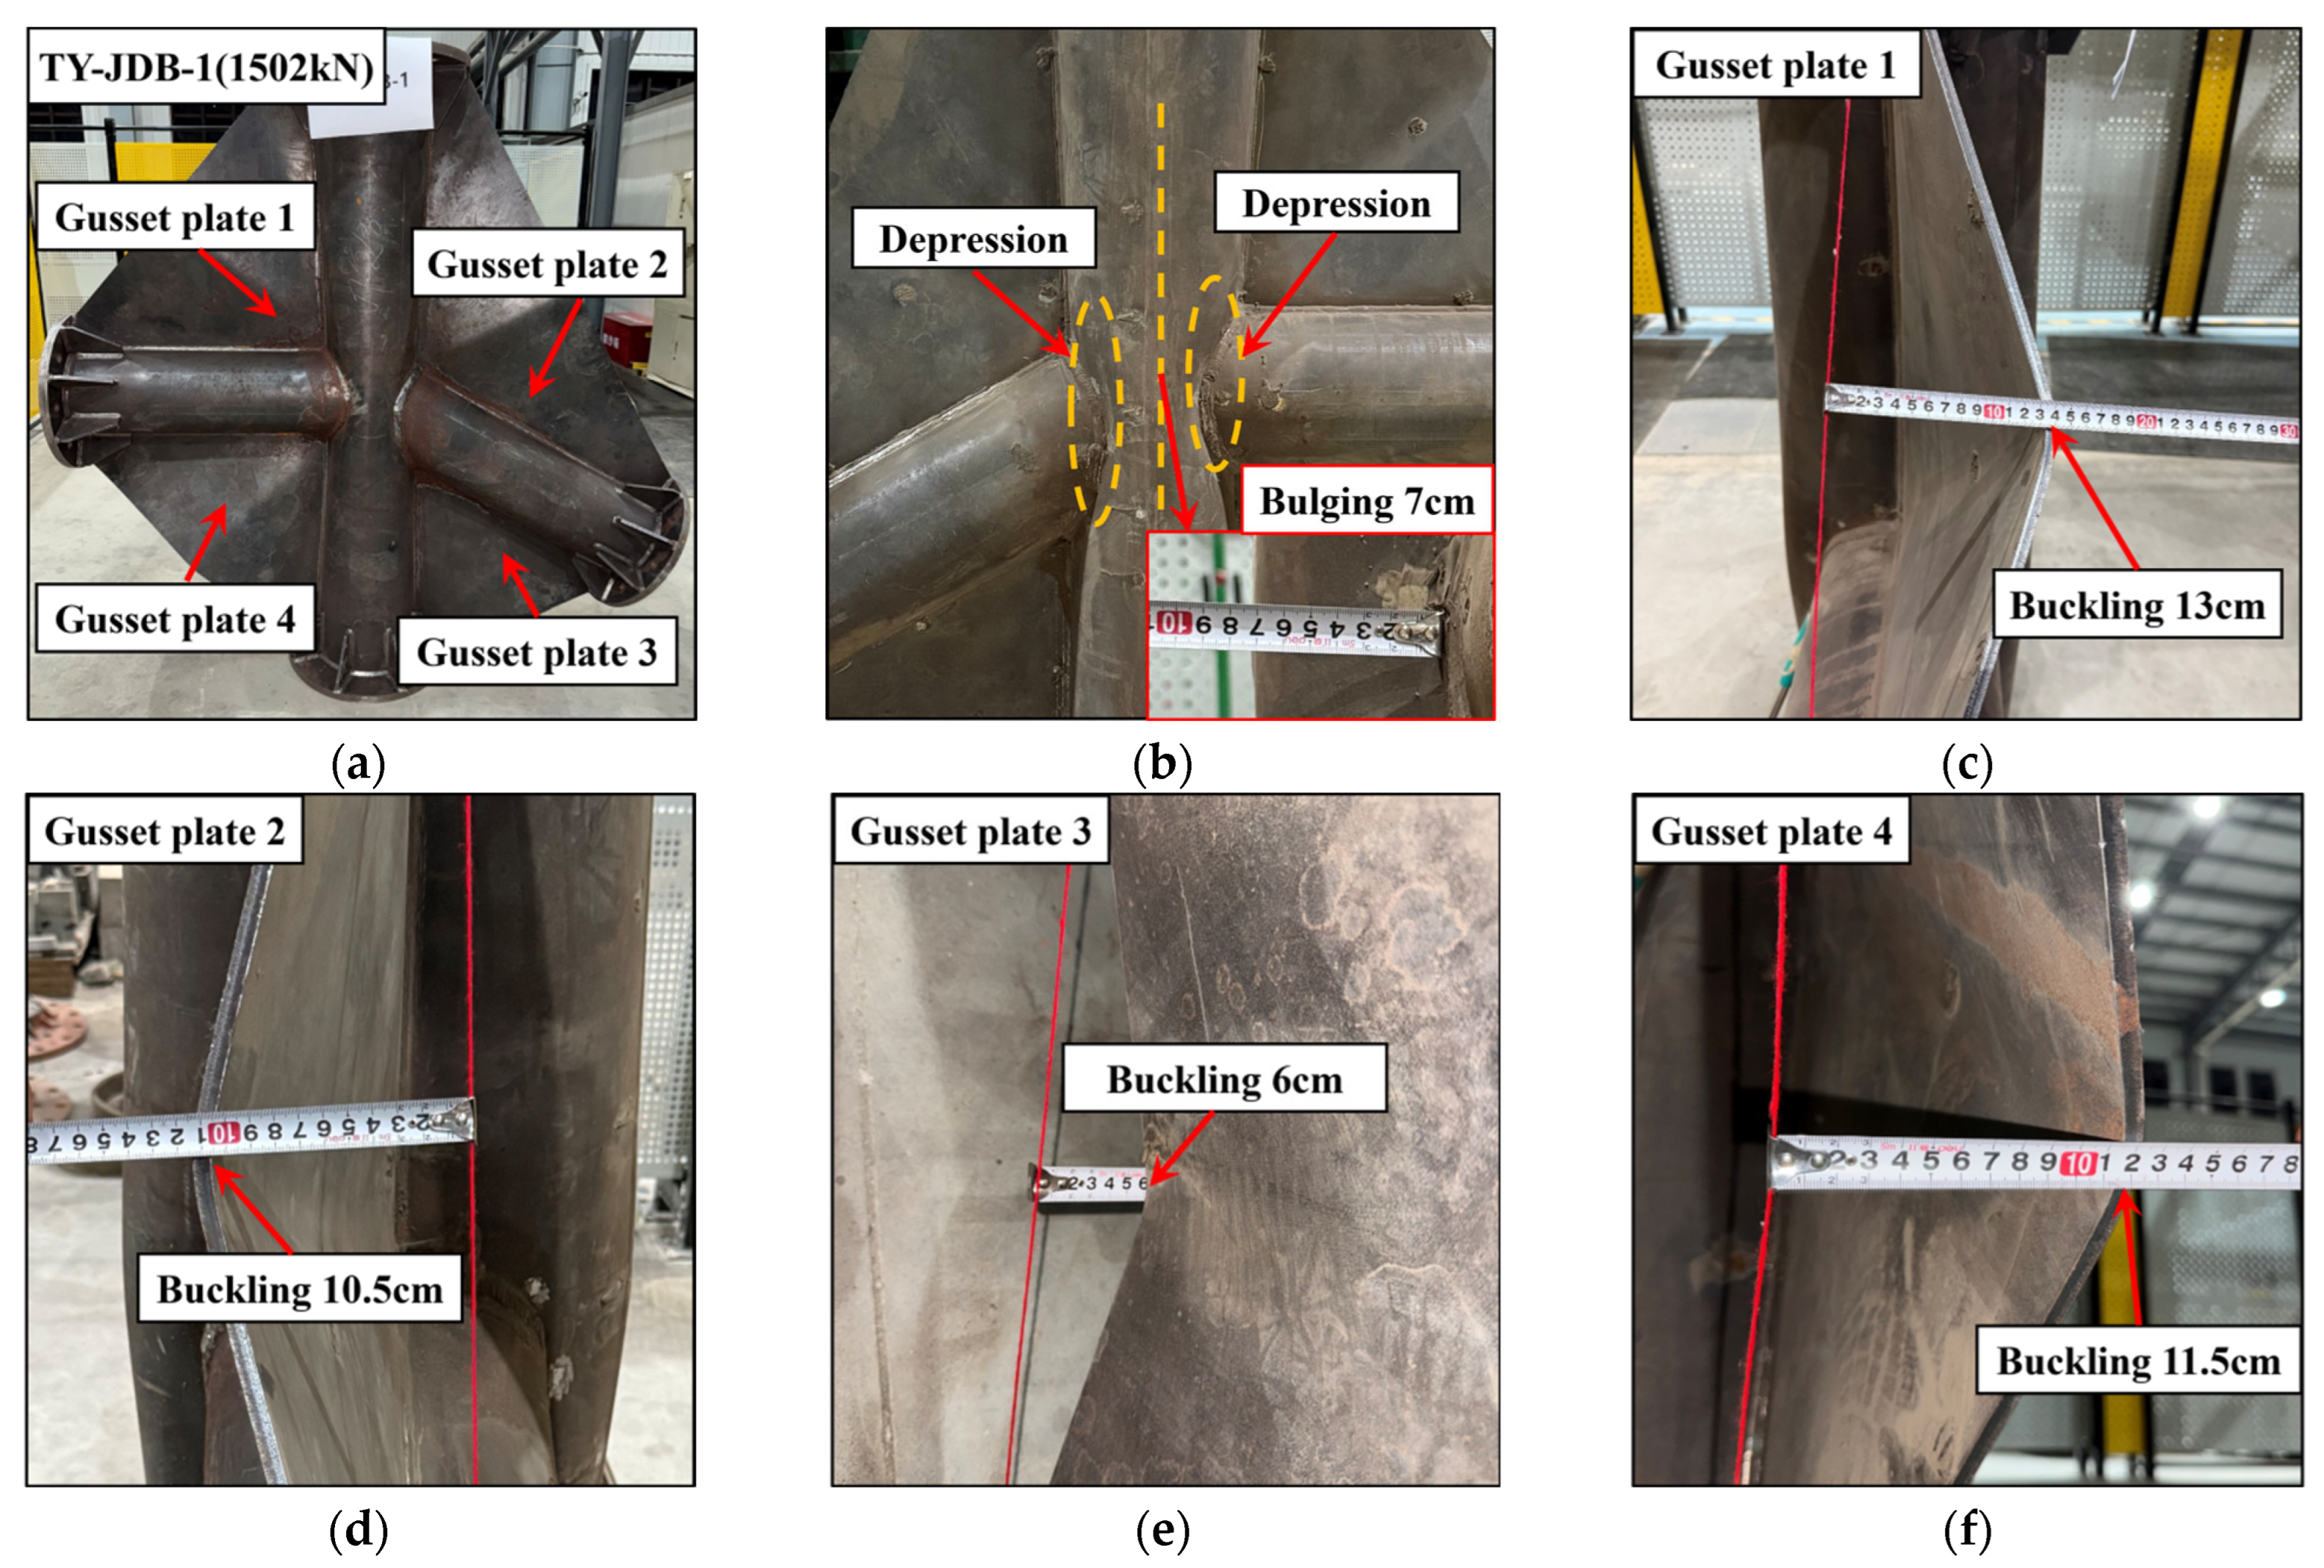
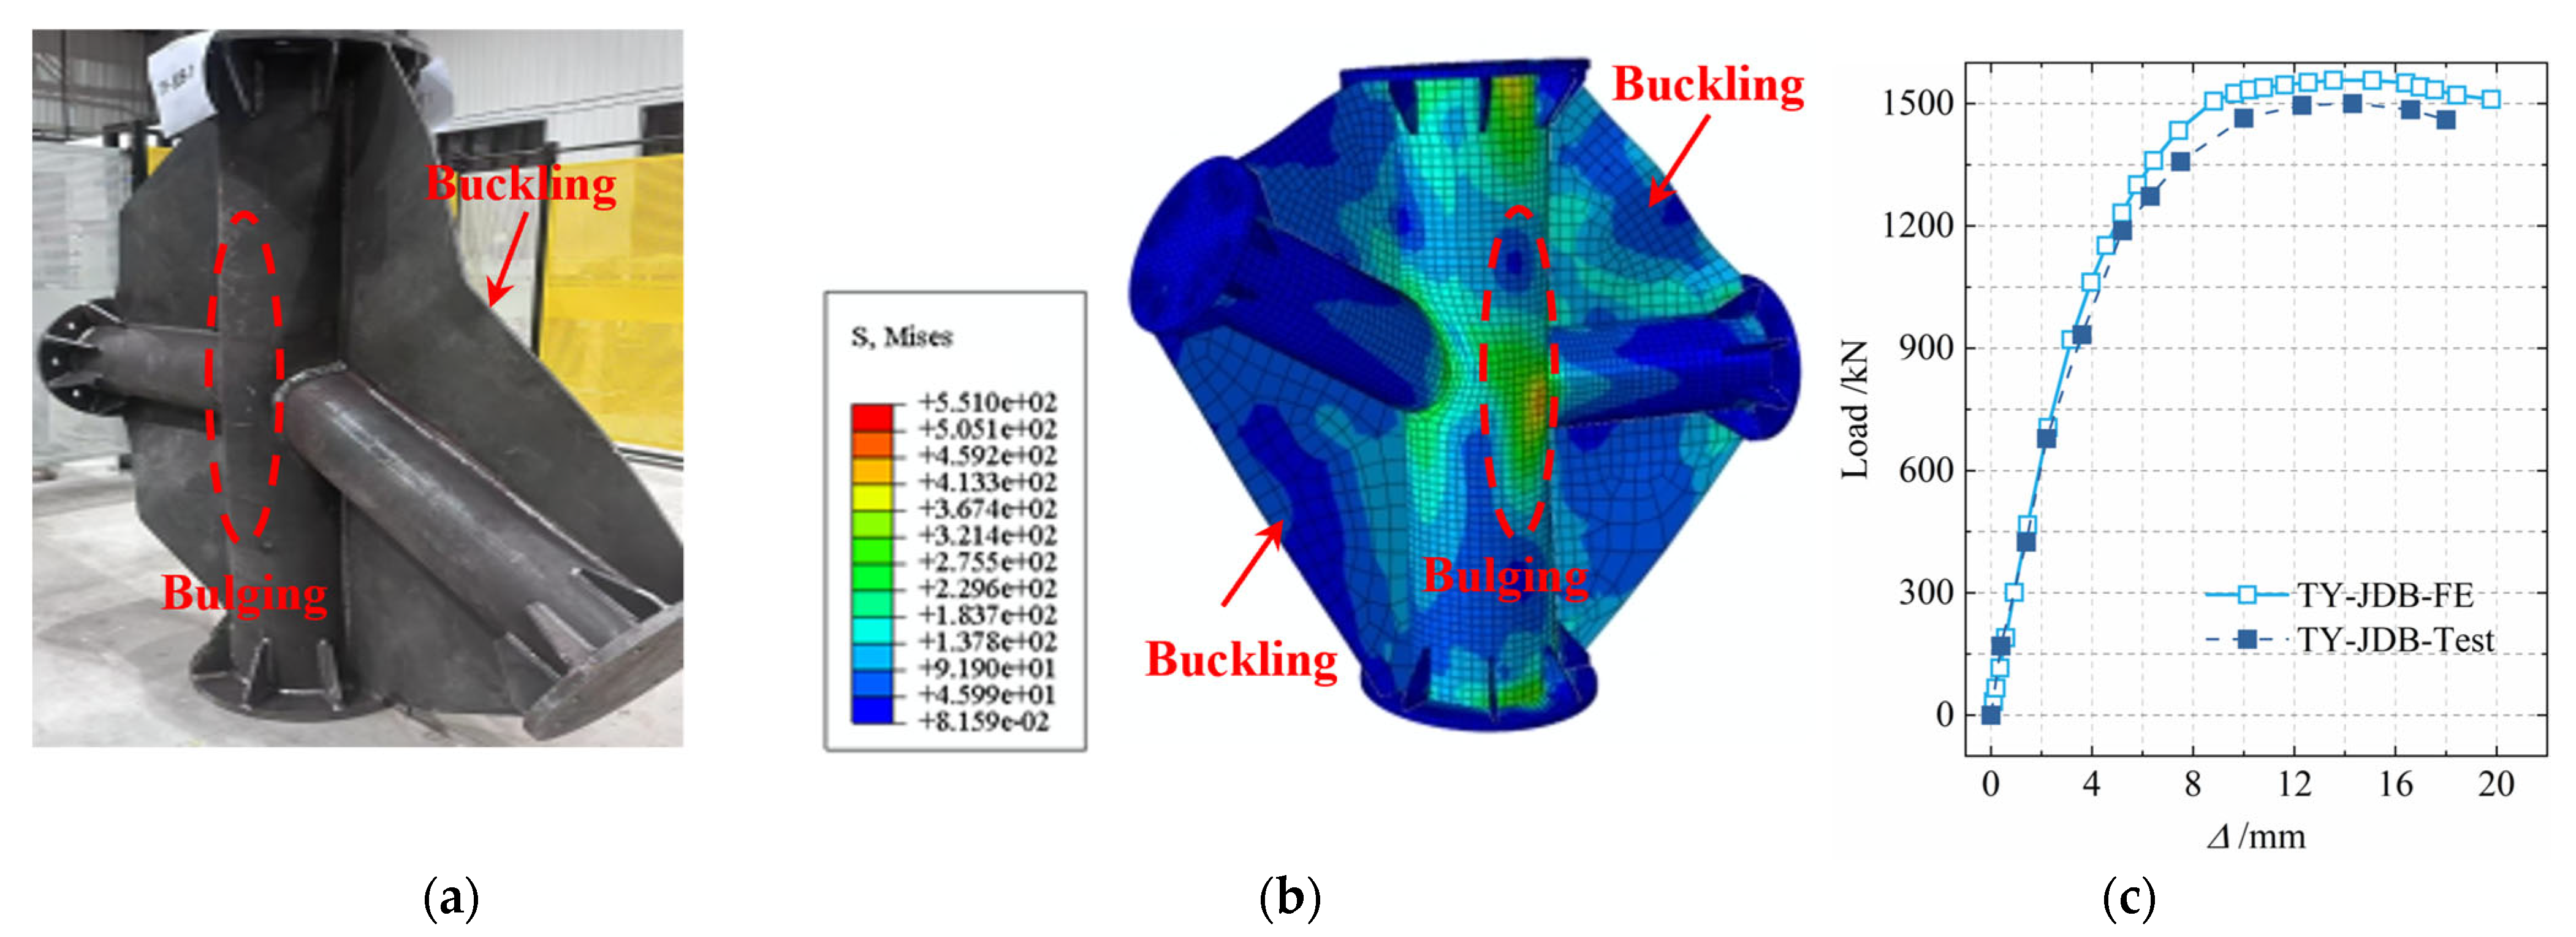
Specimen TY-JDB-1: This specimen is a tubular joint stiffened with a gusset plate, and its failure mode is shown in Figure 9. When the specimen failed (loaded to 1502 kN), obvious concave deformation occurred in the intersecting area of the main pipe, and bulging deformation appeared on the side wall of the main pipe, with the distance from the intersecting line to the bulging position being 7.0 cm. All four gusset plates exhibited buckling deformation, with the buckling deformations of the gusset plates being 13.0 cm, 10.5 cm, 6 cm, and 11.5 cm respectively.
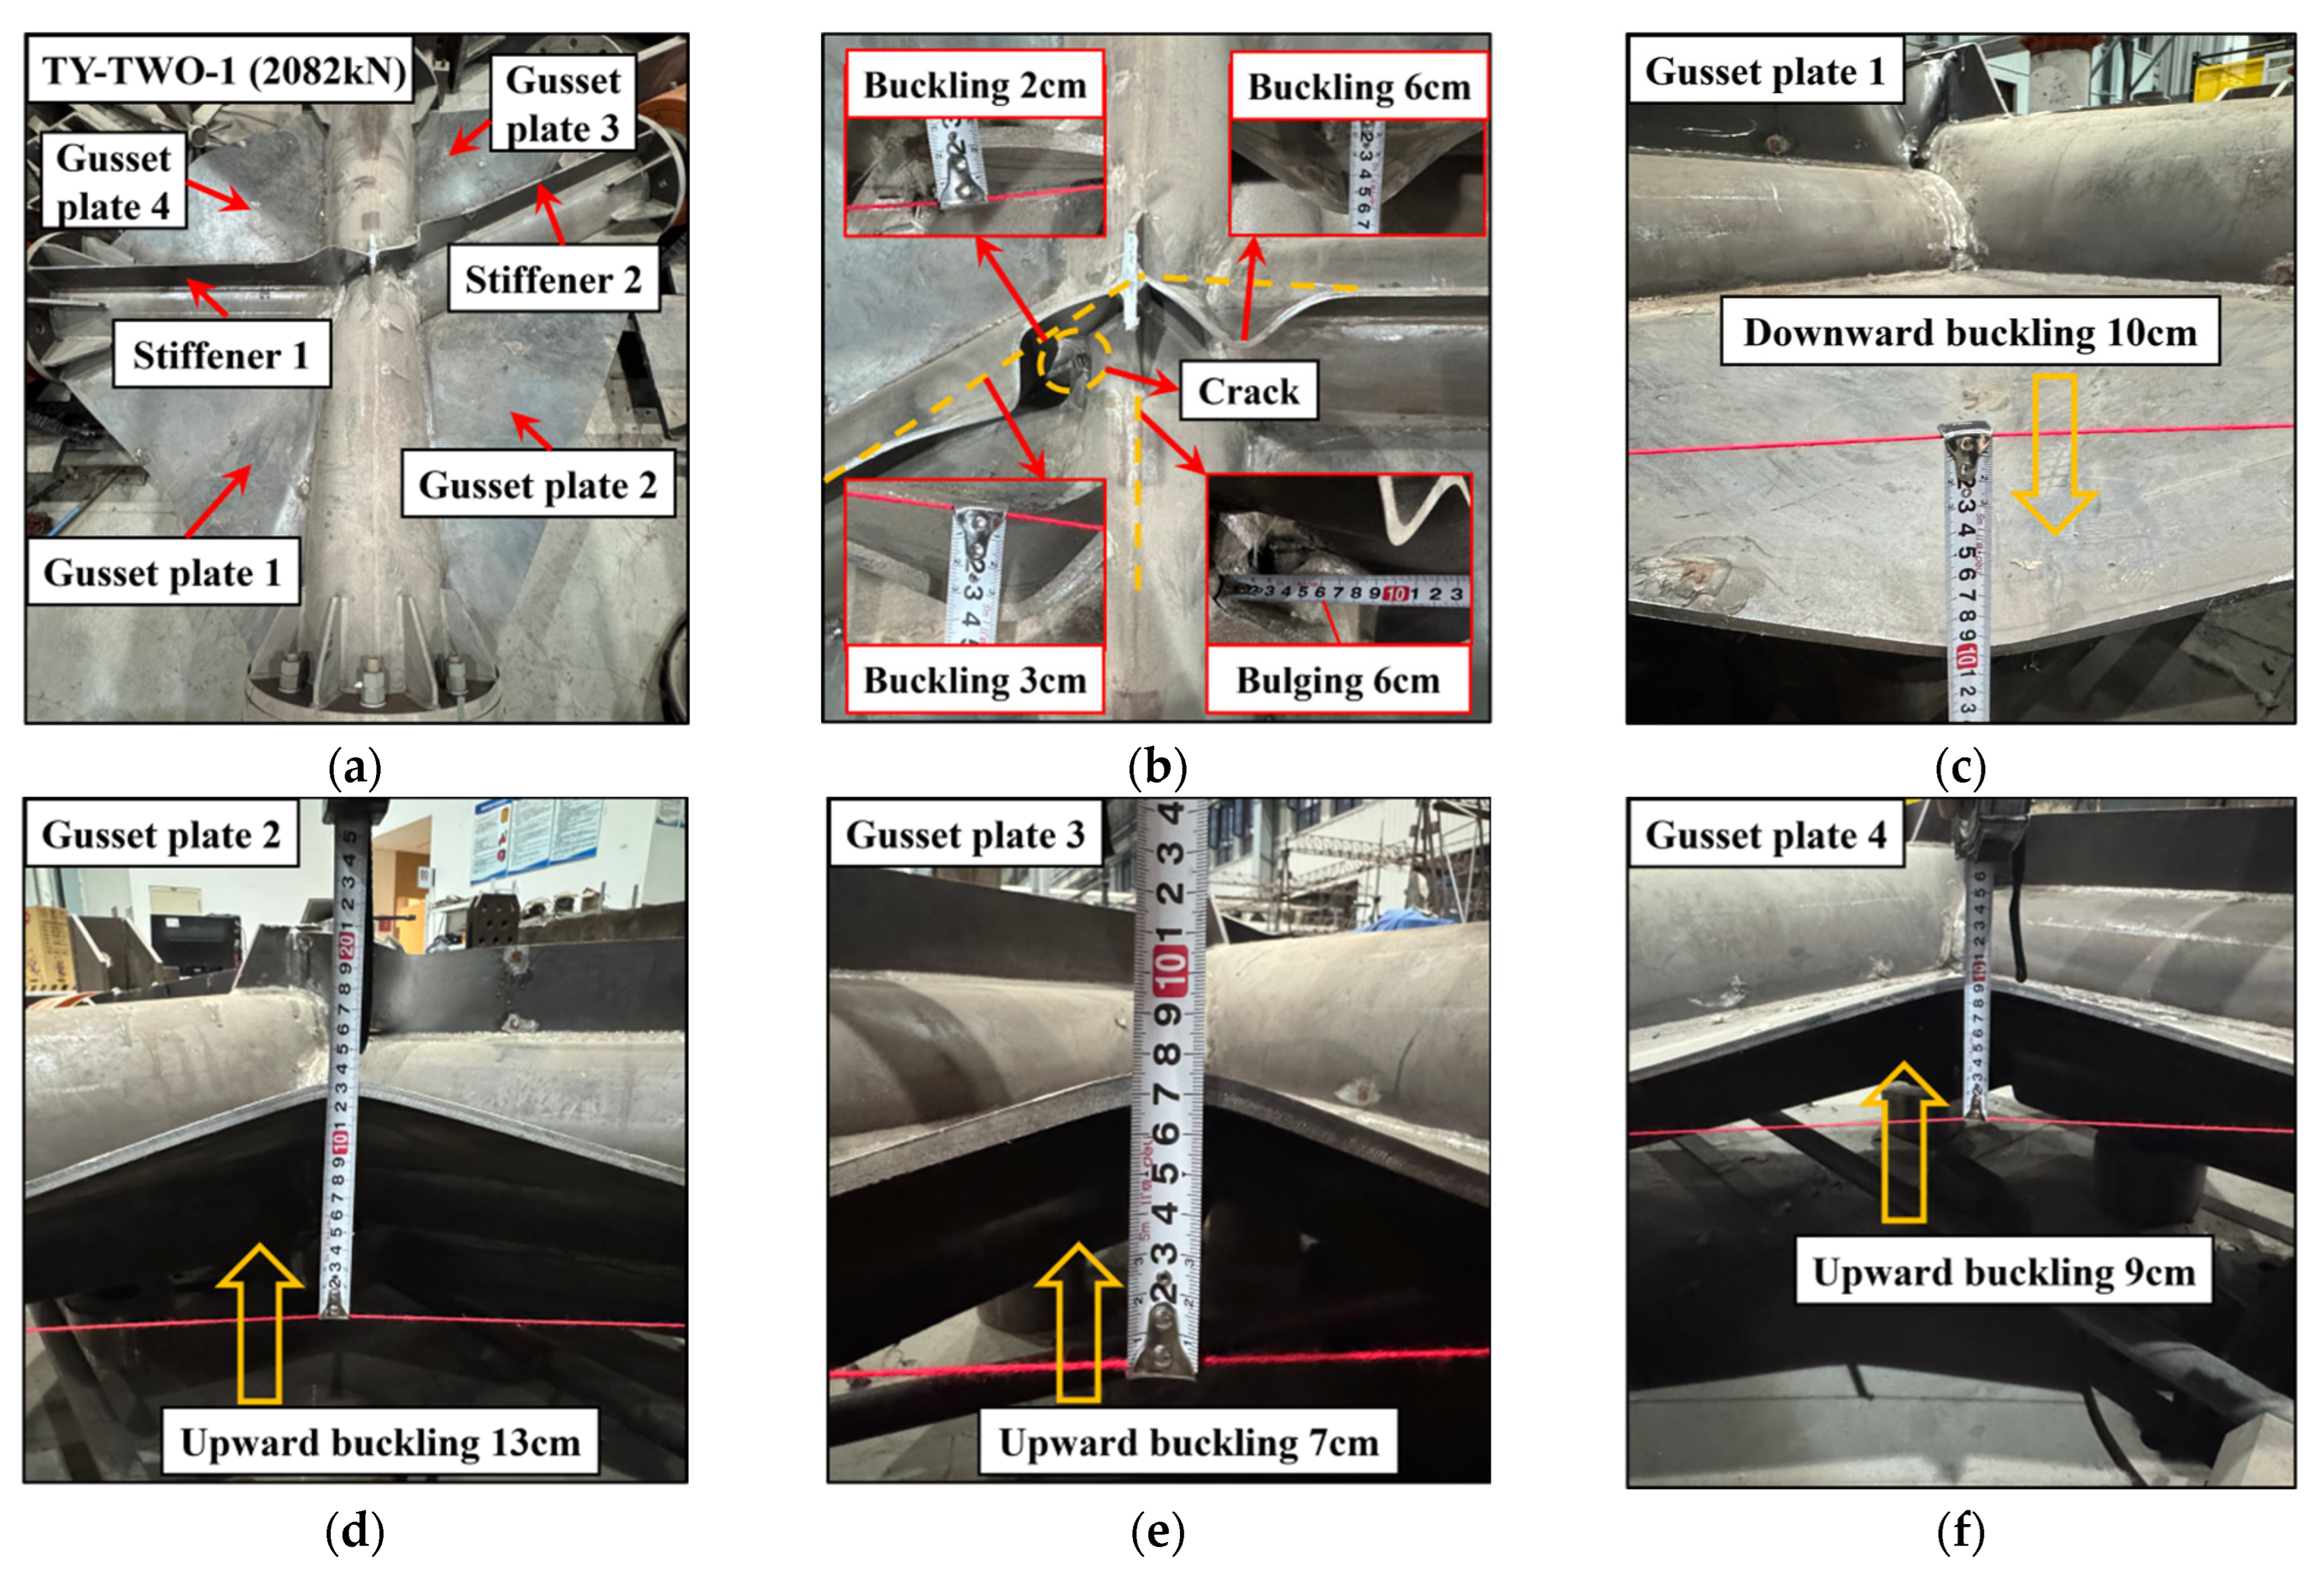
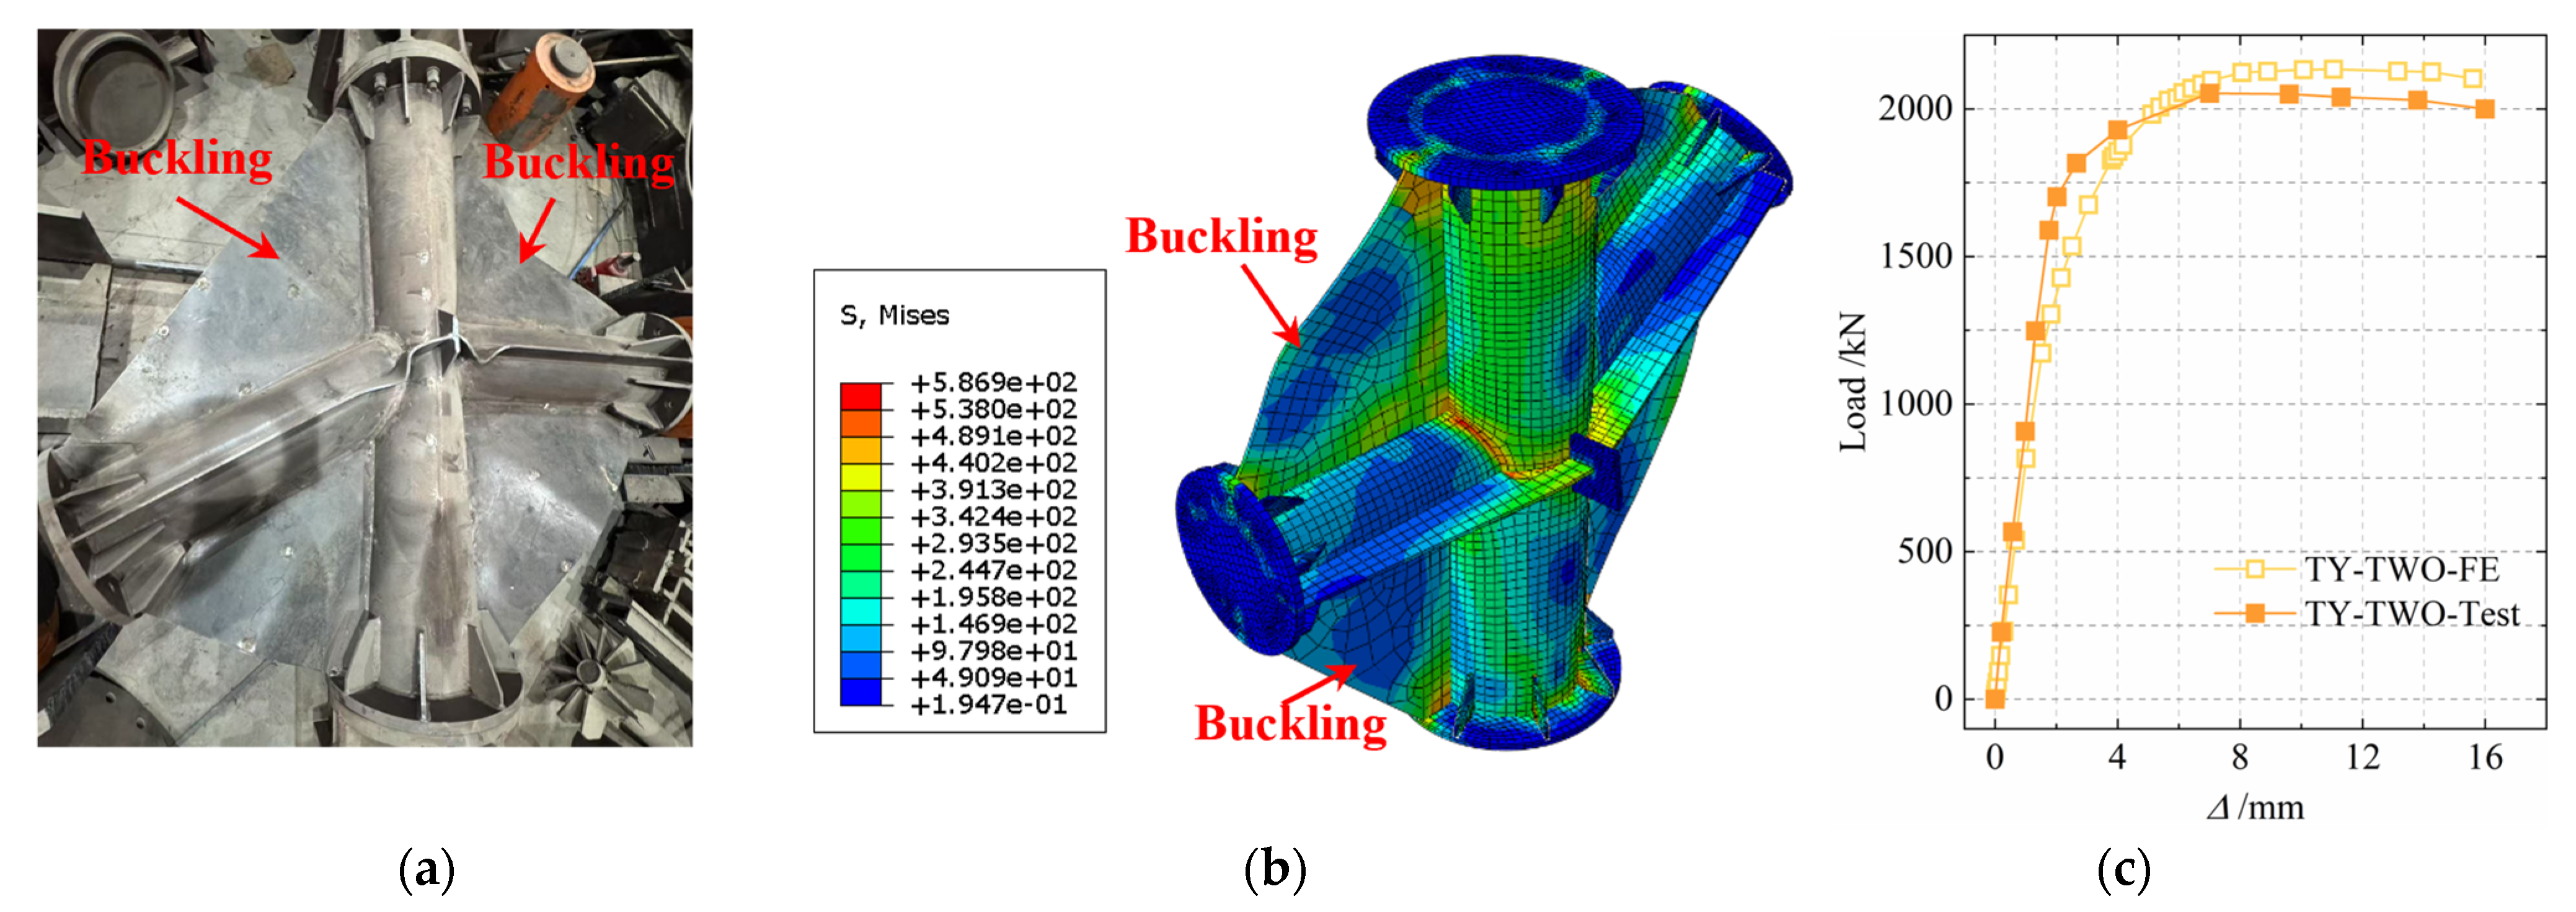
Specimen TY-TWO-1: This specimen is a composite externally stiffened tubular joint, and its failure mode is shown in Figure 10. When the specimen failed (loaded to 2082 kN), no concave deformation occurred in the intersecting area of the main pipe, and the distance from the intersecting line of the main pipe to the bulging position on the side wall was 6 cm. Obvious buckling deformation accompanied by cracks was observed in the stiffening ribs: Stiffening Rib 1 showed two distinct buckling deformations of 2 cm and 3 cm, while Stiffening Rib 2 exhibited one buckling deformation of 6 cm. All four gusset plates also underwent buckling deformation: Gusset Plate 1 buckled downward by 10 cm, and Gusset Plates 2, 3, and 4 buckled upward by 13 cm, 7 cm, and 9 cm respectively.
A comparison between Specimen TY-1 and Specimen TY-JDB-1 reveals that for Specimen TY-JDB-1 with gusset plates, the bulging deformation of the main pipe’s side wall is smaller, and the gusset plates effectively inhibit the local bulging deformation of the main pipe. There are fewer cracks at the intersecting line, indicating that the gusset plates have alleviated the stress concentration problem at the intersecting line.
A comparison between specimen TY-JDB-1 and specimen TY-TWO-1 shows that for specimen TY-TWO-1 with stiffening ribs, the bulging deformation of the main pipe’s side wall is reduced, and the stiffening ribs effectively restrain the local deformation of the main pipe in the stress direction. Regarding the buckling deformation of the gusset plates, except for the increased deformation of gusset plates 2 and 3, the deformation of gusset plates 1 and 4 is significantly reduced, and the buckling direction of gusset plate 1 has changed. The stiffening ribs have altered the original stress distribution, thereby alleviating the stress on gusset plates 1 and 4, while new stress concentrations have emerged in gusset plates 2 and 3. Obvious buckling deformation and cracking failure occurred at the stiffening ribs, indicating that the stiffening ribs have become the main load-bearing components, which delayed the failure of the overall structure.
A comparison between specimen TY-1 and specimen TY-TWO-1 reveals that the effect of composite stiffening in improving the bearing capacity of steel pipe joints is far superior to that of a single stiffening measure. There is a synergistic effect between the gusset plates and stiffening ribs, which jointly enhance the strength and reliability of the joint by optimizing the stress distribution and changing the failure mode of the joint.

4. Test Results and Analysis

4.1. Analysis of Joint Ultimate Bearing Capacity

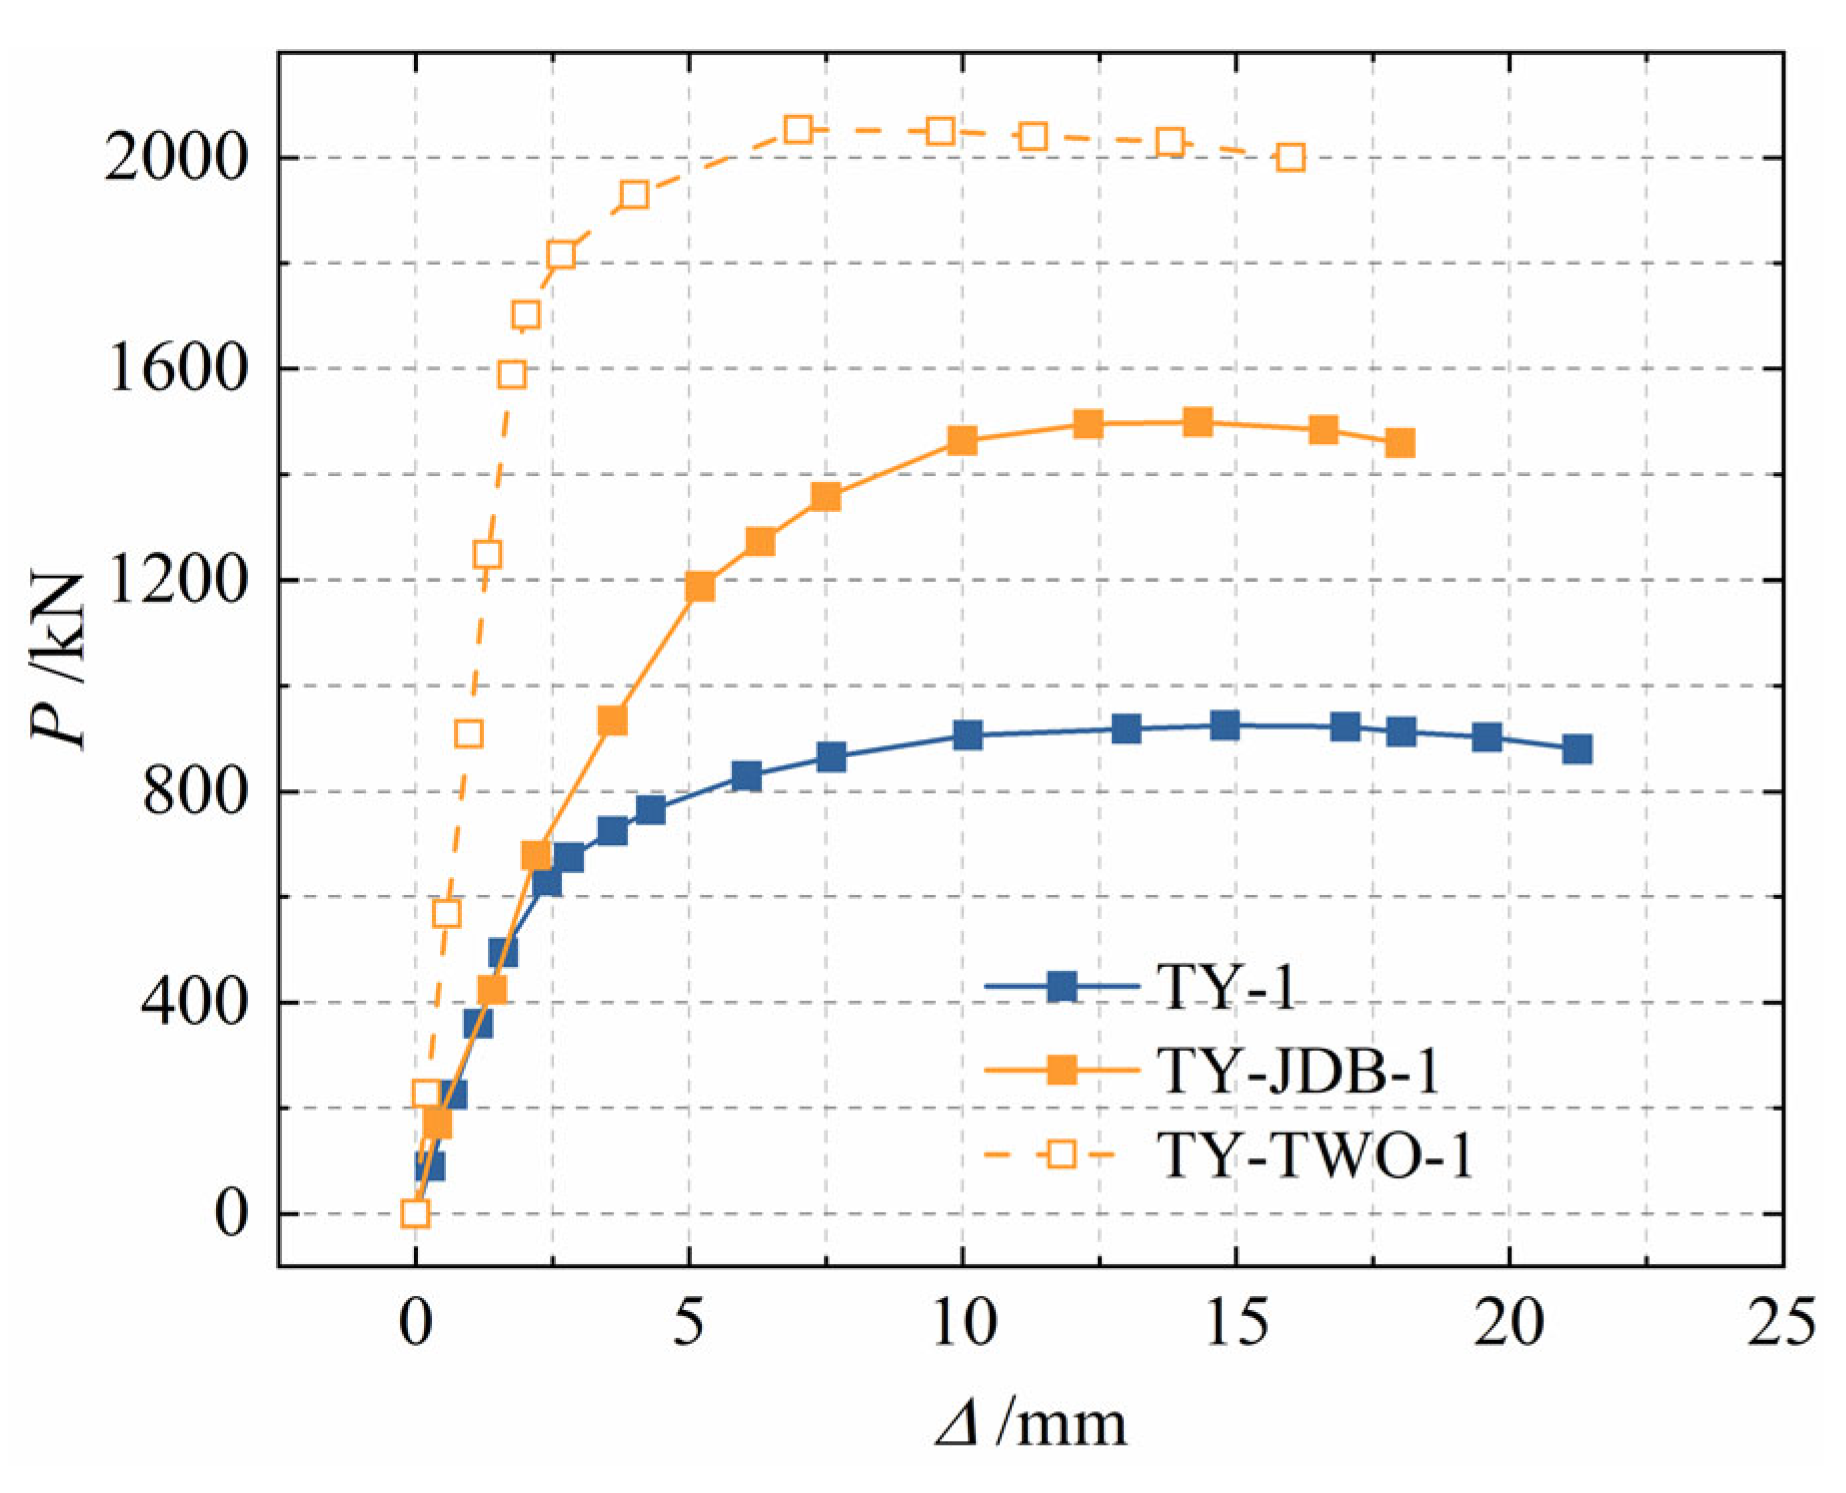
Figure 11 shows a comparison of the load (P)-displacement (Δ) curves of each specimen. The ultimate bearing capacity Pu of each specimen is listed in Table 3. Based on the analysis of Figure 11 and Table 3, it can be concluded that:
(1)
Specimen TY-1 is a pure steel joint, and Specimen TY-JDB-1 is a joint with gusset plates. Compared with Specimen TY-1, the initial stiffness of Specimen TY-JDB-1 remains basically unchanged, the loading displacement in the elastic stage is increased by 50%, and the ultimate bearing capacity is increased by 63.6%. It can be seen that the gusset plates can effectively increase the ultimate bearing capacity of the joint and extend the elastic stage of the joint, but have little impact on the initial stiffness of the joint.
Specimen TY-TWO-1 is a joint with gusset plates and stiffening ribs. Compared with specimen TY-JDB-1, its initial stiffness is increased by 200.3%, and its ultimate bearing capacity is increased by 36.8%. It can be seen that the stiffening ribs can effectively bear part of the load during the loading process and exert a restraining effect on the branch steel pipes, thereby significantly improving the joint stiffness and ultimate bearing capacity. However, the relatively high stiffness also causes the joint to enter the yield stage at a smaller displacement. Compared with specimen TY-JDB-1, specimen TY-TWO-1 enters the yield stage approximately 1.6 mm earlier, which reduces the ductility of the joint.

4.2. Analysis of Strain and Plasticity Results

To investigate the plastic deformation of the specimens, this study converts the strain results obtained from the tests into Von-Mises equivalent strain, with the calculation formula as follows [20]:
ε 1 ε 2 = ε 0 + ε 90 2 ± 1 2 ε 0 ε 45 2 + ε 45 ε 90 2
ε = 2 3 ε 1 ε 2 2 + ε 2 ε 3 2 + ε 1 ε 3 2
where ε 0 , ε 45 , ε 90 are the strains in the 0°, 45°, and 90° directions respectively; ε 1 , ε 2 , ε 3 are the principal strains, for the plane stress state on the surface of the main pipe, ε 3 = 0 is adopted.
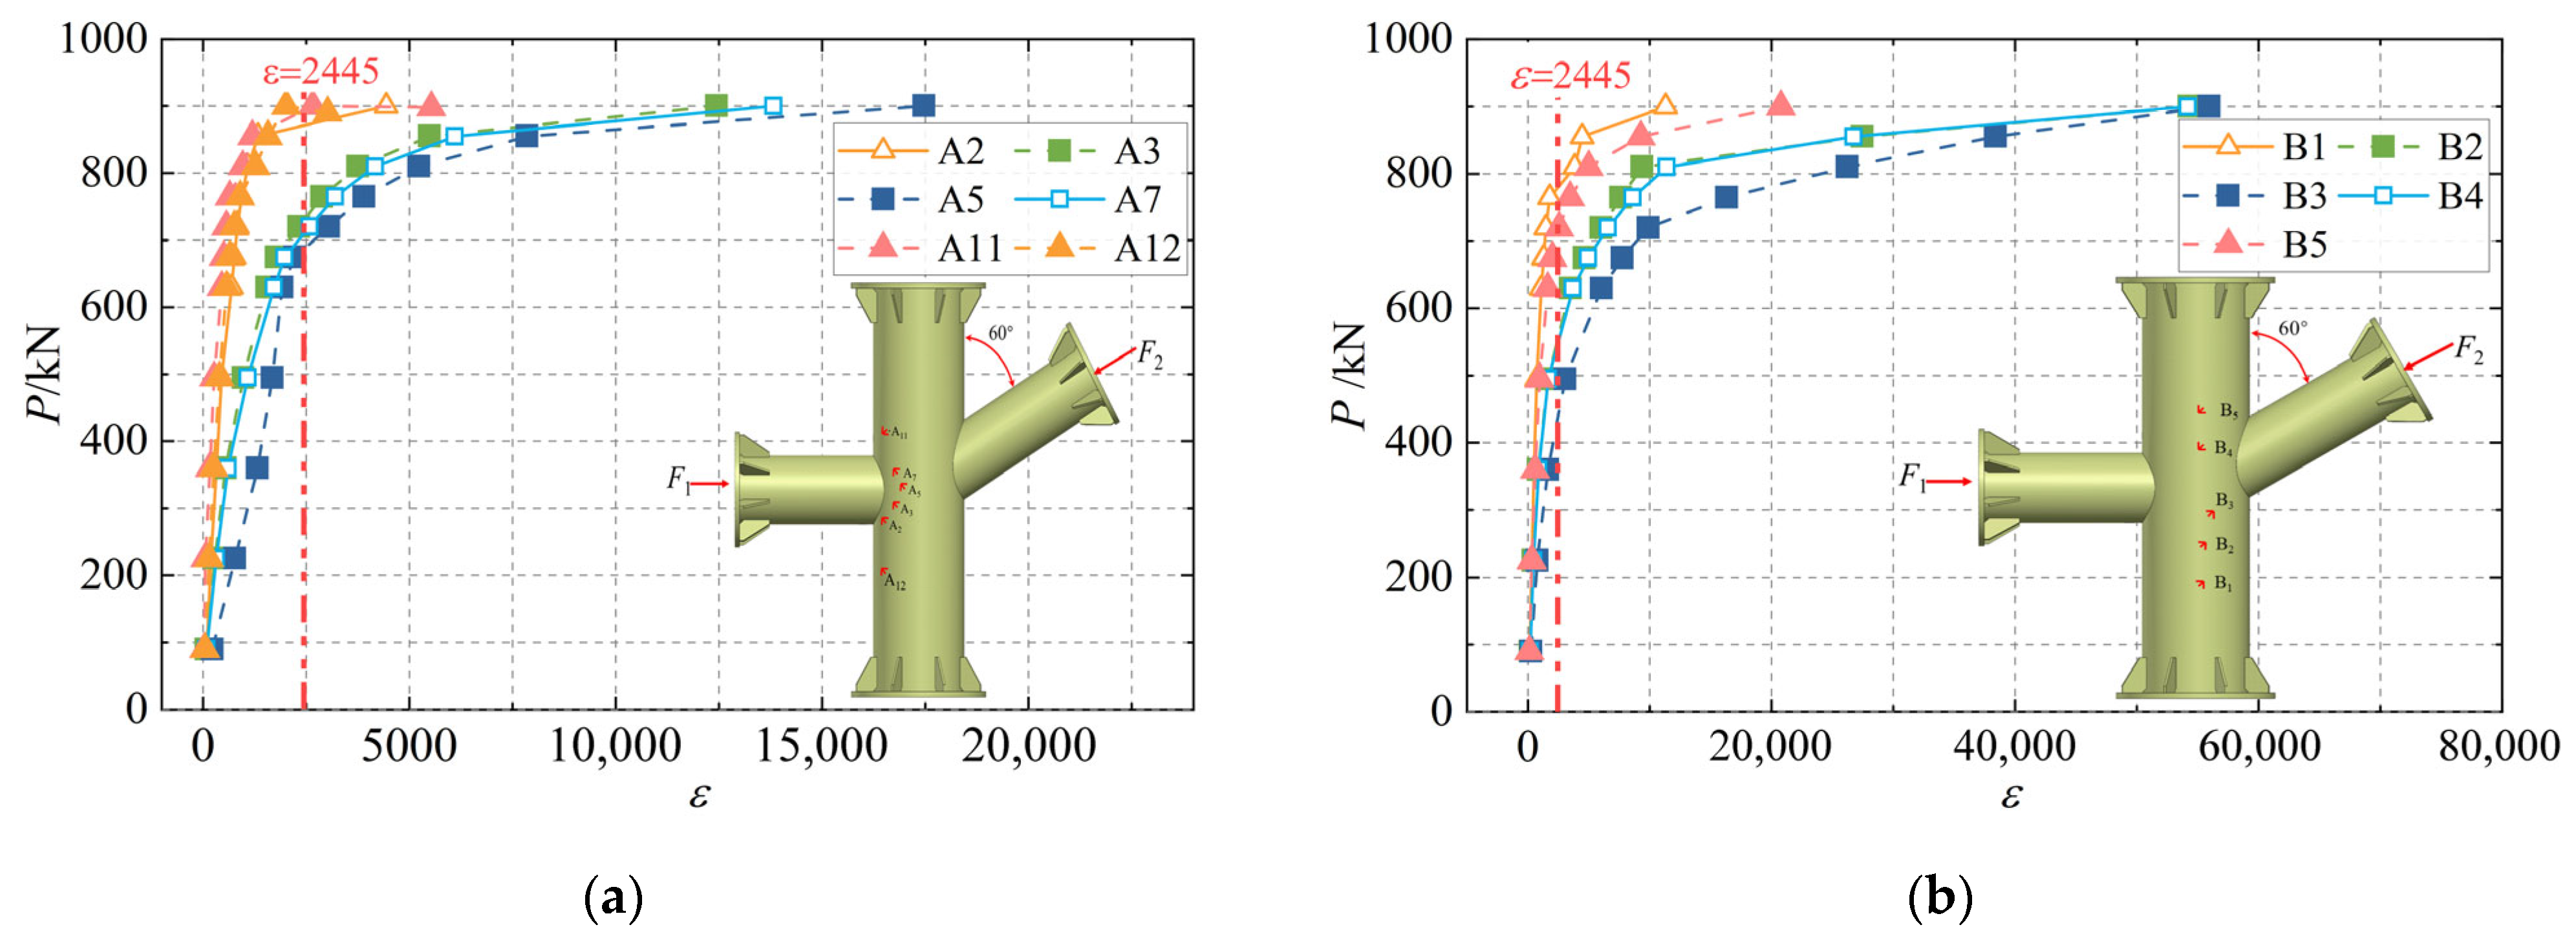
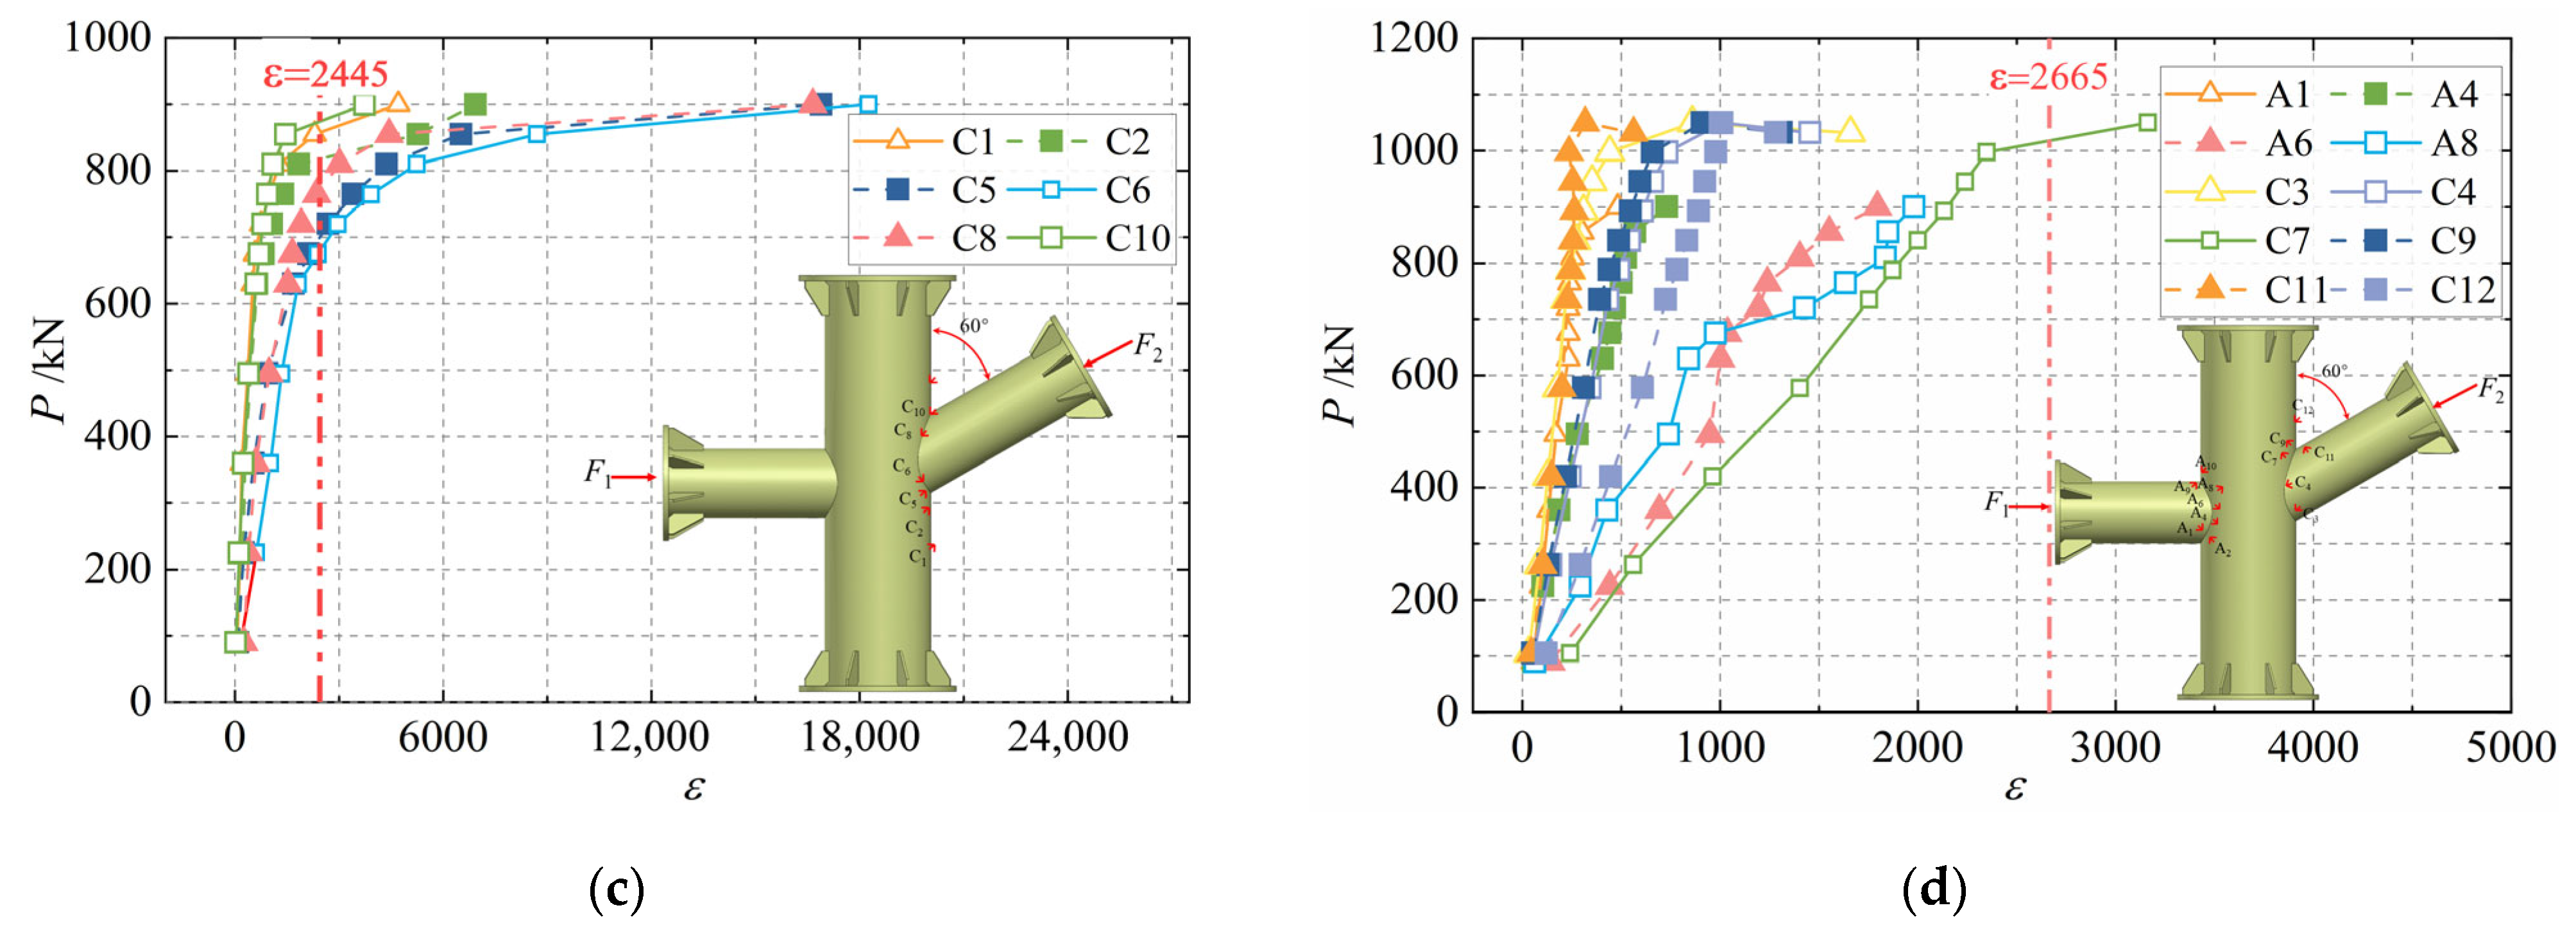
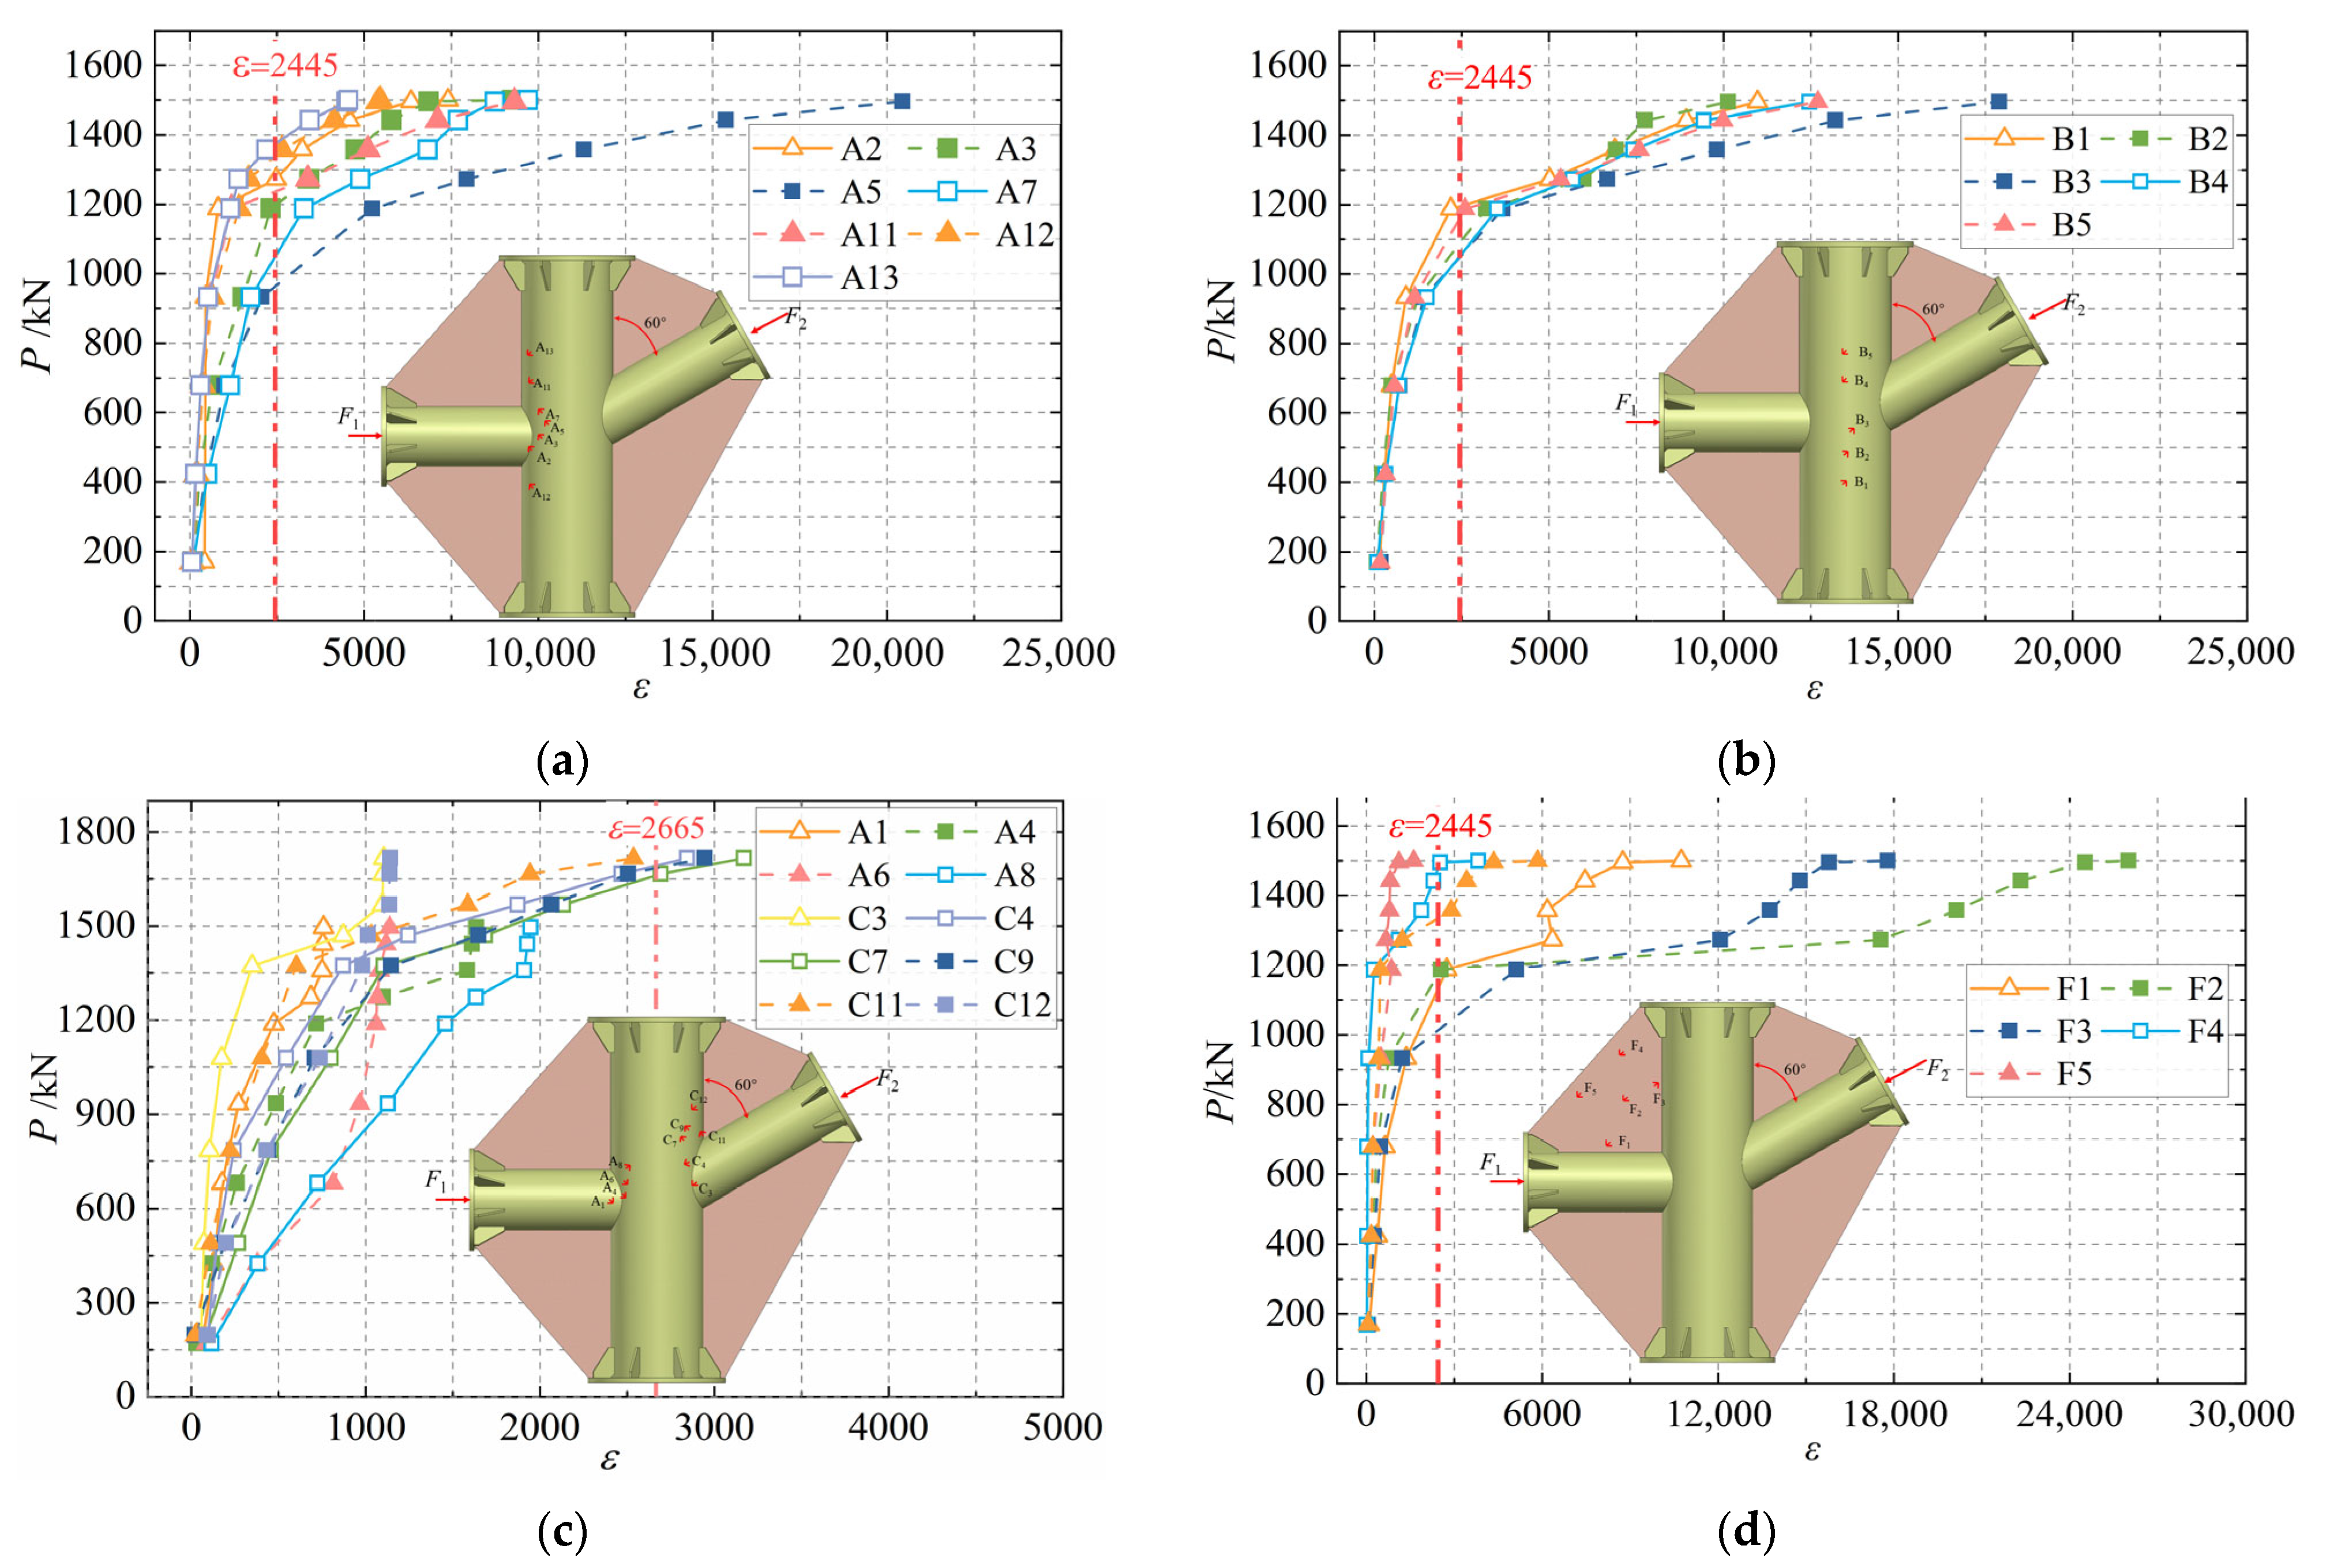
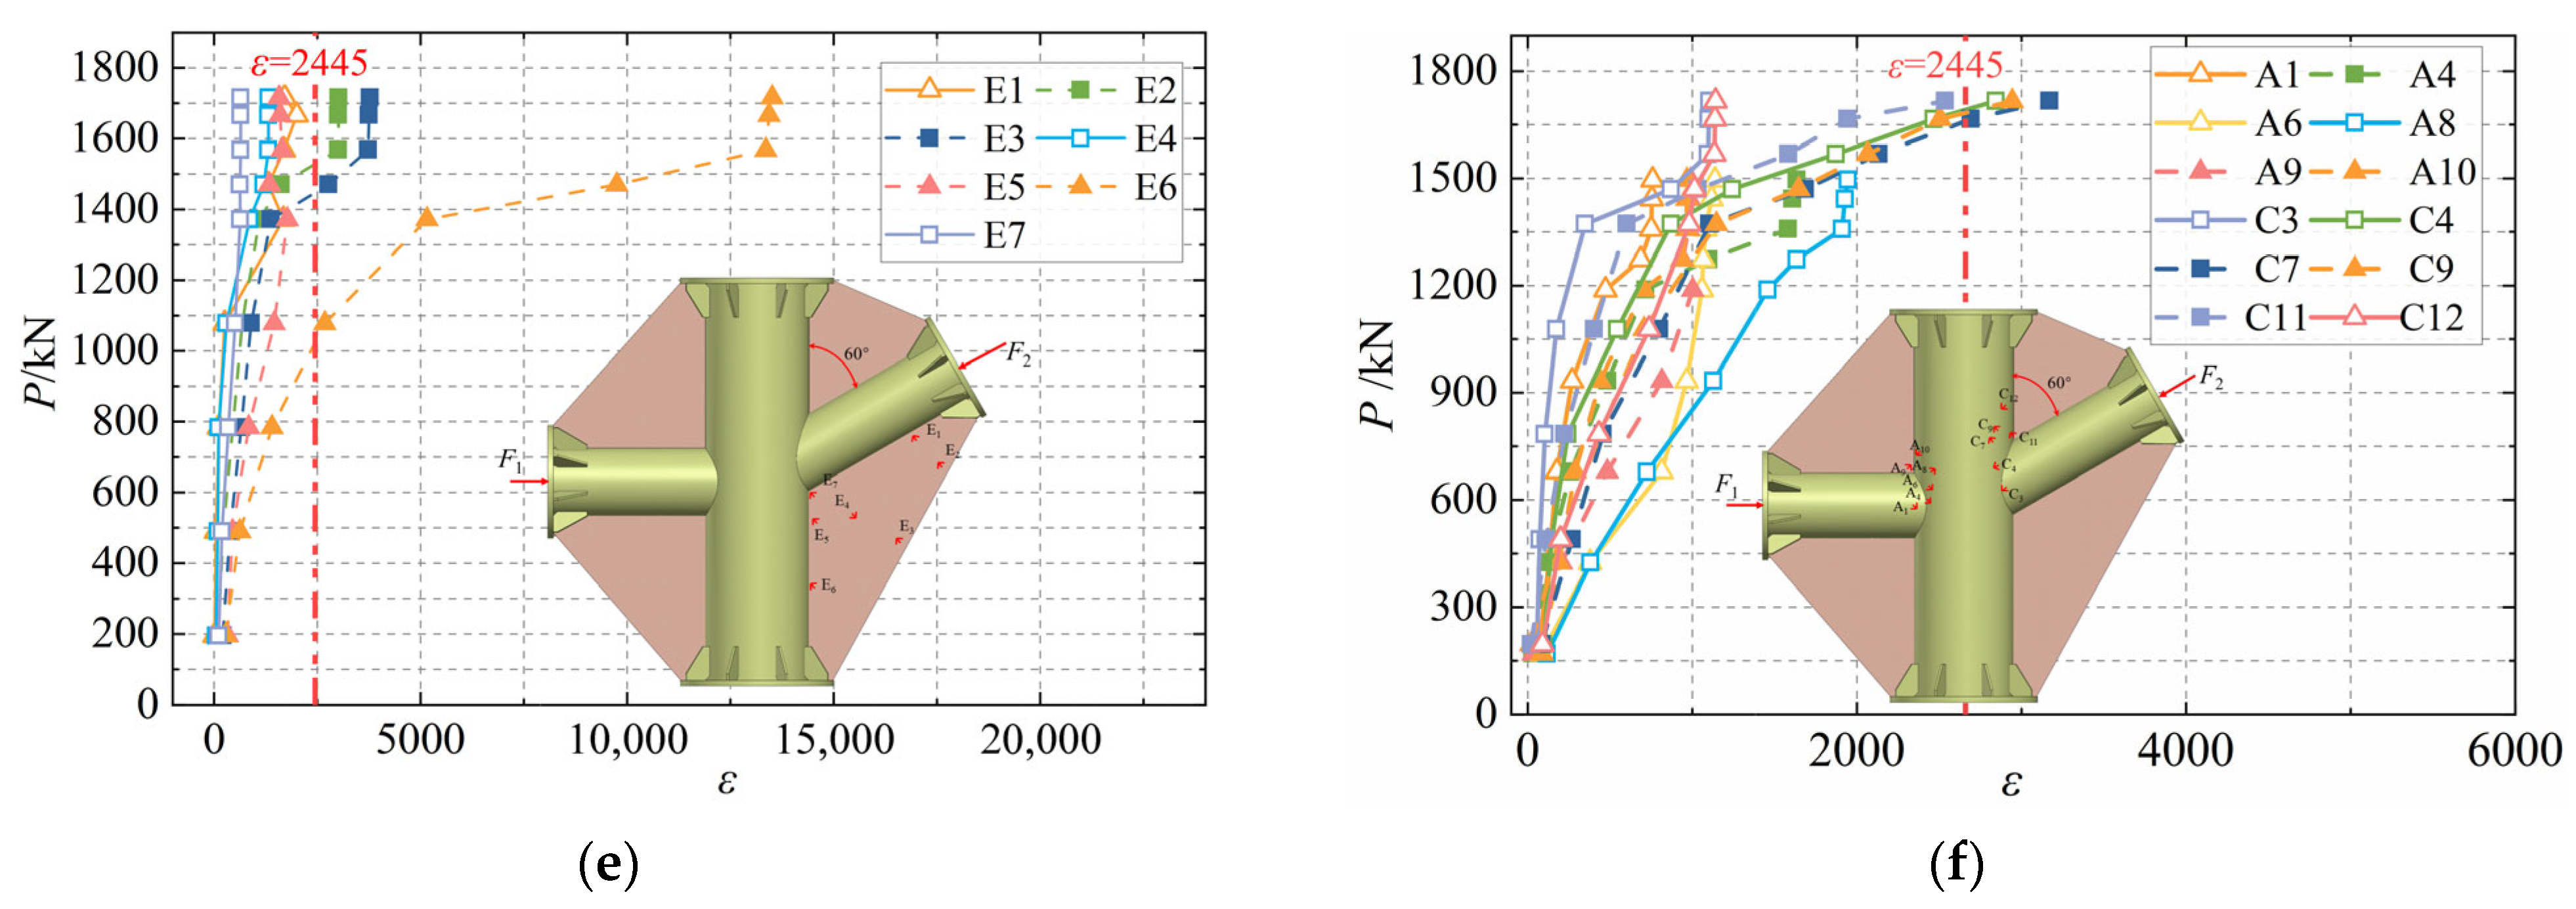
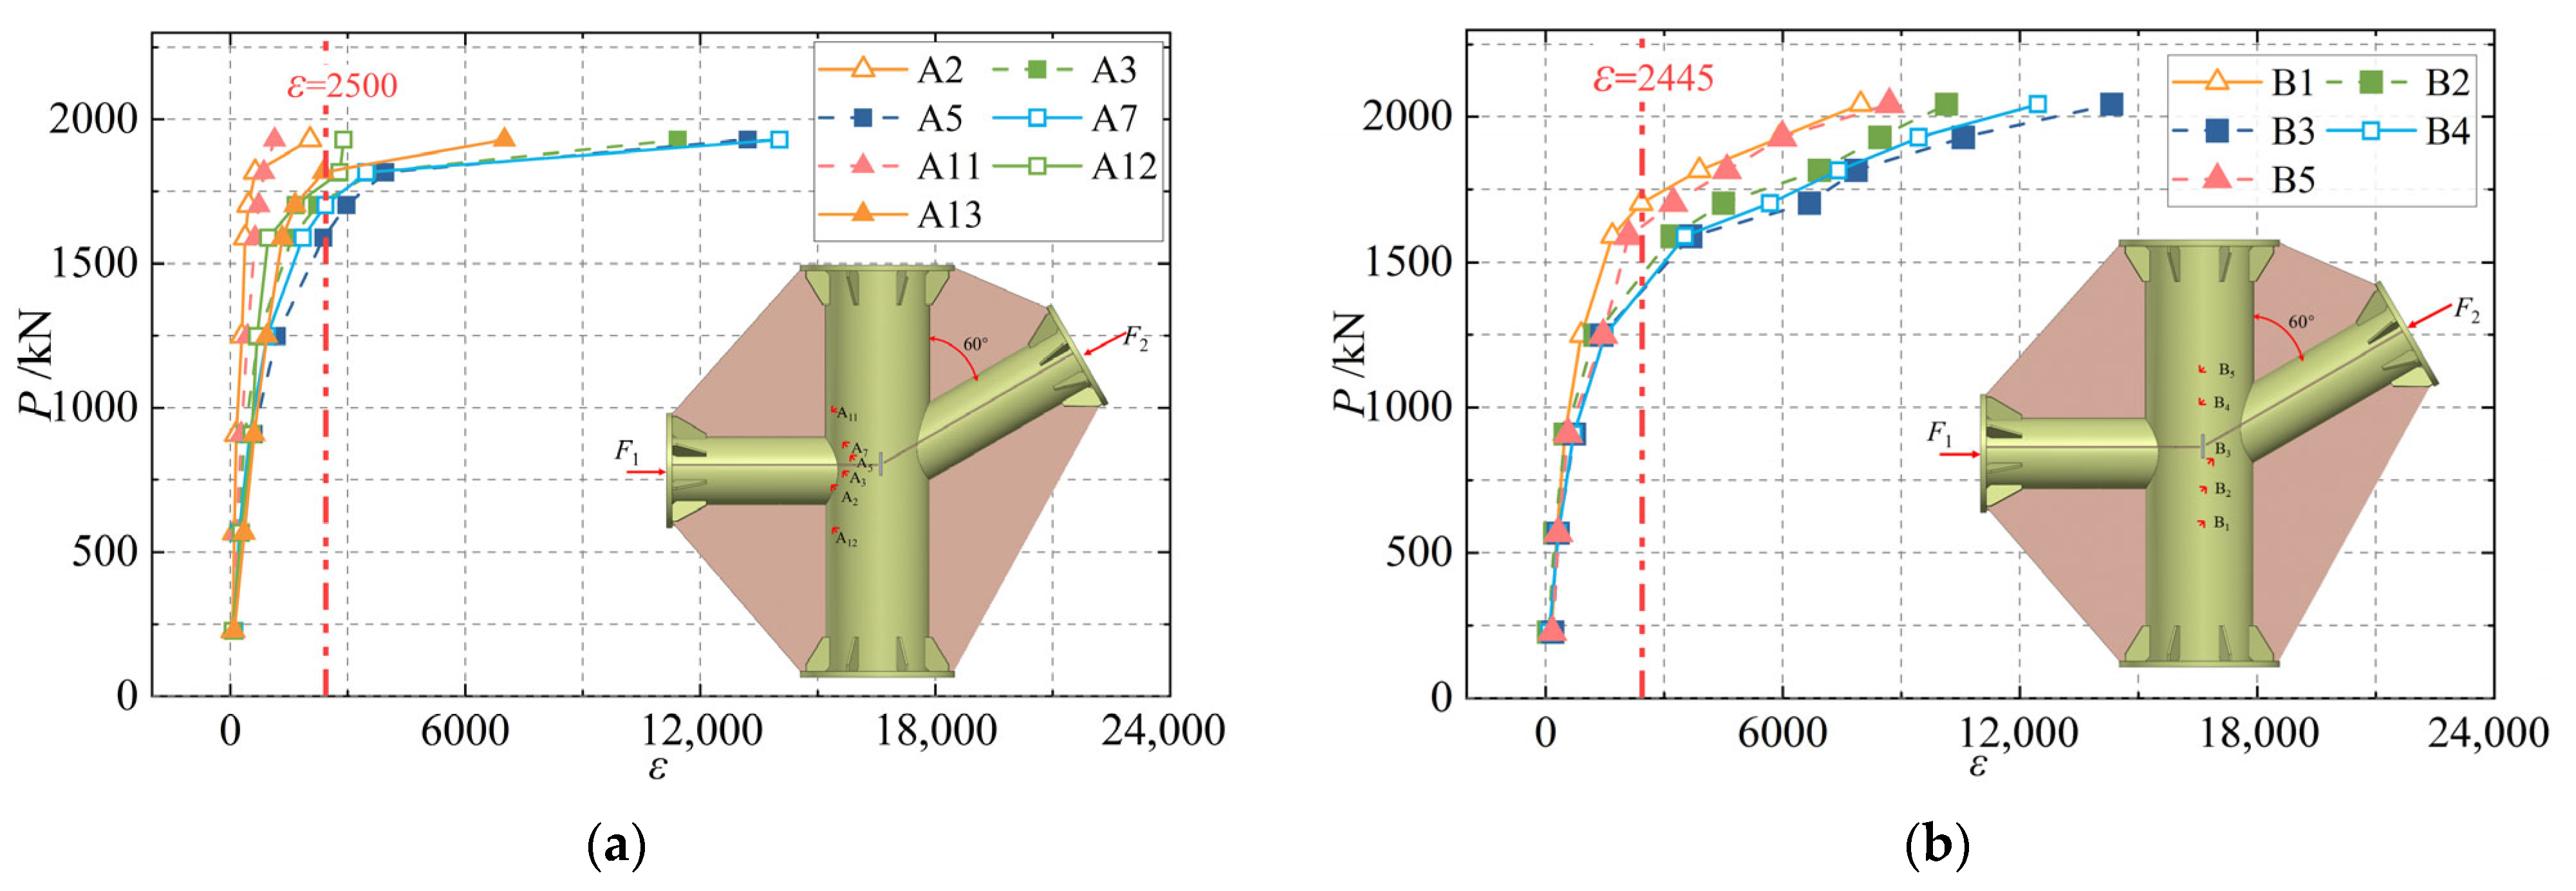
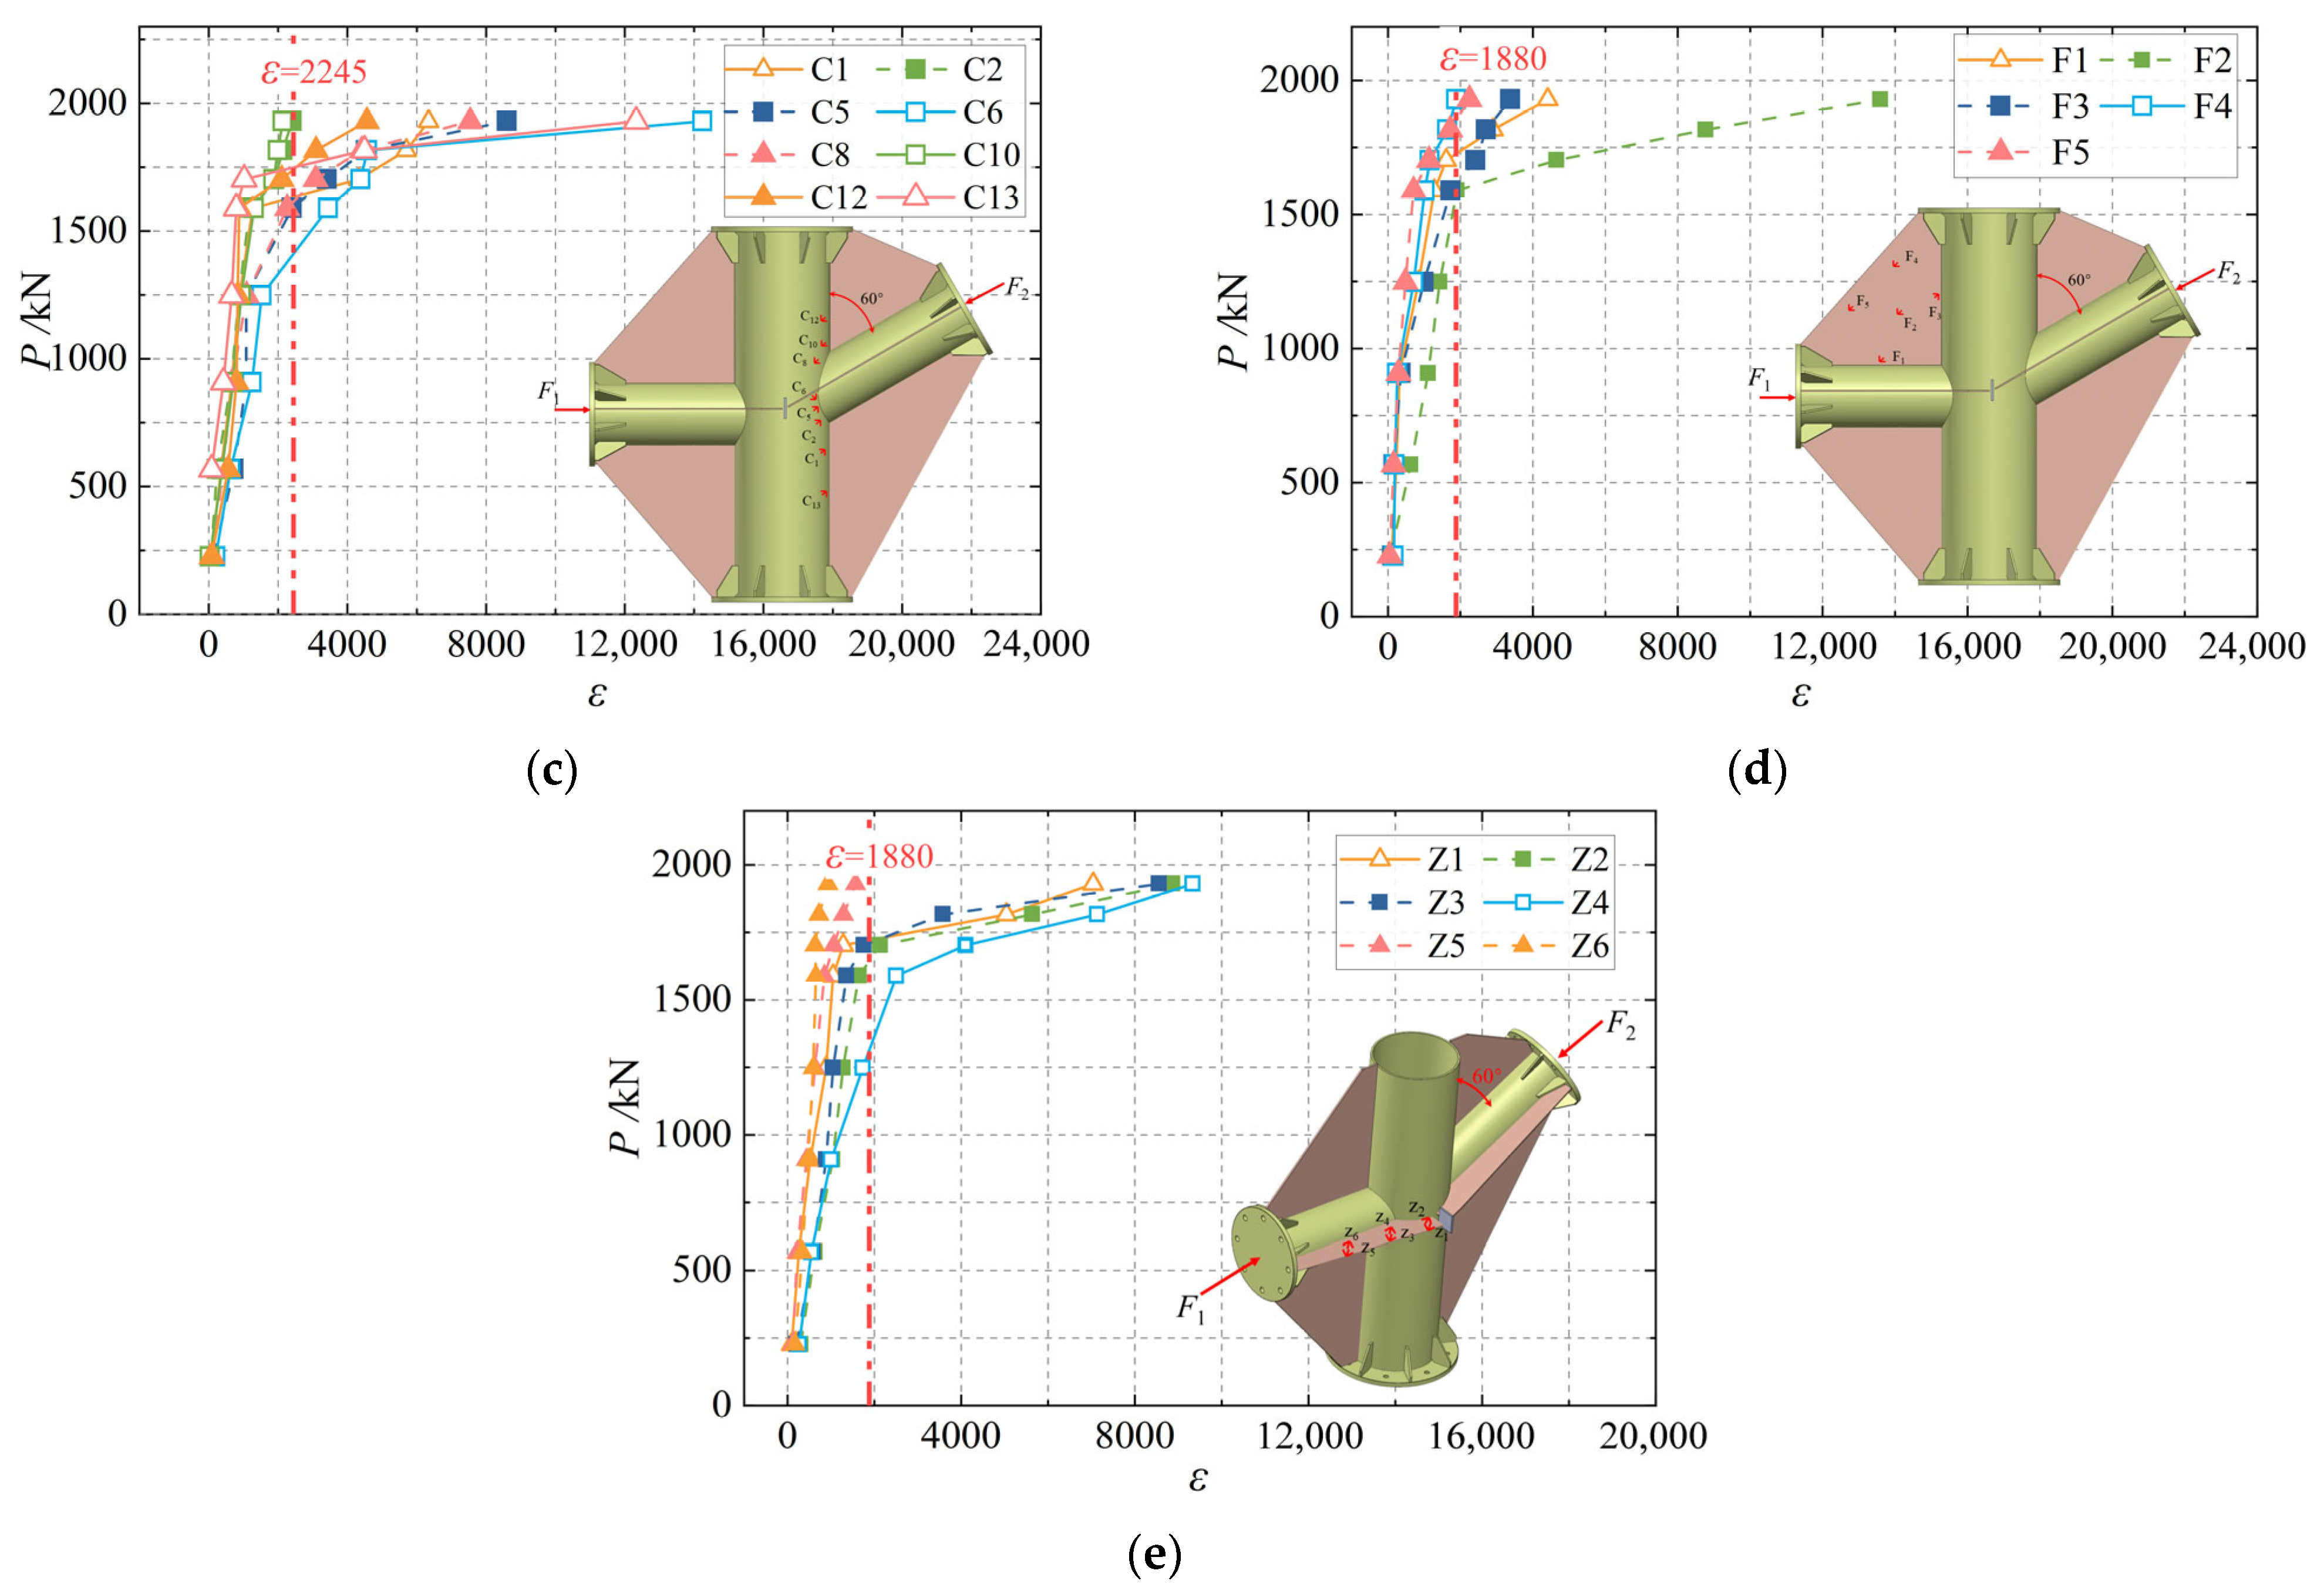
The variation of load with strain in the key regions of specimen TY-1, specimen TY-JDB-1, and specimen TY-TWO-1 is shown in Figure 12, Figure 13 and Figure 14.
This paper analyzes the strain development in various key regions of Specimen TY-1 during the loading process through Figure 12. The results show that during the gradual loading process, the measuring points at the saddle point of the straight branch pipe (A5), the intersection of the main pipe sidewall and the branch pipe axis (B3), and the saddle point of the inclined branch pipe (C6) are the first to reach the material yield strain measured in the material test, that is, the first to enter the yield state. The strain shows a decreasing trend from the center to both sides, indicating that the plastic zone of the main pipe expands outward from the saddle point along the intersecting line. The strain in the saddle point area is much larger than that on both sides of it, which suggests that the load applied by the branch pipe is mainly transferred to the main pipe through the crown point and expands to both sides of the intersecting line after yielding, resulting in extensive plastic development. When loaded to the ultimate state, most measuring points on the main pipe have yielded, while the strain of the branch pipe is small, indicating that the failure mechanism of the unstiffened joint TY-1 is a typical main pipe-dominated plastic failure.
Figure 13 analyzes the strain development in various key regions of Specimen TY-JDB-1 during the loading process. It can be observed that the measuring points at the saddle point in Zone A (A5), the main pipe sidewall in Zone B (B3), and the saddle point along the intersecting line in Zone C (C7) yield first. The plastic zone of the main pipe gradually expands along the intersecting line and the axial direction of the sidewall, indicating that the load is mainly transferred to the main pipe through the crown point and then diffused. Meanwhile, yielding in the gusset plate area starts at the intersections with the main pipe and branch pipe, followed by obvious buckling in the middle part. At the ultimate state, most measuring points on the gusset plate and those near the intersecting line of the main pipe have yielded, while regions far from the branch pipe remain unyielded. This indicates that stiffening expands the yielding range on the main pipe surface, which is mainly concentrated near the gusset plate and the intersecting line. The measuring points on the branch pipe are basically unyielded, suggesting that the failure mechanism of TY-JDB-1 is a collaborative plastic failure of the main pipe and the gusset plate.
Figure 14 analyzes the strain development in various key regions of Specimen TY-TWO-1 during the loading process. As can be seen from the figure, the measuring points at the saddle point of Zone A (A7), B3 of Zone B, and the saddle point of Zone C (C6) reach yielding first, and the strain spreads from these key positions to both sides, indicating that the main pipe also enters a plastic state at the intersection of the branch pipe saddle points. The strain at the saddle point measuring points in Zones A and C is significantly higher than that at the crown points (A2, A11, C2, C10), which suggests that the load of the branch pipe is mainly transferred to the main pipe through the crown points and diffuses along the intersecting line, with the plastic zone gradually expanding. At the ultimate state, most of the measuring points on the main pipe have yielded, and due to the effect of the external stiffening ribs, the axial force of the branch pipe is concentrated at the saddle points.
Figure 14d shows that the yielding of the gusset plate mainly occurs at its intersections with the main pipe and branch pipe, indicating that the composite stiffened specimen TY-TWO-1 has a more extensive plastic development area compared to the unstiffened one, which is concentrated in the gusset plate and the intersecting zone. Figure 14e reveals that the stiffening ribs first yield near the intersecting line, while the strain at positions far from the intersecting line (Z5, Z6) is small, suggesting that the stiffening ribs mainly bear the load near the intersecting line of the main pipe. Only a few measuring points on the branch pipe yield near the saddle point, indicating that in the later stage of loading, the load is mainly borne by the main pipe and the stiffening components together, which improves the load-bearing capacity of the joint.

5. Finite Element Model Analysis

5.1. Finite Element Model Establishment

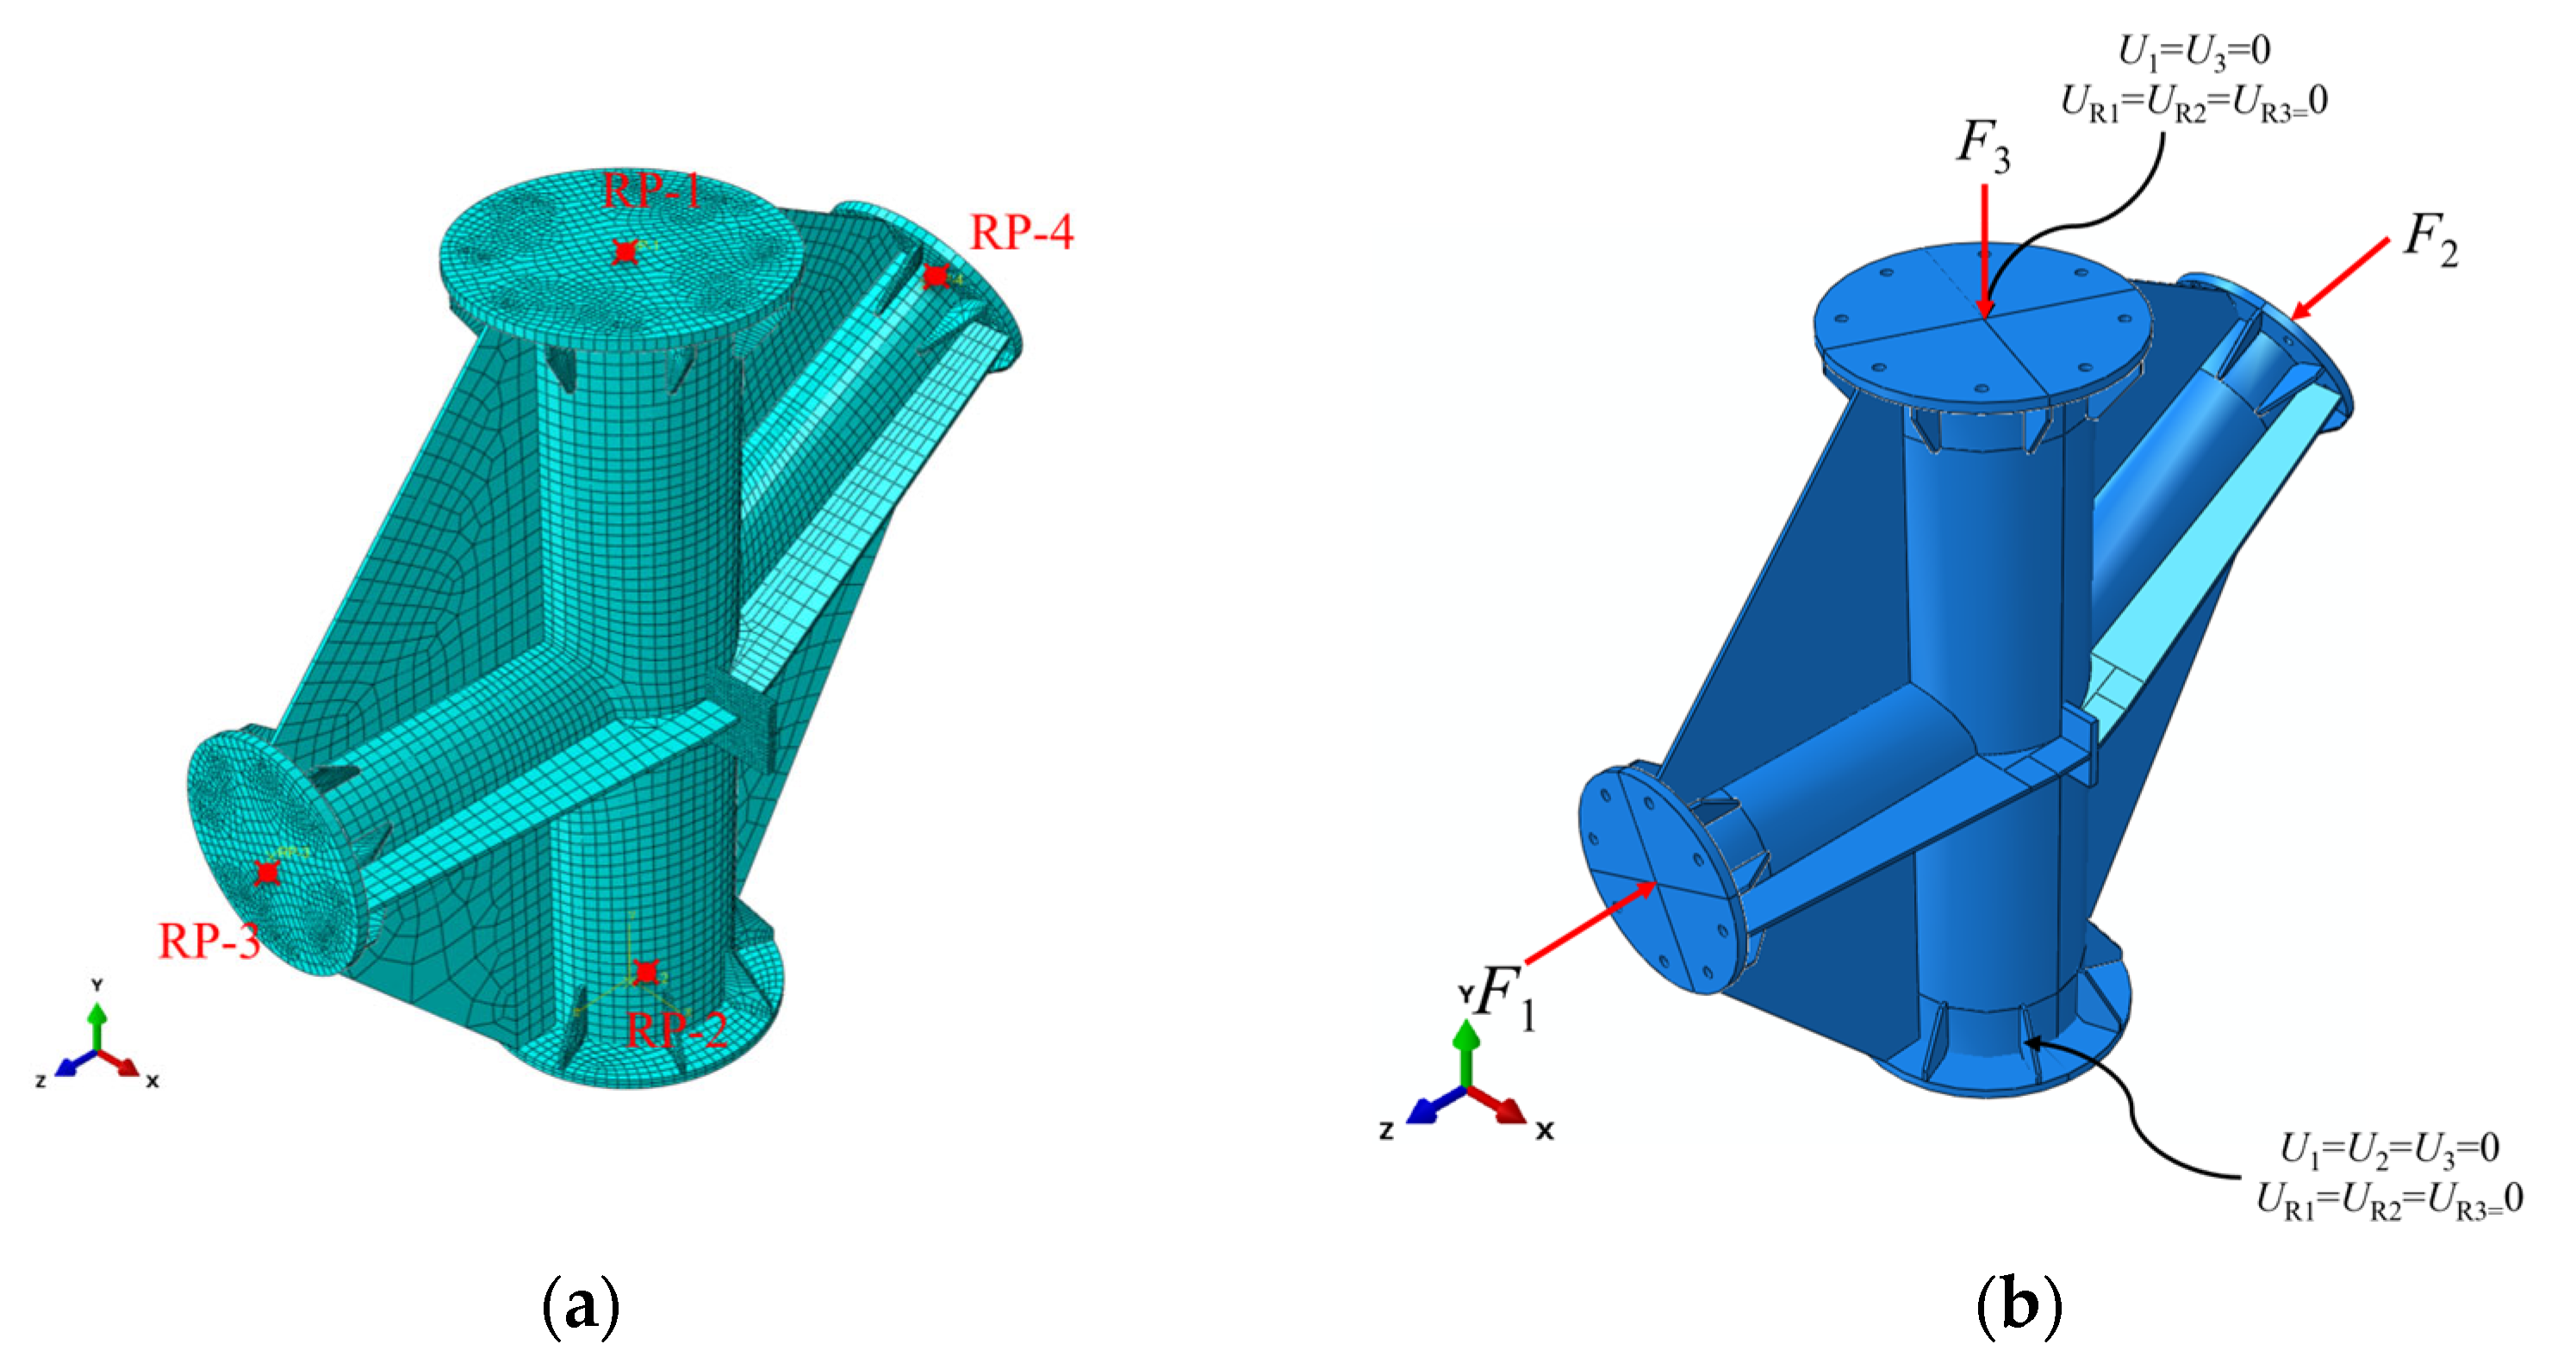
To further analyze the influence of the specifications of each component of composite externally stiffened tubular joints on the ultimate bearing capacity of the joints, this paper establishes a finite element model of the tubular joint using ABAQUS 2020 software, as shown in Figure 15. In the model, all components adopt C3D8R eight-node linear hexahedral elements with reduced integration [21]. The mesh size of the stiffening ribs is 10 mm, the mesh size of the gusset plates is 40 mm, the mesh size of the stiffening plates is 33 mm, the mesh size of the end plates is 24 mm, and the mesh size of the main pipes and branch pipes is 30 mm. The finite element meshing model is shown in Figure 15a.
Due to the unidirectional loading applied to the specimens, a bilinear isotropic hardening elastoplastic model was adopted for the steel constitutive behavior. The material property settings were consistent with the results of the steel tensile tests, with a Poisson’s ratio of 0.3 [22]; all components in the finite element model are connected using “Tie” constraints to simulate the welded connections in actual working conditions; four reference points (RP-1, RP-2, RP-3, RP-4) were created on the top surface of the main pipe, the bottom surface of the main pipe, and the end faces of the branch pipes on both sides, and were coupled with the corresponding cross-sectional areas with full degrees of freedom; The translational degrees of freedom in the X and Z directions and the rotational degrees of freedom in the X, Y, and Z directions of RP-1 were constrained, after which an axial load F3 was applied at RP-1; the full degrees of freedom of RP-2 were constrained to simulate the fixed connection between the column base and the support; loads F1 and F2 were applied to RP-3 and RP-4 to simulate the loads exerted by the actuators. The load application method and boundary conditions of the joint are shown in Figure 15b.

5.2. Finite Element Model Validation

In accordance with the test loading process, the finite element models of specimens TY-1, TY-JDB-1, and TY-TWO-1 were loaded step by step. The calculated load-axial displacement curves of the compressed branch pipes were compared with the test results, as shown in Figure 16, Figure 17 and Figure 18. As can be seen from Figure 16, Figure 17 and Figure 18: The finite element failure modes and load–displacement curves of the three specimens are in good agreement with the test results, which verifies the rationality and accuracy of the finite element modeling method adopted in this paper.
Analysis of the failure modes of the joints in Figure 16, Figure 17 and Figure 18 shows that: the failure mode of TY-1 is compression buckling in the core area, with peeling in the welded region; the failure mode of TY-JDB-1 is compression buckling of the main pipe in the joint core area, accompanied by buckling of the gusset plate; the failure mode of TY-TWO-1 is compression buckling of the main pipe in the joint core area, with the weld in the region where the stiffening plate is close to the main pipe suffering extrusion fracture. Comparison of the failure modes of TY-1 and TY-JDB-1 shows that: the addition of gusset plates distributes the applied load, resulting in an increase in the ultimate bearing capacity of the joint, and a reduction in the load borne by the welded region. Comparison of the failure modes of TY-JDB-1 and TY-TWO-1 reveals that: the addition of stiffening plates can further constrain the vertical cross-sectional deformation of the branch pipe under load and help distribute the load borne by the branch pipe.
Figure 16c, Figure 17c and Figure 18c show the comparison between the finite element calculated load–displacement curves and the experimental load–displacement curves. As can be seen from the figures: the two sets of load–displacement curves are basically close, and the errors between the ultimate bearing capacities of the joints obtained by finite element simulation and the experimental data are all within 10%. The good agreement further verifies the accuracy of the finite element simulation results.

6. Analysis of Influencing Factors on Bearing Capacity

In the previous research, it has been shown that compared with the gusset plate-stiffened tubular joint TY-JDB-1 and the unstiffened tubular joint TY-1, the composite externally stiffened tubular joint TY-TWO-1 exhibits a significant improvement in ultimate bearing capacity due to its stiffening form. Therefore, based on this composite externally stiffened tubular joint, further in-depth research can be conducted on the influence of different parameters on the improvement effect of ultimate bearing capacity. To investigate the influence of different geometric parameters on the ultimate bearing capacity of the TY-TWO-1 joint, this paper takes the finite element model of TY-TWO-1 as the BASE model and establishes a total of 256 parameter-related models targeting 7 types of dimensionless parameters. The seven types of dimensionless parameters are as follows: main pipe to branch pipe diameter ratio (β = d/D); main pipe diameter-to-thickness ratio (γ = D/T); Gusset plate thickness ratio (τ = tp/T); Additional stiffening rib thickness ratio (τs = ts/T); Stiffening rib height ratio (βs = hs/D); Angle between the main pipe’s inclined branch pipe and the inclined branch pipe (θ) and main pipe axial compression ratio (n). As shown in Table 4.

6.1. Influence of Diameter-to-Thickness Ratio of Main Pipe γ

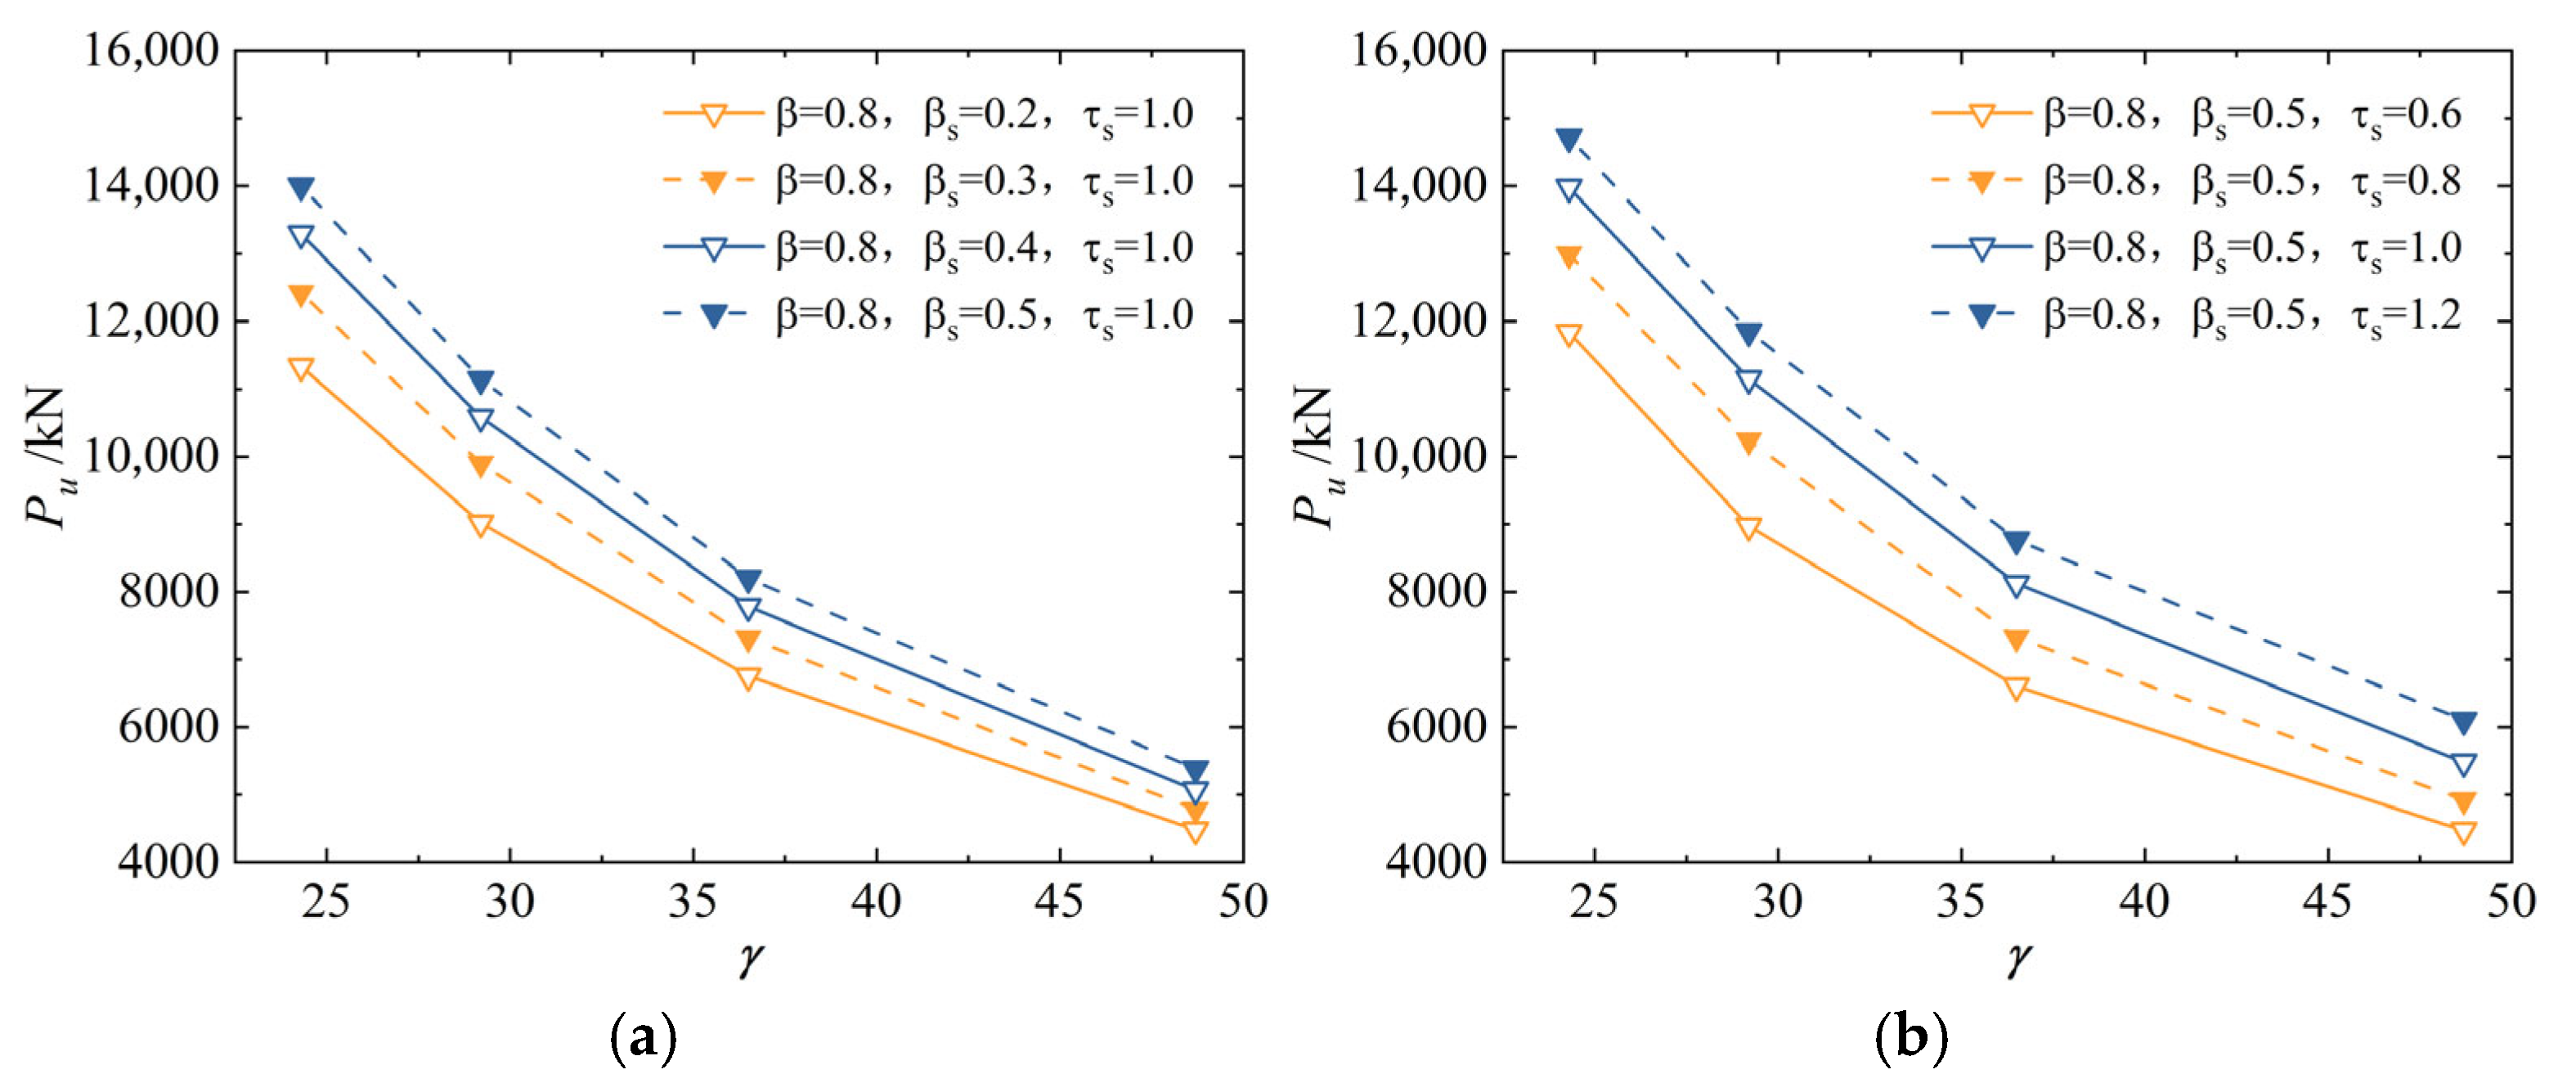
Figure 19 presents the influence law of γ on the ultimate bearing capacity of the joint. It can be seen from the figure that the ultimate bearing capacity decreases significantly with the increase of γ, and the variation trends of the curves are basically consistent when the values of βs and τs are different. As can be seen from Figure 19a, when γ < 36.5, the larger the βs, the faster the change of Pu, indicating that for joints with a larger stiffening rib height ratio, the influence of the main pipe diameter-to-thickness ratio on the ultimate bearing capacity is more significant. As shown in Figure 19b, the larger the τs, the higher the ultimate bearing capacity.

6.2. Influence of Main Pipe to Branch Pipe Diameter Ratio β

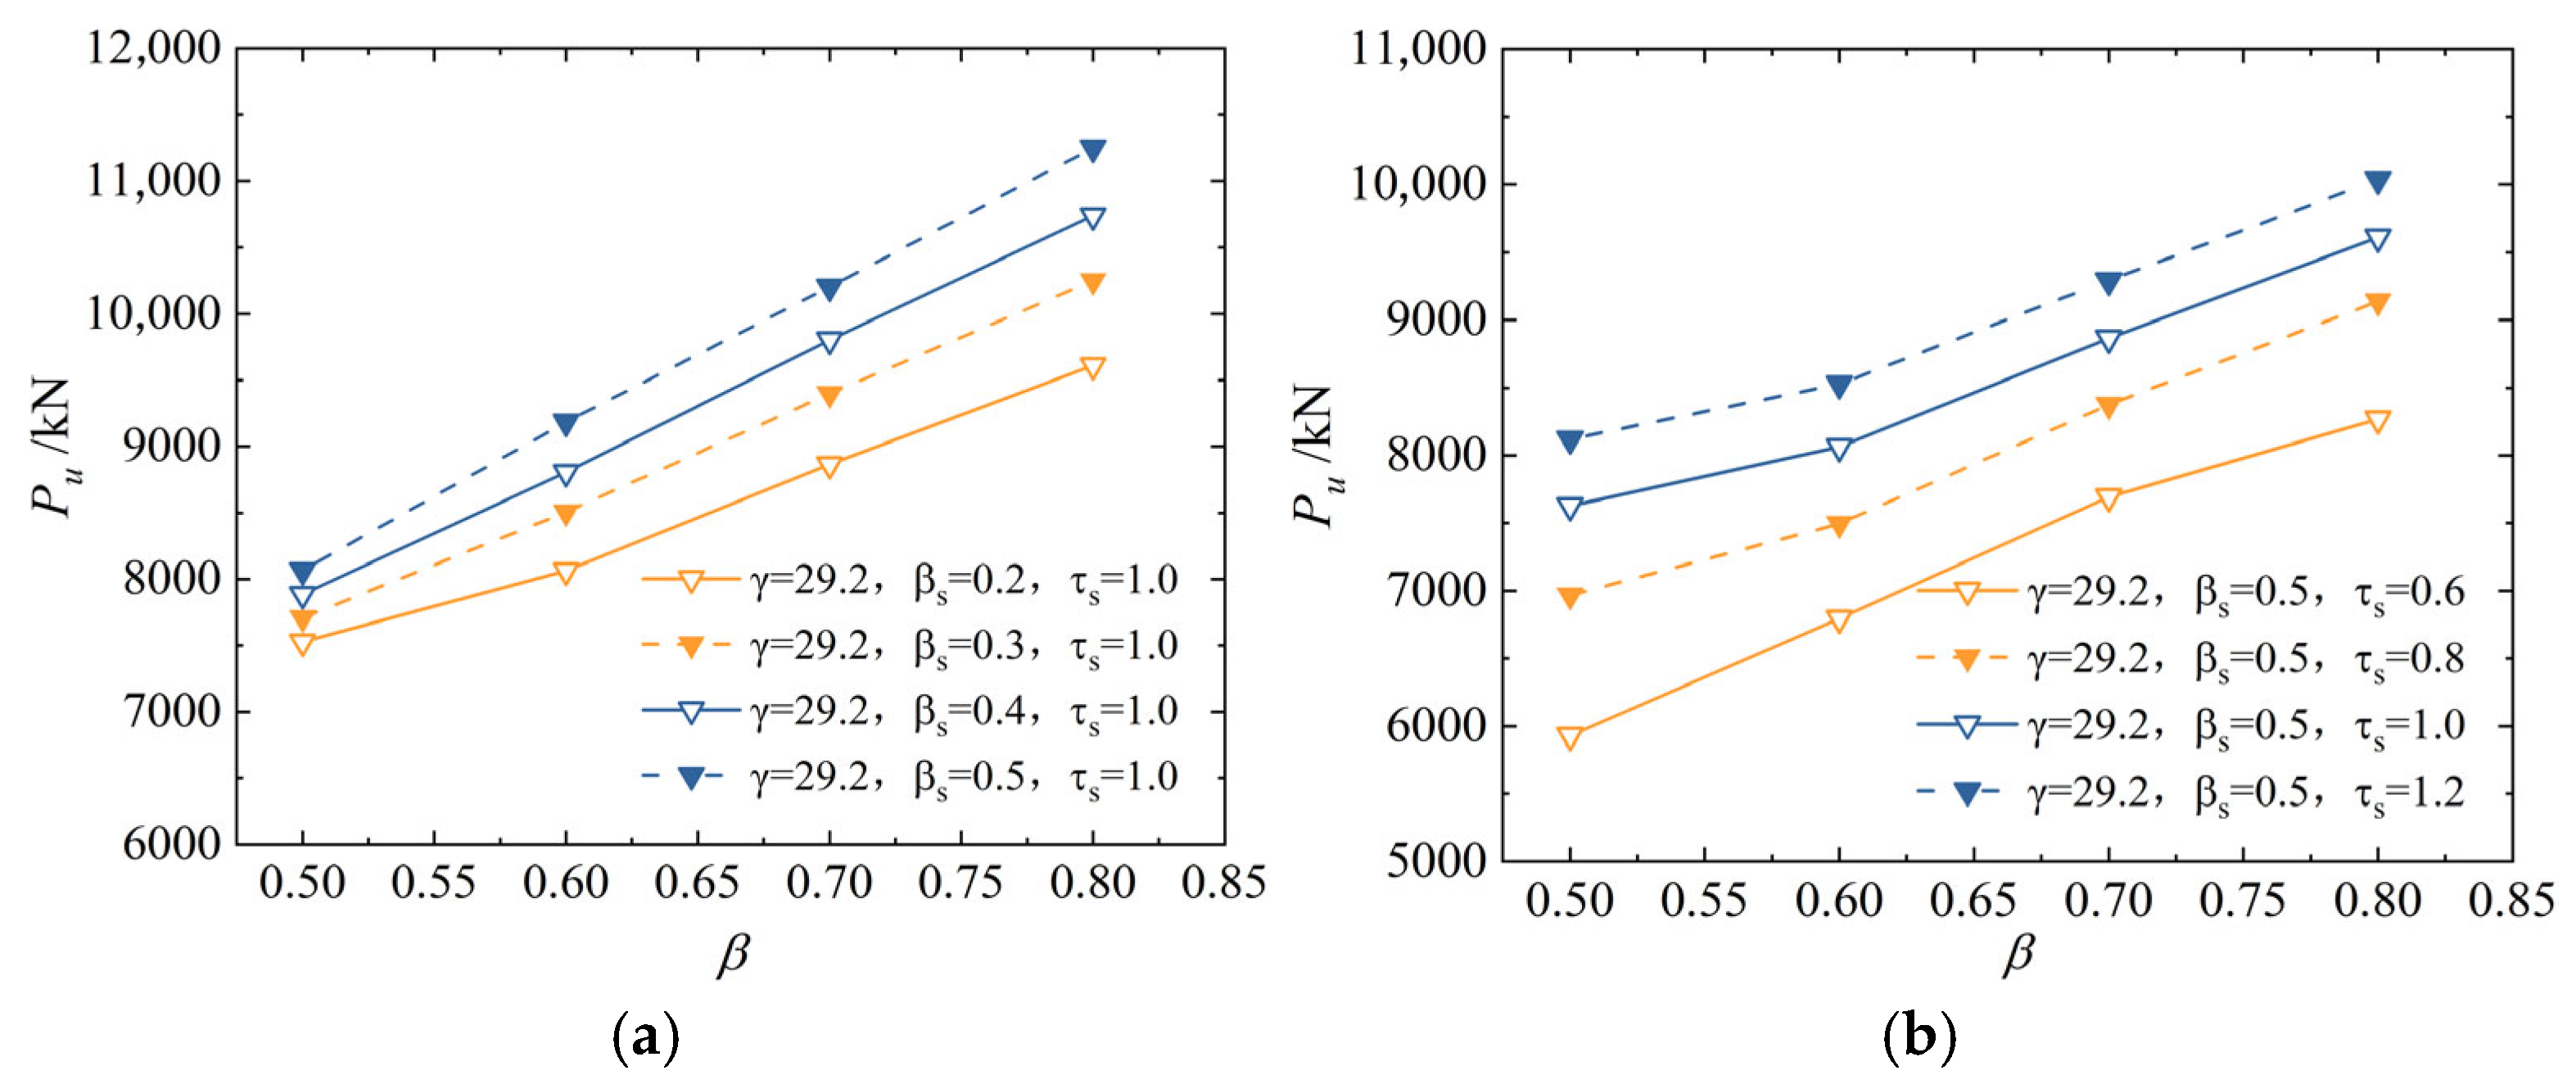
Figure 20 presents the variation of the ultimate bearing capacity Pu of the TY composite tubular joint with the branch-to-main pipe diameter ratio β. As can be seen from Figure 20a, the curves show a consistent trend for different values of βs: Pu increases with the increase of β, and the growth amplitude of Pu increases as βs becomes larger. Figure 20b shows the variation of Pu when τs is 0.6, 0.8, 1.0, and 1.2 respectively. The four curves exhibit a consistent trend: Pu increases with the increase of β. In addition, when β > 0.68, the value of Pu increases rapidly, indicating that joints with a larger β have a better stiffening effect.

6.3. Influence of Gusset Plate Thickness Ratio τ

Figure 21 illustrates the influence law of the gusset plate thickness ratio τ on the ultimate bearing capacity Pu of the joint. As can be seen from Figure 21: Pu increases proportionally with τ in an approximately linear relationship, and it also shows a positive correlation with βs and τs. After the gusset plate is added, it shares the axial force on the branch pipe.

6.4. Influence of Stiffener Thickness Ratio τs

Figure 22 demonstrates the law governing the influence of the thickness ratio of external stiffening ribs τs on the ultimate bearing capacity Pu of the joint. It can be concluded from Figure 22 that for different values of β and βs, Pu increases with the increase of τs, with similar slope changes, indicating a positive correlation between Pu and β, βs. When τs > 1.0, the slope of the curve tends to decrease. This is because the axial force applied to the branch pipe of the stiffened joint is transmitted to the main pipe through the branch pipe, gusset plate, and stiffening ribs. As τs increases, the stiffness of the stiffening ribs increases, leading to an improvement in bearing capacity. However, local yielding of the branch pipe occurs first, which prevents the joint bearing capacity from continuing to increase linearly.

6.5. Influence of Stiffener Height Ratio βs

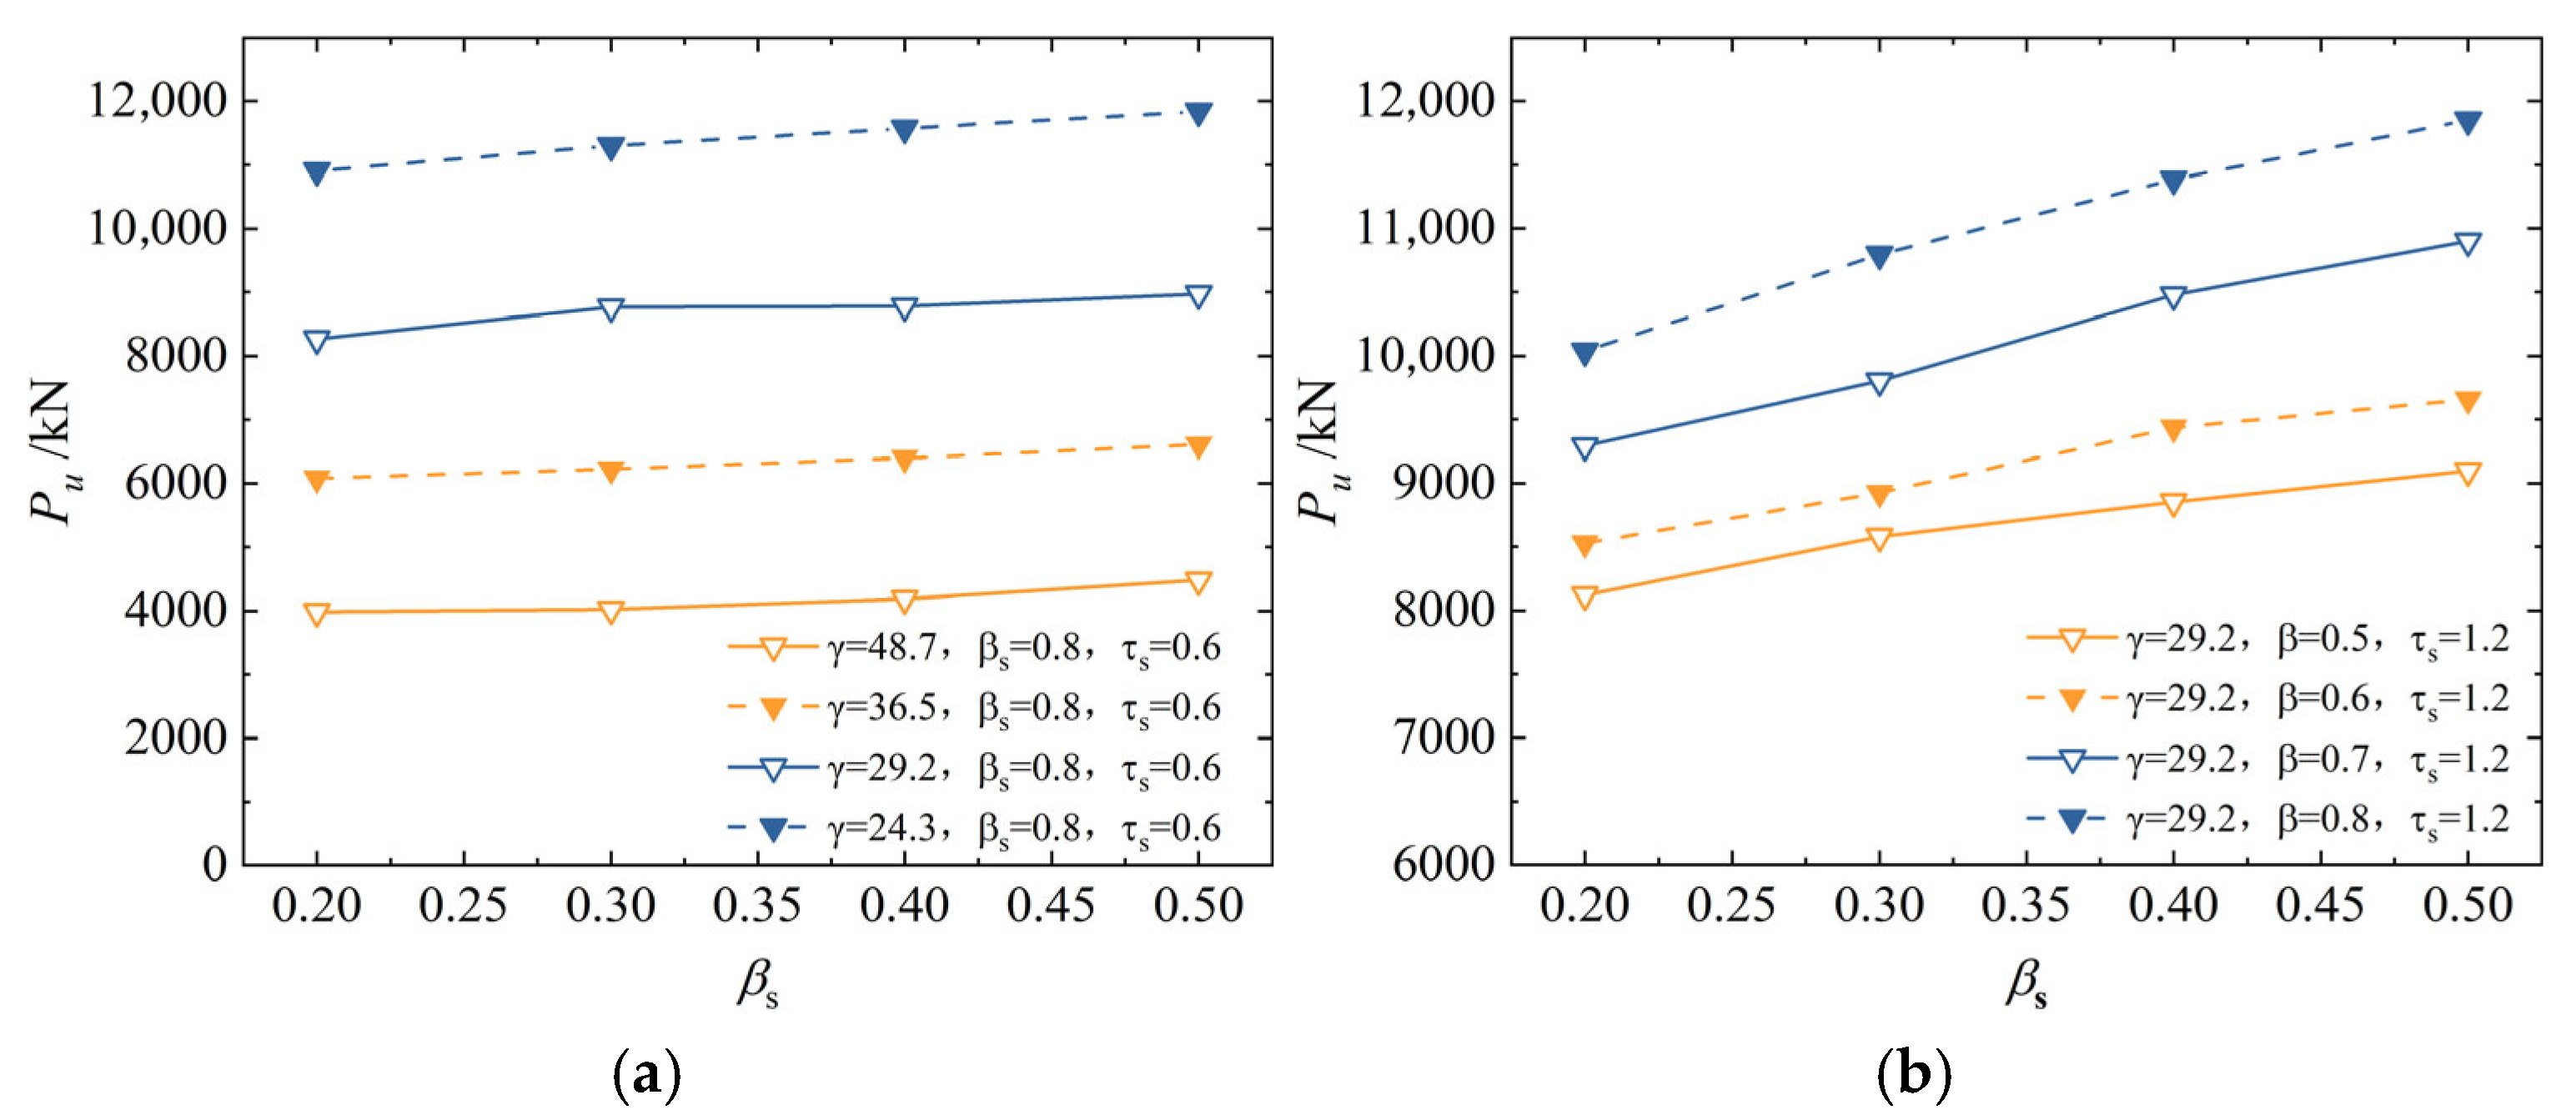
Figure 23 illustrates the law governing the influence of the height ratio of external stiffening ribs βs on the ultimate bearing capacity Pu of the joint. Under different conditions of β and γ, the ultimate bearing capacity increases with the increase of βs. As shown in Figure 23a, when τs is 0.6, the joint bearing capacity changes slightly with the variation of βs. This is because the contribution of external stiffening ribs to the improvement of joint bearing capacity is mainly provided by the flexural stiffness of the stiffening ribs, and the flexural stiffness of external stiffening ribs is mainly controlled by the thickness factor. Therefore, when τs is small, the flexural stiffness of the stiffening ribs is relatively low, resulting in an insignificant change in bearing capacity with the variation of βs. Figure 23b shows that the larger the value of β, the more significant the influence of βs on Pu. When β is larger, the intersection area between the branch pipe and the main pipe is larger, the load concentration effect is stronger, and the constraint effect of the stiffening ribs is enhanced accordingly. Thus, the improvement effect of βs on the ultimate bearing capacity Pu becomes more significant.

6.6. Influence of Angle Ratio Between Inclined Branch Pipe and Main Pipe θ

Figure 24a illustrates the law governing the influence of the angle θ between the inclined branch pipe and the main pipe on the ultimate bearing capacity Pu of the joint. When γ is 24.3 and 48.7, β is 0.5 and 0.8, and the thickness ratio of stiffening ribs τ is 0.6 and 1.2, the branch pipe angle within the range of 45–90° has little effect on the ultimate bearing capacity of the joint. The differences in ultimate bearing capacity of the joint between 45° and 90° are 2.5% and 3.1% respectively. This indicates that after the gusset plate and stiffening ribs have sufficient strength, they can reduce the impact of the branch pipe angle on the ultimate bearing capacity.

6.7. Influence of Axial Compression Ratio of Main Pipe n

Figure 24b illustrates the law governing the influence of different axial compression ratios n on the ultimate bearing capacity Pu of the joint. When β and τs are 0.6 and 1.2 respectively, Pu decreases as n increases, and the external stiffening ribs enhance the influence of n on Pu. When n ≤ 0.4, the influence of n on Pu is relatively small; however, after n ≥ 0.4, Pu shows a significant decrease.

7. Calculation of Ultimate Bearing Capacity

Based on the analysis of joint failure and the results of 7 groups of dimensionless parameters, this paper proposes a method for calculating the ultimate bearing capacity of composite externally stiffened intersecting joints. Its calculation consists of three parts: unstiffened joints, gusset plates, and external stiffeners.
N u   = N 0   ( β , γ , θ , n ) + Δ N 1   ( τ ) + Δ N 2   ( τ s   , β s   )
where Nu is the ultimate bearing capacity of the composite stiffened joint; N0 is the ultimate bearing capacity of the unstiffened joint; ΔN1 is the bearing capacity increment of the joint contributed by the gusset plate; ΔN2 is the bearing capacity increment of the joint contributed by the stiffener ribs.
The calculation for each part is as follows [23]:
N 0 ( β , γ , θ , n ) = f y T 2 7.49 1 0.81 β γ 0.1 ( sin θ ) c ( 1 kn d )
Δ N 1   ( τ ) = f y T 2 C p f y , p f y α τ e
Δ N 2 ( τ s , β s ) = f y T 2 C r f y , s f y α 1 τ s f β s g
where fy is the yield strength of the main pipe; k is the reduction factor; fy,p is the yield strength of the gusset plate; fy,s is the yield strength of the stiffener; Cp and Cr are regression coefficients; c, d, e, g, α and α 1 are regression exponents.
Normalizing Equations (4) to (6) with fyT2:
N u f y T 2 = 7.49 1 0.81 β γ 0.1 ( sin θ ) c 1 k n d + C p f y , p f y α τ e + C r f y , s f y α 1 τ s f β s g
According to the parameter selection range: 0.5 ≤ β ≤ 0.8, 24.3 ≤ γ ≤ 48.7, 0.6 ≤ τp ≤ 0.8, 0.08 ≤ βs ≤ 0.25, 0 ≤ n ≤ 0.4, and combined with nonlinear least squares regression, the calculation formula for the ultimate bearing capacity of the composite externally stiffened tubular joint is obtained as follows:
N u = f y T 2 7.49 1 0.81 β γ 0.1 sin θ 0.183 1 0.231 n 1.498 + 0.0088 f y , p f y τ 0.67 + 2.15 f y , s f y α s τ s 3 β s 1.033
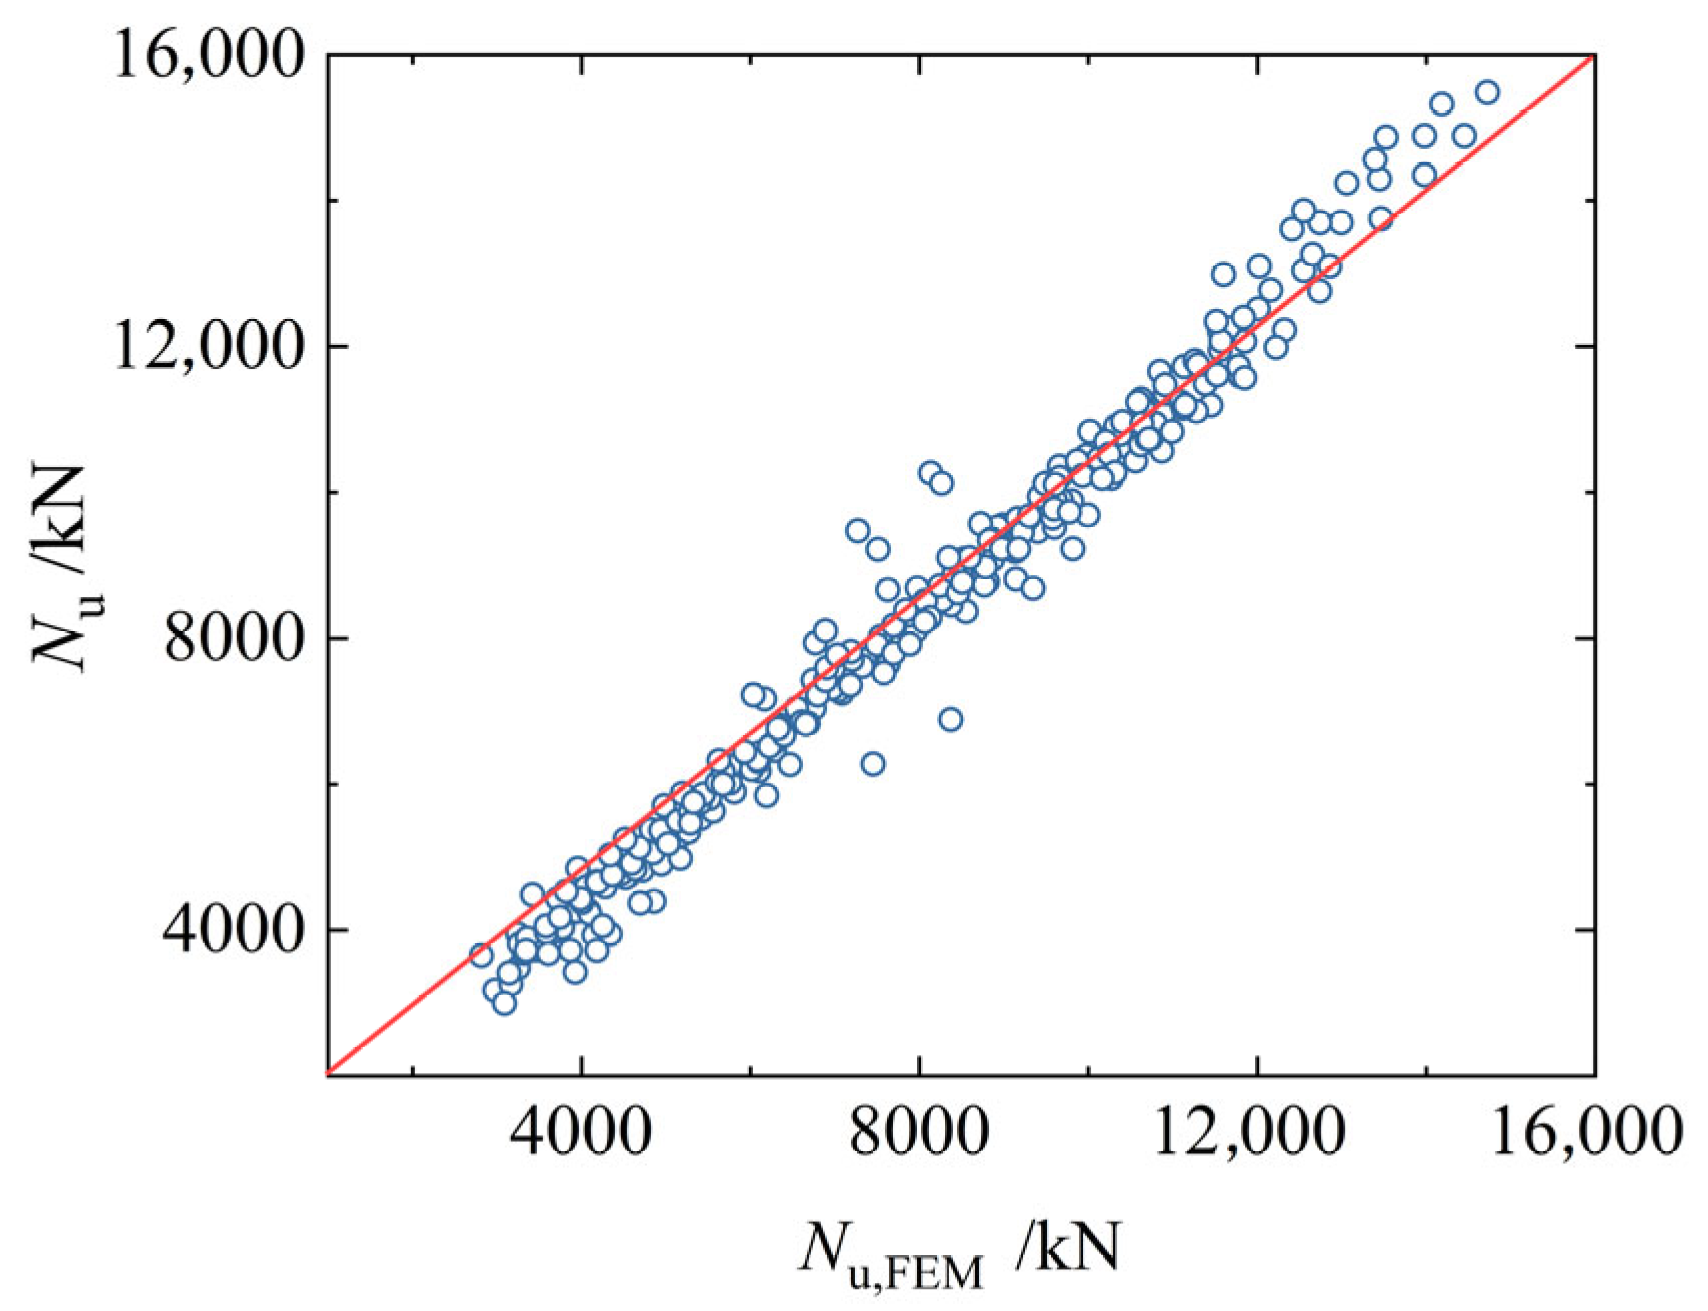
To further verify the accuracy of Equation (8), this paper compares the bearing capacity Nu calculated by Equation (8) with the bearing capacity Nu,FEM obtained from finite element simulation. The results are shown in the Figure 25. In the figure, the abscissa represents the ultimate bearing capacity Nu,FEM obtained from finite element calculation, and the ordinate represents the result Nu derived from the formula. It can be seen from the figure that the results are basically distributed around the 45° reference line. By selecting the dimensionless parameter Nu/Nu,FEM for statistics, the mean value is 1.028 and the variance is 0.004.

8. Engineering Implications

Compared with unstiffened joints or gusset-plate-stiffened joints, composite externally stiffened joints integrate gusset plates and stiffeners. As a result, the welding operation space in the intersecting area is relatively narrow, and the requirement for component positioning accuracy is higher. Moreover, stress concentration is prone to occur in the cross-area of multiple welds. Therefore, it is recommended that during the engineering design stage, BIM technology be used to simulate the construction process in advance to optimize the arrangement spacing of stiffeners and the form of welding grooves. Meanwhile, for the complex welds in the core area of the joint, prefabrication and processing can be completed in the factory, leaving only on-site assembly and connection. This not only improves construction efficiency but also ensures welding quality.
From the perspective of cost composition, composite stiffened joints increase material costs due to the increased steel consumption of stiffening components and increase processing costs due to the increased processing man-hours caused by complex structures. However, in engineering scenarios with high loads and large spans, their ultimate bearing capacity is increased by 126.8% compared with unstiffened joints and by 38.6% compared with gusset-plate-stiffened joints. This can reduce the number of joints or reduce the cross-sectional size of components, thereby indirectly reducing the overall structural cost. At the same time, composite externally stiffened joints optimize the stress distribution through multi-path force transmission, reducing stress concentration in the core area of the joint. During long-term service, the risk of cracking is lower than that of traditional joints, which can greatly reduce the frequency of inspections and maintenance costs, such as avoiding structural outage losses caused by joint reinforcement. In engineering decision-making, attention should not only be paid to the initial construction cost, but also full-life-cycle cost analysis should be incorporated. Especially in projects that require long-term service, such as transmission towers, the long-term economic benefits of composite stiffened joints are more significant.
To avoid over-design, composite externally stiffened joints are more suitable for the following scenarios: first, joints with complex load conditions; second, structures with high requirements for joint reliability; third, areas where the cross-sectional size of components cannot be increased due to space constraints and the bearing capacity of joints needs to be improved through stiffening. This study has important engineering implications and research significance for such long-span transmission lines.

9. Conclusions

This study conducts experimental research on three different TY-type intersecting joints. Taking TY-TWO-1 as the base model, a total of 256 parameter-related models are established for 7 types of dimensionless parameters. Numerical simulation is used to further study the composite stiffening of gusset plates and stiffeners for TY-type joints, exploring the influence of geometric parameters of tubular joints on the ultimate bearing capacity of composite stiffened intersecting joints, and analyzing the failure modes, strain distribution and development laws of the joints under different geometric parameters. The specific conclusions are as follows:
(1)
Through static tests on three types of intersecting joints: unstiffened, gusset plate stiffened, and composite stiffened, it is found that stiffening measures can effectively enhance the ultimate bearing capacity and initial stiffness of the joints. Among them, the ultimate bearing capacity of the composite stiffened specimen (TY-TWO-1) is increased by 126.8% compared with the unstiffened specimen (TY-1). The failure form of the joint presents a failure mechanism dominated by local buckling of the main pipe caused by the transition of force transmission from the branch pipe to the main pipe. Stiffening components play a role in delaying the expansion of the buckling surface and sharing the load.
(2)
The failure modes of unstiffened and composite externally stiffened joints are basically similar, both failing due to excessive plastic deformation caused by yielding at the intersecting area and side walls of the main pipe surface. Specifically, the gusset plate buckles when it fails, and the external stiffener undergoes local out-of-plane buckling when it fails. The overall failure form meets the design principle of “strong joint and weak member”. The improvement in the ultimate bearing capacity of externally stiffened joints is attributed to the combined action of gusset plates and external stiffeners, which increases the overall stiffness of the joint and restricts local deformation on the main pipe surface.
(3)
Analysis of finite element results with different geometric parameters shows that: the diameter–thickness ratio of the main pipe, the diameter ratio of branch pipe to main pipe, the thickness ratio of gusset plate, the width ratio and height ratio of external stiffeners, and the axial compression ratio of the main pipe all have significant impacts on the ultimate bearing capacity of the joint. The ultimate bearing capacity of the joint increases with the increase of main pipe thickness, branch-to-main pipe diameter ratio, stiffener thickness and height, and gusset plate thickness. The constraint effect of gusset plates and stiffeners can reduce the influence of the angle between the branch pipe and main pipe on the ultimate bearing capacity.

Author Contributions

Conceptualization, Q.S. and Q.G.; methodology, Q.S.; software, Q.D.; validation, M.Z. and Y.L.; formal analysis, X.G.; investigation, F.W.; resources, Q.S.; data curation, Q.D.; writing—original draft preparation, Q.G.; writing—review and editing, X.G.; visualization, M.Z.; supervision, Y.L.; project administration, F.W.; funding acquisition, M.Z. All authors have read and agreed to the published version of the manuscript.

Funding

This work is supported by the Science and Technology Project of Northwest Electric Power Design Institute Co., Ltd. under Grant No. NW-RD012-2023.

Data Availability Statement

Data are contained within the article.

Conflicts of Interest

M.Z., Y.L. and F.W. are employed by Northwest Electric Power Design Institute Co., Ltd. of China Power Engineering Consulting Group. The remaining authors declare that the research was conducted in the absence of any commercial or financial relationships that could be construed as a potential conflict of interest. The authors declare that this study received funding from Northwest Electric Power Design Institute Co., Ltd. The funder was not involved in the study design, collection, analysis, interpretation of data, the writing of this article or the decision to submit it for publication.

References

  1. Dong, Y.; Ning, X.; Han, T.; Hou, H.; Zang, M.; Lu, H.; He, X. Triethanolamine assisted ball milling activation of high alumina fly ash: Grinding kinetics, activation mechanism. Ceram. Int. 2025, 51, 4168–4177. [Google Scholar] [CrossRef]
  2. Tong, L.; Wang, Y.; Gao, L.; Shi, W.; Gao, F. Comparative study of different strengthening methods for circular hollow section K-joints. J. Constr. Steel Res. 2024, 217, 108668. [Google Scholar] [CrossRef]
  3. Nassiraei, H.; Rezadoost, P. Local joint flexibility of tubular X-joints stiffened with external ring or external plates. Mar. Struct. 2021, 80, 103085. [Google Scholar] [CrossRef]
  4. Zhu, H.; Shao, Y.; Chi, G.; Gao, X.; Li, K. Simplified bar-system model for tubular structures by considering local joint flexibility. Mar. Struct. 2022, 81, 103122. [Google Scholar] [CrossRef]
  5. Iqbal, M.; Karuppanan, S.; Perumal, V.; Ovinis, M.; Rasul, A. Rehabilitation techniques for offshore tubular joints: A review. J. Mar. Sci. Eng. 2023, 11, 461. [Google Scholar] [CrossRef]
  6. Karuppanan, S.; Perumal, V.; Iqbal, M.; Ovinis, M.; Rasul, A. Ultimate Strength of Internal Ring-Reinforced KT-Joints under Brace Axial Compression. Civil Eng. J. 2024, 10, 1543–1560. [Google Scholar]
  7. Ahmadi, H.; Alinezhad, R.; Atalo, A.A. Stress Concentration Analysis of Internally Ring-Stiffened Two-Planar Tubular KK-Joints. Ships Offshore Struct. 2022, 17, 2203–2217. [Google Scholar] [CrossRef]
  8. Sun, Q.; Qu, S.; Wu, X. Ultimate Load Capacity Analysis of Q690 High-Strength Steel KK-Type Tube-Gusset Plate Connections. J. Struct. Eng. 2019, 145, 04019074. [Google Scholar] [CrossRef]
  9. Deng, P.; Chen, Y.; Zhu, Z.; Liu, Y.; Zhao, S.; Guo, J. Structural behaviour of FRP-reinforced tubular T-joint subjected to combined in-plane bending and axial load. Buildings 2024, 14, 412. [Google Scholar] [CrossRef]
  10. Osman, A.; Gerguis, P.; Gaawan, S. Performance of externally reinforced CHS X-joints subjected to axial loads. J. Eng. Appl. Sci. 2023, 70, 38. [Google Scholar] [CrossRef]
  11. Nassiraei, H.; Rezadoost, P. Stress concentration factors in tubular T-joints reinforced with external ring under in-plane bending moment. Ocean Eng. 2022, 266, 112551. [Google Scholar] [CrossRef]
  12. Diao, Y.; He, S.; Wang, Y.; Tu, L. Experimental and numerical investigations on stress concentration factors of concrete filled steel tube X-joints. Sci. Rep. 2024, 14, 11415. [Google Scholar] [CrossRef]
  13. Nassiraei, H.; Rezadoost, P. Probabilistic analysis of the ultimate strength of tubular X-joints stiffened with outer ring at ambient and elevated temperatures. Ocean Eng. 2022, 248, 110744. [Google Scholar] [CrossRef]
  14. Nassiraei, H.; Yara, A. Local joint flexibility of tubular K-joints reinforced with external plates under in-plane bending loads. Mar. Struct. 2022, 84, 103199. [Google Scholar] [CrossRef]
  15. Nassiraei, H.; Rezadoost, P. Static capacity of tubular X-joints reinforced with fiber reinforced polymer subjected to compressive load. Eng. Struct. 2021, 236, 112041. [Google Scholar] [CrossRef]
  16. Wang, K.; Wang, Y.; Gao, S.; Wang, B.; Chen, J.; Luo, P. Experimental study of hot spot stress for spatial CHS KK-joints. J. Mar. Sci. Eng. 2023, 11, 1432. [Google Scholar] [CrossRef]
  17. Zhang, Y.; Wang, H.; Zheng, S.; Liu, L.; Wu, D. Parametric Modeling and Interpretable Machine-Learning Prediction on Ultimate Load-Carrying Capacity of a Circular Hollow Section X-Joint. Front. Struct. Civ. Eng. 2025, 19, 1287–1304. [Google Scholar] [CrossRef]
  18. GB/T 228.1-2021; Metallic Materials—Tensile Testing—Part 1: Method of Test at Room Temperature. Standards Press of China: Beijing, China, 2022. (In Chinese)
  19. Gao, C.; Zhang, D.; Cui, M.; Peng, P. Bearing Capacity Test and Calculation Theory on CHS X-Joints Stiffened with Joint-Plates. KSCE J. Civ. Eng. 2022, 26, 848–864. [Google Scholar] [CrossRef]
  20. Asgari, M.; Kouchakzadeh, M.A. An equivalent von Mises stress and corresponding equivalent plastic strain for elastic-plastic ordinary peridynamics. Meccanica 2019, 54, 1001–1014. [Google Scholar] [CrossRef]
  21. Wu, Y.; Li, J. Temperature and stress of RC T-beam under different heating curves. J. Build. Eng. 2022, 46, 103620. [Google Scholar] [CrossRef]
  22. Qu, H.; Shi, W.; Li, G. Experimental Study on Tubular K-Joints under Impact Loadings. J. Constr. Steel Res. 2015, 110, 136–150. [Google Scholar] [CrossRef]
  23. Sawada, Y.; Idogaki, S.; Sekita, K. Static and fatigue tests on T-joints stiffened by an internal ring. In Proceedings of the Offshore Technology Conference, Houston, TX, USA, 30 April–3 May1979; One Petro: Richardson, TX, USA, 1979. [Google Scholar]
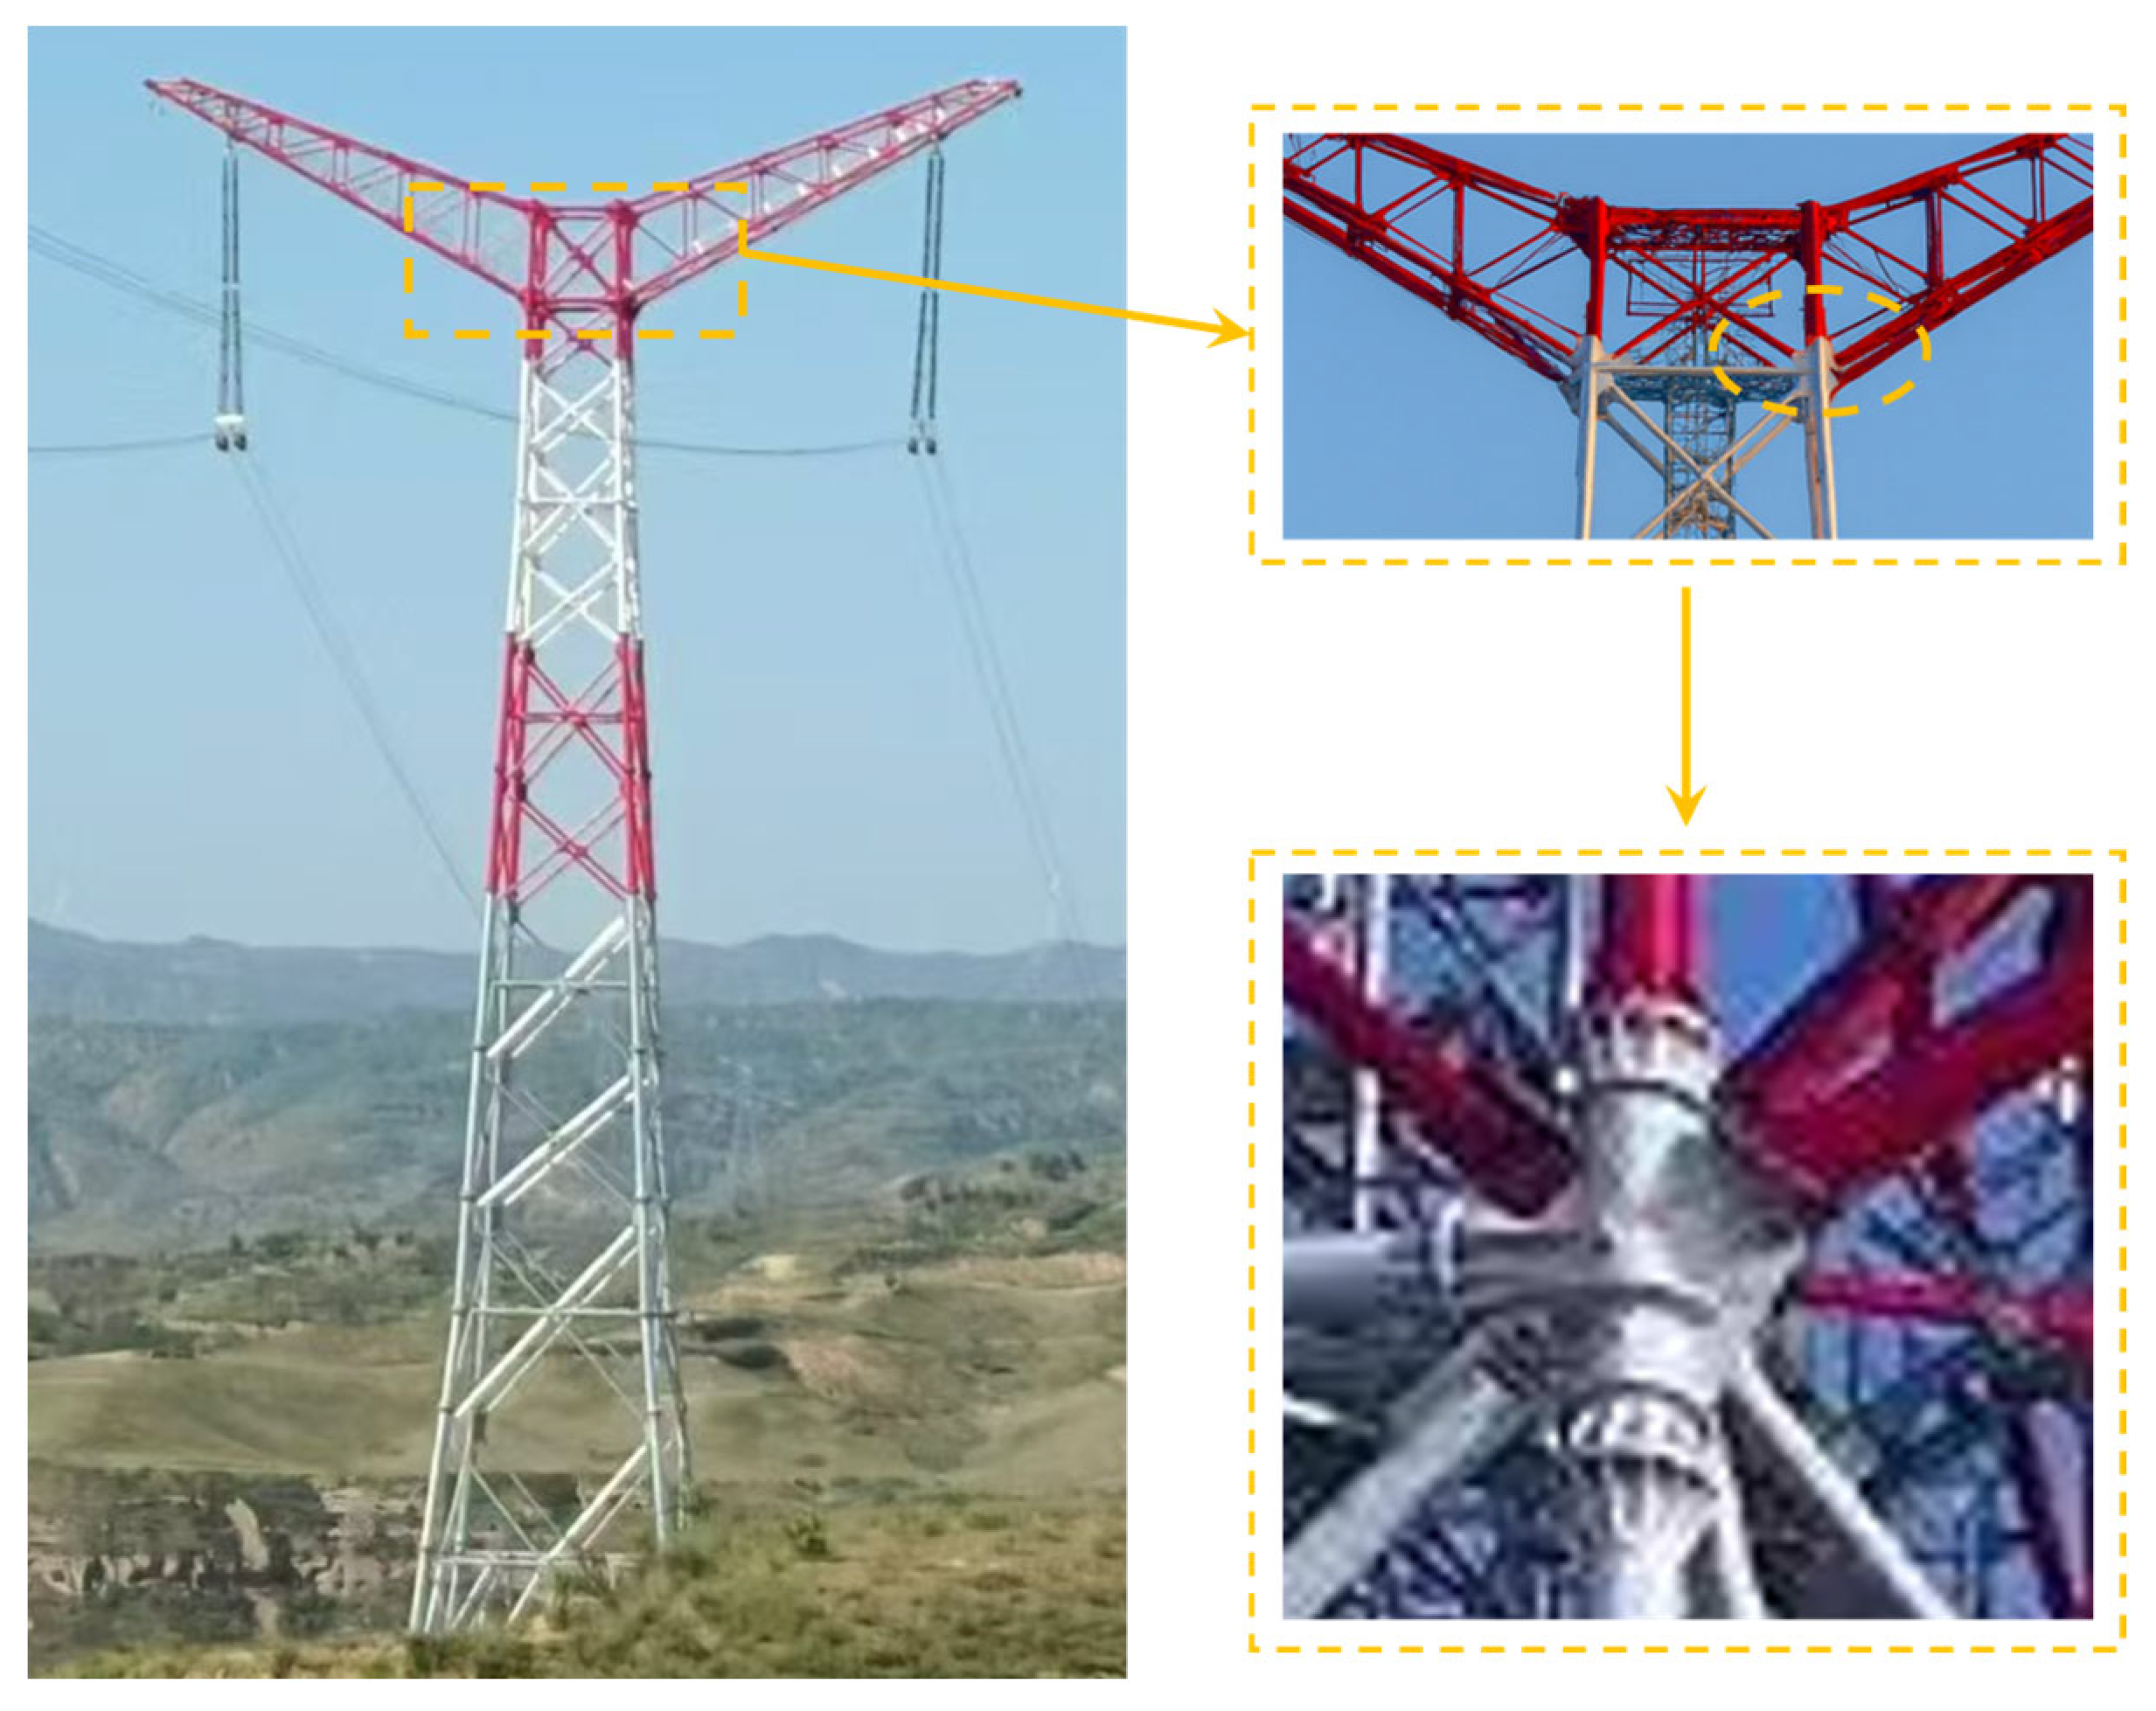
Figure 1. Schematic diagram of the steel tube tower and its intersecting joints.
Buildings 15 03397 g001
Figure 2. Research technical roadmap.
Buildings 15 03397 g002
Figure 3. Geometric details of the joints. (a) Gusset plate-stiffened tubular joint; (b) Gusset plate 2; (c) End plate 1; (d) End plate 2; (e) Stiffener 1, 2, 3; (f) External stiffening rib; (g) Gusset plate 1; (h) Gusset plate 3.
Buildings 15 03397 g003
Figure 4. Loading of material property tests.
Buildings 15 03397 g004
Figure 5. Experimental setup for joints. (a) Schematic picture; (b) Experiment picture.
Buildings 15 03397 g005
Figure 6. Physical diagram of the joints. (a) TY-1; (b) TY-JDB-1; (c) TY-TWO-1.
Buildings 15 03397 g006
Figure 7. Arrangement of displacement transducers and strain gauges.
Buildings 15 03397 g007
Figure 8. Failure model of TY-1. (a) Overall failure; (b) Joint core area; (c) Intersection area of the main pipe.
Buildings 15 03397 g008
Figure 9. Failure model of TY-JDB-1. (a) Overall failure; (b) Joint core area; (c) Gusset plate 1 buckling; (d) Gusset plate 2 buckling; (e) Gusset plate 3 buckling; (f) Gusset plate 4 buckling.
Buildings 15 03397 g009
Figure 10. Failure model of TY-TWO-1. (a) Overall failure; (b) Joint core area; (c) Gusset plate 1 buckling; (d) Gusset plate 2 buckling; (e) Gusset plate 3 buckling; (f) Gusset plate 4 buckling.
Buildings 15 03397 g010
Figure 11. Specimen load–displacement curve.
Buildings 15 03397 g011
Figure 12. Strain distribution of Specimen TY-1. (a) Strain of the main pipe along direction A of the intersecting line of the straight branch pipe; (b) Strain of the main pipe along direction B of the surface length of the main pipe sidewall; (c) Strain of the main pipe along direction C of the intersecting line of the inclined branch pipe; (d) Strain of the branch pipe along the direction of the intersecting line. Note: The red dashed lines in the figure represent the material yield strain measured in the material property test.
Buildings 15 03397 g012aBuildings 15 03397 g012b
Figure 13. Strain results of key measuring points of specimen TY-JDB-1. (a) Strain of the main pipe along direction A of the intersecting line of the straight branch pipe; (b) Strain of the main pipe along direction B of the surface length of the main pipe sidewall; (c) Strain of the main pipe along direction c of the intersection line of the inclined branch pipe; (d) Strain of the gusset plate of the straight branch pipe; (e) Strain of the gusset plate of the inclined branch pipe; (f) Strain of the branch pipe along the direction of the intersecting line.
Buildings 15 03397 g013aBuildings 15 03397 g013b
Figure 14. Strain results of key measuring points of specimen TY-TWO-1. (a) Strain of the main pipe along direction A of the intersecting line of the straight branch pipe; (b) Strain of the main pipe along direction B of the surface length of the main pipe sidewall; (c) Strain of the main pipe along direction c of the intersection line of the inclined branch pipe; (d) Strain of the gusset plate of the straight branch pipe; (e) Strain of the stiffening rib.
Buildings 15 03397 g014aBuildings 15 03397 g014b
Figure 15. Finite element joint. (a) Mesh; (b) Boundary conditions.
Buildings 15 03397 g015
Figure 16. Results comparison of TY-1. (a) Failure mode of the specimen; (b) Failure mode of the finite element model; (c) Load–displacement curve.
Buildings 15 03397 g016
Figure 17. Results comparison of TY-JDB-1. (a) Failure mode of the specimen; (b) Failure mode of the finite element model; (c) Load–displacement curve.
Buildings 15 03397 g017
Figure 18. Results comparison of TY-TWO-1. (a) Failure mode of the specimen; (b) Failure mode of the finite element model; (c) Load–displacement curve.
Buildings 15 03397 g018
Figure 19. Influence of γ on the ultimate bearing capacity. (a) Different values of βs; (b) Different values of τs.
Buildings 15 03397 g019
Figure 20. Influence of β on the ultimate bearing capacity. (a) Different values of βs; (b) Different values of τs.
Buildings 15 03397 g020
Figure 21. Influence of τ on the ultimate bearing capacity. (a) Different values of βs; (b) Different values of τs.
Buildings 15 03397 g021
Figure 22. Influence of τs on the ultimate bearing capacity. (a) Different values of β; (b) Different values of βs.
Buildings 15 03397 g022
Figure 23. Influence of βs on the ultimate bearing capacity. (a) Different values of γ; (b) Different values of β.
Buildings 15 03397 g023
Figure 24. Influence of θ and n on the ultimate bearing capacity. (a) θ; (b) n.
Buildings 15 03397 g024
Figure 25. Comparison between the predictive formula and finite element analysis results.
Buildings 15 03397 g025
Table 1. Parameters of specimen.
Specimen NumberD (mm)t (mm)d (mm)t1 (mm)tp (mm)ts (mm)hs (mm)
TY-1325102608---
TY-JDB-18--
TY-TWO-1888
Table 2. Results of material property tests.
Steel TypeYield Strength
fy (MPa)
Tensile Strength
fu (MPa)
Elastic Modulus
Es (105 MPa)
Elongation After Fracture
δ (%)
Q420-10 mm459.9589.7188.223.3
Q420-8 mm549.2604.7208.321.3
Q355-8 mm409.2559.6218.125.5
Table 3. Summary table of specimen ultimate bearing capacity.
Specimen NumberUltimate Bearing Capacity (kN)Improvement Ratio Compared to Unstiffened SpecimenImprovement Ratio
Compared to Gusset
Plate-Stiffened Specimen
TY-1918--
TY-JDB-1150263.6%-
TY-TWO-22082126.8%38.6%
Table 4. Geometric parameters in the influencing factor analysis.
Geometric ParametersParameter Range
β = d/D0.5, 0.6, 0.7, 0.8
γ = D/T24.3, 29.2, 36.5, 48.7
τ = tp/T0.6, 0.8, 1.0, 1.2
βs = hs/D0.2, 0.3, 0.4, 0.5
τs = ts/T0.6, 0.8, 1.0, 1.2
θ45, 60, 75, 90
n0, 0.2, 0.4, 0.6, 0.8, 1.0
Disclaimer/Publisher’s Note: The statements, opinions and data contained in all publications are solely those of the individual author(s) and contributor(s) and not of MDPI and/or the editor(s). MDPI and/or the editor(s) disclaim responsibility for any injury to people or property resulting from any ideas, methods, instructions or products referred to in the content.