Visualizing ESG Performance in an Integrated GIS–BIM–IoT Platform for Strategic Urban Planning
Abstract
1. Introduction
- Establishment of a green-city-oriented ESG indicator system: Recognizing the inadequacy of corporate-focused ESG indicators in reflecting the sustainability challenges at the urban scale, this study develops a city-level ESG evaluation index system grounded in international standards such as ISO 37120 [10], the UN-Habitat City Prosperity Index (CPI) [11], and green building certifications. Unlike traditional frameworks that emphasize isolated domains or static evaluation, the proposed system introduces clearly defined indicators across the Environmental, Social, and Governance dimensions, aligned with urban planning objectives. The weighting mechanism incorporates expert knowledge, which provides informed judgment in situations where large-scale urban datasets are lacking. This ensures the evaluation system is both grounded in professional insight and practically relevant, thereby enhancing its capacity to guide local strategy formulation.
- Design of an integrated semantic data model for ESG assessment: Existing urban sustainability frameworks often suffer from fragmented data representations and lack a common structure to interconnect physical infrastructure, environmental conditions, and social services. This study addresses this gap by designing a semantically integrated data model that bridges ESG indicators with established GIS, BIM, and IoT data structures. The model defines a set of unified types, attributes, and relational schemas that enable multi-domain knowledge representation. This integration not only enhances data interoperability across sectors but also establishes a formal foundation for reasoning and indicator inference, overcoming the semantic inconsistency and data silos prevalent in traditional urban data systems.
- Implementation of a real-time, multi-scale ESG evaluation and visualization framework: This study implements a unified evaluation framework to address the limitations of existing ESG systems, which often rely on static and fragmented data, making them inadequate for capturing the dynamic and multi-scale nature of urban sustainability. The proposed framework enables the continuous integration of heterogeneous data sources across spatial, semantic, and sensor dimensions, transforming them into actionable ESG insights. By combining semantic enrichment with real-time visualization, the system not only supports up-to-date, location-aware indicator inference but also provides decision-makers with interactive, multi-scale ESG assessments, thereby shifting ESG evaluation from a passive reporting tool to a strategic instrument aligned with the evolving demands of green city governance.
2. Literature Review
2.1. Digital Twin Application in ESG
2.2. Urban Sustainability Assessment Frameworks
2.3. Heterogeneous Data Integration
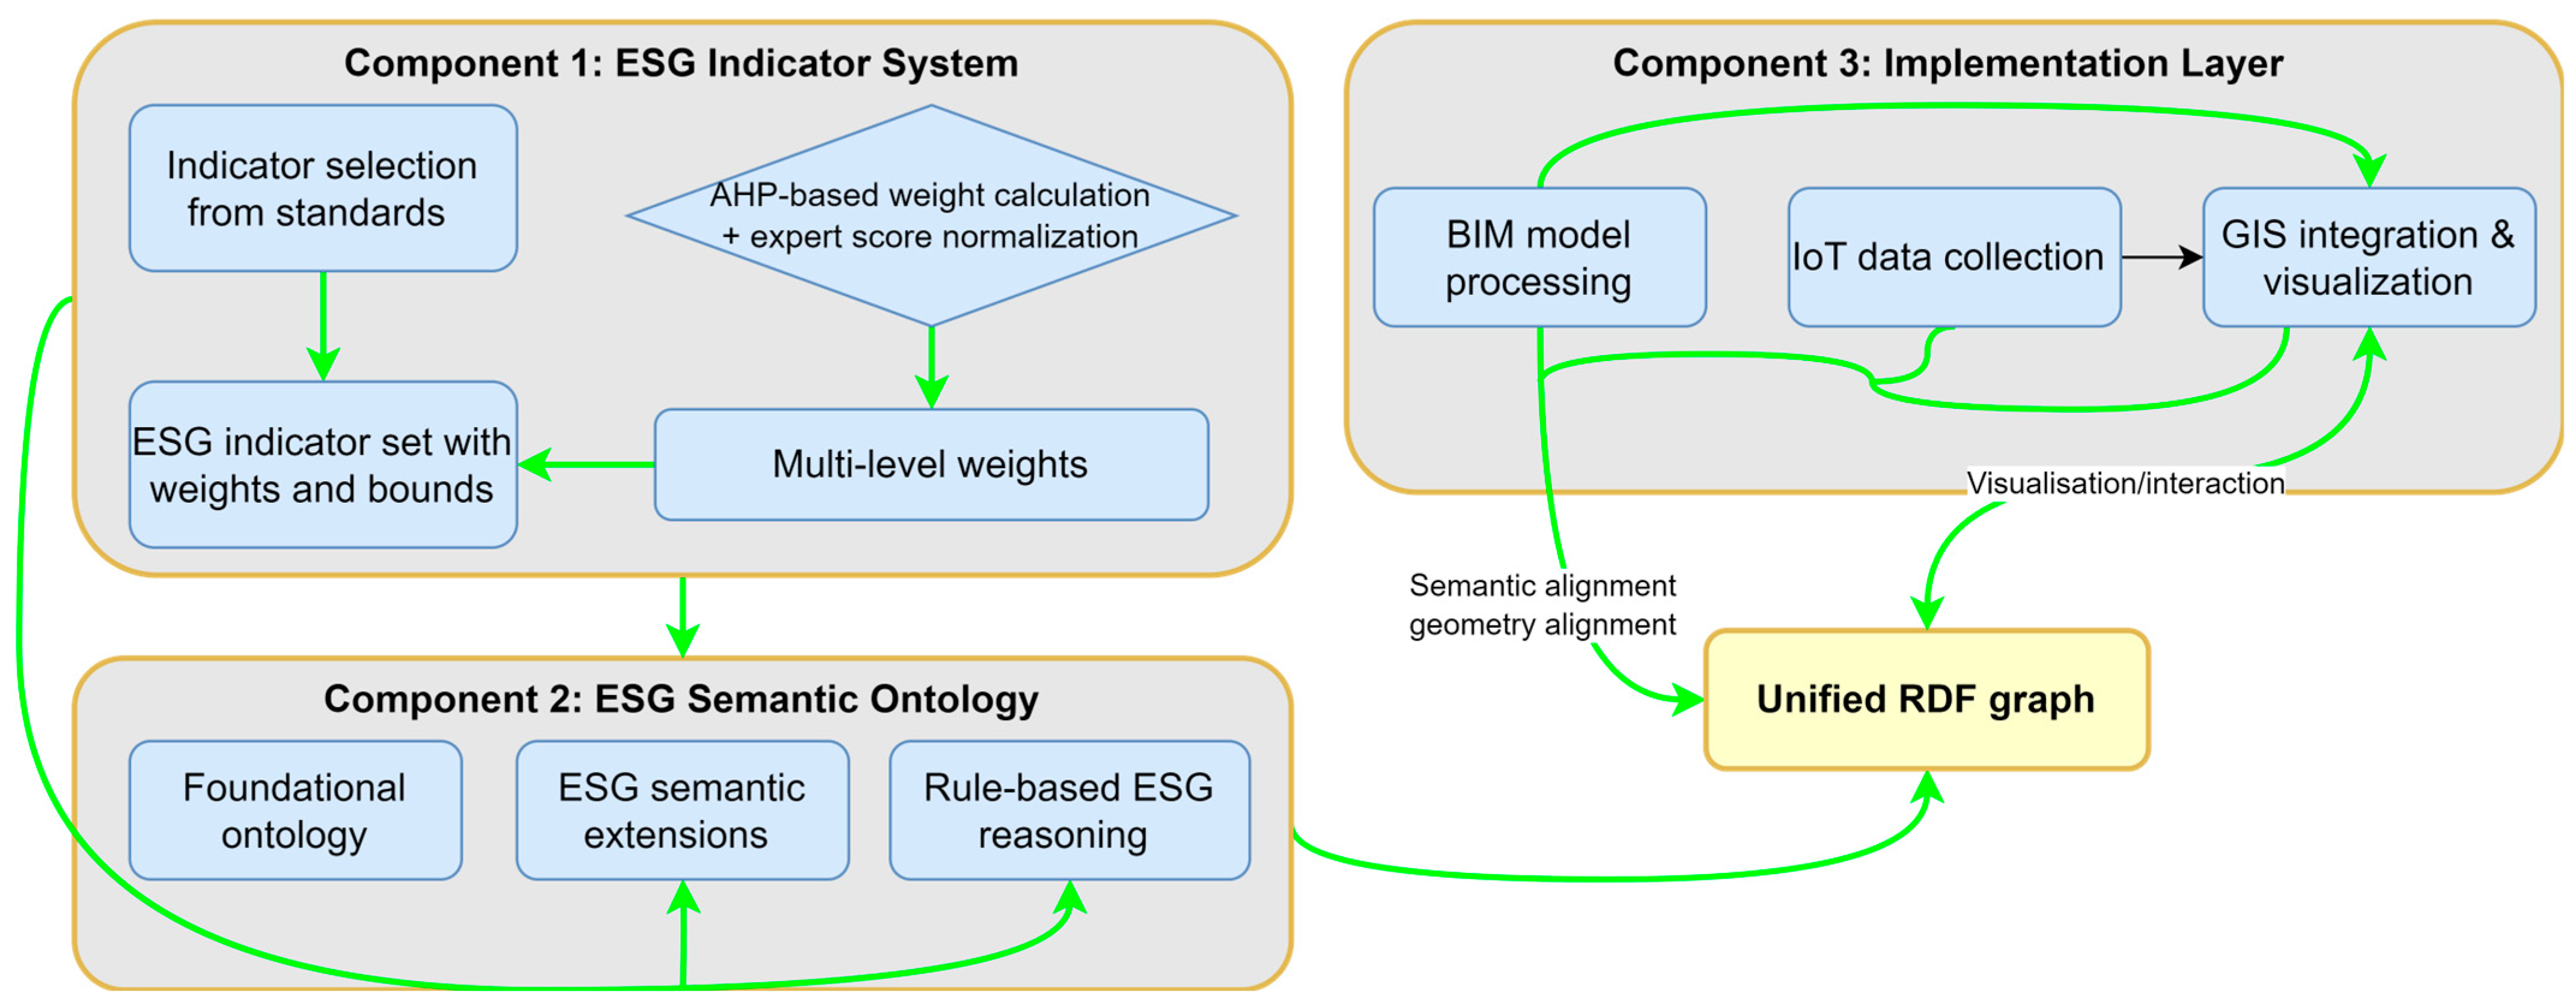
3. Approach for Semantic Modeling and Data Integration of ESG Indicators in Green Cities
3.1. Component 1: Green-Based City-Scale ESG Evaluation
3.1.1. ESG Indicator Modeling and Binding
3.1.2. Analytic Hierarchy Process (AHP) Based ESG Weighting Framework
3.1.3. Indicator Normalization and Quantification
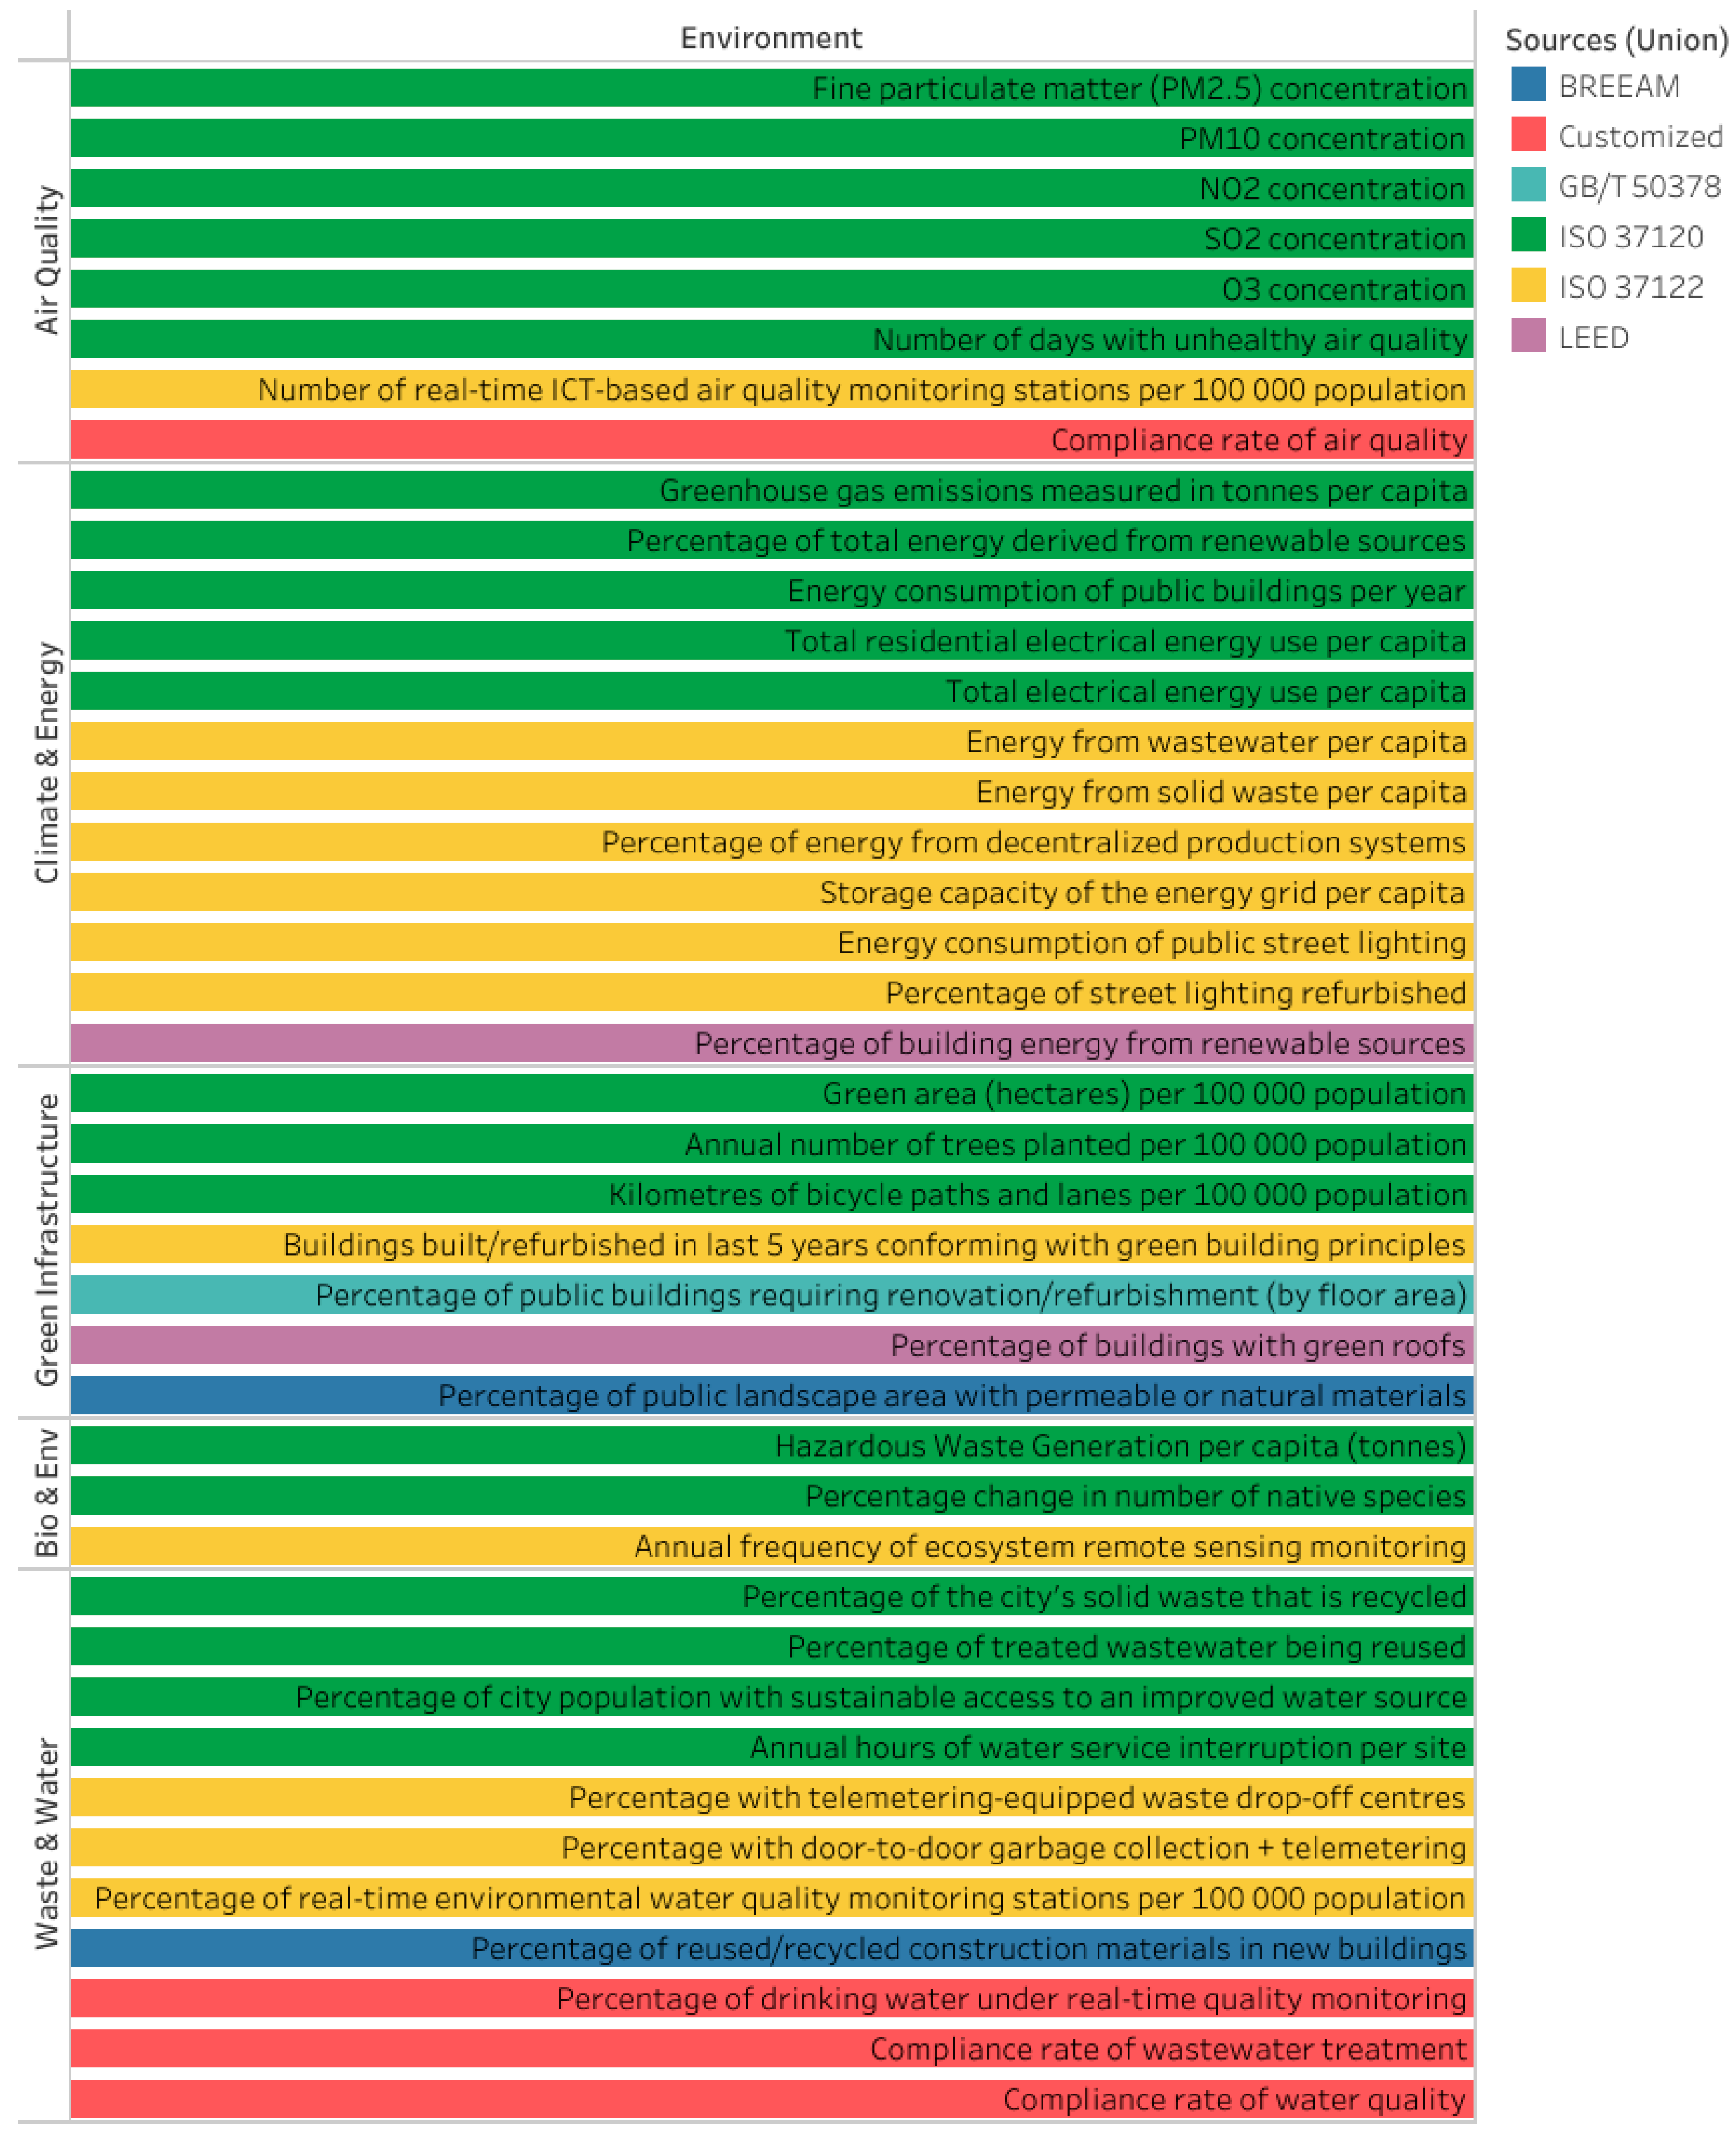
- Recommended values or thresholds from international or national standards. For example, pollutant concentration indicators (such as PM2.5, PM10, and NO2) in the air quality category are based on the WHO Global Air Quality Guidelines [46].
- Historical statistical data from authoritative databases, including those maintained by the United Nations, World Bank, OECD, and IEA. For instance, indicators under the governance category, such as “open government”, “access to public information”, and “average time for building permit approval”, are sourced from World Bank datasets.
- Survey data from reputable industry reports. For example, the indicator “percentage change in number of native species” is derived from WWFs 2024 Living Planet Report [47].
3.1.4. Determination of Weighting System
3.2. Component 2: Ontology Design for ESG-Driven Green City Evaluation Based on GIS-BIM-Iot
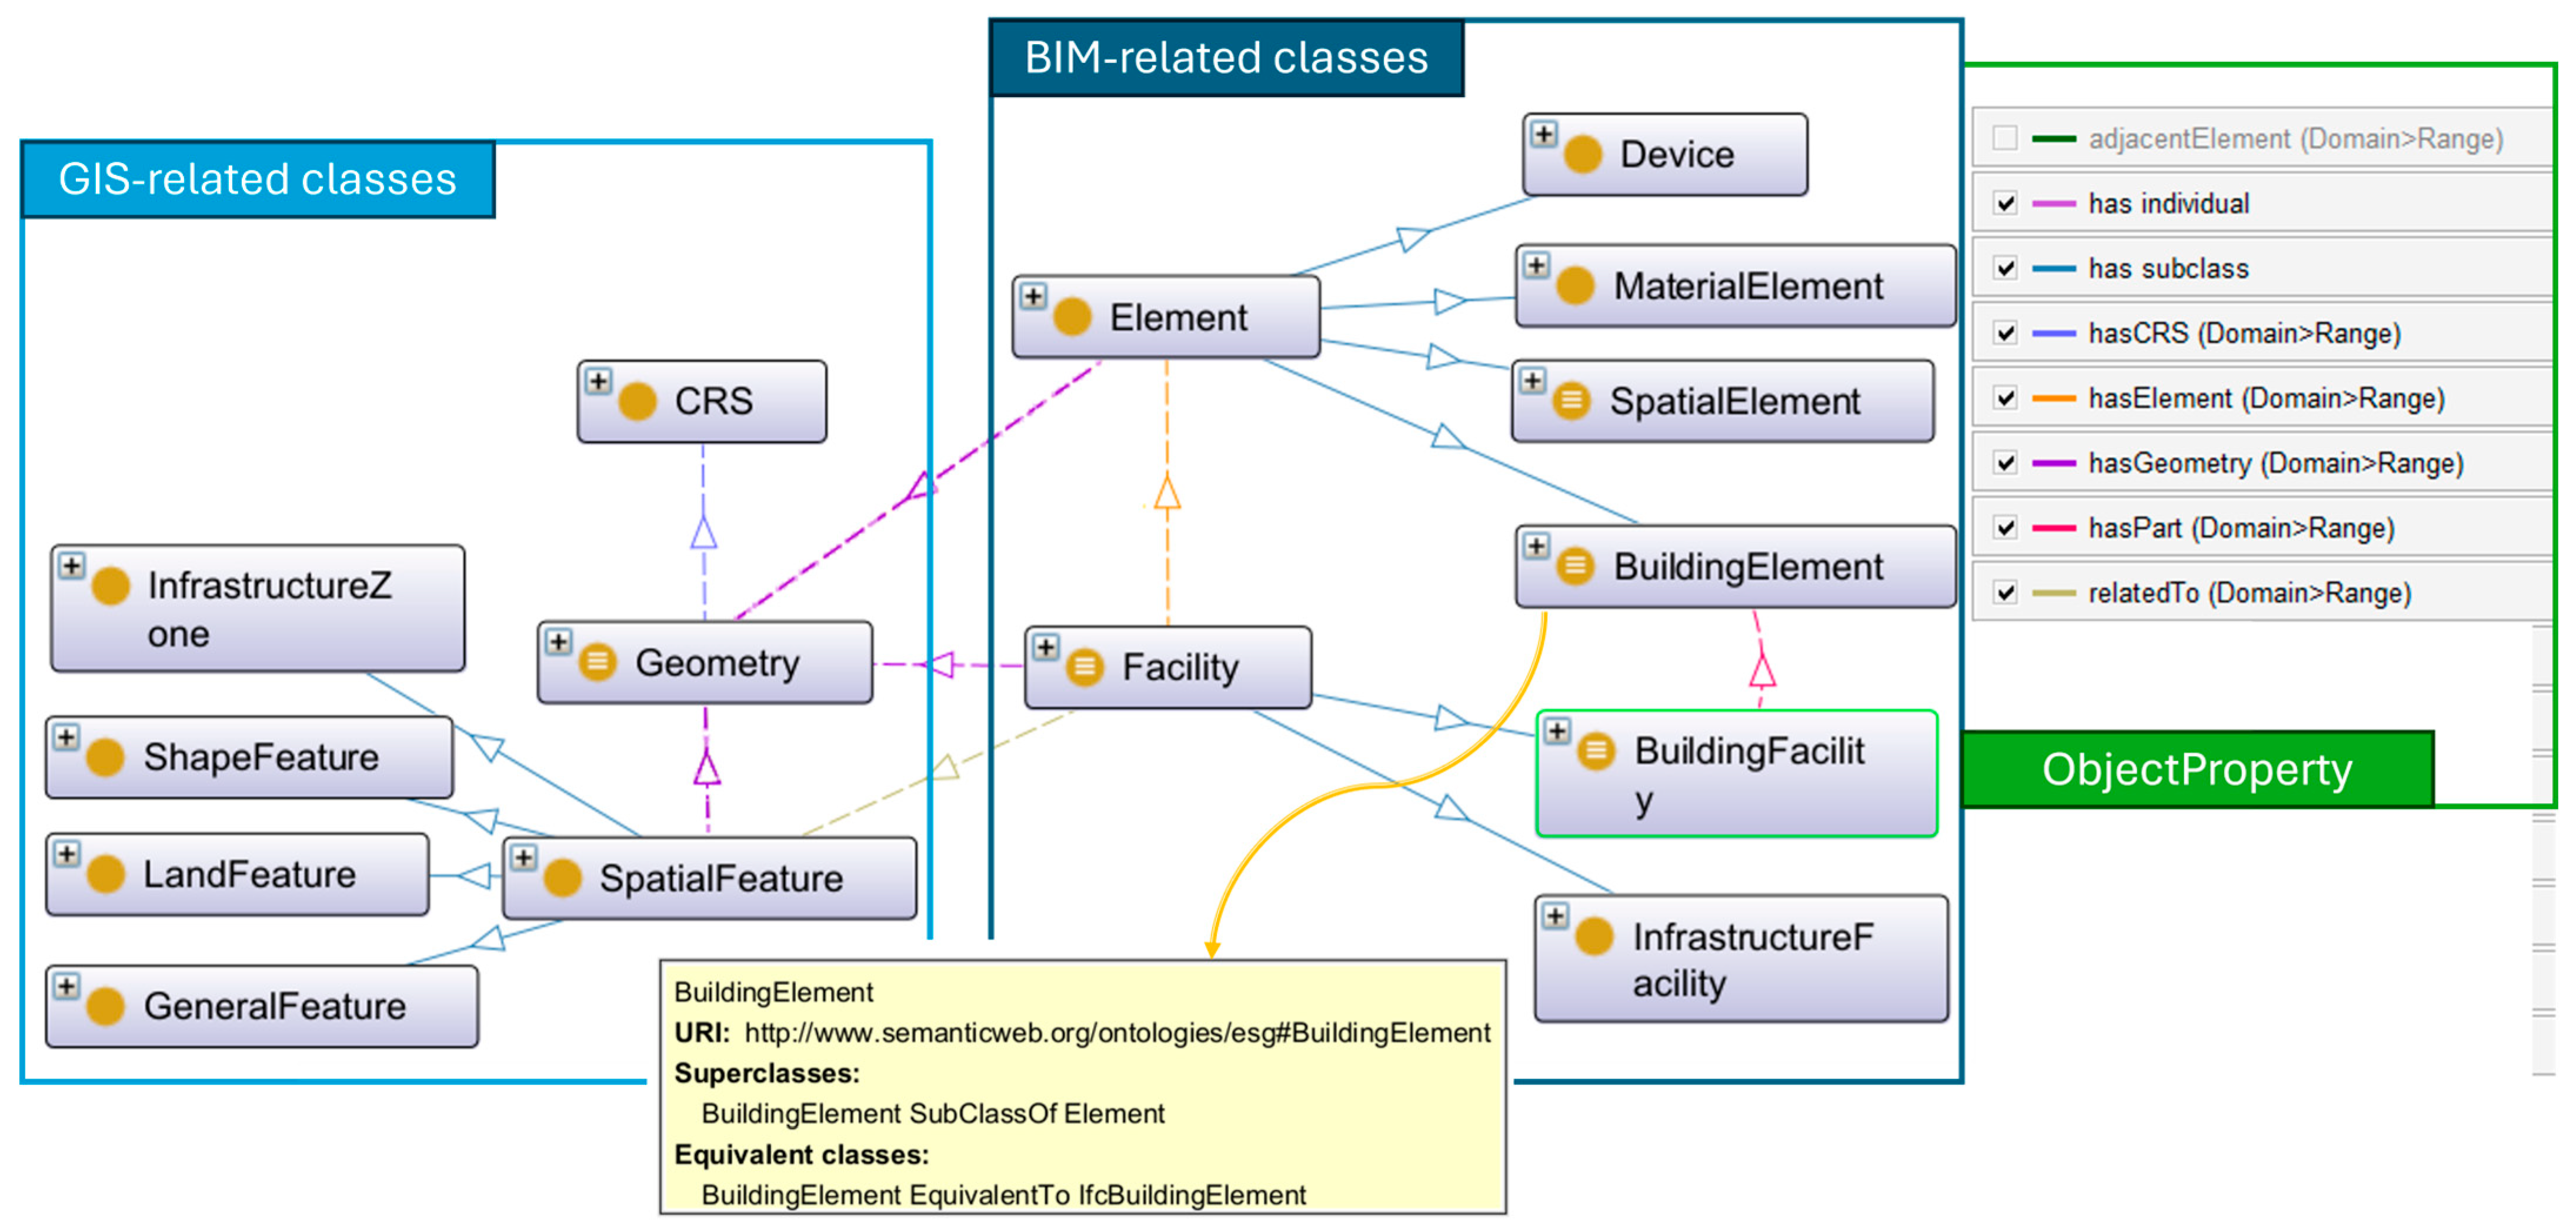
3.2.1. Foundational Ontology Construction
3.2.2. Semantic Extension for ESG Evaluation
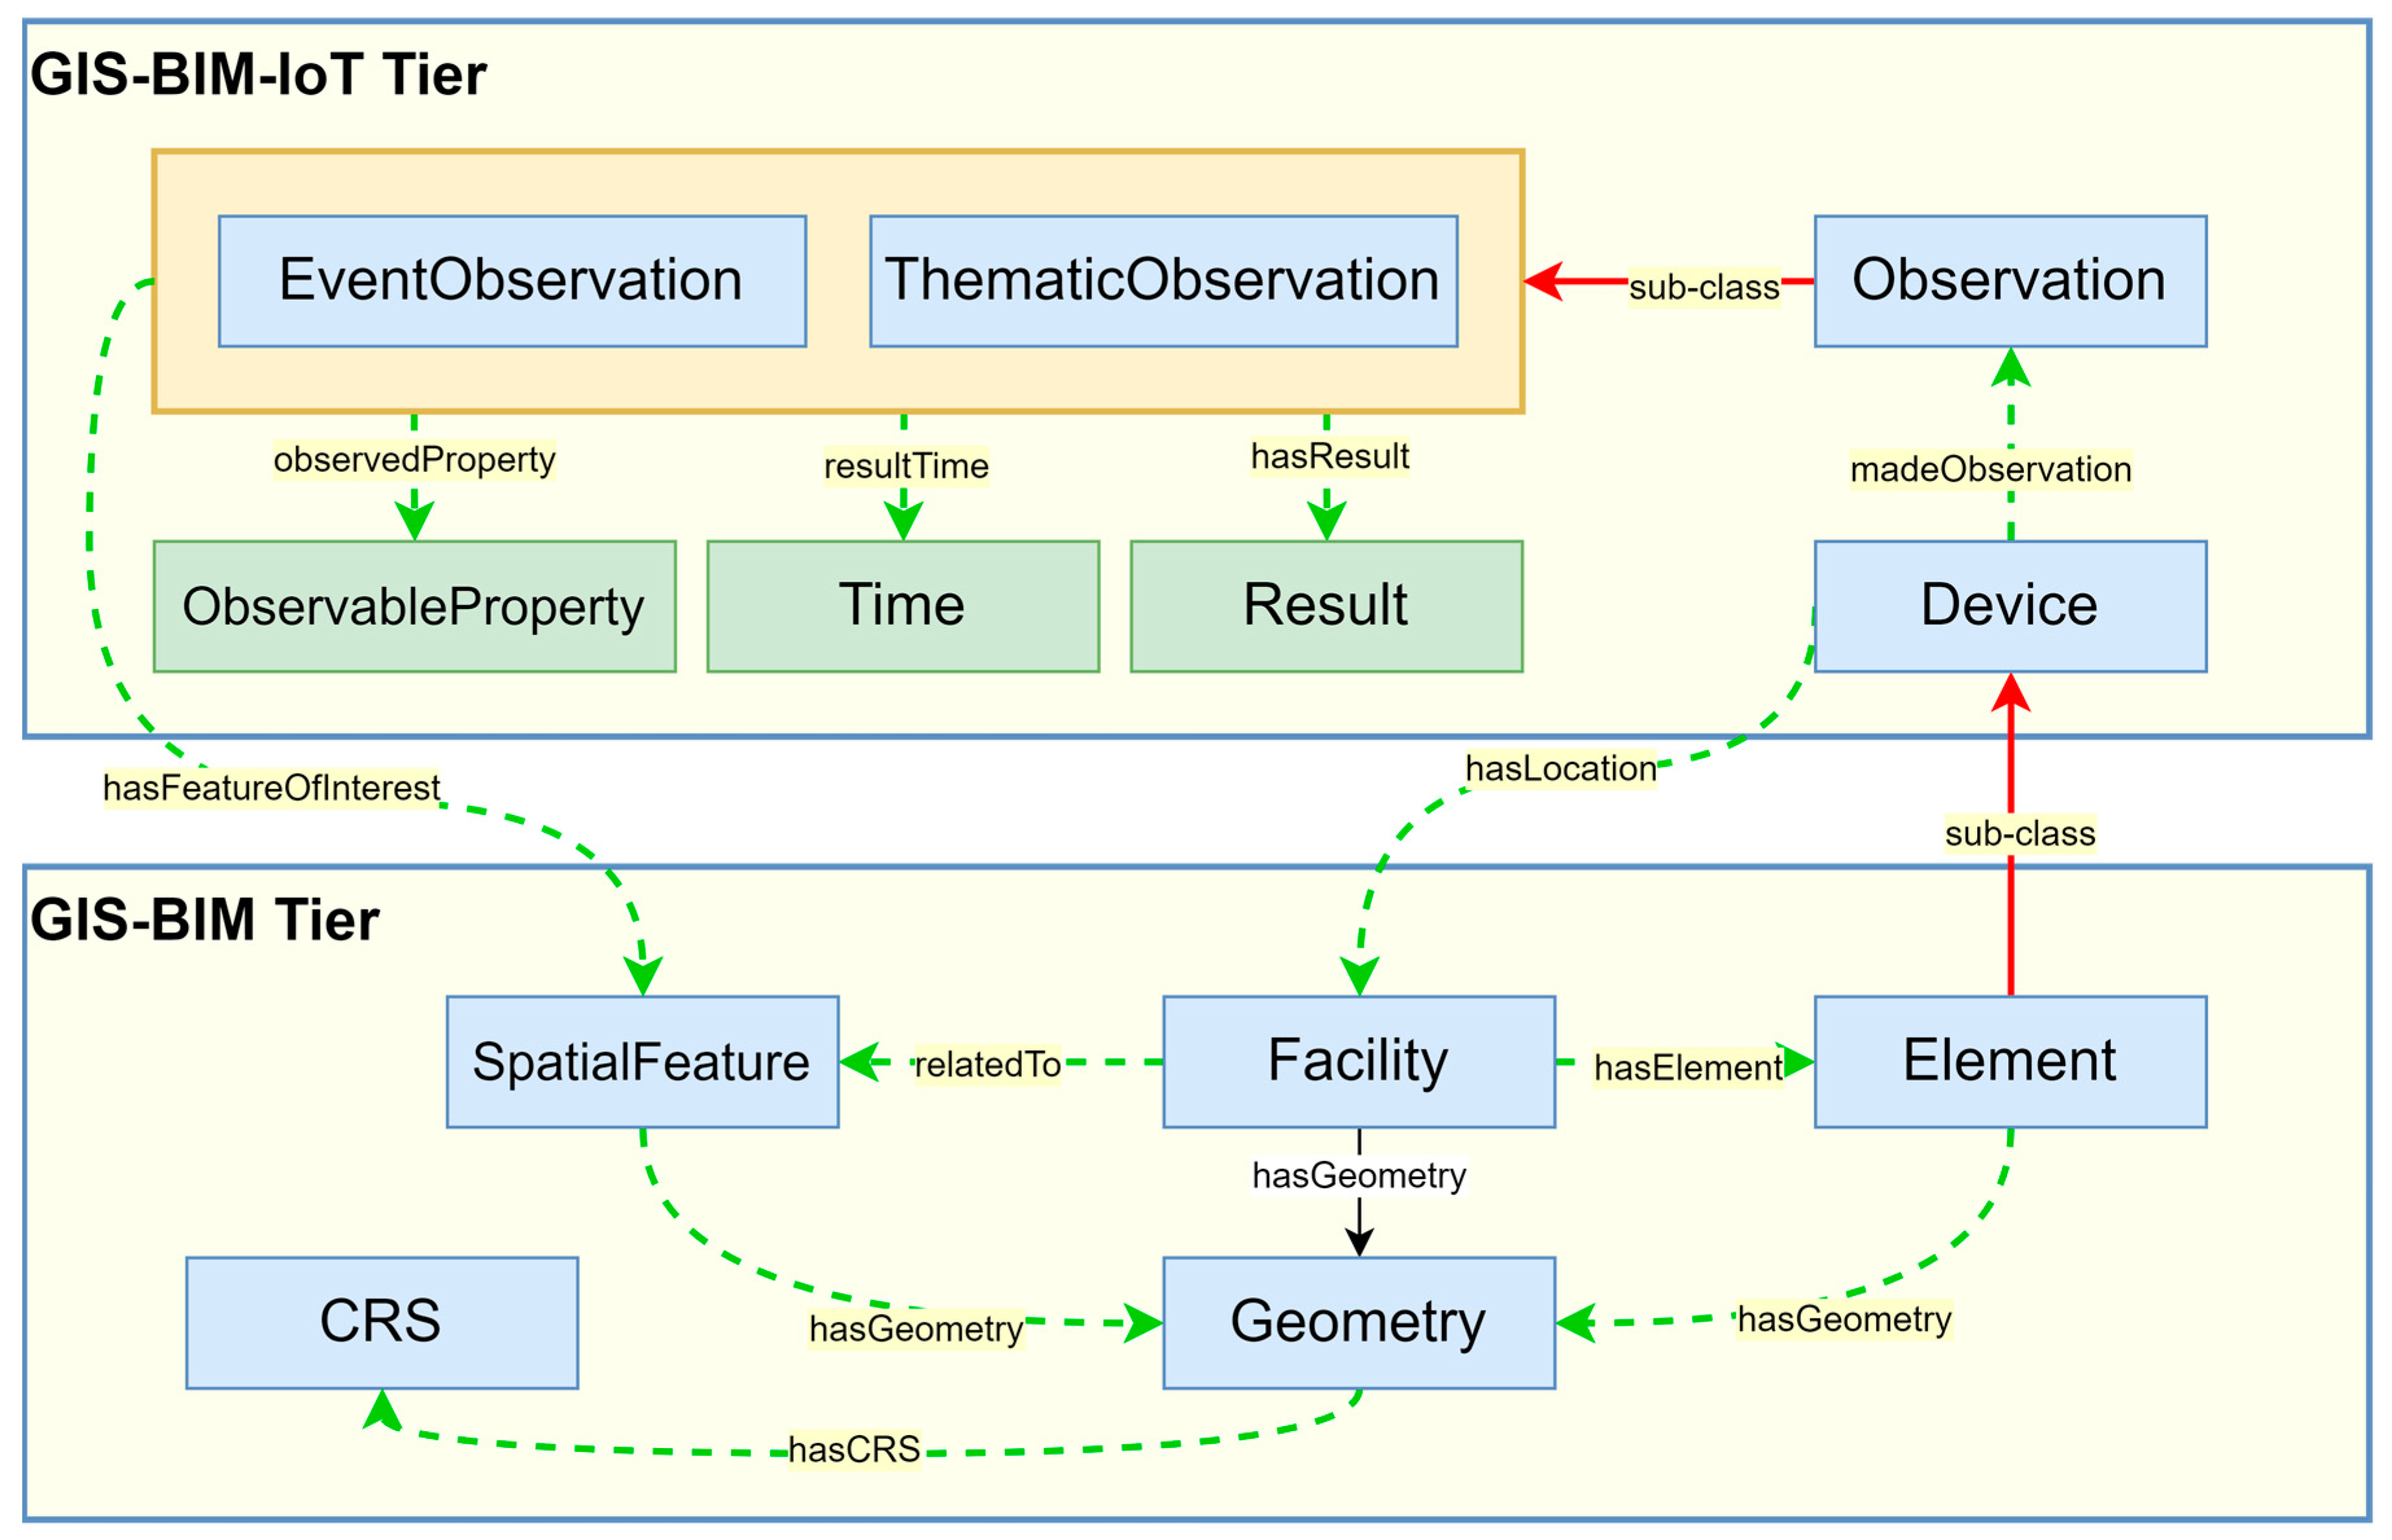
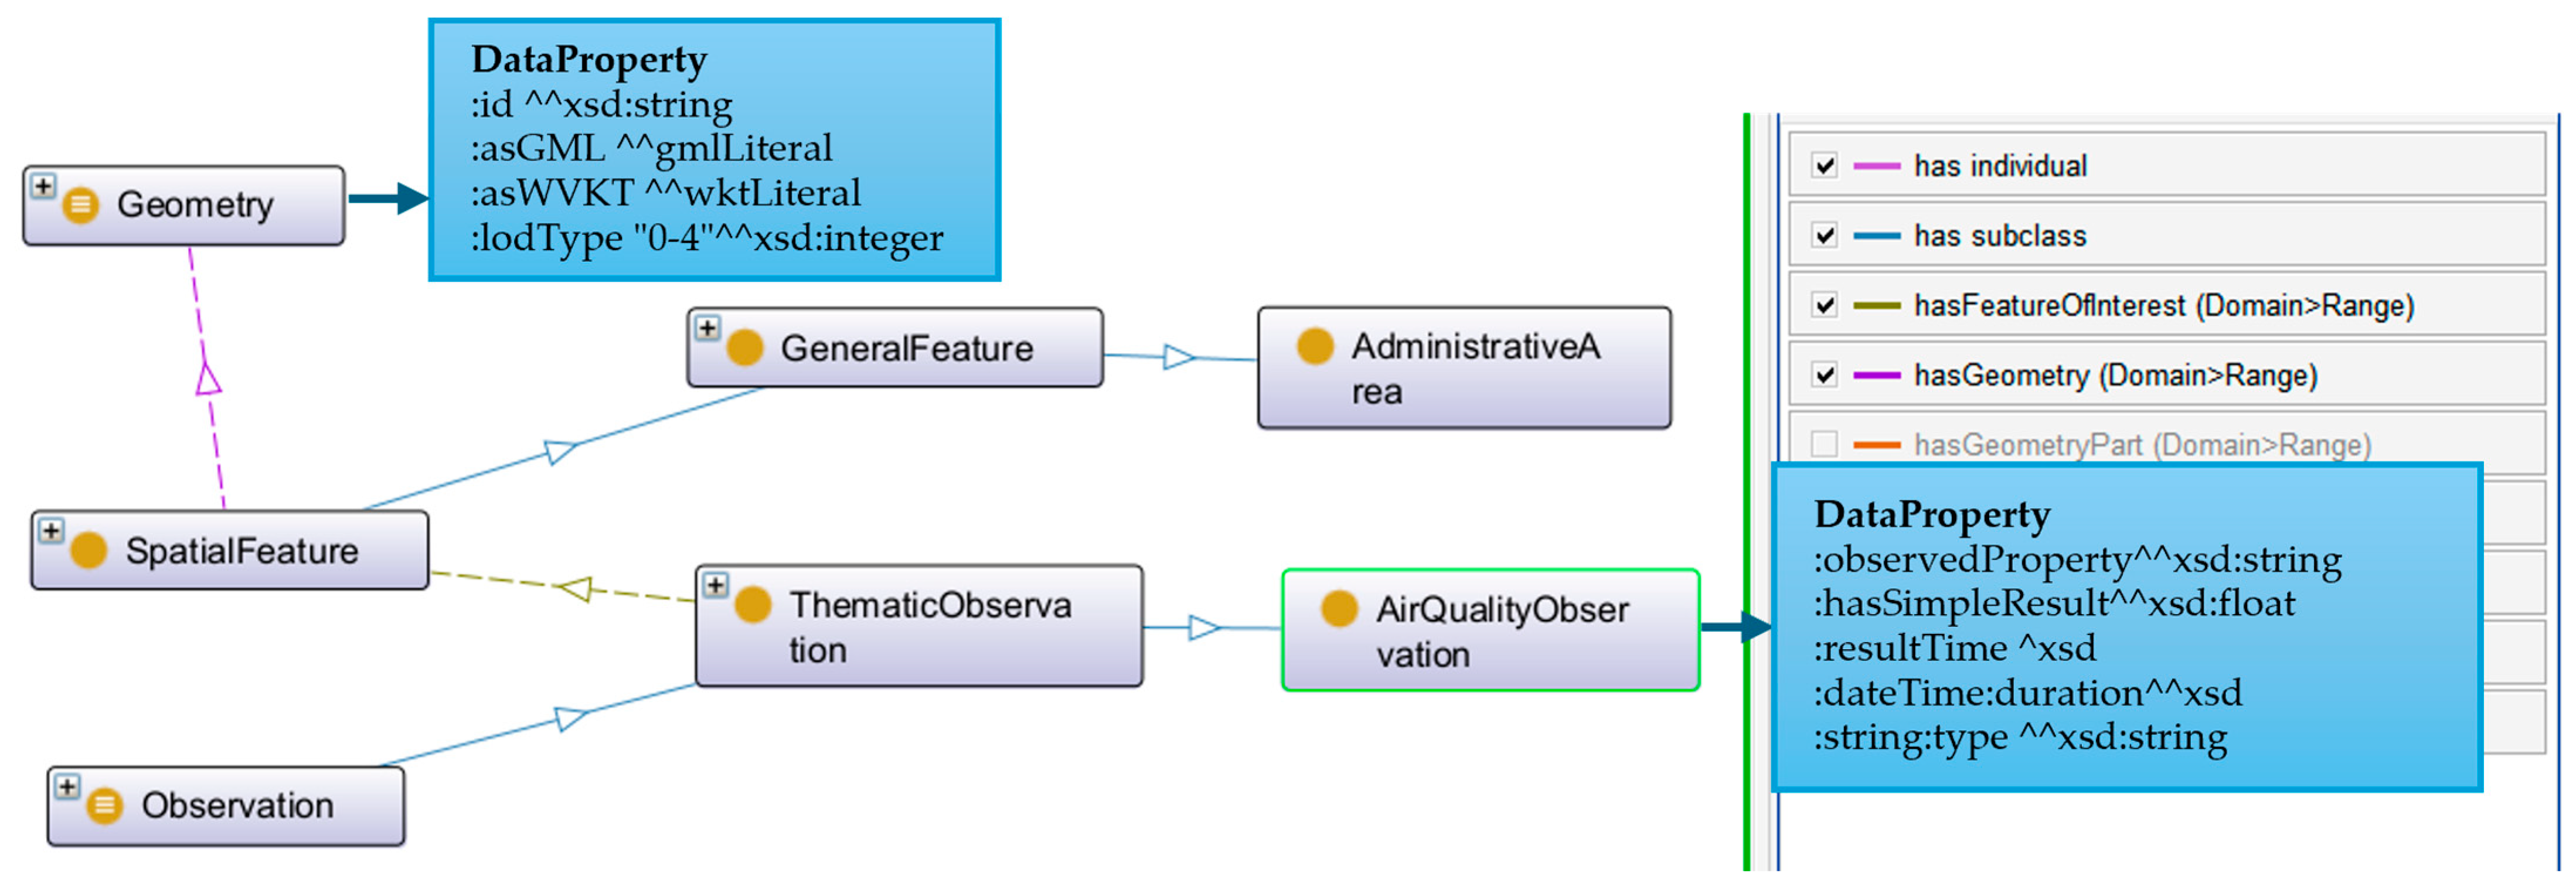
- Environmental QualityIncludes indicators such as PM2.5, NO2 concentration, air quality compliance rate, green space area, and green roof coverage. As shown in Figure 5, Pollutant concentrations are modeled using esg:AirQualityObservation, connected to specific pollutants via sosa:observedProperty. Spatial indicators such as green areas and roofs are represented using subclasses of esg:LandFeature, with geometry defined via geosparql:hasGeometry and resolution specified by esg:lodType.
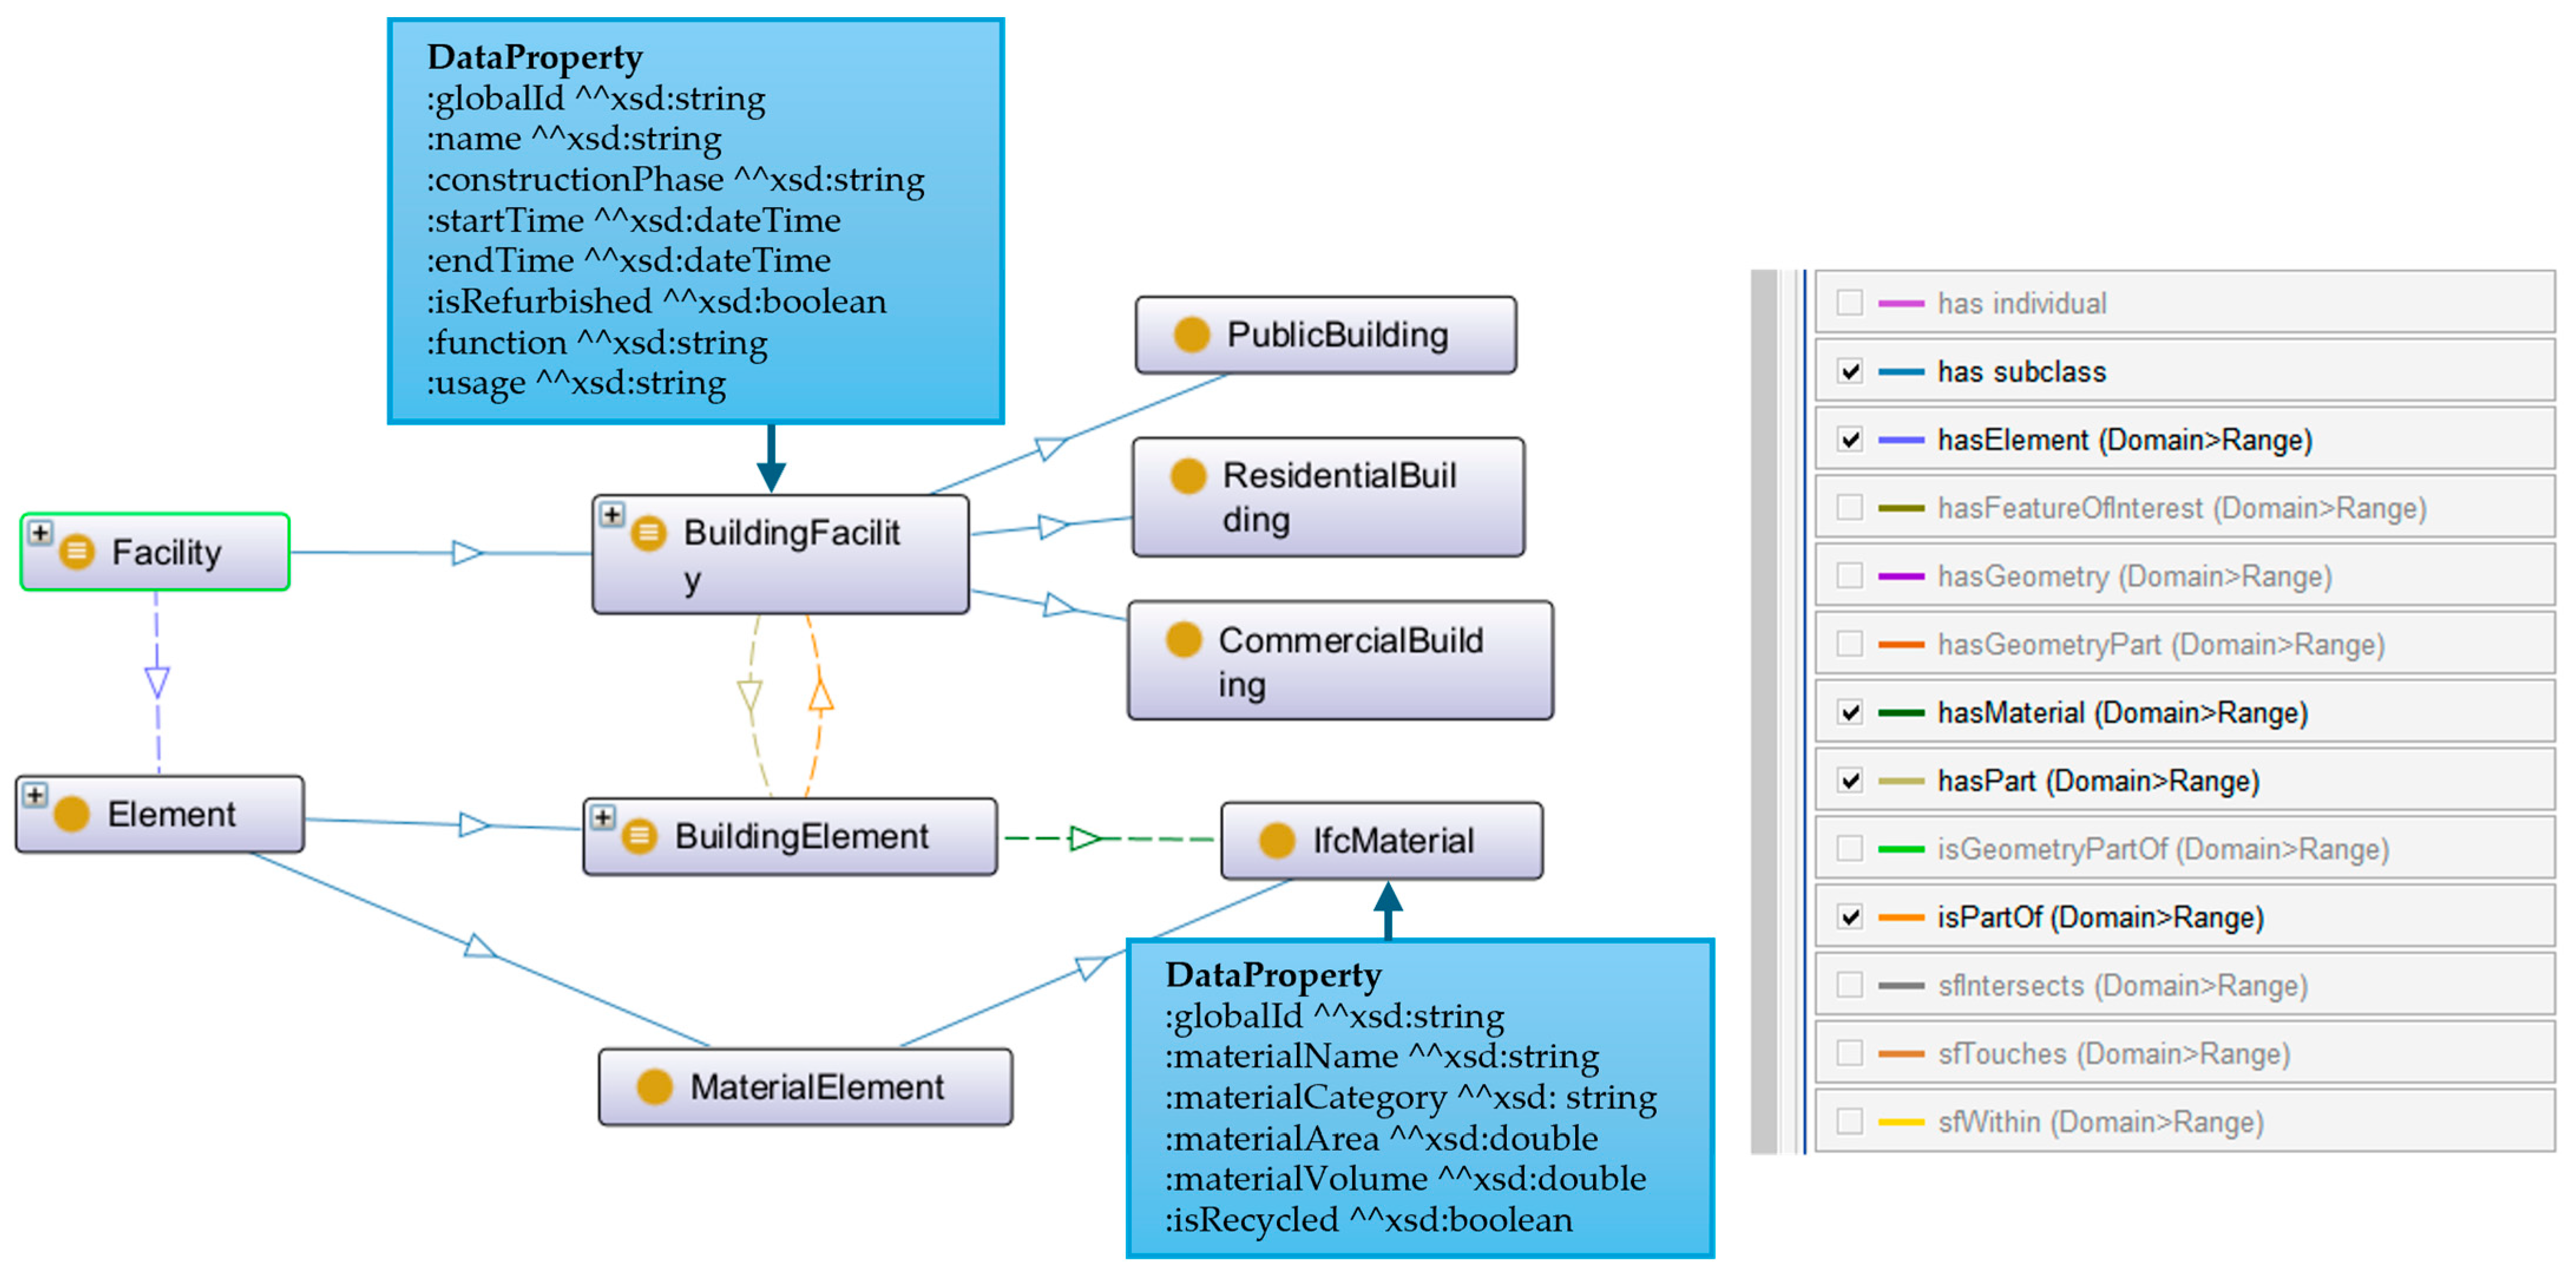
- Energy and Built EnvironmentCovers energy consumption in public buildings, share of renewable energy, green certifications, and BIM delivery. esg:MaterialElement is equipped with properties such as esg:materialName and esg:materialWeight to express material sustainability as shown in Figure 6. esg:Certificate records certification level, issuer, and date and is linked to specific esg:Facility instances. Renewable energy usage is annotated using the esg:energySourceType property.
- Water and Waste ManagementEncompasses indicators like wastewater reuse rate, waste recycling rate, and drinking water compliance. Observations are represented by esg:WaterObservation and esg:WasteObservation, with results structured via sosa:hasResult and esg:Result, supporting alignment across time, location, and entity.
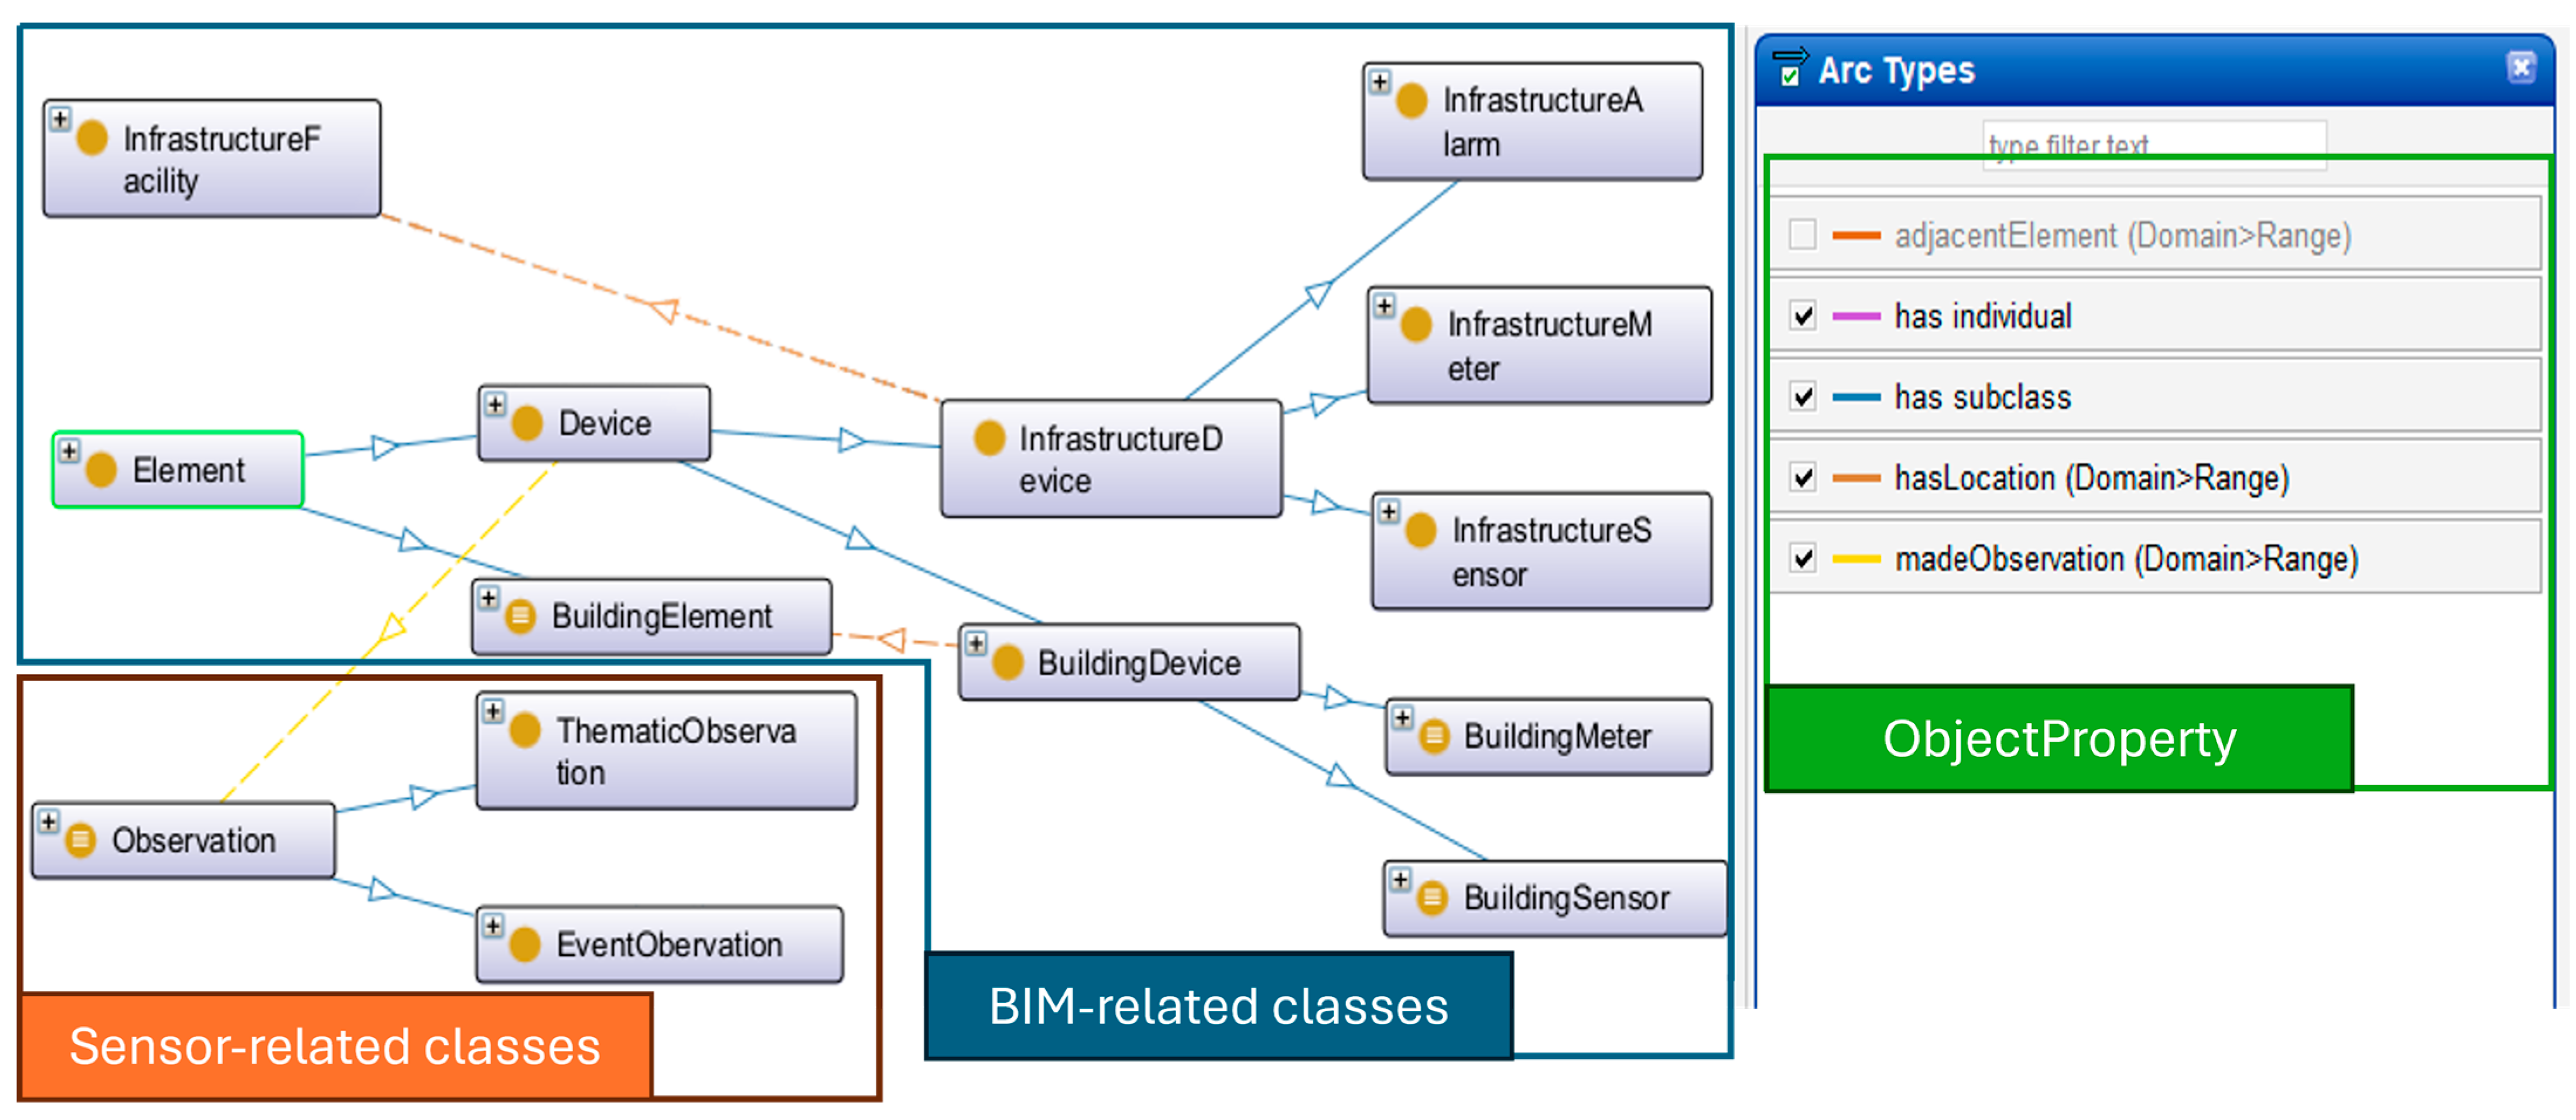
- Mobility and Smart TransportIncludes per capita public transport usage, non-motorized travel rates, smart traffic light deployment, and street lighting systems. Urban traffic infrastructure (e.g., smart street lights, signal systems) is modeled as semantic individuals via esg:InfrastructureFacility and described using attributes such as esg:technologyLevel and esg:isRefurbished.
- ICT and InfrastructureCovers municipal internet coverage, real-time mapping systems, smart metering, and service interruption durations. esg:InfrastructureZone is used to represent the spatial scope of ICT deployments, while esg:Facility and esg:Element subclasses describe the density and distribution of smart devices. esg:Interruption class is used to model service disruptions, annotated with esg:duration and esg:type (e.g., ICT, water).
- Housing and Social InclusionIncludes residential density, per capita living space, slum population ratios, and building comfort. Population attributes are assigned to esg:AdministrativeArea, while building comfort and acoustic performance are inferred through associated esg:Certificate levels, which reflect compliance with relevant well-being or green building standards.
3.2.3. ESG Indicator Reasoning
3.3. Component 3: Implementation of GIS-BIM-Iot Data Integration
3.3.1. Overall Technical Framework
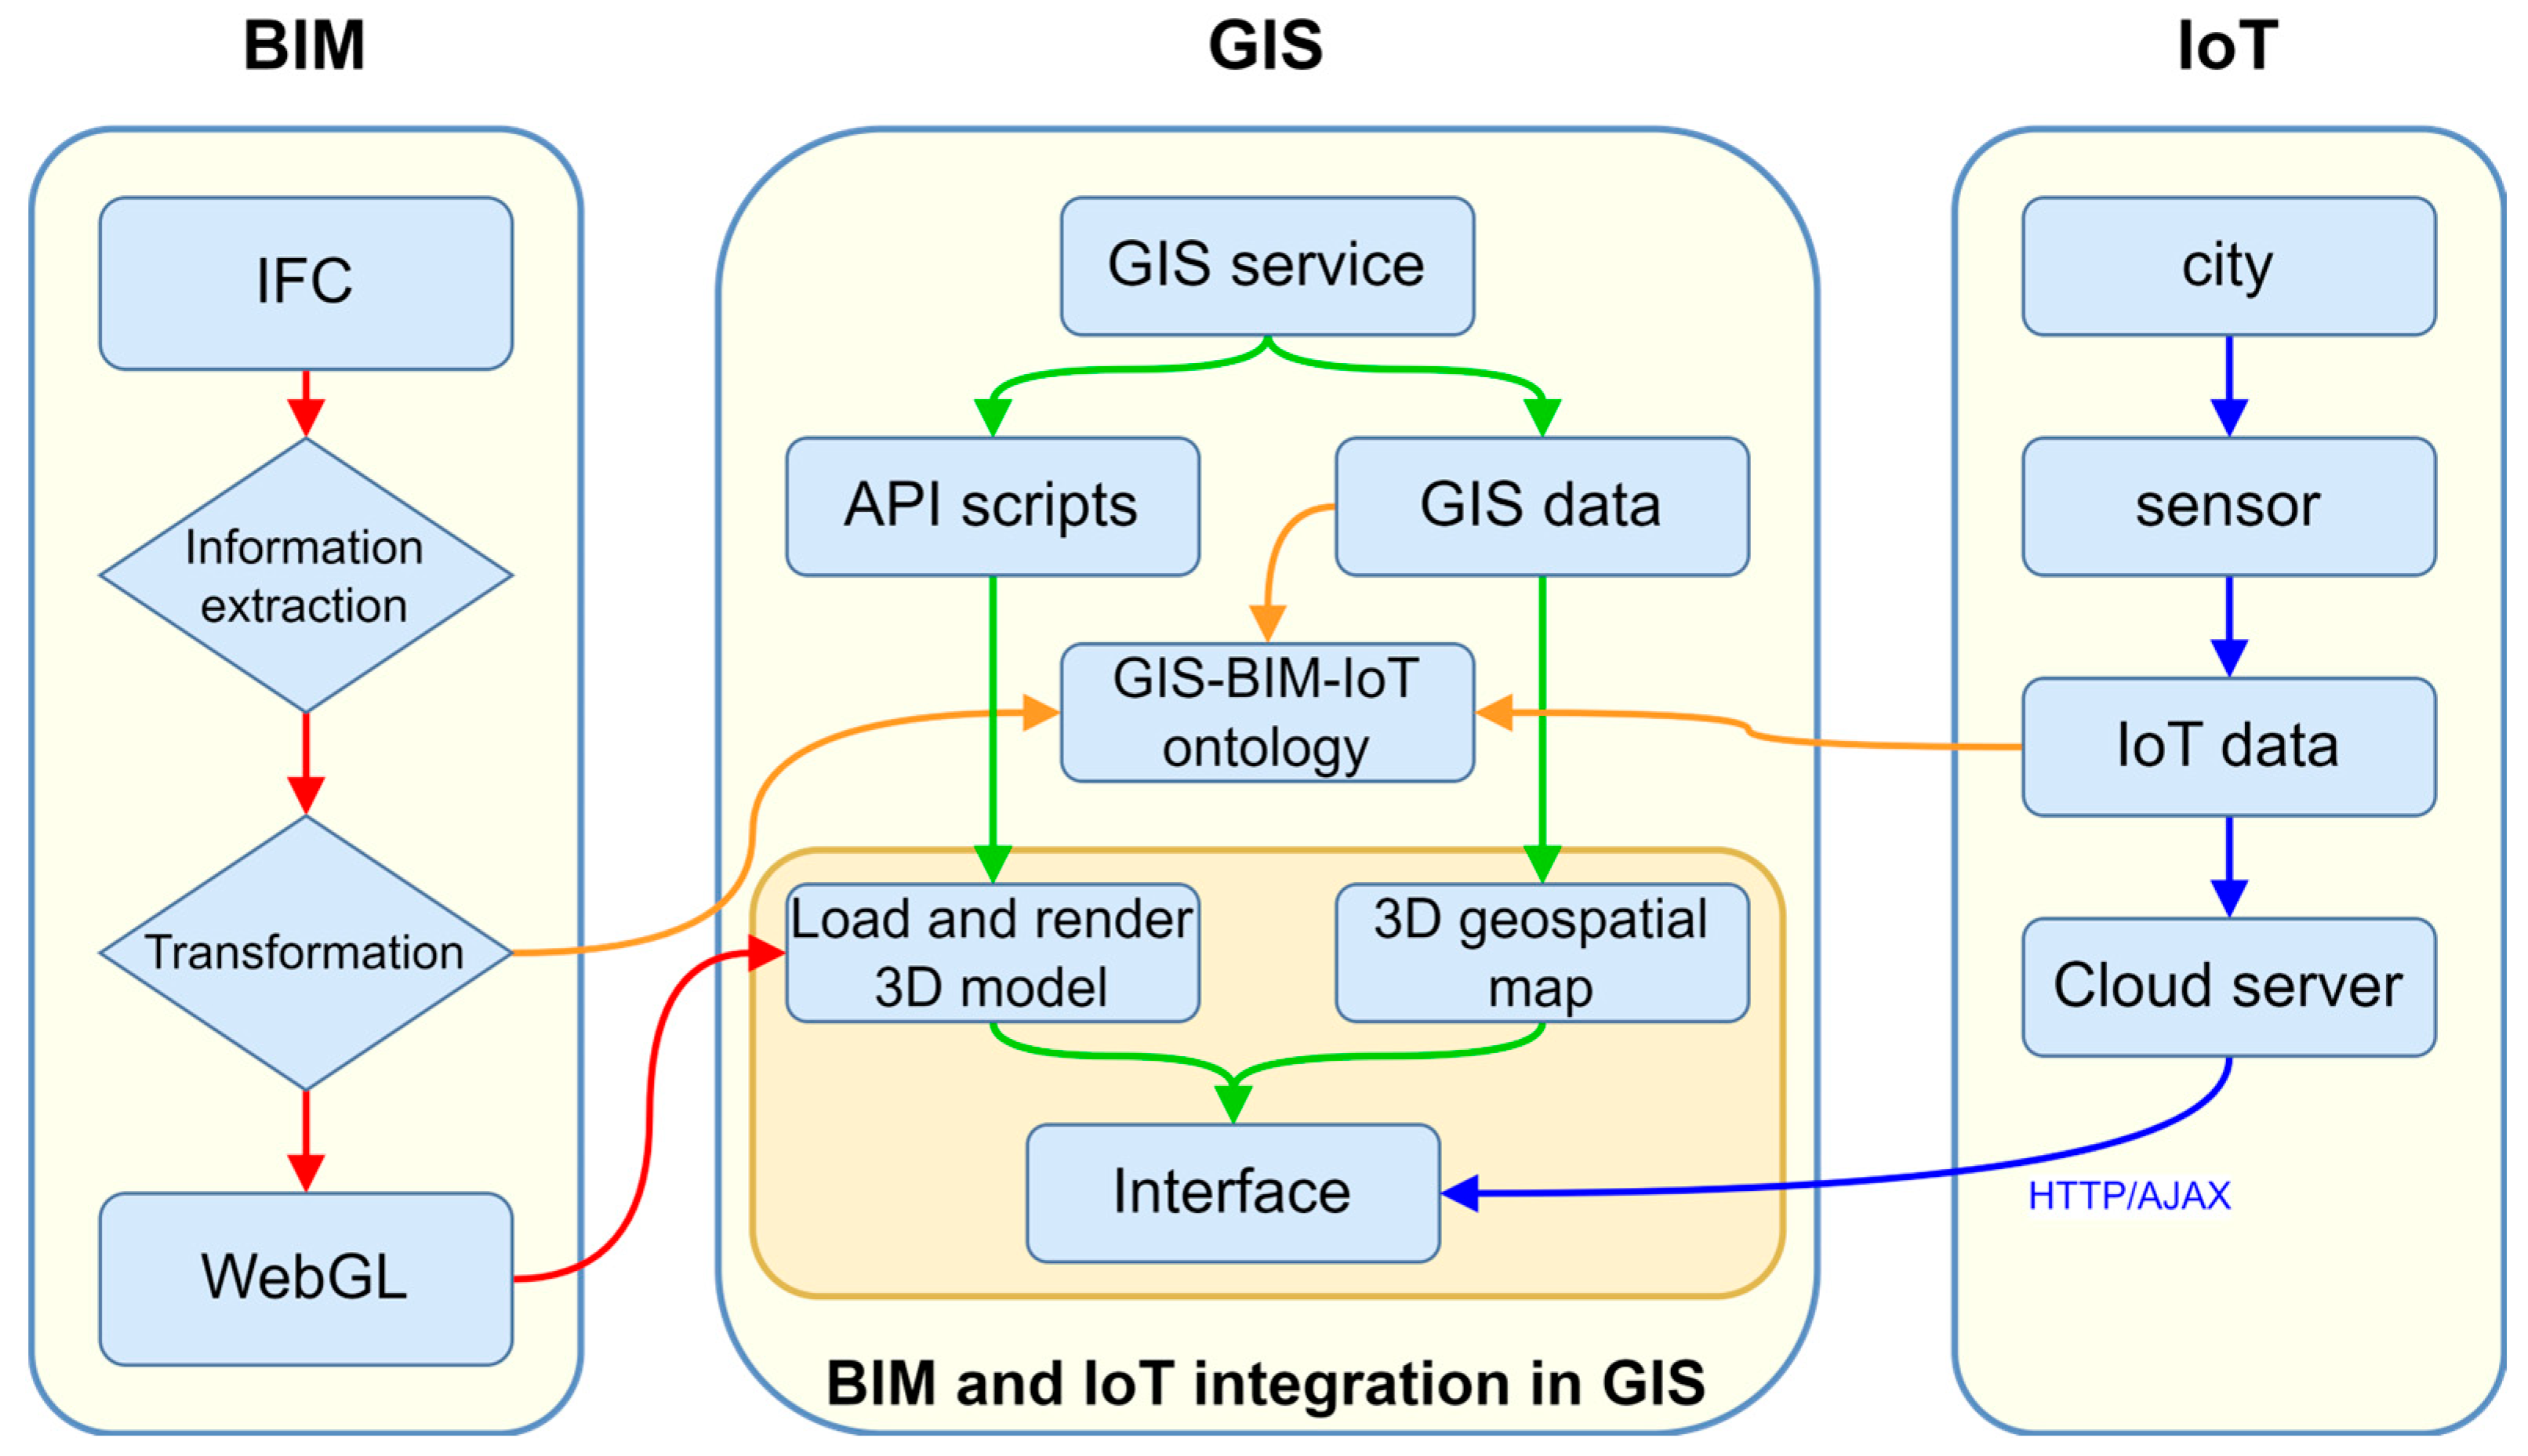
- BIM Block: The IFC model is exploited as it is the most widely accepted standard in the AEC/FM industry [51]. The IFC model is firstly modeled in BIM software Rivet 2024, and it is processed by toolkits that can parse EXPRESS documents. The semantic and geometric information are extracted separately. Geometry information is transformed into WebGL. WebGL is a Web Graphics Library for rendering interactive 2D and 3D graphics in web browsers. The semantic information is organized in an independent document containing the demanding BIM family, project, and owner data.
- IoT Block: Multi-functional sensors are installed not only within buildings but also across the urban environment, including public infrastructure, transportation systems, and environmental monitoring stations. Their exact locations and functions are registered using ontology-based semantic models, which ensure consistent interpretation and alignment of sensor data across domains. These sensors detect parameters that can be used to evaluate the city’s ESG performance and upload the streaming data to cloud servers.
- GIS Block: A GIS web service is employed that allows development upon it. Such service provides GIS data like globe maps as well as API scripts to allow developers to access and manipulate these data and build applications. Consequently, the GIS service could load the WebGL models representing the geometry of BIM with their real-world locations. Moreover, it also enables the sensors’ cloud service via the HTTP/AJAX protocol and receives real-time data. Since each sensor is registered in the BIM model, their global coordinates are also known after a set of transformations together with the BIM model. In a GIS environment, the geometry representation of a BIM model can be directly viewed, and sensor data can be visualized in different ways according to the purposes of green building operation and management. Apart from the geometry representation of BIM, semantic information is associated with its geometry in the GIS environment. Once a certain part of the BIM model is specified in the GIS environment, its linked semantic information would be retrieved and visualized via ontology-defined relations.
- BIM–GIS–IoT synchronization and scale: Sensor records are ingested at regular intervals as SOSA Observations with UTC timestamps and quality flags. Each record is linked to the corresponding building, room, public space, or area using persistent identifiers and spatial containment. Indicator values at a given time use the latest valid observation within a short lookback window. If no valid observation exists, the value is marked as missing. Static BIM and GIS layers are updated when authoritative models or base maps change. Indicator derivation is implemented with SPARQL rule and query logic in the triplestore, with lightweight OWL RL entailment for class and property closure and SHACL used for validation. Static relations such as type hierarchy, part–whole, and spatial containment are materialized in advance. Runtime queries use spatial indicators for GeoSPARQL. The current case study runs on one RDF graph store with a tiled web visualization front end. Performance is most affected by the volume of sensor records and by spatial joints over large areas. To keep latency low, data are ingested and queried in batches, and observations are pre-aggregated by time window and administrative unit prior to computing indicators.
3.3.2. Extraction, Transformation, and Reconnection of IFC BIM Model
3.3.3. Sensor Data Collection and Transmission
4. Case Study: Semantic Integration and ESG Indicator Inference Based on the Proposed GIS-BIM-IoT Ontology
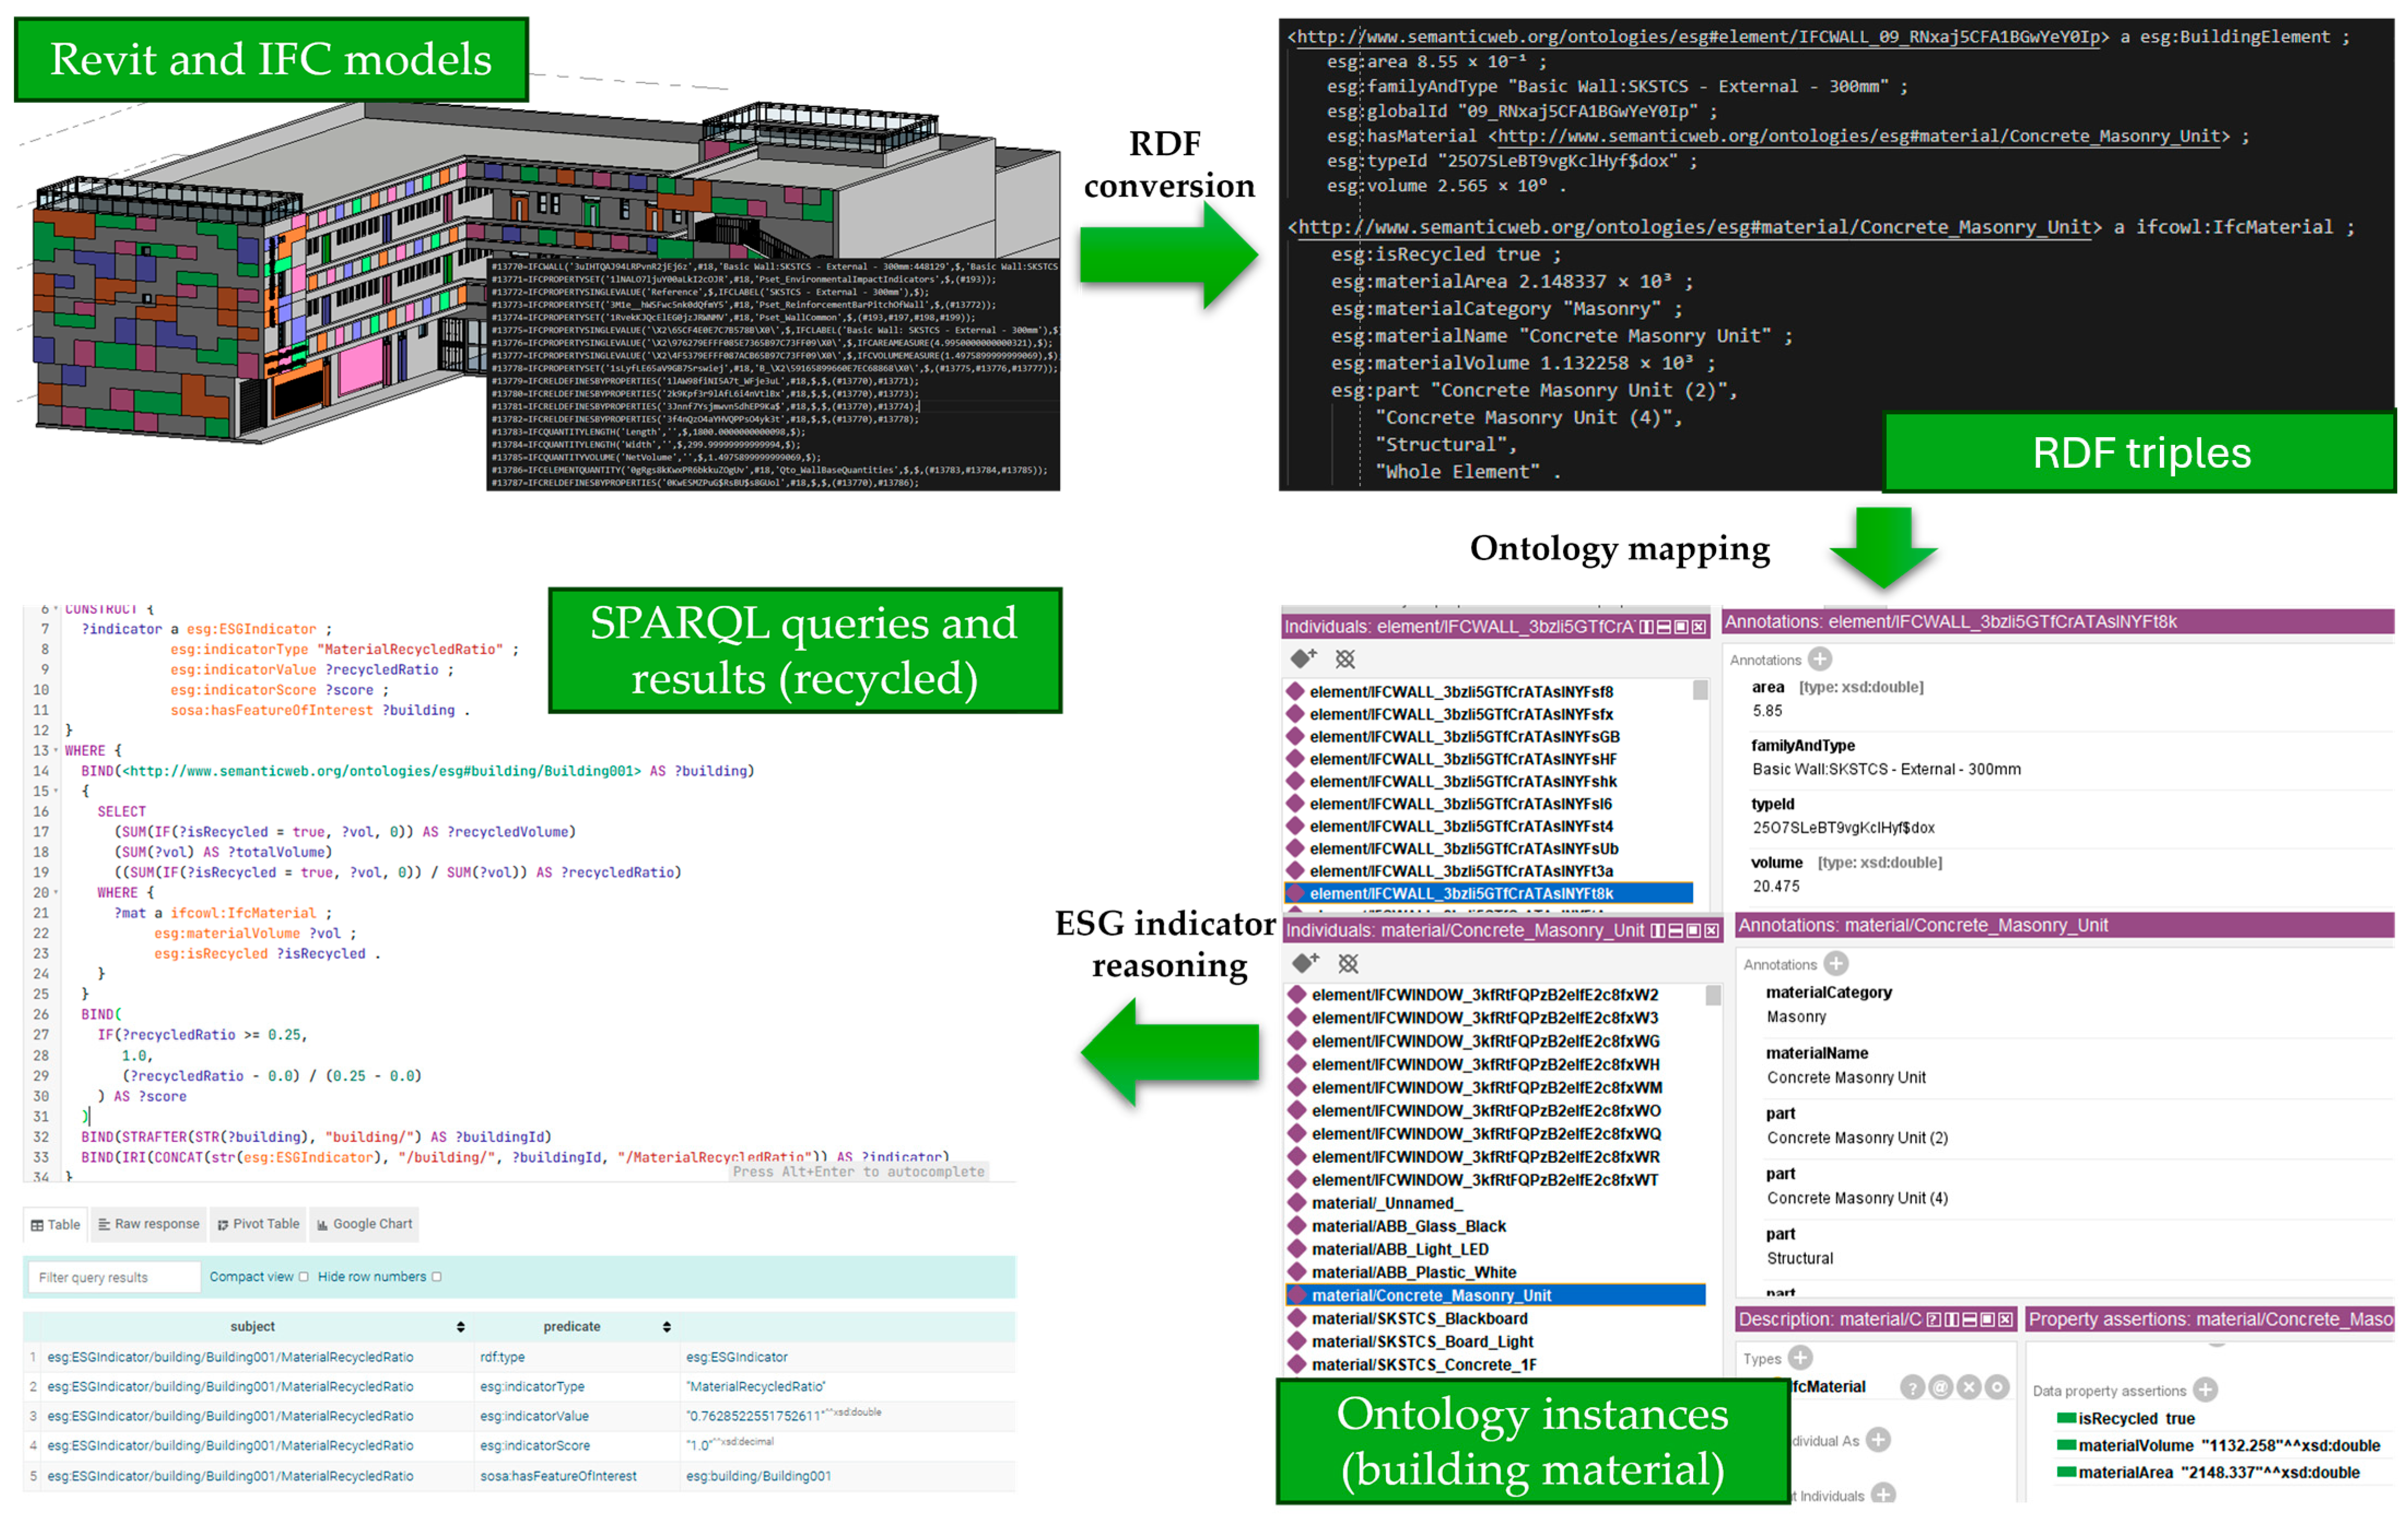
4.1. Semantic Modeling and Inference of the Recycled Construction Material Indicator
- esg:indicatorType: the type of indicator (e.g., esg:materialRecycleRatio);
- esg:indicatorValue: the inferred raw value;
- esg:indicatorScore: the normalized score computed under the unified scoring system.
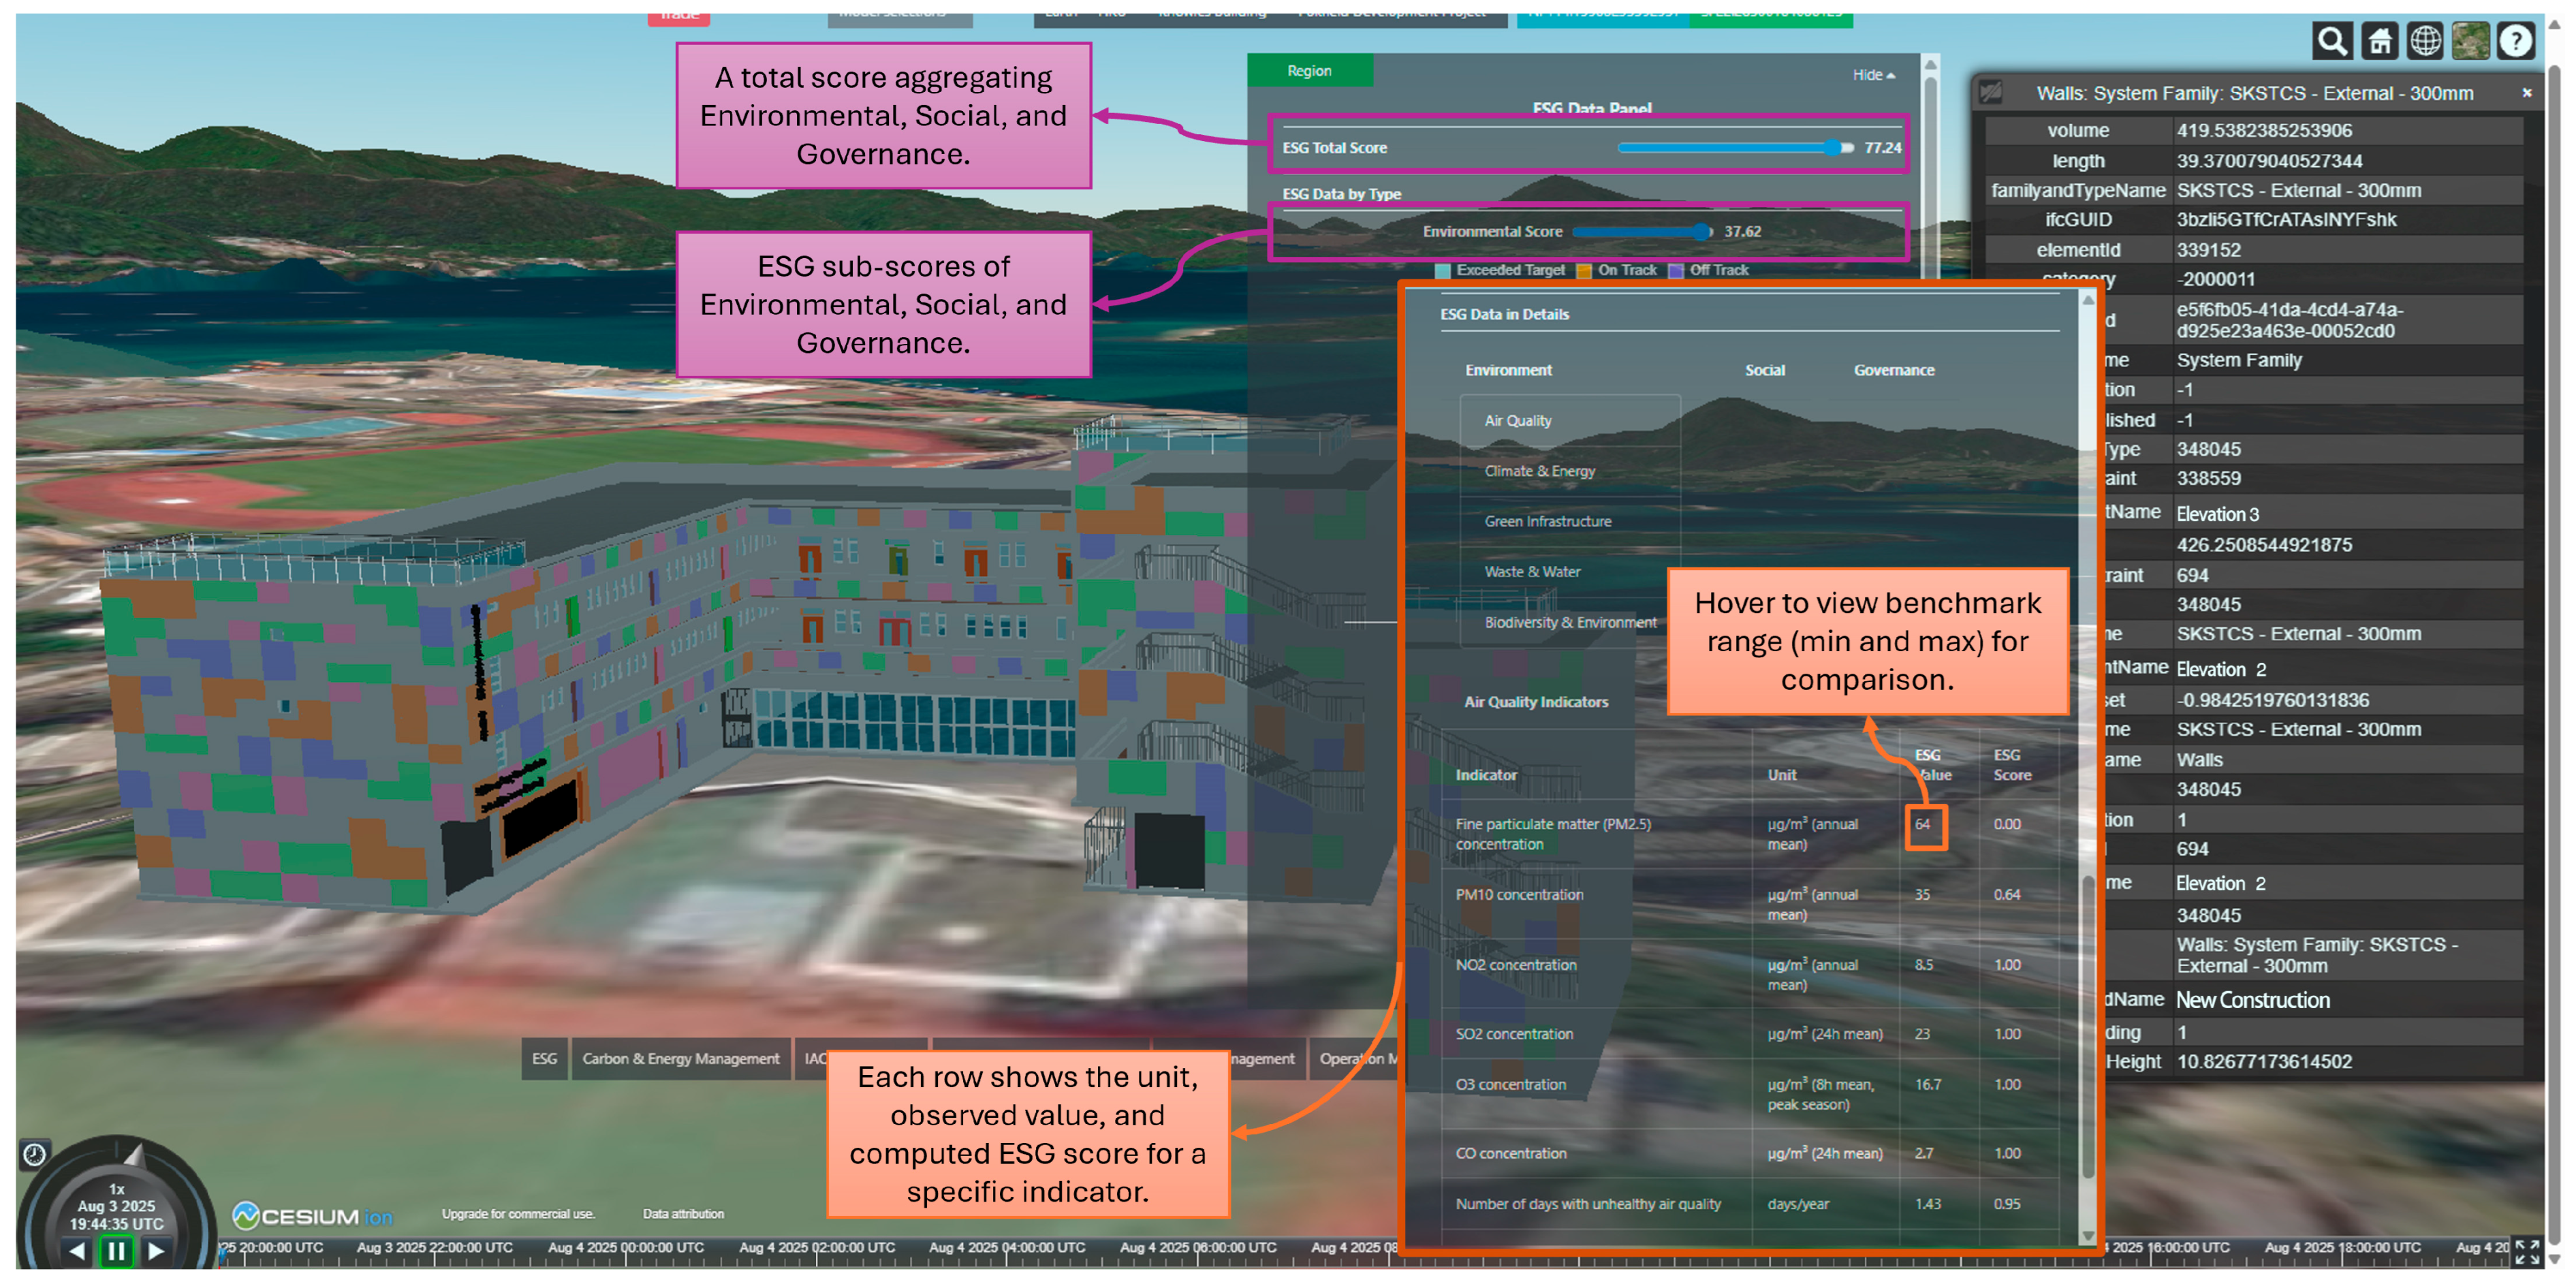
4.2. Dynamic Inference and Scoring of the Air Pollution Concentration Indicator
- esg:indicatorType = “PM10 concentration”
- esg:indicatorValue = 35
- esg:indicatorScore = 0.64
4.3. Integration into a Web-Based 3D Visualization Platform Using Cesium
5. Discussion
5.1. Implications and Contributions
5.2. Limitations and Future Work
6. Conclusions
Author Contributions
Funding
Data Availability Statement
Conflicts of Interest
Appendix A. Initial Selection of ESG Indicators with Respective Sources


Appendix B. The Fundamental Scale of Absolute Numbers
| Intensity of Importance | Definition | Explanation |
|---|---|---|
| 1 | Equal importance | Two activities contribute equally to the objective |
| 2 | Weak or slight | |
| 3 | Moderate importance | Experience and judgment slightly favor one activity over another |
| 4 | Moderate plus | |
| 5 | Strong importance | Experience and judgment strongly favor one activity over another |
| 6 | Strong plus | |
| 7 | Very strong or demonstrated importance | An activity is favored very strongly over another; its dominance demonstrated in practice |
| 8 | Very, very strong | |
| 9 | Extreme importance | The evidence favoring one activity over another is of the highest possible order of affirmation |
| Reciprocals of above | If activity i has one of the above nonzero numbers assigned to it when compared with activity j, then j has the reciprocal value when compared with i | A reasonable assumption |
| Rationals | Ratios arising from the scale | If consistency were to be forced by obtaining n numerical values to span the matrix |
References
- United Nations. Sustainable Development Goal. 2015. Available online: https://www.undp.org/sustainable-development-goals/sustainable-cities-and-communities?utm_source=EN%26utm_medium%3DGSR%26utm_content%3DUS_UNDP_PaidSearch_Brand_English%26utm_campaign%3DCENTRAL%26c_src%3DCENTRAL%26c_src2%3DGSR%26gclid%3DCj0KCQiA6fafBhC1ARI (accessed on 16 August 2025).
- Mohanty, P.; Kotak, Y. Electric vehicles: Status and roadmap for India. In Electric Vehicles: Prospects and Challenges; Elsevier: Amsterdam, The Netherlands, 2017; pp. 387–414. [Google Scholar] [CrossRef]
- Khatri, A.; Bustamante, D.; Ruta, M.; Garcia-Reyes, C.G.; Thompson, F.; Kohli, S.; Pantelidou, H.; Free, M.; Magnani, G.; Schemel, S. BiodiverCities by 2030: Transforming Cities’ Relationship with Nature; World Economic Forum: Geneva, Switzerland, 2022; p. 51. Available online: https://www3.weforum.org/docs/WEF_BiodiverCities_by_2030_2022.pdf (accessed on 16 August 2025).
- Planning Department. Hong Kong 2030+: A Smart, Green and Resilient City Strategy; Planning Department: Hong Kong, China, 2016; p. 45. [Google Scholar]
- United Nations. Who Cares Wins, Connecting Financial Markets to a Changing World; United Nations: New York, NY, USA, 2004. [Google Scholar]
- Sabirali, K.P. Environmental Social Governance (ESG) Practices: A Systematic Literature Review. S. Asian J. Soc. Stud. Econ. 2024, 21, 224–240. [Google Scholar] [CrossRef]
- Bora, I.; Duan, H.K.; Vasarhelyi, M.A.; Zhang, C.; Dai, J. The transformation of government accountability and reporting. J. Emerg. Technol. Account. 2021, 18, 1–21. [Google Scholar] [CrossRef]
- D’Amato, V.; D’Ecclesia, R.; Levantesi, S. Fundamental ratios as predictors of ESG scores: A machine learning approach. Decis. Econ. Financ. 2021, 44, 1087–1110. [Google Scholar] [CrossRef]
- Eccles, R.G.; Lee, L.-E.; Stroehle, J.C. The social origins of ESG: An analysis of Innovest and KLD. Organ. Environ. 2020, 33, 575–596. [Google Scholar] [CrossRef]
- ISO 37120; Sustainable Cities and Communities—Indicators for City Services and Quality of Life, International Organization for Standardizaiton. International Organization for Standardization: Geneva, Switzerland, 2018. Available online: https://www.iso.org/standard/68498.html (accessed on 16 August 2025).
- UN-Habitat, City Prosperity Initiative: Methodology and Metadata. 2016. Available online: www.undatarevolution.org (accessed on 16 August 2025).
- Grieves, M.; Vickers, J. Digital twin: Mitigating unpredictable, undesirable emergent behavior in complex systems. In Transdisciplinary Perspectives on Complex Systems; Springer: Berlin/Heidelberg, Germany, 2016; pp. 85–113. [Google Scholar] [CrossRef]
- Yin, M.; Reja, V.K.; Wei, R.; Brilakis, I.; Sheil, B.; Perrotta, F.; Marie d’Avigneau, A.; Lu, L. Exploring the value of digital twins for information management in highway asset maintenance. Dev. Built Environ. 2025, 21, 100614. [Google Scholar] [CrossRef]
- Eastman, C.C.M.C.; Eastman, C.C.M.C.; Teicholz, P.; Sacks, R.; Liston, K. BIM Handbook: A Guide to Building Information Modeling for Owners, Managers, Designers, Engineers and Contractors, 2nd ed.; John Wiley & Sons: Hoboken, NJ, USA, 2011. [Google Scholar]
- Peng, Z.-R.; Tsou, M.-H. Internet GIS: Distributed Geographic Information Services for the Internet and Wireless Network, 1st ed.; John Wiley & Sons: Hoboken, NJ, USA, 2003. [Google Scholar]
- Gubbi, J.; Buyya, R.; Marusic, S. Palaniswami, Internet of Things (IoT): A vision, architectural elements, and future directions. Future Gener. Comput. Syst. 2013, 29, 1645–1660. [Google Scholar] [CrossRef]
- Gu, Y.; Katz, S.; Wang, X.; Vasarhelyi, M.; Dai, J. Government ESG reporting in smart cities. Int. J. Account. Inf. Syst. 2024, 54, 100701. [Google Scholar] [CrossRef]
- Dovolil, P.; Svitek, M. Integrating ESG into the Smart City Concept with Focus on Transport. In Proceedings of the 2024 Smart City Symposium Prague (SCSP), Prague, Czech Republic, 23–24 May 2024; pp. 1–7. [Google Scholar] [CrossRef]
- Wu, J.; Alias, A.H. Key Factors for Building Information Modelling Implementation in the Context of Environmental, Social, and Governance and Sustainable Development Goals Integration: A Systematic Literature Review. Sustainability 2024, 16, 9504. [Google Scholar] [CrossRef]
- Barykin, S.E.; Strimovskaya, A.V.; Sergeev, S.M.; Borisoglebskaya, L.N.; Dedyukhina, N.; Sklyarov, I.; Sklyarova, J.; Saychenko, L. Smart City Logistics on the Basis of Digital Tools for ESG Goals Achievement. Sustainability 2023, 15, 5507. [Google Scholar] [CrossRef]
- Zhou, Y.; Dan, Z.; Yu, X. Climate-adaptive resilience in district buildings and cross-regional energy sharing in Guangzhou-Shenzhen-Hong Kong Greater Bay Area. Energy Build. 2024, 308, 114004. [Google Scholar] [CrossRef]
- Dan, Z.; Zhou, B.; Zhou, Y. Optimal infrastructures and integrative energy networks for sustainable and energy-resilient city renaissance. Appl. Energy 2025, 387, 125612. [Google Scholar] [CrossRef]
- Dan, Z.; Song, A.; Zheng, Y.; Zhang, X.; Zhou, Y. City information models for optimal EV charging and energy-resilient renaissance. Nexus 2025, 2, 100056. [Google Scholar] [CrossRef]
- ISO 37122; Sustainable Development of Communities—Indicators for Smart Cities. International Organization for Standardization: Geneva, Switzerland, 2017; p. 71. Available online: https://www.iso.org/obp/ui/#iso:std:iso:37122:dis:ed-1:v1:en (accessed on 16 August 2025).
- Godish, T. (Ed.) Indoor Environmental Quality Overview. In Indoor Environmental Quality; CRC Press: Boca Raton, FL, USA, 2001; pp. 301–444. [Google Scholar]
- BEAM Society Limited. BEAM Plus for New Buildings; BEAM Society Limited: Hong Kong, 2012; p. 2. [Google Scholar]
- B/T 50378; Assessment Standard for Green Building China. Ministry of Housing and Urban-Rural Development (MOHURD): Beijing, China, 2019.
- Gavaldà, O.; Gibbs, C.; Eicker, U. A Review of Current Evaluation Urban Sustainability Indicator Frameworks and a Proposal for Improvement. Sustainability 2023, 15, 15425. [Google Scholar] [CrossRef]
- Fosu, R.; Suprabhas, K.; Rathore, Z.; Cory, C. Integration of Building Information Modeling (BIM) and Geographic Information Systems (GIS)–a literature review and future needs. In Proceedings of the 32nd CIB W78 Conference, Eindhoven, The Netherlands, 26–29 October 2015; pp. 27–29. [Google Scholar]
- Open Geospatial Consortium, CityGML. 2025. Available online: https://www.ogc.org/standards/citygml (accessed on 16 August 2025).
- buildingSMART Team, Industry Foundation Classes (IFC). 2025. Available online: https://www.buildingsmart.org/standards/bsi-standards/industry-foundation-classes (accessed on 16 August 2025).
- Kang, T.W.; Hong, C.H. A study on software architecture for effective BIM/GIS-based facility management data integration. Autom. Constr. 2015, 54, 25–38. [Google Scholar] [CrossRef]
- De Laat, R.; Van Berlo, L. Integration of BIM and GIS: The development of the CityGML GeoBIM extension. In Advances in 3D Geo-Information Sciences; Springer: Berlin/Heidelberg, Germany, 2011; pp. 211–225. [Google Scholar]
- Isikdag, U.; Underwood, J.; Aouad, G. An investigation into the applicability of building information models in geospatial environment in support of site selection and fire response management processes. Adv. Eng. Inform. 2008, 22, 504–519. [Google Scholar] [CrossRef]
- Yuan, Z.; Shen, G.Q.P. Using IFC standard to integrate BIM models and GIS. In Proceedings of the International Conference on Construction and Real Estate, Brisbane, Australia, 1–3 December 2010. [Google Scholar]
- Deng, Y.; Cheng, J.C.P.; Anumba, C. Mapping between BIM and 3D GIS in different levels of detail using schema mediation and instance comparison. Autom. Constr. 2016, 67, 1–21. [Google Scholar] [CrossRef]
- Liu, X.; Wang, X.; Wright, G.; Cheng, J.; Li, X.; Liu, R. A state-of-the-art review on the integration of Building Information Modeling (BIM) and Geographic Information System (GIS). ISPRS Int. J. Geo-Inf. 2017, 6, 53. [Google Scholar] [CrossRef]
- Shi, J.; Pan, Z.; Jiang, L.; Zhai, X. An ontology-based methodology to establish city information model of digital twin city by merging BIM, GIS and IoT. Adv. Eng. Inform. 2023, 57, 102114. [Google Scholar] [CrossRef]
- Isikdag, U. BIM and IoT: A synopsis from GIS perspective. Int. Arch. Photogramm. Remote Sens. Spat. Inf. Sci. 2015, 40, 33. [Google Scholar] [CrossRef]
- buildingSMART Team, ifcOWL. 2025. Available online: https://technical.buildingsmart.org/standards/ifc/ifc-formats/ifcowl (accessed on 16 August 2025).
- Open Geospatial Consortium, World Wide Web Consortium, Semantic Sensor Network Ontology. 2025. Available online: https://www.w3.org/TR/vocab-ssn (accessed on 16 August 2025).
- Saaty, T.L. Decision making—The Analytic Hierarchy and Network Processes (AHP/ANP). J. Syst. Sci. Syst. Eng. 2004, 13, 1–35. [Google Scholar] [CrossRef]
- Dong, Y.; Zhang, G.; Hong, W.C.; Xu, Y. Consensus models for AHP group decision making under row geometric mean prioritization method. Decis. Support Syst. 2010, 49, 281–289. [Google Scholar] [CrossRef]
- Crawford, G.; Williams, C. A note on the analysis of subjective judgment matrices. J. Math. Psychol. 1985, 29, 387–405. [Google Scholar] [CrossRef]
- Santos, M.C.D.; Pereira, F.H. ESG performance scoring method to support responsible investments in port operations. Case Stud. Transp. Policy 2022, 10, 664–673. [Google Scholar] [CrossRef]
- World Health Organization. WHO Global Air Quality Guidelines, Particulate Matter (PM2.5 and PM10), Ozone, Nitrogen Dioxide, Sulfur Dioxide and Carbon Monoxide; WHO: Geneva, Switzerland, 2021; pp. 1–360. [Google Scholar]
- Idowu, S.O.; Capaldi, N.; Zu, L.; Das Gupta, A. (Eds.) Living Planet BT—Encyclopedia of Corporate Social Responsibility; Springer: Berlin/Heidelberg, Germany, 2013; p. 1591. [Google Scholar] [CrossRef]
- Schwab, K. The Global Competitiveness Report 2016–2017; World Economic Forum: Geneva, Switzerland, 2017. [Google Scholar]
- Agugiaro, G.; Benner, J.; Cipriano, P.; Nouvel, R. The Energy Application Domain Extension for CityGML: Enhancing interoperability for urban energy simulations, Open Geospatial Data. Softw. Stand. 2018, 3, 2. [Google Scholar] [CrossRef]
- Yin, M.; Wu, Z.; Wen, Y.; Tang, L. Visualize GIS, BIM and IoT Data for Comprehensive Green Building Parameters Monitoring. In Proceedings of the 8th International Conference on Innovative Production and Construction, Hong Kong, 7–8 December 2019. [Google Scholar]
- Vanlande, R.; Nicolle, C.; Cruz, C. IFC and building lifecycle management. Autom. Constr. 2008, 18, 70–78. [Google Scholar] [CrossRef]
- Khronos. Khronos Finalizes glTF 1.0 Specification. 2015. Available online: https://www.khronos.org/gltf/ (accessed on 16 August 2025).
- Cesium. Cesium—An Open source Javascript Library for World-Class 3D Globes and Maps. 2018. Available online: https://cesiumjs.org/ (accessed on 16 August 2025).
- GRESB. 2025. Available online: https://www.gresb.com/nl-en/ (accessed on 16 August 2025).
- LSEG. Data & Analytics. 2025. Available online: https://www.lseg.com/en/data-analytics (accessed on 16 August 2025).
- Autodesk Tandem. 2025. Available online: https://intandem.autodesk.com/ (accessed on 16 August 2025).
- Bentley iTwin. 2025. Available online: https://www.bentley.com/software/itwin-platform/ (accessed on 16 August 2025).

| ESG | Sub-Category | Indicator | GIS-BIM-IoT Relevant | Unit | Min | Max | fm |
|---|---|---|---|---|---|---|---|
| Environment | Air Quality | Fine particulate matter (PM2.5) concentration | T | µg/m3 (annual mean) | 5 | 35 | 1.2909 |
| PM10 concentration | T | µg/m3 (annual mean) | 15 | 70 | 1.2955 | ||
| NO2 concentration | T | µg/m3 (annual mean) | 10 | 40 | 1.2037 | ||
| SO2 concentration | T | µg/m3 (24 h mean) | 40 | 125 | 1.3477 | ||
| O3 concentration | T | µg/m3 (8 h mean, peak season) | 60 | 100 | 1.2612 | ||
| CO concentration | T | µg/m3 (24 h mean) | 4 | 7 | 1.3845 | ||
| Number of days with unhealthy air quality | T | days/year | 0 | 30 | 1.2498 | ||
| Number of real-time ICT-based air quality monitoring stations per 100,000 population | T | numbers | 0 | 1 | 0.8528 | ||
| Compliance rate of air quality | T | % | 0 | 100 | 1.2089 | ||
| Climate and Energy | Greenhouse gas emissions measured in tons per capita | T | tCO2e /person/year | 0.5 | 20 | 0.9981 | |
| Percentage of total energy derived from renewable sources | T | % | 0 | 70 | 1.0345 | ||
| Energy consumption of public buildings per year | T | kWh/m2/year | 100 | 350 | 0.8178 | ||
| Percentage of building energy from renewable sources | T | % | 0 | 100 | 0.9997 | ||
| Total electrical energy use per capita | T | kWh/person/year | 40 | 50,000 | 0.8544 | ||
| Energy from wastewater treatment per capita | T | kWh/person/year | 30 | 400 | 0.9138 | ||
| Energy from solid waste per capita | T | kWh/person/year | 10 | 150 | 0.9918 | ||
| Percentage of energy from decentralized production systems | T | % | 0 | 35 | 0.8199 | ||
| Storage capacity of the energy grid per capita | T | kWh/person | 0.05 | 0.6 | 0.8799 | ||
| Percentage of public street lighting in total municipal energy consumption | T | % | 15 | 50 | 0.7912 | ||
| Percentage of street lighting refurbished | T | % | 0 | 100 | 0.7071 | ||
| Green Infrastructure | Green area (hectares) per 100,000 population | T | hectares | 60 | 800 | 0.9186 | |
| Annual number of trees planted per 100,000 population | T | numbers | 100 | 20,000 | 0.8226 | ||
| Percentage of buildings with green roofs | T | % | 0 | 65 | 0.9071 | ||
| Percentage of public landscape areas with permeable or natural materials | T | % | 20 | 80 | 0.9013 | ||
| Kilometers of bicycle paths and lanes per 100,000 population | T | kilometres | 5 | 70 | 0.8639 | ||
| Buildings built/refurbished in last 5 years conforming with green building principles | T | % | 15 | 80 | 0.8933 | ||
| Percentage of public buildings requiring renovation/refurbishment (by floor area) | T | % | 1 | 20 | 0.8464 | ||
| Waste and Water | Percentage of the city population with waste drop-off centres equipped with telemetering | T | % | 20 | 50 | 1.1782 | |
| Percentage of the city’s solid waste that is recycled | T | % | 5 | 85 | 1.1828 | ||
| Percentage of treated wastewater being reused | T | % | 0 | 85 | 1.1254 | ||
| Percentage of reused/recycled construction materials in new buildings | T | % | 0 | 25 | 0.8851 | ||
| Percentage of city population with sustainable access to an improved water source | T | % | 10 | 100 | 1.1352 | ||
| Percentage with telemetering-equipped waste drop-off centers | T | % | 20 | 70 | 0.9200 | ||
| Percentage with door-to-door garbage collection + telemetering | T | % | 10 | 80 | 0.8826 | ||
| Percentage of drinking water under real-time quality monitoring | T | % | 10 | 80 | 1.0930 | ||
| Annual hours of water service interruption per site | T | hours | 0 | 45 | 0.9686 | ||
| Compliance rate of wastewater treatment | T | % | 10 | 100 | 1.3705 | ||
| Compliance rate of water quality | T | % | 30 | 90 | 1.4293 | ||
| Biodiversity and Environment | Hazardous Waste Generation per capita (tonnes) | T | tonnes | 0 | 1 | 1.0842 | |
| Percentage change in number of native species | F | % | 30 | 90 | 1.1154 | ||
| Annual frequency of ecosystem remote sensing monitoring | T | days/year | 12 | 60 | 0.9625 | ||
| Social | Health and Livability | Life expectancy | F | years | 55 | 85 | 1.1598 |
| Under-age-five mortality per 1000 live births | F | ‰ | 5 | 100 | 1.2673 | ||
| Square meters of public outdoor recreation space per capita | T | m2 | 2 | 25 | 0.9408 | ||
| Noise pollution | T | dB | 30 | 60 | 1.0304 | ||
| Percentage of population registered with air and water quality alert systems | T | % | 0 | 100 | 0.9269 | ||
| Percentage of natural-hazard-related deaths per 100,000 population | T | % | 0 | 20 | 1.1700 | ||
| Percentage of deaths by industrial accidents per 100,000 population | T | % | 0 | 25 | 1.1767 | ||
| Percentage of annual expenditure on emergency management planning | F | % | 5 | 15 | 1.1319 | ||
| Percentage of buildings meeting thermal comfort standards | T | % | 10 | 50 | 0.9414 | ||
| Percentage of buildings with optimized natural lighting | T | % | 10 | 50 | 0.8572 | ||
| Percentage of buildings with certified acoustic performance | T | % | 10 | 50 | 0.8503 | ||
| Percentage of buildings with continuous IAQ monitoring | T | % | 5 | 50 | 0.8984 | ||
| Mobility and Access | Annual number of public transport trips per capita | T | trips | 30 | 560 | 0.9051 | |
| Percentage of commuters using a travel mode other than a personal vehicle | T | % | 20 | 70 | 0.9522 | ||
| Percentage of city area mapped by real-time interactive street maps | T | % | 28 | 80 | 0.8380 | ||
| Percentage of city streets with real-time traffic alerts | T | % | 20 | 80 | 0.9535 | ||
| Percentage of traffic lights that are intelligent/smart | T | % | 5 | 50 | 0.9644 | ||
| Area of site with internet connections | T | % | 20 | 80 | 1.1814 | ||
| Percentage of city area covered by municipally provided Internet | T | % | 40 | 70 | 1.1814 | ||
| Average downtime of city’s IT infrastructure per year | T | hours | 0 | 48 | 1.1539 | ||
| Housing and Equity | Percentage of city population living in dwellings that are under registered tenure | T | % | 50 | 95 | 0.8633 | |
| Percentage of city population living in slums | T | % | 5 | 50 | 0.9755 | ||
| Average Living Area per Capita | T | m2 | 10 | 60 | 0.9590 | ||
| Number of homeless per 100,000 population | F | % | 0 | 400 | 1.0589 | ||
| Percentage of households with smart electricity meters | T | % | 5 | 90 | 0.8086 | ||
| Percentage of households with smart water meters | T | % | 5 | 90 | 0.8115 | ||
| Governance | Participation | Voter participation in last municipal election | F | % | 20 | 90 | 0.9681 |
| Civic Participation | F | 0.2 | 0.9 | 0.9389 | |||
| Transparency | Number of convictions for corruption and/or bribery by city officials | F | numbers | 10 | 90 | 0.9871 | |
| Existence of open government data platform | F | scores | 0 | 10 | 1.0184 | ||
| Access to Public Information | F | % | 0 | 100 | 1.0598 | ||
| Policy and Planning | Existence of participatory budgeting mechanisms | F | % | 2 | 10 | 1.0306 | |
| Existence of a public climate action plan | F | 0 | 1 | 1.0310 | |||
| Green Spending Share | F | % | 10 | 45 | 1.1075 | ||
| Land Use Efficiency | T | ratio | 0 | 3 | 0.9389 | ||
| Land Use Mix | T | 0 | 1.61 | 0.9317 | |||
| Annual number of citizens engaged in urban planning per 100,000 | F | numbers | 100 | 2000 | 0.8741 | ||
| Average time for building permit approval | T | days | 20 | 200 | 0.7634 | ||
| Percentage of buildings certified under recognized green building standards | F | % | 10 | 50 | 0.9803 | ||
| Percentage of sites delivered to full BIM | T | % | 0 | 70 | 0.9112 | ||
| Fiscal Governance | Local Expenditure Efficiency | F | 0 | 200 | 0.9683 | ||
| Percentage of municipal budget spent on smart city innovations and initiatives per year | F | % | 0 | 3 | 1.0000 |
| LoD Level | Representation Characteristics | Included Building Elements |
|---|---|---|
| LoD1 | Simplified block model with flat roof | Building volume |
| LoD2 | Adds roof details and external attachments such as balconies | Roof structures, balconies |
| LoD3 | Complete exterior structure, including walls, roof, and possibly openings | Exterior walls, roof, and possibly doors/windows |
| LoD4 | Includes internal structural components | Rooms, interior walls, stairs, furniture, etc. |
Disclaimer/Publisher’s Note: The statements, opinions and data contained in all publications are solely those of the individual author(s) and contributor(s) and not of MDPI and/or the editor(s). MDPI and/or the editor(s) disclaim responsibility for any injury to people or property resulting from any ideas, methods, instructions or products referred to in the content. |
© 2025 by the authors. Licensee MDPI, Basel, Switzerland. This article is an open access article distributed under the terms and conditions of the Creative Commons Attribution (CC BY) license (https://creativecommons.org/licenses/by/4.0/).
Share and Cite
Wu, Z.; Islam, S.; Tang, L. Visualizing ESG Performance in an Integrated GIS–BIM–IoT Platform for Strategic Urban Planning. Buildings 2025, 15, 3394. https://doi.org/10.3390/buildings15183394
Wu Z, Islam S, Tang L. Visualizing ESG Performance in an Integrated GIS–BIM–IoT Platform for Strategic Urban Planning. Buildings. 2025; 15(18):3394. https://doi.org/10.3390/buildings15183394
Chicago/Turabian StyleWu, Zhuoqian, Shareeful Islam, and Llewellyn Tang. 2025. "Visualizing ESG Performance in an Integrated GIS–BIM–IoT Platform for Strategic Urban Planning" Buildings 15, no. 18: 3394. https://doi.org/10.3390/buildings15183394
APA StyleWu, Z., Islam, S., & Tang, L. (2025). Visualizing ESG Performance in an Integrated GIS–BIM–IoT Platform for Strategic Urban Planning. Buildings, 15(18), 3394. https://doi.org/10.3390/buildings15183394


