Abstract
For the possible damage to overhead pipelines caused by gas explosions in utility tunnels, an overall three-dimensional finite-element model of utility tunnel–soil–pipeline is established, the overpressure loads are applied to the inner wall of the gas chamber in the utility tunnel, the dynamic response laws of the utility tunnel and the pipeline are calculated and analyzed, and anti-explosion protection measures are proposed. The results show that the degree of damage to the pipe wall is determined by both the explosion-impacted area and the soil constraint. Under the same explosion-impacted area, the peak horizontal displacement of the monitoring point without soil constraint is 1.64 times that with soil constraint, and 1.29 times for the peak vertical displacement. The damage to the lower part of the pipeline is significantly greater than that to the upper part of the pipeline, and the damage to the pipeline decreases with an increase in the horizontal angle between the utility tunnel and the pipeline. The diameter deformation rates were 49% at α = 0° and 84% at α = 45°, with α = 90° showing the least damage. Therefore, it is suggested that the overhead pipeline is perpendicular to the utility tunnel. As the vertical distance between the utility tunnel and the pipeline increases, the diameter deformation rate and displacement of the pipeline both decrease, and when this distance is greater than 3 m, the influence on the pipeline significantly decreases. Therefore, it is recommended that the distance between the pipeline and the utility tunnel should be at least 3 m. In addition, the damage caused by gas explosions to the overhead pipeline can be reduced by reinforcing the gas chamber, using energy-absorbing materials around the utility tunnel, and setting up hollow piles between the utility tunnel and pipelines.
1. Introduction
In recent years, the construction scale of utility tunnels in China has continued to expand, and their number has also shown a significant upward trend [1]. At the same time, various types of pipelines have been introduced into the utility tunnels, causing the cross-sectional form of the utility tunnels to gradually develop towards larger and more comprehensive directions. For example, the double-layer utility tunnel on Nanbinhe Road in Lanzhou [2], the multi-layer utility tunnel in Xiong’an New Area [3], and abroad, the La Défense New Town utility tunnel built in the new urban area of Paris in France, the Yokohama 21st Century Future Port utility tunnel in Japan, the Xinyi Line utility tunnel in Taiwan Province, and the Marina Bay underground utility tunnel in Singapore [4] are all typical representatives.
However, gas leakage and explosion accidents occur from time to time. For instance, in July 2017, a gas pipeline explosion occurred in Songyuan City, Jilin Province, China, killing 7 people and injuring 85. In September 2018, natural gas pipeline explosions occurred successively in three communities in Boston, MA, USA; this incident led to 60–100 fires and the destruction of 70 houses. In January 2019, a gas leakage in the center of Paris led to an explosion, killing 4 people and injuring 54. In February 2019, a gas pipeline explosion occurred in a block in San Francisco, CA, USA, causing a fire in a restaurant. In January 2021, a gas pipeline explosion occurred in Dalian City, Liaoning Province, China. The cause of the accident was that the lack of soil support at the bottom of the pipeline caused part of the pipeline to be suspended, the anti-corrosion coating in the weld area at the pipeline crack was missing, and the circumferential weld of the pipeline cracked and leaked, spreading to the surroundings to form an explosive gas, which exploded when encountering an open flame. The accident killed three people and injured eight. In June 2021, a natural gas leakage occurred in Shiyan City, Hubei Province, followed by an explosion, trapping many people; eventually, 25 people were killed, and 138 were injured. These incidents undoubtedly pose a threat to the utility tunnels themselves and the surrounding environment. Therefore, many scholars have carried out research on aspects such as gas explosion overpressure, propagation laws, structural damage, and the impact on the surrounding environment through experimental or numerical methods.
In terms of experiments, Li et al. [5] concluded through experiments that the peak overpressure is the largest (0.115 MPa) when the gas concentration in a closed space is 9.5%. Tian et al. [6] measured the pressures of gas explosions at different concentrations by experimental methods and explored the changes in the peak pressure rise rate at different gas concentrations. Shearer et al. [7] obtained the gas explosion load curve through explosion experiments. Ajrash et al. [8] also obtained a gas explosion load curve similar to that of Shearer. Wu et al. [9] used the self-developed utility tunnel gas explosion experimental system and found that when the volume fraction of methane is 9.5%, the peak explosion overpressure is the largest, reaching 0.308 MPa. Yan et al. [10,11] conducted closed explosion experiments for methane–air mixed gas and concluded that the peak overpressure of gas explosions first increases and then decreases with the increase in concentration. Cao J. et al. [12] studied the impact of natural gas explosions with different hydrogen addition amounts on the utility tunnel through experiments. The research showed that when the hydrogen addition amount is higher than 20%, the explosion characteristics are mainly determined by hydrogen, and when it is less than 20%, they are mainly determined by natural gas. Chen et al. [13] carried out full-scale utility tunnel gas explosion tests. The results showed that the pipelines in the utility tunnel were relatively safe, but the accessories were severely damaged. Duan et al. [14] studied explosion vents through experiments. The research showed that the increase in the venting area helps to reduce the peak overpressure in the utility tunnel, and the closer the venting position is to the fire source, the better the effect. From the above research, it can be seen that many scholars essentially agree with the conclusion that the peak overpressure occurs when the gas concentration is 9.5%, but the specific values of the peak overpressure are not consistent.
Due to the high-risk and high-cost characteristics of explosion tests, many scholars have chosen to conduct relevant research through numerical simulation. Liu et al. [15] used ANSYS16.0 to equivalent the blasting load to a triangular load, and they explored the dynamic response of the air chamber under different time histories and peak loads. It was found that the pipeline under blasting was less affected by the blasting, and the blasting action time was relatively long. Zhang et al. [16] used ANSYS software to establish a three-compartment model of the utility tunnel and a cross-intersection node utility tunnel model. Partitions were used to simulate the congestion inside the utility tunnel, and the influence of different partitions on the gas explosion was studied. It was found that the thicker the partition, the less the overall impact on the utility tunnel. Shi et al. [17] adopted the finite-element method to study the dynamic response and damage of underground buildings under blasting. It was found that the explosion could cause serious damage to the structure, and corresponding reinforcement measures should be taken. Wang et al. [18] conducted a study involving calculation and a three-stage analysis, and they explored the response of underground buildings at different blasting locations under conditions with or without protection. The conclusion was that when the explosion’s starting point was at the center of the structure, the impact on the structure was the most intense. Feng et al. [19] used ABAQUS software to study the response of tunnels with different cross-sections to explosions. It was found that circular tunnels were the least affected by the explosion, while horseshoe-shaped tunnels were the most affected. Zhou et al. [20] designed and constructed a small-scale shallow-buried urban underground tunnel, carried out on-site explosion experiments, and explored the changes in peak loads under different TNT equivalents. The conclusion was that the peak load increased with the increase in the TNT equivalents, and it could reach up to 0.303 MPa at most. The top of the tunnel was the most vulnerable area, and the degree of damage became more and more serious as the scaled distance decreased. Wang et al. [21] used LS-DYNA to establish a numerical model of an engineering tunnel, explored the influence of different concrete strengths on the explosion, and proposed explosion-proof measures according to the explosion characteristics. The conclusion was that gas explosion loads with high overpressure peaks could lead to serious explosion accidents, tunnel damage, and the failure of internal partitions. Tian et al. [22] used LS-DYNA to study the internal explosion of the gas chamber under different TNT charges. It was found that the peak shockwave overpressure on the center line of the internal air showed a trend of first decreasing, then increasing, and finally decreasing during the propagation process, and the displacement of the upper roof was relatively large, so strengthening it should be given priority. Xia et al. [23] used LS-DYNA to conduct a dynamic response analysis of the utility tunnel under different explosion points and charge amounts. It was found that the reinforcement of the utility tunnel structure affected the degree of damage to the utility tunnel, and the blast-facing surface of the utility tunnel was the main damaged part. Xu et al. [24] optimized the design of the pressure-relief openings of the underground utility tunnel through FLACS. By designing the pressure-relief openings, the explosion overpressure of the gas was effectively alleviated. Xue et al. [25] simulated the dynamic response of urban utility tunnels under natural gas explosions. It was found that the compressive stress and tensile stress zones in the utility tunnel were alternately distributed, and the most dangerous points of the structure were located at the inner corners and outer walls. Gao et al. [26] used LS-DYNA to analyze the dynamic response characteristics and the entire process of damage to the utility tunnel structure under internal gas explosions, revealed its failure mechanism, and proposed using polyurea coatings for reinforcement, as well as reinforcing the mid-span positions of the roof and side walls with higher-strength steel bars. Wu et al. [27] and Wang et al. [28] each studied the influence of porous structures on the gas explosion propagation law in the underground utility tunnel through simulation. It was found that the small pores inside the porous structure could effectively absorb pressure waves and combustion waves, thus suppressing the explosion propagation. Pang et al. [29] studied different support spacings in the utility tunnel. The results showed that a smaller support spacing could make the gas distribution more uniform, thereby increasing the flame propagation speed. Zhang et al. [30] studied the influence of the bending angle of the utility tunnel and the hydrogen concentration on the explosion. The results showed that the greater the bending degree of the pipeline, the greater the overpressure inside the utility tunnel, but the slower the flame propagation speed. The influence of the hydrogen concentration on the explosion first increased and then decreased with the increase in the concentration. Xia et al. [31] designed a ribbed, thin-walled UHPC utility tunnel structure and calculated it through numerical simulation. The results showed that this structure could effectively improve the explosion resistance of the utility tunnel. The above-mentioned research analyzed the impact of gas explosions on the utility tunnel itself, and it determined the damage laws and vulnerable parts of the utility tunnel under different loads, different detonation points, and different cross-sections.
In addition to causing damage to the structure of the utility tunnel itself, the gas explosion in the gas compartment of the utility tunnel will also have a certain impact on the external environment. Cai et al. [32] used the LS-DYNA finite-element software to study the dynamic response of the water supply tunnel below when an accidental explosion occurs in a highway tunnel. Anirban et al. [33] studied the impact of different explosion points on the tunnel and concluded that increasing the overburden layer and adding a PU geotextile slope protection could reduce the damage caused to the tunnel by blasting. Anirban et al. [34] explored the effect of the thickness of the blasting-protective cover on the tunnel by using the blasting effect of the compressible PU geotechnical foam enclosure structure in surface blasting. It was found that as the thickness increases, the protective effect of the shielding layer will be enhanced accordingly, but it can only be strengthened above a certain thickness, and when the thickness reaches a certain level, it will stop protecting the tunnel. Schecklinski et al. [35,36] carried out tunnel blasting experiments to explore the impact of partitions with different heights and thicknesses on the overpressure and impulse of the blasting shockwave. Copper et al. [37] used the numerical simulation method to explore the effect of the burning rate on the overpressure and found that the faster the burning rate, the greater the peak overpressure load. Bao et al. [38] used a self-developed explosion pressure-relief device to explore the impact of tunnels with different shapes on the pressure-relief efficiency, and they found that the pressure-relief efficiency of circular tunnels is stronger than that of tunnels with other shapes. Liu et al. [39], taking the New York subway system as the background, used ABAQUS software to study the impact of factors such as explosive equivalent, soil stiffness, and strength on the dynamic response of the subway tunnel structure under explosion. Wang et al. [40] studied the impact of gas explosions in the utility tunnel on adjacent subway tunnels under different burial depths, different zenith distances, and different angles. Wang et al. [41] studied the impact of gas explosions in the utility tunnel on the safety of the under-passing tunnel structure, analyzed the impact rules of the tunnel at different distances from the utility tunnel, and determined the safe distance. The above research analyzed the impact of gas explosions on underground structures such as the ground surface or tunnels, and it clarified the impact of different distances between structures, different layout methods, different soil types, different overburden thicknesses, and different protective measures on the damage results.
Based on the above-mentioned research, there is still no consensus on the overpressure laws in current gas explosion experiments for utility tunnels. Moreover, reports on the safety impact of gas explosions in common double-layer multi-compartment utility tunnels on adjacent underground structures are relatively scarce. Therefore, based on field model experiments and existing theoretical research, combined with actual underground double-layer comprehensive utility tunnel projects, this article uses numerical methods to study and analyze the dynamic response and failure law of the overhead pipeline under the action of a gas explosion in the comprehensive utility tunnel, and to simplify the overpressure time-history curve. Through three-dimensional finite-element modeling of the soil–utility tunnel–pipeline structure, the optimal spacing between pipelines and utility tunnels and the influence of protective measures are studied, aiming to improve the anti-explosion ability of the overhead pipeline in the comprehensive utility tunnel, and to provide a scientific basis for the anti-explosion protection of pipelines and utility tunnels.
2. Computational Model
The three-dimensional finite-element modeling of the soil–utility tunnel–pipeline structure was carried out using ABAQUS. According to the engineering data, the utility tunnel adopted in this chapter is a double-layer structure composed of four compartments: the power compartment, the thermal compartment, the gas compartment, and the comprehensive compartment. The specific parameters are shown in Figure 1a. The overall cross-sectional size is 9.5 m × 7.3 m. The inner diameter of the overhead pipeline is 1 m, the pipe wall thickness is 100 mm, and the burial depth is 2 m. The calculation length of the model is 20 m, and the infinite-element boundary is adopted. The schematic diagram of the relative position between the pipeline and the utility tunnel is shown in Figure 1b, where L is the distance from the lower part of the pipeline to the utility tunnel, and α is the angle between the pipeline and the utility tunnel. The cross-sectional size of the soil is 70 m × 45 m, and the longitudinal length is 20 m.
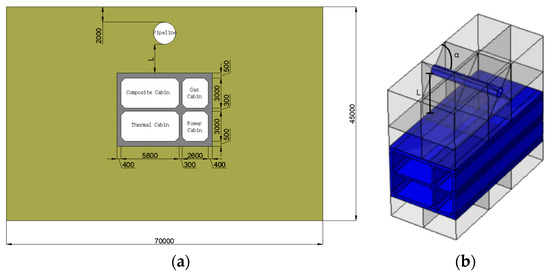
Figure 1.
Computational model: (a) Calculation parameters of the utility tunnel (mm). (b) The relative position between the pipeline and the utility tunnel.
The upper surface of the model is a free boundary, while the lower surface and the surrounding surfaces adopt infinite-element boundaries to simulate the semi-infinite soil mass. The soil uses the Mohr–Coulomb constitutive model, the concrete adopts the Concrete Damage Plasticity (CDP) model, and the steel bars use the plastic model. The utility tunnel is made of C45 concrete and HRB335 steel bars; the pipeline is made of C30 concrete. The internal friction angle of the soil is 12°, and the cohesion is 35 kPa. The material parameters are shown in Table 1. The values of each parameter are derived from on-site geotechnical investigation data and laboratory test results.

Table 1.
Material parameters.
3. Gas Explosion Load
Figure 2 presents the measured overpressure time history of the gas explosion [41]. The overpressure peak value at measuring point #1 is much larger than that at measuring point #3, and the overpressure data is relatively complete, with an obvious pressure rise and fall. The maximum measured overpressure is 0.63 MPa, and the time duration for both the pressure rise and fall of the gas explosion is about 0.1 s. To evaluate the overall deformation, referring to Refs. [15,41], the measured overpressure time history at the measuring points is simplified to obtain a three-stage simplified overpressure time-history curve OABC, as shown in Figure 3. Here, the negative pressure is ignored and the stable situation is considered. The starting moment is taken at 0.3 s (point O). For the sake of safety, the peak overpressure value is taken as 0.7 MPa (point B), and 0.1 times the peak overpressure value is 0.07 MPa (point A, at 0.55 s). The time for both the pressure-rising section AB and the pressure-falling section BC is 0.1 s. During the actual calculation, the load of section A0BC is uniformly applied to the inner wall of the gas chamber of the utility tunnel. The duration of both section A0B and section BC is 0.1 s, and the peak overpressure value is 0.7 MPa.
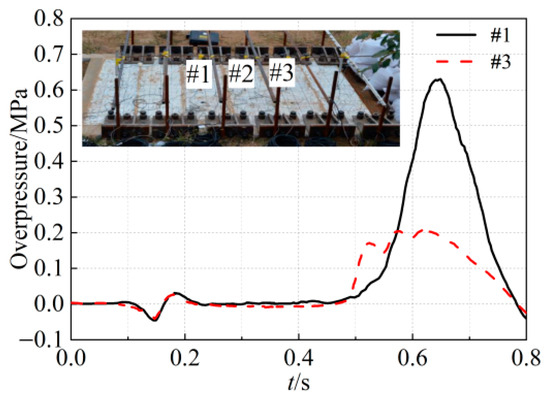
Figure 2.
The measured overpressure time history of the gas explosion.
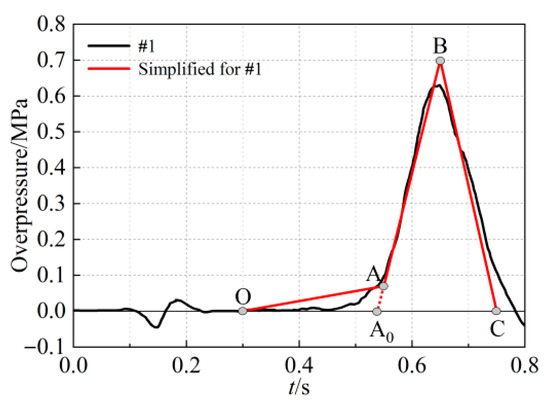
Figure 3.
Simplified overpressure time history of the utility tunnel.
4. Numerical Simulation
This paper mainly focuses on the impact of gas explosions in utility tunnels on the tunnels themselves and the pipelines crossing above them, and it proposes protective measures for the blast resistance of gas in utility tunnels. It emphasizes the analysis of the dynamic response laws of utility tunnels under gas explosions, and it presents the variation laws of damage with the included angle, the safe burial depth, and the protective measures.
4.1. The Impact of Gas Explosions on Utility Tunnels
In this section, the working condition when L = 5 m and α = 0° is discussed. Figure 4 shows the schematic diagram of the positions of various monitoring points of the model. By studying the dynamic response of the two-layer utility tunnel structure under the action of the explosion, the peak value of gas explosion is taken as 0.7 MPa, the duration of the gas explosion load is 0.2 s (with the pressure-rising and pressure-reducing time being 0.1 s each), and the overall calculation time is 0.4 s.
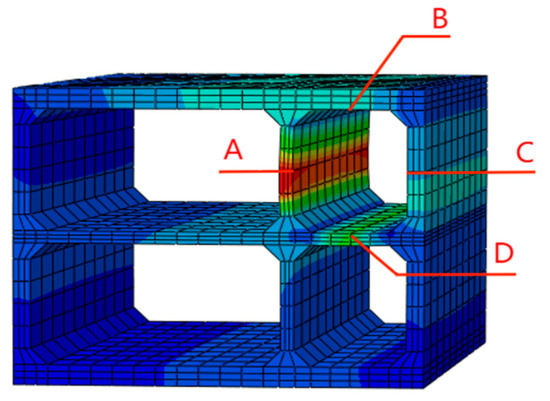
Figure 4.
Schematic diagram of monitoring points: Points A-D are the feature points that need to be analyzed.
It can be clearly seen from the stress and displacement distribution results shown in Figure 5a–c that there is a significant mechanical response concentration phenomenon in multiple key parts of the gas tank structure. Specifically, the stress concentration effect caused by geometric mutations is significant in each corner area, where the stress value is significantly higher than in the surrounding area, indicating that the corner position has become a potential high-risk point under load. At the same time, there are also signs of local damage at the junction between the intermediate partition and the upper and lower plates, which may be manifested as stress exceeding the material yield limit or plastic deformation, reflecting that the connection area was subjected to significant lateral or out-of-plane loads in the structural force transmission path. In addition, the partition connected to the adjacent compartment on the left experienced significant displacement in the middle, indicating that the stiffness at this location is relatively weak or the bending moment is large, which may result in interface coordination deformation or insufficient boundary constraints. Overall, gas chambers exhibit significant uneven stress characteristics in complex load environments, and certain critical connection areas and geometric discontinuities require special attention to prevent structural failure.
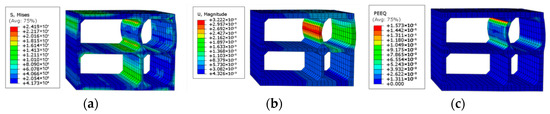
Figure 5.
Nephograms of the utility tunnel under gas load: (a) Stress nephogram of the utility tunnel. (b) Displacement nephogram of the utility tunnel. (c) Equivalent plastic strain nephogram of the utility tunnel.
Figure 6a presents the time-history diagrams of displacement at points A, B, C, and D in the center of the side wall of the gas compartment. It can be observed from the figure that the displacement at each point of the utility tunnel’s side wall increases rapidly as the explosion progresses, and then the growth rate gradually decreases. Analyzing the reasons for this situation, this is caused by the relatively slow pressure increase and the long duration of the gas explosion load. After the action time (0.2 s) of the gas explosion load ends, the inner wall of the utility tunnel lining will continue to generate displacement due to its own inertia, resulting in continuous deformation, and plastic deformation occurs. In the gas compartment, point A and point C have the same affected areas, while point B and point D have the same affected areas. From Figure 6b,c, it can be seen that point A and point C mainly experience displacement in the X-direction, while point B and point D mainly experience displacement in the Y-direction. Moreover, the displacement of point A is 1.64 times that of point C, and the displacement of point D is 1.29 times that of point B. The reason for this is that the soil on the top and right-hand side walls of the utility tunnel restricts the displacement and deformation, so the damage caused is less than that to the bottom and left-hand side walls. The above content indicates one point: When a gas explosion occurs in the utility tunnel, the pipe wall mainly shows a tendency to expand in all directions along the tunnel wall. The degree of damage to the pipe wall is jointly determined by the explosion-affected area and whether there is soil constraint. The left-hand side wall of the utility tunnel has the largest explosion-affected area among the four side walls and is not constrained by soil, so it can be judged as the weakest position in the entire tunnel. To ensure the safety of the entire utility tunnel, it is necessary to consider strengthening the weak position in the blast-resistant design of the utility tunnel.
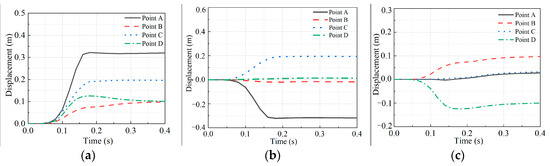
Figure 6.
Time-history diagrams of displacement at monitoring points: (a) Total displacement of the monitoring point. (b) Displacement of the monitoring point in the X-direction. (c) Displacement of the monitoring point in the Y-direction.
4.2. The Impact of Gas Explosions on Pipelines Under Different Angular Conditions
This section focuses on investigating the disparities in the damage impacts of gas explosions on pipelines when the angles between the upward-crossing pipelines and the utility tunnel are different. Specifically, cases with L = 5 m and α of 0°, 45°, and 90° are selected for discussion. In this study, the diameter deformation rate is utilized as the criterion for assessing the degree of pipeline damage. The diameter deformation rate is defined as the ratio of the variation in the vertical diameter of the structure to its vertical inner diameter. At present, there are relatively few well-established research findings regarding the limit value of the diameter deformation rate. According to the “Code for design of oil transportation pipeline engineering” [42], the horizontal diameter deformation of the pipeline must not exceed 3% of the pipe’s outer diameter. The “Code for design of metro” [43], based on past engineering experiences, stipulates that the diameter deformation rate should be maintained within the range of 4–6%.
Figure 7 depicts the Mises stress nephograms of the pipeline under different angles between the pipeline and the utility tunnel. As can be observed from the figure, when α = 0°, the explosion travels from the lower part of the pipeline towards the upper part. When α = 45° and α = 90°, not only does the explosion propagate from the lower part to the upper part, but it also continues to spread from the location directly beneath the gas compartment towards both ends. The propagation of the explosion invariably commences from the area where the pipeline is adjacent to the gas pipeline gallery. When α = 0°, the maximum stress borne by the pipeline is 18.69 MPa. When α = 45°, the maximum stress of the pipeline reaches 17.79 MPa. When α = 90°, the maximum stress of the pipeline is 16.36 MPa. Notably, the stress is at its peak when the angle is 0°, being approximately 1.05-fold that of α = 45° and 1.14-fold that of α = 90°. When the pipeline is parallel to the utility tunnel (0°), it will bear intact and unchanged tensile and compressive strains along the direction of the wave propagation axis. As the angle increases, the pipeline is no longer completely aligned with the main direction of strain in the utility tunnel. Evidently, the stress exerted on the pipeline diminishes as the angle increases.
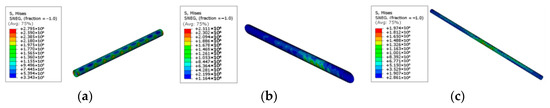
Figure 7.
Stress nephograms at different angles: (a) Stress nephogram when α = 0°. (b) Stress nephogram when α = 45°. (c) Stress nephogram when α = 90°.
The upper point (designated as point 1) and the lower point (designated as point 2) on the middle cross-section of the pipeline at various angles were individually chosen as monitoring points to conduct an in-depth study on the damage state of the pipeline. Figure 8 presents the displacement time-history curves of each reference point under different angular conditions between the pipeline and the utility tunnel. As is evident from the figure, at 0.1 s, under the impact of the explosion, the displacement surges rapidly. Subsequently, once the explosion ceases, the structure continues to experience displacement owing to the effect of inertia. It can be clearly observed that, at each angle, the displacement of the lower point is invariably greater than that of the upper point. Specifically, the peak displacement of monitoring point 1 when α = 0° is 1.2-fold that when α = 45° and 1.24-fold that when α = 90°. Similarly, the peak displacement of monitoring point 2 when α = 0° is 1.2-fold that when α = 45° and 1.26-fold that when α = 90°. Given that the damage initiates from the lower part of the pipeline and then spreads upwards, and that it diffuses in all directions from the upper part of the gas compartment, the damage inflicted on the lower part of the pipeline is markedly more severe than that on the upper part. Consequently, to mitigate the damage, it is advisable to reinforce the soil at the lower part of the pipeline or strengthen the upper part of the gas compartment.
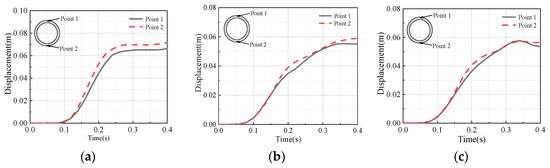
Figure 8.
Displacement time-history diagrams of pipeline monitoring points at different angles: (a) Displacement of the monitoring point when α = 0°. (b) Displacement of the monitoring point when α = 45°. (c) Displacement of the monitoring point when α = 90°.
Based on the data collected from the monitoring points, the diameter deformation rate of the pipeline can be precisely calculated. When α = 0°, the diameter deformation rate of the pipeline is approximately 0.85%. When α = 45°, the diameter deformation rate of the pipeline is 0.50%. When α = 90°, the diameter deformation rate of the pipeline is 0.42%. From the above data, it can be seen that the pipeline suffers the most severe damage when α = 0°, followed by when α = 45°, while the least damage occurs when α = 90°. The deformation rate when α = 90° is only 49% of that when α = 0° and 84% of that when α = 45°.
Through the numerical comparison of the stress borne by the pipeline, pipeline displacement, and diameter deformation rate, it is evident that the pipeline sustains the most severe damage when α = 0°. The underlying reasons for this phenomenon can be analyzed as follows: When α = 0°, the length of the pipeline influenced by the explosion in the gas compartment is considerably longer compared to when α = 45° and α = 90°. After the gas explosion, the soil is compressed, which, in turn, affects the pipeline. As a result, the diameter deformation rate at α = 0° is greater than that at other angles. Relatively speaking, as the pipeline approaches a position perpendicular to the utility tunnel, the length of the pipeline affected by the gas compartment gradually decreases. Consequently, the degree of damage inflicted on the pipeline also diminishes. In summary, the area directly above the gas compartment proves to be the least suitable location for pipeline placement. To mitigate the damage caused by gas explosions, it is advisable to make the pipeline as perpendicular to the gas compartment as possible. This approach effectively reduces the length of the pipeline vulnerable to the influence of the gas compartment.
4.3. The Impact of Gas Explosions on Pipelines Under Different Spacing Conditions
In this section, the primary focus is on investigating the disparities in the damage impacts of gas explosions on pipelines under different angular conditions between the vertically crossing pipelines and the utility tunnel. Specifically, the scenarios α = 0° with L values of 1 m and 3 m are chosen for in-depth discussion.
Figure 9 shows the Mises stress nephograms of the pipeline at different distances between the pipeline and the utility tunnel. As can be seen from the figure, the stress in both cases is transmitted from the lower part to the upper part of the pipeline, and the stress propagation trends are similar. When L = 1 m, the maximum stress of the pipeline is 21.89 MPa; when L = 3 m, the maximum stress of the pipeline is 21.63 MPa. From the above data, it can be known that, as the spacing decreases, the stress on the pipeline increases, but the growth rate is relatively small.
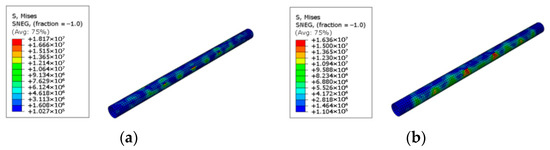
Figure 9.
Stress nephograms at different angles: (a) Stress nephogram when L = 1 m. (b) Stress nephogram when L = 3 m.
Figure 10a,b present the displacement time-history diagrams of the monitoring points under the conditions of L = 1 m and L = 3 m, respectively. Specifically, when L = 1 m, the diameter deformation rate of the utility tunnel amounts to 1.22%, while when L = 3 m, this value is 0.96%. Notably, the deformation rate at L = 1 m is 1.27-fold that at L = 3 m. Evidently, as the spacing between the relevant components reduces, the diameter deformation rate of the pipeline shows a continuous upward trend.
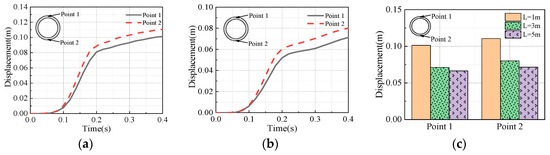
Figure 10.
Displacement diagrams of pipeline monitoring points at different depths: (a) Displacement of the monitoring point when L = 1 m. (b) Displacement of the monitoring point when L = 3 m. (c) Peak displacements at different depths.
Figure 10c depicts the peak displacements of the monitoring points at varying spacings. For monitoring point 1, the peak displacement registers at 101 mm when L = 1 m, 71 mm when L = 3 m, and 66 mm when L = 5 m. Specifically, the peak displacement at L = 1 m is 1.42-fold that at L = 3 m and 1.53-fold that at L = 5 m, while the peak displacement at L = 3 m is 1.07-fold that at L = 5 m. Similarly, for monitoring point 2, the peak displacement reaches 111 mm when L = 1 m, 80 mm when L = 3 m, and 72 mm when L = 5 m. Here, the peak displacement at L = 1 m is 1.38-fold that at L = 3 m and 1.54-fold that at L = 5 m, and the peak displacement at L = 3 m is 1.11-fold that at L = 5 m. Based on these data, it is evident that, between L = 1 m and L = 3 m, the displacement of the monitoring points exhibits higher sensitivity to the spacing between the pipeline and the utility tunnel. In contrast, between 3 m and 5 m, the influence of the spacing on the displacement is less pronounced compared to the range from 1 m to 3 m. In summary, increasing the spacing within 3 m can substantially mitigate the damage caused by gas explosions to the pipeline. However, the pipeline displacement shows little response to further increases in spacing beyond 3 m. Therefore, it is recommended that the optimal spacing between the pipeline and the utility tunnel be set at 3 m.
4.4. The Impact of Protective Measures on Gas Explosions
Figure 11 shows the schematic diagrams of the above-mentioned three measures. To reduce the impact of gas explosions on the overhead pipelines, this paper discusses three implementation methods: (1) Strengthening the Gas Chamber: This method involves using ultra-high-performance concrete in the gas chamber to resist the deformation of the utility tunnel, but the related materials and construction costs will significantly increase. Therefore, its application may only be reasonable in infrastructure projects with extremely high security requirements. (2) Using Energy-Absorbing Materials around the Structure: This approach entails setting up a shock-absorbing layer and backfilling with foam concrete at the outer position of the integrated utility tunnel. A thickness of 1.0 m was used in the simulations. Due to the large number of pores in foam concrete itself, it has excellent characteristics, such as good deformation ability, buffer energy absorption, and easy construction, and it is regarded as an excellent energy-absorbing material. (3) Arranging Hollow Piles between the Utility Tunnel and the Pipelines: The shock-absorbing effect of phononic crystals is simulated by arranging hollow piles between the structures, and the piles featured a square cross-section and are made of C80 concrete. The external side length is 700 mm, with an internal hole diameter of 225 mm. The center-to-center spacing between the piles is set to 1.0 m. In this section, the cases of α = 0° and L = 1 m are selected for discussion.
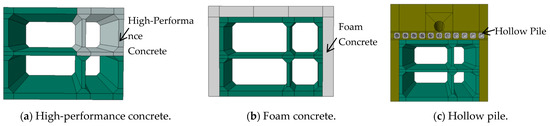
Figure 11.
Different protective measures.
Figure 12 shows the displacement time-history curve of Pipeline Point 2. It can be seen from the figure that the maximum displacement of Pipeline Point 2 without protective measures is 111 mm. When high-performance concrete is used in the gas chamber, the maximum displacement of Point 2 is 0.21 mm. When the periphery of the integrated utility tunnel is backfilled with foam concrete, the maximum displacement of Point 2 is 15 mm. When hollow piles are arranged between the structures, the maximum displacement of Point 2 is 105 mm. From the above data, strengthening the gas chamber, using energy-absorbing materials around it, and arranging hollow piles between the structures can all effectively protect the overhead pipelines. Among these measures, the maximum displacement after strengthening the gas chamber with high-performance concrete is only 0.2% of that without measures. The maximum displacement after backfilling with foam concrete is only 13.5% of that without measures. However, the impact of arranging hollow piles between the structures is relatively limited, with the maximum displacement being 95% of that without measures.
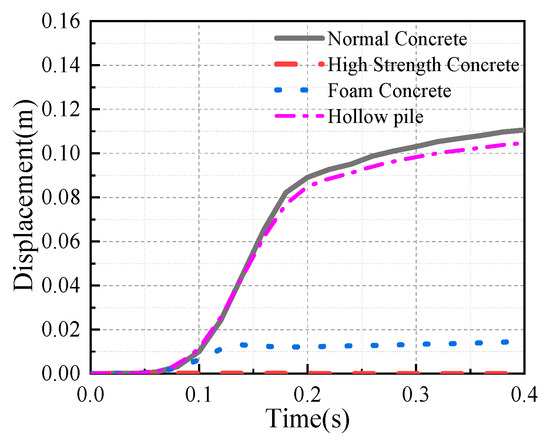
Figure 12.
Displacement time-history curve of Point 2.
Figure 13 depicts the velocity time-history curve of Point 2. Evidently, the peak velocity decreased significantly after the implementation of protective measures. Specifically, the peak velocity of Point 2 after the reinforcement of the gas chamber with high-performance concrete, after backfilling with foam concrete, and after the arrangement of hollow piles between structures is 0.3%, 22.2%, and 87.3%, respectively, compared to that without any measures. Based on the above analysis, it is clear that both reinforcing the gas chamber and using energy-absorbing materials around the utility tunnel can effectively mitigate the damage to the overhead pipelines caused by gas explosions. Although the arrangement of hollow piles between structures also lessens the impact of the explosion on the upper structure, the extent of the reduction is relatively smaller compared to the first two methods. These reinforcement methods can be contemplated for use when it is unfeasible to increase the angle and the distance between the pipeline and the utility tunnel.
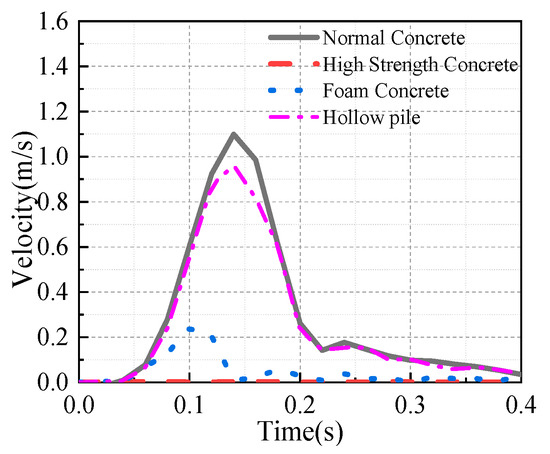
Figure 13.
Velocity time-history curve of Point 2.
5. Conclusions
In combination with a double-deck, four-compartment underground integrated utility tunnel project, a study on safety protection against gas explosions in the utility tunnel’s gas chamber was carried out. Through three-dimensional finite-element modeling and dynamic response analysis of the soil–utility tunnel–pipeline structure using the ABAQUS finite-element software, the following main conclusions were obtained:
- (1)
- Under the action of the gas explosion, the wall of the utility tunnel expands outward. Due to the constraint of the surrounding soil, the deformation of the left wall (unconstrained or weakly constrained side) of the utility tunnel is significantly greater than that of the right wall, and the displacement of the bottom plate is also much greater than that of the top plate. Analysis shows that the pipe wall area with the largest area affected by the explosion and the weakest soil constraint is the most vulnerable weak link in the utility tunnel structure. Therefore, in the blast-resistant design of pipe galleries, special attention should be paid to strengthening these weak areas.
- (2)
- The damage to the overhead pipelines decreases as the angle between the pipelines and the utility tunnel increases. The diameter deformation rate when they are perpendicular is only 49% of that when they are parallel. Therefore, when arranging the pipelines, they should be made as perpendicular to the gas chamber as possible to reduce the length of the pipelines affected by the gas chamber, thereby minimizing the damage caused by gas explosions.
- (3)
- The stress, diameter deformation rate, and displacement of the pipelines all decrease as the distance between the pipelines and the utility tunnel increases. Moreover, increasing the distance within 3 m can significantly reduce the damage to the pipelines caused by gas explosions. However, the pipeline displacement is not sensitive to further increases in the distance beyond 3 m. Therefore, it is recommended that the distance between the pipelines and the utility tunnel be set at 3 m.
- (4)
- The methods of strengthening the gas chamber and using energy-absorbing materials can both effectively reduce the displacement and velocity of the overhead pipelines. Arranging hollow piles can also play a certain protective role. These strengthening methods can be considered for use when it is impossible to increase the angle and the distance between the pipelines and the utility tunnel.
- (5)
- This study provides a theoretical basis and practical suggestions for the blast-resistant design of underground utility tunnel systems. Future research could further explore the effects of different parameters on explosions and the application of new high-performance protective materials.
Author Contributions
Conceptualization, D.W.; Data Curation, J.D. (Jian Dong); Formal Analysis, J.D. (Jian Dong); Funding Acquisition, D.W.; Investigation, X.C. and D.S.; Methodology, X.C., J.D. (Jianmei Du) and J.K.; Resources, J.D. (Jianmei Du); Validation, D.S.; Visualization, J.K.; Writing—Original Draft, D.W. and J.D. (Jian Dong); Writing—Review and Editing, J.K. All authors have read and agreed to the published version of the manuscript.
Funding
This research was funded by the Tianjin Municipal Science and Technology Bureau (Grant Nos. 23JCYBJC00390, 23YDTPJC00670).
Data Availability Statement
Some or all of the data supporting this study’s findings are available from the corresponding author upon reasonable request.
Conflicts of Interest
Author Jianmei Du was employed by the company North China Municipal Engineering Design & Research Institute Co., Ltd. The remaining authors declare that the research was conducted in the absence of any commercial or financial relationships that could be construed as a potential conflict of interest.
References
- You, X.H. State-of-art and prospectives of urban utility tunnels in China. Tunn. Constr. 2018, 38, 1603–1611. [Google Scholar]
- Dai, C.; Zhang, P.L.; Zhong, C.J. Discussion on engineering application and design scheme of double-deck utility tunnel. Water Wastewater Eng. 2018, 54, 109–113. [Google Scholar]
- Wang, F.B.; Wang, Y.; Wang, Z.M. Construction Technology of Multi-storey Utility tunnel in Xiong an. In Proceedings of the 26th Civil Engineering Construction Technology Exchange Meeting of Six Provinces and One City in East China (Volume I), Hangzhou, China, 21–23 October 2020; pp. 198–200. [Google Scholar]
- Zhang, Z.C. Research on Management and Development of Urban Underground Pipeline Galleries at Home and Abroad. Constr. Sci. Technol. 2018, 24, 42–52+59. [Google Scholar]
- Li, Z.; Chen, L.; Yan, H.C. Gas explosions of methane-air mixtures in a large-scale tube. Fuel 2021, 285, 119239. [Google Scholar] [CrossRef]
- Tian, S.Y.; Liu, J.; Gao, K. Experimental study on shock wave impulse and pressure rise rate of gas explosion in airtight pipeline. J. Saf. Sci. Technol. 2015, 11, 16–21. [Google Scholar]
- Shearer, M.J.; Tam, V.H.Y.; Corr, B. Analysis of results from large scale hydrocarbon gas explosions. J. Loss Prev. Process Ind. 2000, 13, 167–173. [Google Scholar] [CrossRef]
- Ajrash, M.J.; Zanganeh, J.; Moghtaderi, B. Flame deflagration in side-on vented detonation tubes: A large scale study. J. Hazard. Mater. 2018, 345, 38–47. [Google Scholar] [CrossRef]
- Wu, J.S.; Cai, J.T.; Zhao, Y.M.; Cao, Y.; Zhou, R.; Pang, L. Experimental study of the propagation characteristics of gas explosions in urban utility tunnels. J. Tsinghua Univ. Sci. Technol. 2022, 62, 987–993. [Google Scholar]
- Yan, Q.S.; Zhang, Y.A. Characteristic Study on Gas Blast Loadings in an Urban Utility Tunnel. J. Perform. Constr. Facil. 2020, 34, 04020076. [Google Scholar] [CrossRef]
- Yan, Q.S.; Zhang, Y.N.; Li, S.T. Experimental study and numerical simulation of gas explosion load characteristics in utility tunnel. Blasting 2021, 38, 140–146. [Google Scholar]
- Cao, J.; Wu, J.; Zhang, H.; Cai, J.; Wang, Y.; Fan, C. Experimental study on hydrogen-blended natural gas explosion characteristic and severity control measure in utility tunnels. Int. J. Hydrogen Energy 2024, 92, 738–747. [Google Scholar] [CrossRef]
- Chen, D.; Zhang, H.; Li, J.; Liu, K.; Wang, Y.; Huang, Y.; Mao, Z.; Wu, C. A full-scale experimental investigation of natural gas explosion in a 710-m long utility tunnel with multiple pipelines. Tunn. Undergr. Space Technol. 2024, 153, 106049. [Google Scholar] [CrossRef]
- Duan, Y.; Liu, L.; Yang, J.; Long, J.; He, G.; Lei, S.; Duan, X. Effects of explosion-venting interlayer within utility tunnels on the characteristics of natural gas explosions. Fuel 2024, 377, 132766. [Google Scholar] [CrossRef]
- Liu, Z.X.; Wang, Z.K.; Zhang, H.H.; Xu, H. Numerical Simulation of Blast-resistant Performance of Utility Tunnel under Gas Explosion. J. Disaster Prev. Mitig. Eng. 2018, 38, 624–632. [Google Scholar]
- Zhang, K.M. Study on Structural Dynamic Response and Damage Laws of Under Gas Explosion in Underground Utility Tunnel. Master’s Thesis, Beijing University of Civil Engineering and Architecture, Beijing, China, 2020. [Google Scholar]
- Shi, Y.C. Dynamic Response and Damage Mechanism of Reinforced Concrete Structures Under Blast Loading. Ph.D. Thesis, Tianjin University, Tianjing, China, 2010. [Google Scholar]
- Wang, Q. Numerical Analysis for Progressive Collapse and Protection of Underground Structure Under Internal Blast Load. Master’s Thesis, Tianjin University, Tianjing, China, 2014. [Google Scholar]
- Feng, X.H. Study on Mechanism and Mode of Progressive Collapse of Underground Structure Subjected to Its Internal Blast Loading. Master’s Thesis, Tianjin University, Tianjing, Chian, 2011. [Google Scholar]
- Zhou, Q.; He, H.G. Evaluation of blast-resistant ability of shallow-buried reinforced concrete urban utility tunnel. Eng. Fail. Anal. 2021, 119, 105003. [Google Scholar] [CrossRef]
- Wang, S.P.; Li, Z. Performance of utility tunnels under gas explosion loads. Tunn. Undergr. Space Technol. Inc. Trenchless Technol. Res. 2020, 109, 103762. [Google Scholar] [CrossRef]
- Tian, W.; Wu, Z.Y.; Wang, Y.W.; Xiao, Y.Q.; Zhang, X.D. Dynamic response law of structure under explosion in gas cabin of underground integrated utility tunnel. Sci. Technol. Eng. 2019, 19, 31–36. [Google Scholar]
- Xia, M.; Wang, J.H.; Liu, F. Numerical simulation study on dynamic response of utility tunnel structure under shallow-buried explosion. Prot. Eng. 2020, 42, 25–32. [Google Scholar]
- Xu, Y.; Huang, Y.M.; Li, J.; Ma, G. A risk-based optimal pressure relief opening design for gas explosions in underground utility tunnels. Tunn. Undergr. Space Technol. Inc. Trenchless Technol. Res. 2021, 116, 104091. [Google Scholar] [CrossRef]
- Xue, Y.Z.; Chen, G.H.; Zhang, Q.; Xie, M.; Ma, J. Simulation of the dynamic response of an urban utility tunnel under a natural gas explosion. Tunn. Undergr. Space Technol. Inc. Trenchless Technol. Res. 2021, 108, 103713. [Google Scholar] [CrossRef]
- Gao, X.J.; Zhou, J.; Zhang, Y.; Lv, J.J.; Liu, N. Study on blast resistance performance and reinforcement method of underground utility tunnel. Eng. Bl. 2023, 29, 145–151+158. [Google Scholar]
- Wu, J.; Zhao, Y.; Zhou, R.; Cai, J.; Pang, L. Suppression effect of porous media on natural gas explosion in utility tunnels. Fire Saf. J. Prepubl. 2022, 128, 103522. [Google Scholar] [CrossRef]
- Wang, H.N. Study on the Influence of Propagation Law Gas Explosion in Underground Utility Tunnel with Porous Structure. Master’s Thesis, Beijing University of Civil Engineering and Architecture, Beijing, China, 2024. [Google Scholar]
- Pang, L.; Li, W.; Yang, K. Gas explosion overpressure loads in utility tunnels under different pipe support spacing. Tunn. Undergr. Space Technol. Inc. Trenchless Technol. Res. 2025, 155, 106193. [Google Scholar]
- Zhang, H.; Wu, J.; Cao, J.; Fan, C.; Cai, J.; Wang, Y. Effects of hydrogen status and compartment structure on hydrogen explosion propagation in utility tunnels. Int. J. Hydrogen Energy. 2024, 96, 652–663. [Google Scholar] [CrossRef]
- Xia, Z.; Li, H.; Xie, J.; Zong, Z.; Zhang, Z. Numerical study on dynamic response of a novel ribbed thin-walled UHPC box-type utility tunnel under gas explosion. Case Stud. Constr. Mater. 2024, 21, e03630. [Google Scholar]
- Cai, L.J.; Zhu, F.M.; Wu, L.; Han, F.; Peng, S. Influence of Accidental Explosion of Upper Highway Tunnel on the Lower Water Supply Tunnel. Chin. J. Undergr. Space Eng. 2013, 9, 1197–1200. [Google Scholar]
- De, A.; Zimmie, T.F. Effects of Surface Explosion on Underground Tunnel and Potential Mitigation Measures. Transp. Infrastruct. Geotech. 2016, 3, 74–90. [Google Scholar] [CrossRef]
- De, A.; Morgante, A.N.; Zimmie, T.F. Numerical and physical modeling of geofoam barriers as protection against effects of surface blast on underground tunnels. Geotext. Geomembr. 2016, 44, 1–12. [Google Scholar]
- Smith, P.D.; Vismeg, P.; Teo, L.C.; Tingey, L. Blast wave transmission along rough-walled tunnels. Int. J. Impact Eng. 2018, 21, 419–432. [Google Scholar]
- Schecklinski-Gluck, G.A. Calculation procedure for blast in tunnel branchings developed from experiments and AUTODYN calculations. In Proceedings of the 7th International Symposium Interaction of the Effects of Munitions with Structures, Mannheim, Germany, 6–10 April 2015. [Google Scholar]
- Copper, M. Experimental and numerical investigation of blast wave propagation in tunnels. In Proceedings of the 15th International Symposium on Military Aspects of Blast and Shock, Banff, AB, Canada, 11–15 September 2017. [Google Scholar]
- Bao, Q.; Fang, Q.; Zhang, Y.; Chen, L.; Yang, S.; Li, Z. Effects of gas concentration and venting pressure on overpressure transients during vented explosion of methane-air mixtures. Fuel 2016, 175, 40–48. [Google Scholar] [CrossRef]
- Liu, H.B. Dynamic Analysis of Subway Structures Under Blast Loading. Geotech. Geol. Eng. 2009, 6, 699–711. [Google Scholar] [CrossRef]
- Wang, P.F. Study on Influence of Gas Explosion on Utility Tunnel and Adjacent Subway Tunnel. Master’s Thesis, Xi’an Technological University, Xi’an, China, 2022. [Google Scholar]
- Wang, D.; Chen, C.H.; Zhang, H.; Liu, Z.X.; Meng, S.B. Influence of gas explosion in a utility tunnel on the structural safety of a undercrossing tunnel. J. Vib. Shock 2023, 42, 160–166+185. [Google Scholar]
- GB 50253—2014; Code for Design of Oil Transportation Pipeline Engineering. Planning Press: Beijing, China, 2014.
- GB 50157—2013; Code for Design of Metro. China Architecture & Building Press: Beijing, China, 2013.
Disclaimer/Publisher’s Note: The statements, opinions and data contained in all publications are solely those of the individual author(s) and contributor(s) and not of MDPI and/or the editor(s). MDPI and/or the editor(s) disclaim responsibility for any injury to people or property resulting from any ideas, methods, instructions or products referred to in the content. |
© 2025 by the authors. Licensee MDPI, Basel, Switzerland. This article is an open access article distributed under the terms and conditions of the Creative Commons Attribution (CC BY) license (https://creativecommons.org/licenses/by/4.0/).