Article

Numerical Study of Excavation Face Active Instability in Upward Shield Tunneling

1
Department of Civil Engineering, Hangzhou City University, Hangzhou 310015, China
2
Zhejiang Key Laboratory of Safe Construction and Intelligent Maintenance for Urban Shield Tunnels, Hangzhou 310015, China
3
Zhejiang Provincial Engineering Research Center of Intelligent Urban Infrastructure, Hangzhou 310015, China
4
College of Civil Engineering and Architecture, Zhejiang University, Hangzhou 310058, China
5
Power China Huadong Engineering Corporation, Hangzhou 311122, China
6
Power China Smart Rail Transit Engineering Research Center, Hangzhou 311122, China
7
College of Civil and Transportation Engineering, Shenzhen University, Shenzhen 518060, China
*
Author to whom correspondence should be addressed.
Buildings 2025, 15(18), 3371; https://doi.org/10.3390/buildings15183371
Submission received: 2 August 2025 / Revised: 11 September 2025 / Accepted: 14 September 2025 / Published: 17 September 2025
(This article belongs to the Section Building Structures)

Abstract

To study excavation face instability in upward shield tunneling, a 3D numerical model was established using ABAQUS software v2023 under different depth ratios (C/D = 1, 1.5, 2, 3, 4), with reference to the upward shield tunneling project of the Midosuji Utility Tunnel Construction Project in Japan. The model simulated soil as an elastoplastic material governed by the Mohr–Coulomb criterion, with dimensions of 60 m × 60 m × 60 m and boundary constraints applied to soil surfaces. This study explores variations in the limit support pressure and soil failure zone during the instability process. Simulation results were validated through scaled model tests (1:50). The study findings reveal that (1) for varying depth ratios, the support pressure on the excavation face decreases as the depth ratio increases, with diminishing reductions at higher ratios. (2) At shallower depths (C/D < 3), the soil failure zone above the excavation face is nearly conic. At deeper depths (C/D ≥ 3), the failure zone resembles a “bullet head” shape. (3) At shallower depth ratios (C/D < 3), surface displacement shows slow-to-rapid transitions. At deeper depth ratios (C/D ≥ 3), surface displacement remains nearly constant. (4) Post-instability, stress concentration at the horizontal tunnel’s top opening causes segments to deform into an inverted V-shape. (5) Soil stress changes are categorized into three zones—stress release, soil wedging, and stress transfer—with each zone expanding as depth increases.

1. Introduction

In recent years, the rapid enhancement of urban infrastructure has accelerated the development of underground spaces. Shafts, acting as critical passages connecting surface and underground spaces, play a key role in the maintenance and ventilation of underground areas. Usually, shafts are excavated and constructed from the ground downwards [1,2,3,4]. This method is relatively straightforward and requires lower technical construction, aiding in the swift construction of underground structures. However, with diminishing surface space, this downward excavation method becomes less practical in busy traffic hubs. To solve this problem, the upward shield method (USM) has been proposed for shaft excavation. This method [5,6] involves excavating upwards from an existing horizontal tunnel to construct a shaft, a process entailing complex progressive failure mechanisms in soil and precise control of top-jacking forces [7,8]. In this process, the segment structure is the key component to bear the jacking force, and its mechanical properties directly affect the construction safety. Previous studies [9] have revealed the bearing characteristics and failure modes of shield segments through full-scale loading tests, which provide an important basis for the USM jacking force control. Similarly, existing studies have shown that underground engineering activities such as foundation pit excavation and horizontal tunneling can significantly disturb the surrounding stratum environment and induce deformation [10,11,12], while the USM construction may also cause similar disturbance effects.
During the construction of USM, inadequate support pressure at the excavation face can lead to active instability of the soil layer above the excavation face, causing surface subsidence, damage to surface structures, and traffic safety incidents. Thus, studying how to maintain the excavation face stability in USM is particularly important. Currently, there are few numerical simulation studies on the instability of the excavation face in USM.
As an efficient and effective research tool, numerical simulation has been extensively used to explore the excavation face stability of shield tunnels. Although numerical simulation studies on the excavation face stability of upward shield tunnels are relatively limited, there is already relatively well-established numerical simulation research on horizontal shield excavation face stability [13,14,15,16]. Vermeer et al. [17] developed a three-dimensional model to simulate the excavation face instability of horizontal shield tunnels in sandy soils, focusing on strata displacement during instability and the effect of soil internal friction angle on excavation face stability. Kim and Tonon [18] applied Midas GTS software to create a tunnel excavation face instability model, examining how tunnel diameter, depth, and soil properties influence the limit support pressure of the excavation face. Sterpi and Cividini [19] conducted a numerical analysis to explore the effects of soil softening on excavation face instability. Qiao et al. [20] applied FLAC3D software and the strength reduction method, determining that the Poisson’s ratio and elastic modulus of the soil have a negligible effect on the limit support pressure of the excavation face. Lei et al. [21] integrated centrifuge experiments with numerical simulation models to examine the soil arching effect and internal soil pressure distribution during the excavation face instability. Yan [22] used ABAQUS software to develop computational models of excavation face instability at various slopes, revealing that the limit support pressure of the excavation face increases with the slope angle.
However, unlike horizontal shield tunneling with well-documented failure mechanisms, USM excavates upward from an existing tunnel, generating fundamentally different stress redistribution. This complexity necessitates specific attention to instability mechanisms in USM, particularly regarding the critical effects of burial depth ratio (C/D). To address this gap, our work is the first to systematically investigate depth-dependent instability mechanisms in USM—a crucial factor given the pronounced sensitivity of stability to burial depth ratios.
Building on this focus, this study establishes the first comprehensive 3D numerical model for USM excavation face instability under varying burial depth ratios (C/D = 1, 1.5, 2, 3, 4; where C is the distance from the excavation face to the ground surface, and D is the tunnel diameter). The model quantifies limit support pressure and its variation patterns, analyzes horizontal tunnel stress–deformation responses, and captures soil displacement fields during active instability. These efforts aim to provide theoretical and practical guidance for USM support control in urban underground projects.

2. Establishment of Upward Shield Tunneling Numerical Simulation Model

2.1. Model Size and Boundary Conditions

Using ABAQUS software, a three-dimensional numerical model was established based on the Midosuji Utility Tunnel Construction Project in Japan and its use of the upward shield method [23]. This utility tunnel spans approximately 4 km beneath National Highway #25, housing 1500 mm diameter water pipes and power cables. The upward shield method was employed to construct seven branching shafts beneath the heavily trafficked Midosuji Road, minimizing ground disturbance to adjacent subway infrastructure and reducing surface traffic disruption during construction. The depth of the shaft is about 30 m.
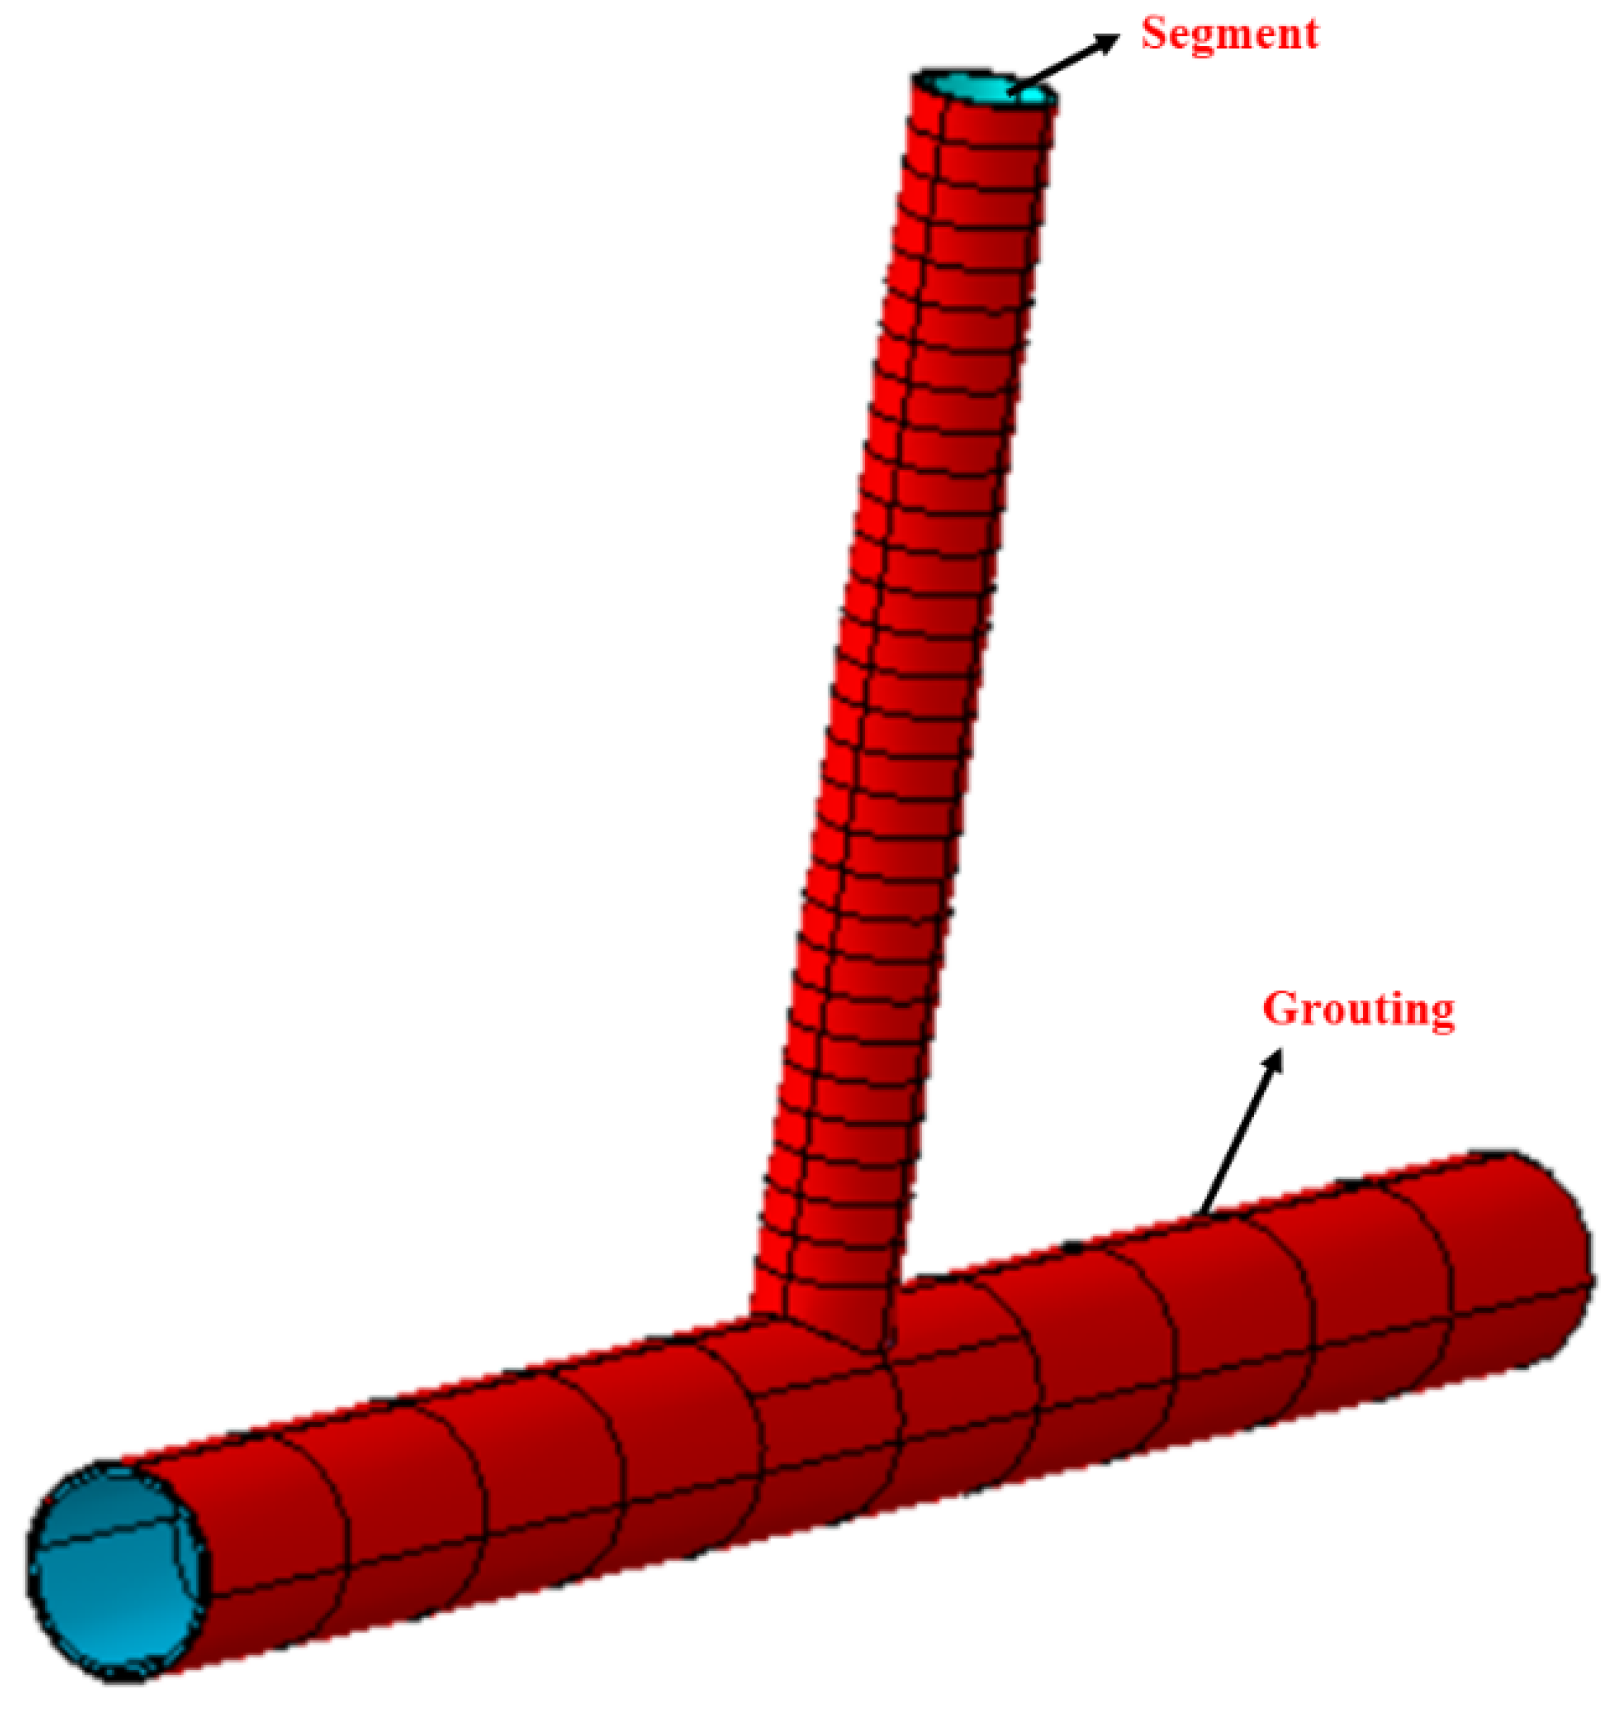
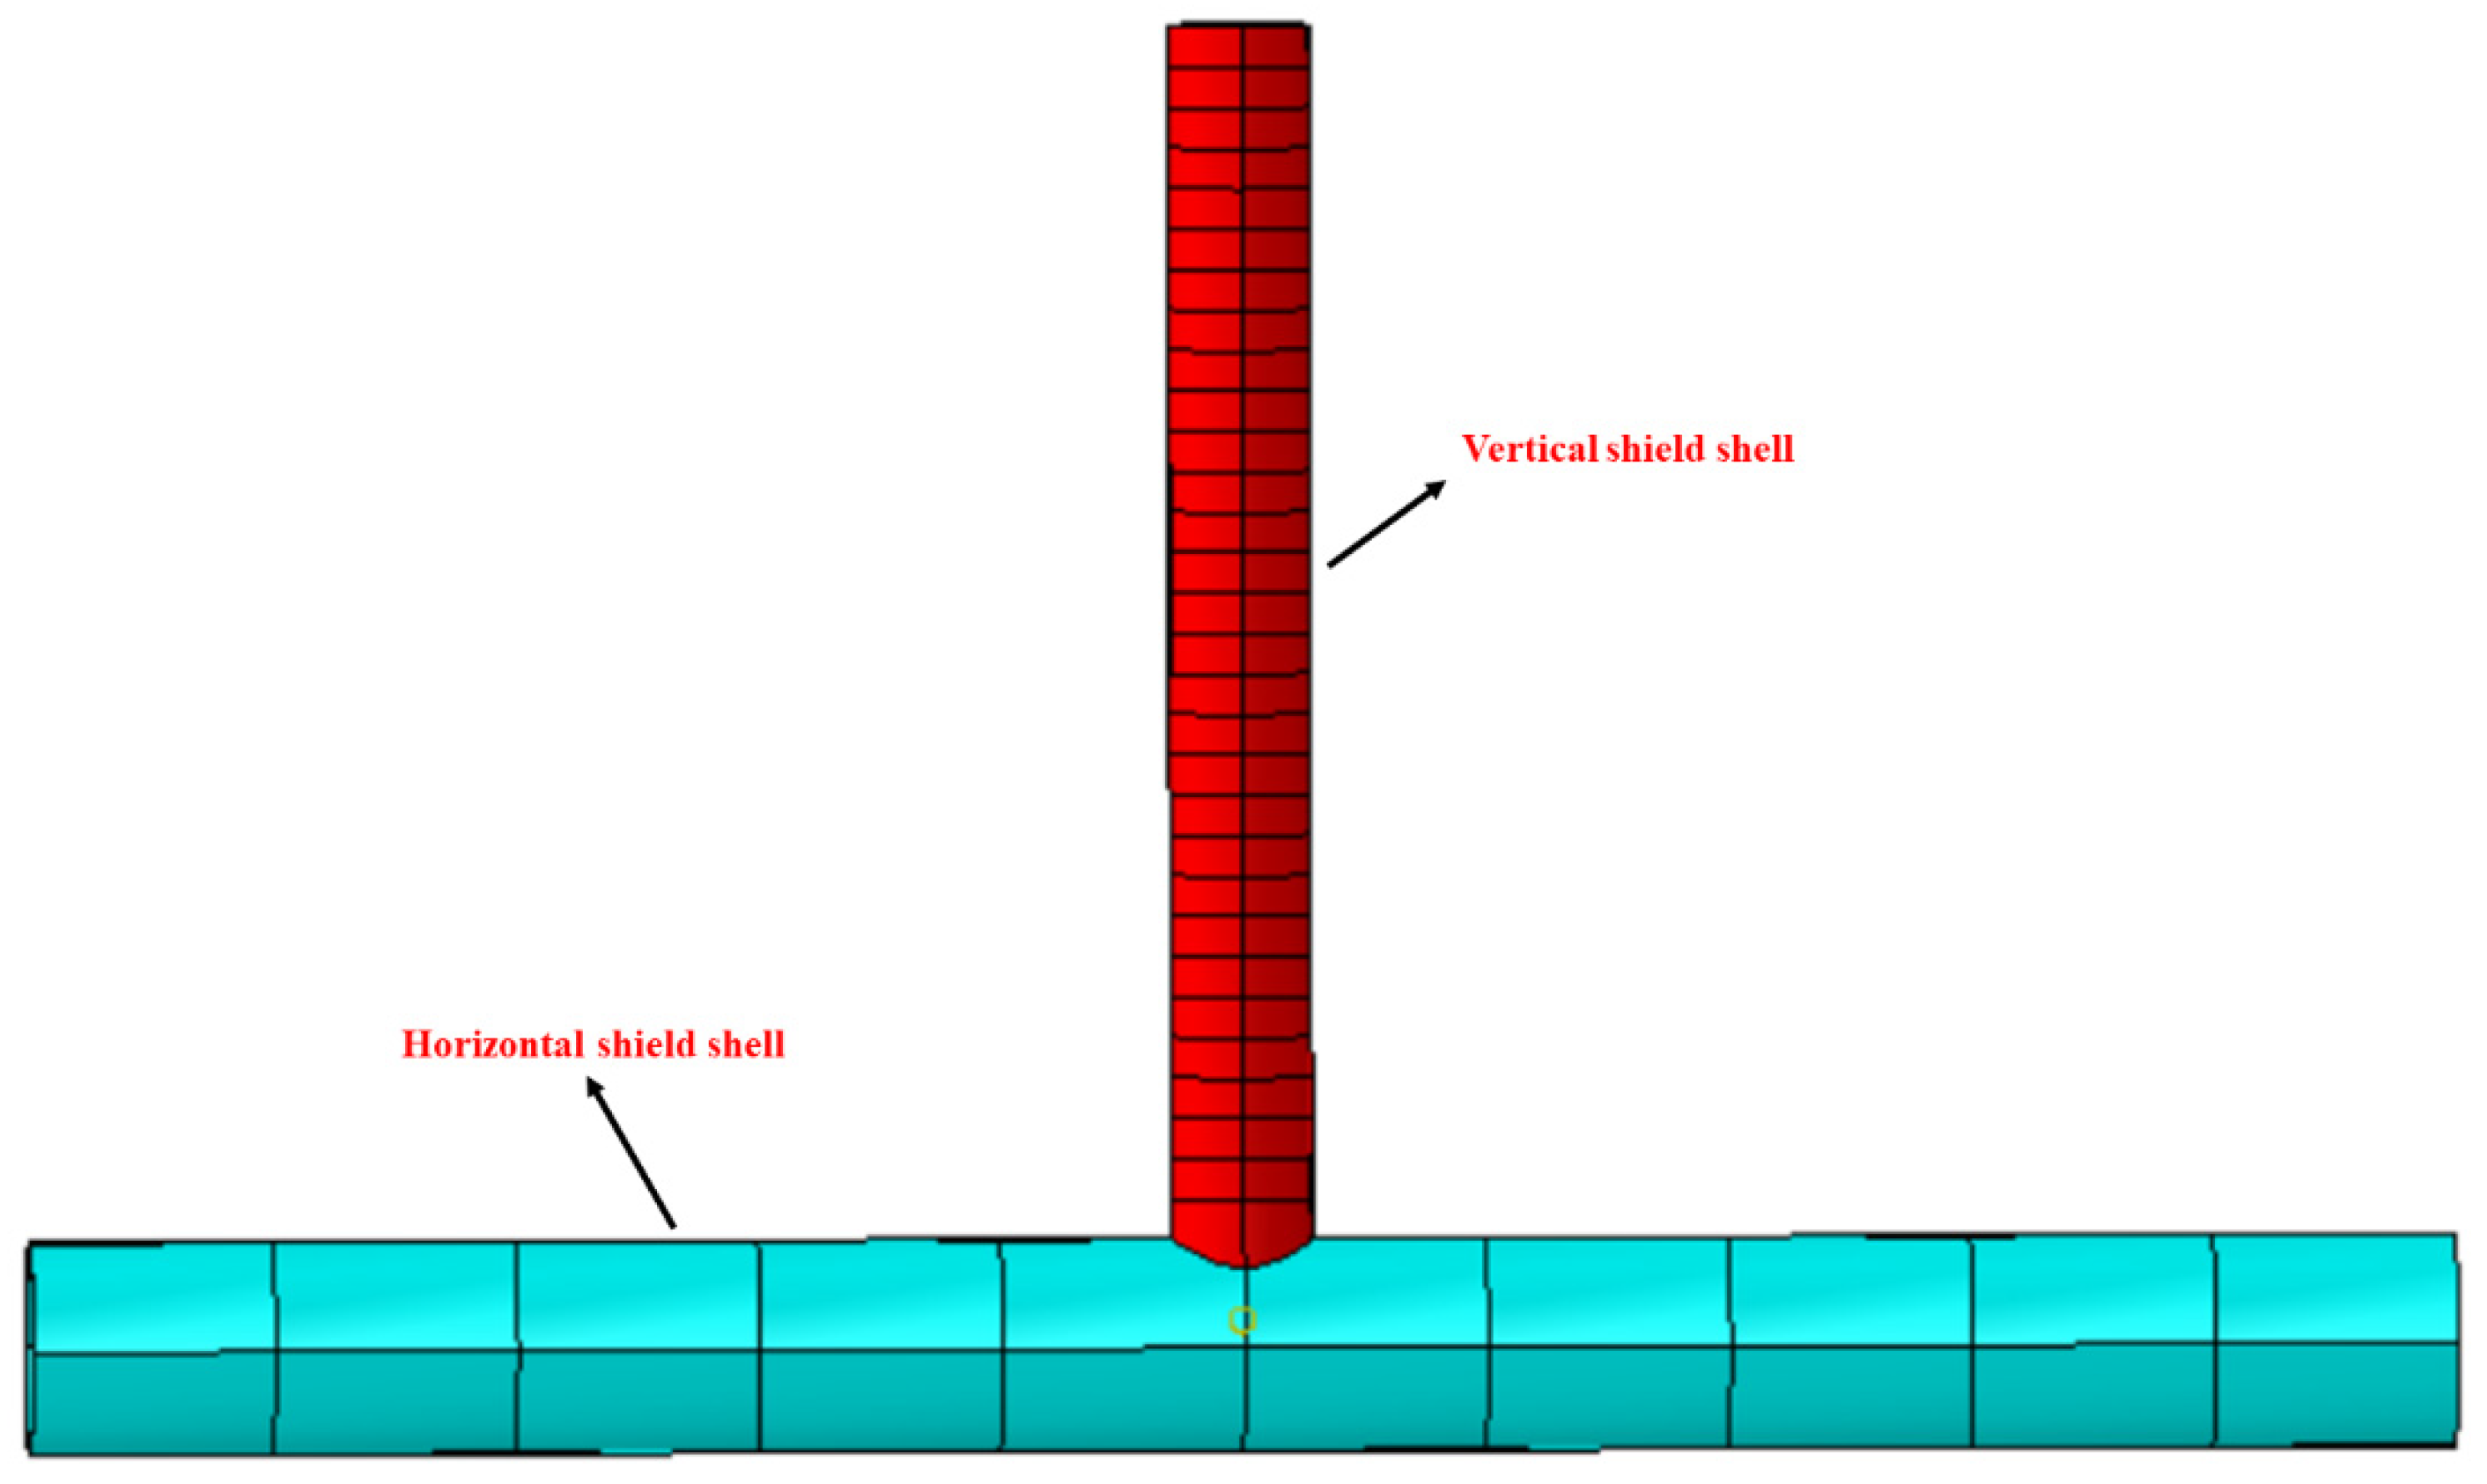
The soil dimensions were defined as 60 m × 60 m × 60 m (see Figure 1). The horizontal segments had an outer diameter of 5.07 m and an inner diameter of 4.77 m, while the vertical segments had an outer diameter of 3.3 m and an inner diameter of 3 m. Previous studies by Liu et al. [24], Zhang et al. [25], and Hu et al. [26] set the grouting layer thickness to 0.1 m during numerical simulation. Following these studies, we set the outer diameter of the horizontal grouting layer to 5.27 m and the inner diameter to 5.07 m, the vertical grouting layer’s outer diameter to 3.5 m, and the inner diameter to 3.3 m (see Figure 2). The horizontal shield shell’s outer diameter was set to 5.27 m, and the inner diameter to 5.07 m, while the vertical shield shell’s outer diameter was 3.5 m and inner diameter 3.3 m (see Figure 3). The model utilized C3D8 elements for mesh generation, totaling 107,818 elements for all parts. Boundary conditions were specified as follows: displacement in the x-direction was constrained on both vertical outer surfaces perpendicular to x; displacement in the y-direction was constrained on the vertical outer surfaces perpendicular to y; and all displacements (x, y, z) were constrained on the bottom surface. The top surface remained free. Horizontal components (shield shell, grouting, segments) had y-direction constraints; vertical components had z-direction constraints.

2.2. Material Parameters and Basic Assumptions

Using the laboratory-measured soil parameters of the dried river sand (used in scaled model tests) and the tunnel modeling parameters from Cao et al. [27], the model was constructed. The parameters for each part are provided in Table 1 and Table 2.
The basic assumptions of the numerical model in this study are as follows:
(1)
The soil is modeled as an isotropic ideal elastoplastic material, and its failure is governed by the Mohr–Coulomb criterion. Plastic strains develop when the stress state satisfies the yield condition, with progressive failure controlled via stepwise support pressure reduction.
(2)
It is assumed that there is no relative movement between the soil and the outer surfaces of the shield and the grout, meaning both are bonded.
(3)
It is assumed that an earth pressure balance method is used to counteract the soil pressure in front of the excavation face during the excavation of the horizontal shield tunnel and the upward shield tunnel.

2.3. Simulation Procedure

The simulation technique for modeling the excavation face instability in horizontal shield tunnels [28] consists of two steps: the first step is to simulate the shield tunnel excavation process, and the second step is to decrease the support pressure at the excavation face to simulate the active instability. Adopting the methodology from horizontal tunnel modeling, the numerical simulation process for the excavation face instability in upward shield tunneling is described as follows.

2.3.1. Ground Stress Equilibrium

The initial ground stress field is determined by setting boundary conditions on the soil surface and applying the soil gravity (g = 10 m/s2), thereby achieving ground stress equilibrium.

2.3.2. Construction Process of Horizontal Shield Tunnel

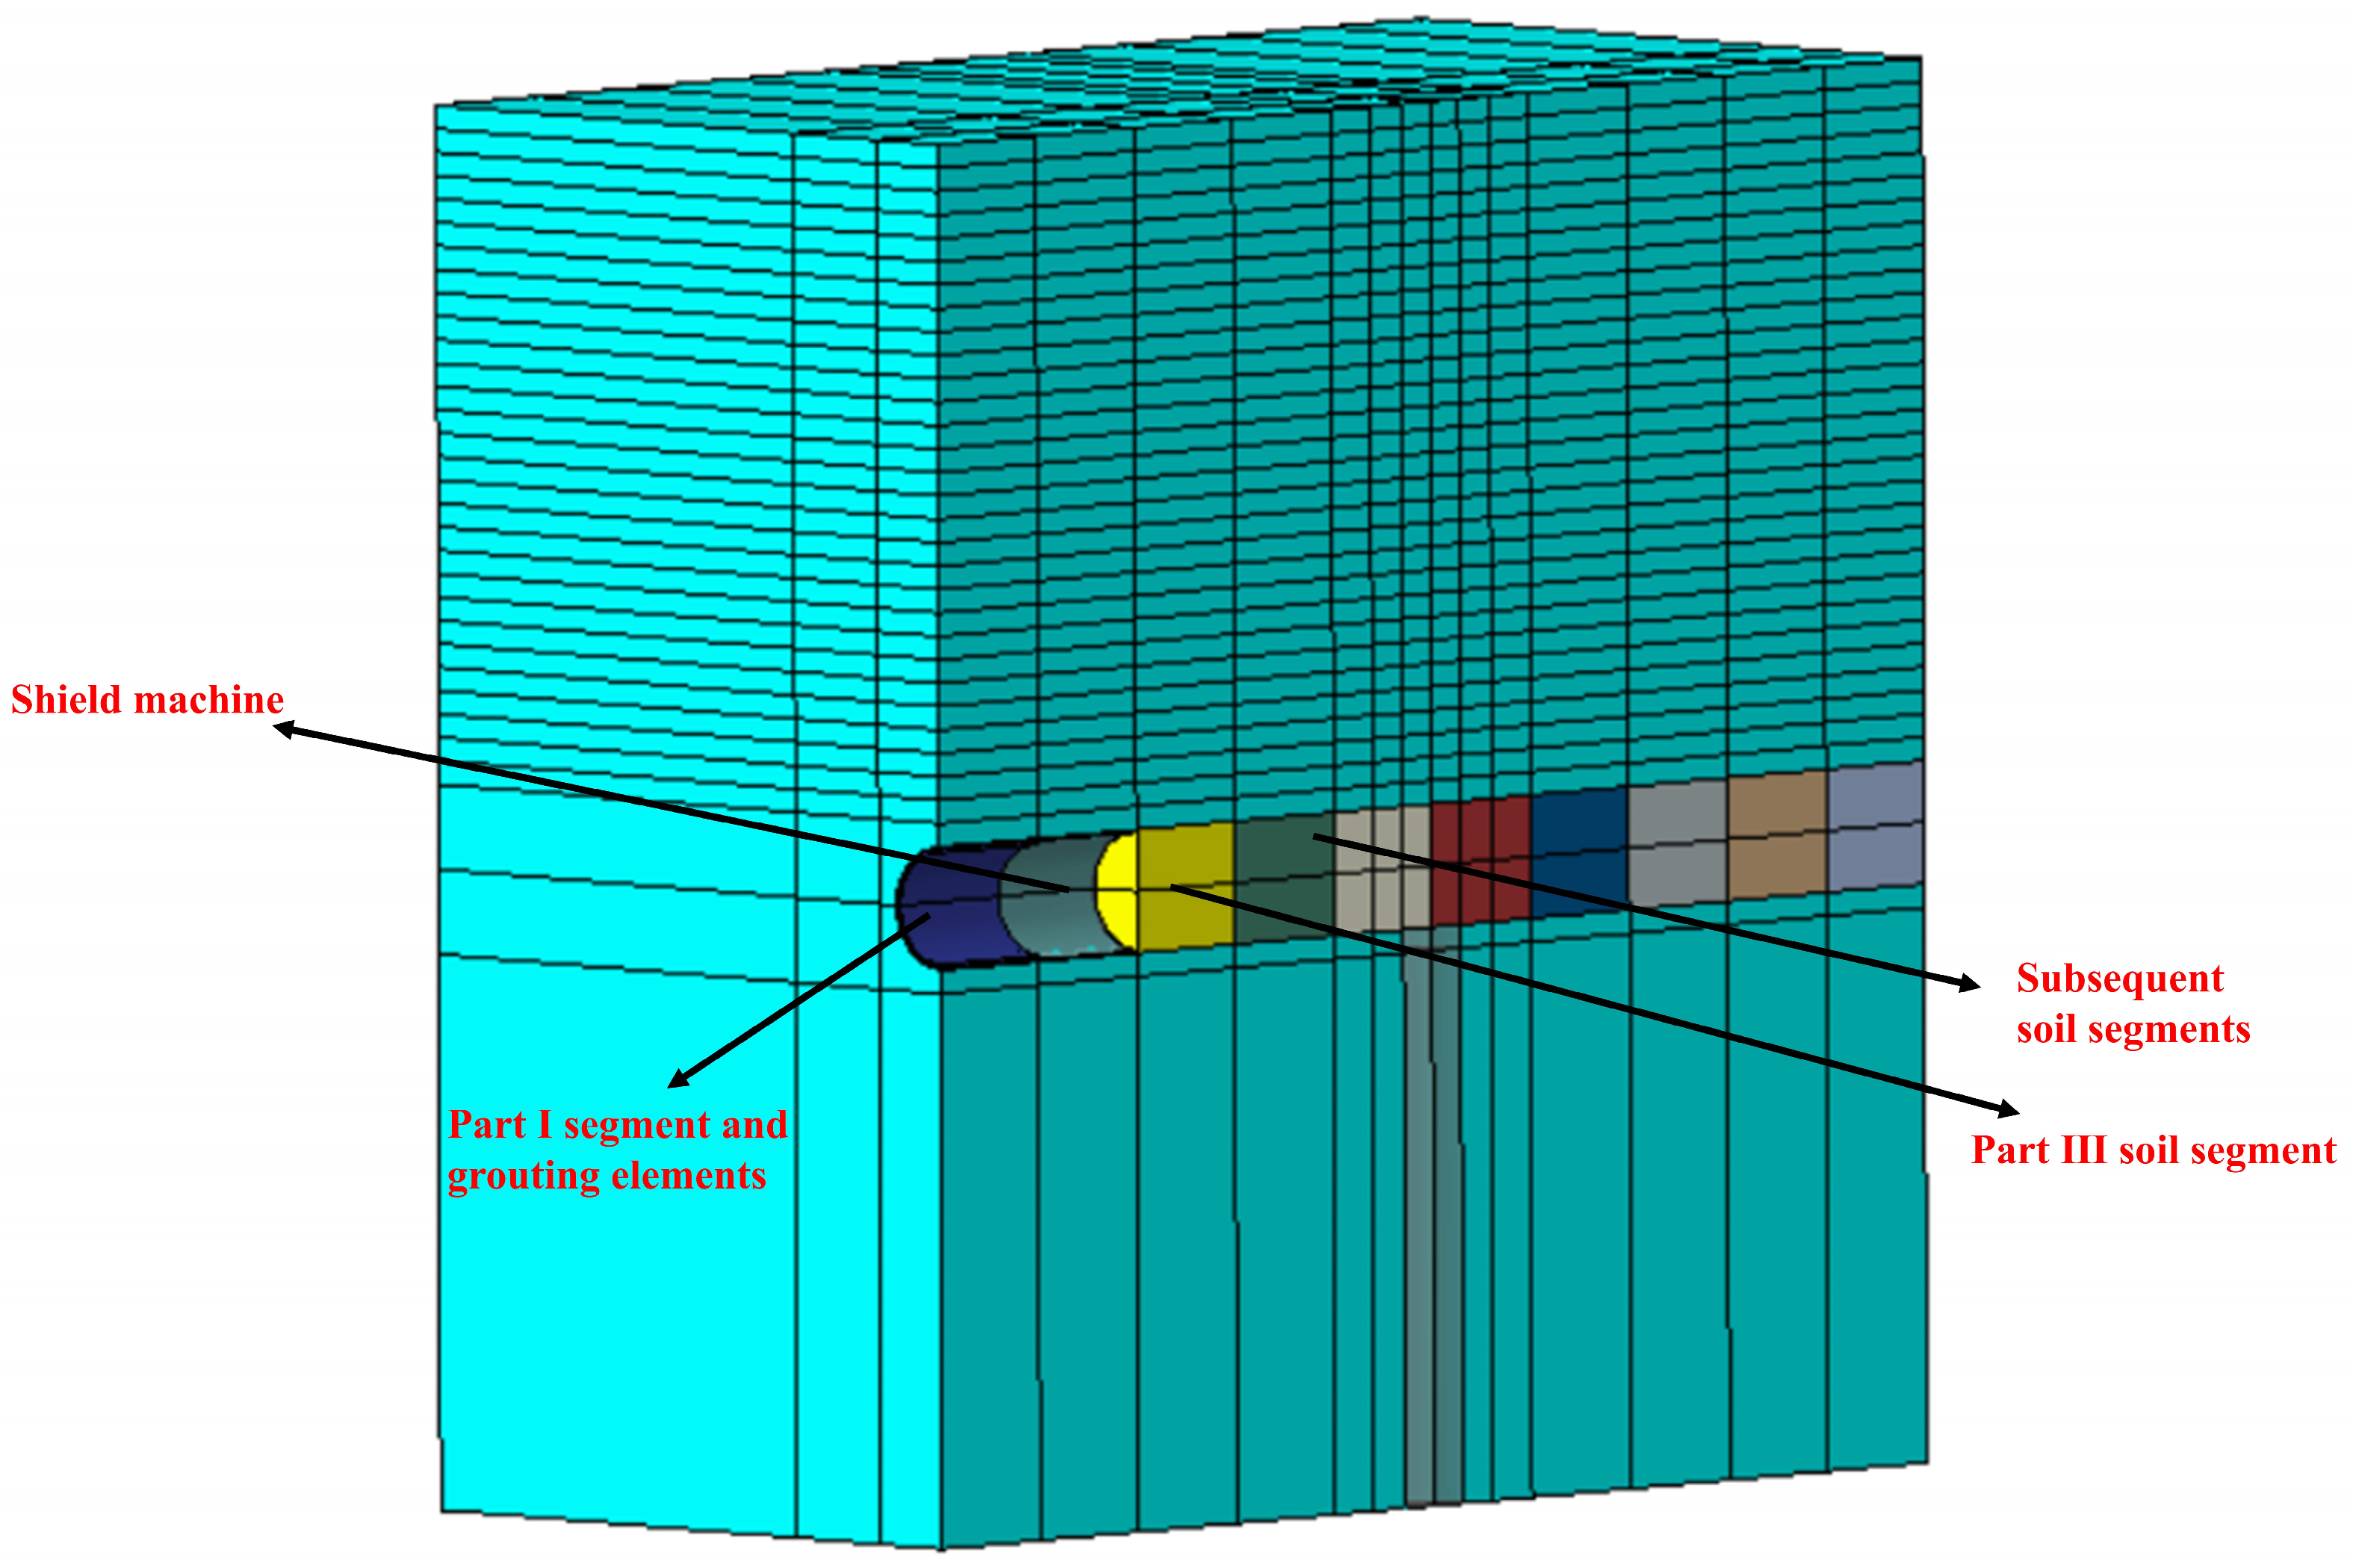
The construction process of the horizontal shield tunnel is shown in Figure 4, which is as follows:
(1)
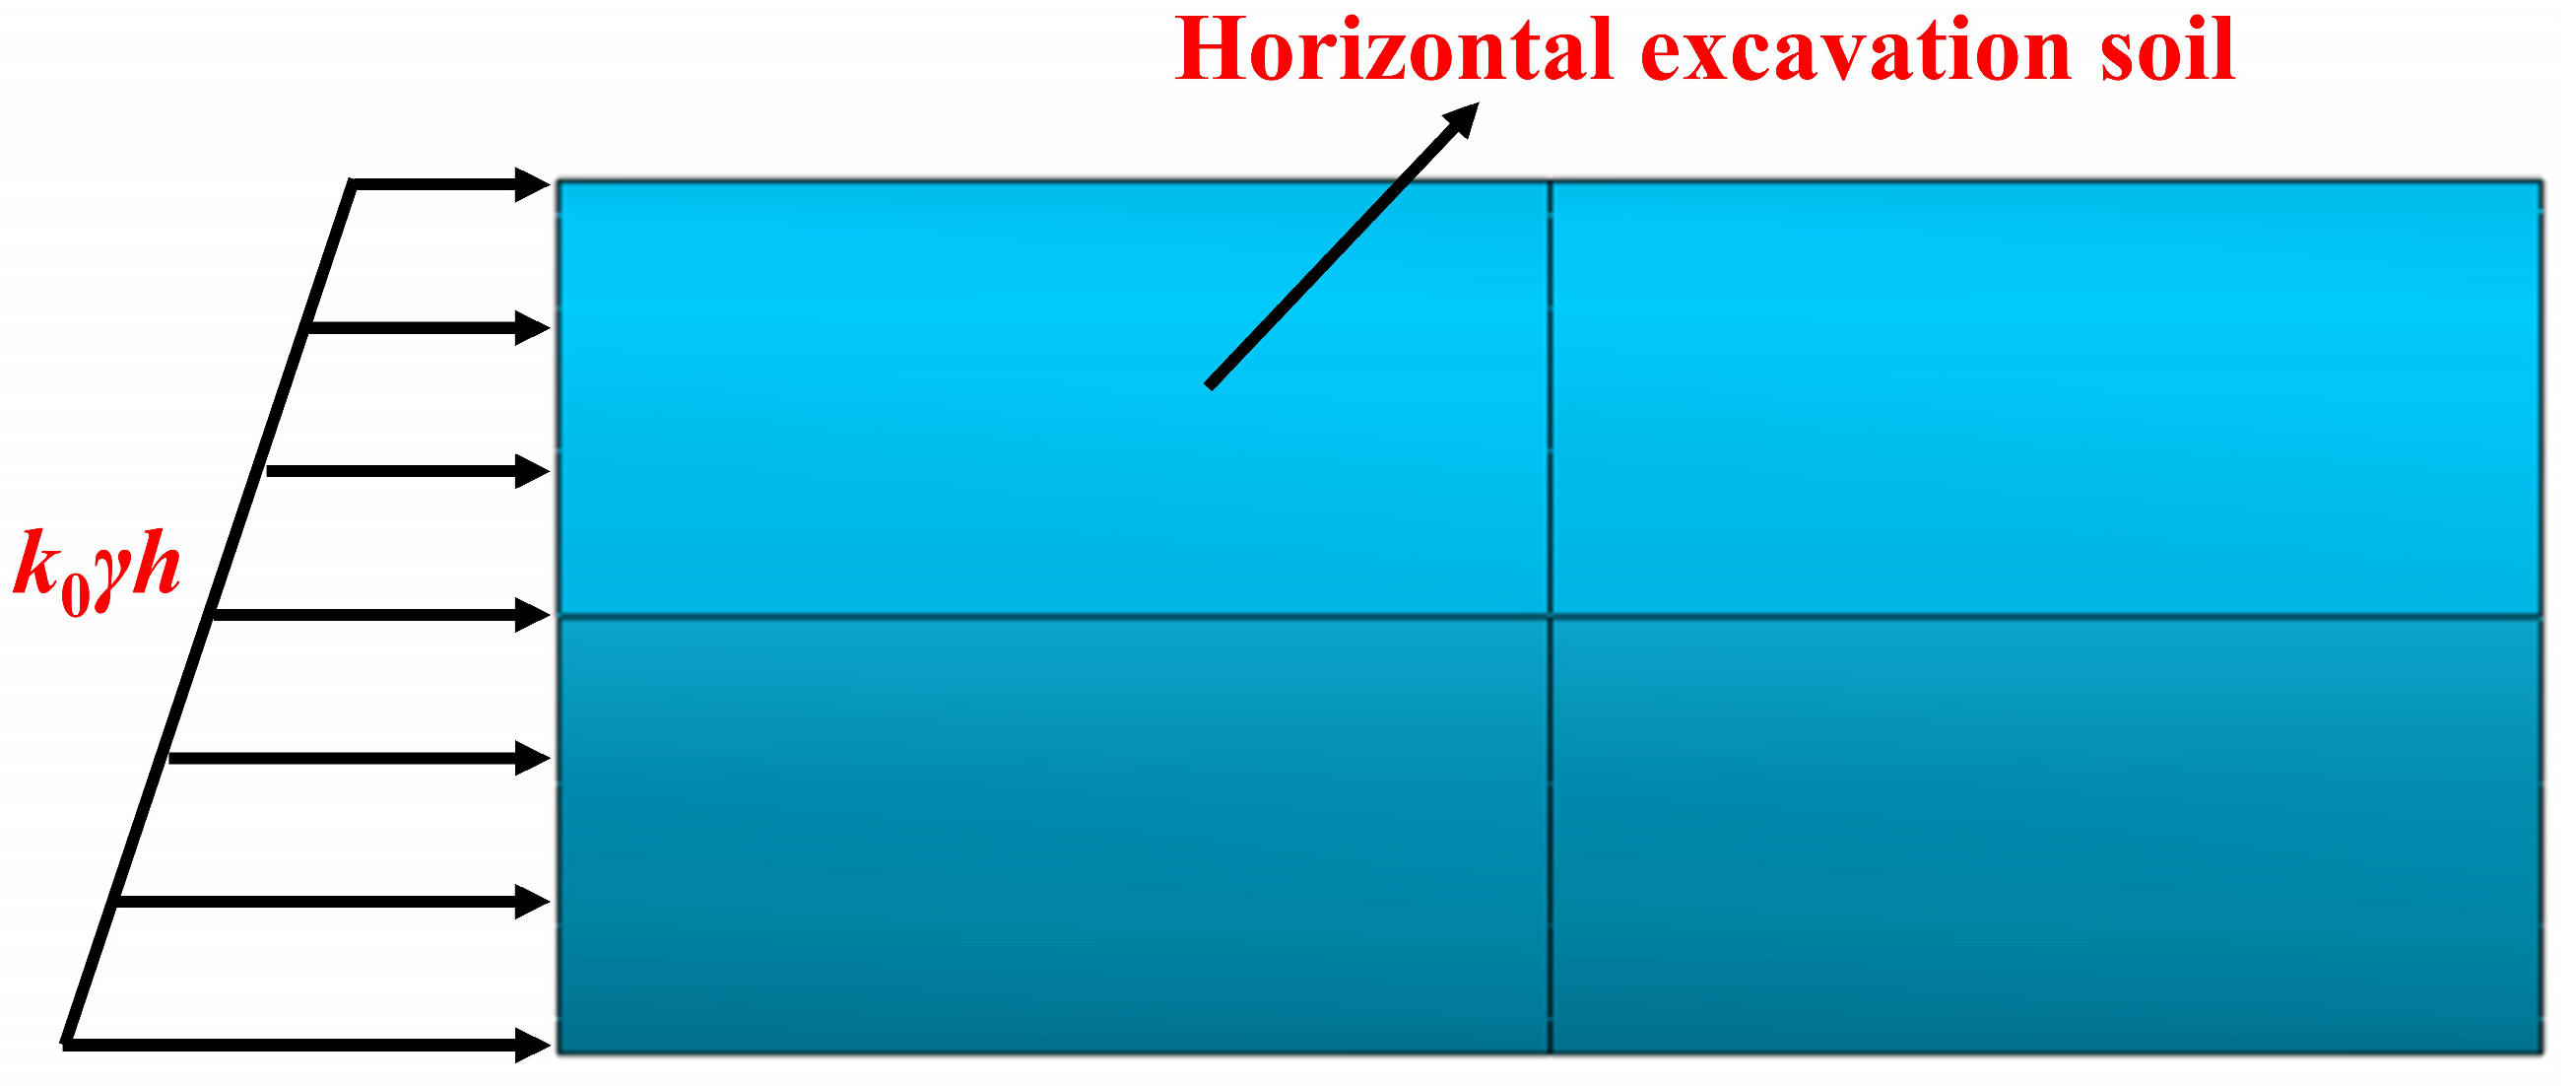
Excavation process: The excavation soil in the horizontal tunnel is divided into 10 segments (each 6 m in length) for phased excavation, and the excavation process is simulated by activating and deactivating elements in ABAQUS. In the first analysis step, the first soil segment is deactivated. Simultaneously, the corresponding shield elements are activated, and the excavation face support pressure is applied. This support pressure has a trapezoidal distribution, as shown in Figure 5, and is calculated based on the formula k0γh, where k0 is the coefficient of earth pressure at rest (k0 = 1 − sin ϕ = 0.5 for ϕ = 30°), γ is the soil volumetric weight, and h is the distance from the soil to the ground surface. Upon moving to the next soil segment, the support pressure is removed. This process continues for the remaining nine segments in subsequent analysis steps.
(2)
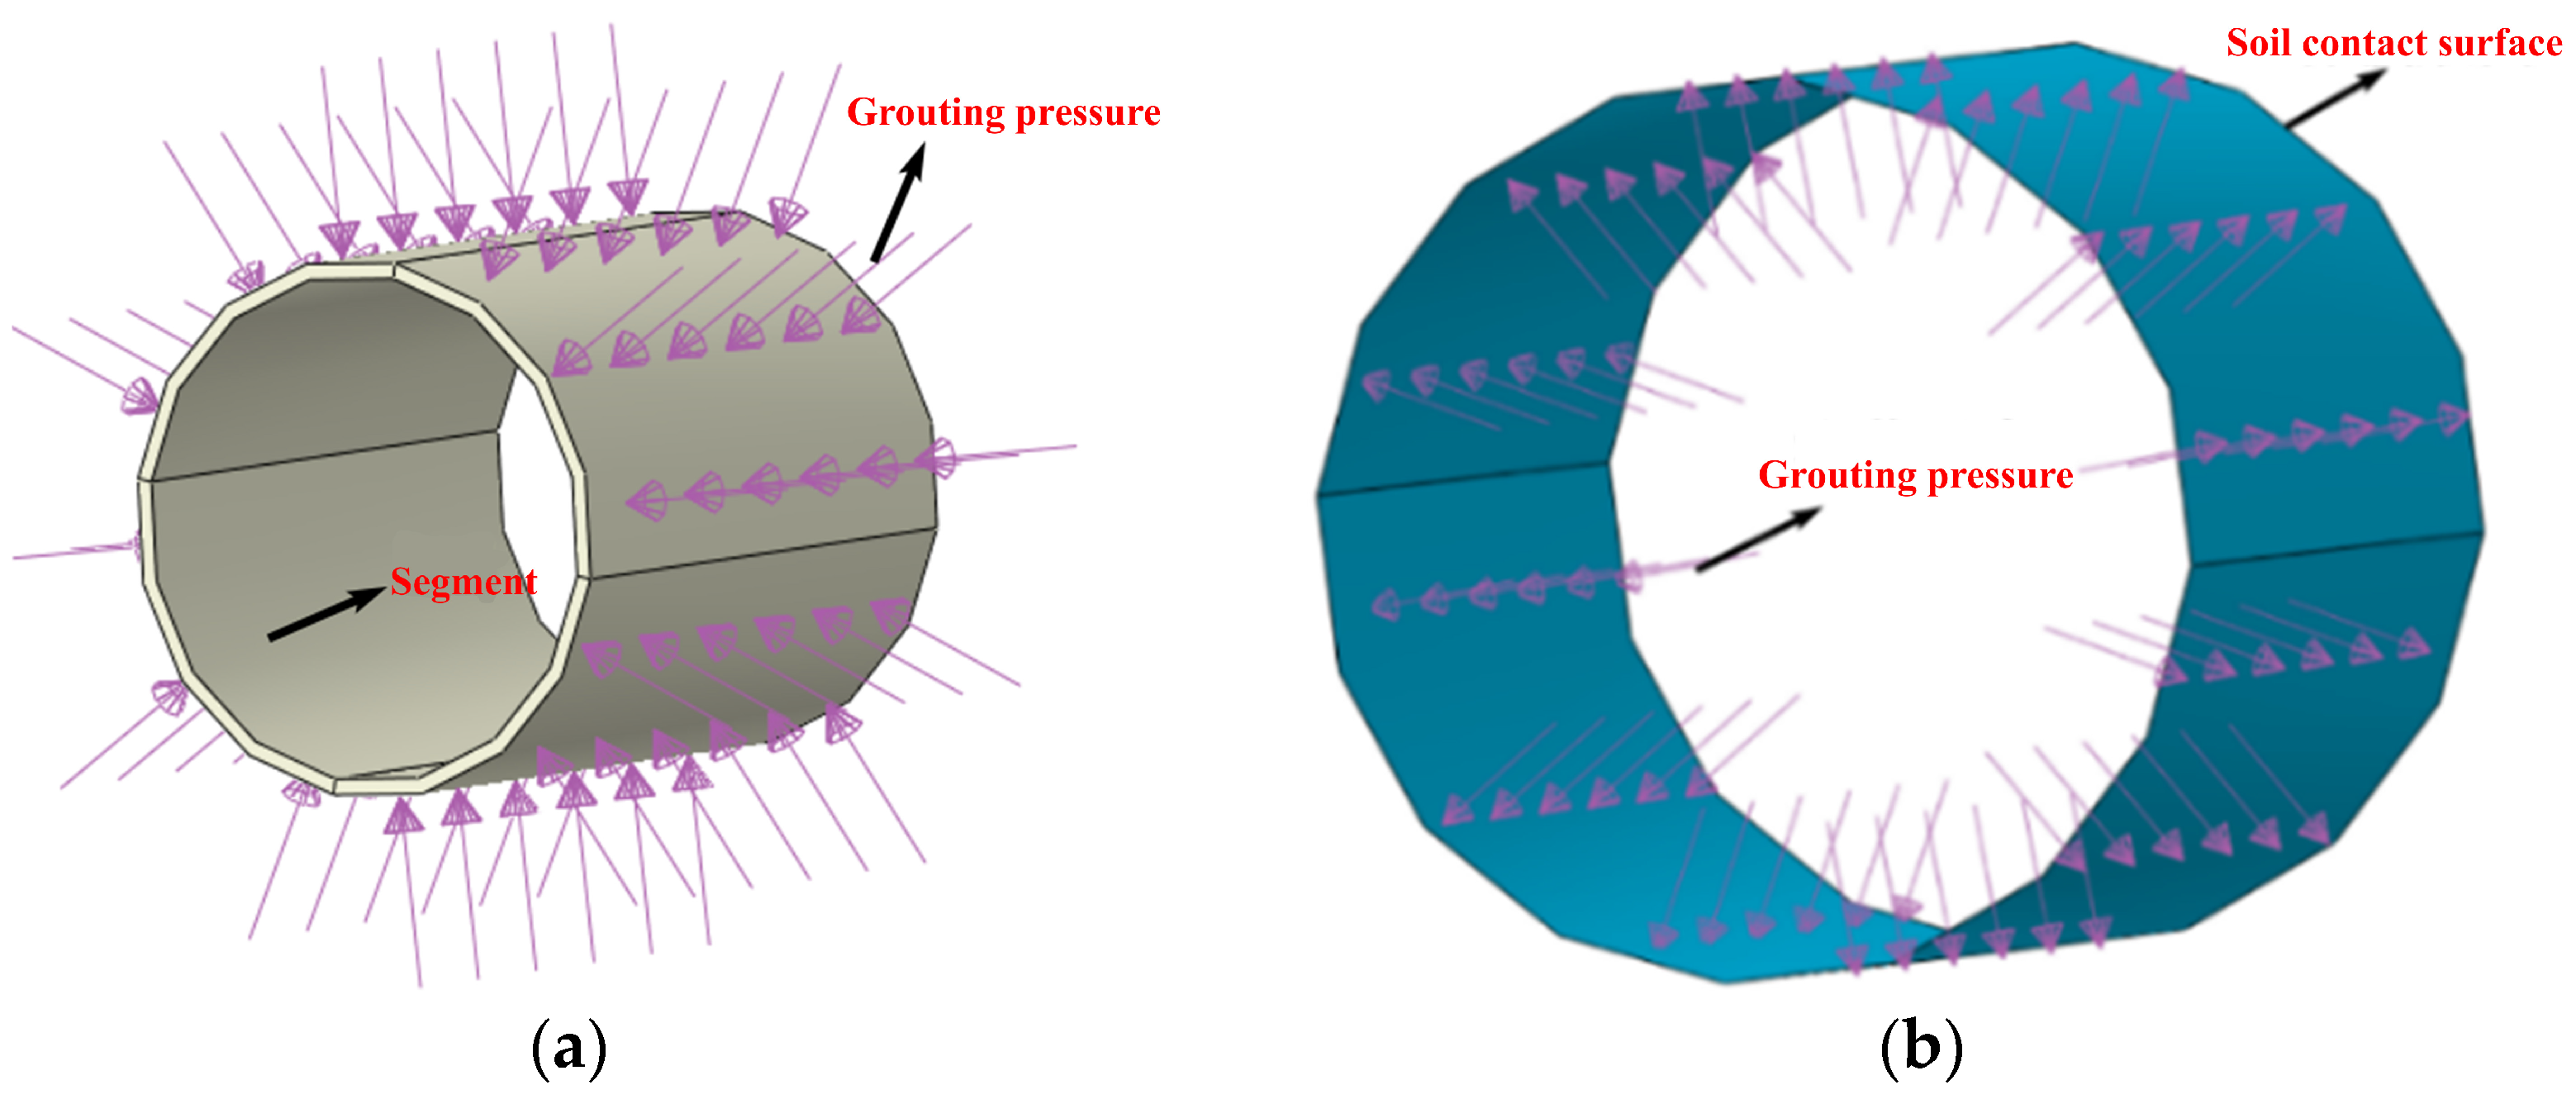
The activation of segment and grouting elements: As the shield machine excavates the next soil segment, the shield shell parts in the previously excavated segment are deactivated and moved to the newly excavated segment to simulate the shield machine advancement. Simultaneously, the segment and grouting elements in the previously excavated segment are activated. When activating the grouting elements, grouting pressure is applied to the segments’ outer surface and the soil’s inner surface (see Figure 6). The grouting pressure is typically between 0.1 MPa and 0.3 MPa [29]; in this study, it is set at 0.15 MPa. In the following analysis steps, the remaining nine segments of the segment and grouting elements are sequentially activated.
(3)
Grouting hardening: The shield machine advances at a speed between 1.8 mm/min and 44 mm/min [30], with a daily advance of 12 m. Based on the standard that grouting hardens after one day [31], the grouting hardening process is simulated in the second analysis step after activating the grouting elements. From the 4th analysis step onward, the elastic modulus of the grouting in the first segment is increased to represent the hardening, and the grouting pressure on both the segment and the soil is removed. The grouting hardening for the remaining nine segments is completed in subsequent analysis steps, concluding the simulation of the horizontal tunnel construction.

2.3.3. Breaking the Top Opening of the Horizontal Tunnel Segments Part

During this analysis step, the elements corresponding to the top opening of the horizontal tunnel segments were deactivated to simulate the breaking of these openings (see Figure 7).

2.3.4. Construction Process of Upward Shield Tunneling

(1)
Soil excavation: For instance, when the excavation depth is 15 m from the ground surface, the soil is segmented into 15 parts, each part being excavated 1 m at a time. In the initial analysis step, the first 1 m soil section is deactivated (see Figure 8). Concurrently, the upward shield machine for the first section is activated, and support pressure is applied at the excavation face, given as γh0 (see Figure 9), where h0 is the depth to the ground surface. When excavating the second section, the support pressure from the first section is removed. Subsequent analysis steps continue with the excavation of the remaining soil sections.
(2)
Activation of lining and grouting units, along with the grouting hardening process: The construction process of the upward shield tunnel is completed by simulating the activation of the lining and grouting units and the subsequent hardening of the grout, as detailed in Section 2.3.2.

2.3.5. The Simulation of the Active Instability During Upward Shield Tunneling

The excavation face instability process of the upward shield tunnel is simulated through stress control in this study [32]. The support pressure was reduced in 20 discrete steps (each step decreasing the pressure ratio by 0.05) until it reached 0 kPa. The active instability process of the upward shield excavation face is deemed to start when non-convergence occurs in the ABAQUS software calculations [33].

3. Numerical Analysis and Experimental Validation of Excavation Face Instability

3.1. The Failure Zone of the Excavation Face Under the Active Instability State in the Numerical Model

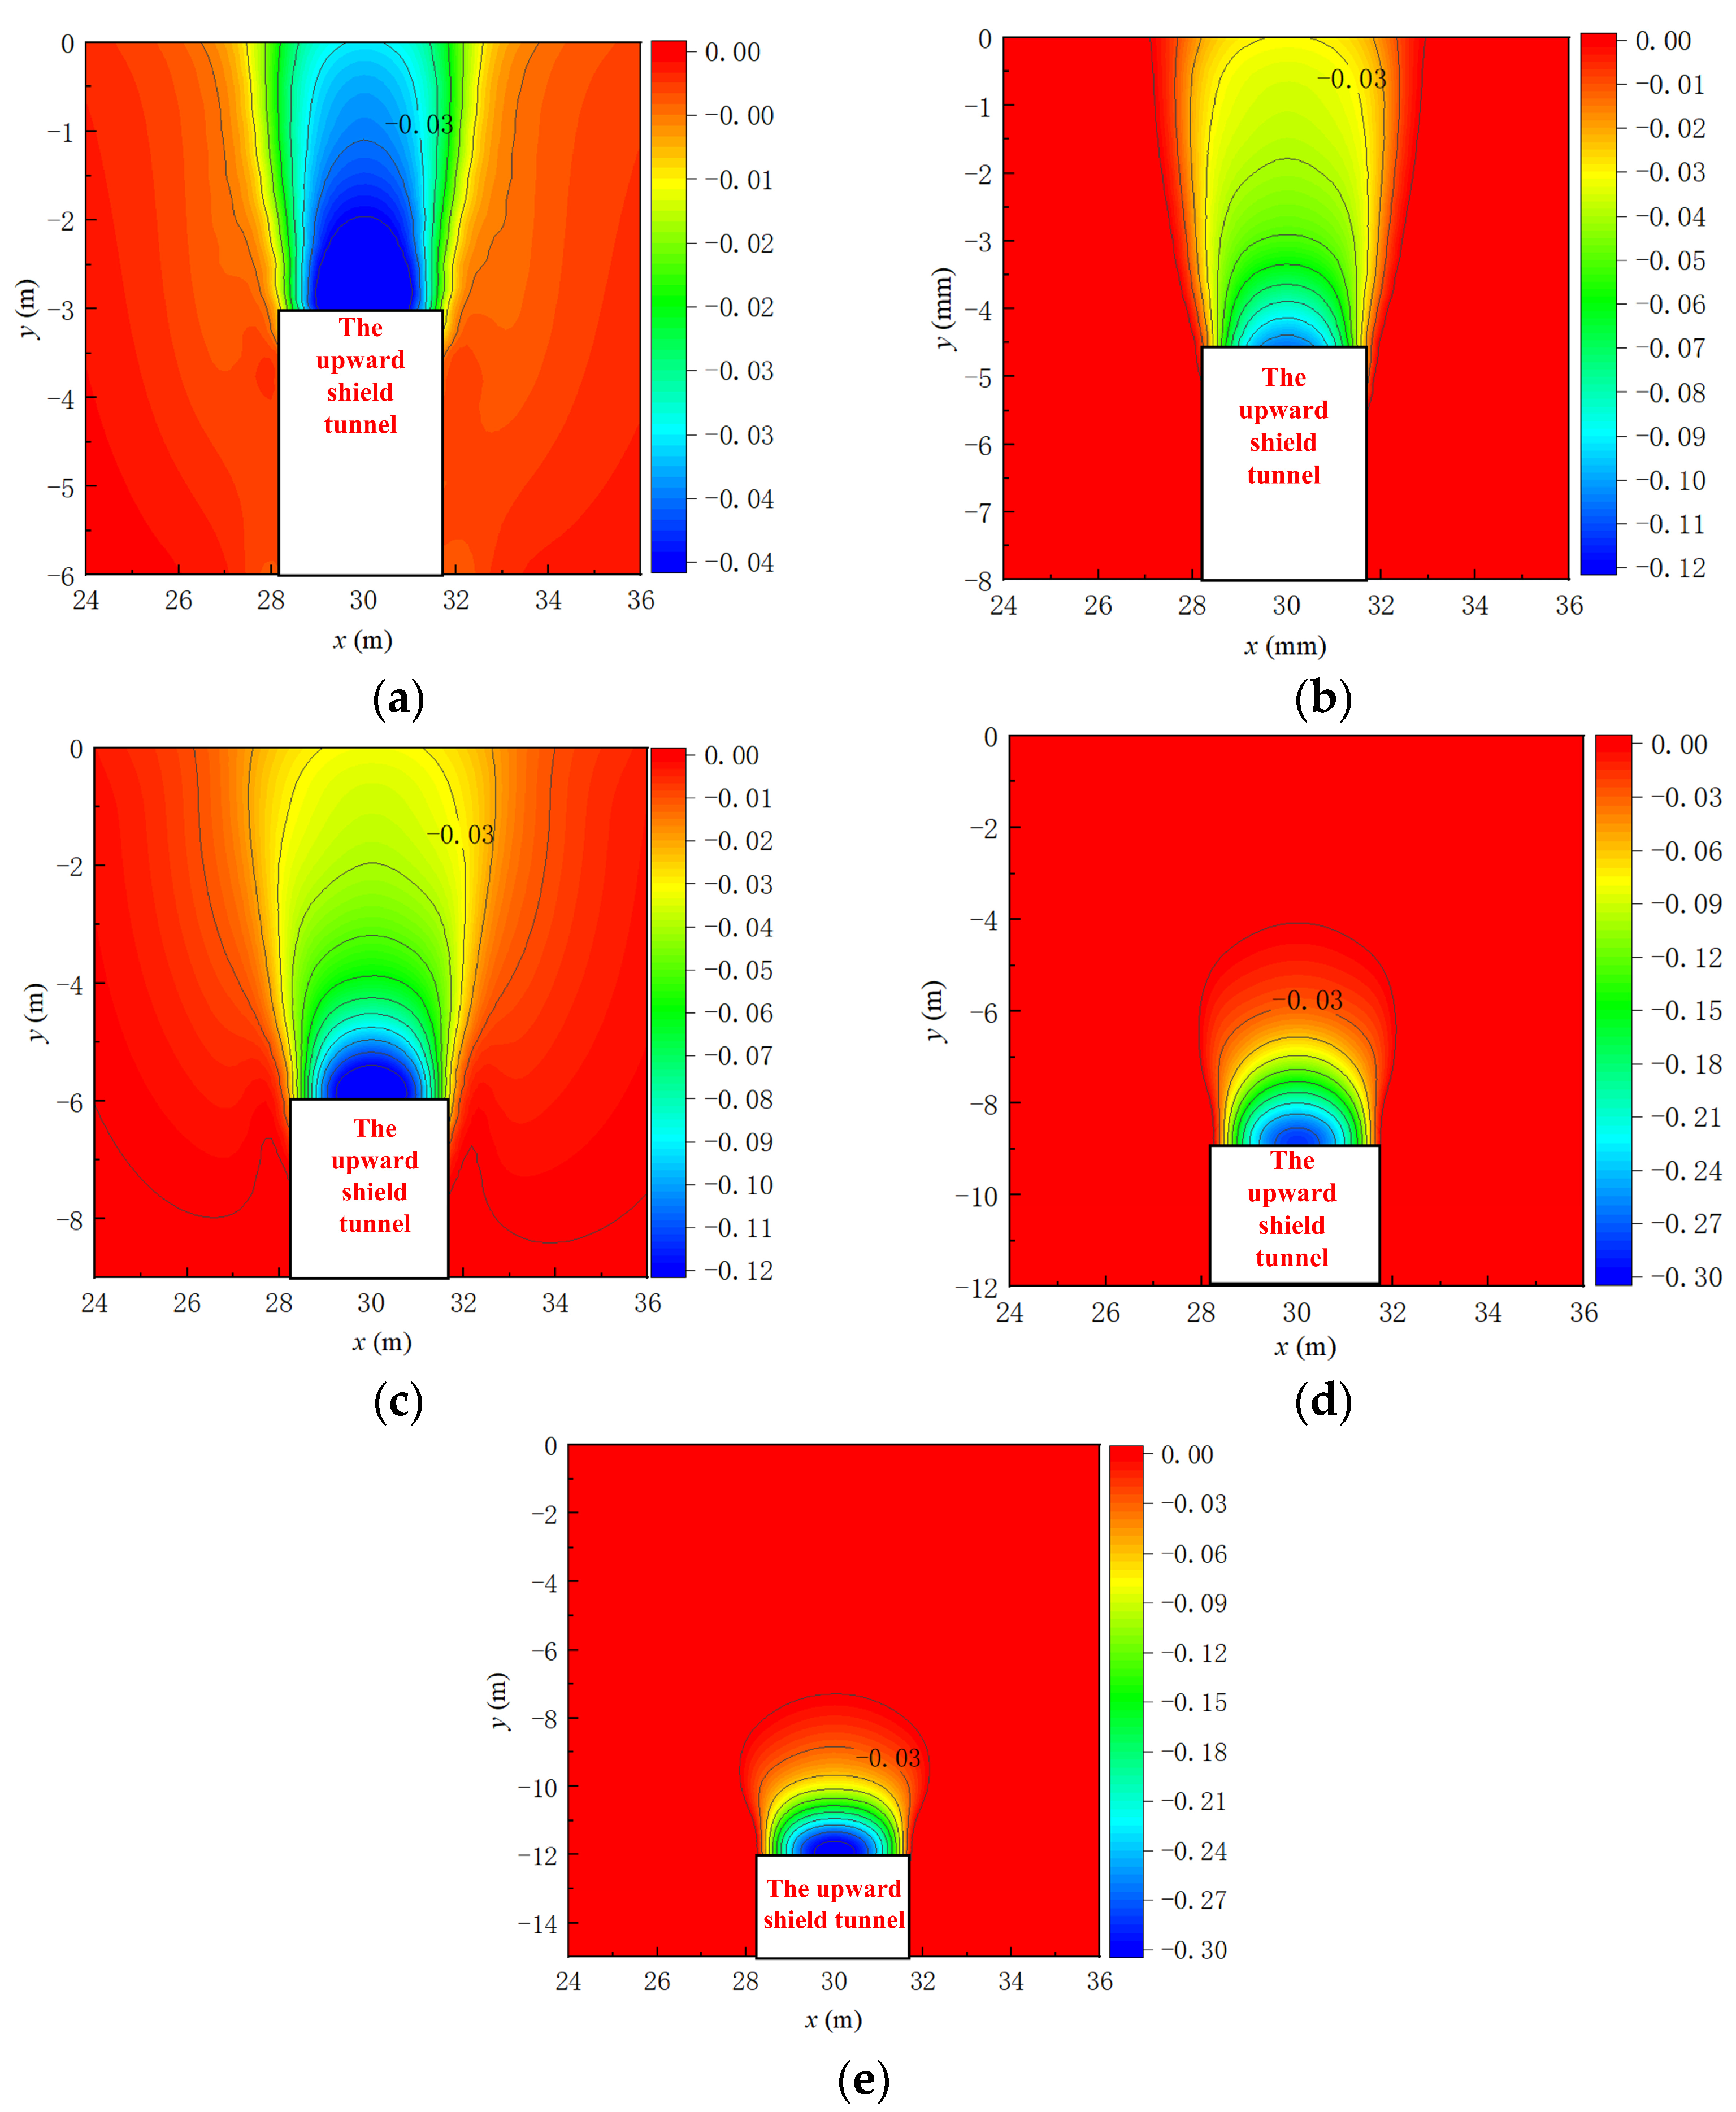
Figure 10 visualizes soil failure zones resulting from active instability at the excavation face during upward shield tunneling, under different burial depth conditions. For shallow burial depths (C/D < 3), the boundary of the failure zone is determined by the displacement contour extending to the ground surface [16], with the contour line at −0.03 m marking the division. As shown in Figure 10, the vertical failure zone of the soil is nearly conical. For deeper burial depths (C/D ≥ 3), a closed failure zone forms within the soil above the excavation face, with a height being approximately 1D. Cui et al. [34] discovered that the failure zone of the soil is greatly influenced by the tunnel burial depth through trapdoor tests. When the burial depth is greater, the soil arching effect becomes more evident, the principal stress rotation is more uniform, and a stable soil arch structure is more easily formed. Similarly, as depicted in Figure 10, with an increasing burial depth ratio, the soil arching effect above the excavation face in the upward shield tunnel is strengthened, and the stress rotation in the soil is more uniform, facilitating the formation of a stable soil arching structure within the soil itself [34]. In cases of shallow burial depth, the vertical failure zone of the soil can extend to the surface.

3.2. The Variation Law of Limit Support Pressure During Active Instability of the Excavation Face in the Numerical Model

The support pressure ratio η is defined as the current support pressure normalized by the initial vertical earth pressure at the tunnel depth (η = P/Pinitial), where P is the applied support pressure, and Pinitial is the initial support pressure (Pinitial = γC).
Figure 11 shows the displacement-to-support pressure ratio curve during active instability of the excavation face. Displacement data were measured at the center point of the excavation face along the vertical direction. It demonstrates that the displacement-to-support pressure ratio of the excavation face exhibits a similar pattern across various burial depth ratios. For instance, when C/D is 2, the variation pattern can be categorized into two stages:
The first stage is the slow change phase. During this phase, as the support pressure ratio gradually decreases, the displacement of the excavation face increases slowly. When the support pressure ratio starts to decrease, the soil begins to form an initial arch, causing the stress above the excavation face to shift laterally. This initial decrease in the support pressure ratio results in only minor changes in displacement.
The second stage is the accelerated change phase: In this phase, further reduction in the support pressure ratio causes a continued increase in excavation face displacement. Once the support pressure ratio drops to its minimum value (i.e., the limit support pressure ratio is reached), a sudden spike in displacement occurs, signaling instability in the soil above the excavation face. As the support pressure ratio continues to decrease, the initial arch collapses and progresses upward, resulting in an accelerated rate of displacement change.
For a given displacement, the support pressure ratio (η) increases with the burial depth ratio (C/D). This occurs due to two synergistic mechanisms:
The support pressure ratio η is defined as the current support pressure normalized by the initial support pressure Pinitial. As Pinitial scales linearly with burial depth, deeper excavations inherently commence with higher baseline pressures. For a given absolute displacement requiring a similar absolute pressure reduction (ΔP) across depths, deeper cases exhibit proportionally smaller reductions in η due to the elevated initial reference value.
Furthermore, increased confining stress at higher C/D ratios enhances soil arching efficacy. This reinforcement delays plastification near the excavation face, necessitating larger relative pressure reductions to initiate comparable displacements. The soil consequently maintains predominantly elastic behavior until support pressures decline more substantially, thereby shifting the displacement onset toward elevated η values with increasing burial depth.
The minimum support pressure ratio (ηmin) was determined through a stepwise reduction procedure with adaptive step refinement in ABAQUS simulations, based on the limit equilibrium state during active instability. The specific determined steps are as follows:
(1)
The initial support pressure ratio (η = P/Pinitial) was reduced from η = 1.0 (full support) to η = 0 (no support) in 20 coarse steps (each coarse step reducing η by 0.05).
(2)
Upon detection of a displacement acceleration point (‘knee point’) within a coarse step, the simulation backtracked to the preceding stable pressure ratio.
(3)
Upon detection of the knee point within a coarse step interval, the step size was immediately reduced to 0.01. The refinement process backtracked to the pressure ratio value immediately preceding the coarse step in which the knee point was detected.
(4)
From this preceding value, η was reduced again using the finer step size (0.01) through the region encompassing the suspected knee point. This fine-grained reduction allowed for the precise determination of ηmin corresponding to the onset of instability.
Figure 12 illustrates ηmin of the excavation face for various burial depth ratios. It indicates that the minimum support pressure ratio decreases with increasing burial depth ratio. For shallower depths (C/D < 3), the decrease in the minimum support pressure ratio is more substantial as the burial depth ratio increases. However, for greater burial depths (C/D ≥ 3), the reduction in the minimum support pressure ratio becomes less pronounced with increasing depth. This implies that greater burial depth ratios intensify the arching effect within the overburden soil, thereby enhancing stress transfer effectiveness to the surrounding soil. Consequently, the required minimum support pressure ratio decreases. At deeper burial depths, the stress above the excavation face is rotated more evenly, leading to the formation of a stable soil arch structure above the excavation face. In deep burial scenarios (C/D ≥ 3), the size and shape of the failure zone above the excavation face remain relatively similar. Additionally, there are smaller variations in stress, and the minimum support pressure ratio approaches a stable value.

3.3. Comparison and Verification of Numerical Model and Model Test

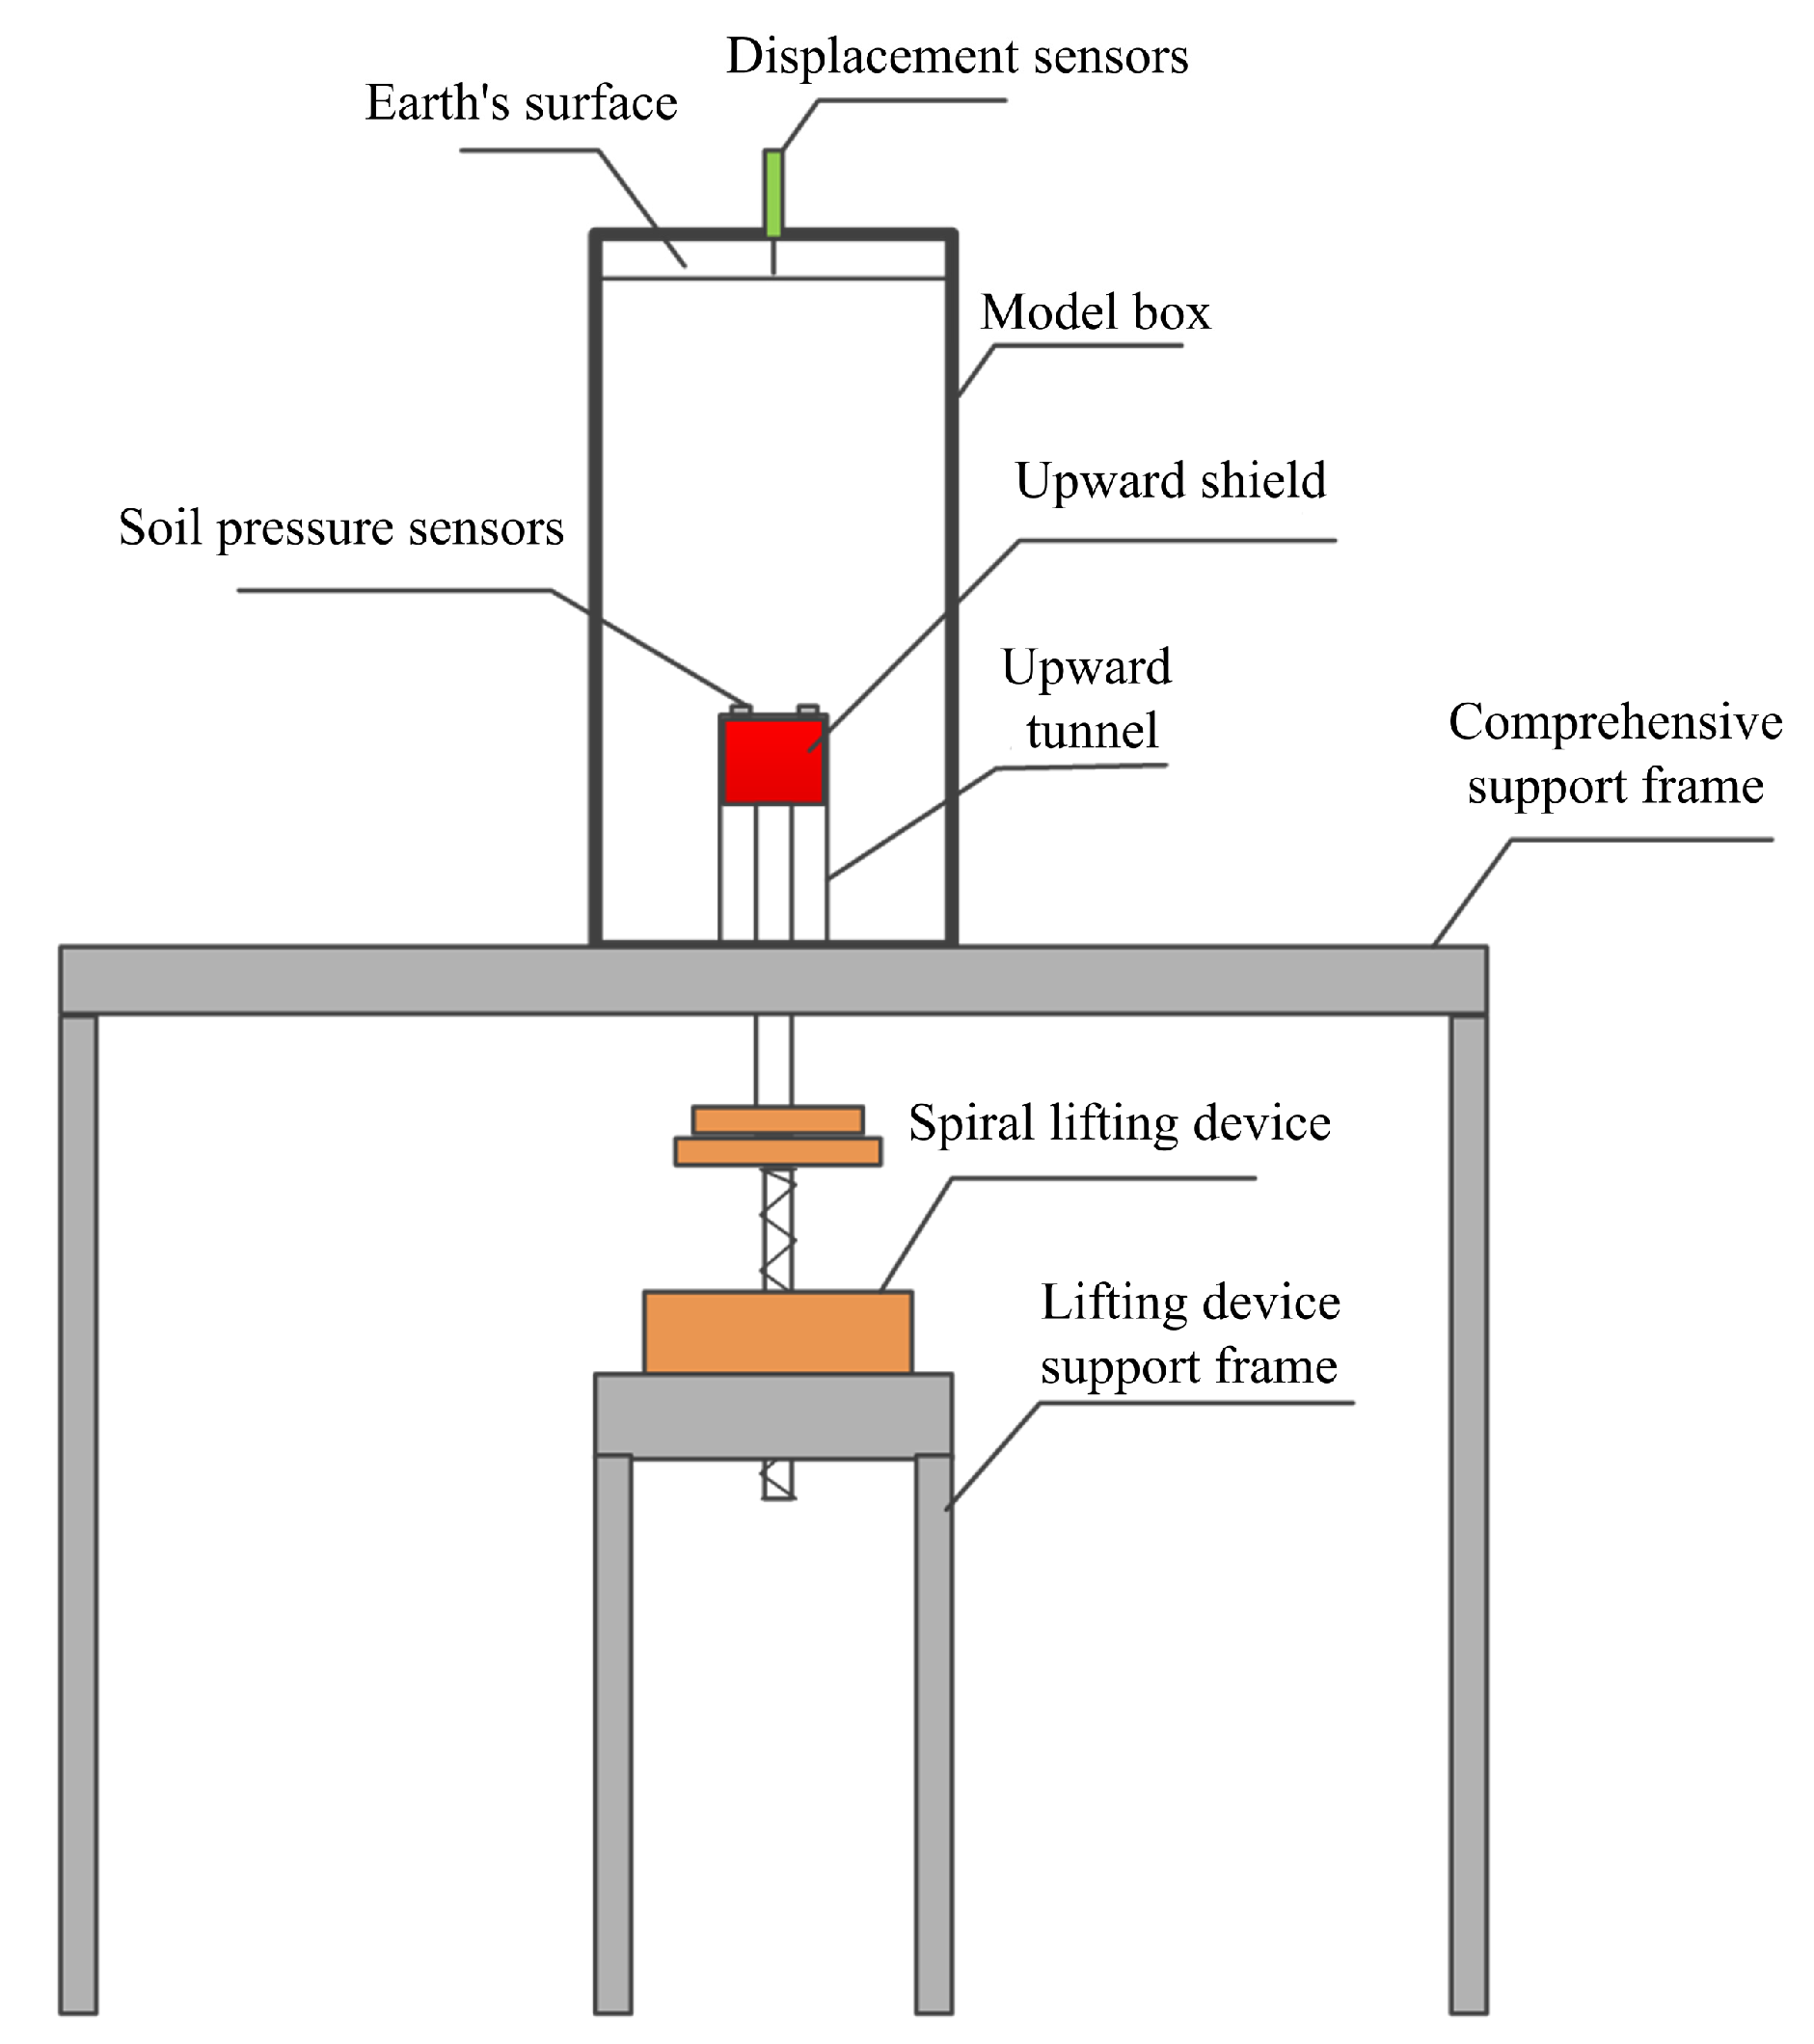
Based on the Midosuji Utility Tunnel Construction Project in Japan [23], a scaled (1:50) model testing device for the stability of the excavation face in upward shield tunneling has been independently designed (see Figure 13). The model includes a model box, a lifting device support frame, a comprehensive support frame, an upward tunnel, an upward shield, a spiral lifting device, and a data collection system. The spiral lifting device moves downward to drive the upward shield, simulating the active instability failure of the soil above the excavation face. The data collection system, which includes soil pressure sensors and surface displacement sensors positioned above the excavation face, records the variations in soil pressure and surface displacement during the excavation face instability. During the model test, LED lights are installed on the two sides of the model box for illumination, and a camera is placed at the front to capture images of the soil failure zone above the excavation face during the failure process.
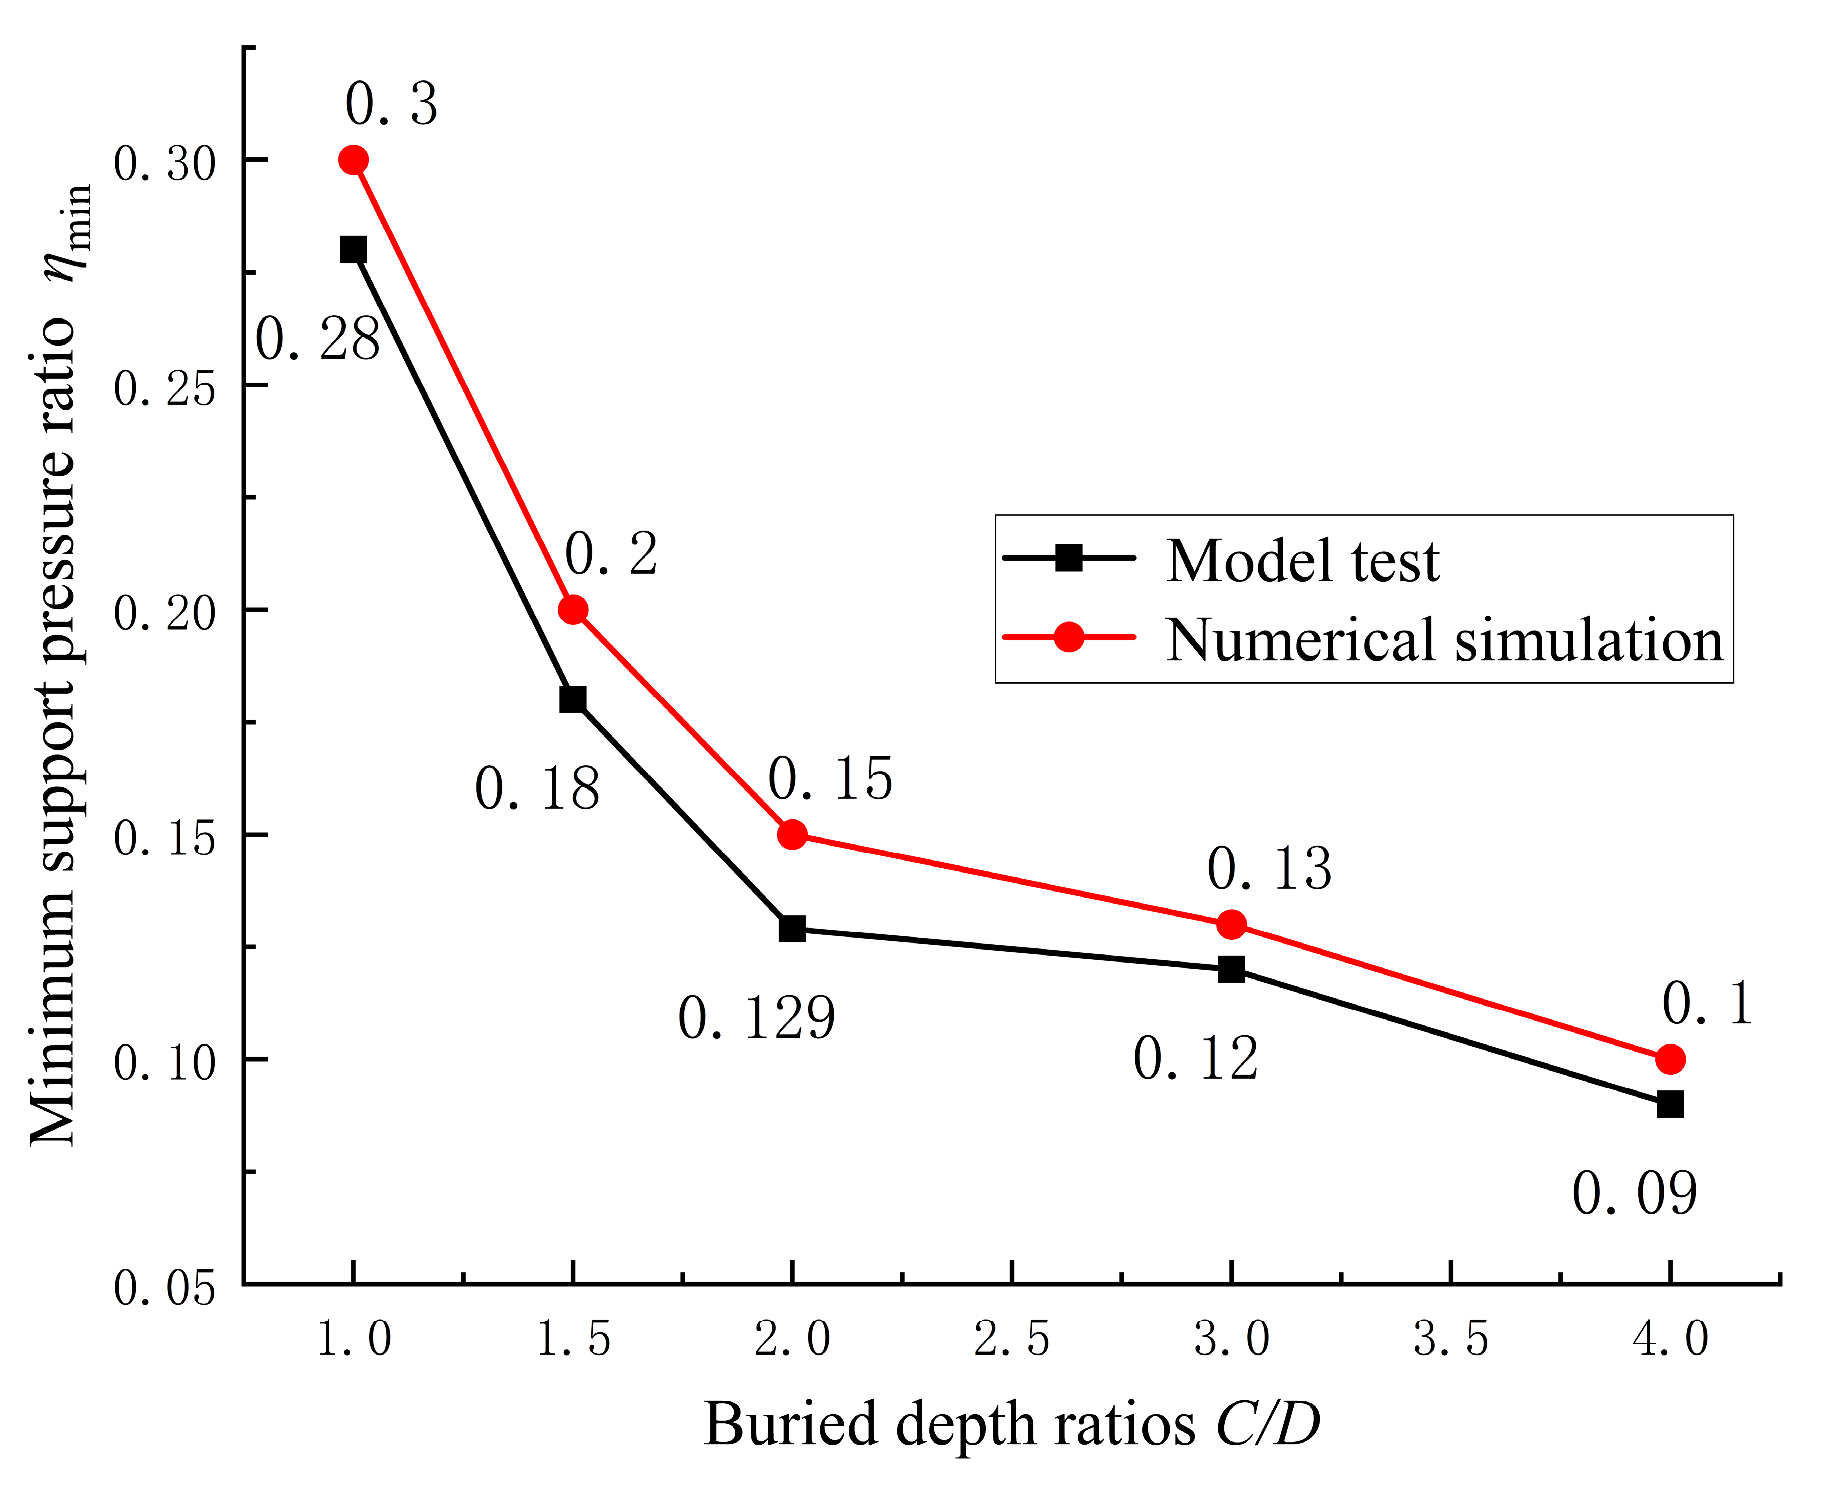
Numerical simulation results were benchmarked against model testing results to confirm reliability. Figure 14 illustrates the comparison of the minimum support pressure ratio results from both methods. The results show that the minimum support pressure ratios obtained through numerical simulation and model testing are relatively close. As the buried depth ratio (C/D) increases, both methods exhibit a consistent trend in which the minimum support pressure ratio decreases. This decrease is more significant for shallower depths (C/D < 3) and less for deeper depths (C/D ≥ 3). The agreement in the magnitude and trend of the minimum support pressure ratio between the numerical simulation and the model test confirms the accuracy of the numerical simulation results.
Figure 15 demonstrates that for shallow depths (C/D < 3), the model test results depict a nearly conical failure zone above the excavation face. For deeper depths (C/D ≥ 3), a closed failure zone forms in the soil above the excavation face. The similarity between the failure zone images from model tests and numerical simulations further corroborates the validity of both methods.

4. Numerical Analysis of Active Instability of Upward Shield Tunneling Excavation Face

4.1. Variation in Surface Displacement Under Active Instability

All surface displacements in Figure 16 are measured at the ground surface position directly above the upward tunnel axis. This location exhibits the maximum settlement during excavation face instability and serves as the control point for surface deformation analysis.
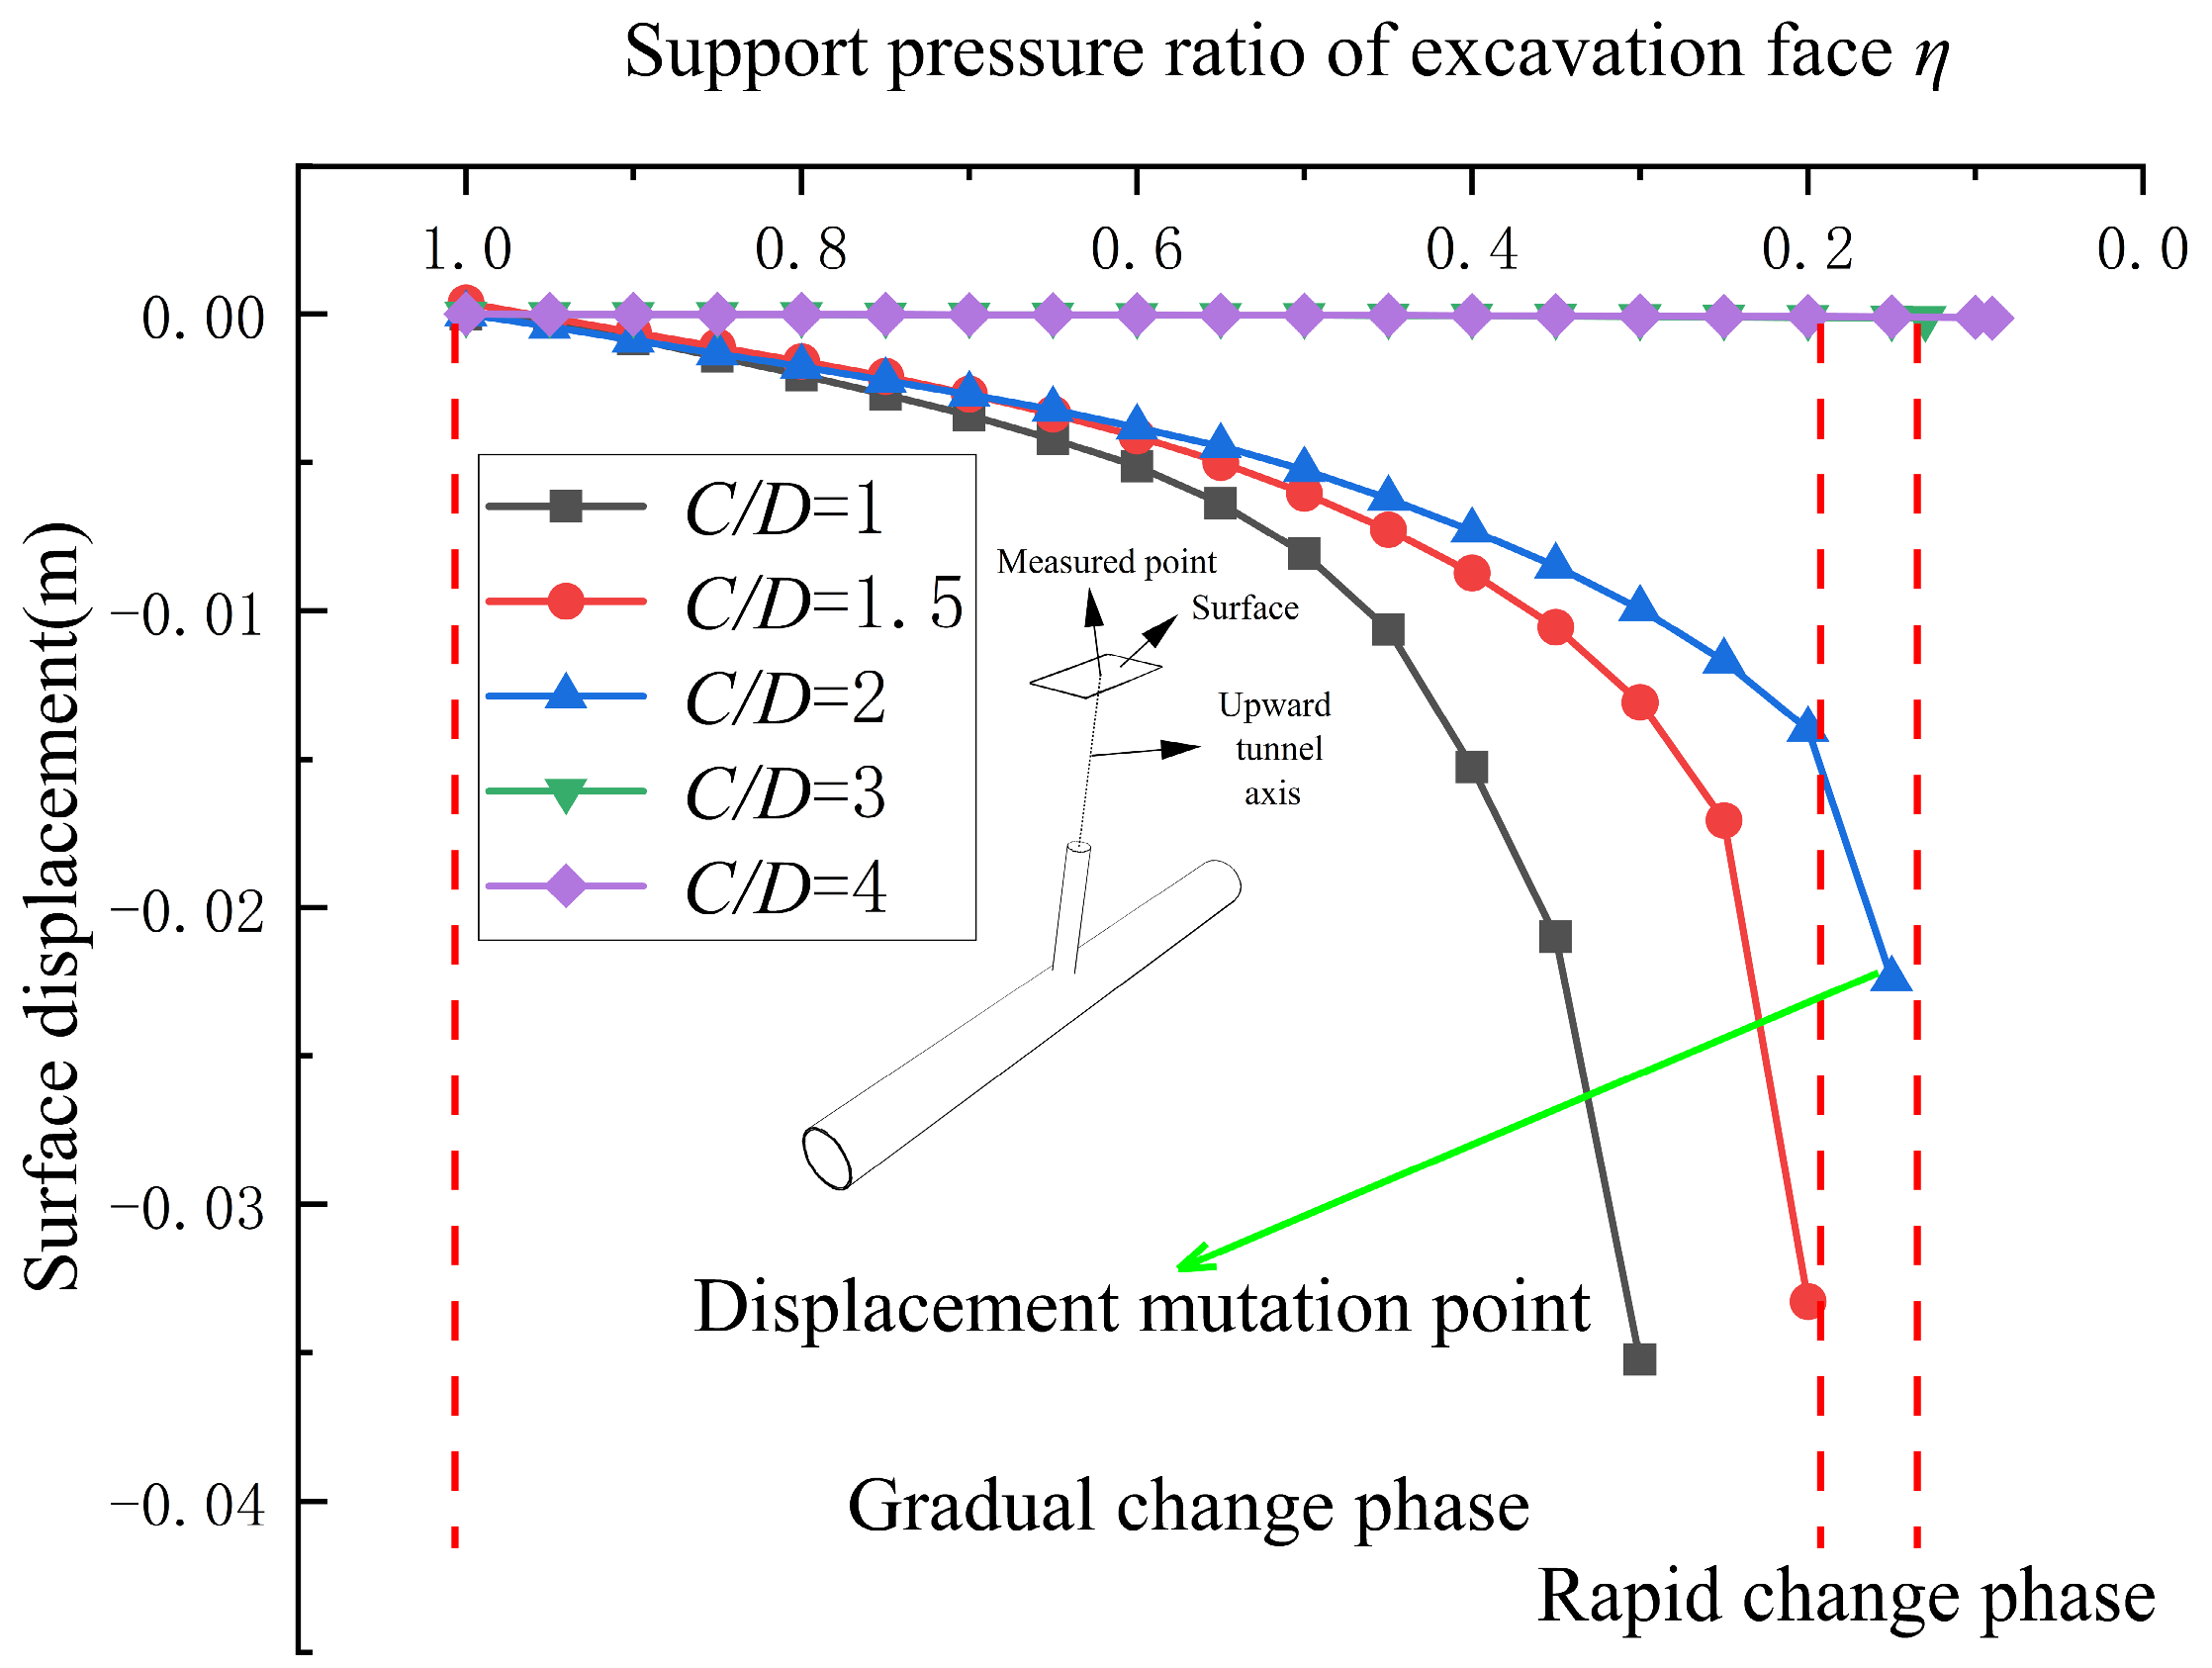
Figure 16 shows the surface displacement trends under the condition of active instability of the excavation face in upward shield tunneling. It demonstrates that different buried depths result in varying patterns of surface displacement changes as the support pressure ratio decreases. For shallower depths (C/D < 3), such as C/D = 2, the surface displacement change is characterized by two distinct phases:
The first phase is the gradual change phase. During this phase, surface displacement changes slowly with decreasing support pressure ratio. Initial soil arch formation begins upon further reduction, diverting stress from above the excavation face into the surrounding soil. As a result, surface displacement does not vary significantly.
The second phase is the rapid change phase. In this phase, when the support pressure ratio reaches the minimum value, a sudden change in surface displacement is observed, signifying the instability of the soil mass above the excavation face. With an increasing buried depth ratio, the magnitude of the sudden change in surface displacement decreases. This indicates that as the depth increases, the soil arching effect is enhanced, leading to a reduction in the extent of surface displacement changes.
Figure 10 shows that with greater buried depths (C/D ≥ 3), the stress rotation above the excavation face becomes more uniform, allowing for the formation of a stable soil arch structure within the soil mass. In such cases, the instability of the excavation face does not significantly impact the surface displacement.
The settlement troughs in Figure 17 are measured perpendicular to the horizontal tunnel axis on the ground surface. This setup ensured that we captured the full settlement trough—including the maximum settlement at the upward tunnel axis and the gradual decrease in settlement toward the trough edges.
Figure 17 depicts the surface settlement troughs under the condition of active instability of the excavation face during upward shield tunneling for different buried depths. It can be observed that for shallow depths (C/D < 3), as the buried depth ratio increases, the depth of the surface settlement trough gradually decreases and the trough becomes flatter, with an influence range approximately equal to 3D. For deeper depths (C/D ≥ 3), the instability and failure zone of the excavation face do not extend to the surface, resulting in almost zero surface displacement.

4.2. Variation in Stress and Deformation of Horizontal Tunnel Segment Under Active Instability

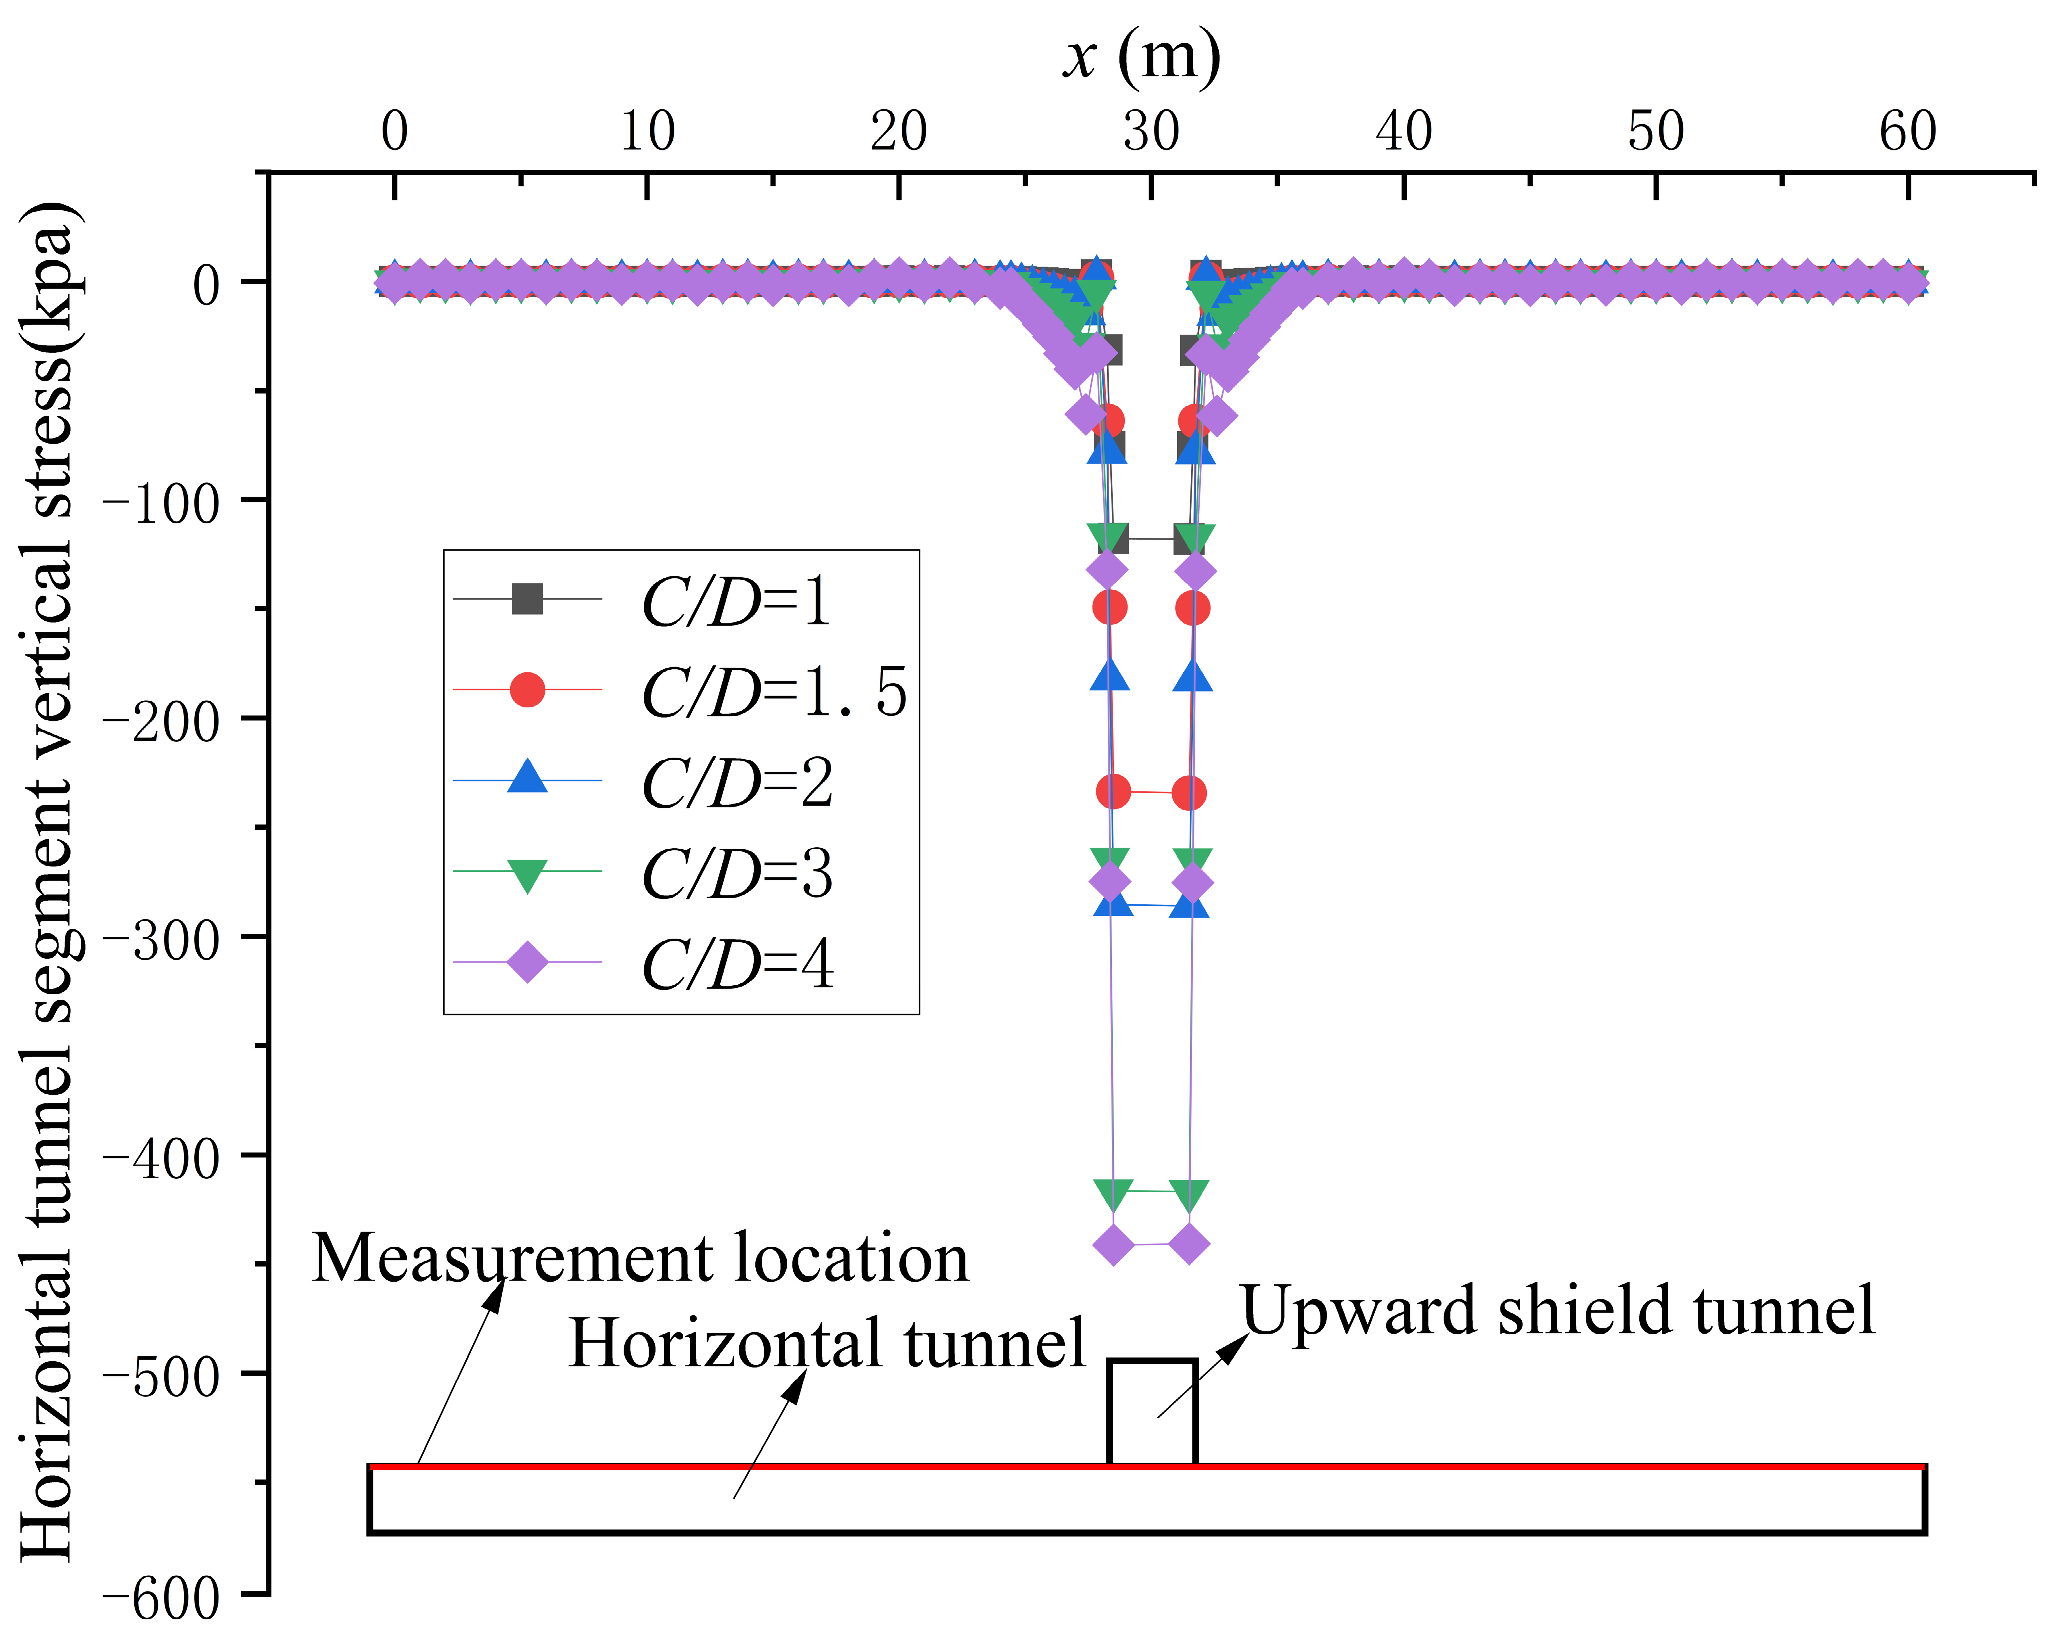
Figure 18 depicts the vertical stress variation at the top of the horizontal tunnel segments during active instability of the excavation face in upward shield tunneling. It can be observed that after the soil above the excavation face undergoes active instability, the stress at the top opening of the horizontal tunnel segment increases. As the buried depth ratio increases, the distance between the excavation face and the top opening of the horizontal tunnel segment decreases, resulting in a greater increase in stress.
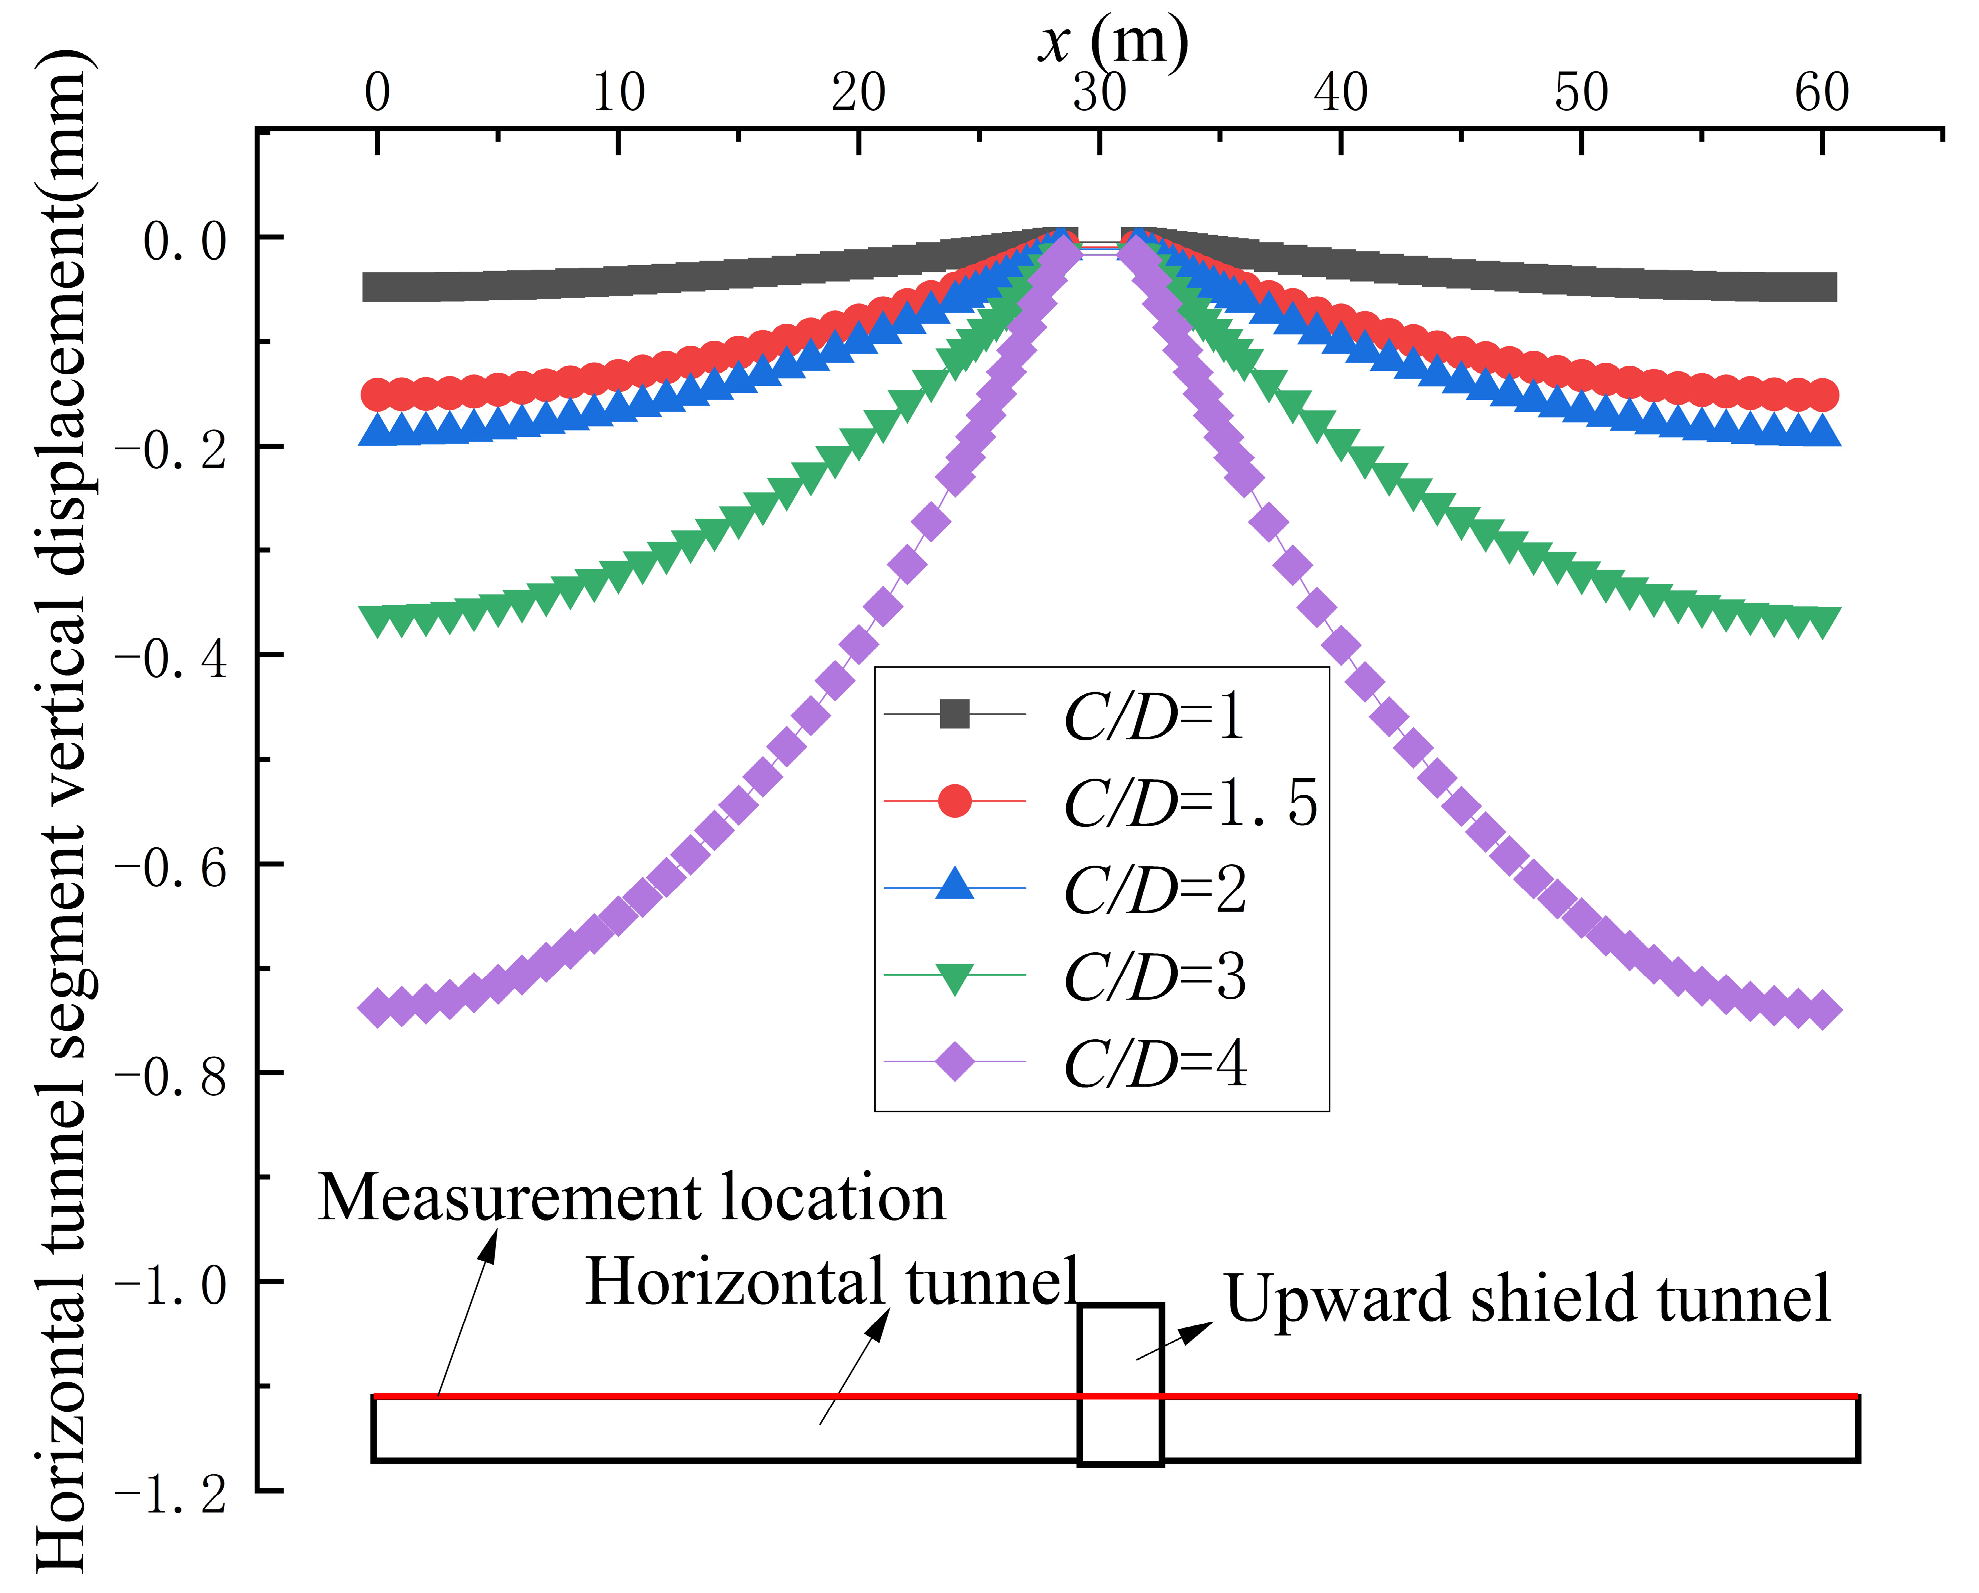
Figure 19 shows the displacement variation in the horizontal tunnel segments during active instability of the excavation face in upward shield tunneling. After the soil above the excavation face undergoes active instability, the horizontal tunnel segments move downward as a whole. With the decrease in the support pressure ratio, the horizontal tunnel segments exhibit an upward displacement at the vertical tunnel opening, ultimately forming an inverted V shape. The larger the buried depth ratio, the later the active instability occurs, the smaller the distance between the excavation face and the horizontal tunnel segment top opening, and the greater the upward displacement of the horizontal tunnel segments near the top opening.

4.3. Variation in Horizontal Soil Displacement Under Active Instability

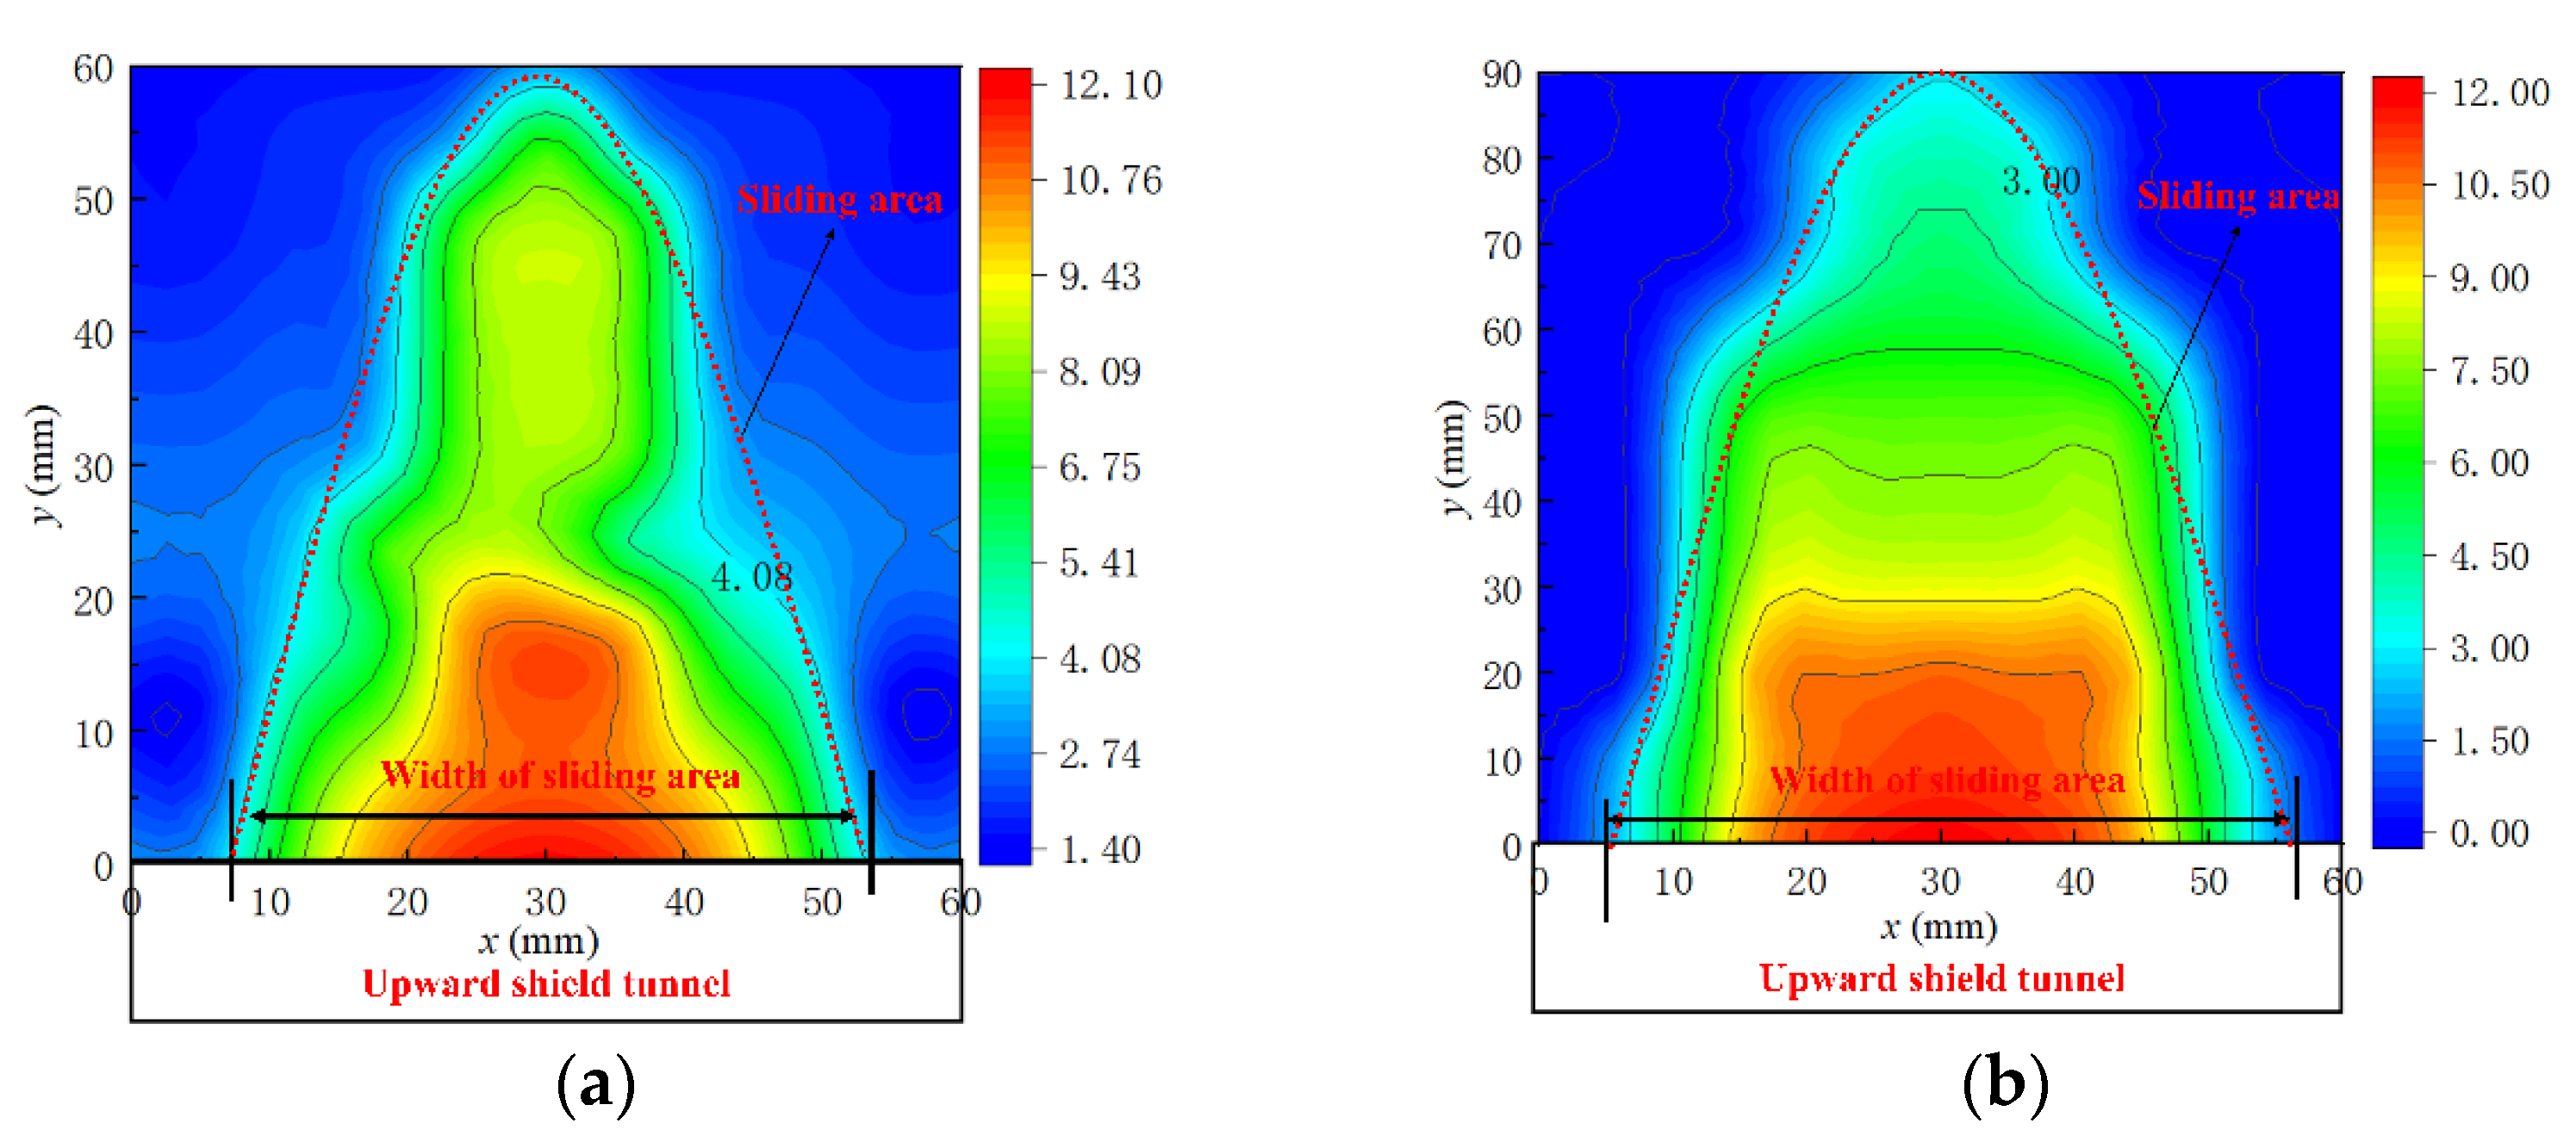
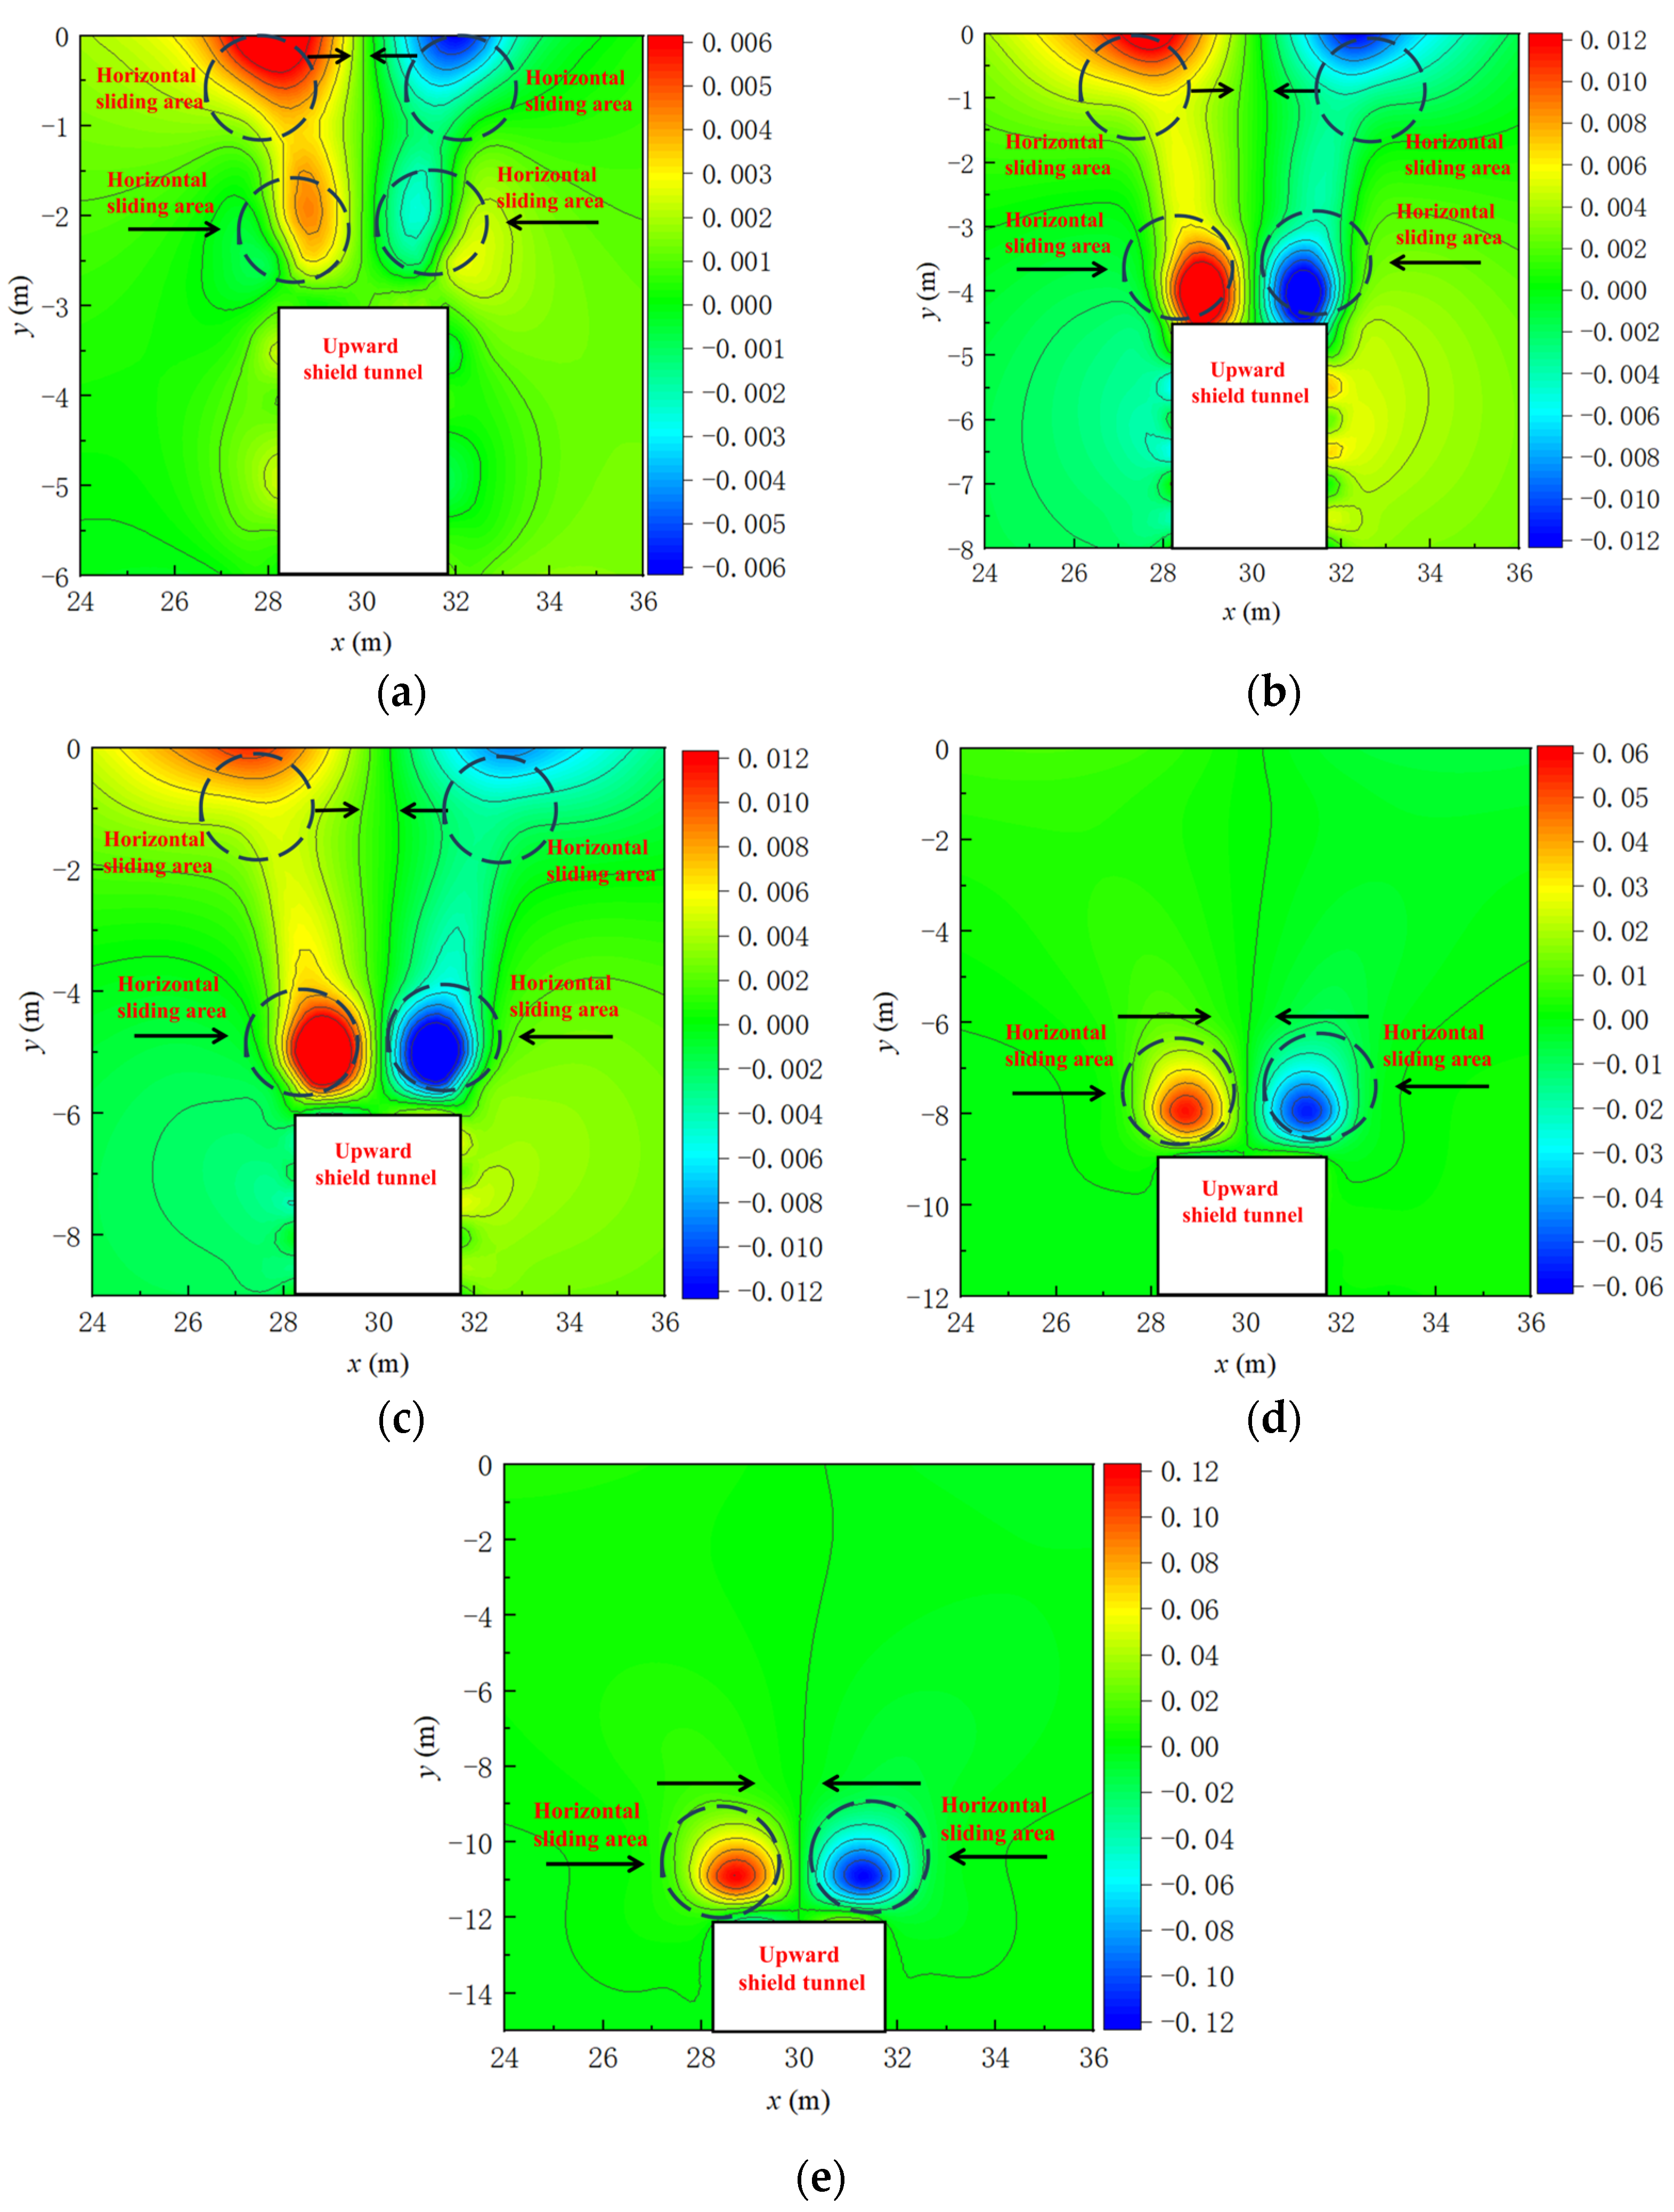
Figure 20 illustrates the horizontal soil displacement under different buried depth ratios during active instability. When the buried depth is relatively shallow (C/D < 3), the horizontal failure zone of the soil above the excavation face is divided into four regions. In the region near the surface, the soil on both sides moves inward and wedges together. The soil near the excavation face moves towards the upward tunnel. As the buried depth ratio increases, the horizontal failure zone of the soil above the excavation face transitions into two regions, with the height of the horizontal failure zone being approximately 1D.

4.4. Variation in Earth Pressure Under Active Instability

During the active instability of the excavation face in upward shield tunneling, vertical and horizontal soil pressure changes are closely linked to soil displacement. Correlating soil displacement with soil pressure changes helps elucidate the soil pressure mechanism in various regions during the active instability of the excavation face. Two-parameter variables are defined as:
η v = σ v σ v 0
η h = σ h σ h 0
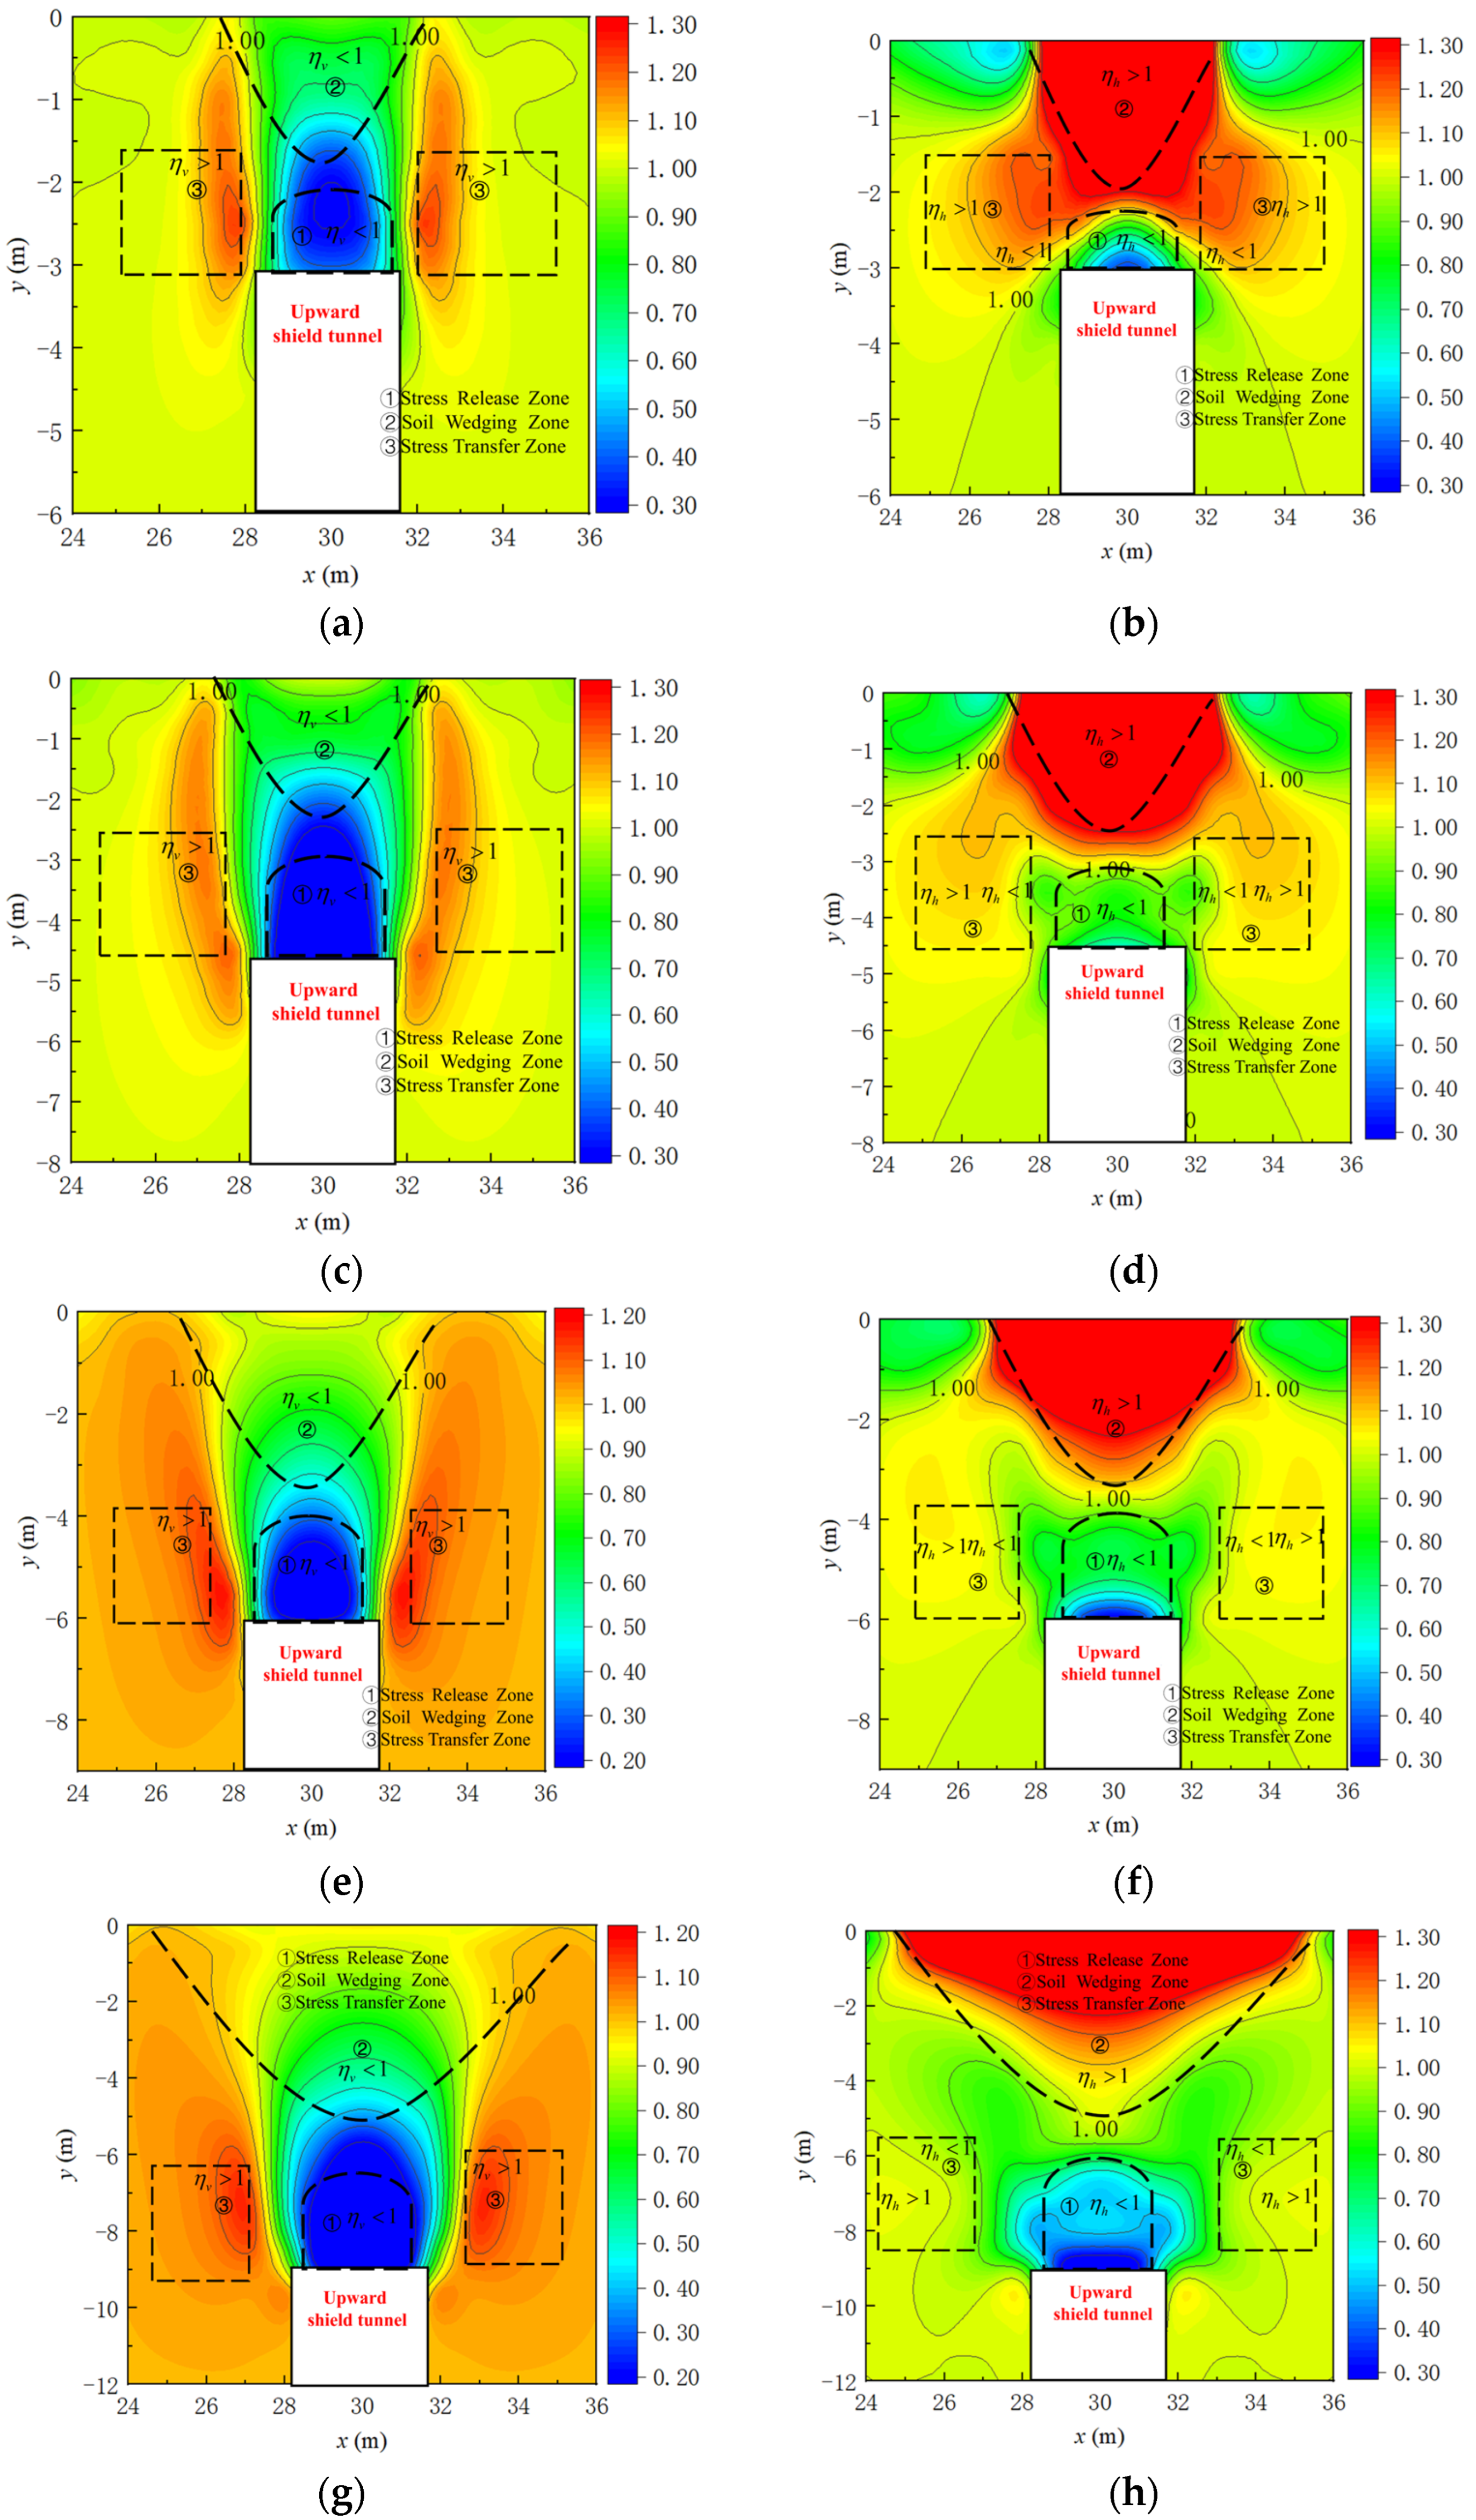
where ηv represents the vertical soil pressure ratio, σv represents vertical soil pressure at a point after active instability of the upward shield tunneling excavation face, and σv0 represents the vertical soil pressure at the same point before active instability. The value of ηv indicates the change in vertical soil pressure; ηv > 1 indicates an increase in vertical soil pressure during active instability, and ηv < 1 indicates a decrease in vertical soil pressure during active instability. Similarly, ηh represents the horizontal soil pressure ratio, σh represents the horizontal soil pressure at a point after active instability of the upward shield tunneling excavation face, and σh0 represents the horizontal soil pressure at the same point before active instability. The value of ηh indicates the change in horizontal soil pressure; ηh > 1 indicates an increase in horizontal soil pressure during active instability, and ηh < 1 indicates a decrease in horizontal soil pressure during active instability.
Figure 21 illustrates the changes in horizontal and vertical soil pressures after the active instability of the excavation face at different burial depths. It shows that during the active instability of the upward tunneling shield tunnel excavation face, soil pressure changes can be categorized into three regions: stress release zone, soil wedging zone, and stress transfer zone.
(1)
Stress release zone
The stress release zone corresponds to the region with the largest vertical displacement (see Figure 10). As the support pressure ratio of the excavation face gradually decreases, the soil within the stress release zone moves towards the upward shield tunnel, leading to a stress release state in the stress release zone. This results in both vertical and horizontal soil pressures decreasing in this zone (ηv < 1, ηh < 1).
(2)
Soil wedging zone
The soil wedging zone is located above the stress release zone. The significant vertical displacement in the stress release zone causes the soil in the soil wedging zone to slide downwards, reducing vertical soil pressure in the soil wedging zone (ηv < 1). Horizontally, the soil particles in the soil wedging zone move towards each other, leading to an increase in horizontal soil pressure due to wedging effects (ηh > 1).
(3)
Stress transfer zone
The soil arching effect during the active instability of the excavation face transfers the soil pressure from the soil wedging zone to the stress transfer zone. This results in an increase in vertical soil pressure in the stress transfer zone (ηv > 1). Horizontally, a stress release zone forms, and there is a tendency for soil to move inward, leading to a decrease in horizontal soil pressure (ηh < 1). However, further from the stress release zone, the horizontal soil pressure increases due to the load transferred from the soil above (ηh > 1). Figure 21 shows that with increasing burial depth ratio, the soil pressure in the soil wedging zone increases, enhancing the wedging effect between soil particles and expanding the range of the soil wedging zone.

5. Conclusions

The Midosuji Utility Tunnel Construction Project in Japan served as a prototype for upward shield tunneling projects. In this study, numerical models were established to simulate the active instability of the excavation face under varying burial depth ratios (C/D = 1, 1.5, 2, 3, 4). The main conclusions are as follows:
(1)
The numerical simulation results of the minimum support pressure ratio and its variation under the active instability conditions of the upward shield tunneling excavation face are close to those from model tests. As the burial depth ratio increases, the minimum support pressure ratio decreases. The failure zones of the soil at the excavation face obtained from numerical simulation align with the model test results. Under shallow burial conditions, the failure zone is an inverted cone, while in deep burial conditions, it adopts a bullet-shaped configuration. The similarity between numerical simulation results and model test results verifies the reliability of the numerical simulation results.
(2)
Under the active instability conditions of the upward shield tunneling excavation face, the stress at the top opening position of the horizontal tunnel segments increases. Moreover, with the increase in burial depth ratio, the stress increment becomes larger. In this state, the horizontal tunnel segments will move downward as a whole. As the support pressure ratio of the excavation face decreases, the horizontal tunnel segments at the top opening will exhibit upward displacement, eventually forming an inverted V shape. The greater the burial depth ratio, the larger the downward displacement of the horizontal tunnel segments near the top opening.
(3)
Under the active instability conditions of the upward shield tunneling excavation face, when the burial depth is relatively small (C/D < 3), the main horizontal failure zone of the soil above the excavation face is divided into three regions. When the burial depth is relatively large (C/D ≥ 3), the main horizontal failure zone above the excavation face consists of two regions, with the soil on both sides moving inward and interlocking. By analyzing the relationship between the displacement and stress changes in the soil above the excavation face after active instability, the stress change zones of the excavation face are classified into three categories: stress release zone, soil interlocking zone, and stress transfer zone.
This study can provide references for the excavation face stability during upward shield tunneling. However, it does not address instability patterns in water-bearing strata or clayey soils, which can be explored in future research.

Author Contributions

Conceptualization, X.W. (Xiao Wang) and G.W.; Data curation, X.W. (Xiao Wang) and Y.L.; Formal analysis, X.W. (Xiao Wang), Y.L. and Z.L.; Funding acquisition, X.W. (Xiao Wang), G.W., X.W. (Xinjiang Wei), Y.L. and X.S.; Investigation, X.S.; Methodology, Y.L. and Z.L.; Project administration, Z.Y. and J.Y.; Resources, X.W. (Xiao Wang) and G.W.; Supervision, G.W. and X.W. (Xinjiang Wei); Visualization, X.W. (Xiao Wang) and Y.L.; Writing—original draft, X.W. (Xiao Wang) and Y.L.; Writing—review and editing, G.W., X.W. (Xinjiang Wei), Z.Y. and J.Y. All authors have read and agreed to the published version of the manuscript.

Funding

This research was funded by the National Natural Science Foundation of China (Grant No. 52308421), and Natural Science Foundation of Zhejiang Province (Grant No. LHZ23E080001), and Research Projects of Department of Education of Zhejiang Province (Grant No. Y202248906), and the Education Ministry’s Collaborative Education Project with Industry (Grant No. 240806473304945), and the Scientific Research Fund of Zhejiang Provincial Education Department (Grant No. Y202455922), and the Key Laboratory of Safe Construction and Intelligent Maintenance for Urban Shield Tunnels of Zhejiang Province (Grant No. ZUCC-UST-22-06).

Institutional Review Board Statement

Not applicable.

Data Availability Statement

The original contributions presented in the study are included in the article, further inquiries can be directed to the corresponding author.

Conflicts of Interest

Authors Zihai Yan and Jiajia Yan are employed by the Power China Huadong Engineering Corporation. The remaining authors declare that the research was conducted in the absence of any commercial or financial relationships that could be construed as a potential conflict of interest.

References

  1. Walton, G.; Kim, E.; Sinha, S.; Sturgis, G.; Berberick, D. Investigation of Shaft Stability and Anisotropic Deformation in a Deep Shaft in Idaho, United States. Int. J. Rock Mech. Min. Sci. 2018, 105, 160–171. [Google Scholar] [CrossRef]
  2. Wang, T.; Fang, B.; Hu, T.; Wei, L.; Dai, G. Field Study on the Application of Combined Grouting for the Super-Long Drilled Shaft. Results Eng. 2023, 19, 101366. [Google Scholar] [CrossRef]
  3. Feng, D.-L.; Wu, H.-N.; Chen, R.-P.; Liu, F.-X.; Yao, M. An Analytical Model to Predict the Radial Deformation of Surrounding Rock during Shaft Construction via Shaft Boring Machine. Tunn. Undergr. Space Technol. 2023, 140, 105321. [Google Scholar] [CrossRef]
  4. Yang, Y.-F.; Liao, S.-M.; Liu, M.-B.; Wu, D.-P.; Pan, W.-Q.; Li, H. A New Construction Method for Metro Stations in Dense Urban Areas in Shanghai Soft Ground: Open-Cut Shafts Combined with Quasi-Rectangular Jacking Boxes. Tunn. Undergr. Space Technol. 2022, 125, 104530. [Google Scholar] [CrossRef]
  5. Himuro, A. Upward Shield Tunneling from Deep Underground Stormwater Storage Pipes in the Central Areas. In Proceedings of the WEFTEC 2007, Water Environment Federation, San Diego, CA, USA, 13–17 October 2007; pp. 9312–9320. [Google Scholar]
  6. Konoha, Y.; Yamamoto, Y. Turning Simple Ideas into Reality: Development and Application of Upward Shield Tunneling Method for the Sewer Construction Project along Bandai-Hannan Line. Civ. Eng. 2003, 53–57. [Google Scholar]
  7. Wang, X.; Wei, X.; Wei, G.; Zhu, C.; Jin, T.; Yan, Z. Theoretical and Numerical Analysis of the Failure Mechanism and Jacking Force during Vertical Tunneling Using a CEL Approach. Tunn. Undergr. Space Technol. 2024, 148, 105765. [Google Scholar] [CrossRef]
  8. Zhou, Y.; Wei, G.; Wang, X.; Tao, B.; Huang, Q.; Wei, X. Analytical Solution of Soil Deformation Caused by Vertical Pipe Jacking Construction Considering Grouting Pressure. Sci. Rep. 2025, 15, 17476. [Google Scholar] [CrossRef]
  9. Wei, G.; Feng, F.; Huang, S.; Xu, T.; Zhu, J.; Wang, X.; Zhu, C. Full-Scale Loading Test for Shield Tunnel Segments: Load-Bearing Performance and Failure Patterns of Lining Structures. Undergr. Space 2025, 20, 197–217. [Google Scholar] [CrossRef]
  10. Wei, G.; Feng, W.; Wu, X.; Wu, P.; Li, H.; Zhu, Z.; Wang, Z. Research on the Combined Control of Tunnel Deformation Adjacent to the Foundation Pit by Servo Steel Strut and Capsule Grouting. Sci. Rep. 2025, 15, 23432. [Google Scholar] [CrossRef] [PubMed]
  11. Wei, G.; Zhou, Y.; Wang, Z.; Wang, Q.; Lu, C.; Feng, G. Deformation Control of Shield Tunnels Affected by Staged Foundation Pit Excavation: Analytical Method and Case Study. Buildings 2025, 15, 2046. [Google Scholar] [CrossRef]
  12. Xu, J.; Gao, M.; Wang, Y.; Yu, Z.; Zhao, J.; DeJong, M.J. Numerical Investigation of the Effects of Separated Footings on Tunnel-Soil-Structure Interaction. J. Geotech. Geoenviron. Eng. 2025, 151, 04025057. [Google Scholar] [CrossRef]
  13. De Buhan, P.; Cuvillier, A.; Dormieux, L.; Maghous, S. Face Stability of Shallow Circular Tunnels Driven under the Water Table: A Numerical Analysis. Int. J. Numer. Anal. Methods Geomech. 1999, 23, 79–95. [Google Scholar] [CrossRef]
  14. Huang, M.; Li, S.; Yu, J.; Tan, J.Q.W. Continuous Field Based Upper Bound Analysis for Three-Dimensional Tunnel Face Stability in Undrained Clay. Comput. Geotech. 2018, 94, 207–213. [Google Scholar] [CrossRef]
  15. Ukritchon, B.; Yingchaloenkitkhajorn, K.; Keawsawasvong, S. Three-Dimensional Undrained Tunnel Face Stability in Clay with a Linearly Increasing Shear Strength with Depth. Comput. Geotech. 2017, 88, 146–151. [Google Scholar] [CrossRef]
  16. Zhang, C.; Han, K.; Zhang, D. Face Stability Analysis of Shallow Circular Tunnels in Cohesive–Frictional Soils. Tunn. Undergr. Space Technol. 2015, 50, 345–357. [Google Scholar] [CrossRef]
  17. Vermeer, P.A.; Ruse, N.; Marcher, T. Tunnel Heading Stability in Drained Ground. Felsbau 2002, 20, 8–18. [Google Scholar]
  18. Kim, S.H.; Tonon, F. Face Stability and Required Support Pressure for TBM Driven Tunnels with Ideal Face Membrane–Drained Case. Tunn. Undergr. Space Technol. 2010, 25, 526–542. [Google Scholar] [CrossRef]
  19. Sterpi, D.; Cividini, A. A Physical and Numerical Investigation on the Stability of Shallow Tunnels in Strain Softening Media. Rock Mech. Rock Eng. 2004, 37, 277–298. [Google Scholar] [CrossRef]
  20. Qiao, J.-L.; Zhang, Y.-T.; Gao, J.; Li, Y.-Y. Application of Strength Reduction Method to Stability Analysis of Shield Tunnel Face. J. Tianjin Univ. (Sci. Technol.) 2010, 43, 14–20. (In Chinese) [Google Scholar]
  21. Lei, H.-Y.; Liu, M.; Zhong, H.-C.; Xu, Y.-G.; Yuan, D.-J. Centrifuge Model Test and Numerical Simulation of Face Instability of Shield Tunnel in Clay. J. Tianjin Univ. (Sci. Technol.) 2023, 56, 503–512. (In Chinese) [Google Scholar]
  22. Yan, B.-H. Numerical Simulation and Centrifugal Test Study on Stability of Shield Tunnel Excavation Surface Under Seepage Conditions. Master’s thesis, Chang’an University, Xi’an, China, 2020. (In Chinese). [Google Scholar]
  23. 2015 Outstanding Civil Engineering Achievement Award|Japan Society of Civil Engineers. Available online: https://www.jsce-int.org/a_t/achievement/civil/2015 (accessed on 5 August 2024).
  24. Liu, W.-Z.; Sun, K.; Dai, X.-Y.; Ai, G.-P.; Lei, T. Numerical simulation and field monitoring of influence of metro shield tunnel undercrossing the existing railway frame bridge by long distance. J. Railw. Sci. Eng. 2022, 19, 208–218. (In Chinese) [Google Scholar] [CrossRef]
  25. Zheng, G.; Lu, P.; Diao, Y. Advance Speed-Based Parametric Study of Greenfield Deformation Induced by EPBM Tunneling in Soft Ground. Comput. Geotech. 2015, 65, 220–232. [Google Scholar] [CrossRef]
  26. Hu, Y.; Lei, H.; Zheng, G.; Shi, L.; Zhang, T.; Shen, Z.; Jia, R. Ground Movement Induced by Triple Stacked Tunneling with Different Construction Sequences. J. Rock Mech. Geotech. Eng. 2022, 14, 1433–1446. [Google Scholar] [CrossRef]
  27. Cao, Y.; Lin, X.-R.; Li, Z.-L. Refined Numerical Simulation of Shallow Shield Construction in Soft Soil Stratum. Adv. Eng. Sci. 2022, 54, 149–158. (In Chinese) [Google Scholar] [CrossRef]
  28. Liu, Y.-N.; Lei, H.-Y.; Ma, C.-Y.; Guan, B.-H. Three-dimensional stability analysis of shied tunnel face adjacent to existing tunnels. Chin. J. Geotech. Eng. 2023, 45, 1374–1383. (In Chinese) [Google Scholar]
  29. Chen, K.-J. Construction Technology of Subway Engineering; China Railway Publishing House: Beijing, China, 2014. [Google Scholar]
  30. Cui, L.-J. Prediction of Shield Tunneling Parameters Based on Machine Learning Fusion Model. Master’s thesis, Zhejiang University, Hangzhou, China, 2022. (In Chinese). [Google Scholar]
  31. Liu, C.; Zhang, Z.-X.; Regueiro, R.A. Pile and Pile Group Response to Tunnelling Using a Large Diameter Slurry Shield–Case Study in Shanghai. Comput. Geotech. 2014, 59, 21–43. [Google Scholar] [CrossRef]
  32. Li, W. Stability Analysis of Tunnel Face in Soils Based on the Upper Bound Method of Limit Analysis. Ph.D thesis, Beijing Jiaotong University, Beijing, China, 2021. (In Chinese). [Google Scholar]
  33. Fei, K.; Peng, J. Detailed Explanation of ABAQUS Geotechnical Engineering Example; Posts & Telecom Press: Beijing, China, 2017. [Google Scholar]
  34. Cui, P.-B.; Zhu, Y.-Q.; Liu, Y.; Zhu, Z.-G.; Pan, Y.-D. Model test and particle flow numerical simulation of soil arch effect for unsaturated sandy soil tunnel. Rock Soil Mech. 2021, 42, 3451–3466. (In Chinese) [Google Scholar] [CrossRef]
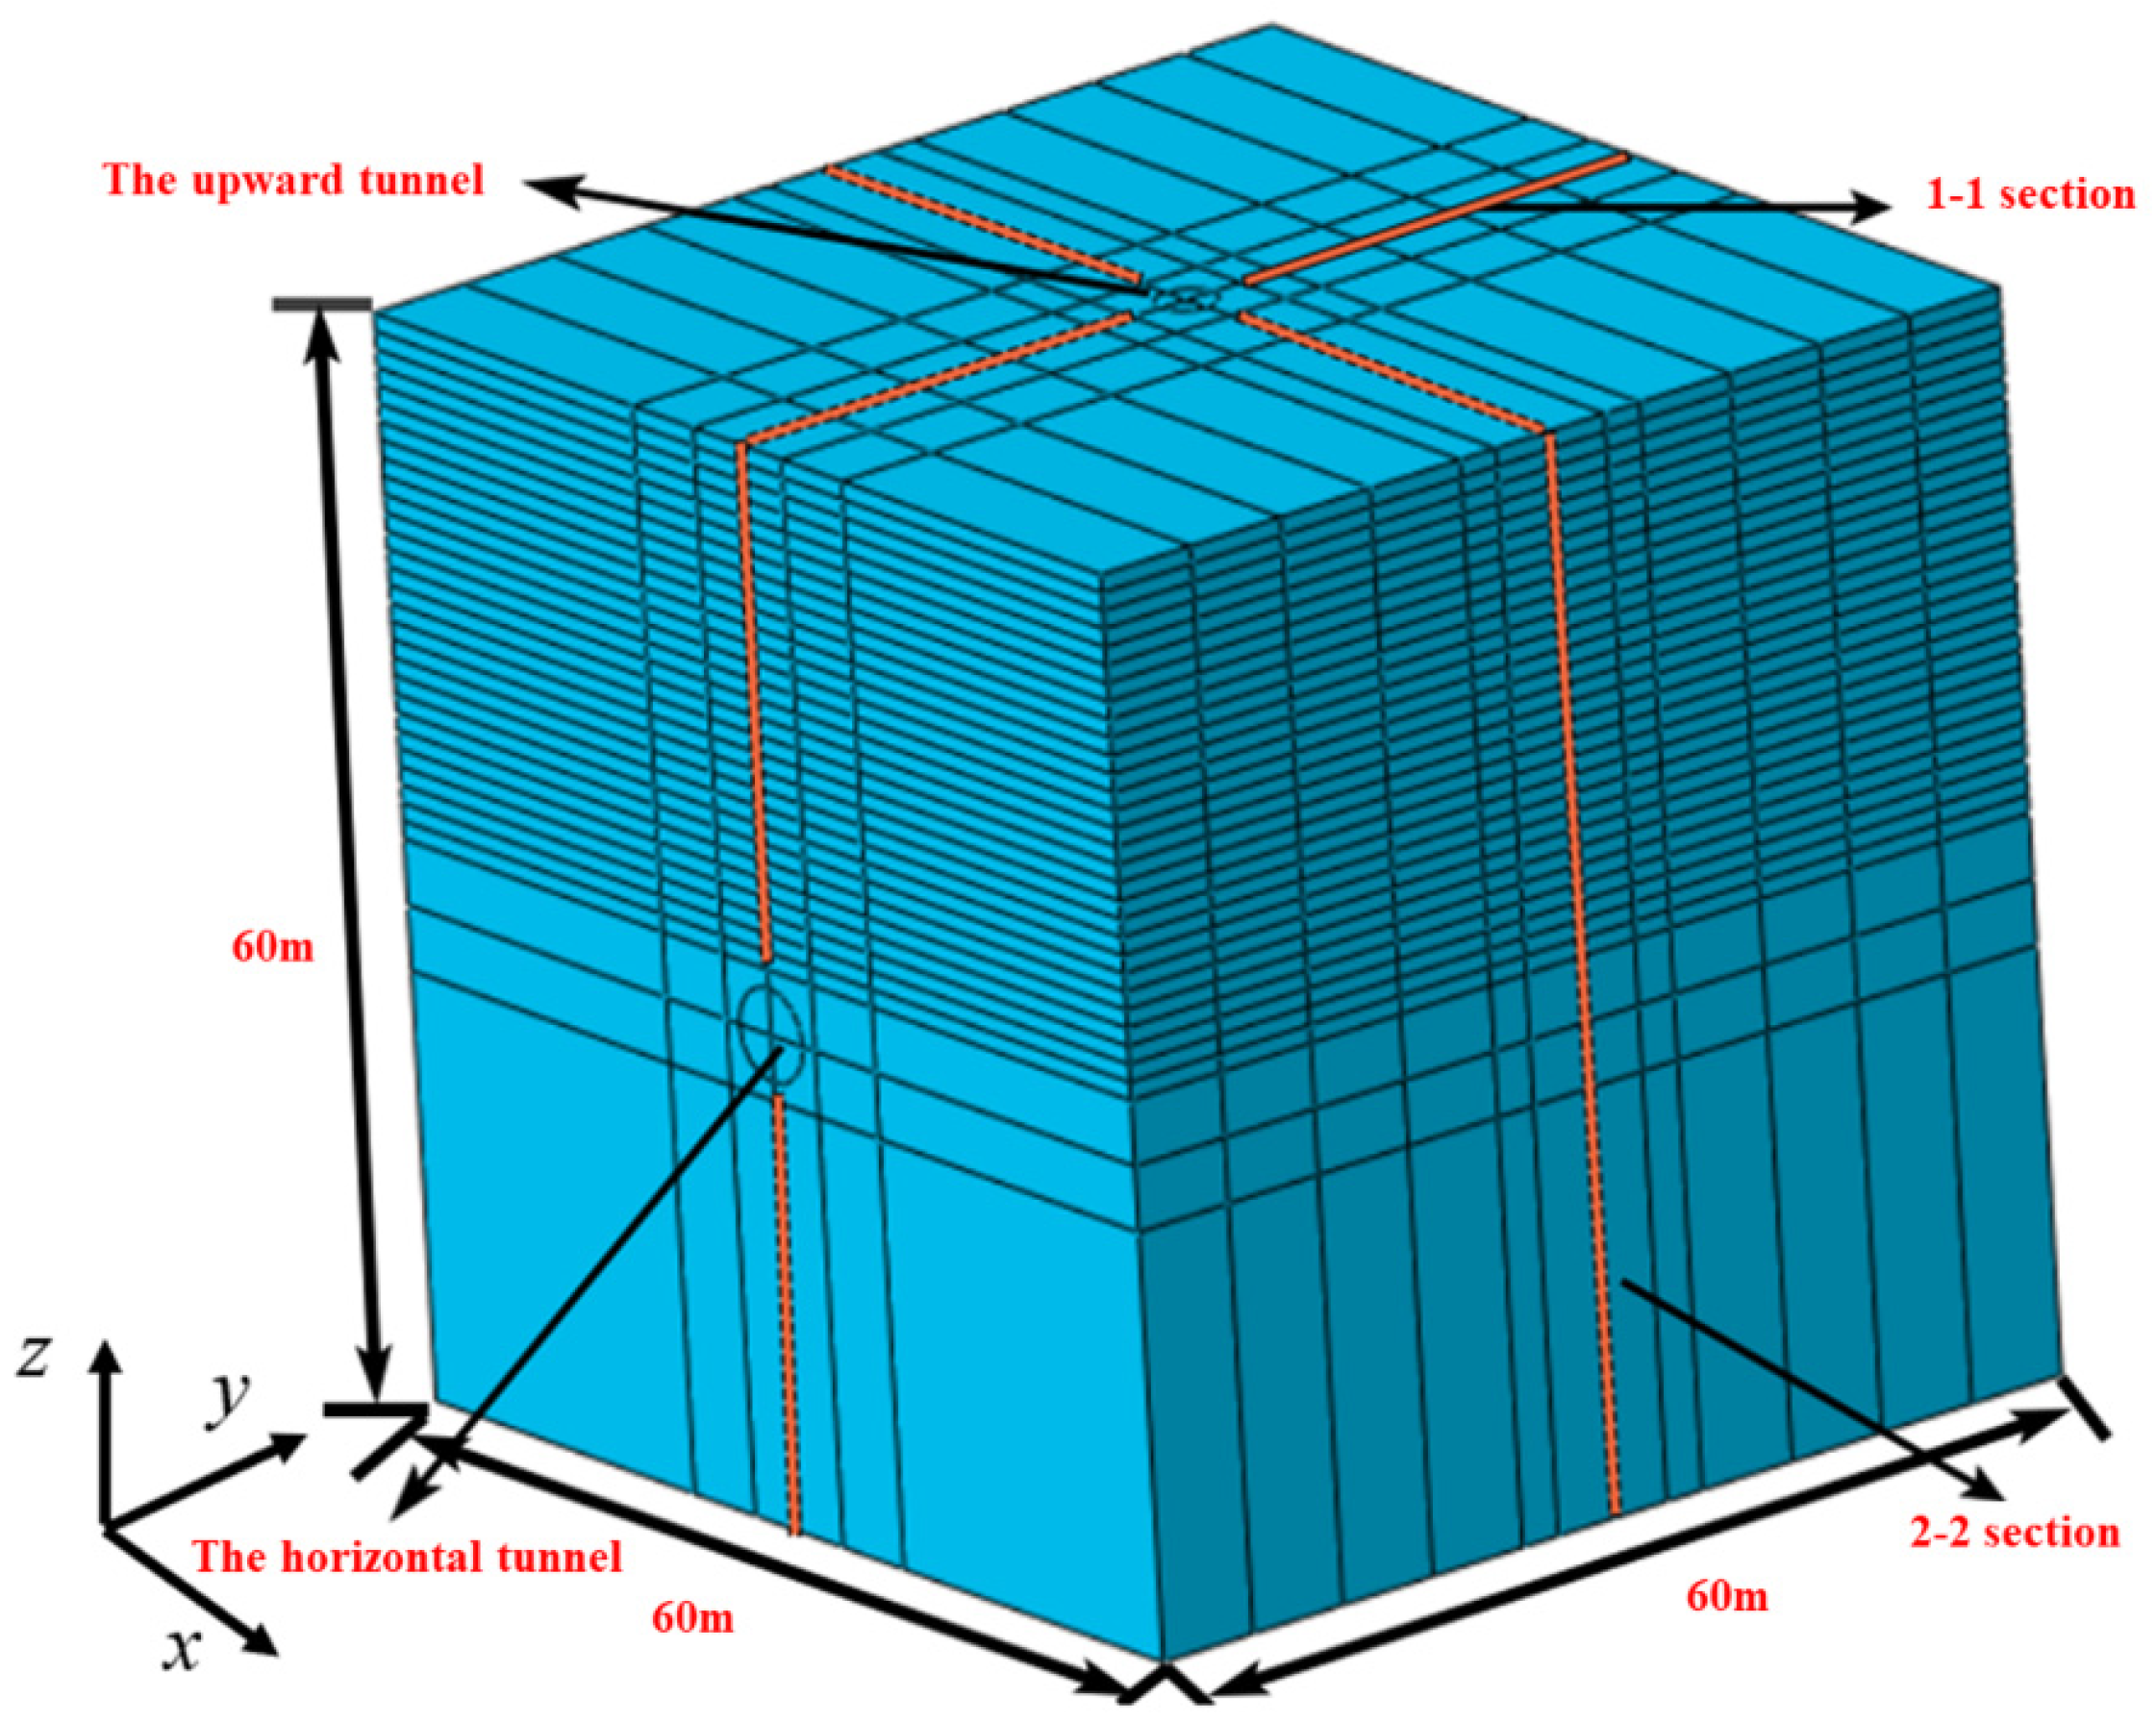
Figure 1. Soil part.
Buildings 15 03371 g001
Figure 2. Segment part and grouting part.
Buildings 15 03371 g002
Figure 3. Shield shell part.
Buildings 15 03371 g003
Figure 4. Construction process of the horizontal shield tunnel.
Buildings 15 03371 g004
Figure 5. Support force distribution of the horizontal excavation face.
Buildings 15 03371 g005
Figure 6. Grouting pressure distribution. (a) Segment grouting pressure. (b) Soil grouting pressure.
Buildings 15 03371 g006
Figure 7. Breaking part of horizontal tunnel segment.
Buildings 15 03371 g007
Figure 8. Construction process of upward shield tunneling.
Buildings 15 03371 g008
Figure 9. Support force distribution of vertical excavation face.
Buildings 15 03371 g009
Figure 10. Failure zone of the excavation face during active instability under different burial depth ratios in the numerical model. (a) C/D = 1. (b) C/D = 1.5. (c) C/D = 2. (d) C/D = 3. (e) C/D = 4.
Buildings 15 03371 g010
Figure 11. Displacement–support pressure ratio curve under active instability of excavation face.
Buildings 15 03371 g011
Figure 12. The minimum support pressure ratio of the excavation face under different buried depth ratios.
Buildings 15 03371 g012
Figure 13. Model test device.
Buildings 15 03371 g013
Figure 14. Comparison of the minimum support pressure ratio between numerical simulation and model test.
Buildings 15 03371 g014
Figure 15. Active instability soil failure zone of the excavation face under different buried depth ratios of the model test. (a) C/D = 1. (b) C/D = 1.5. (c) C/D = 2. (d) C/D = 3. (e) C/D = 4.
Buildings 15 03371 g015aBuildings 15 03371 g015b
Figure 16. The variation law of surface displacement under the active instability state of upward shield tunneling excavation face.
Buildings 15 03371 g016
Figure 17. Surface settlement troughs under active instability of the excavation face with different buried depth ratios.
Buildings 15 03371 g017
Figure 18. Vertical stress change at the top of horizontal tunnel segments under active instability state.
Buildings 15 03371 g018
Figure 19. Displacement change in horizontal tunnel segment under active instability state.
Buildings 15 03371 g019
Figure 20. Horizontal soil displacement under active instability with different buried depth ratios. (a) C/D = 1. (b) C/D = 1.5. (c) C/D = 2. (d) C/D = 3. (e) C/D = 4.
Buildings 15 03371 g020
Figure 21. The vertical and horizontal earth pressure changes after active instability with different buried depth ratios. (a) C/D = 1, vertical. (b) C/D = 1, horizontal. (c) C/D = 1.5, vertical. (d) C/D = 1.5, horizontal. (e) C/D = 2, vertical earth pressure. (f) C/D = 2, horizontal earth pressure. (g) C/D = 3, vertical earth pressure. (h) C/D = 3, horizontal earth pressure. (i) C/D = 4, vertical earth pressure. (j) C/D = 4, horizontal earth pressure.
Buildings 15 03371 g021aBuildings 15 03371 g021b
Table 1. Linear elastic material property.
Linear Elastic MaterialElastic ModulusPoisson Ratio
Segment25.88 GPa0.17
Grouting material before hardening0.9 MPa0.25
Grouting material after hardening400 MPa0.25
Shield shell206 GPa0.3
Table 2. Elastic–plastic material property.
Elastic–Plastic MaterialElastic ModulusPoisson RatioThe Angle of Internal FrictionCohesionDensity
Soil14.5 MPa0.3230°0 kPa1500 kg/m3
Disclaimer/Publisher’s Note: The statements, opinions and data contained in all publications are solely those of the individual author(s) and contributor(s) and not of MDPI and/or the editor(s). MDPI and/or the editor(s) disclaim responsibility for any injury to people or property resulting from any ideas, methods, instructions or products referred to in the content.