1. Introduction
Tunnels constitute an integral component of modern transportation networks, playing a pivotal role in urban development and regional connectivity [
1]. Consequently, there is a high demand for the stability and durability of tunnel structures [
2]. During tunnel construction, the secondary lining serves as the internal protective layer of the tunnel structure, with its compactness being a critical factor in ensuring the long-term stable operation of the tunnel [
3]. However, due to the complexity of the construction environment and the limitations of construction techniques [
4], voids in the secondary lining frequently occur [
5,
6]. These not only affect the overall performance of the structure but can also lead to diseases such as cracking and leakage of the lining [
7]. In severe cases, they may even result in the structural failure of the tunnel.
Despite the critical importance of the compactness of secondary lining in tunnel engineering, monitoring and prevention of void phenomena still face numerous challenges. Traditional monitoring methods often rely on post hoc detection, lacking real-time capabilities to identify and address void issues during construction [
4]. Moreover, existing monitoring technologies still have limitations in terms of accuracy and reliability, making it difficult to comprehensively assess the compaction status within the lining [
7]. More importantly, the formation mechanism of voids is not yet fully understood, and the lack of systematic theoretical support restricts the optimization of monitoring schemes and the improvement of construction techniques [
3,
8]. Therefore, how to monitor the compaction of secondary lining in real-time, accurately identify void areas, and propose effective prevention and control measures based on the void formation mechanism has become a key technical issue that needs to be resolved in the field of tunnel engineering [
9].
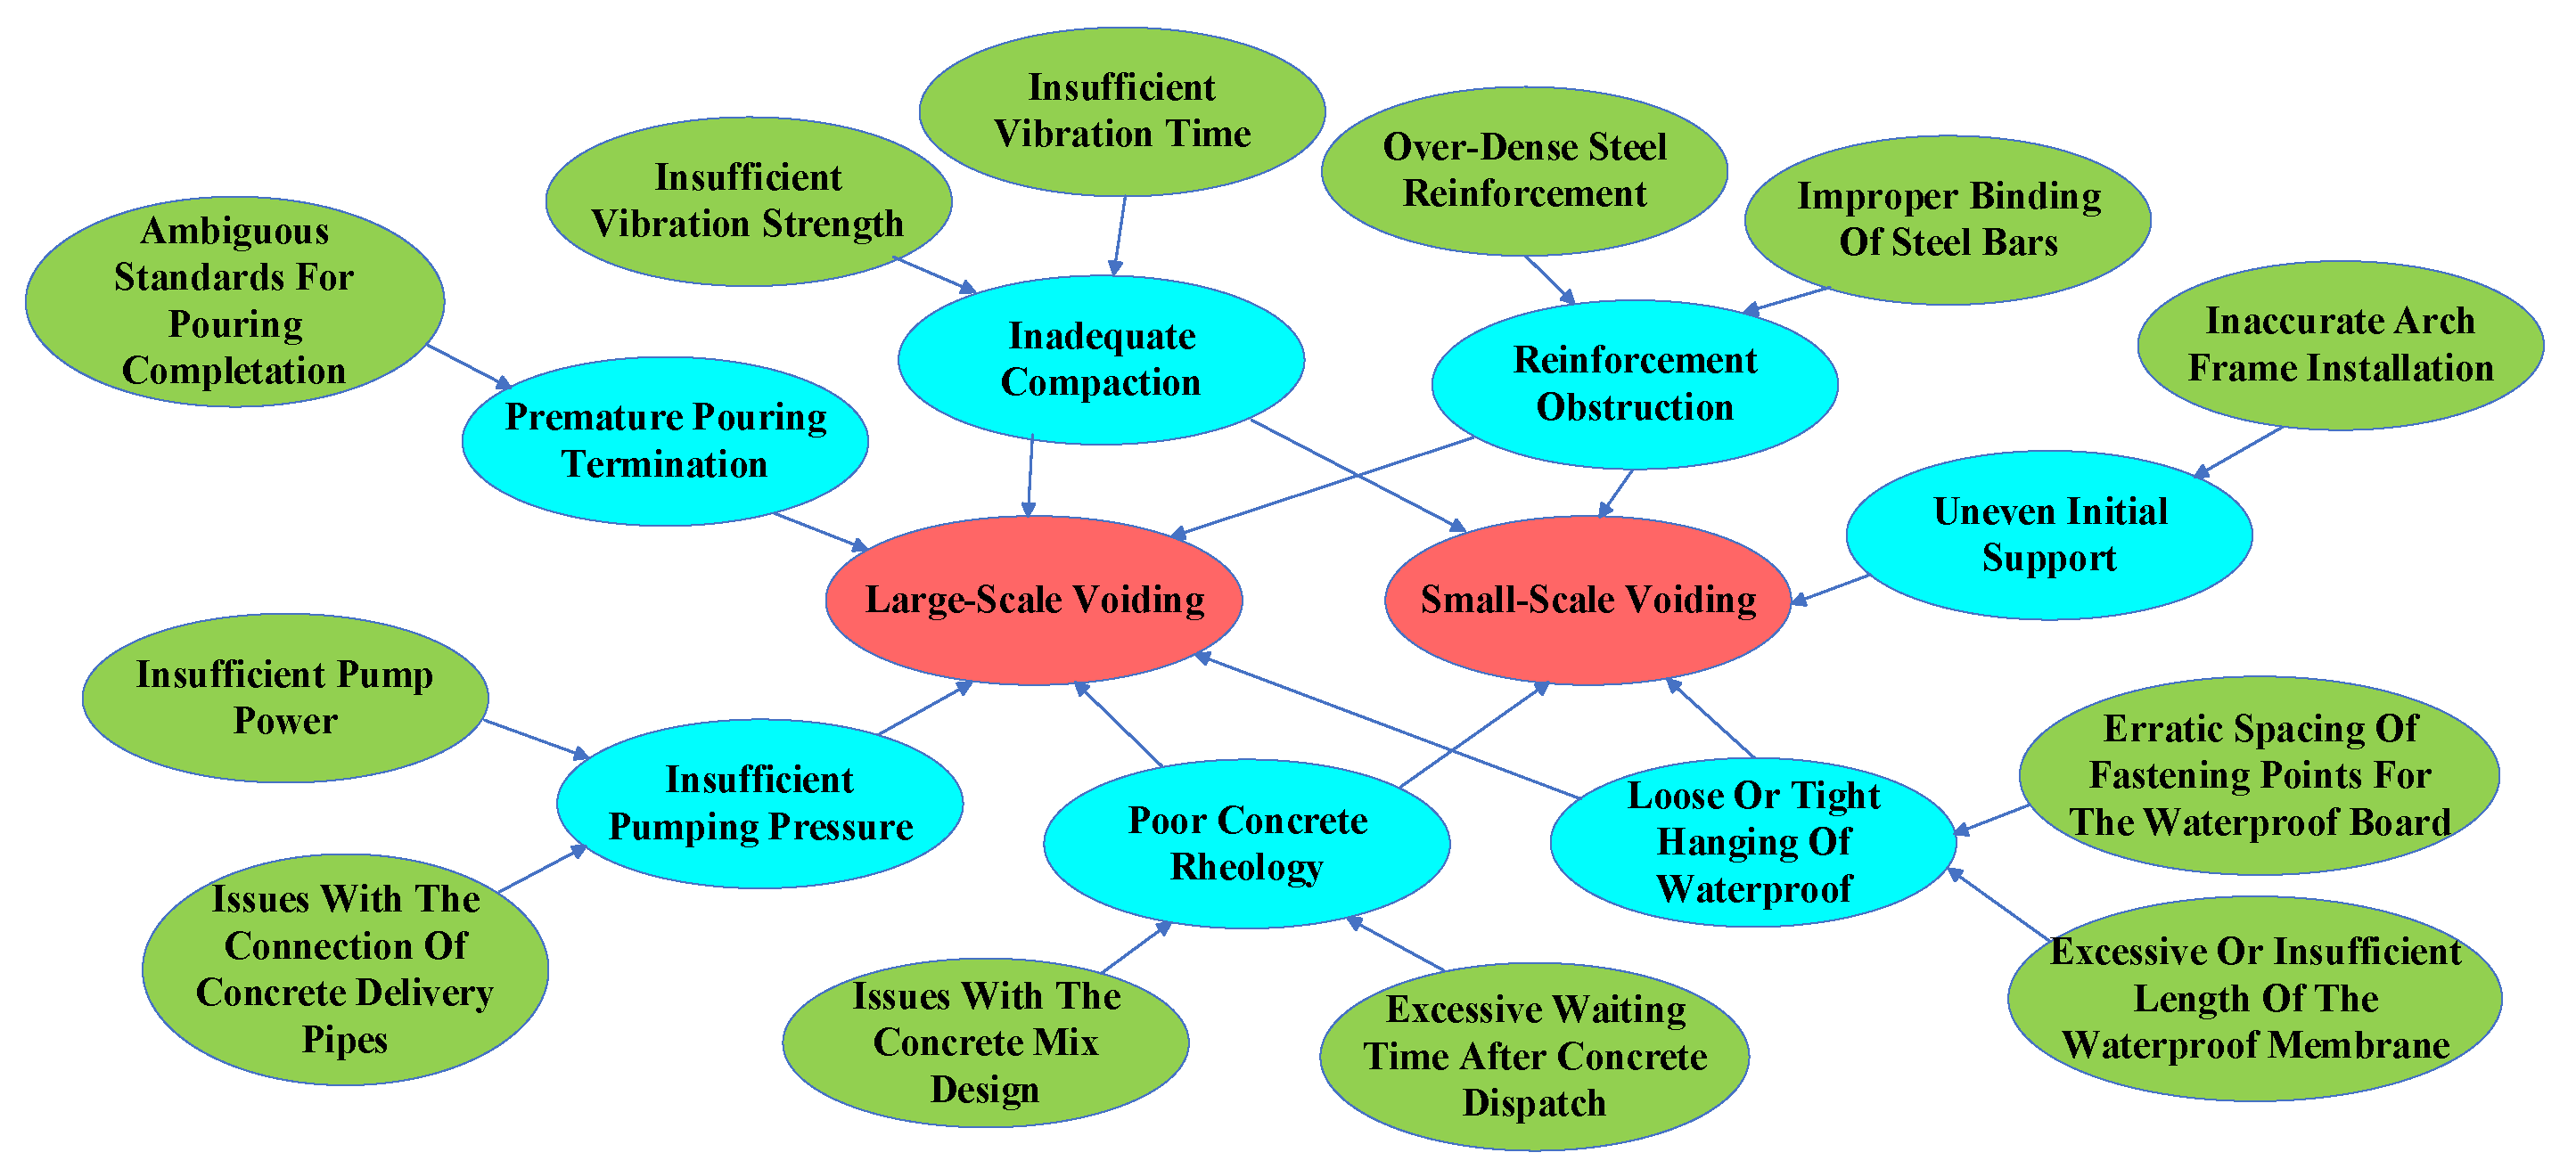
During tunnel construction, the formation of voids behind the lining is a result of multiple interacting factors. As shown in
Figure 1, these factors can be categorized into material selection, construction environment, personnel operation, construction techniques, and equipment. Specifically, different concrete mixtures may flow downhill due to gravity during placement, failing to fully fill the mold [
10]. Additionally, concrete shrinkage after pouring can further increase void formation [
11]. Insufficient training and unfamiliarity with construction techniques among personnel can lead to inadequate compaction and improper determination of the completion of pouring [
12,
13,
14]. From the construction technical perspective, improper spacing and length of waterproof board fixing points [
15], as well as over-excavation [
16], can result in voids behind the lining. Furthermore, inaccuracies in arch frame installation, insufficient pump pressure, or untimely maintenance, and insecure connections of delivery pipes can also cause void formation. Environmental factors such as geological hazards, hydrogeological conditions, topography, working environment, and climate also contribute to the void formation [
12]. These factors, either individually or in combination, can lead to extensive, concentrated voids primarily located at the arch apex, and smaller, dispersed voids mainly found at the arch waist.
At present, Ground Penetrating Radar (GPR) technology is a commonly used method for detecting voids in tunnel linings. It operates by emitting high-frequency electromagnetic pulses and receiving reflected signals, enabling non-destructive testing of the internal condition of the lining. The advantage of GPR technology lies in its high resolution and real-time monitoring capabilities, but it requires a high level of technical proficiency from operators and may be limited in certain geological conditions [
17]. Liu et al. [
18] proposed a multi-task deep neural network capable of simultaneously identifying void shape, depth, and lining thickness (in millimeters). This approach, combined with curve fitting post-processing, effectively reduces false alarm rates. Their model demonstrated superior performance compared to traditional GPR methods, particularly in challenging scenarios characterized by low electromagnetic (EM) contrast, such as the interface between primary and secondary linings. To address environmental noise and electromagnetic interference in raw GPR data, Zhang et al. [
19] designed FilterNet, a model based on a CNN-RNN architecture. FilterNet enhances void recognition accuracy by employing joint time-frequency domain filtering.
In addition to GPR, the microtremor method assesses the dynamic characteristics of underground structures by analyzing surface microtremor signals for the detection of tunnel lining voids [
20]. Conductive sensing technology is another novel approach for void detection in secondary linings. Luo et al. [
21] implemented an embedded system based on Raspberry Pi, incorporating pre-embedded conductive lines within the secondary lining. This system enables real-time localization of voids (in meters) by detecting abrupt changes in electrical conductivity, with data synchronized to the cloud for continuous monitoring during construction. Three-dimensional laser scanning technology uses laser scanning for high-precision three-dimensional spatial scanning, directly reflecting the unevenness of the lining surface and the distribution of voids [
22]. Ye et al. [
8] further confirmed the negative impact of void phenomena on the performance of tunnel structures by applying transient electromagnetic radar in the quality assessment of composite tunnel linings. The impact-echo method determines the existence of internal voids by tapping the structural surface and listening to the reflected sound waves [
23]. Tang et al. [
24] developed a finite element model to simulate the non-linear propagation patterns of sound waves under three distinct conditions: intact lining, air-filled voids, and water-filled voids, thereby establishing an acoustic response database. The primary advantages of this technique are its non-contact nature, suitability for high-temperature environments, and the elimination of requirements for pre-embedded components or consumables. Furthermore, time-energy density analysis based on wavelet transform identifies voids by analyzing the time-energy distribution characteristics of structural responses [
25]. Infrared thermography uses infrared cameras to capture thermal images of the structural surface, identifying temperature distribution unevenness caused by voids [
26]. A method combining impact elastic wave technology with machine learning algorithms enhances the accuracy and efficiency of void detection through machine learning [
27]. The acoustic spectrum analysis method identifies voids by analyzing the spectral characteristics of structural responses [
28]. The Transient Electromagnetic Radar (TER) method identifies voids by detecting the propagation characteristics of electromagnetic waves within the structure [
29]. However, the current detection methods can only be performed after the lining has been stripped of its formwork; at this point, the lining has developed strength and is carrying loads. Subsequent remedial measures are difficult to implement to alter defects that have already formed. Therefore, it is preferable to prevent the occurrence of voids during the lining pouring process.
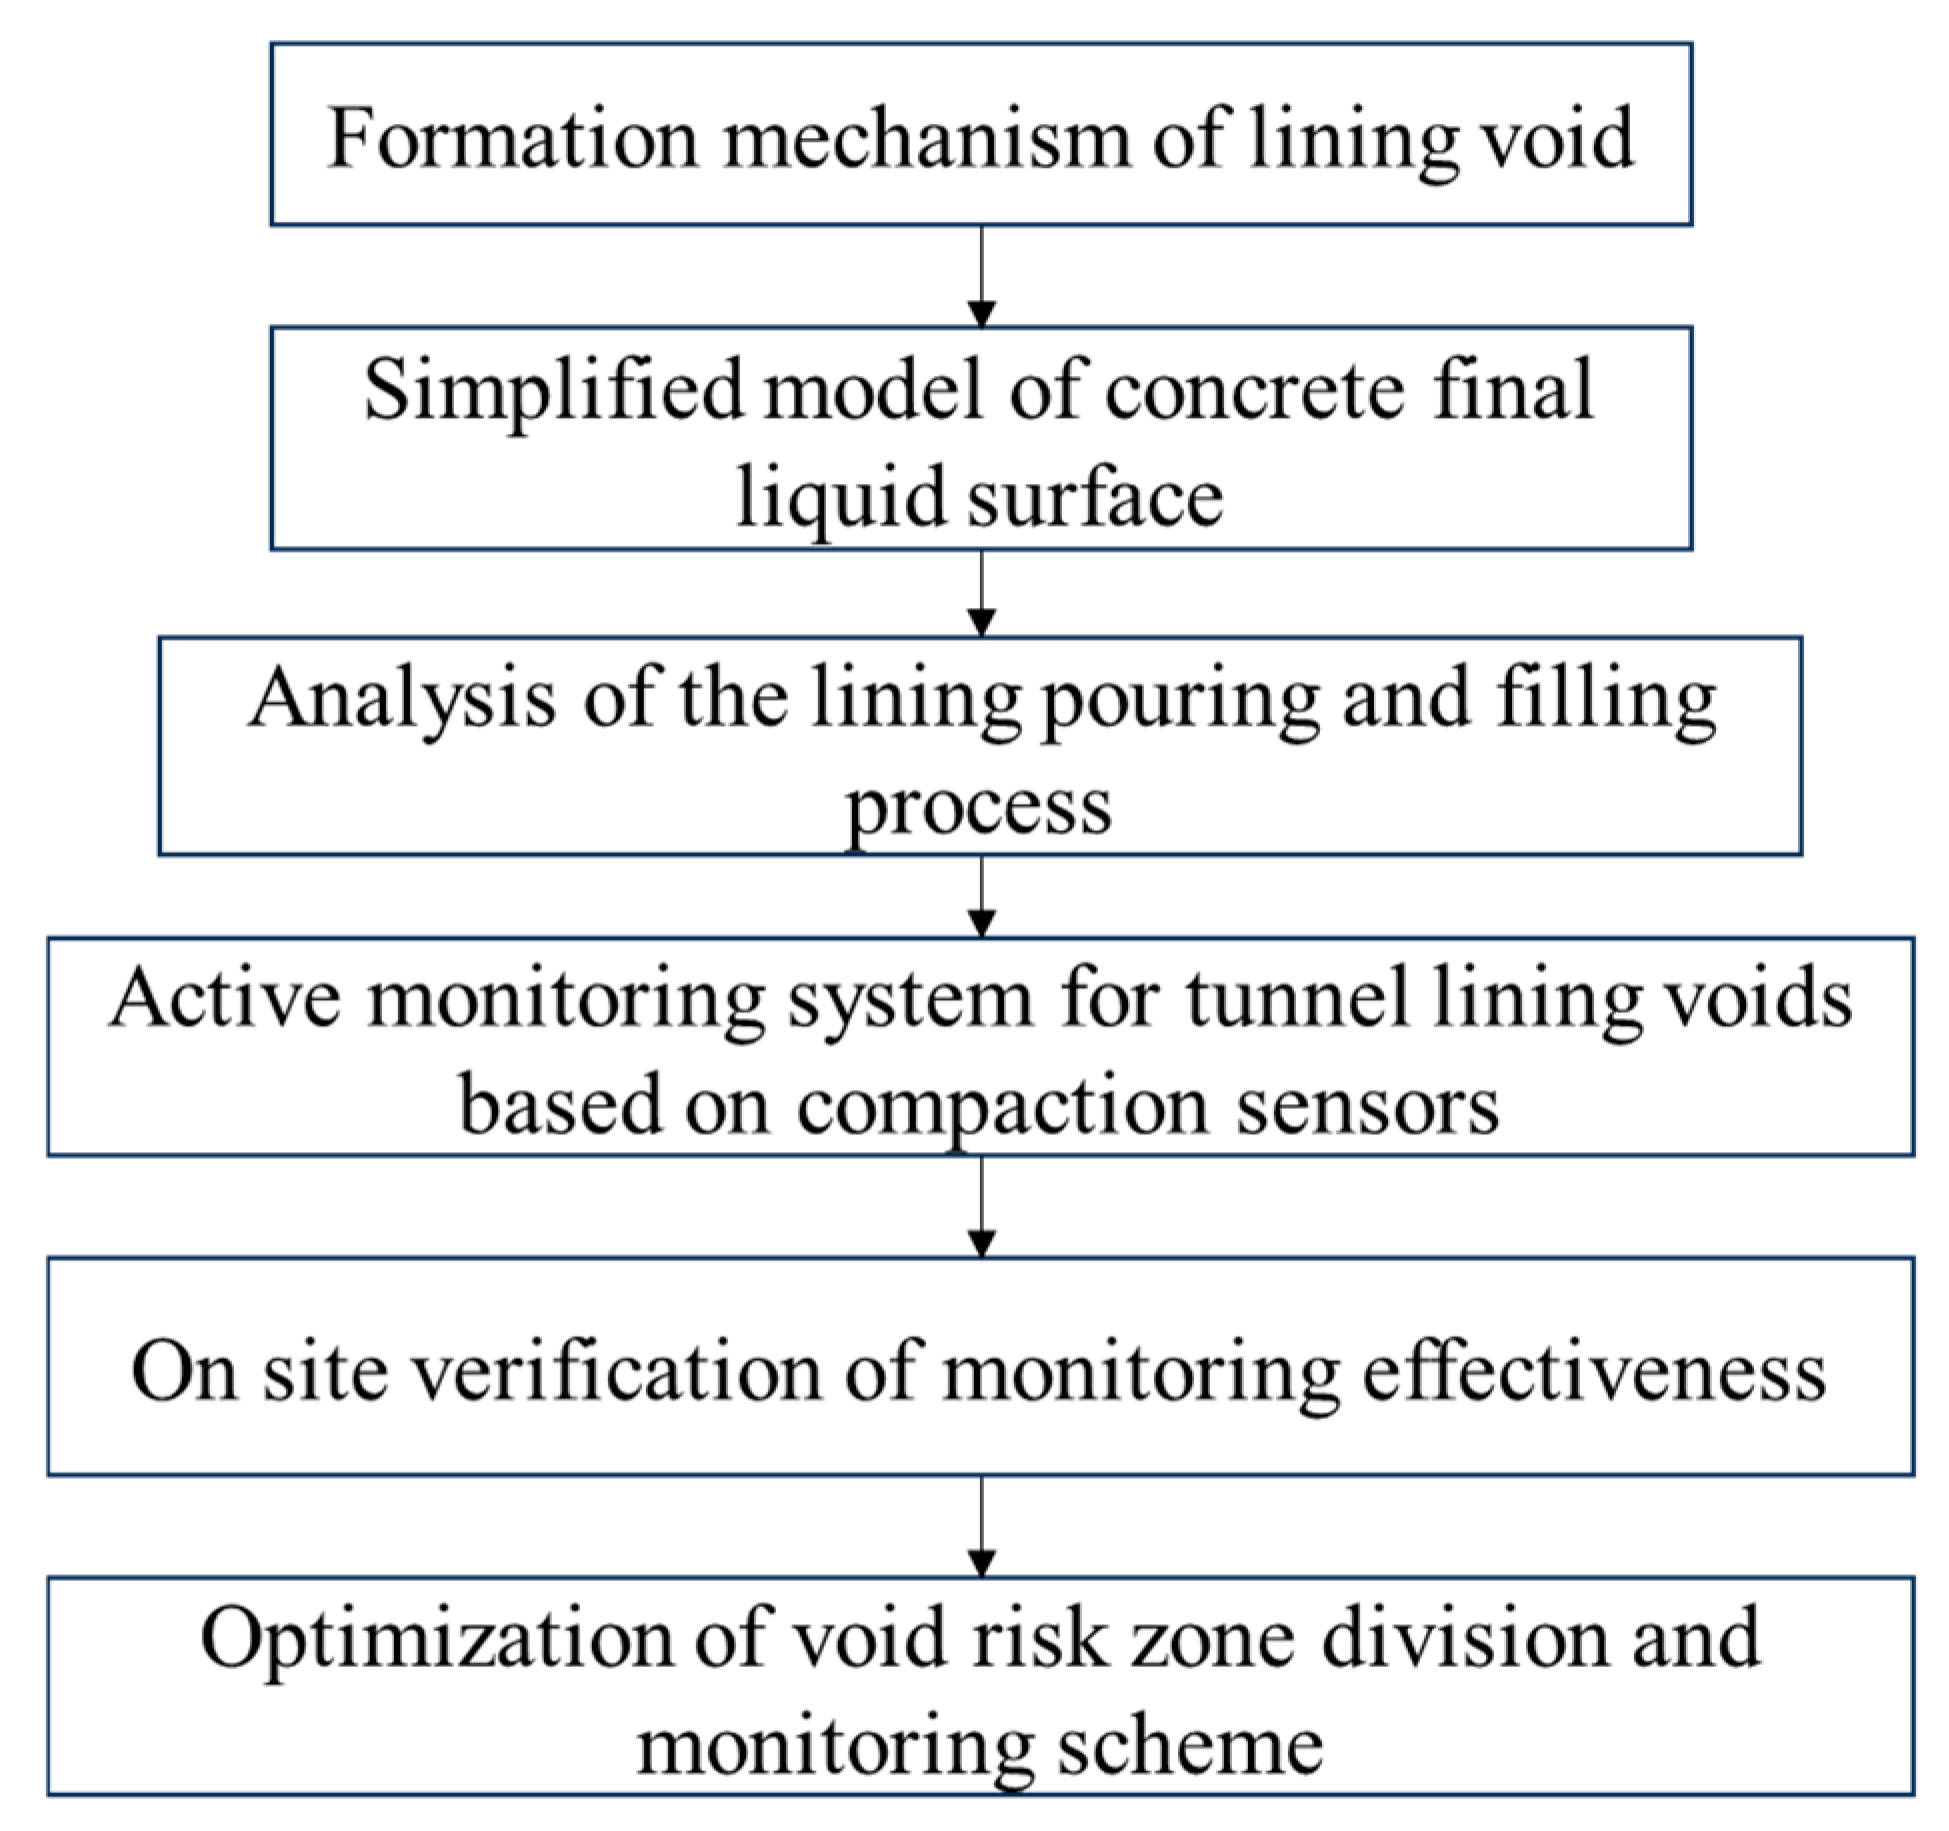
This study commences with an in-depth analysis of the formation mechanisms underlying the voids in the secondary lining of tunnels, predicated on the rheological properties of fresh concrete. Subsequently, a model depicting the final state of the concrete surface profile in the flow and accumulation process is formulated. This model accounts for the critical shear stress of freshly mixed concrete and the influence of rebar obstructions on the surface profile. Secondly, by analyzing the pouring process within the vault of the tunnel, the locations that are more susceptible to void formation are identified, and void risk zones are delineated. Subsequently, a novel real-time monitoring device is developed, which is capable of accurately and promptly monitoring the compaction status of the secondary lining and identifying potential void issues. Furthermore, based on the study of void risk areas, the monitoring scheme is optimized to enhance the precision and efficiency of the monitoring process. Finally, the effectiveness and practicality of the developed monitoring device are verified through ground penetrating radar (GPR) detection results. The technical roadmap of this article is shown in
Figure 2.
2. Computational Method for the Final State of the Concrete Flow Surface
Fresh concrete, as a cement-based material, exhibits non-Newtonian fluid characteristics. Currently, the primary models used to describe the rheological properties of concrete include the Bingham model [
30,
31,
32], the Herschel–Bulkley model [
33,
34,
35], the Casson model [
36,
37,
38], and the cell model [
39], and several other models. Extensive research has been conducted by numerous scholars on the applicability of these models to fresh concrete. Among these, the Herschel–Bulkley model is the most widely used in practical applications. The Bingham model assumes that concrete behaves as a solid below yield stress and flows as a viscous fluid above this stress. The Herschel–Bulkley model, an extension of the Bingham model, more accurately describes the non-linear flow characteristics of fresh concrete. The Casson model, initially developed for describing blood rheology, has also been explored in concrete research. Despite the advantages and disadvantages of each model, the Herschel–Bulkley model has become the mainstream choice in engineering due to its superior capability in handling complex flow behaviors. The rheological expression of Herschel–Bulkley model [
40] is given by
where
τ represents the shear stress,
τy is the yield stress,
K is the consistency index,
γ is the shear rate, and
n is the flow behavior index.
Concrete fluid exhibits shear thickening or shear thinning characteristics depending on its internal particle composition. During the shear flow of fresh concrete, the networked flocculated structure is gradually destroyed, leading to a decrease in apparent viscosity and resulting in shear thinning, characterized by n < 1. However, when the volume fraction of solid particles in fresh concrete is very high, collisions and friction between particles may lead to shear thickening, characterized by n > 1. As concrete transitions from a flowing state to a critical static final state, the shear rate γ becomes 0, and the critical shear stress at the concrete base is τ0.
Figure 3 depicts a simplified model of the final static surface of concrete after being pumped from the outlet ABCD into the upper space. The final surface assumes a piled shape, spreading radially in a circular pattern. Using the center of the outlet’s bottom surface as the origin, a coordinate system is established with the concrete surface height as the H-axis and the radial flow direction as the R-axis. The highest point of the surface is located at the pump outlet, defined as the initial height h
0. The height gradually decreases radially outward, reaching its furthest extent at PQ, where O’PQ represents the liquid surface. Force equilibrium analysis is performed on the infinitesimal element EE’FF’-MM’NN’. In static state, the combined force of the gravity from the downstream liquid acting on face MM’N’N and the shear force acting on face EFNM should balance the gravitational force from the upstream liquid acting on face EE’F’F. The equilibrium equation is as follows:
By expanding Equation (2), we obtain
where
ρ is the density of the concrete,
g is the gravitational acceleration (taken as 9.81 m/s
2),
h is the liquid surface height,
r is the flow radius, and
θ is the spread angle, and
τ0 is critical shear stress of concrete.
Neglecting the higher-order differential terms that have a minor impact on the results, the above equation simplifies to
Solving this equation yields
where
C is a constant, and the height of the concrete within the central cylindrical region AA’BB’ is
h0, with the cylindrical radius being
r0. By substituting the initial boundary conditions into Equation (5), the constant
C can be determined:
As illustrated in
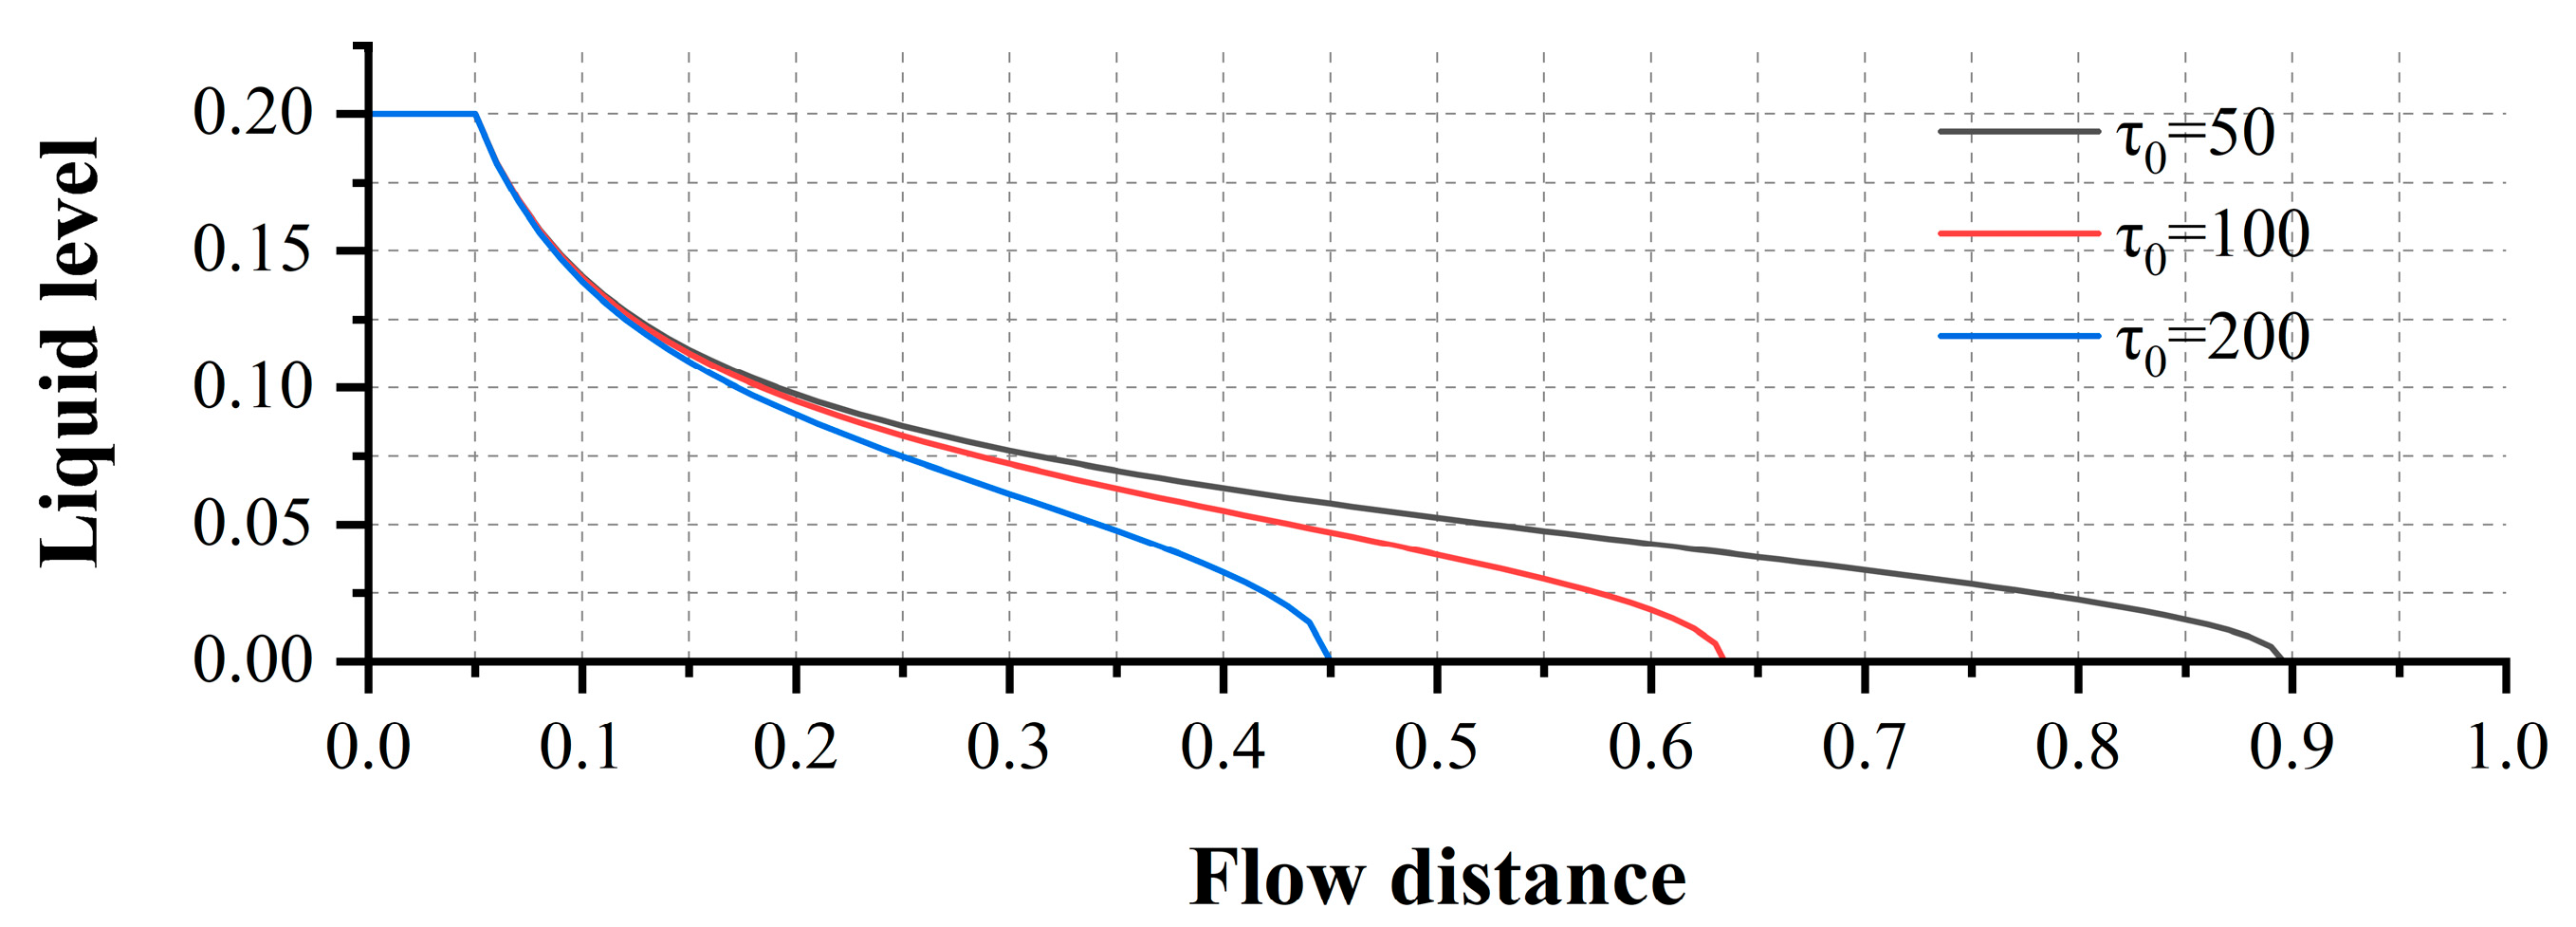
Figure 4, to verify the accuracy of the aforementioned conclusion, three conditions of yield stress,
τ0 = 50 Pa,
τ0 = 100 Pa, and
τ0 = 200 Pa, were selected. The final static liquid surface curve of the concrete was calculated for each condition with an initial liquid surface height of 0.2 m and an initial liquid column radius of 0.05 m. It can be observed from the figure that the yield stress has a significant impact on the final static liquid surface curve of the concrete. When the yield stress is 50 Pa, the flow distance of the concrete is 0.896 m. However, as the yield stress increases to 100 Pa and 200 Pa, the flow distance of the concrete correspondingly decreases to 0.634 m and 0.450 m, respectively. Additionally, the slope of the liquid surface becomes steeper, which may lead to difficulties in completely filling the formwork.
4. Active Monitoring System for Tunnel Lining Voids Based on Compaction Sensors
4.1. System Composition
The monitoring system based on the monitoring belt consists of a monitoring belt, a connection line, a direct display terminal and monitoring software.
(1) Monitoring belt and its principles
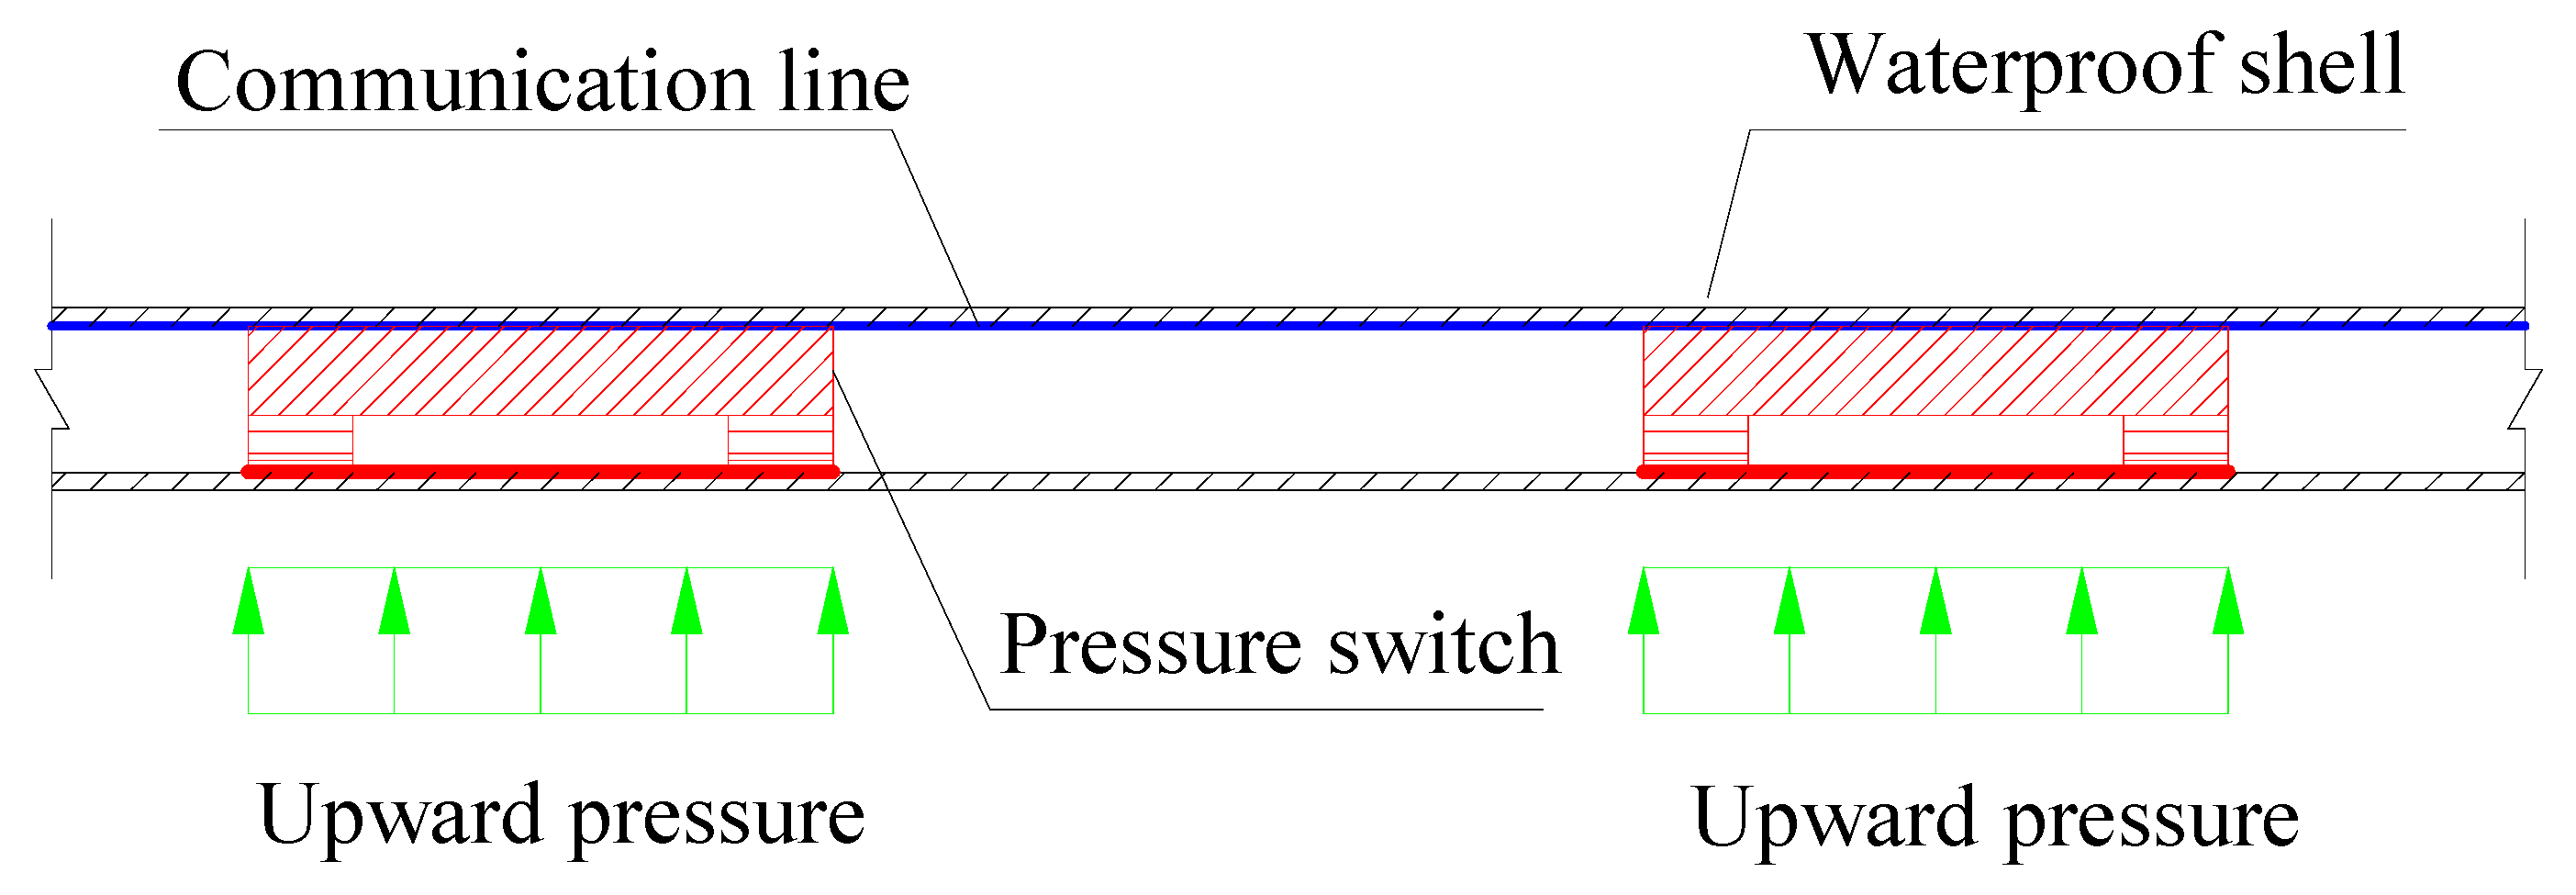
The monitoring belt is the core component of the system, which consists of a waterproof shell, pressure switches, a communication line and a communication port. The longitudinal profile of the belt is shown in
Figure 9. The monitoring belt is 12 m long and 5 cm wide, with its surface covered by an insulating PE material film. Internally, 15 pressure switches are set up, each connected by 15 separate wires. The distance between the two pressure switches is 80 cm. The length of the belt and the number of pressure sensors also can be customized according to the need. When pressure causes closure, an electrical signal is generated from the pressure switch and transmitted via the wire to the direct-display terminal. The direct display terminal receives the signal through an RS485 serial communication interface and processes it with its built-in chip, then transmits the monitoring results to the cloud via the built-in WIFI chip. The cloud server receives the data and stores it and displays it on the web terminal interface.
When the upward pressure is less than 3 kPa, The pressure switch in the belt is in the disengaged state, and the indicator lights of the direct display terminal showed red. When the upward pressure is more than 3 kPa, The pressure switch is on and the indicator lights showed green.
(2) Direct display terminal
The direct display terminal is connected with the monitoring belt through the connection line, mainly to display the state of the pressure switch. There are 15 pairs of indicator lights on the display panel of the terminal. A corresponding distance, which is from the construction joint to the pressure switch, is noted near the lights. The connection of the monitoring belt and display terminal is shown in
Figure 10.
The engineers and technicians can judge the casting state of the lining by checking the direct display terminal in the tunnel. At the same time, the wireless communication module in the direct display terminal makes access to the network in the tunnel, and the manager could monitor the casting process and status of the lining through monitoring software in the office.
(3) Monitoring software
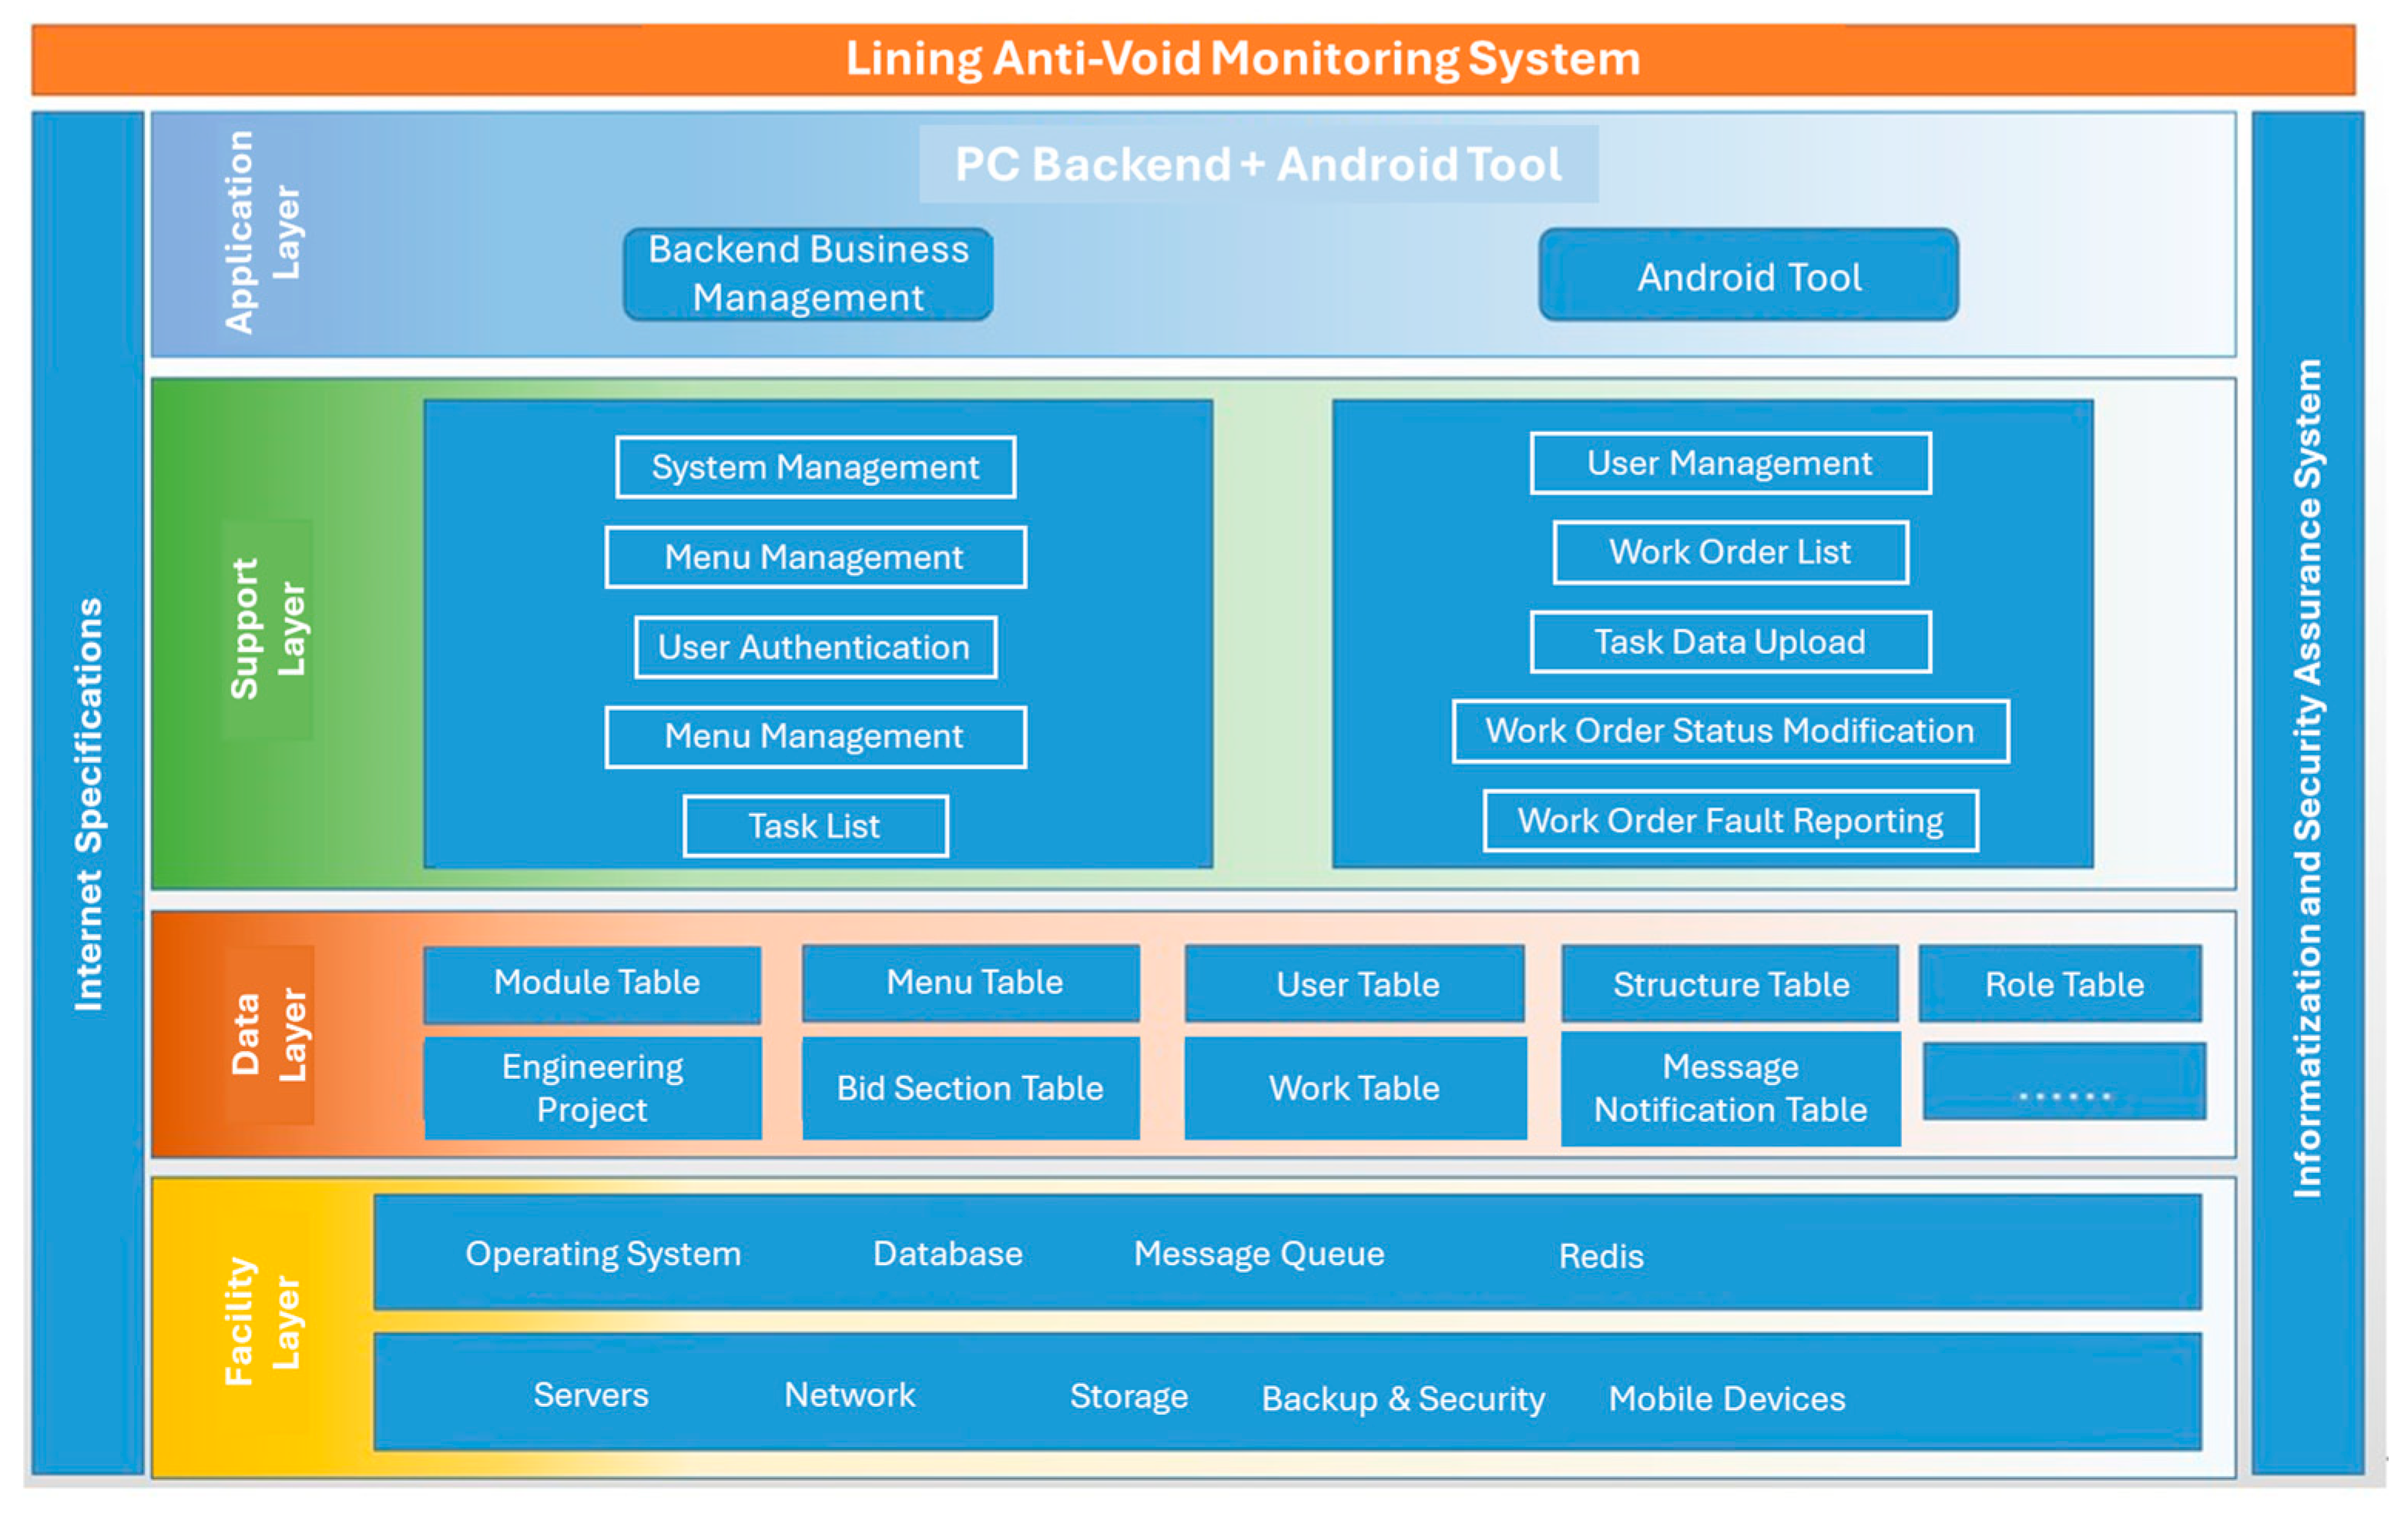
The software system connects with the terminal wirelessly. It has the functions of data storage, report generation, and process approval. It can realize real-time monitoring, viewing historical data. Each concrete lining pour constitutes a monitoring task. Once pouring begins, data is collected, stored, and reported once per minute. This data is stored in a cloud platform database. Real-time computation analyzes the continuity, left-right symmetry, and front-back balance of the lining pour, as well as the compaction status at the tunnel vault. Results are displayed on the user monitoring interface, with alerts generated for abnormal conditions. The software architecture is shown in
Figure 11.
4.2. Installation Method
The installation of the monitoring belt is completed by the waterproof layer laying team. The weight of a 12 m long belt is about 0.4 kg, which can be easily bonded to the surface of geotextiles with adhesive. At the same time, a fixed position for shooting nails is also set to prevent the monitoring belt separated from geotextiles, as shown in
Figure 12. Installation of a piece of a monitoring belt can be completed in 5 min which barely increases in workload and time. The side with the transmission interface of the monitoring belt is set outside of the edge template of the framework of the secondary lining. The direct display terminal on the ground connects with the belt through the connection line which facilitates the operator to check. The belt can be laid between the geotextile and waterproof board as well as the surface of the waterproof board. It is strongly advised to lay the belt between geotextile and waterproof board because voids of type I could easily form and be hard to treat.
The operation process of the vault void monitoring system is as follows. Firstly, the installation of the belt shall be carried out after the geotextile has been laid. It should be noted that there will be false activation from reinforcement bars. A slight adjustment of the reinforcement bars position should be made to ensure that all pressure switches keep disengaged. In the process of casting, the direct display terminal should be inspected at all times. At the end of the concrete pouring, taking increasing pumping pressure and other measures to make as many lights as possible turn green.
4.3. Validation Experiments for the Monitoring System
To verify the accuracy of voiding risk zones, a certain tunnel adopts an active monitoring system based on pressure-sensitive sensors to monitor the compaction behind the entire formwork lining. The tunnel employs a separated twin-tunnel structure and utilizes a composite lining system based on the principles of the New Austrian Tunneling Method (NATM). The left tunnel extends from ZK1+700 to ZK2+565, with a length of 865 m, while the right tunnel runs from YK1+720 to YK2+580, spanning 860 m. The combined length of both tunnels totals 1725 m. The geological conditions along the alignment consist of 143 m of Class V surrounding rock, 572 m of Class IV surrounding rock, and 1010 m of Class III surrounding rock. A 24 m-long bamboo-cut-type portal is designed at the tunnel entrance. The maximum overburden depth of the tunnel is approximately 106 m. Both the entrance and exit portals are situated on straight alignments, and the longitudinal grade for both the left and right tunnels is 2.90%.
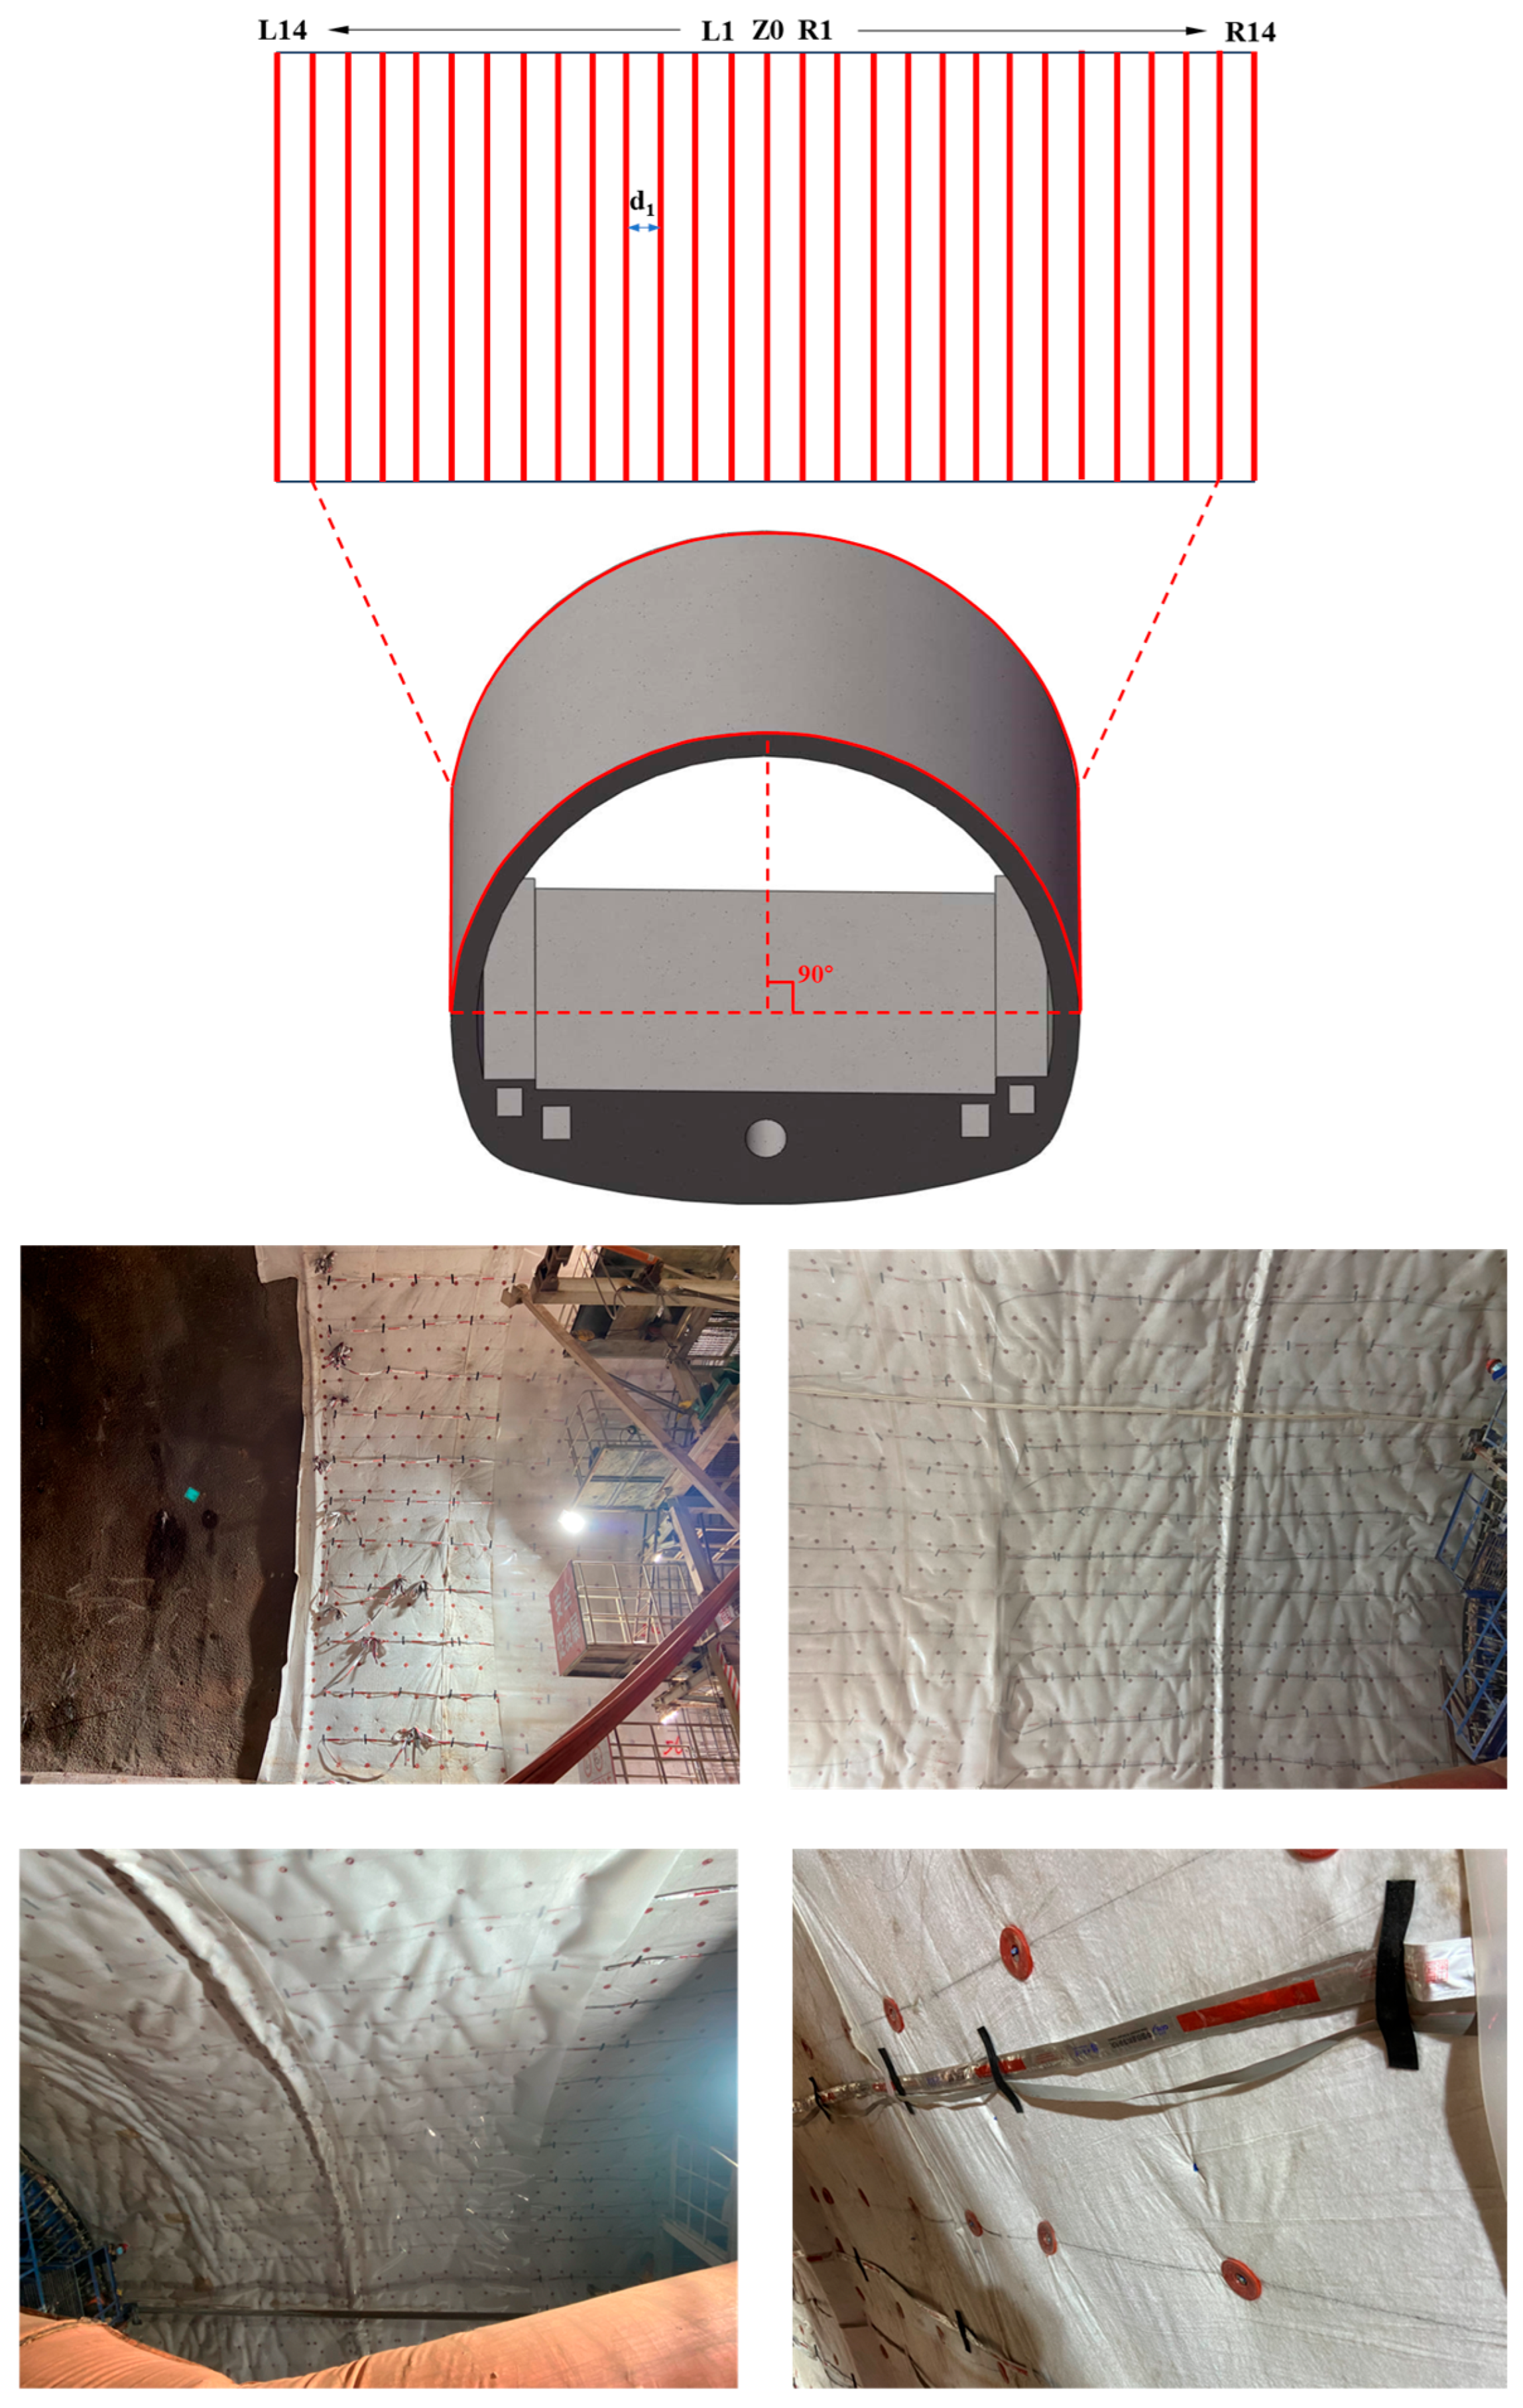
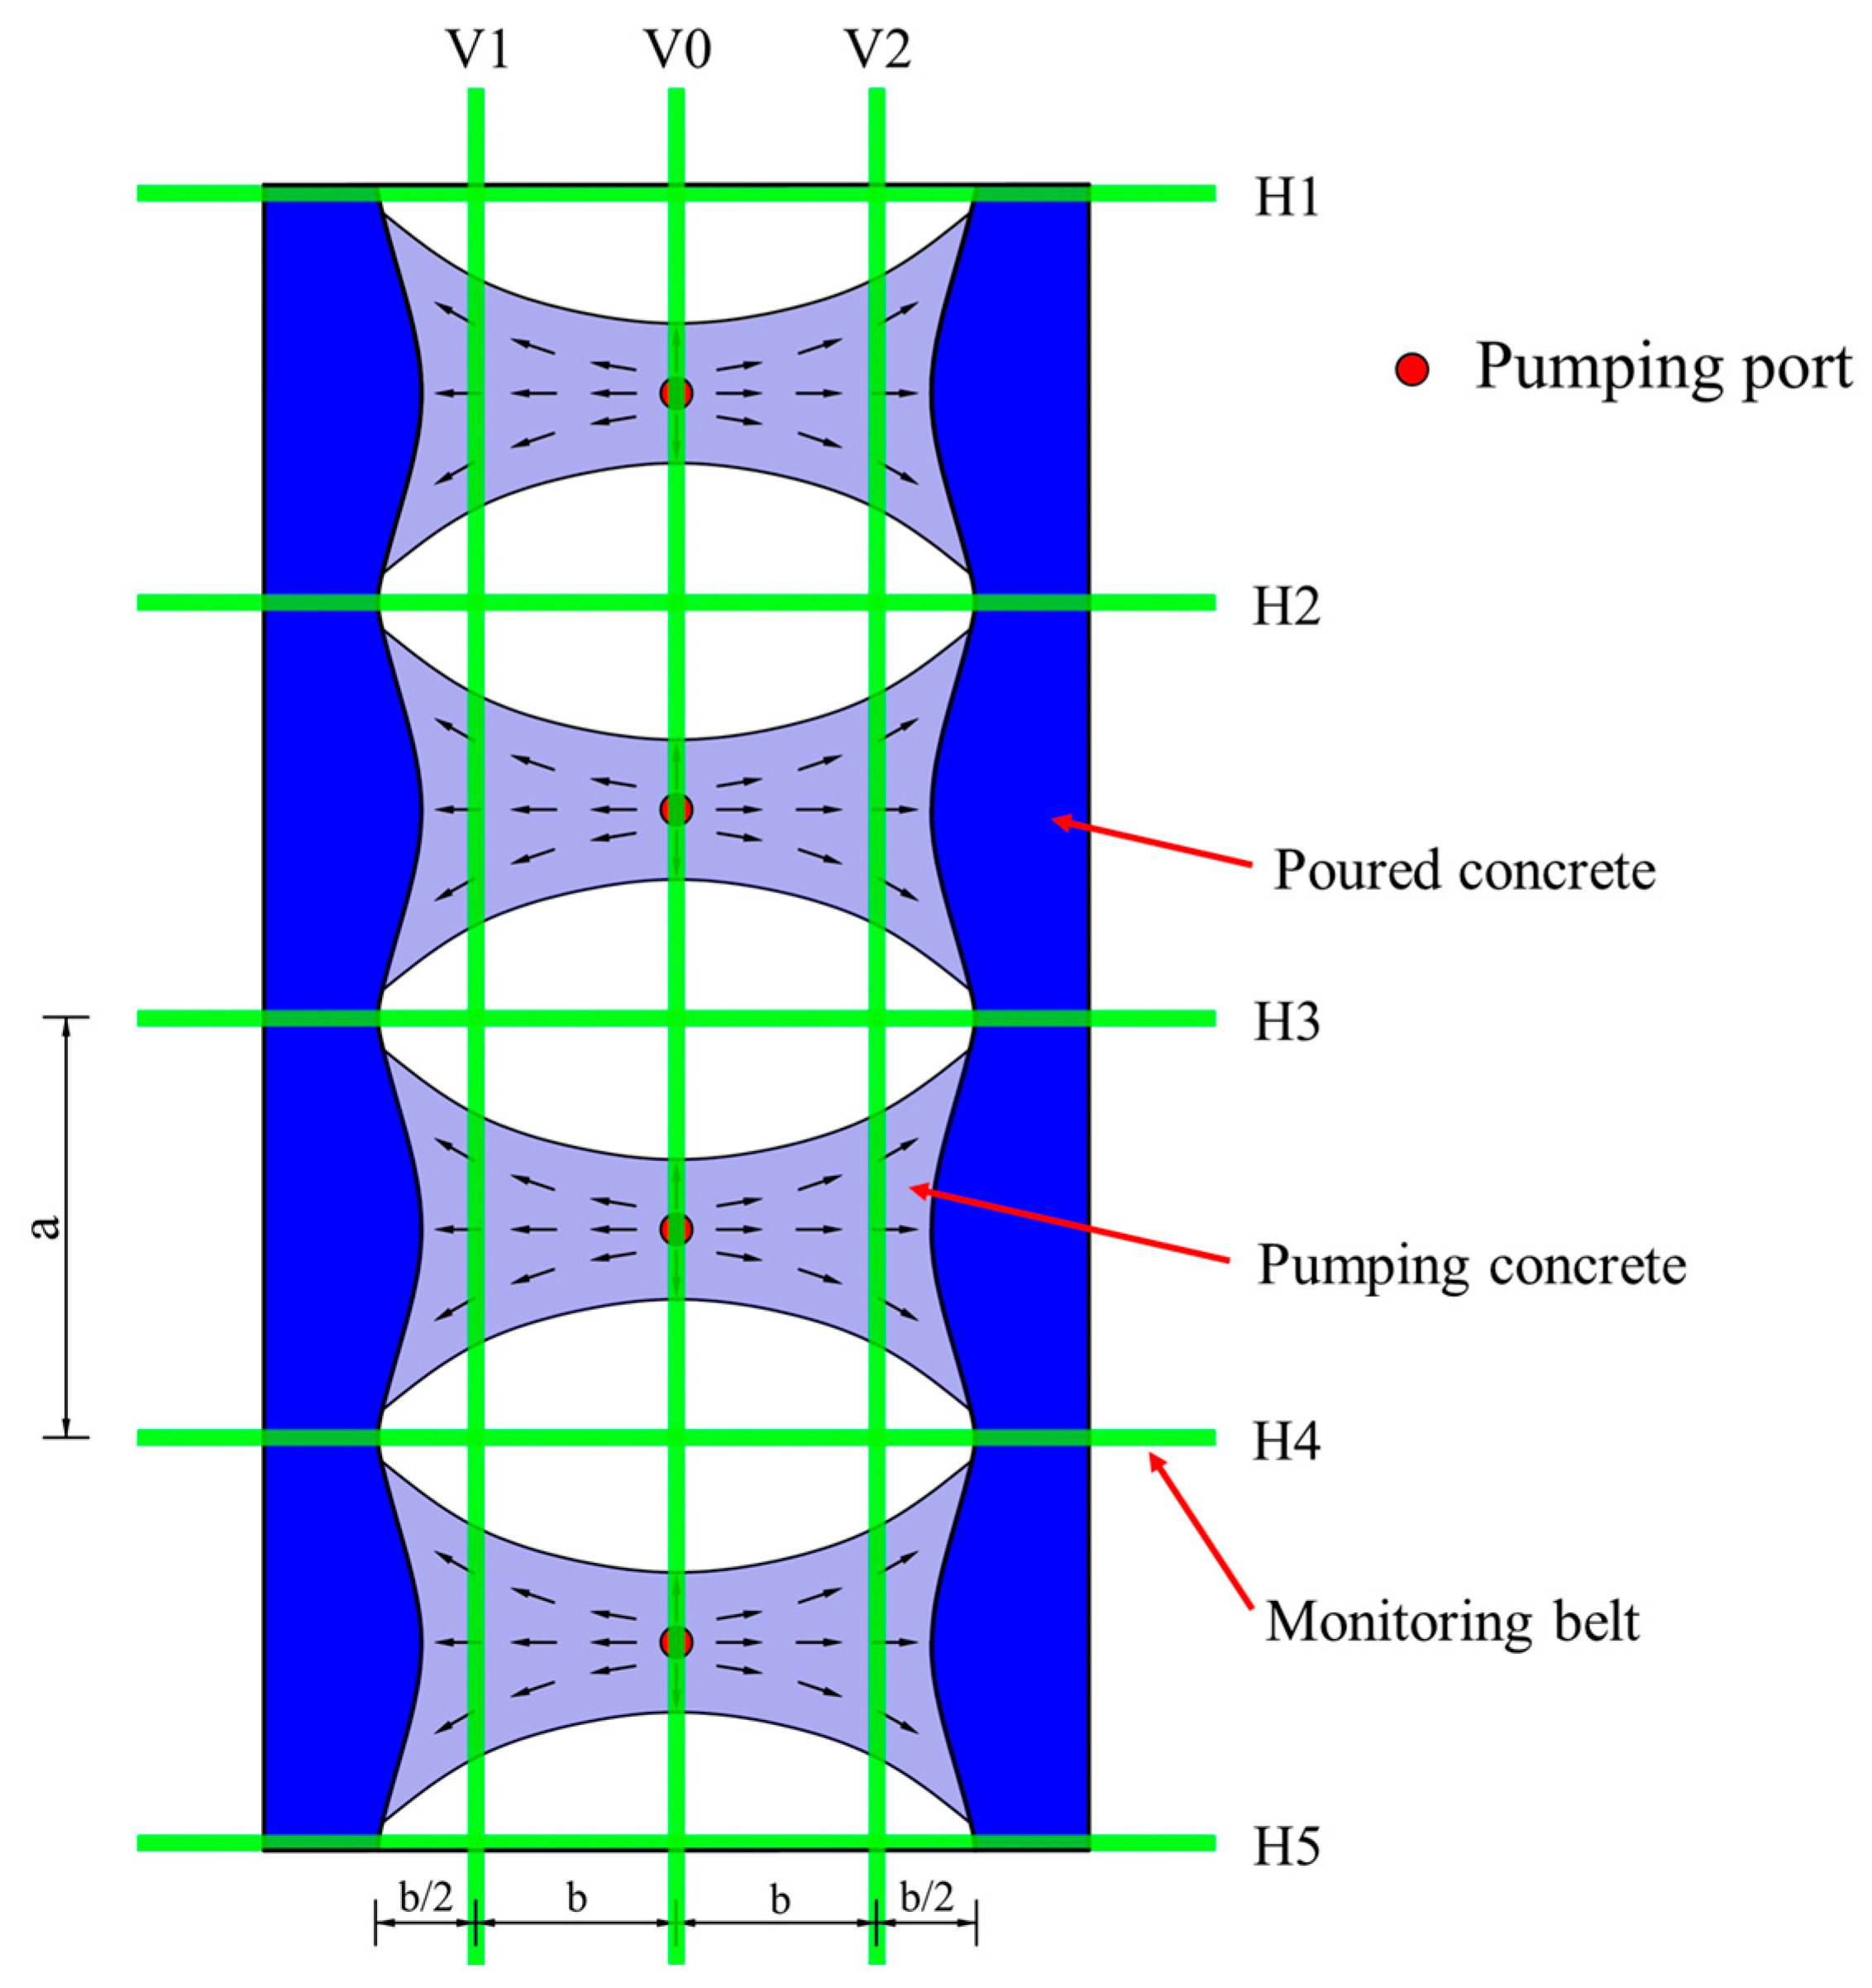
The upper arch of the tunnel is a single-centered circle with a cross-sectional radius of 7.1 m. The validation experiment selected the section from YK1+900-YK2+380 of the right tunnel for monitoring. The validation experiment consisted of two parts. Firstly, comprehensive monitoring of the upper arch was conducted to identify areas with a high incidence of voids behind the lining. Secondly, focused monitoring was carried out in regions with a high risk of voids to analyze the distribution patterns of voids within these areas. As shown in
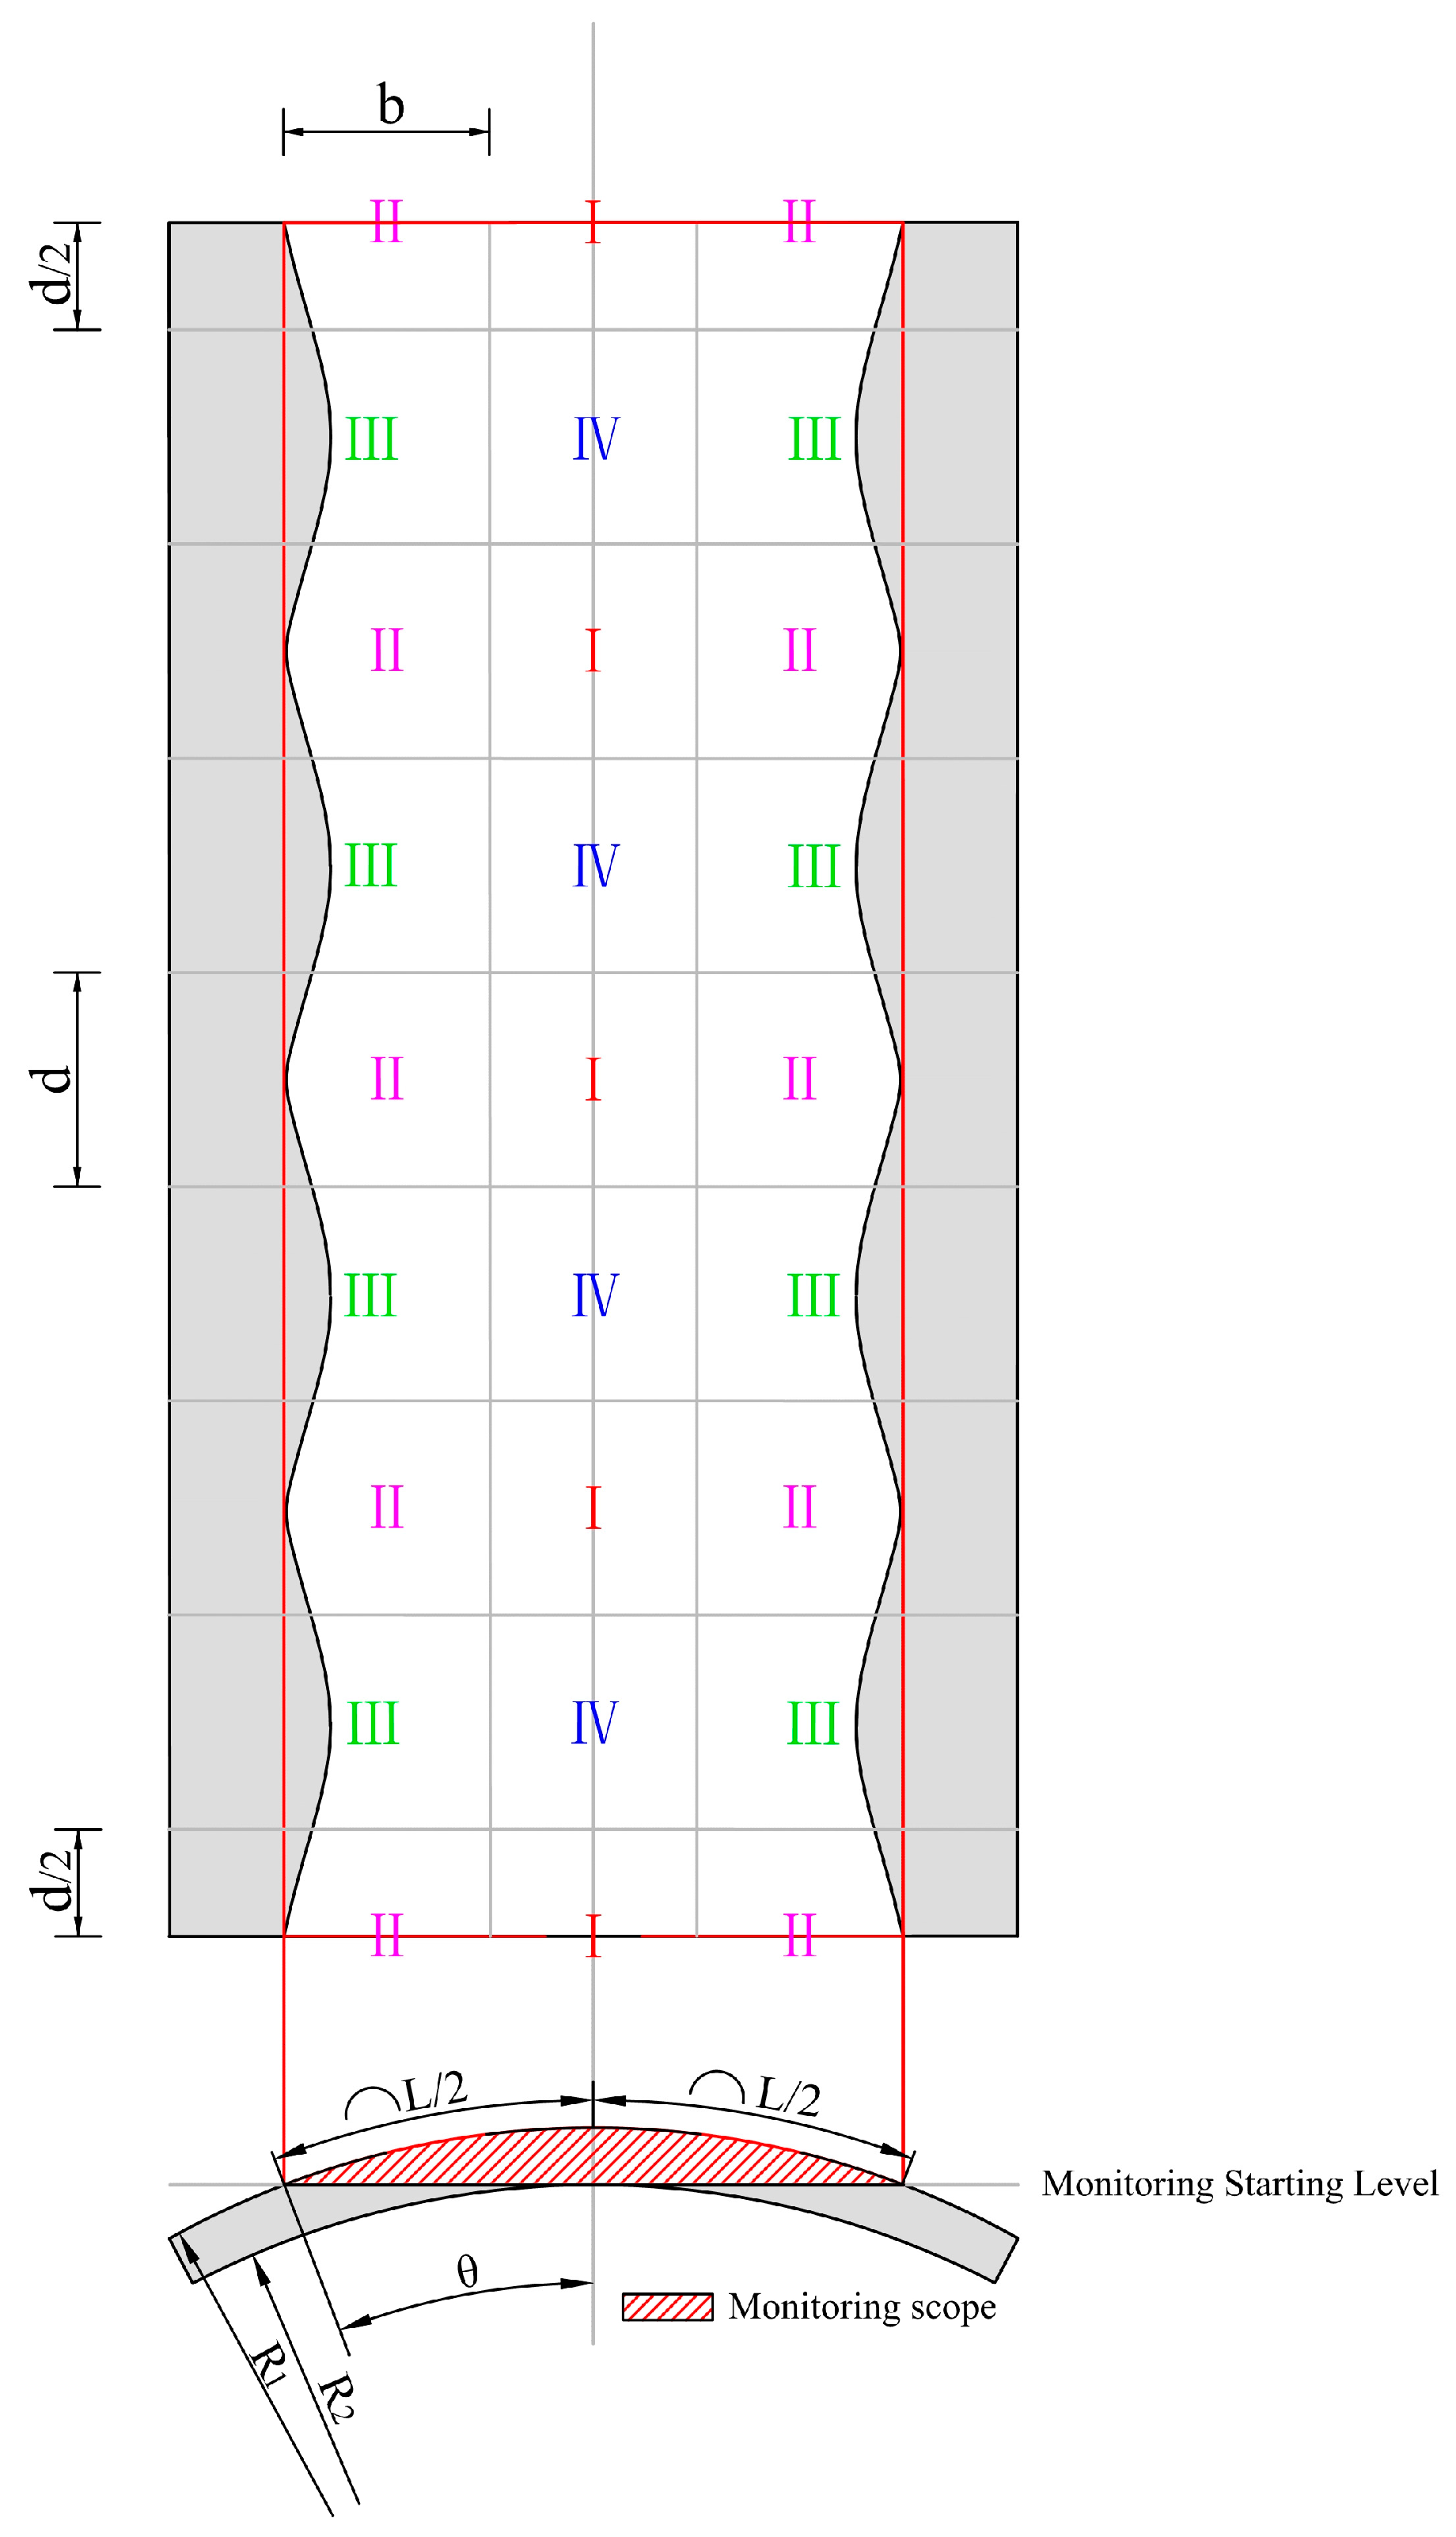
Figure 13, the monitoring section for voids behind the upper arch lining is designated as YK1+900-YK2+140. A total of 20 segments of secondary lining were monitored. The longitudinal distance between each sensor monitoring point was 0.8 m, with each sensor having 15 measurement points. The circumferential interval d1 between sensors was 0.8 m, and a total of 29 sensors were installed.
During the comprehensive monitoring of the upper arch, a total of 17 voids were identified. Specifically, within the 30° range on both sides of the vault, 11 voids were found, accounting for 64.7% of the total voids. The largest non-compact area showed red lights across five consecutive monitoring points. In the 30° to 60° range on both sides of the arch shoulders, 3 voids were found, accounting for 17.6% of the total voids. The largest non-compact area showed red lights across three consecutive monitoring points. In the 60° to 90° range on both sides of the arch waists, 2 voids were found, accounting for 11.7% of the total voids. The largest non-compact area showed red lights across two consecutive monitoring points. The voids were mainly concentrated in the vault area, and the length of the voids in this region was generally greater than in other parts.
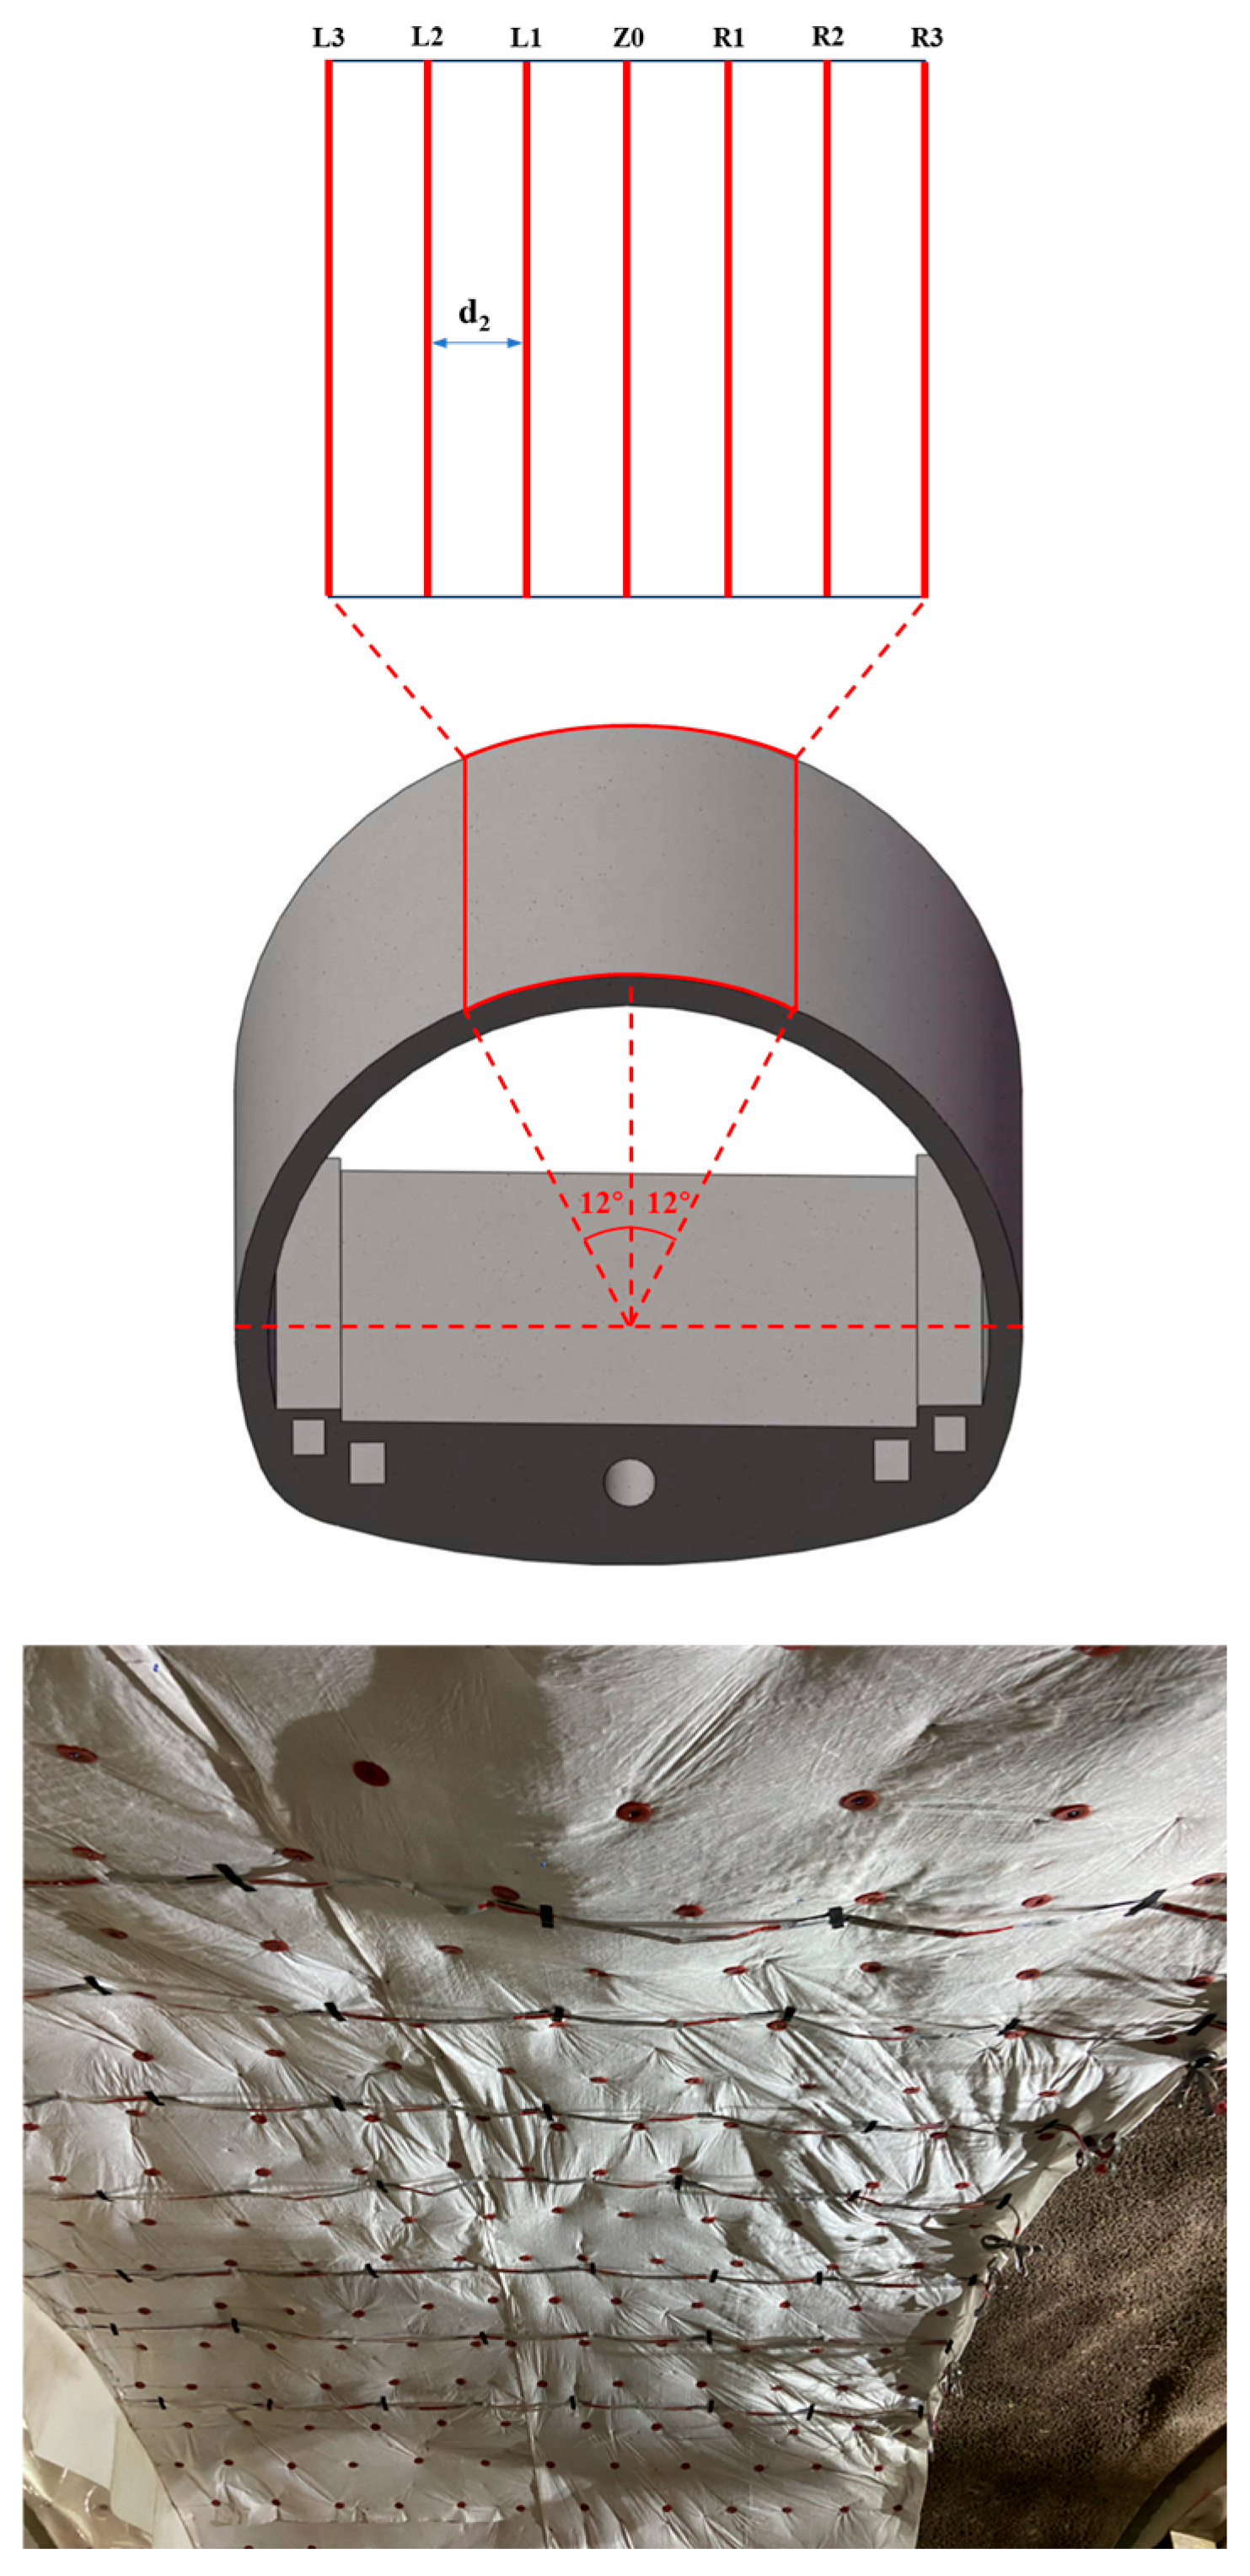
From the above experiments, it is evident that the vault is a high-incidence area for voids. To further investigate the longitudinal distribution characteristics of voids in this area, denser monitoring was conducted on the vault of the secondary lining within the YK2+140 to YK2+380 section, involving 20 modules, as shown in
Figure 14. 7 sensors were arranged on the vault, with a shortened circumferential interval d2 of 0.4 m. This part of the verification experiment aimed to study the longitudinal distribution pattern of voids in the vault through denser monitoring.
4.4. Radar-Based Validation of Monitoring Results
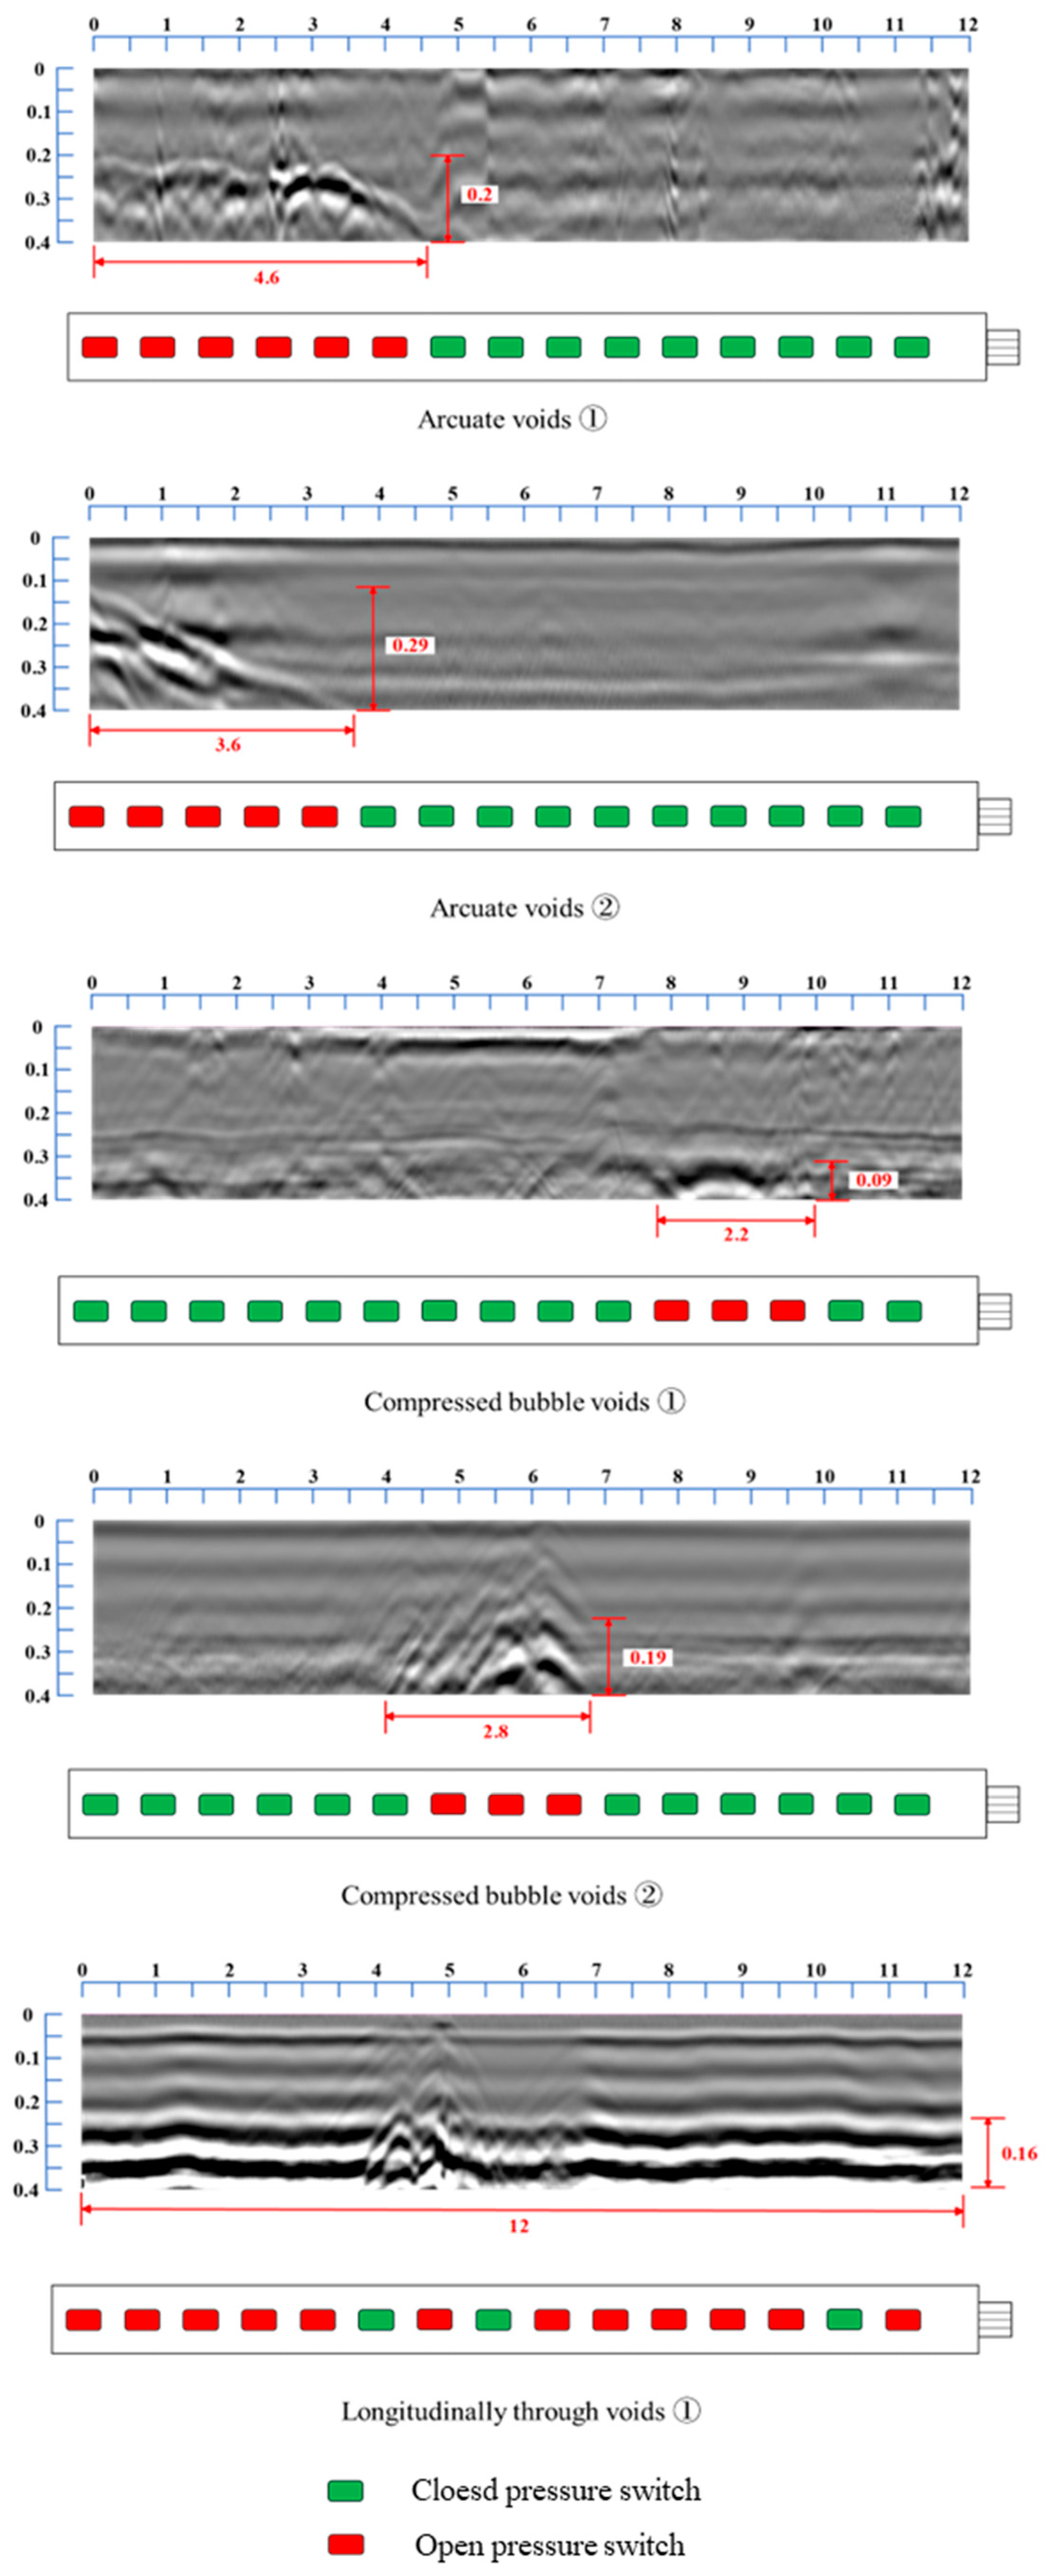
As shown in
Figure 15, to validate the accuracy of the void proactive monitoring system based on compaction sensors, this study selected the vault survey line as the validation object and used ground-penetrating radar (GPR) technology to verify the void monitoring results. In this validation experiment, 5 voids were detected in the vault area, including 2 arcuate voids, 2 compressed bubble voids, and 1 longitudinally through void. Specifically, arcuate voids ① showed a void located between YK2+212 and YK2+217, with a length of 4.6 m. The compaction sensor indicator lights 1 through 6 were activated, and the monitoring results were consistent with the radar verification. For details on other void locations, please refer to
Figure 15. The results indicate that the 5 voids in the vault area were generally consistent with the GPR detection results. The radar verification demonstrated that the proactive monitoring system based on compaction sensors could effectively and accurately detect voids behind the secondary lining. Additionally, the compaction sensor monitoring experiment confirmed the accuracy of the void risk area delineation.
7. Conclusions
In this study, based on Bingham fluid theory, we have provided an in-depth analysis of the formation mechanisms of voids in the secondary linings of tunnels. Our findings offer valuable insights into the morphological characteristics of voids and present a novel approach for their detection and monitoring. Here are the key conclusions drawn from our research:
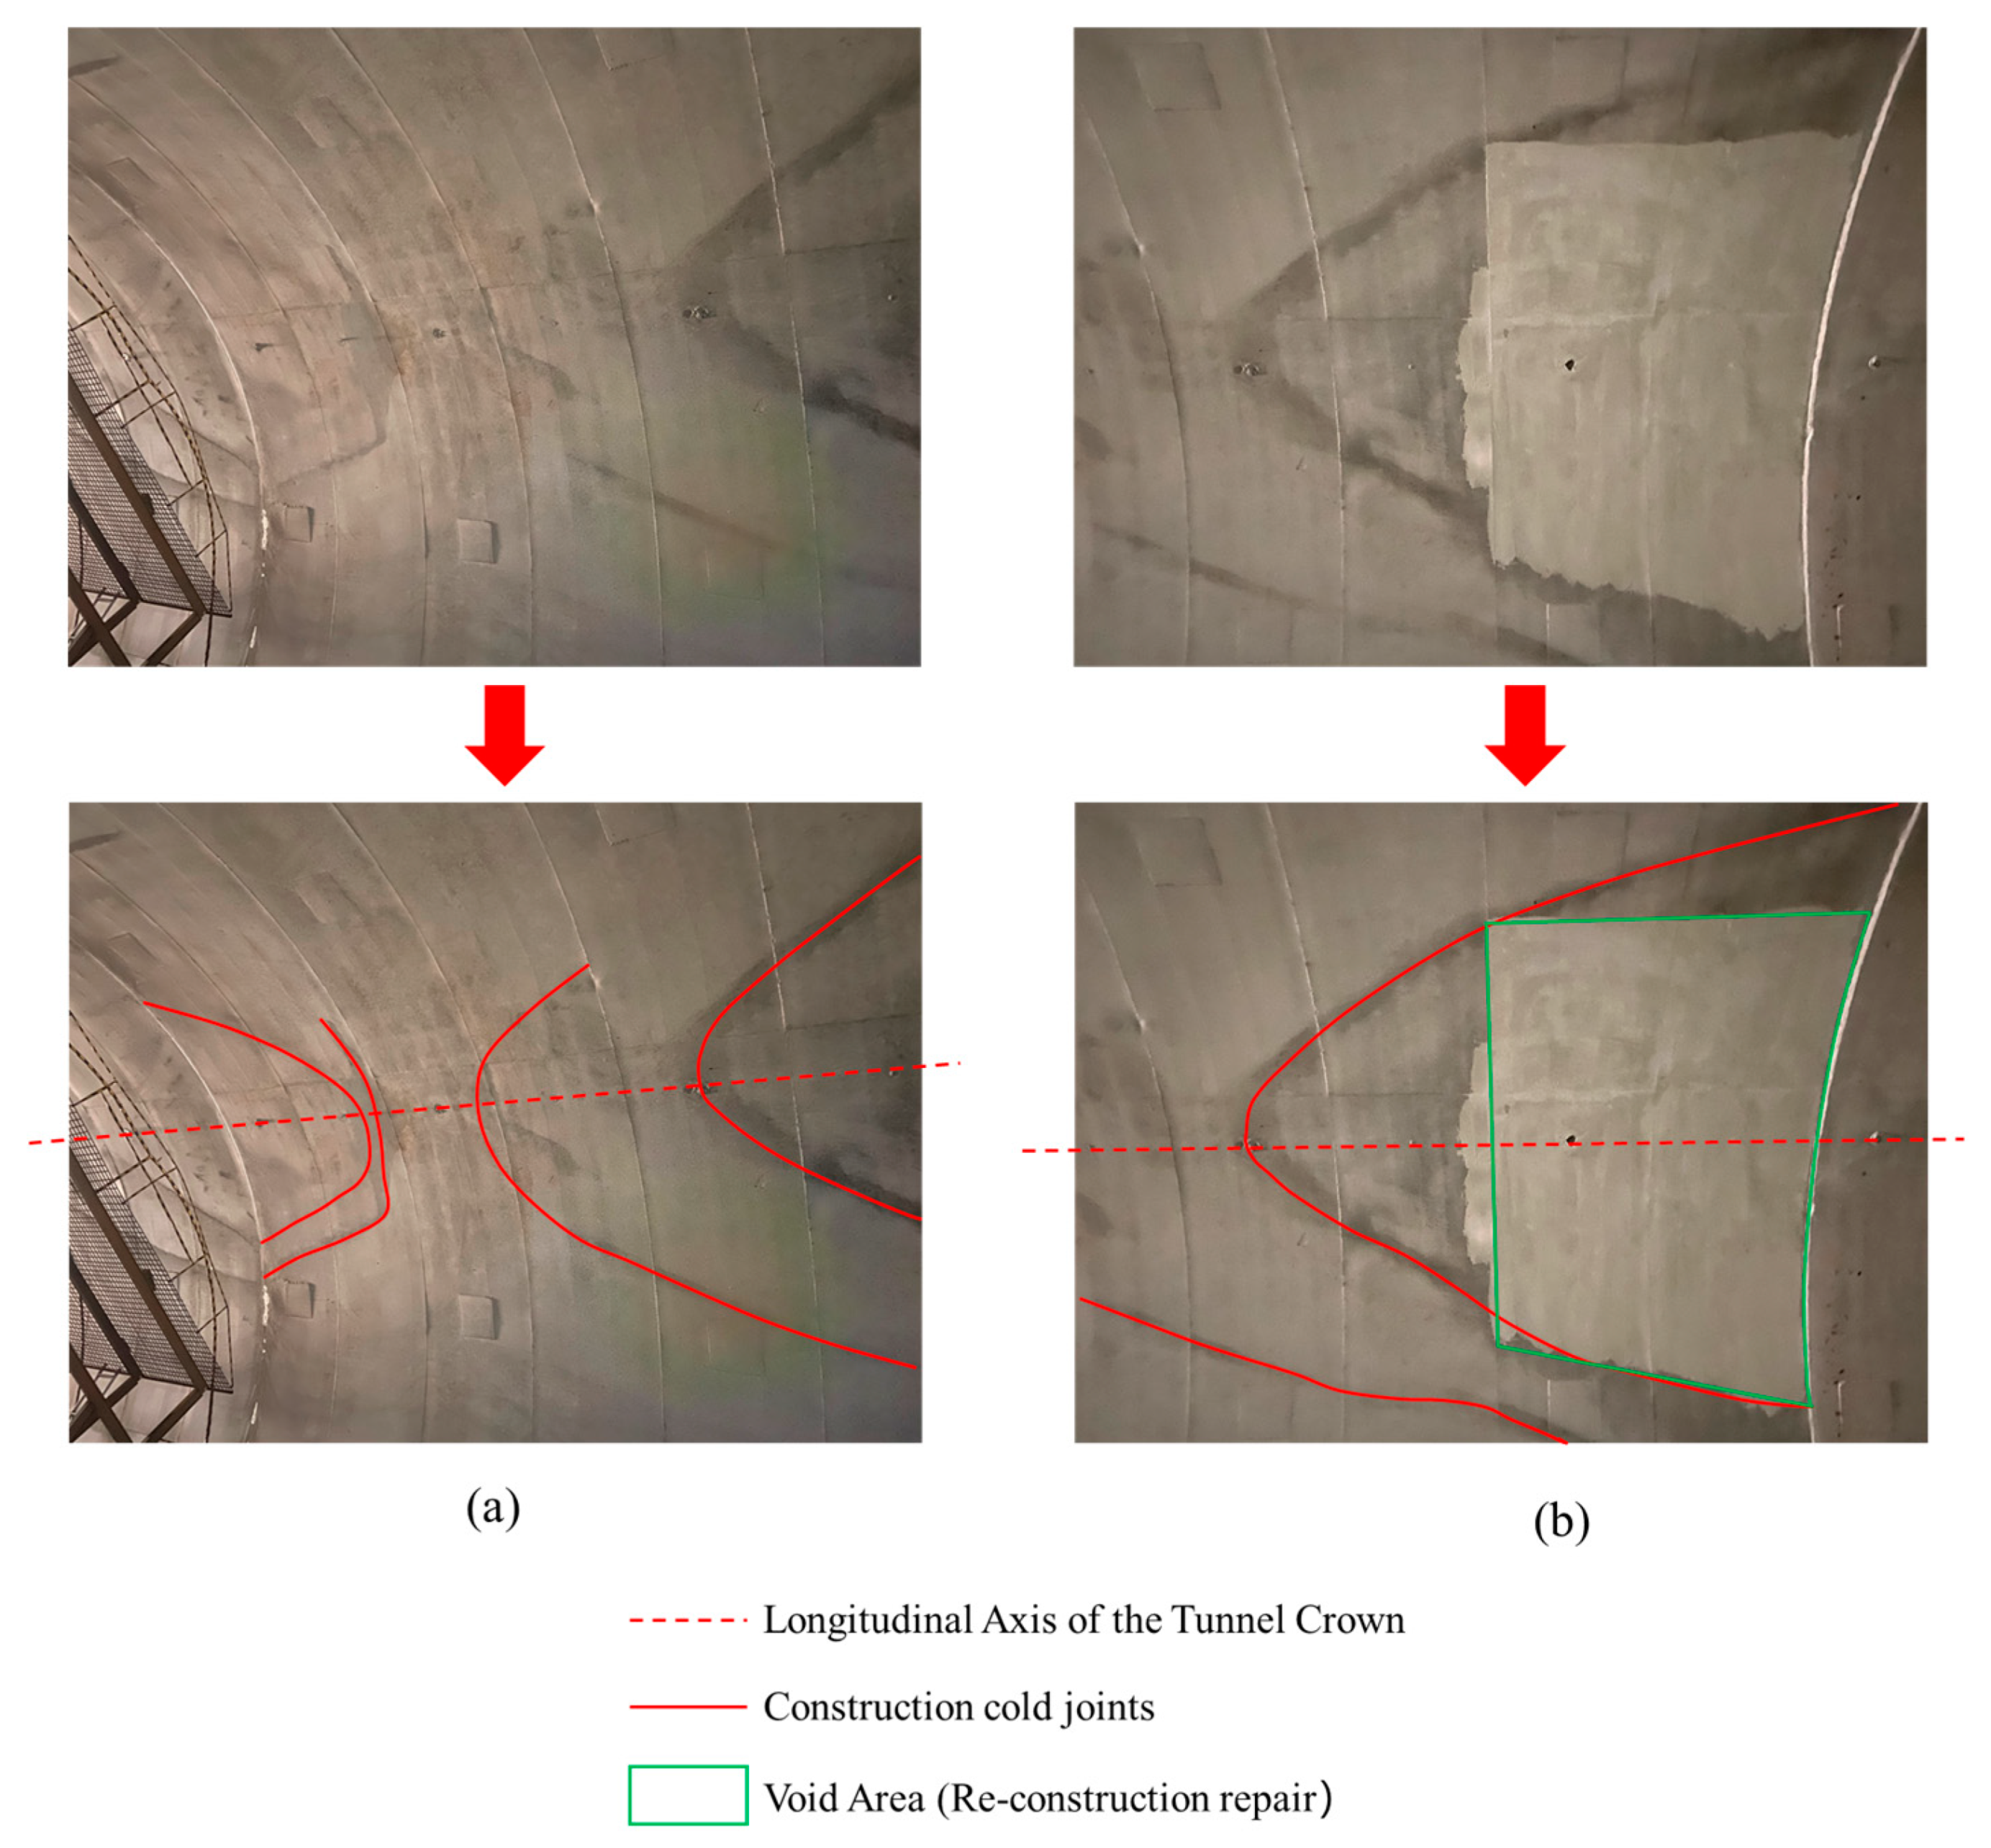
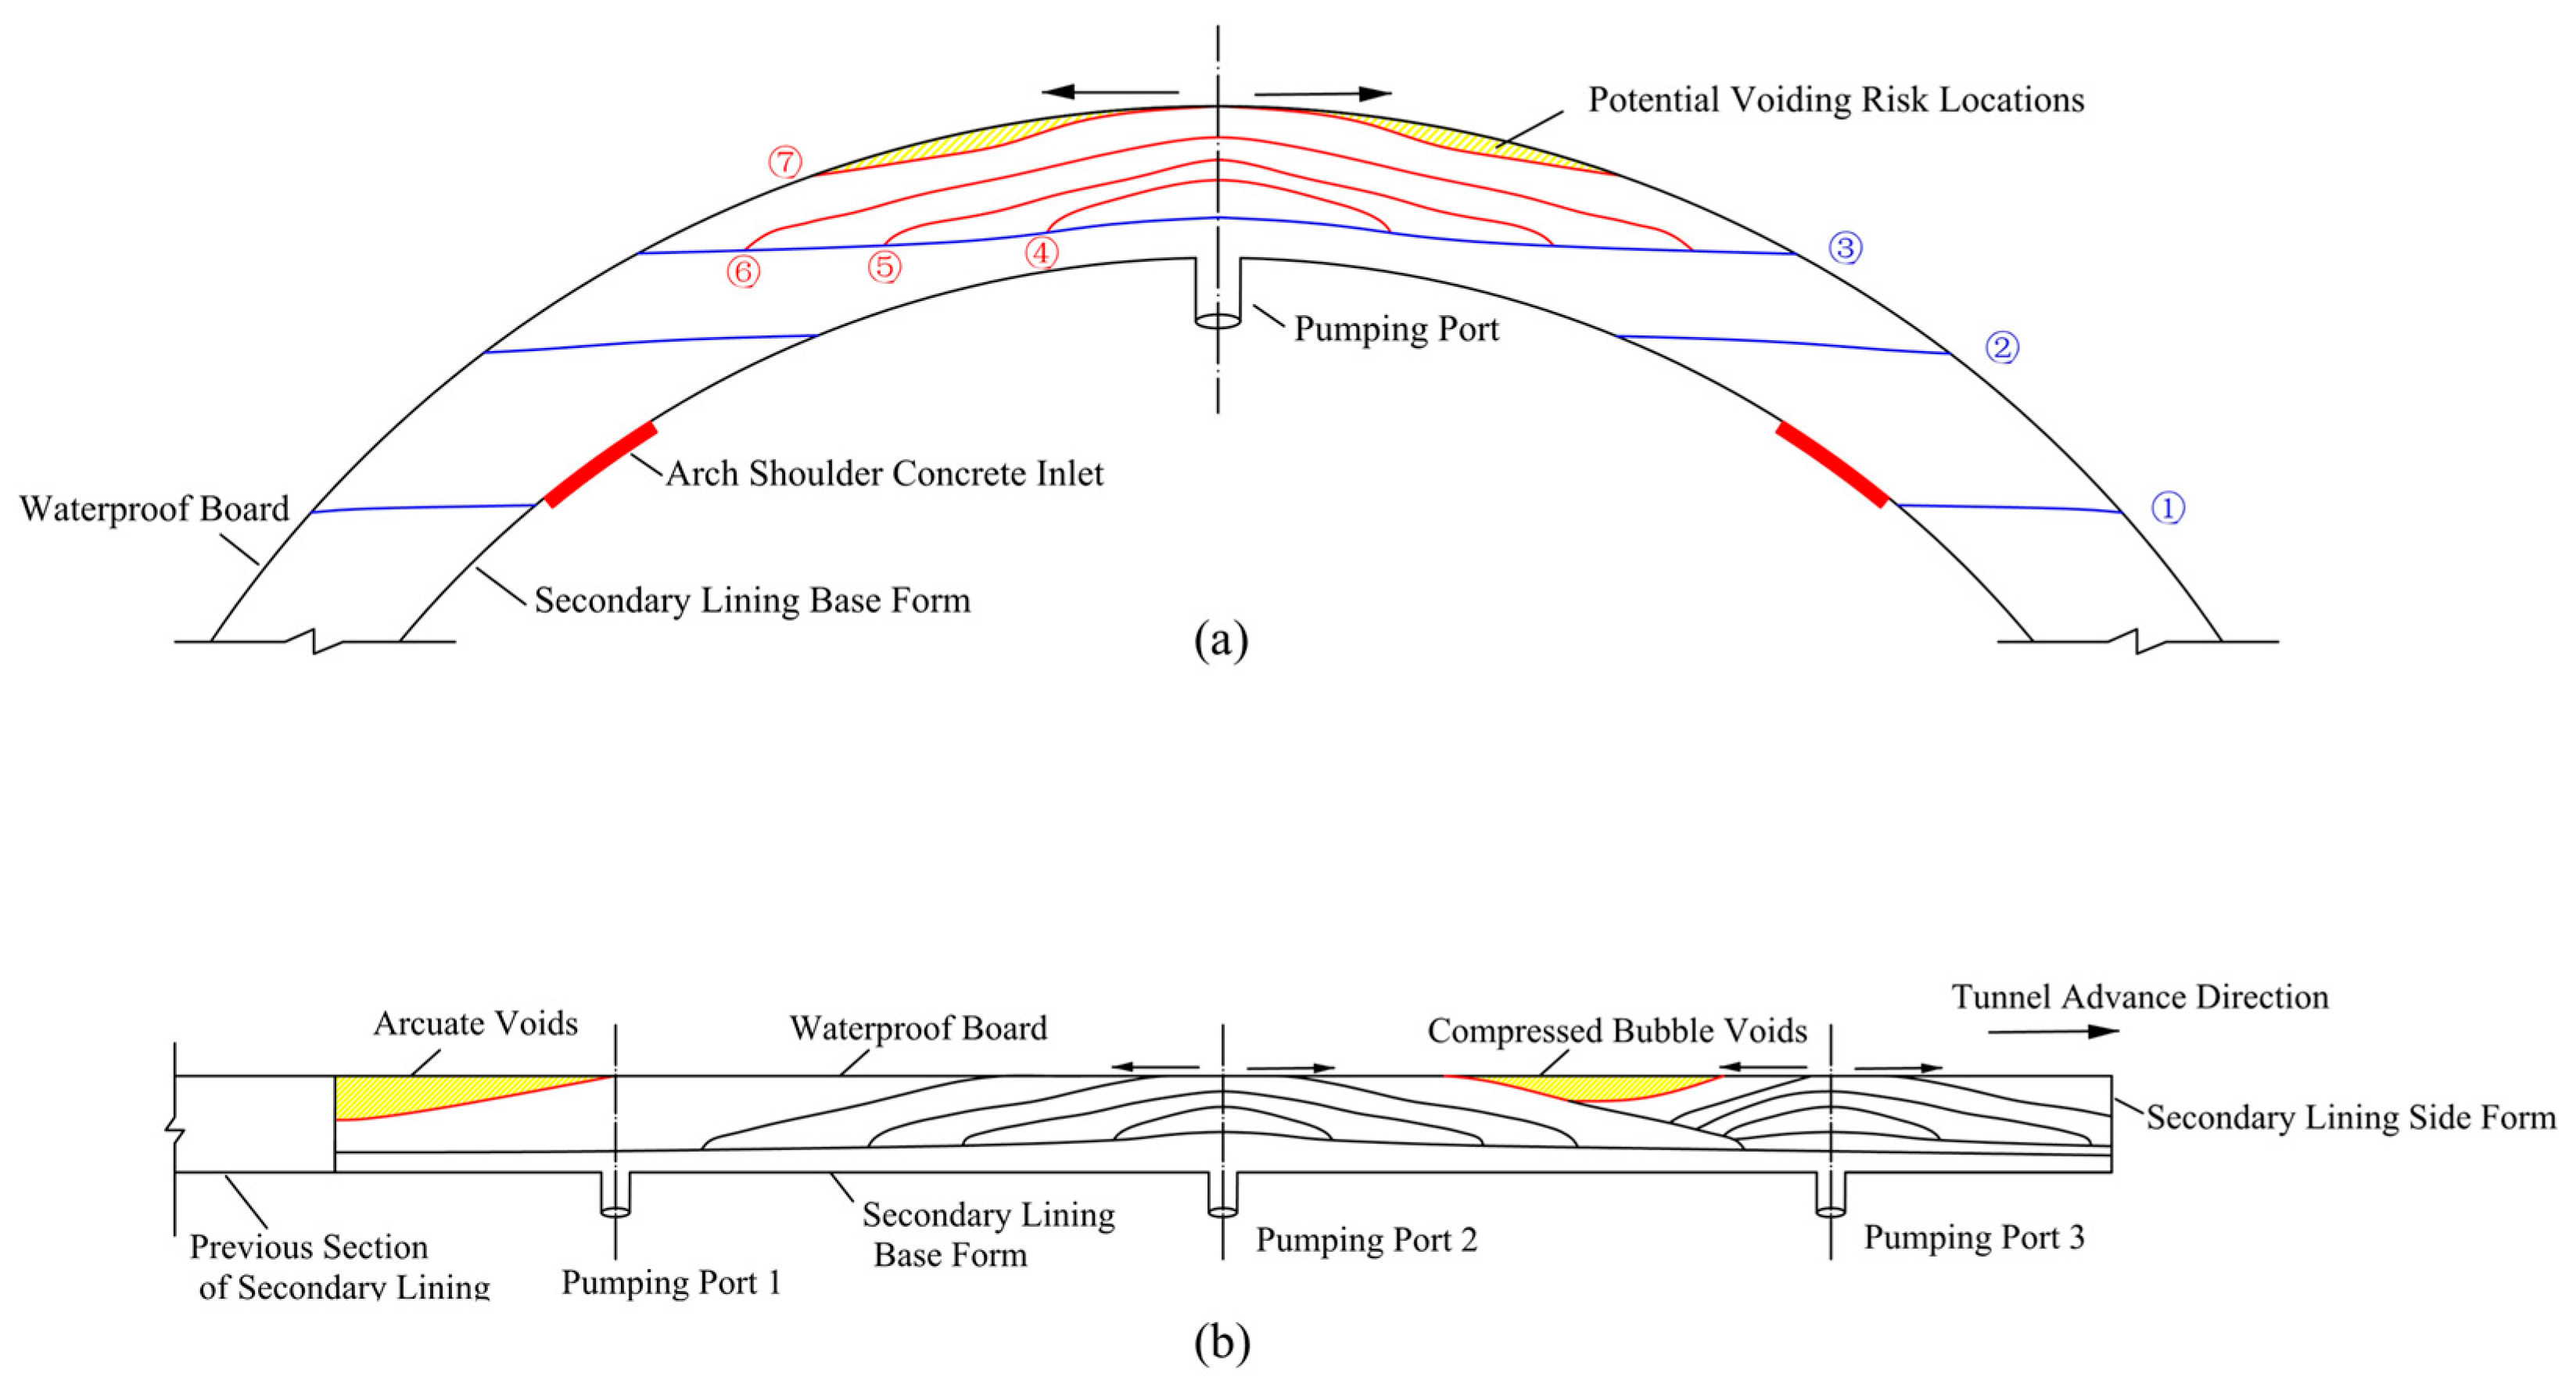
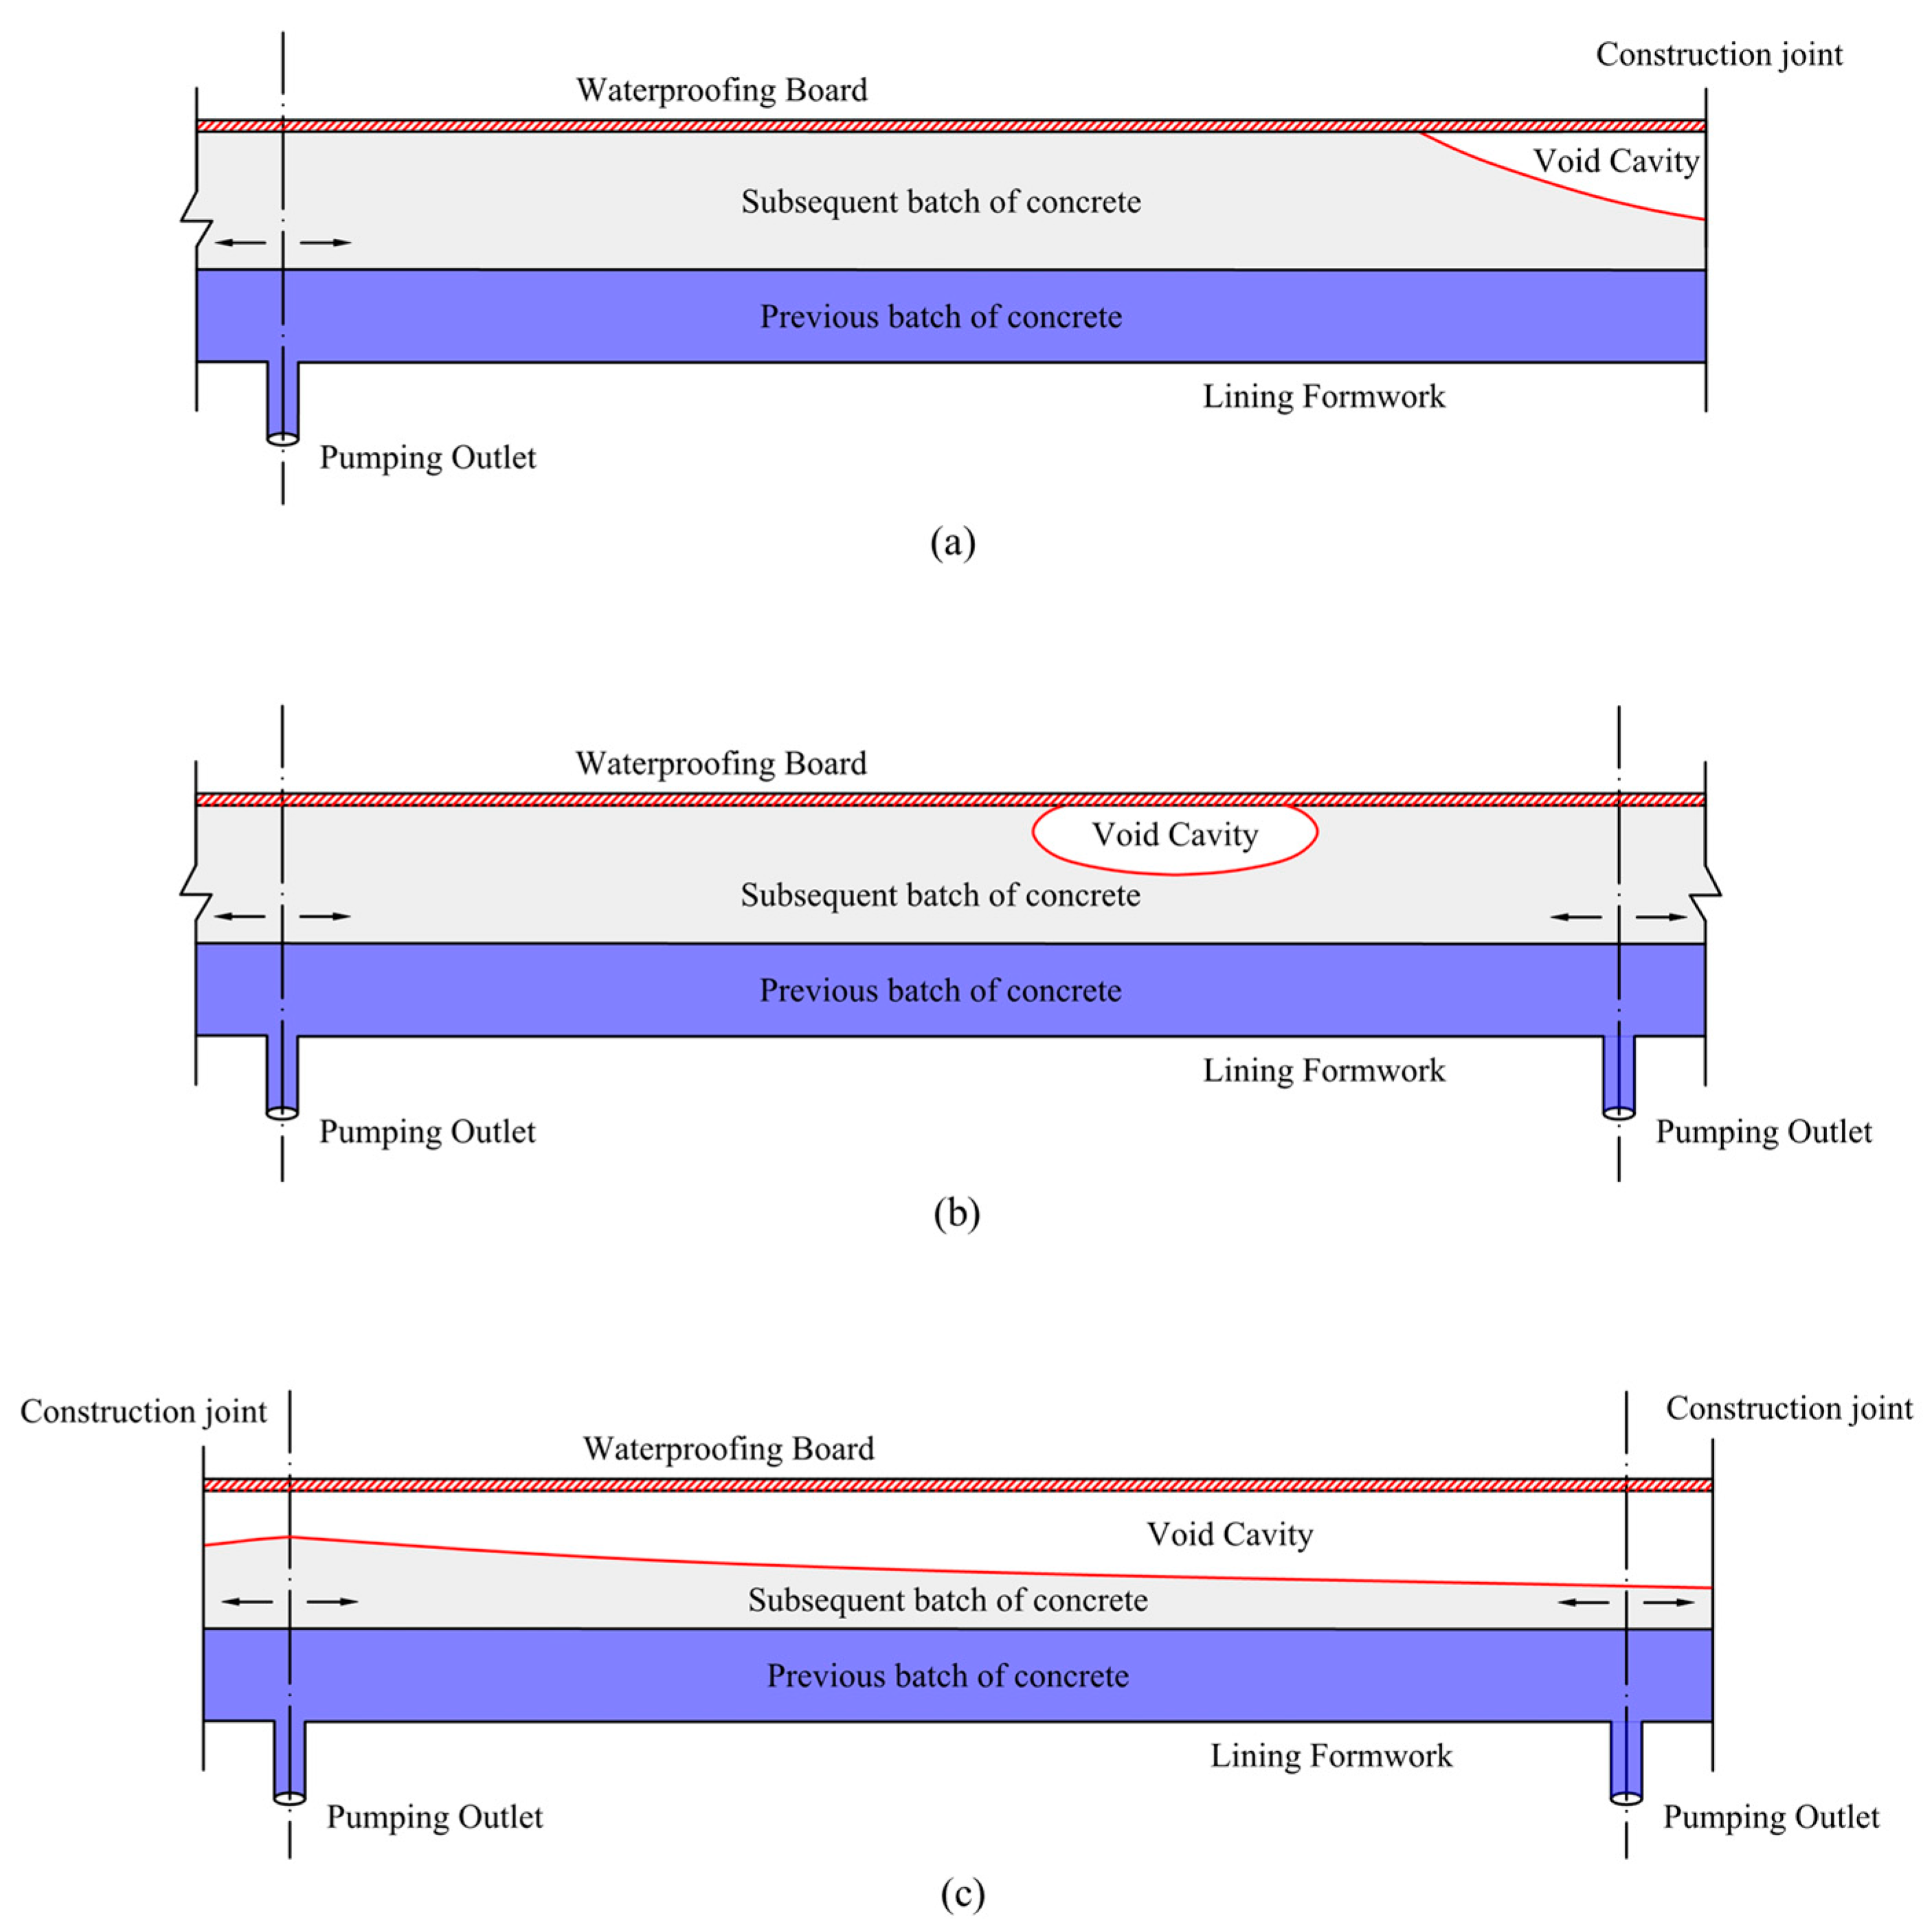
(1) This study delves into the filling progress of fresh concrete within the formwork and thoroughly analyzes the formation mechanisms of voids. Through this analysis, the morphological characteristics of voids in different locations are revealed, providing a new perspective on understanding their formation process. Due to the forces and flow resistance during the movement of fresh concrete, voids tend to form in specific areas, especially in complex formwork structures and uneven construction environments. The characteristics of voids vary by location, with arcuate voids primarily occurring in the construction joint area, while compressed bubble voids are more common in the middle of mold.
(2) This study proposes a novel risk assessment model for vault voids, subdividing the vault area into four distinct risk levels. The model incorporates factors such as the dynamics of concrete flow, formwork geometry, and construction conditions, enabling a more accurate prediction of void formation. The stratified risk levels facilitate targeted monitoring and intervention strategies, ensuring that high-risk areas receive more focused attention. This proactive approach enhances the precision and efficiency of void detection, contributing to the overall stability and longevity of the tunnel structure. The implementation of this model offers significant improvements in construction quality control and maintenance planning, thereby reducing the likelihood of structural issues and associated costs.
(3) Based on the delineation of void risk areas, this study has designed a targeted proactive monitoring device and scheme for secondary lining voids. The scheme emphasizes intensive monitoring of high-risk areas, significantly enhancing the accuracy and efficiency of the monitoring process. By deploying more monitoring points in high-risk zones and utilizing advanced monitoring technologies, potential void issues can be detected and addressed more promptly. This scheme optimizes resource allocation, reduces unnecessary monitoring efforts, and improves the overall system’s response speed and reliability, providing strong support for engineering safety.
(4) To validate the effectiveness of the monitoring scheme, ground penetrating radar (GPR) technology was employed for field testing. The test results indicate that the optimized monitoring scheme performs excellently in identifying and locating voids in secondary linings, significantly improving monitoring accuracy and reliability. By comparing field test data with expected outcomes, the study confirmed that this scheme can accurately detect void areas within the lining structure, providing robust data support for engineering practice.
