Article

Prediction on Dynamic Yield Stress and Plastic Viscosity of Recycled Coarse Aggregate Concrete Using Machine Learning Algorithms

1
School of Culture Resources, Taipei National University of the Arts, Taiwan 112301, China
2
Department of Civil Engineering, Tamkang University, Taiwan 251301, China
3
College of Civil Engineering, Tongji University, Shanghai 200092, China
*
Author to whom correspondence should be addressed.
Buildings 2025, 15(18), 3353; https://doi.org/10.3390/buildings15183353
Submission received: 14 August 2025 / Revised: 7 September 2025 / Accepted: 15 September 2025 / Published: 16 September 2025
(This article belongs to the Special Issue Recycled Aggregate Concrete as Building Materials)

Abstract

Recycled coarse aggregates (RCA) offer an alternative to natural coarse aggregates in concrete production, reducing natural aggregate extraction and landfill burdens and potentially lowering embodied energy and CO2 emissions. This study leverages machine learning algorithms to predict the dynamic yield stress (DYS) and plastic viscosity (PV) of RCA concrete (RCAC). A database of 380 RCAC mixtures, incorporating 11 input features, was analyzed using six machine learning models: Artificial Neural Network (ANN), Decision Tree (DT), Random Forest (RF), Extreme Gradient Boosting (XGBoost), Light Gradient Boosting Machine (LightGBM), and Support Vector Machine (SVM). The model performance was compared, followed by sensitivity analyses to identify critical factors influencing DYS and PV. For DYS, the DT model demonstrated the highest predictive performance (testing R2/RMSE/MAE = 0.95/18.25/13.99; others: 0.90–0.93/12.14–26.10/15.40–19.50) due to its robustness on smaller datasets. The XGBoost model led for PV (testing R2/RMSE/MAE = 0.93/7.06/4.58; others: 0.82–0.89/8.69–11.20/6.06–7.51) owing to its sequential residual minimization that captures nonlinear interactions. Sensitivity analyses revealed that polycarboxylate superplasticizer content and water-to-binder ratio significantly influence DYS, while cement content and saturated-surface-dried water absorption of RCA (i.e., measured with open pores filled and the aggregate surface dry) dominate PV. The time-dependent role in affecting PV was also highlighted. By optimizing and comparing different machine learning algorithms, this study advances predictive methodologies for the rheological properties of RCAC, addressing the underexplored use of machine learning for RCAC rheology (DYS and PV) and the limitations of traditional empirical rheology methods, thereby promoting the efficient use of recycled materials in sustainable concrete design.

1. Introduction

Rapid urbanization and infrastructure development generate vast amounts of construction and demolition waste, with concrete accounting for nearly 50% of this waste stream. Waste concrete can be processed into recycled aggregates, which are further used to produce recycled aggregate concrete. The engineering potential of recycled aggregate concrete has been disclosed [1,2]. Substituting natural aggregates with recycled aggregates conserves natural resources and reduces the environmental burden associated with landfill waste. However, recycled aggregate exhibits different properties from natural aggregate, such as higher porosity and greater water absorption capacity, which may affect the rheological properties of recycled aggregate concrete.
It is essential to clarify concrete rheology since the latter influences the mixing, pumping, placement, and even 3D printing of concrete, all of which affect the quality and durability of the final product. In concrete rheology, three primary rheological parameters are of interest, including static yield stress, dynamic yield stress (DYS), and plastic viscosity (PV), which refer to the stress required to initiate flow, the stress needed to maintain flow under dynamic conditions, and the resistance to flow once the material begins to move, respectively. These parameters are influenced by the internal elements of concrete, including the properties of the aggregates used. As reported, both recycled coarse and fine aggregates (RCA and RFA) can significantly alter the rheological properties of recycled aggregate concrete [3,4]. However, due to limited literature on the rheology of RFA concrete, this study focuses primarily on RCA concrete (RCAC).
Water-related factors, such as the water absorption of RCA and the effective water-to-binder (w/b) ratio in RCAC, play a central role in governing the rheology of fresh concrete. Hou et al. [5] reported that the DYS increase in RCAC is more pronounced when RCA is in an oven-dry condition due to its higher water absorption. This phenomenon occurs because the effective w/b ratio is reduced to compensate for the water absorption of RCA, making the RCAC more difficult to flow. Moreover, the rheological properties of RCAC are also affected by supplementary cementitious materials and chemical admixtures. For instance, Singh and Singh [6] found that the addition of fly ash (FA) in RCAC as a viscosity modifier can reduce yield stress and enhance workability. González-Taboada et al. [7] also indicated that while the addition of superplasticizers (SPs) mitigates the adverse effects of RCA on rheology, their efficiency decreases when SPs mix with high RCA content.
The above studies underscore the importance and complexity of material design in adjusting the rheological properties of RCAC. As a result, a technical challenge is accurately predicting the rheological properties of RCAC. Accurate predictions allow for optimizing complex material designs, ensuring desired rheological properties. In practical applications, the required rheological parameters can be determined using the workability box in conjunction with specific application scenarios [8,9]. Traditional prediction of these parameters relies heavily on empirical relationships based on extensive laboratory testing. Despite prior work on workability control, there is currently no generalizable a priori tool to predict RCAC rheology from design variables without laboratory testing. This gap motivates a machine learning-based approach tailored to RCAC rheology.
Machine learning models can learn from historical data to identify patterns and relationships between input features and output properties [10,11]. Once trained, these models can predict output properties under different combinations of input features, bypassing the need for extensive experimental trials. At present, machine learning models have accurately predicted the various characteristics of RCAC, such as compressive strength [12], frost resistance [13], carbonation resistance [14], chloride resistance [15,16], sulfate resistance [17], and carbon emissions [18]. However, using machine learning models to predict the rheological properties of RCAC remains an underexplored area. Hence, this study aims to develop and compare machine learning models that predict RCAC rheology (DYS and PV) for the first time.
In this study, machine learning algorithms are applied to predict the rheological properties of RCAC. A comprehensive database is developed through systematic data collection, processing, and partitioning, encompassing essential rheological parameters of RCAC. Six machine learning models, including Artificial Neural Network (ANN), Support Vector Machine (SVM), Extreme Gradient Boosting (XGBoost), Light Gradient Boosting Machine (LightGBM), Random Forest (RF), and Decision Tree (DT), are constructed, with hyperparameter tuning for optimization. The significance of the proposed approach lies in delivering high-accuracy predictions without additional rheological testing, thereby enabling rapid AI-assisted optimization of rheology-oriented RCAC mix designs and reducing reliance on extensive empirical trials. Comprehensive model evaluations and comparisons are then conducted to assess prediction accuracy for the rheological properties of RCAC. Moreover, sensitivity analyses are employed to identify the crucial factors affecting these properties. Overall, the main contributions of this study are to demonstrate the feasibility of applying machine learning models to predict the rheology of RCAC and identify the most accurate model for predicting DYS and PV among six commonly used algorithms, thereby establishing a baseline for future data-driven rheology-oriented RCAC mix designs.

2. Database and Models

2.1. Data Collection, Processing, and Partition

To establish a reliable machine learning database for predicting the rheological properties of RCAC, data were collected from All Databases of the Web of Science using the advanced search term: “TS = (recycled aggregate OR waste aggregate OR recycled concrete OR waste concrete) AND TS = (rheology OR rheological OR yield stress OR viscosity)”. This data collection process followed specific criteria to ensure consistency and accuracy.
Previous literature was required to report DYS (Pa) and/or PV (Pa·s). Due to the limited sample size, the prediction of static yield stress has not been conducted. According to Deng et al. [18], the compressive strength and carbon emissions of RCAC were successfully predicted using 12 input features, including cement strength grade (1), mixing proportions (8), and RCA characteristics (3). Thus, the previous literature was required to provide or enable inference of RCAC mixing proportions, cement strength grade (defined as OPC’s grade), and RCA characteristics. Only FA, limestone (LF), and polycarboxylate-based SP were considered in various mineral and chemical admixtures. Only saturated surface-dry water absorption (Wssd), the water absorption of RA when open pores are filled with water and the aggregate surface is dry [19], was considered in various RCA characteristics due to its standardized test method [19], reliability [19], and strong correlation with other characteristics [20], such as apparent density and crushing value. Furthermore, RCA should be untreated chemically or biologically, with impurities limited to less than 5 wt.%. Since temporal effects have emerged as a central theme across disciplines [21,22], the previous literature was also required to report the measurement time for rheological tests, defined as the contact time between the binder and water.
As a result, 380 sets of RCAC mixtures were collected from 13 studies [5,23,24,25,26,27,28,29,30,31,32,33,34], where 11 input features include the RCA’s Wssd (%), OPC’s grade (MPa), water content (kg/m3), cement content (kg/m3), FA content (kg/m3), LF content (kg/m3), natural fine aggregate (NFA) content (kg/m3), natural coarse aggregate (NCA) content (kg/m3), RCA content (kg/m3), SP content (kg/m3), and measurement time (min). For clarity, the w/b or water-to-cement (w/c) ratios were replaced by water content. The mass of RCA was converted to that of total-dried RCA. If RCA was pre-absorbed, the absorbed water was subtracted from RCA content and added to water content. Moreover, DYS and PV were derived from flow curve tests. Since some studies did not specify the rheological testing environment, while others explicitly conducted tests at room temperature, the testing environment of these 13 studies was defined as room temperature. Furthermore, since FA reacts minimally over the whole rheological testing period (within 100 min in this study), all fly ashes were generalized, so that they only behaved as fine spherical particles in the rheological process. Additionally, due to the diverse parameters of polycarboxylate-based SPs, SPs are often not subdivided in machine learning studies on concrete performance prediction [18].
Data processing is necessary for the high-quality evolution of machine learning databases. Missing values were filled by using mean or median values for each feature to avoid introducing bias. Subsequently, outliers were detected using box plots and Z-score analysis and excluded. Additionally, all numerical variables were normalized to a standard scale to ensure model compatibility and reduce biases from differing measurement units. The refined dataset was further partitioned into training and testing sets. Specifically, 70% of the data was used to train the relationship between input variables and output parameters, and the remaining 30% was reserved as the testing set, which was not used in the training process but utilized for assessing the model’s performance and accuracy.

2.2. Model Development

Given the complexity and interactions of the data, six advanced machine learning models were selected, including Artificial Neural Network (ANN), Support Vector Machine (SVM), Extreme Gradient Boosting (XGBoost), Light Gradient Boosting Machine (LightGBM), Random Forest (RF), and Decision Tree (DT). Each algorithm exhibits distinct strengths in modeling nonlinearity, high-order interactions, heterogeneity, and interpretability. DYS and PV are modeled with separate single-output regressors to optimize each target while maintaining consistency across datasets. There is a clear need for machine learning models because empirical lab-calibrated equations do not generalize across datasets and mix designs. The selected machine learning models address the above problems by learning nonlinear relationships, high-order interactions, and path-dependent effects in RCAC rheology, and by providing an a priori test-free approach that reduces reliance on extensive rheometry and enables rapid screening and optimization.

2.2.1. Artificial Neural Network (ANN)

ANN is a powerful tool for capturing complex non-linear relationships between input features and output variables. Its multi-layer architecture allows for hierarchical learning, making ANN well-suited for regression tasks that involve high-dimensional data, such as predicting DYS and PV in RCAC. Additionally, ANN can adapt to varying concrete mix designs, enhancing prediction accuracy.

2.2.2. Random Forest (RF)

RF is an ensemble method that builds multiple decision trees on random data subsets and averages their predictions. By reducing overfitting, it enhances model robustness and accuracy. For predicting the rheological properties of RCAC, RF effectively captures complex interactions between input features. However, hyperparameters like tree number and depth should be carefully tuned to avoid overfitting and ensure generalization.

2.2.3. Extreme Gradient Boosting (XGBoost)

XGBoost is a gradient-boosting algorithm that iteratively corrects errors made by previous trees. It excels at handling non-linear relationships and complex interactions, making it well-suited for predicting concrete properties. XGBoost performance depends heavily on hyperparameter tuning, particularly learning rate, number of trees, and maximum depth, to optimize accuracy and prevent overfitting.

2.2.4. Light Gradient Boosting Machine (LightGBM)

LightGBM is a gradient-boosting model optimized for speed and memory efficiency. It uses a histogram-based approach to build decision trees and handles categorical features natively. LightGBM is effective for predicting concrete rheology. However, like XGBoost, it requires careful tuning of parameters such as tree depth and learning rate to avoid overfitting.

2.2.5. Support Vector Machine (SVM)

SVM is a regression method that finds the optimal hyperplane to minimize prediction error, using kernel functions for non-linear relationships. In predicting RCAC’s DYS and PV, SVM constructs complex interactions between features, but requires careful tuning of kernel and regularization parameters to achieve optimal performance.

2.2.6. Decision Tree (DT)

DT segments data into regions based on feature values, providing an interpretable model for regression tasks. For concrete mix prediction, DT can capture relationships between mix parameters and rheological properties. However, it is prone to overfitting, necessitating constraints on tree depth and node splitting criteria to improve model generalization.

2.2.7. Hyperparameter Tuning for Machine Learning Models

Hyperparameters are critical in determining the performance of machine learning models, directly influencing prediction accuracy and computational efficiency [35]. Proper selection of hyperparameters is essential for balancing model complexity and generalization, which ultimately enhances predictive reliability [36]. In this study, a combination of hyperparameter optimization techniques was employed to address the unique requirements of six different machine learning models, specifically leveraging grid search, random search, and Bayesian optimization.
Each model was paired with the most suitable tuning approach based on its specific characteristics and computational demands. Grid search exhaustively evaluates all specified hyperparameter combinations, ensuring optimal configuration at a high computational cost. Random search provides a more efficient alternative by randomly sampling configurations, often achieving strong performance with reduced computational demands. Bayesian optimization refines the search iteratively by using prior evaluation results, enabling a focused and efficient exploration that can enhance model performance with fewer evaluations.
To prevent overfitting during tuning, regularization techniques and cross-validation were incorporated. Regularization helped control model complexity, while cross-validation assessed stability across different data subsets, ensuring robust generalization. Model performance was evaluated using the negative mean squared error metric, with configurations that minimized negative mean squared error metric retained as optimal. The final tuned hyperparameters for each model are detailed in Table 1.

3. Results and Discussion

3.1. Data Analysis

3.1.1. Statistical Analysis

After data processing, the refined machine learning database comprises 171 and 325 valid samples for DYS and PV, respectively. The summaries of the inputs and outputs of these valid mixtures are presented in Table 2 and Table 3. Figure 1 depicts the parameter distribution from the database. RCAC samples account for 86.0% (147 samples) for DYS and 82.5% (268 samples) for PV, while the remaining samples represent natural aggregate concrete as the control group.
As shown, the RCA’s Wssd has a P10–P90 range of 3.37–7.00% (median: 6.30%) for DYS and 5.05–6.96% (median: 6.96%) for PV. High Wssd values of RCA would increase the water demand in RCAC, thus exerting a significant influence on its rheological properties.
For DYS, the water content has a P10–P90 range of 168.0–240.0 kg/m3 (median: 200.7 kg/m3), while cement content has a P10–P90 range of 320.0–440.0 kg/m3 (median: 360.0 kg/m3). These medians result in the w/c ratio of 0.56. For PV, the water content has a P10–P90 range of 178.5–232.1 kg/m3 (median: 204.2 kg/m3), while cement content has a P10–P90 range of 320.0–440.0 kg/m3 (median: 400.0 kg/m3). These medians lead to the w/c ratio of 0.51. Moreover, over 94% of samples utilize SPs. The SP content has a P10–P90 range of 1.34–9.86 kg/m3 (median: 5.50 kg/m3) for DYS, and 1.60–9.86 kg/m3 (median: 3.48 kg/m3) for PV. Obviously, high w/c ratios (> 0.50) and high SP content emphasize the negative effects of RCA on the rheological performance of RCAC. Such effects may stem from the absorption characteristics, irregular shape, or adhered old mortar of RCA.
NCA and RCA exhibit distinctive content distributions. For DYS, the NCA content has a P10–P90 range of 327.0–1021.0 kg/m3 (median: 649.0 kg/m3), and RCA content has a P10–P90 range of 140.4–868.8 kg/m3 (median: 355.0 kg/m3). For PV, the NCA content has a P10–P90 range of 384.0–887.0 kg/m3 (median: 614.4 kg/m3), and RCA content has a P10–P90 range of 138.3–795.3 kg/m3 (median: 351.0 kg/m3). The lower RCA content than NCA indicates its partial replacement strategy. Due to the adverse effects of RCA on the strength of RCAC, the partial replacement of NCA with RCA can balance environmental benefits with mechanical properties.
In this database, OPC’s grades only involve 42.5 and 52.5. It may be attributed to structural concrete requirements, ensuring sufficient strength of RCAC. Additionally, FA is sparingly used, despite its benefits in enhancing workability. LF is the opposite. For DYS, the LF content has a P10–P90 range of 40.0–180.0 kg/m3 (median: 40.0 kg/m3). These median values bring about the ratio of LF to (LF + cement) is 10 wt.%, consistent with typical filler usage. It indicates common practices of using LF as a partial cement substitute to reduce carbon emissions.
Additionally, the measurement time has a P10–P90 range of 10–60 min (median: 16 min) for DYS and 10–90 min (median: 20 min) for PV. The DYS value presents a P10–P90 range of 4.09–214.0 Pa (median: 108.48 Pa), while the PV value depicts a P10–P90 range of 11.58–72.60 Pa·s (median: 36.10 Pa·s). The wide variability underscores the complexity of their relationships with input parameters, which cannot be fully captured through qualitative analysis alone.

3.1.2. Pearson and Spearman Analyses

Pearson and Spearman coefficient analyses were conducted for DYS and PV to further explore the relationships between input parameters and rheological properties. These analyses quantify the linear (Pearson) and rank-based (Spearman) correlations, providing deeper insights into the factors influencing RCAC performance. It is worth explaining that Pearson coefficient between two parameters (xi and yi) is determined based on their covariance and standard deviation (σx and σy), as shown in Equation (1). In contrast, Spearman’s coefficient is computed on the ranks of the variables (i.e., a monotonic association), as given in Equation (2).
ρ P e a r s o n = c o v ( X , Y ) σ x σ y = ( x i x ¯ ) ( y i y ¯ ) ( x i x ¯ ) 2 ( y i y ¯ ) 2
ρ S p e a r m a n = 1 6 i = 1 n ( R x i R y i ) 2 n ( n 2 1 )
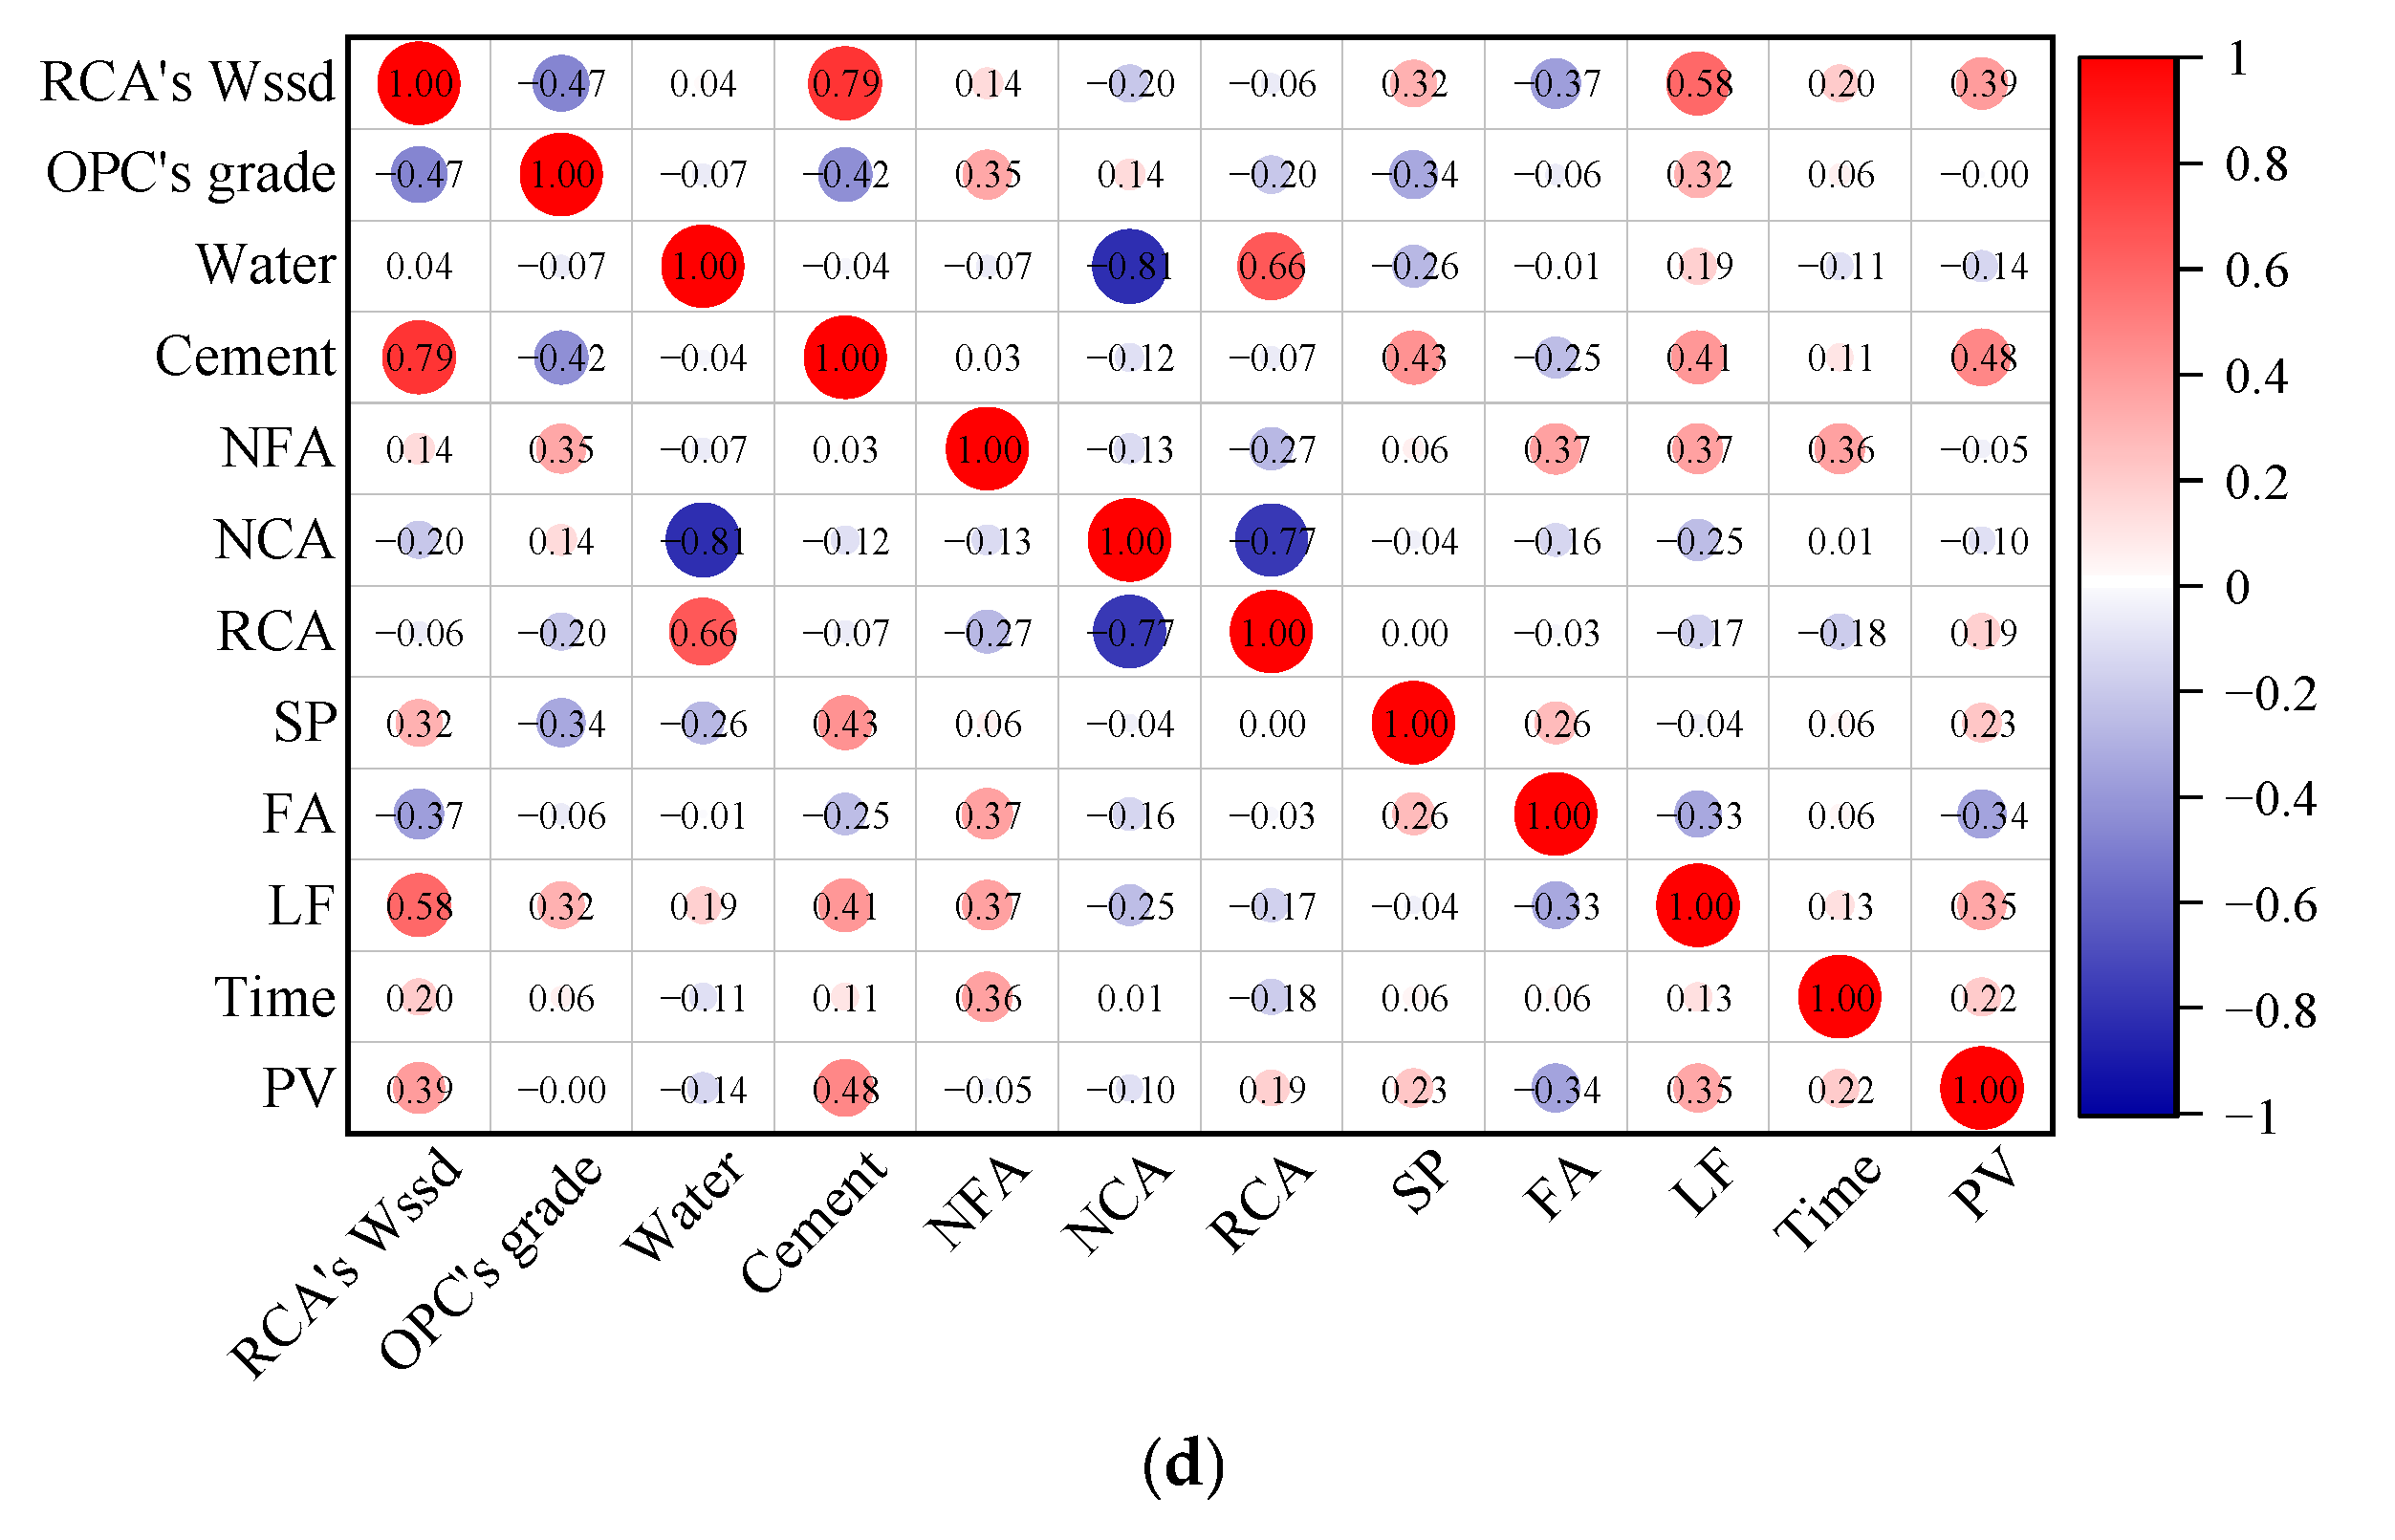
The results from Pearson and Spearman coefficient analyses are shown in Figure 2. A correlation coefficient r ranges from −1 to 1, values closer to ±1 indicate stronger associations, and negative values denote inverse relationships. Pearson coefficients measure linear relationships, while Spearman coefficients capture monotonic trends, accounting for non-linearities.
For DYS, the correlations with RCA’s Wssd are very weak (Pearson: −0.03, Spearman: −0.16), suggesting that the high water absorption of RCA has a limited impact on the stress needed to maintain flow. However, RCA’s Wssd shows moderate positive correlations with PV (Pearson: 0.42, Spearman: 0.39), indicating its significant role in increasing resistance to flow, likely due to increased paste viscosity resulting from higher effective water demand.
For DYS, cement and water contents show weak negative correlations (cement: Pearson: −0.25, Spearman: −0.20; water: Pearson: −0.27, Spearman: −0.30). It can be attributed to the fact that increased water content dilutes the cement paste, reducing cohesiveness, while higher cement content reduces interparticle friction due to lubrication effects derived from the paste. For PV, the trends reverse. Cement content demonstrates moderate positive correlations (Pearson: 0.42, Spearman: 0.48), highlighting its contribution to increased viscosity, while water content shows weak negative correlations (Pearson: −0.16, Spearman: −0.14), reflecting improved flowability with additional water.
Aggregate composition further differentiates the effects on DYS and PV. NFA content exhibits moderate negative correlations with DYS (Pearson: −0.33, Spearman: −0.48), indicating their role in reducing internal friction through better particle packing. Instead, NCA content shows moderate positive correlations with DYS (Pearson: 0.36, Spearman: 0.33), reflecting increased interparticle friction and structural interlock. Moreover, RCA content demonstrates weak correlations with DYS (Pearson: 0.07, Spearman: 0.17) and PV (Pearson: 0.21, Spearman: 0.19), highlighting its limited influence. It should be noted that indirect effects of RCA through water absorption and morphology may be evident.
The SP use emerges as a critical factor in controlling both DYS and PV. For DYS, SP content shows strong negative correlations (Pearson: −0.59, Spearman: −0.58), reflecting its effectiveness in reducing internal friction and improving flowability. For PV, SP content exhibits weak positive correlations (Pearson: 0.17, Spearman: 0.23), indicating its limited but notable role in balancing flow resistance through paste fluidization. FA and LF also contribute significantly. FA shows moderate negative correlations with DYS (Pearson: −0.44, Spearman: −0.46) and PV (Pearson: −0.29, Spearman: −0.34), underscoring its role in improving workability. LF exhibits moderate negative correlations with DYS (Pearson: −0.47, Spearman: −0.33) but moderate positive correlations with PV (Pearson: 0.33, Spearman: 0.35), suggesting its dual role as a fine filler enhancing paste viscosity while reducing yield stress.
Measurement time, which accounts for the potential time-dependent effects such as thixotropy, shows weak correlations with DYS (Pearson: −0.20, Spearman: −0.16) and PV (Pearson: 0.21, Spearman: 0.22). These weak correlations suggest that rheological properties may remain stable during the measurement process, with limited structural rebuilding or breakdown.
In summary, the correlation analysis highlights the multifaceted influences of input parameters on RCAC’s rheological properties. DYS is dominantly controlled by SP content, while PV is more sensitive to RCA’s Wssd and cement content. It should be noted that these correlations are limited in capturing complex, non-linear interactions and lack predictive capabilities. Hence, machine learning models are necessary to address these gaps.

3.2. Dynamic Yield Stress: Model Evaluation and Accuracy Assessment

The performance and predictive accuracy of machine learning models in estimating DYS for RCAC are evaluated. To quantitatively present these characteristics of the developed models, common evaluation metrics are used, i.e., the coefficient of determination (R2), Root Mean Squared Error (RMSE), and Mean Absolute Error (MAE), as defined in Equations (3)–(5):
R 2 = 1 i = 1 n ( y i y ^ i ) 2 i = 1 n ( y i y ¯ ) 2
R M S E = i = 1 n y i y ^ i 2 n
M A E = 1 n i = 1 n y i y ^ i
where y i , y ^ i , y ¯ , and n denote the measured value, the predicted value, the sample mean of the target, and the number of data points, respectively.
These metrics are computed based on the discrepancies between the measured values and their corresponding predicted values. Collectively, these metrics evaluate the accuracy, error magnitude, and overall reliability of each model in estimating the rheological properties of RCAC, with R2 value closer to 1 and lower RMSE and MAE values indicating a more precise predictive model.
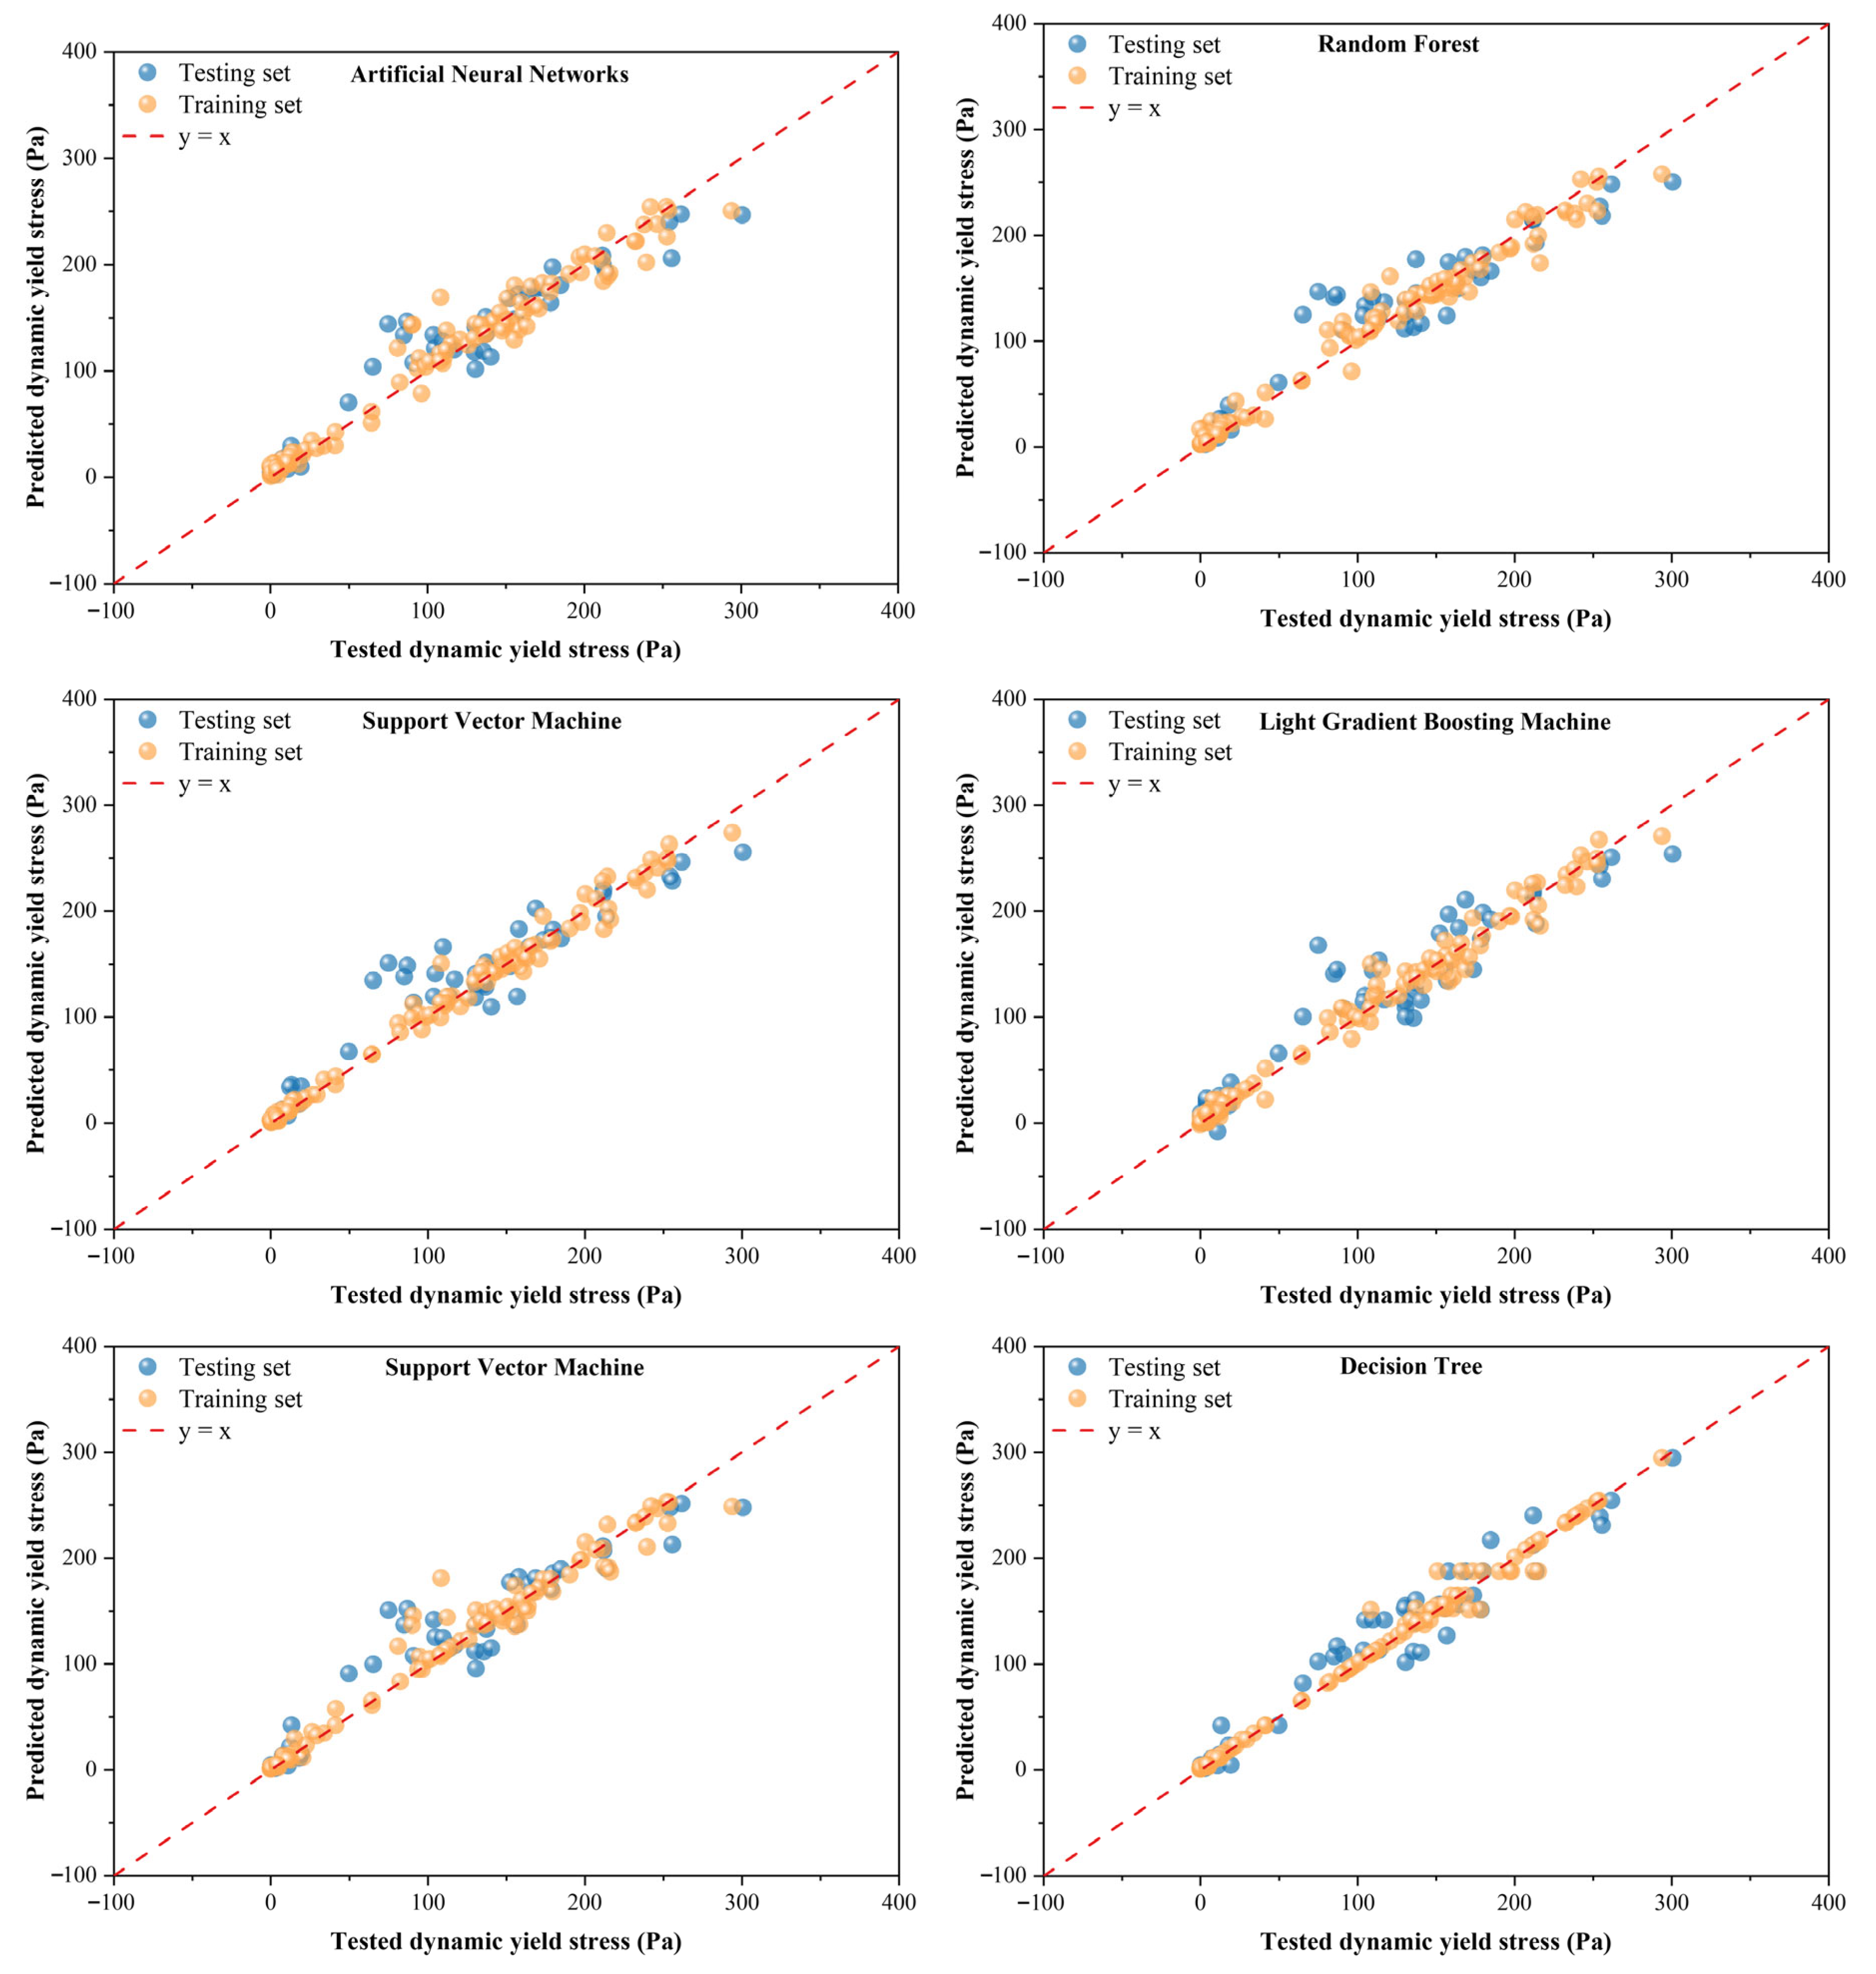
After determining the optimal hyperparameters for each machine learning algorithm, the predictive performance of the models for DYS was assessed using training and testing datasets. The evaluation metrics of six machine learning models toward different datasets, including R2, RMSE, and MAE, are detailed in Table 4. Figure 3 visualizes the above results. As shown, the X-axis represents the experimentally measured values of DYS, while the Y-axis denotes the values predicted by the models. The diagonal line in the figure represents the ideal scenario where the predicted values perfectly match the experimental results.
Among these, the DT model exhibited the best performance in predicting DYS, achieving the highest testing R2 of 0.9506 and the lowest RMSE (18.25) and MAE (13.99). The ANN model ranked second (testing R2 = 0.9285), followed by SVM (testing R2 = 0.9173), RF (testing R2 = 0.9142), XGBoost (testing R2 = 0.9067), and LightGBM (testing R2 = 0.8990). Training–testing gaps were smallest for DT and larger for boosting models, indicating varying susceptibility to overfitting under limited sample size (n = 171).
DYS is the stress required for a mixture to start and continue flowing, and it is governed by a small set of levers that change inter-particle friction, mainly SP content and water content (see Section 3.4.1). These levers often act in a threshold-like manner: once SP or water crosses a mixture-specific cut-point, the system flips from a non-workable state to a workable state. DT fits this pattern because it learns a few high-gain splits exactly at such cut-points, which explains its strong test performance with limited data. ANN ranks second, representing nonlinear couplings such as SP and water without hand-crafted thresholds. However, with only 171 DYS cases, ANN faces a bias–variance trade-off. Strong regularization can underfit near regime boundaries, while looser regularization can overfit tail cases. Hence, its errors remain slightly above DT. Boosting methods, including XGBoost and LightGBM, sequentially chase small residuals. In sparse regions such as the upper DYS tail (≥214 Pa, 90th percentile), this tendency can lead to overfitting and higher test errors. RF reduces variance. However, random feature subsetting can cause individual trees to miss decisive SP or water splits, which limits accuracy. SVM imposes smooth decision surfaces. It is competitive overall but less able to capture sharp regime shifts triggered by dosage changes, consistent with moderately larger RMSE and MAE than DT. In practice, when DYS is the target, models that capture a few critical thresholds generalize best, since aggregative learners become preferable only if sample coverage near regime boundaries is substantially increased.
In summary, for DYS, the empirical ranking (DT > ANN > SVM > RF > XGBoost > LightGBM) is consistent with control by a limited set of critical variables, favoring interpretable, rule-based learners over heavily aggregative ensembles when data are modest.

3.3. Plastic Viscosity: Model Evaluation and Accuracy Assessment

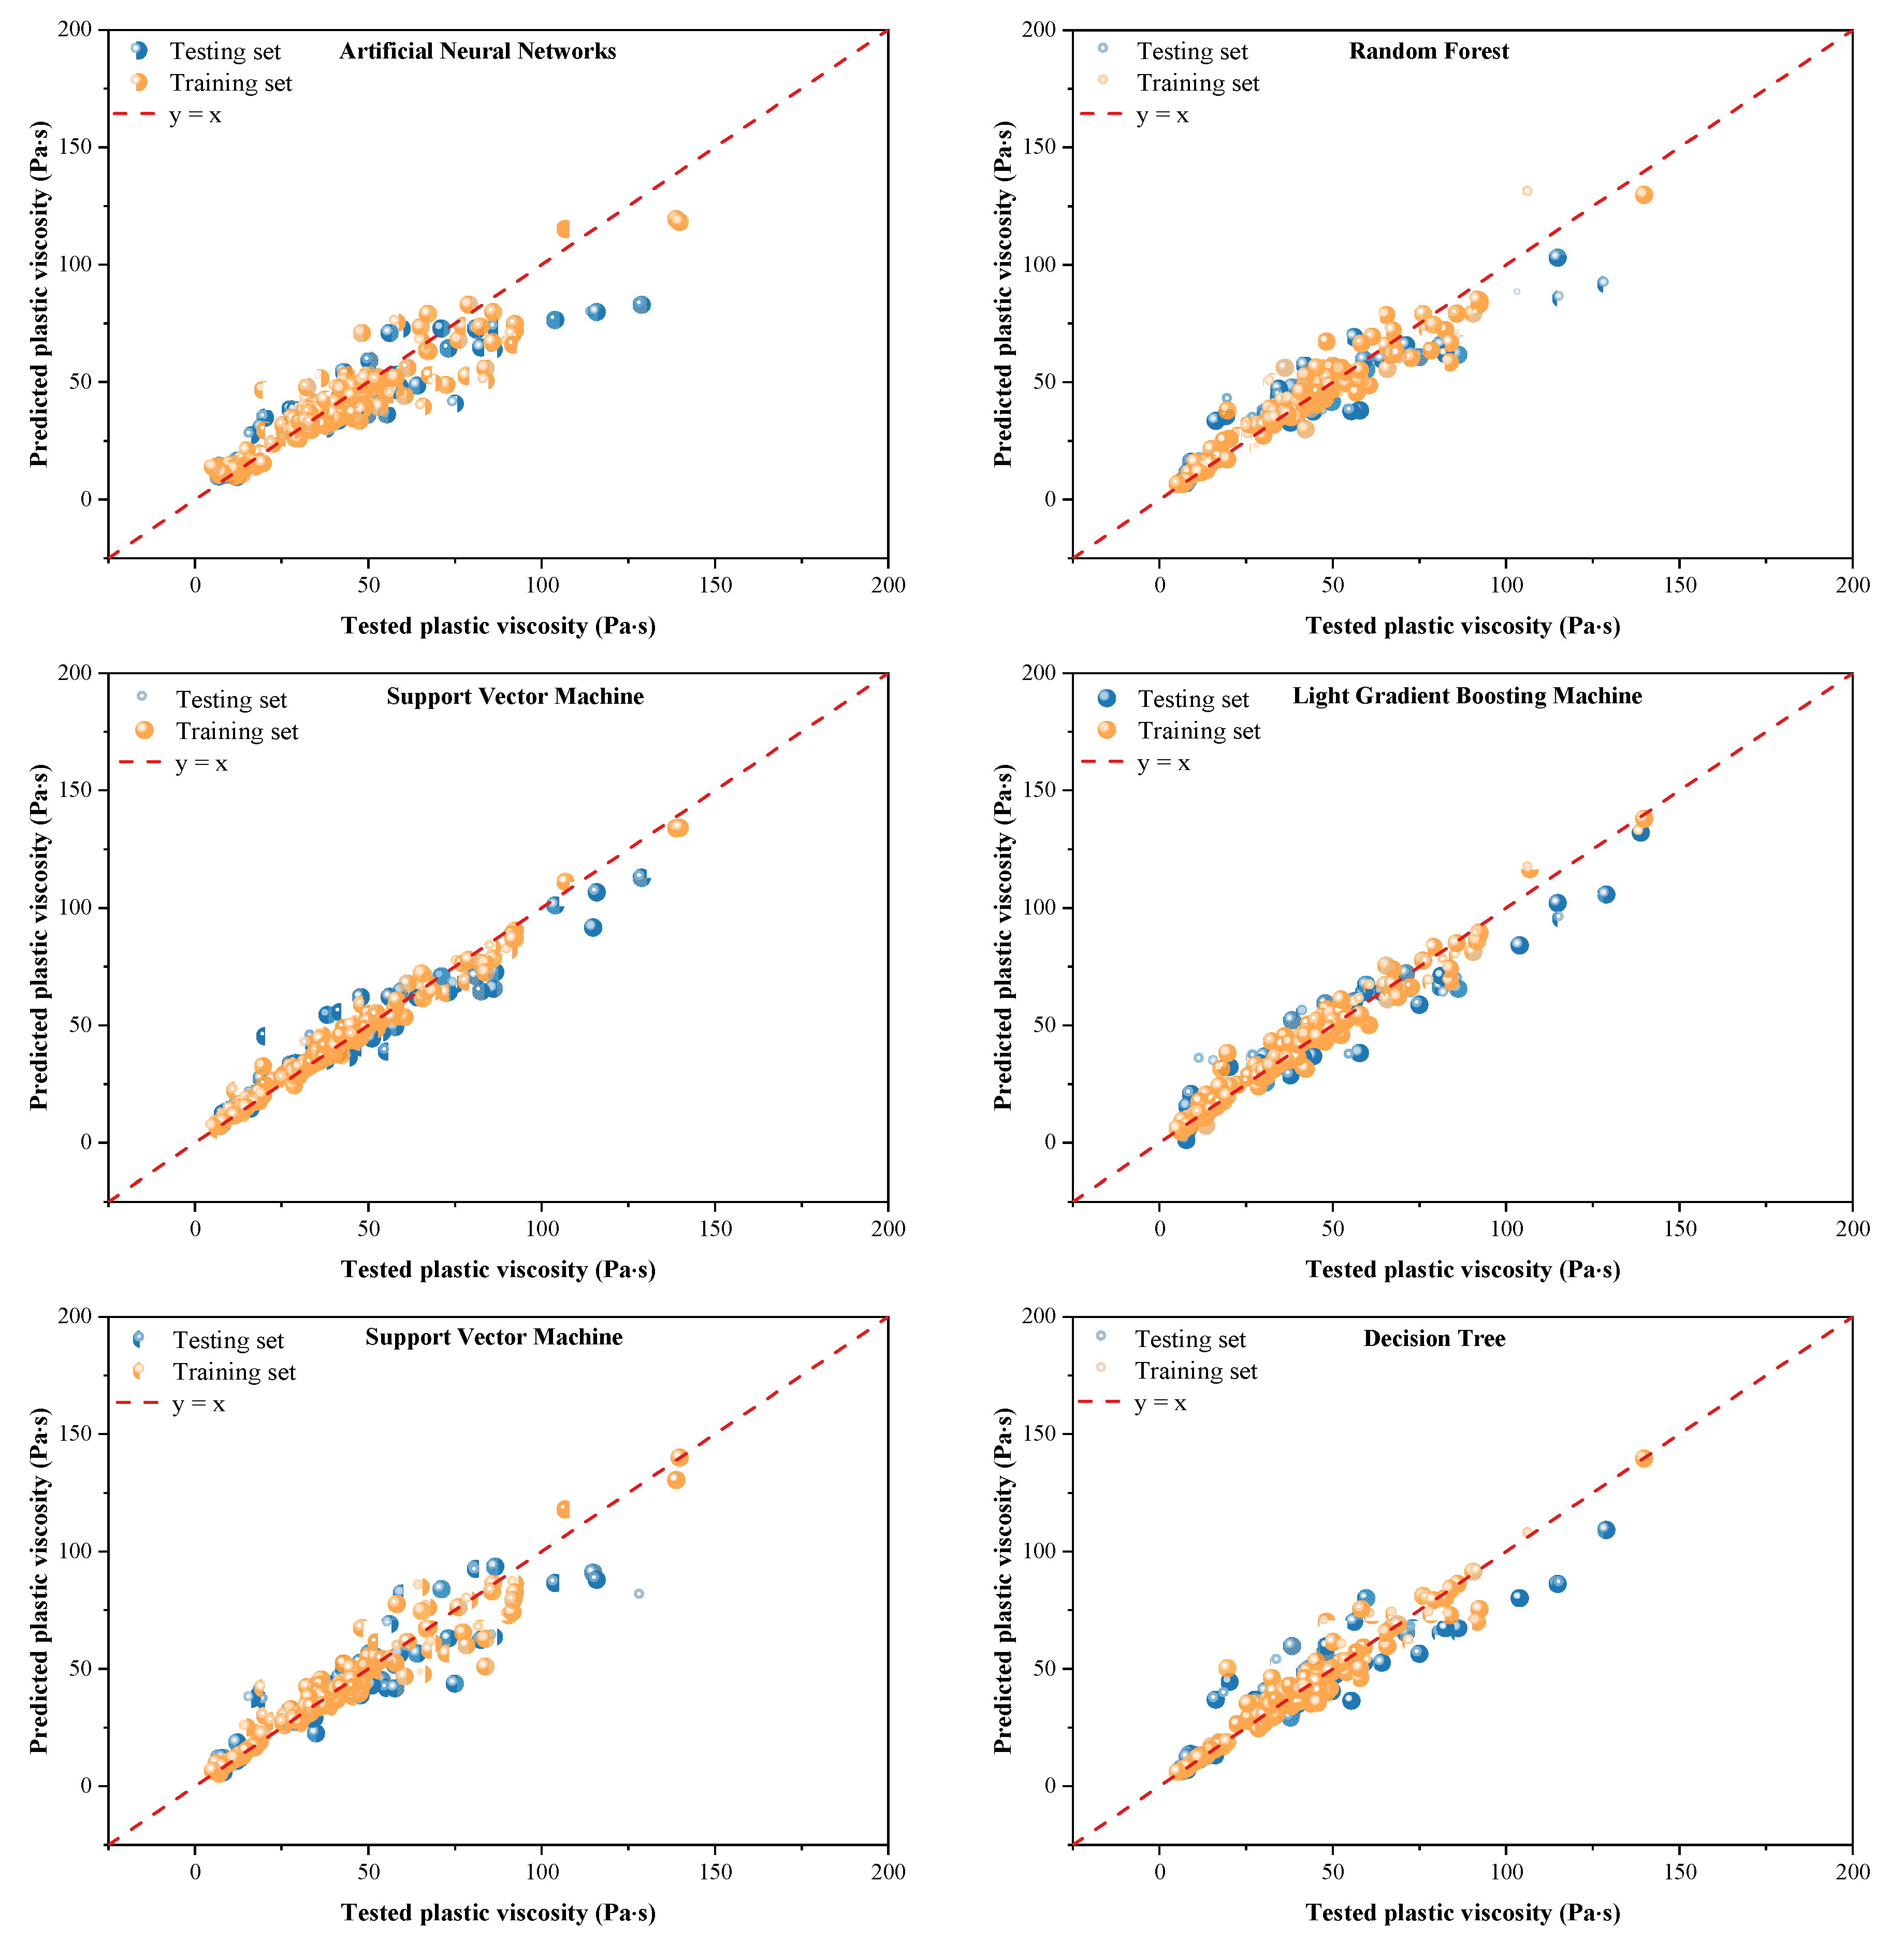
After determining the optimal hyperparameters for each machine learning algorithm, the performance and predictive accuracy of machine learning models in estimating PV for RCAC are also evaluated using training and testing datasets. The evaluation metrics of six machine learning models toward different datasets, including R2, RMSE, and MAE, are detailed in Table 5. Figure 4 visualizes the above results. The X-axis represents the experimentally measured values of PV, while the Y-axis denotes the values predicted by the models. Similarly, the diagonal line in the figure represents the ideal scenario where the predicted values perfectly match the experimental results.
XGBoost demonstrated the highest accuracy in predicting PV, achieving a testing R2 of 0.9298, RMSE of 7.06, and MAE of 4.58. LightGBM, while also leveraging gradient-boosting principles, achieved slightly lower accuracy (testing R2 = 0.8935, RMSE = 8.69, MAE = 6.06). RF (testing R2 = 0.8665) and DT (testing R2 = 0.8577) showed moderate accuracy, while SVM (testing R2 = 0.8487) and ANN (testing R2 = 0.8230) trailed.
PV reflects resistance under continuous shear and is governed by paste-controlled viscosity that accumulates from several medium-strength factors (see Section 3.4.2). Higher cement content increases solids volume and cohesion. Larger Wssd reduces effective free water and raises viscosity. Longer measurement time captures thixotropic rebuilding. Because influence is distributed across many inputs rather than dominated by a single threshold, boosted ensembles, such as XGBoost and LightGBM, are advantaged. By sequentially correcting residuals, they integrate cement, Wssd, water, time, and second-order interactions into accurate predictions, which aligns with their leading test performance. DT is less suitable because PV rarely hinges on a small number of high-gain splits. A single tree may fit local regions, but loses accuracy when effects are additive and diffuse. RF mitigates variance and is more robust than a single DT, while random feature subsetting can dilute attention to the most informative variables, which generates accuracy below boosting. SVM provides smooth function approximation and performs moderately well. However, it may fail to capture interaction terms without explicit features. ANN trails primarily because key morphology and grading descriptors (e.g., shape index) are absent. The network cannot fully exploit higher-order interactions and may regularize away weak signals. In practice, PV modeling benefits from aggregative learners and from features that approximate effective water and time dependence, and adding particle-level descriptors should further narrow the gap for ANN and SVM.
Overall, for PV, the empirical ranking (XGBoost > LightGBM > RF > DT > SVM > ANN) aligns with viscosity of the cumulative effect of multiple moderate factors, favoring aggregative learners.

3.4. Sensitivity/Significance/Importance Analysis

To understand the impact of individual features on the predictive models of RCAC, feature importance analysis was conducted using the XGBoost and DT models. These models were selected because they demonstrated the best predictive performance for DYS and PV, as indicated in Section 3.2 and Section 3.3, respectively. XGBoost uses a tree-based approach to evaluate the gain (or reduction in error) for each feature across multiple boosting rounds, aggregating these gains to quantify overall importance. In contrast, the DT model calculates feature importance based on how effectively each feature reduces the prediction error at each node split. These metrics help in understanding which features most significantly influence the target predictions and provide insight into how the input variables affect the rheological properties.

3.4.1. Importance Analysis for DYS

The feature-important results for DYS are presented in Figure 5. As shown, the SP content emerged as the most influential feature, with an importance score of 0.5974, underscoring its dominant role in controlling DYS. SP significantly reduces internal friction and cohesion within the concrete matrix, enabling better flow under dynamic conditions. The schematic diagram of this mechanism can be found in the previous literature [37]. This effect aligns with the primary definition of DYS as the stress required to maintain flow. By dispersing cement particles and reducing particle-particle interactions, SP enhances fluidity and offsets the adverse effects of RCA’s high water absorption. The high importance score reflects the necessity of SP in mitigating the rheological challenges posed by recycled aggregates.
The water content ranked as the second most important feature, with an importance score of 0.22068. Water content directly impacts the paste viscosity and the lubrication between particles, which are critical for maintaining flow. An optimal w/b ratio ensures sufficient cohesion while preventing excessive dilution, which could compromise the structural stability of RCAC. The significant role of water content aligns with the observation that DYS is highly sensitive to the balance between paste fluidity and aggregate interlock.
The NFA content exhibited a moderate importance score of 0.07986, reflecting its contribution to the overall workability of RCAC. NFA improves packing density and reduces interparticle voids, enhancing flowability under dynamic conditions. The moderate importance score suggests that while NFA positively influences DYS, its effect is secondary to SP and water content.
The measurement time (importance score: 0.0501) also plays a notable role, indicating the time-dependent nature of the stress required to maintain flow. Thixotropic effects, such as structural rebuilding within the cementitious matrix during rest periods, could influence the measured DYS. The importance of measurement time highlights the dynamic nature of RCAC’s rheological behavior, where time-dependent changes in paste structure can affect flow resistance.
Interestingly, features such as RCA’s Wssd (importance score: 0.02077), NCA content (0.02291), and RCA content (0.00811) had lower importance scores. RCA’s Wssd, while influencing water demand, appears to have a more indirect effect on DYS, likely mitigated by SP usage. Similarly, NCA and RCA content have less impact on flowability compared to fine aggregates or paste properties. The lower importance of RCA content reflects its partial replacement strategy, where its contribution to flow resistance is diluted by NFA and SP. Additionally, several features, including OPC grade, FA content, and LF content, exhibited negligible importance scores, almost 0. It may be attributed to the limited sample size or point distribution of obtained values (rather than interval distribution).
In summary, the DT model reveals that SP content and water content are the primary factors governing DYS in RCAC, as they directly influence the internal friction and cohesion of the matrix. This analysis underscores the importance of prioritizing SP dosage and water management in RCAC mix design to optimize its rheological properties. It is consistent with the analyses of Pearson and Spearman coefficients.
These results, combined with Section 3.2 results, indicate that DYS is dominated by a few critical thresholds: once SP and water reach mix-dependent cut-points, yield is overcome; remaining variables modulate but rarely overturn that regime.

3.4.2. Importance Analysis for PV

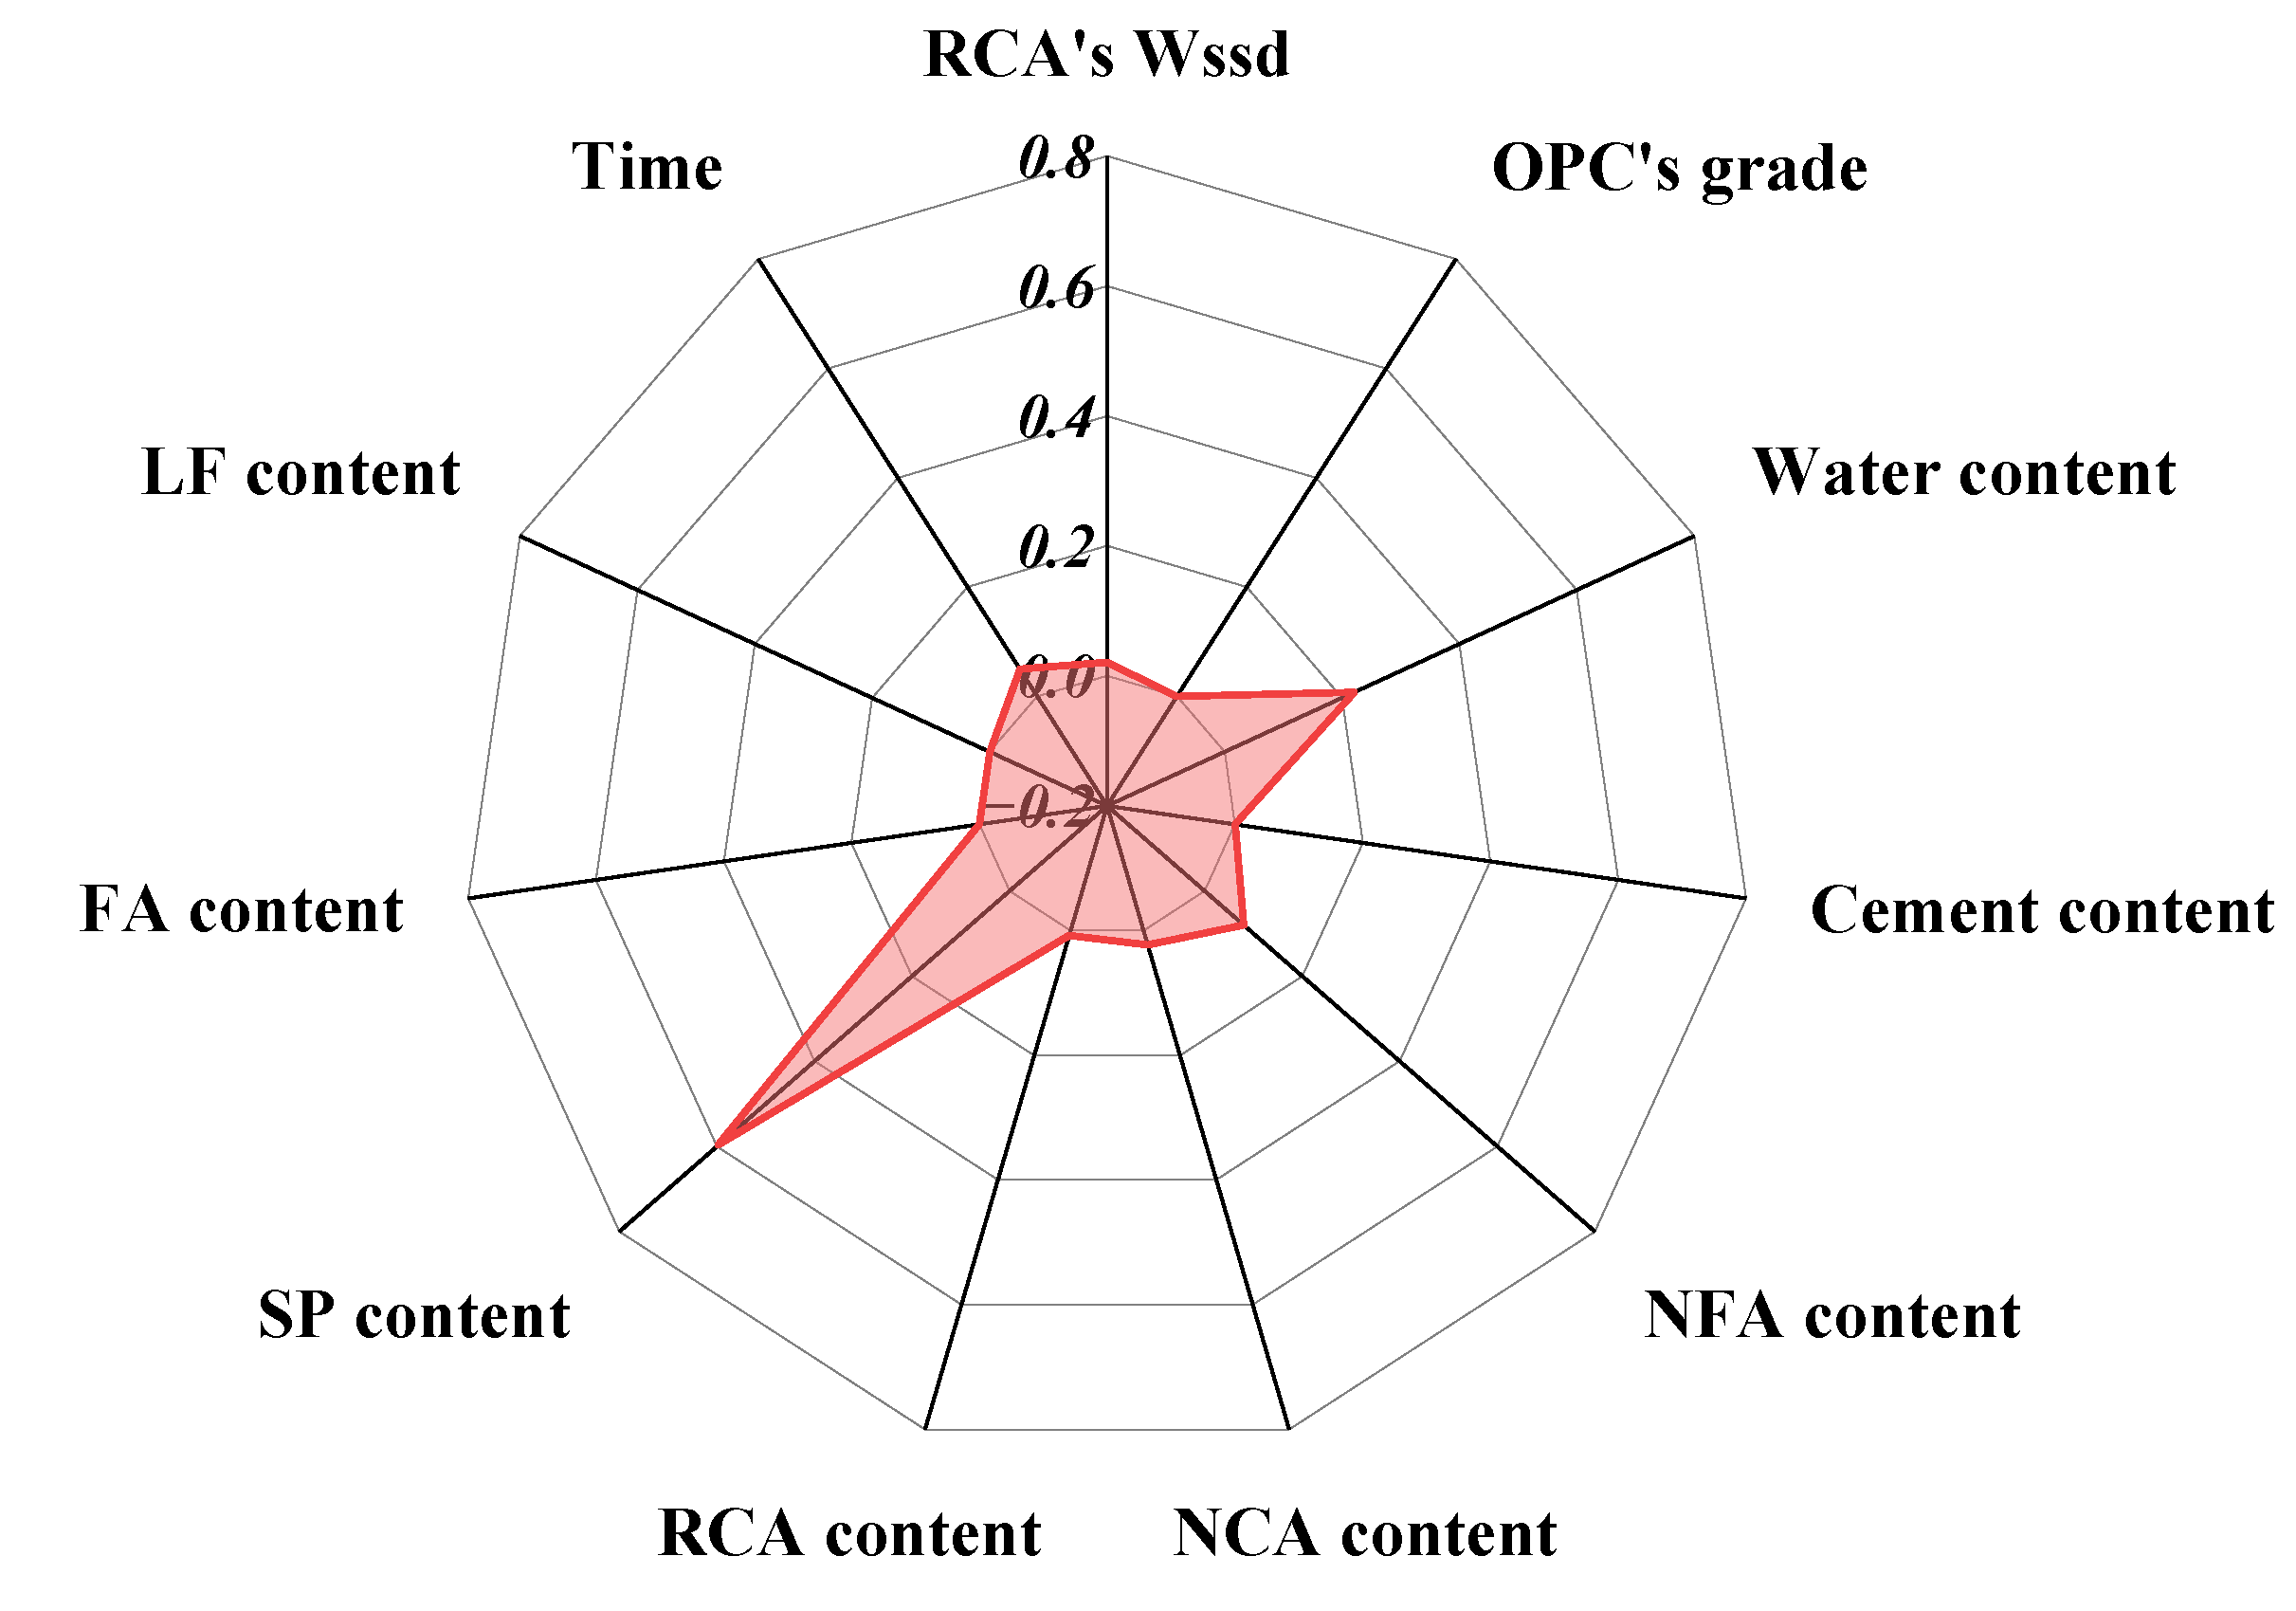
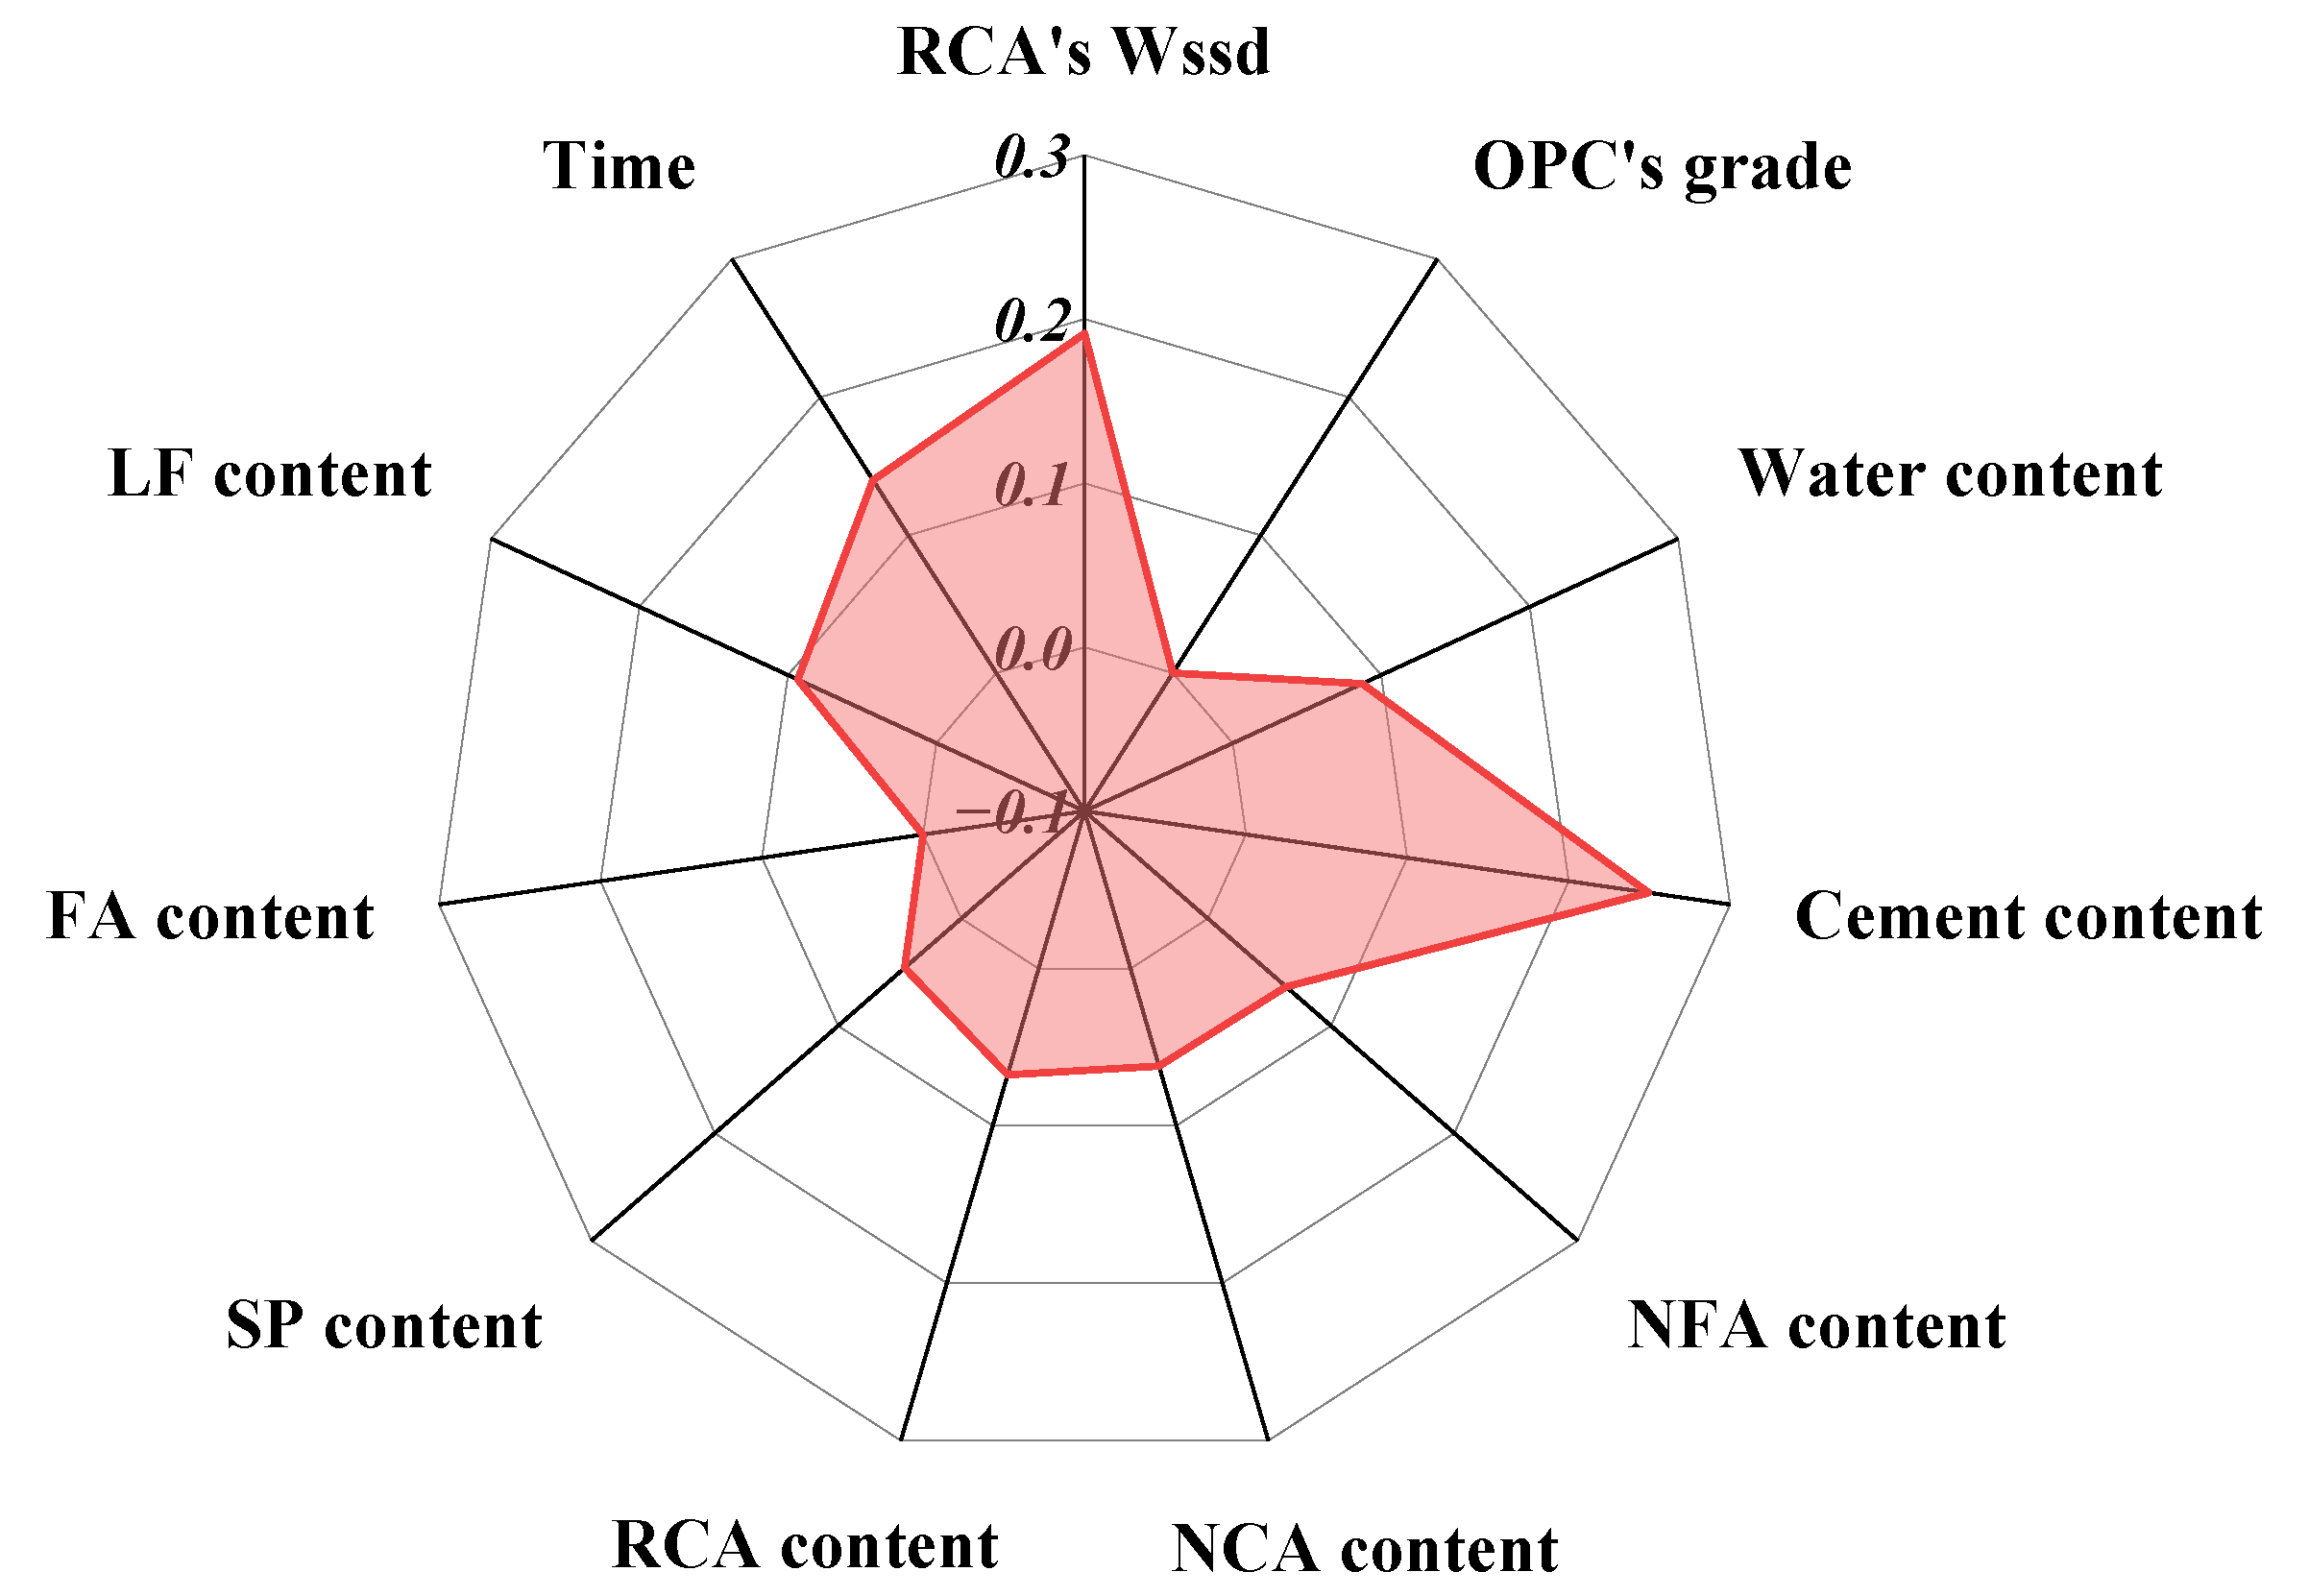
The feature-important results for PV are shown in Figure 6. As illustrated, cement content exhibited the highest importance score (0.24947), indicating its dominant influence on PV. Cement content directly determines the viscosity of the paste matrix by influencing the w/b ratio, hydration kinetics, and particle packing efficiency. A higher cement content typically increases the cohesion and viscosity of the paste, thereby elevating PV. The schematic diagram of this mechanism can be found in the previous literature [38]. This aligns with the fundamental definition of PV, since higher paste viscosity results in greater resistance to flow. The model’s prioritization of cement content underscores its integral role in governing the rheological properties of RCAC.
The RCA’s Wssd ranked second (importance score: 0.19124), emphasizing its critical role in determining effective water availability within the mix. RCA’s high Wssd leads to increased water absorption during mixing, reducing free water for lubrication and thus raising the viscosity of the cementitious matrix. This effect is particularly pronounced in RCAC, where RCA is known to exacerbate water demand due to its porosity and adhered old mortar. The high importance of Wssd reflects its indirect yet significant impact on PV through its influence on the paste’s consistency and lubrication capacity.
Measurement time, with an importance score of 0.13992, ranked third, highlighting the time-dependent behavior of PV. Prolonged measurement times may capture the thixotropic nature of cementitious systems, where structural rebuilding occurs during periods of rest. This phenomenon directly affects PV as the internal structure of the paste may resist flow more significantly over time. The importance of this parameter suggests that PV prediction models should account for time-dependent thixotropic effects, which are particularly relevant in practical scenarios such as pumping and casting.
Water content (0.08723) and LF content (0.09317) also contributed significantly to PV prediction. Water content plays a dual role: higher water content reduces PV by increasing fluidity, while insufficient water exacerbates particle-paste friction, elevating PV. LF, as a mineral additive, improves particle packing and reduces water demand, thereby enhancing paste consistency. However, excessive LF may increase PV due to its fineness and high surface area, which contribute to internal friction.
Interestingly, NFA and NCA contents exhibited relatively low importance scores (0.06344 and 0.06202, respectively). This suggests that while aggregates contribute to overall stability and cohesion, their role in determining PV is secondary compared to paste-related parameters like cement and water content. Similarly, RCA content (0.06747) ranked lower in importance, highlighting that RCA’s indirect effects, such as increased Wssd, are more critical than its direct content level. Additionally, OPC grade and FA content were assigned zero importance, indicating minimal influence on PV within this dataset. Similarly, it may be attributed to the limited sample size or point distribution of obtained values (rather than interval distribution).
In summary, cement content and RCA’s Wssd emerge as the most influential parameters, underscoring their critical roles in determining paste viscosity and particle-paste interactions. It is consistent with the analyses of Pearson and Spearman coefficients. Importantly, the XGBoost model supplements the significance of measurement time, i.e., time-dependent effects. These findings offer mechanistic insights into PV and emphasize the importance of optimizing paste properties to control the flow resistance in RCAC.
Together with Section 3.3 results, these results confirm that PV accrues from multiple paste-level processes, which explains why aggregative learners (boosting) best capture its rheological behavior.

4. Conclusions

Traditional prediction methods for RCAC’s rheology require extensive laboratory testing and cannot capture the interaction of parameters. Instead, machine learning models can address the above limitations in theory, but their applications to predict RCAC’s rheology have been rarely reported. Therefore, machine learning algorithms were applied to predict the DYS and PV of RCAC in this study. The database comprises 380 RCAC mixtures from 13 studies, with 11 input features. Six models were constructed and optimized. Model evaluations assessed prediction accuracy for the rheological properties of RCAC, and correlation and sensitivity analyses identified key influencing factors. The main findings and prospects are summarized as follows:
(1)
The DT model demonstrated the best predictive performance for DYS, achieving the highest testing R2 of 0.9506. Accordingly, DT is the preferred model for DYS on small datasets, leveraging the full dataset while capturing hierarchical and nonlinear interactions with minimal overfitting. The ANN model ranked second with a testing R2 of 0.9285. SVM and ensemble models, including RF, XGBoost, and LightGBM, exhibited moderate to strong performance, with testing R2 values ranging from 0.8990 to 0.9173.
(2)
The XGBoost model excelled in predicting RCAC’s PV, achieving the highest testing R2 of 0.9298. Therefore, XGBoost is the recommended choice for PV, reflecting superior capture of multiple paste-level interactions that govern viscosity. LightGBM also performed well, with a testing R2 of 0.8935. Simpler models, including DT and RF, achieved moderate predictive accuracy, with testing R2 values of 0.8577 and 0.8665, respectively. SVM and ANN showed lower predictive capabilities, with testing R2 values falling below 0.85.
(3)
As identified by the DT model, SP content and water content (i.e., w/b ratios) are the most influential factors for RCAC’s DYS. Thus, adjusting SP content and w/b ratio is the most effective lever for controlling DYS. For PV, cement content and RCA’s Wssd emerged as the dominant parameters in the XGBoost model, confirming that cement content and RCA absorption govern paste lubrication and viscosity. These conclusions are corroborated by the Pearson and Spearman coefficient analyses. The observed time-dependent effect on PV confirms the dynamic nature of RCAC rheology as indicated by feature importance.
(4)
Future research should focus on expanding the database, particularly for predicting DYS, to improve model generalization and reliability. The apparently small effects of FA, LF, and cement strength grade likely reflect data limitations rather than intrinsic irrelevance. Current samples are limited and unevenly distributed, with missing intermediate levels. Addressing these limitations by incorporating more samples with evenly distributed parameter values could better capture their true influence on RCAC’s rheological properties.

Author Contributions

Conceptualization, H.C.; methodology, H.C. and W.L.; formal analysis, H.C., W.L. and T.Y.; data curation, H.C.; Software, H.C.; writing—original draft, H.C. and W.L.; writing—review & editing, H.C., W.L. and T.Y.; validation, H.C.; visualization, H.C. All authors have read and agreed to the published version of the manuscript.

Funding

This research received no external funding.

Institutional Review Board Statement

Not applicable.

Informed Consent Statement

Not applicable.

Data Availability Statement

The data presented in this study are available in the previous studies (see Section 2.1), or the data presented in this study are available upon request.

Conflicts of Interest

The authors declare no conflicts of interest.

References

  1. Maglad, A.M.; Mansour, W.; Tayeh, B.A.; Elmasry, M.; Yosri, A.M.; Fayed, S. Experimental and analytical investigation of fracture characteristics of steel fiber-reinforced recycled aggregate concrete. Int. J. Concr. Struct. Mater. 2023, 17, 74. [Google Scholar] [CrossRef]
  2. Mansour, W.; Li, W.; Wang, P.; Badawi, M. Experimental and numerical evaluations of the shear performance of recycled aggregate RC beams strengthened using CFRP sheets. Eng. Struct. 2024, 301, 117368. [Google Scholar] [CrossRef]
  3. Wu, Y.W.; Liu, C.; Liu, H.W.; Zhang, Z.Z.; He, C.H.; Liu, S.H.; Zhang, R.F.; Wang, Y.Q.; Bai, G.L. Study on the rheology and buildability of 3D printed concrete with recycled coarse aggregates. J. Build. Eng. 2021, 42, 103030. [Google Scholar] [CrossRef]
  4. Zou, S.; Xiao, J.Z.; Duan, Z.H.; Ding, T.; Hou, S.D. On rheology of mortar with recycled fine aggregate for 3D printing. Constr. Build. Mater. 2021, 311, 125312. [Google Scholar] [CrossRef]
  5. Hou, S.D.; Duan, Z.H.; Xiao, J.Z.; Li, L.; Bai, Y.H. Effect of moisture condition and brick content in recycled coarse aggregate on rheological properties of fresh concrete. J. Build. Eng. 2021, 35, 102075. [Google Scholar] [CrossRef]
  6. Singh, R.B.; Singh, B. Rheology of High-Volume Fly Ash Self-Compacting Recycled Aggregate Concrete. J. Mater. Civil. Eng. 2021, 33, 04021280. [Google Scholar] [CrossRef]
  7. González-Taboada, I.; González-Fonteboa, B.; Martínez-Abella, F.; Roussel, N. Robustness of self-compacting recycled concrete: Analysis of sensitivity parameters. Mater. Struct. 2018, 51, 537–546. [Google Scholar] [CrossRef]
  8. Iris, G.T.; Belén, G.F.; Fernando, M.A.; Diego, C.L. Self-compacting recycled concrete: Relationships between empirical and rheological parameters and proposal of a workability box. Constr. Build. Mater. 2017, 143, 537–546. [Google Scholar] [CrossRef]
  9. Safhi, A.E.; Dabiri, H.; Soliman, A.; Khayat, K.H. Prediction of self-consolidating concrete properties using XGBoost machine learning algorithm: Rheological properties. Powder Technol. 2024, 438, 119623. [Google Scholar] [CrossRef]
  10. Miao, Y.; Lau, S.S.Y.; Lo, K.K.N.; Song, Y.; Lai, H.; Zhang, J.; Tao, Y.; Fan, Y. Harnessing climate variables for predicting PV power output: A backpropagation neural network analysis in a subtropical climate region. Sol. Energy 2023, 264, 111979. [Google Scholar] [CrossRef]
  11. Miao, Y.; Liu, P.; Fu, I.C.S.; Lei, Q.; Lau, S.S.Y.; Tao, Y. The study of architectural geometry and shape in the energy balance of glazed roofs. Buildings 2022, 12, 1550. [Google Scholar] [CrossRef]
  12. Bu, L.T.; Du, G.Q.; Hou, Q. Prediction of the Compressive Strength of Recycled Aggregate Concrete Based on Artificial Neural Network. Materials 2021, 14, 3921. [Google Scholar] [CrossRef] [PubMed]
  13. Liu, K.H.; Zou, C.Y.; Zhang, X.C.; Yan, J.C. Innovative prediction models for the frost durability of recycled aggregate concrete using soft computing methods. J. Build. Eng. 2021, 34, 101822. [Google Scholar] [CrossRef]
  14. Liu, K.H.; Alam, M.S.; Zhu, J.; Zheng, J.K.; Chi, L. Prediction of carbonation depth for recycled aggregate concrete using ANN hybridized with swarm intelligence algorithms. Constr. Build. Mater. 2021, 301, 124382. [Google Scholar] [CrossRef]
  15. Jin, L.B.; Dong, T.Y.; Fan, T.; Duan, J.; Yu, H.L.; Jiao, P.F.; Zhang, W.B. Prediction of the chloride diffusivity of recycled aggregate concrete using artificial neural network. Mater. Today Commun. 2022, 32, 104137. [Google Scholar] [CrossRef]
  16. Liu, K.H.; Zheng, J.K.; Pacheco-Torgal, F.; Zhao, X.Y. Innovative modeling framework of chloride resistance of recycled aggregate concrete using ensemble-machine-learning methods. Constr. Build. Mater. 2022, 337, 127613. [Google Scholar] [CrossRef]
  17. Liu, K.H.; Dai, Z.H.; Zhang, R.B.; Zheng, J.K.; Zhu, J.; Yang, X.C. Prediction of the sulfate resistance for recycled aggregate concrete based on ensemble learning algorithms. Constr. Build. Mater. 2022, 317, 125917. [Google Scholar] [CrossRef]
  18. Deng, Q.; Xiao, J.Z.; Duan, Z.H.; Li, L.; Guan, X.S. An intelligent mix design system for sustainable concrete containing multi-source recycled aggregate. J. Build. Eng. 2024, 96, 110566. [Google Scholar] [CrossRef]
  19. Duan, Z.H.; Zhao, W.J.; Ye, T.H.; Zhang, Y.H.; Zhang, C.C. Measurement of Water Absorption of Recycled Aggregate. Materials 2022, 15, 5141. [Google Scholar] [CrossRef]
  20. González-Taboada, I.; González-Fonteboa, B.; Martínez-Abella, F.; Carro-López, D. Study of recycled concrete aggregate quality and its relationship with recycled concrete compressive strength using database analysis. Mater. Construc. 2016, 66, 323. [Google Scholar] [CrossRef]
  21. Miao, Y.; Chau, K.W.; Lau, S.S.Y.; Ye, T. A novel thermal comfort model modified by time scale and habitual trajectory. Renew. Sustain. Energy Rev. 2025, 207, 114903. [Google Scholar] [CrossRef]
  22. Du, Z.; Liu, Y.; Zhang, Z. Spatiotemporal analysis of influencing factors of carbon emission in public buildings in China. Buildings 2022, 12, 424. [Google Scholar] [CrossRef]
  23. Amario, M.; Pepe, M.; Martinelli, E.; Toledo, R.D. Rheological Behavior at Fresh State of Structural Recycled Aggregate Concrete. High. Tech. Concr. Where Technol. Eng. Meet. 2018, 215–223. [Google Scholar]
  24. Amario, M.; Pepe, M.; Rangel, C.S.; Toledo, R.D. Analytical tool for assessment of the rheological behavior of recycled aggregate concrete. Constr. Build. Mater. 2021, 309, 125166. [Google Scholar] [CrossRef]
  25. Amer, A.A.M.; Ezziane, K.; Bougara, A.; Adjoudj, M. Rheological and mechanical behavior of concrete made with pre-saturated and dried recycled concrete aggregates. Constr. Build. Mater. 2016, 123, 300–308. [Google Scholar] [CrossRef]
  26. Bizinotto, M.B.; Faleschini, F.; Fernández, C.G.J.; Hernández, D.F.A. Effects of chemical admixtures on the rheology of fresh recycled aggregate concretes. Constr. Build. Mater. 2017, 151, 353–362. [Google Scholar] [CrossRef]
  27. Faleschini, F.; Jiménez, C.; Barra, M.; Aponte, D.; Vázquez, E.; Pellegrino, C. Rheology of fresh concretes with recycled aggregates. Constr. Build. Mater. 2014, 73, 407–416. [Google Scholar] [CrossRef]
  28. González-Taboada, I.; González-Fonteboa, B.; Eiras-López, J.; Rojo-López, G. Tools for the study of self-compacting recycled concrete fresh behaviour: Workability and rheology. J. Clean. Prod. 2017, 156, 1–18. [Google Scholar] [CrossRef]
  29. González-Taboada, I.; González-Fonteboa, B.; Martínez-Abella, F.; Seara-Paz, S. Analysis of rheological behaviour of self-compacting concrete made with recycled aggregates. Constr. Build. Mater. 2017, 157, 18–25. [Google Scholar] [CrossRef]
  30. González-Taboada, I.; González-Fonteboa, B.; Martínez-Abella, F.; Seara-Paz, S. Evaluation of self-compacting recycled concrete robustness by statistical approach. Constr. Build. Mater. 2018, 176, 720–736. [Google Scholar] [CrossRef]
  31. Güneyisi, E.; Gesoglu, M.; Algin, Z.; Yazici, H. Rheological and fresh properties of self-compacting concretes containing coarse and fine recycled concrete aggregates. Constr. Build. Mater. 2016, 113, 622–630. [Google Scholar] [CrossRef]
  32. Mandal, R.; Panda, S.K.; Nayak, S. Evaluation of rheological properties of sustainable self-compacting recycled aggregate concrete produced by two-stage mixing approach. J. Build. Eng. 2024, 87, 109126. [Google Scholar] [CrossRef]
  33. Tahar, Z.E.A.; Benabed, B.; Kadri, E.; Ngo, T.T.; Bouvet, A. Rheology and strength of concrete made with recycled concrete aggregates as replacement of natural aggregates. Epitoanyag 2020, 72, 48–58. [Google Scholar] [CrossRef]
  34. Duan, Z.; Jiang, S.; Xiao, J.; Hou, S.; Chen, X. Effect of Moisture Condition of Recycled Coarse Aggregate on the Properties of Concrete (in Chinese). J. Build. Mater. 2021, 24, 545–550. [Google Scholar]
  35. Yang, L.; Shami, A. On hyperparameter optimization of machine learning algorithms: Theory and practice. Neurocomputing 2020, 415, 295–316. [Google Scholar] [CrossRef]
  36. Bischl, B.; Binder, M.; Lang, M.; Pielok, T.; Richter, J.; Coors, S.; Thomas, J.; Ullmann, T.; Becker, M.; Boulesteix, A.L.; et al. Hyperparameter optimization: Foundations, algorithms, best practices, and open challenges. Wires Data Min. Knowl. 2023, 13, e1484. [Google Scholar] [CrossRef]
  37. Feng, H.; Feng, Z.; Wang, W.; Deng, Z.; Zheng, B. Impact of polycarboxylate superplasticizers (PCEs) with novel molecular structures on fluidity, rheological behavior and adsorption properties of cement mortar. Constr. Build. Mater. 2021, 292, 123285. [Google Scholar] [CrossRef]
  38. Xie, J.; Cui, X.; Guo, N.; Liu, G. Influence of mix proportions on rheological properties, air content of wet shotcrete—A case study. Appl. Sci. 2021, 11, 3550. [Google Scholar] [CrossRef]
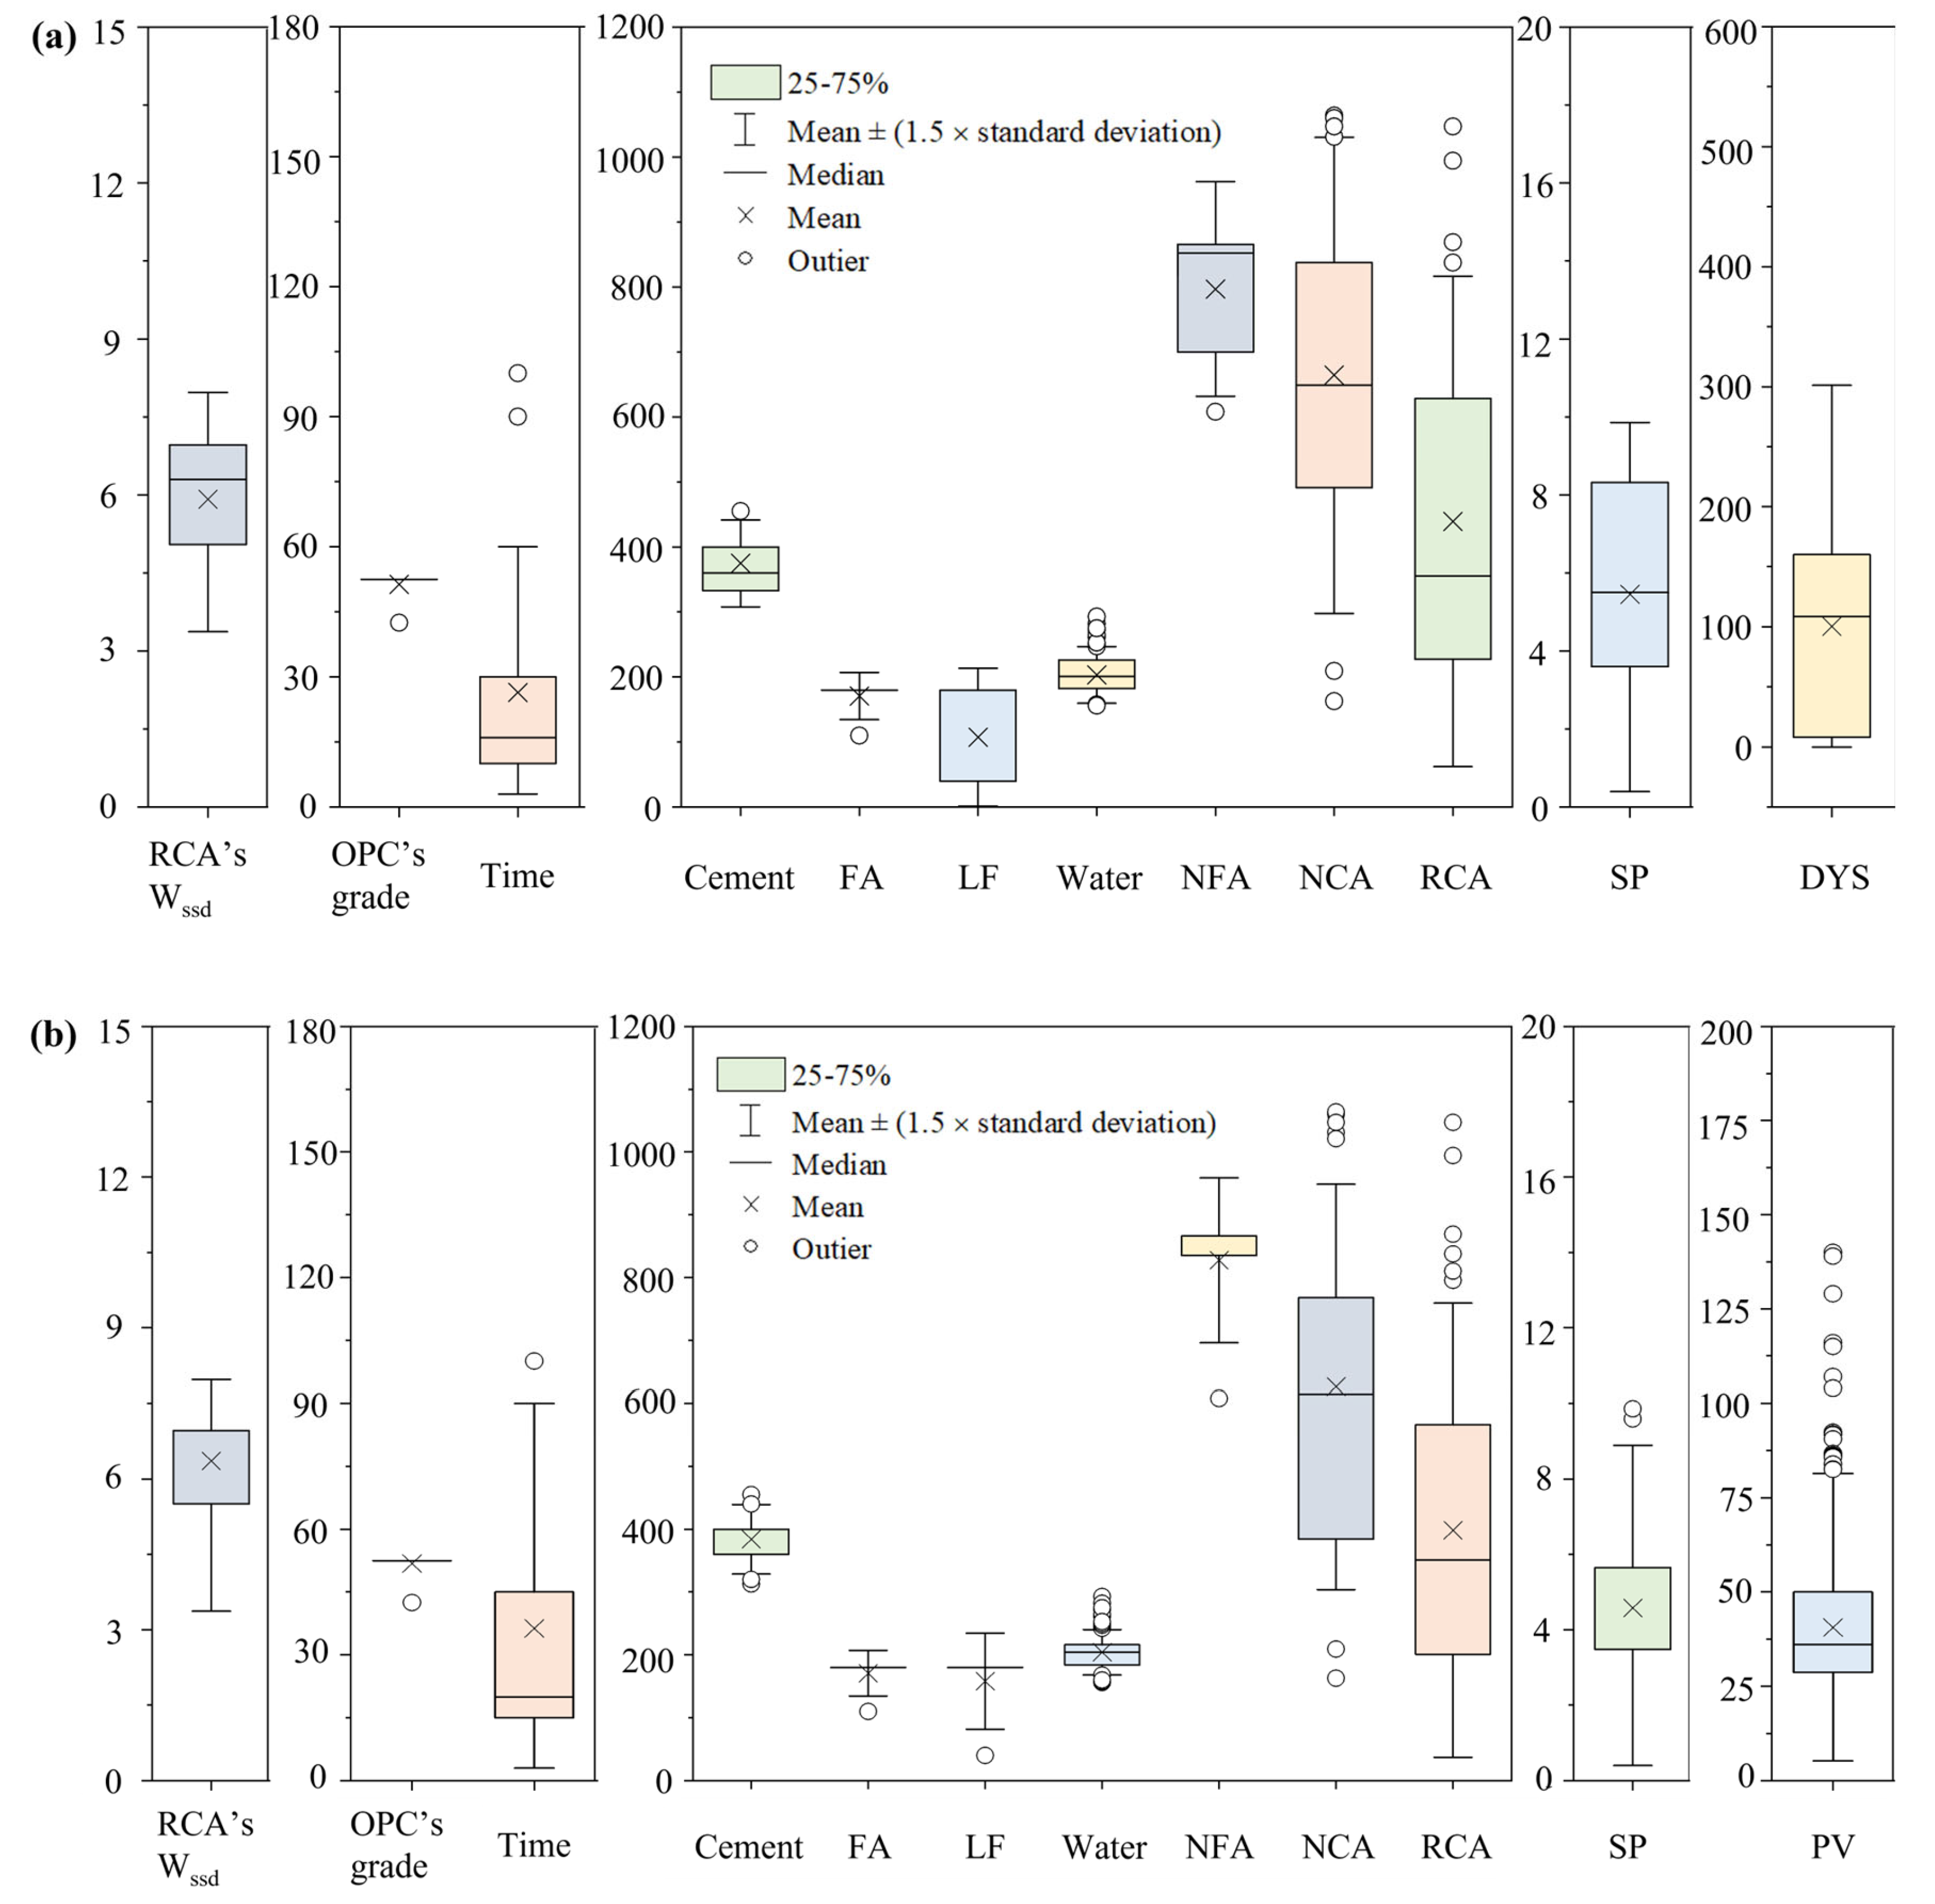
Figure 1. Boxplot distribution of input and output parameters for predicting DYS (a) and PV (b).
Buildings 15 03353 g001
Figure 2. Matrices of Pearson coefficients for DYS (a) and PV (b), and Spearman coefficients for DYS (c) and PV (d).
Buildings 15 03353 g002aBuildings 15 03353 g002b
Figure 3. Predicted dynamic yield stress results of machine learning models.
Buildings 15 03353 g003
Figure 4. Predicted plastic viscosity results of machine learning models.
Buildings 15 03353 g004
Figure 5. Feature importance for DYS based on the DT model.
Buildings 15 03353 g005
Figure 6. Feature importance for PV based on the XGBoost model.
Buildings 15 03353 g006
Table 1. Optimized hyperparameters for machine learning models.
ModelHyperparameterDYSPV
ANNLearning rate0.0010.001
Activation‘relu’‘relu’
Hidden_layer_sizes[32, 16][32, 16]
RFn_estimators149247
Max_depth4512
Min_samples_split46
Min_samples_leaf11
XGBoostLearning rate0.140.02
Max_depth332
Gamma45
n_estimators84266
subsample0.990.5
LightGBMLearning rate0.190.16
max_depth4011
n_estimators257335
subsample10.93
SVMdegree34
epsilon0.10.001
gamma‘scale’‘scale’
C1000100
Kernel‘rbf’‘poly’
DTmax_depth910
min_samples_split23
min_samples_leaf13
Table 2. Summary statistics of input and output parameters for predicting DYS.
ParameterSample SizeMeanMin.MedianMax.P10P90
InputsRCA’s Wssd1475.913.376.307.973.377.00
OPC’s grade17151.342.552.552.542.552.5
Water171203.3156.0200.7292.9168.0240.0
Cement171374.6313.0360.0455.0320.0440.0
NFA171796.9608.0852.0944.0608.0944.0
NCA138664.1163.0649.01064.0327.01021.0
RCA147439.3121.9355.01047.0140.4868.8
SP1625.450.405.509.861.349.86
FA23170.9110.0180.0180.0110.0180.0
LF60107.740.040.0180.040.0180.0
Time171263161001060
OutputsDYS171100.310108.48301.204.09214.00
Note: P10 and P90 denote the 10th and 90th percentiles.
Table 3. Summary statistics of input and output parameters for predicting PV.
ParameterSample SizeMeanMin.MedianMax.P10P90
InputsRCA’s Wssd2686.363.376.967.975.056.96
OPC’s grade32551.842.552.552.552.552.5
Water325204.3156.0204.2292.9178.5232.1
Cement325383.8313.0400.0455.0320.0440.0
NFA325827.6608.0866.0944.0700.0880.0
NCA266626.3163.0614.41064.0384.0887.0
RCA268398.1121.9351.01047.0138.3795.3
SP3164.580.403.489.861.609.86
FA23170.9110.0180.0180.0110.0180.0
LF199158.240.0180.0180.040.0180.0
Time325363201001090
OutputsPV32540.595.2336.10140.0011.5872.60
Table 4. Evaluation metrics of models for predicting DYS.
ModelDatasetR2RMSEMAE
ANNTraining0.970214.509.26
Testing0.928521.9715.40
RFTraining0.97927.977.87
Testing0.914212.1416.78
XGBoostTraining0.98928.735.57
Testing0.906725.0916.62
LightGBMTraining0.984510.477.01
Testing0.899026.1019.50
SVMTraining0.974013.556.44
Testing0.917323.6215.58
DTTraining0.99147.803.03
Testing0.950618.2513.99
Table 5. Evaluation metrics of models for predicting PV.
ModelDatasetR2RMSEMAE
ANNTraining0.87508.595.76
Testing0.823011.207.51
RFTraining0.94175.873.81
Testing0.86659.736.48
XGBoostTraining0.98403.081.97
Testing0.92987.064.58
LightGBMTraining0.97094.152.79
Testing0.89358.696.06
SVMTraining0.93486.213.27
Testing0.848710.366.60
DTTraining0.95035.423.04
Testing0.857710.057.03
Disclaimer/Publisher’s Note: The statements, opinions and data contained in all publications are solely those of the individual author(s) and contributor(s) and not of MDPI and/or the editor(s). MDPI and/or the editor(s) disclaim responsibility for any injury to people or property resulting from any ideas, methods, instructions or products referred to in the content.