Article

Analysis and Research on Thermal Insulation Performance of Autoclaved Aerated Concrete Sandwich Perimeter Wall in Hot-Summer and Cold-Winter Regions Under Low Temperature Environment

1
College of Architecture and Civil Engineering, West Anhui University, Lu’an 237012, China
2
School of Intelligent Construction and Transportation Engineering, Hefei University, Hefei 230601, China
3
School of Civil & Environmental Engineering and Geography Science, Ningbo University, Ningbo 315211, China
4
College of Civil Engineering, Anhui Jianzhu University, Hefei 230601, China
*
Author to whom correspondence should be addressed.
Buildings 2025, 15(18), 3332; https://doi.org/10.3390/buildings15183332
Submission received: 24 July 2025 / Revised: 3 September 2025 / Accepted: 8 September 2025 / Published: 15 September 2025
(This article belongs to the Section Building Materials, and Repair & Renovation)

Abstract

This study examines the dynamic response of autoclaved aerated concrete (AAC) under solar radiation and ambient temperature coupling. A comparative analysis is conducted between traditional sintered bricks (brick), AAC, and autoclaved aerated concrete sandwich insulated wall panels (ATIM), using three thermal engineering models. The experimental group focuses on the south wall, with differentiated designs: Model A (brick), Model B (AAC), and Model C (ATIM). Temperature data collectors assess heat transfer and internal temperature regulation in winter. The results show that the AAC sandwich system significantly reduces thermal fluctuations, with a 26% and 14.8% attenuation in temperature amplitude compared to brick and AAC. The thermal inertia index of the AAC sandwich structure system is 51.5% and 14.58% higher than that of traditional brick walls and AAC walls, respectively. The heat consumption index of ATIM is, on average, 14% lower than that of AAC and 74.5% lower than that of the brick system. The study confirms that the AAC sandwich rock wool wall structure enhances temperature stability and energy efficiency, supporting green building and low-carbon energy-saving goals.

1. Introduction

The issue of global warming has aroused widespread concern in the international community, and the promotion of a low-carbon, environmentally friendly, and sustainable development model has become the key to meeting the challenges of economic development [1]. Developed countries such as the United States, Japan, and the European Union have pledged to achieve net-zero carbon dioxide emissions by 2050. As the world’s largest emitter of carbon dioxide, China is actively committed to reducing emissions, and energy consumption is expected to continue to grow [2]. In 2020, China proposed to strive to achieve “carbon peak” by 2030 and “carbon neutrality” by 2060, accelerating its low-carbon development. Energy consumption in the building sector plays a crucial role in realizing the low-carbon goal [3]. According to statistics from 2022, the annual carbon emissions from China’s construction sector reached 2.18 billion tons, accounting for nearly 40% of the country’s total emissions. Among these, the energy consumption for urban heating in northern China in 2022 was 217 million tons of standard coal, representing 20% of the total energy consumption in China’s building sector [4]. Therefore, promoting energy efficiency and emission reduction in buildings is of great significance for China to achieve the goal of carbon peaking and carbon neutrality.
Tan Y.Y. et al. [5] proposed a composite that incorporates fly ash (FA) and ground granulated blast-furnace slag (GGB) into palm oil fuel ash (POFA)–based geopolymer concrete to reduce CO2 emissions, thereby lowering porosity and enhancing fresh-state and mechanical properties, which in turn improves thermal insulation and overall thermal efficiency. Gómez P.J.R. et al. [6] reported that large volumes of polluting waste cannot be effectively managed, causing environmental damage, and advocated the use of sustainable building materials. By designing a sustainable construction system that integrates design, testing, and a 30-year prototype validation of a rice husk–guadua–sugarcane lightweight concrete, they concluded that the material can serve as a low-cost, seismically resistant, and environmentally friendly alternative to steel and cement, compliant with Ecuadorian norms and suitable for low-income communities. Sathiparan N. et al. [7] analyzed the effects of FA and rice husk ash (RHA) used as partial cement substitutes on the porosity and compressive strength of permeable concrete. The results show that FA and RHA can be effectively combined to produce permeable concrete with improved performance, reduced costs, and diminished environmental impacts. Chowdhurya J.A. et al. [8] sought to reduce the environmental burden of conventional building materials by integrating FA and boiler slag (BS) into geopolymer composites. Their findings demonstrate that incorporating BS and FA offers a viable, eco-friendly alternative to traditional materials, reducing reliance on geosand and cement while enhancing sustainability. Mohamed O.A. et al. [9] investigated the resistance of concretes containing alkali-activated binders with higher calcium to chloride ingress and carbonation by partially or completely replacing ordinary Portland cement (OPC) with FA and GGB. They showed that combining GGB with FA more effectively enhances carbonation resistance. To mitigate the environmental impacts of conventional building materials and enhance concrete performance, many researchers have adopted fly ash as a cement replacement. Autoclaved aerated concrete (AAC) is particularly noteworthy, as approximately 70% of its raw constituents comprise industrial solid wastes—such as fly ash, slag, silica tailings sand and silt, and flue-gas desulfurization gypsum—thereby attracting widespread attention. AAC has low density and excellent thermal isolation properties, which can effectively reduce the energy consumption of buildings, especially in terms of heat preservation and energy saving. In summer, AAC can effectively block the entry of external heat, and in winter, it can maintain the indoor temperature, thus significantly reducing the building’s energy consumption and achieving energy-saving effects. AAC is a new type of building material, which is widely recognized for its lightweight, high strength, high temperature resistance, acoustic noise absorption, and excellent heat preservation performance [10]. AAC can not only be used as a wall heat preservation material but also can be used as a load-bearing structure [11]. Its unique microporous structure makes it outstanding in building energy-saving performance. Its unique microporous structure makes it outstanding in building energy saving. AAC forms a porous structure mainly through outgassing [12,13], which makes it lighter and gives it better thermal insulation properties [14]. The porous structure of AAC has various advantages in terms of lightness of the final product, as well as acoustic and thermal insulation, and it can be used to produce energy-efficient masonry components and structures, which is therefore very advantageous in terms of sustainability and building comfort [15]. Liu Xiaohui et al. [16] determine the optimal proportion of the base for autoclaved aerated concrete based on orthogonal tests using polar analysis and matrix correlation analysis and show that glass powder, as an alternative to fly ash, is effective in improving the dry density, compressive strength, and thermal conductivity of autoclaved aerated concrete. Miccoli L. et al. [17] design and test an exterior wall panel system composed of ultra-high performance concrete (UHPC) and AAC. A composite exterior wall panel system made of ultra-high performance concrete (UHPC) and AAC was designed and tested in conjunction with a modified interior wall coating technique, and the results showed that the composite design significantly improved the strength and thermal insulation properties of the wall. Yang et al. [18] analyzed the relationship between the thermal insulating properties and the strength of AAC. The experimental results showed that the optimization of pore structure can strike a balance between thermal insulation and structural safety, and the compressive strength and thermal coefficient decrease with the increase in aluminum powder in the mixture. Chen et al. [19] analyzed the effect of the pore structure of AAC on the thermal conductivity through experiments and numerical simulations, and the results showed that the effect of pore size on the thermal conductivity increases with the increase in the pore diameter, and the thermal conductivity of AAC decreases with the increase in the pore size. Yu C. et al. [20] proposed a composite wall design combining AAC and thermal insulation materials, and a quantitative analysis of thermal performance was carried out. It was shown that the composite wall could effectively reduce the internal surface temperature, minimize the heat gain, and improve the energy efficiency. Stepien A. et al. [21] proposed a method of modifying AAC materials by adding HIPS to enhance their thermal performance. It was shown that the addition of HIPS improves the pore structure of AAC and enhances its thermal performance. Sharma U. et al. [22] applied advanced simulation techniques to quantify the thermal performance of AAC blocks under different climatic conditions. It was shown that AAC blocks can effectively reduce building heat gain and improve energy efficiency, especially under high summer temperature conditions.
Previous research on the energy-saving and thermal insulation performance of AAC wall panels was mainly based on numerical simulation analysis, lacking the support and verification of actual engineering test data, and the conclusions of the research were relatively macroscopic. At present, the research on AAC materials focuses on the effects of moisture content, porosity, and raw material ratio on the performance of a single test block or a single wall panel, and less on the overall thermal insulation performance of the AAC combined wall panel system. Reference [20] analyzed the performance of AAC materials from the microstructural point of view but lacked in-depth verification of the macroscopic wall thermal insulation performance; reference [21] is mainly for the study of the summer working conditions and did not involve the winter thermal insulation effect. In contrast, the research on sandwich insulated walls has made richer progress. Sang Guochen [23] pointed out through analysis that for low-energy buildings using solar heating, the applicability of the internal insulation structure is poor, while the sandwich insulation structure has better temperature stability compared with the external insulation structure. Zhu Xiaolin [24] found that the sandwich insulation wall structure showed superior thermal insulation performance under winter working conditions through on-site measurements of the winter thermal environment of assembled residential houses with different insulation forms in the Fuping and Sanyuan areas of Shaanxi. Many scholars focused on precast concrete sandwich walls, which effectively improved the overall thermal performance of the wall by optimizing the design of the sandwich structure and material selection [25,26,27,28,29]. Due to the excellent insulation performance of AAC, this base is built on, exploring the effects of adding insulating rock wool in the middle of AAC wall panels on its energy-saving and heat preservation performance, which is affected by environmental changes and solar radiation. In order to clarify the role of these factors, this study constructed three kinds of building thermal models: traditional sintered brick wall, AAC wall panel and AAC wall panel + insulating rock wool (TIM). The thermal performance of AAC sandwich walls in low-temperature environments in summer-hot and winter-cold regions was investigated on the basis of existing research [30].

2. Materials and Methods

2.1. Material of TIM

At present, the commonly used thermal insulation materials in the building can be mainly divided into two categories: inorganic thermal insulation materials and organic thermal insulation materials. Traditional organic materials mainly include molded polystyrene foam board, polyurethane insulation board, and extruded polystyrene foam board [31], and inorganic thermal insulation materials include expanded perlite, aerated concrete, rock wool, glass wool, etc. [32]. Among them, rock wool has low thermal conductivity and can effectively stop heat transfer, thus providing excellent thermal insulation. The material is made of natural ore (such as basalt) melted and fibered, which has excellent fire resistance and is not easy to burn. Rock wool also has a high compressive strength, can withstand large external forces without breaking, and has a strong, long service life. Therefore, this experiment selects rock wool as the sandwich insulation material of AAC, and its related parameters are shown in Table 1.

2.2. Material of AAC

The AAC used in this experiment is provided by Gaodi Enterprise in the Anhui Province; the basic performance of the AAC board is based on GB/T 11969-2020 [33], and its relevant parameters are shown in Table 1 and Table 2. The main raw materials of AAC are produced by slag, tail mud, desulfurization gypsum and fly ash through a certain ratio, and aluminum powder is added as a foaming agent, and the porous material is cured through high-temperature and high-pressure steam curing. 70% of the raw materials of the AAC panels are fly ash, slag, silica tail sand, silica tail mud, desulfurization gypsum and other industrial solid wastes, and the steam used in the production process is waste steam from power plants. During the production process, the steam used for production is the waste steam of the power plant, and the water used for production is purified and recycled from natural rainwater, which is a new type of green building material in the true sense.

2.3. Model Introduction

In order to study the effect of adding thermal insulation materials to AAC wall panels on their energy-saving and thermal insulation performance, three experimental models of traditional sintered brick walls, AAC wall panels, and ATIM were selected for this experiment to carry out a systematic energy-saving performance analysis. The experimental model was established in Lu’an City, Anhui Province, China (east longitude: 116.48, north latitude: 31.76); the specific dimensions of the experimental room are 1900 × 1800 × 1500 mm, the thickness of the wall is 240 mm, and the specific dimensions of the experimental room are shown in Figure 1. The indoor flooring is composed of cast-in-place concrete, with a height difference of 120 mm between the interior and exterior surfaces, effectively isolating the indoor environment from external conditions, minimizing thermal exchange, and preventing rainwater ingress. The roofing system is equipped with thermal insulation to mitigate the influence of solar radiation on internal temperatures. To ensure adequate waterproofing performance of the experimental setup, the roof was coated with a 3 mm thick asphalt-based waterproof layer, while the exterior envelope was further treated with waterproof paint and an additional asphalt membrane. In addition, aluminum casement windows with dimensions of 500 × 800 mm were reserved on the north wall to facilitate personnel access and equipment installation.
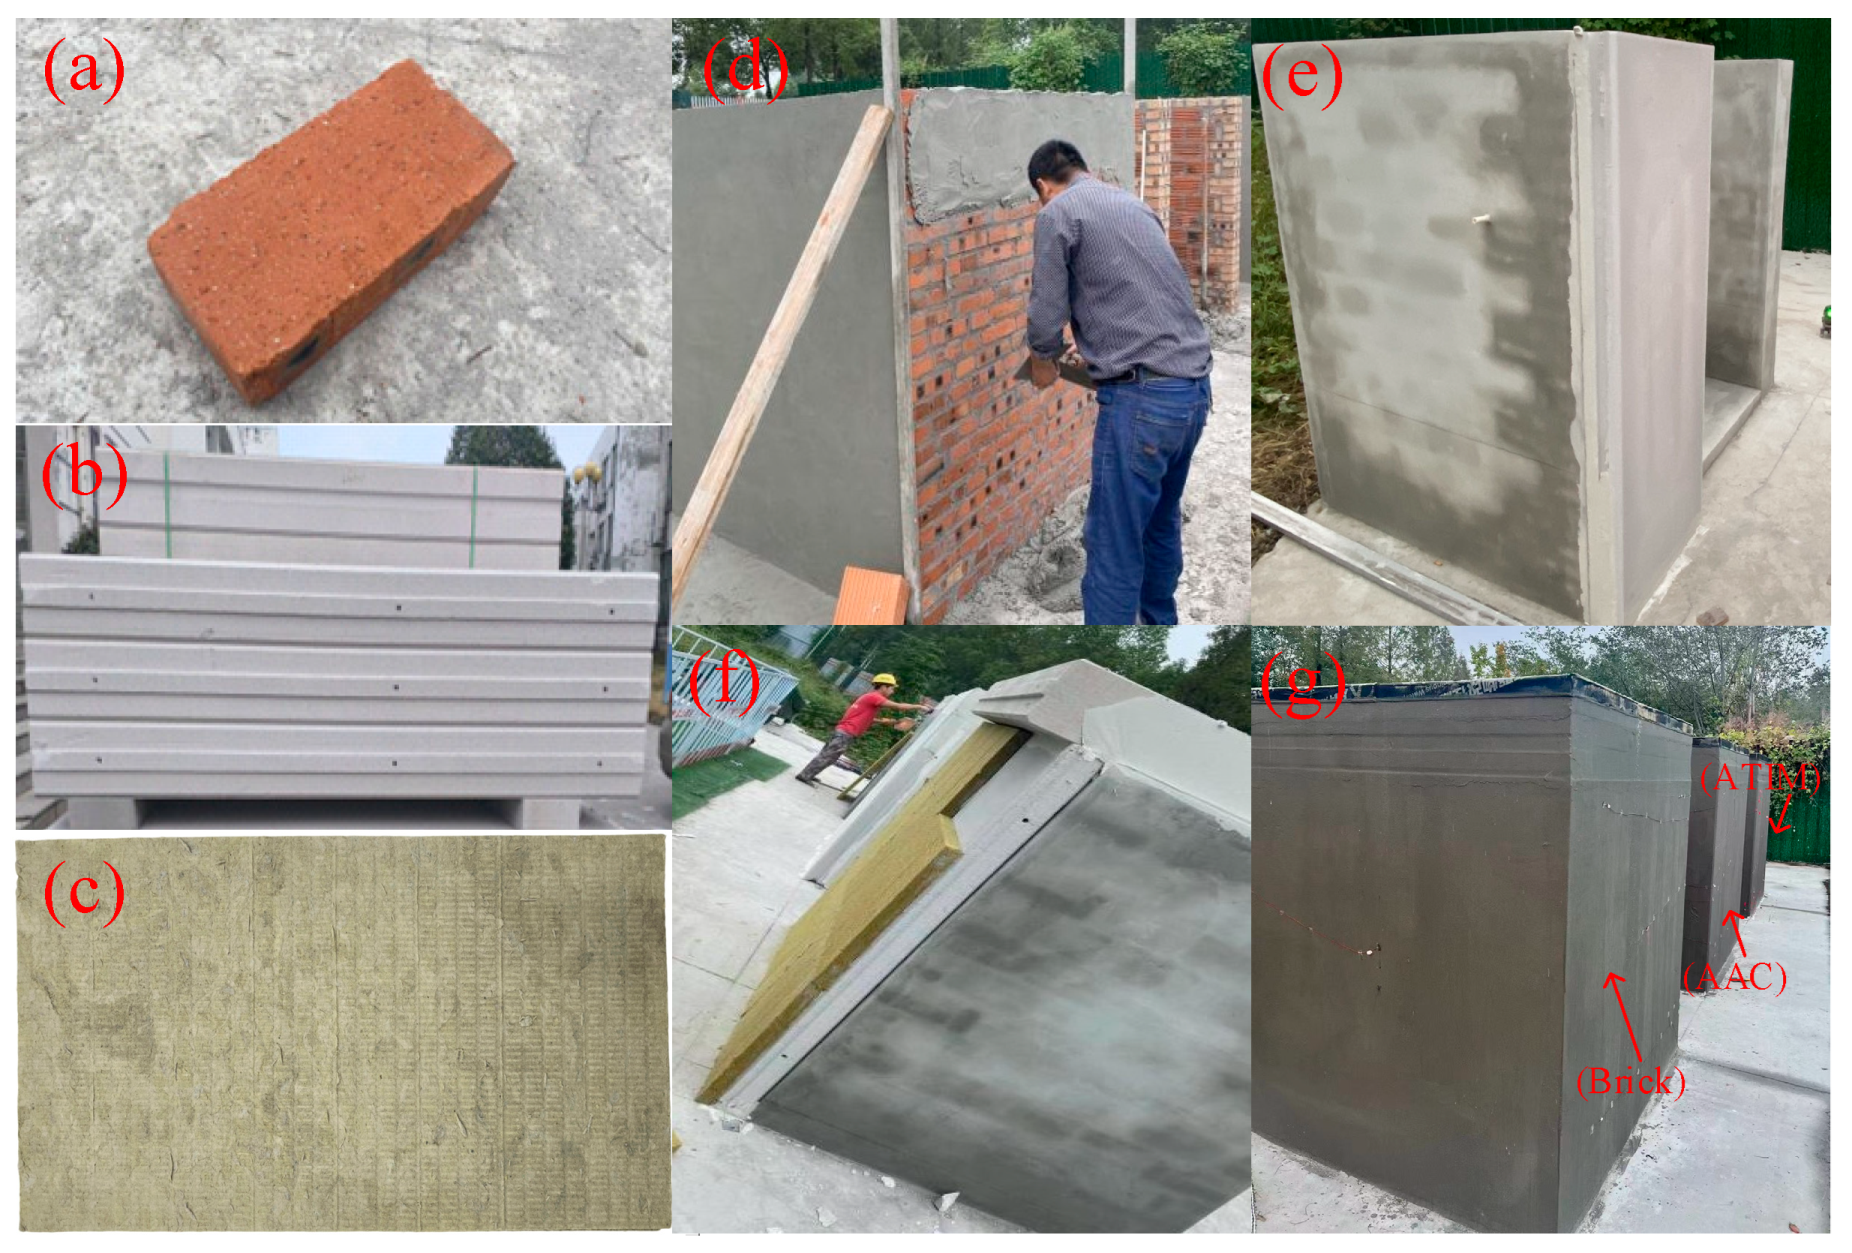
The content of this test is solar radiation, heat flux, indoor and outdoor temperature, internal and external wall temperature, etc., mainly on the south wall for systematic analysis. In this experiment, mainly on the south wall, a variable treatment is done; the rest of the wall is a gangue brick wall. The wall structure is shown in Figure 1 and Figure 2. Model A’s south wall is a 240 mm thick brick wall, with a brick size of 240 × 115 × 90 mm; model B’s south wall is AAC wall panels; and the south wall of model C is an ATIM wall, with thicknesses of 100, 40 and 100 mm, respectively, and the sandwich of the wall is connected to the inner and outer walls by bolts. The AAC and ATIM walls are plastered with a 2 mm thick, AAC-specific mortar and subsequently waterproofed, and the rest of the walls are 200 mm thick gangue brick walls with a brick size of 200 × 95 × 50 mm. Joints are plastered with cement mortar, and joints are plastered with AAC-specific mortar, and the rest of the walls are brick masonry. Figure 3 shows the relevant materials and models.
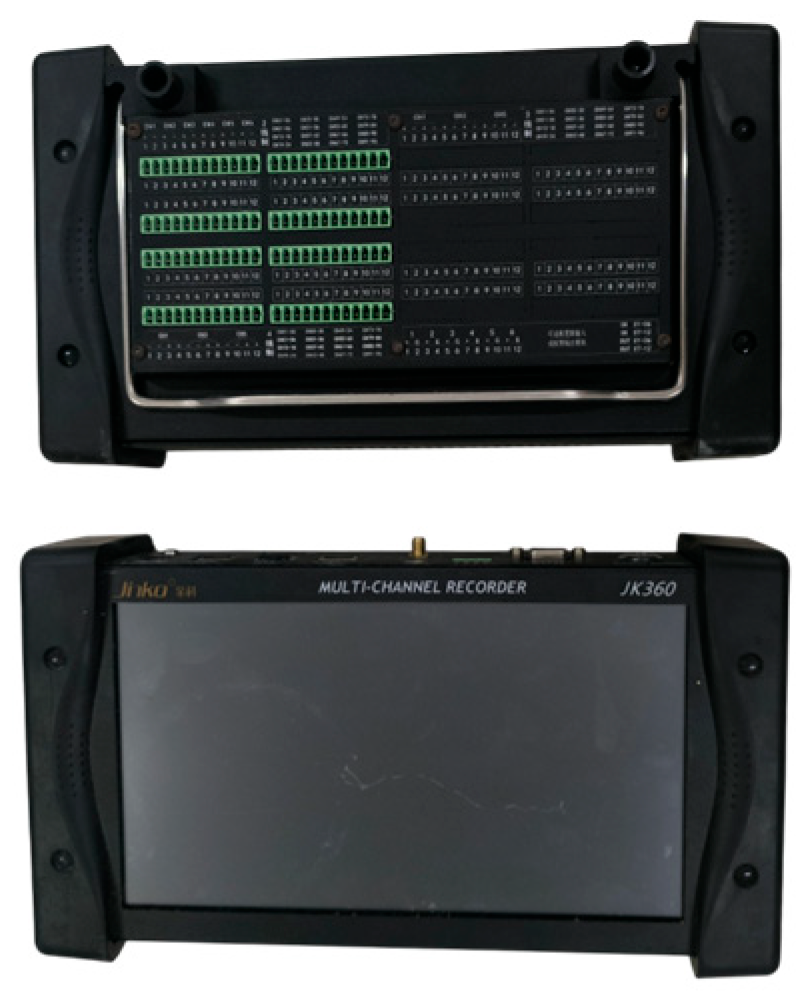
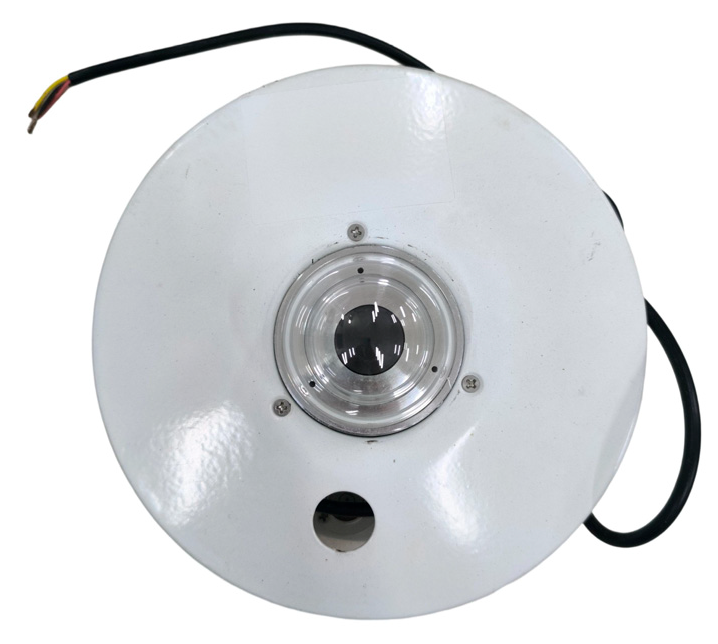
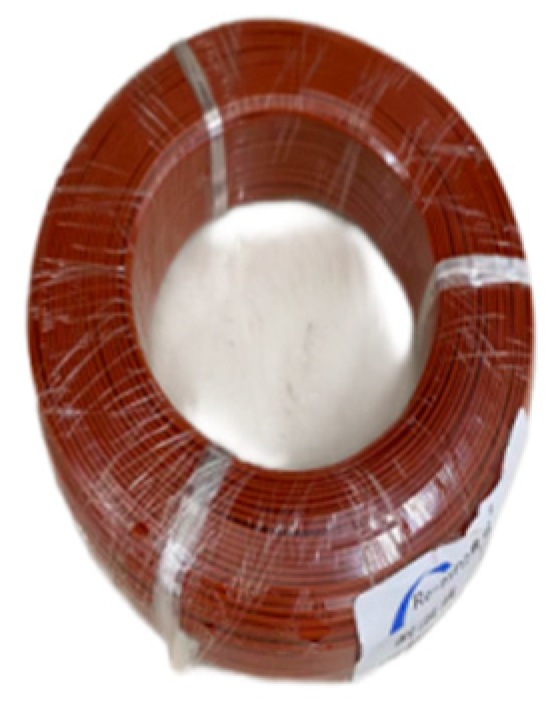
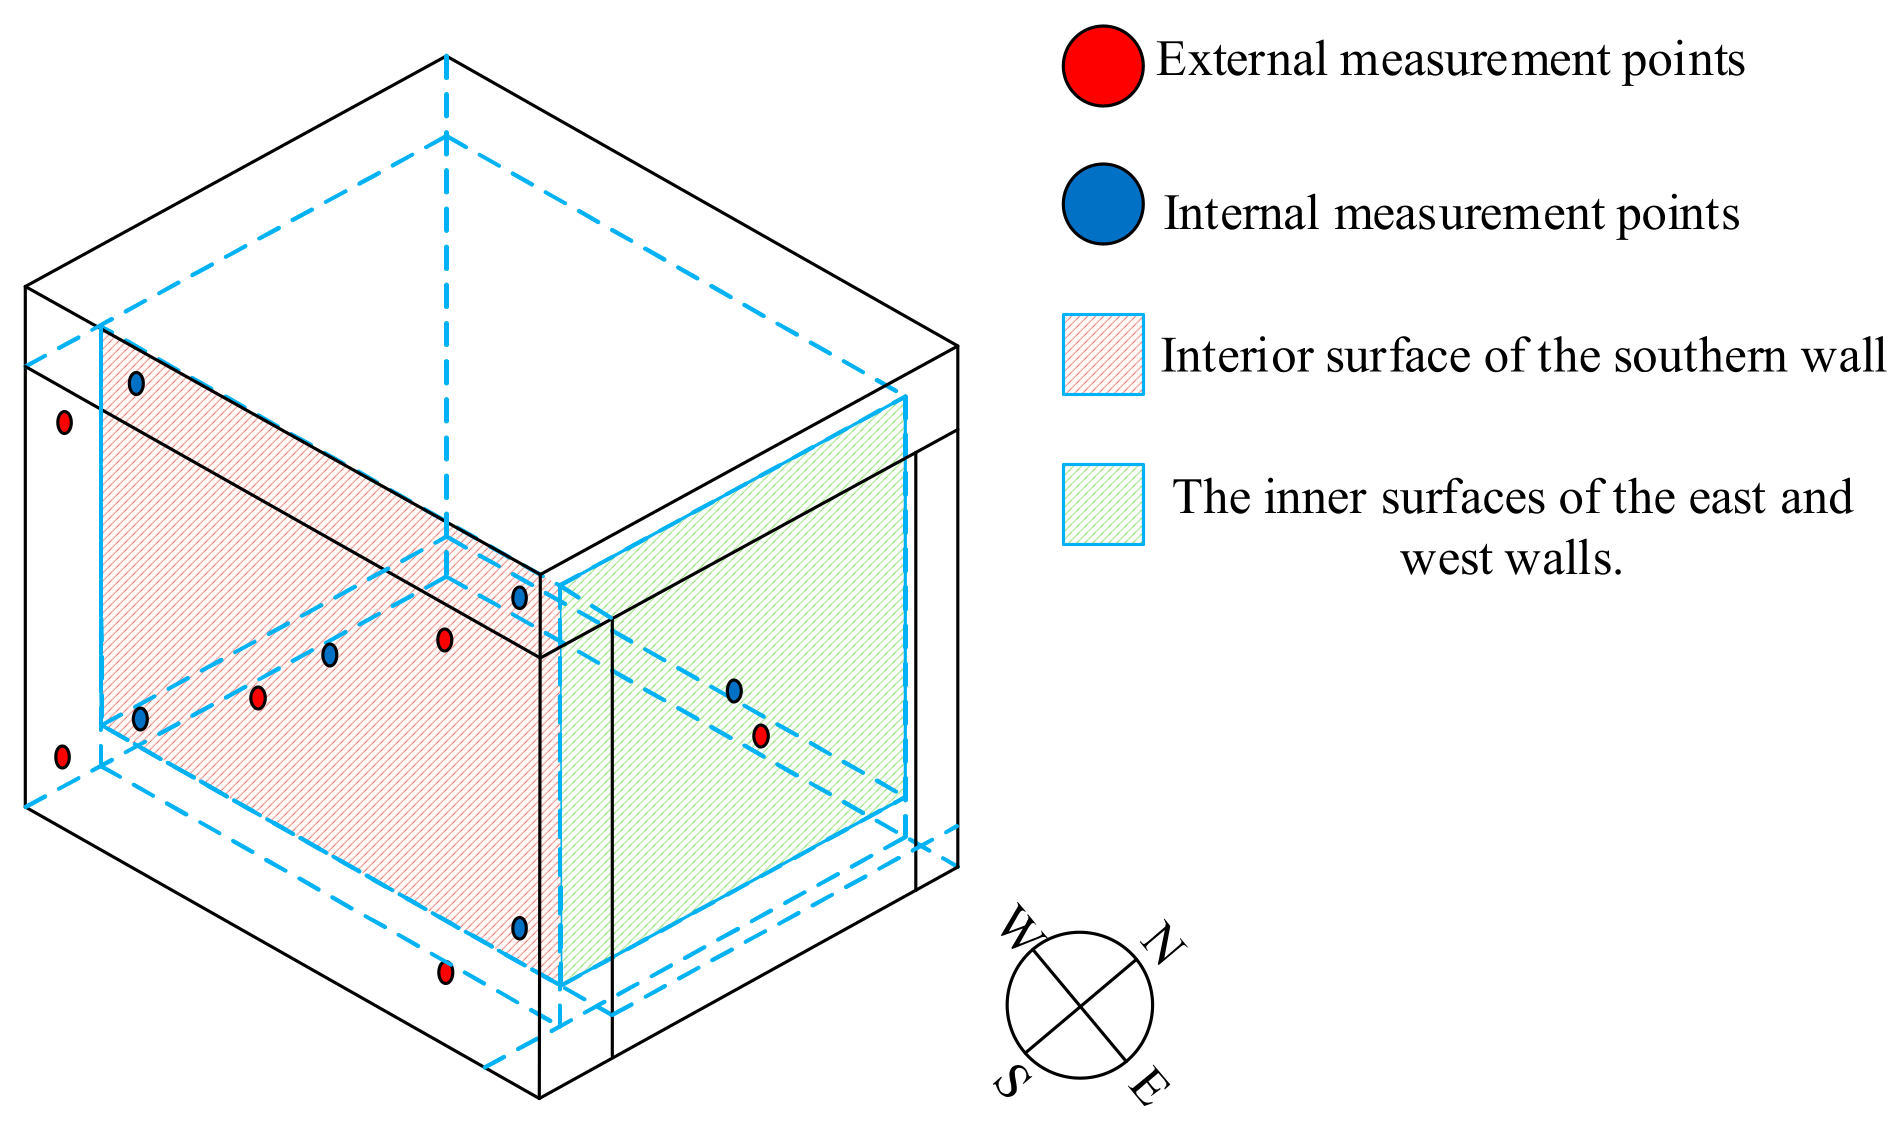
The experiment was conducted continuously over 7 days, from 00:00 on 11 January to 23:59 on 17 January 2024. During this time, all windows remained closed, and no natural ventilation was permitted. The data collection of the experiment mainly utilized a multi-channel collector, model JK360-48, and a solar radiometer, model YGC-TBD, with a sensitivity of 7–14 μV/W∙m2. Thermocouples were used for real-time monitoring of wall temperature; the bare head of the thermocouple is 0.1 mm, the temperature range is −20 °C to 100 °C, and the resolution is ±0.1 °C. The relevant instruments and thermocouples are shown in Figure 4, Figure 5 and Figure 6. One end of the thermocouple is pasted in the location to be measured, and the other section is connected to the data acquisition instrument to record the wall temperature changes by reading the data shown in the device. Location of measurement points: one measurement point is arranged at the center of each of the east and west walls inside and outside; the direct sunlight of the south wall is the focus of the study, and the measurement points are arranged at the corners and the middle of its inner and outer walls. The arrangement of measuring points is shown in Figure 7. The solar irradiator sensor is installed in the surrounding open area, with no obstacles to the place. The level of the radiation table is adjusted and fixed, the protective cover is opened, and then the output cable of the radiation table is connected to the collection equipment; at this time, the intensity of solar radiation can be observed.

3. Assessment Methods

3.1. Temperature Probability Density Distribution

In order to further quantify the probability distribution characteristics of the outdoor temperature and the internal temperature of the model, logarithmic normal distribution was selected to fit the experimental data, and the probability density function of the distribution model is as follows:
σ = i = 1 n ( x i μ ) 2 n ,
f ( x ) = 1 σ L x 2 π exp ln x μ L 2 2 σ L 2 ,
where σ is standard deviation; μ is mean value; x and f ( x ) are random variables and their probability density functions; μ L is logarithmic mean; and σ L is logarithmic standard deviation.

3.2. Evaluation of Thermal Performance

3.2.1. Heat Storage Coefficient and Thermal Inertia Index

The indexes for evaluating the thermal performance of materials mainly include thermal conductivity, specific heat capacity, and heat storage coefficient. As an important part of the heat exchange between the building and the external environment, the enclosure system is a key factor in determining the energy consumption of the building, and its thermal inertia index and thermal storage performance also directly affect the comfort of the building [34]. The heat storage coefficient ( S ) and thermal inertia index ( D ) of the material can be expressed by Equations (3) and (4) [35] as follows:
S = 2 π c ρ λ Z ,
D = S R ,
where c is the specific heat capacity of the material; ρ is the density of the material; λ is the thermal conductivity of the material; Z is the period; and R is the thermal resistance of the material.
R = i = 1 n δ i λ i ,
where δ i denotes the wall thickness; and λ i denotes the material heat transfer coefficient.

3.2.2. Thermal Delay Time

Thermal delay time denotes the interval between the occurrence of the peak composite outdoor temperature at the building envelope’s outer surface and the corresponding peak at its inner surface. Higher thermal inertia of the enclosure structure results in a longer delay time [36],
ξ = t i n , max t o u t , max ,
where t i n , max denotes the elapsed time required for the model’s inner surface temperature to attain its maximum value; and t o u t , max denotes the elapsed time required for the model’s outer surface temperature to attain its maximum value.

3.2.3. Thermal Amplitude Attenuation Multiple

The thermal amplitude attenuation multiple is defined as the ratio of the amplitude of the external temperature wave incident on the outer surface of the building envelope to the amplitude of the corresponding temperature wave at its inner surface. This factor quantifies the enclosure’s resistance to thermal wave propagation: higher values correspond to reduced temperature fluctuations at the inner surface.
ν = T o u t , max T o u t , min T i n , max T i n , min ,
where T o u t , min is the minimum temperature of the outer wall; and T i n , min is the minimum temperature of the inner wall.

3.3. Heat Gain

The ability of the building exterior wall to block heat flow exchange between the indoor and outdoor environments is calculated by using the integral of the heat flow density of the inner surface of the wall over a certain time period, which can be calculated by the following formula:
Q = τ = 0 τ c q i n d τ , q i n > 0 , h e a t   g a i n q i n < 0 , h e a t   l o s t ,
where Q is the heat load per unit wall area; q i n is the density of heat flow through the inner surface of the wall; τ is the heat transfer time; and τ c is the time period.
q i n = h i n T i n T i a ,
where h i n represents the convective heat transfer coefficient of the inside of the wall; the value is taken as 8.7 W(m2∙K). T i n represents the hourly temperature of the wall surface inside the wall; and T i a represents the hourly temperature of the air inside the wall.

3.4. Heat Consumption Indicator

Enhancing indoor thermal comfort and reducing energy consumption in residential buildings is both an economic imperative and a critical component of national sustainable development strategies. To enact energy-conservation policies and address excessive heating demands and poor indoor thermal quality in China’s cold and frigid regions, effective technical interventions are employed to constrain heating energy use within prescribed limits. The indicator of heat consumption of a building shall be calculated in accordance with the following formula:
q H = q H T + q 1 N F q 1 H ,
where q H indicates the index of heat consumption of the building; q H T indicates the heat consumption per unit of building area through heat transfer of the envelope; q 1 N F indicates the heat consumption per unit of building area through air infiltration; and q 1 H indicates the internal heat gain per unit of building area.
q H T = ( T a i t r T a o t ) ( i = 1 n ε i K i F i ) A ,
where T a i t r denotes the average indoor temperature of all rooms; T a o t denotes the average outdoor temperature during the heating period; ε i denotes the correction factor for the heat transfer coefficient of the envelope; K i denotes the heat transfer coefficient of the envelope; F i denotes the area of the envelope; and A denotes the floor area.
q 1 N F = ( T a i t r T a o t ) ( c a ρ a N V ) A ,
where c a indicates the specific heat capacity of air; ρ a is air density; N is the number of air changes; and V is the volume of air changes.

3.5. Economic Benefits and Uncertainty

In many countries, space heating and cooling loads constitute a substantial share of national energy consumption. Electricity cost savings ( E C S ) are a key metric for evaluating energy efficiency and an important economic indicator of technical feasibility. Accounting for the cost per square meter of wall construction, ECS is calculated as follows:
Δ q i n = q i n , A T I M ( A A C ) q i n , B r i c k E C S = Δ q i n × E C × 24 h ,
where E C denotes electricity cost. As stipulated by the Anhui Provincial People’s Government, the residential electricity tariff is set at 0.5653 RMB per kWh.
To assess the reliability of the measurement experiment, ensure result accuracy, and quantify potential error margins, this study conducted an uncertainty analysis. The uncertainties associated with wall surface and indoor temperature measurements were calculated using the corresponding equations.
u A ( x ) = t n ( x x ¯ ) 2 n 1 ,
where t / n is the standard deviation coefficient; x is the mean of the dependent variable; and n is the number of observations.
Instrument uncertainty is determined by the instrument itself and its characteristics and is defined as follows:
u B ( x ) = Δ m c ,
where Δ m is the uncertainty limit; and c is the coverage factor, taken as 3 .

4. Results and Discussion

4.1. Temperature Analysis

Figure 8 shows that between 11 and 12 January, environmental temperature varied markedly, averaging 6.81 °C, peaking at 12.78 °C at 20:00, and falling to −1.34 °C at 06:00, for a diurnal range of 14.12 °C. Under these conditions, the mean interior temperatures of the brick, AAC, and ATIM walls were 11.2 °C, 9.73 °C, and 9.91 °C, respectively. The brick wall exhibited the largest fluctuation (8.7 °C), reflecting poor thermal buffering and insulation; the AAC wall reduced this to 5.33 °C; and the ATIM wall further minimized it to 3.76 °C, demonstrating the highest thermal stability. Between 16 and 18 January, solar radiation levels remained consistently low, resulting in indoor temperatures being predominantly governed by ambient environmental conditions. The ATIM wall consistently maintained indoor temperatures approximately 2 °C higher than both the AAC block wall and brick wall. As the evaluation was limited to south-facing walls, the observed thermal differentials between wall systems remained minimal. These results indicate that ATIM’s optimized thermal resistance and inertia significantly enhance temperature regulation, stabilize indoor environments, and improve building energy efficiency.
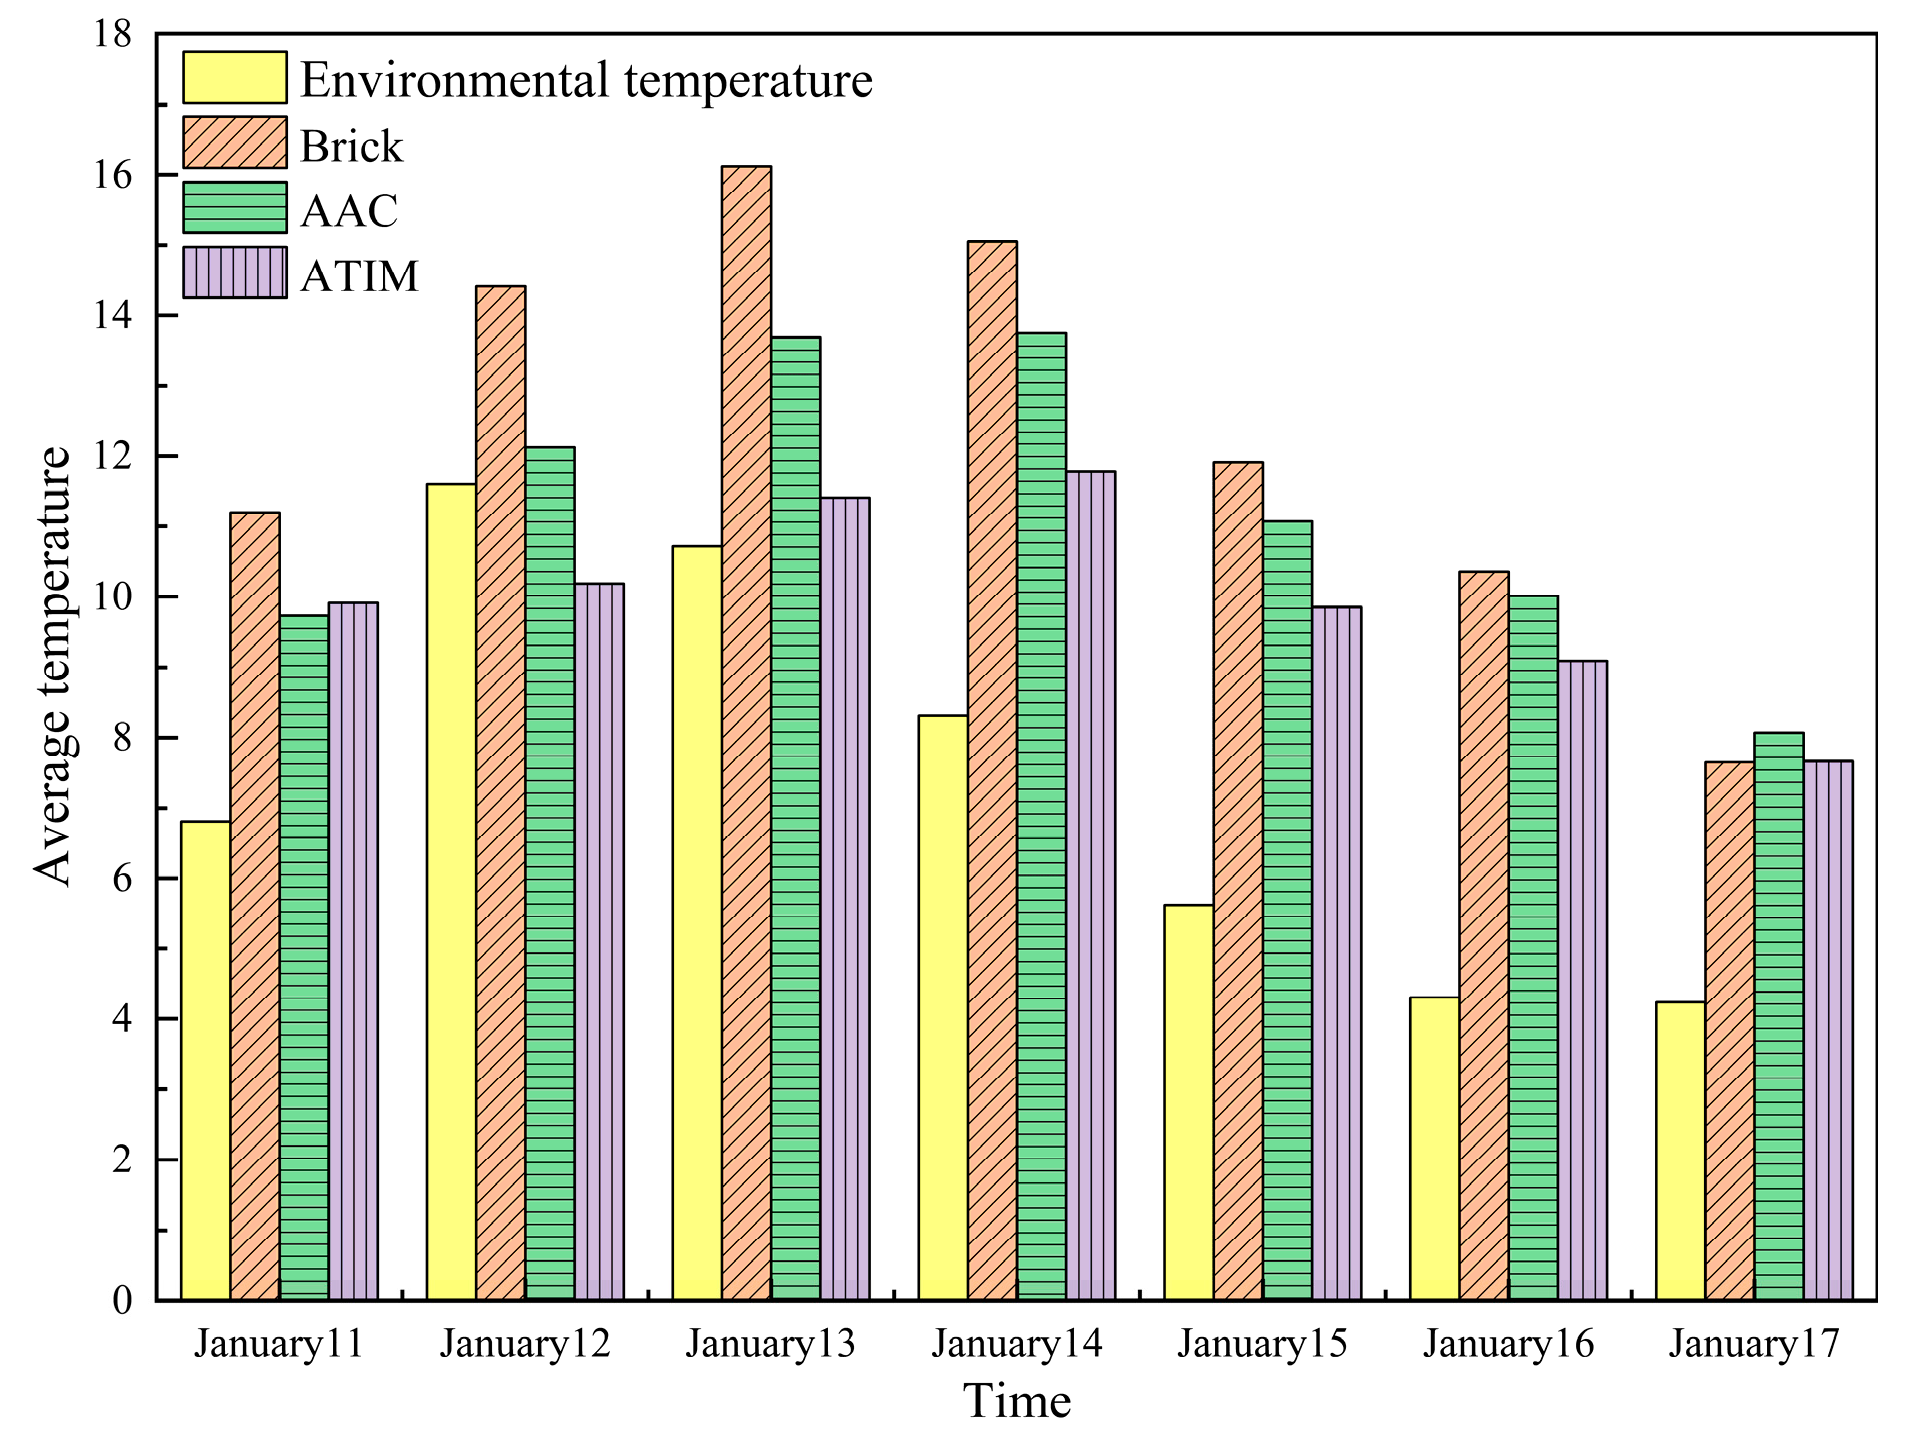
Figure 9 indicates that the mean environment temperatures on 11–17 January were 6.81 °C, 11.60 °C, 10.72 °C, 8.31 °C, 5.62 °C, 4.31 °C, and 4.24 °C, respectively. Corresponding mean interior temperatures for the brick wall were 11.20 °C, 14.41 °C, 16.12 °C, 15.05 °C, 11.91 °C, 10.36 °C, and 7.65 °C; for the AAC wall, 9.73 °C, 12.12 °C, 13.69 °C, 13.75 °C, 11.07 °C, 10.01 °C, and 8.07 °C; and for the ATIM wall, 9.91 °C, 10.19 °C, 11.41 °C, 11.78 °C, 9.85 °C, 9.09 °C, and 7.66 °C. Among these, the brick wall exhibited the highest peak interior temperature of 16.12 °C on 13 January, followed by a rapid decline and pronounced fluctuations mirroring environmental conditions. The AAC wall’s mean temperatures lay intermediate between those of the brick and ATIM walls and displayed moderate, lagged responses to environmental variations. The ATIM wall maintained the lowest mean interior temperatures with the smallest fluctuations and the smoothest temporal profile, demonstrating superior thermal stability. From 13 to 16 January, the brick, AAC, and ATIM walls experienced mean temperature decreases of 13.51%, 9.54%, and 6.95%, respectively, indicating the brick wall’s most pronounced sensitivity to environmental changes. On 17 January, reduced solar radiation and further environmental cooling increased temperature drop rates to 26.16%, 19.38%, and 15.73%, respectively. These results confirm that the brick wall’s interior closely tracked environmental fluctuations, exhibiting the poorest insulation. In contrast, the ATIM wall delivered the best temperature stability and insulation performance, effectively attenuating external temperature influences, with the AAC wall offering intermediate performance.
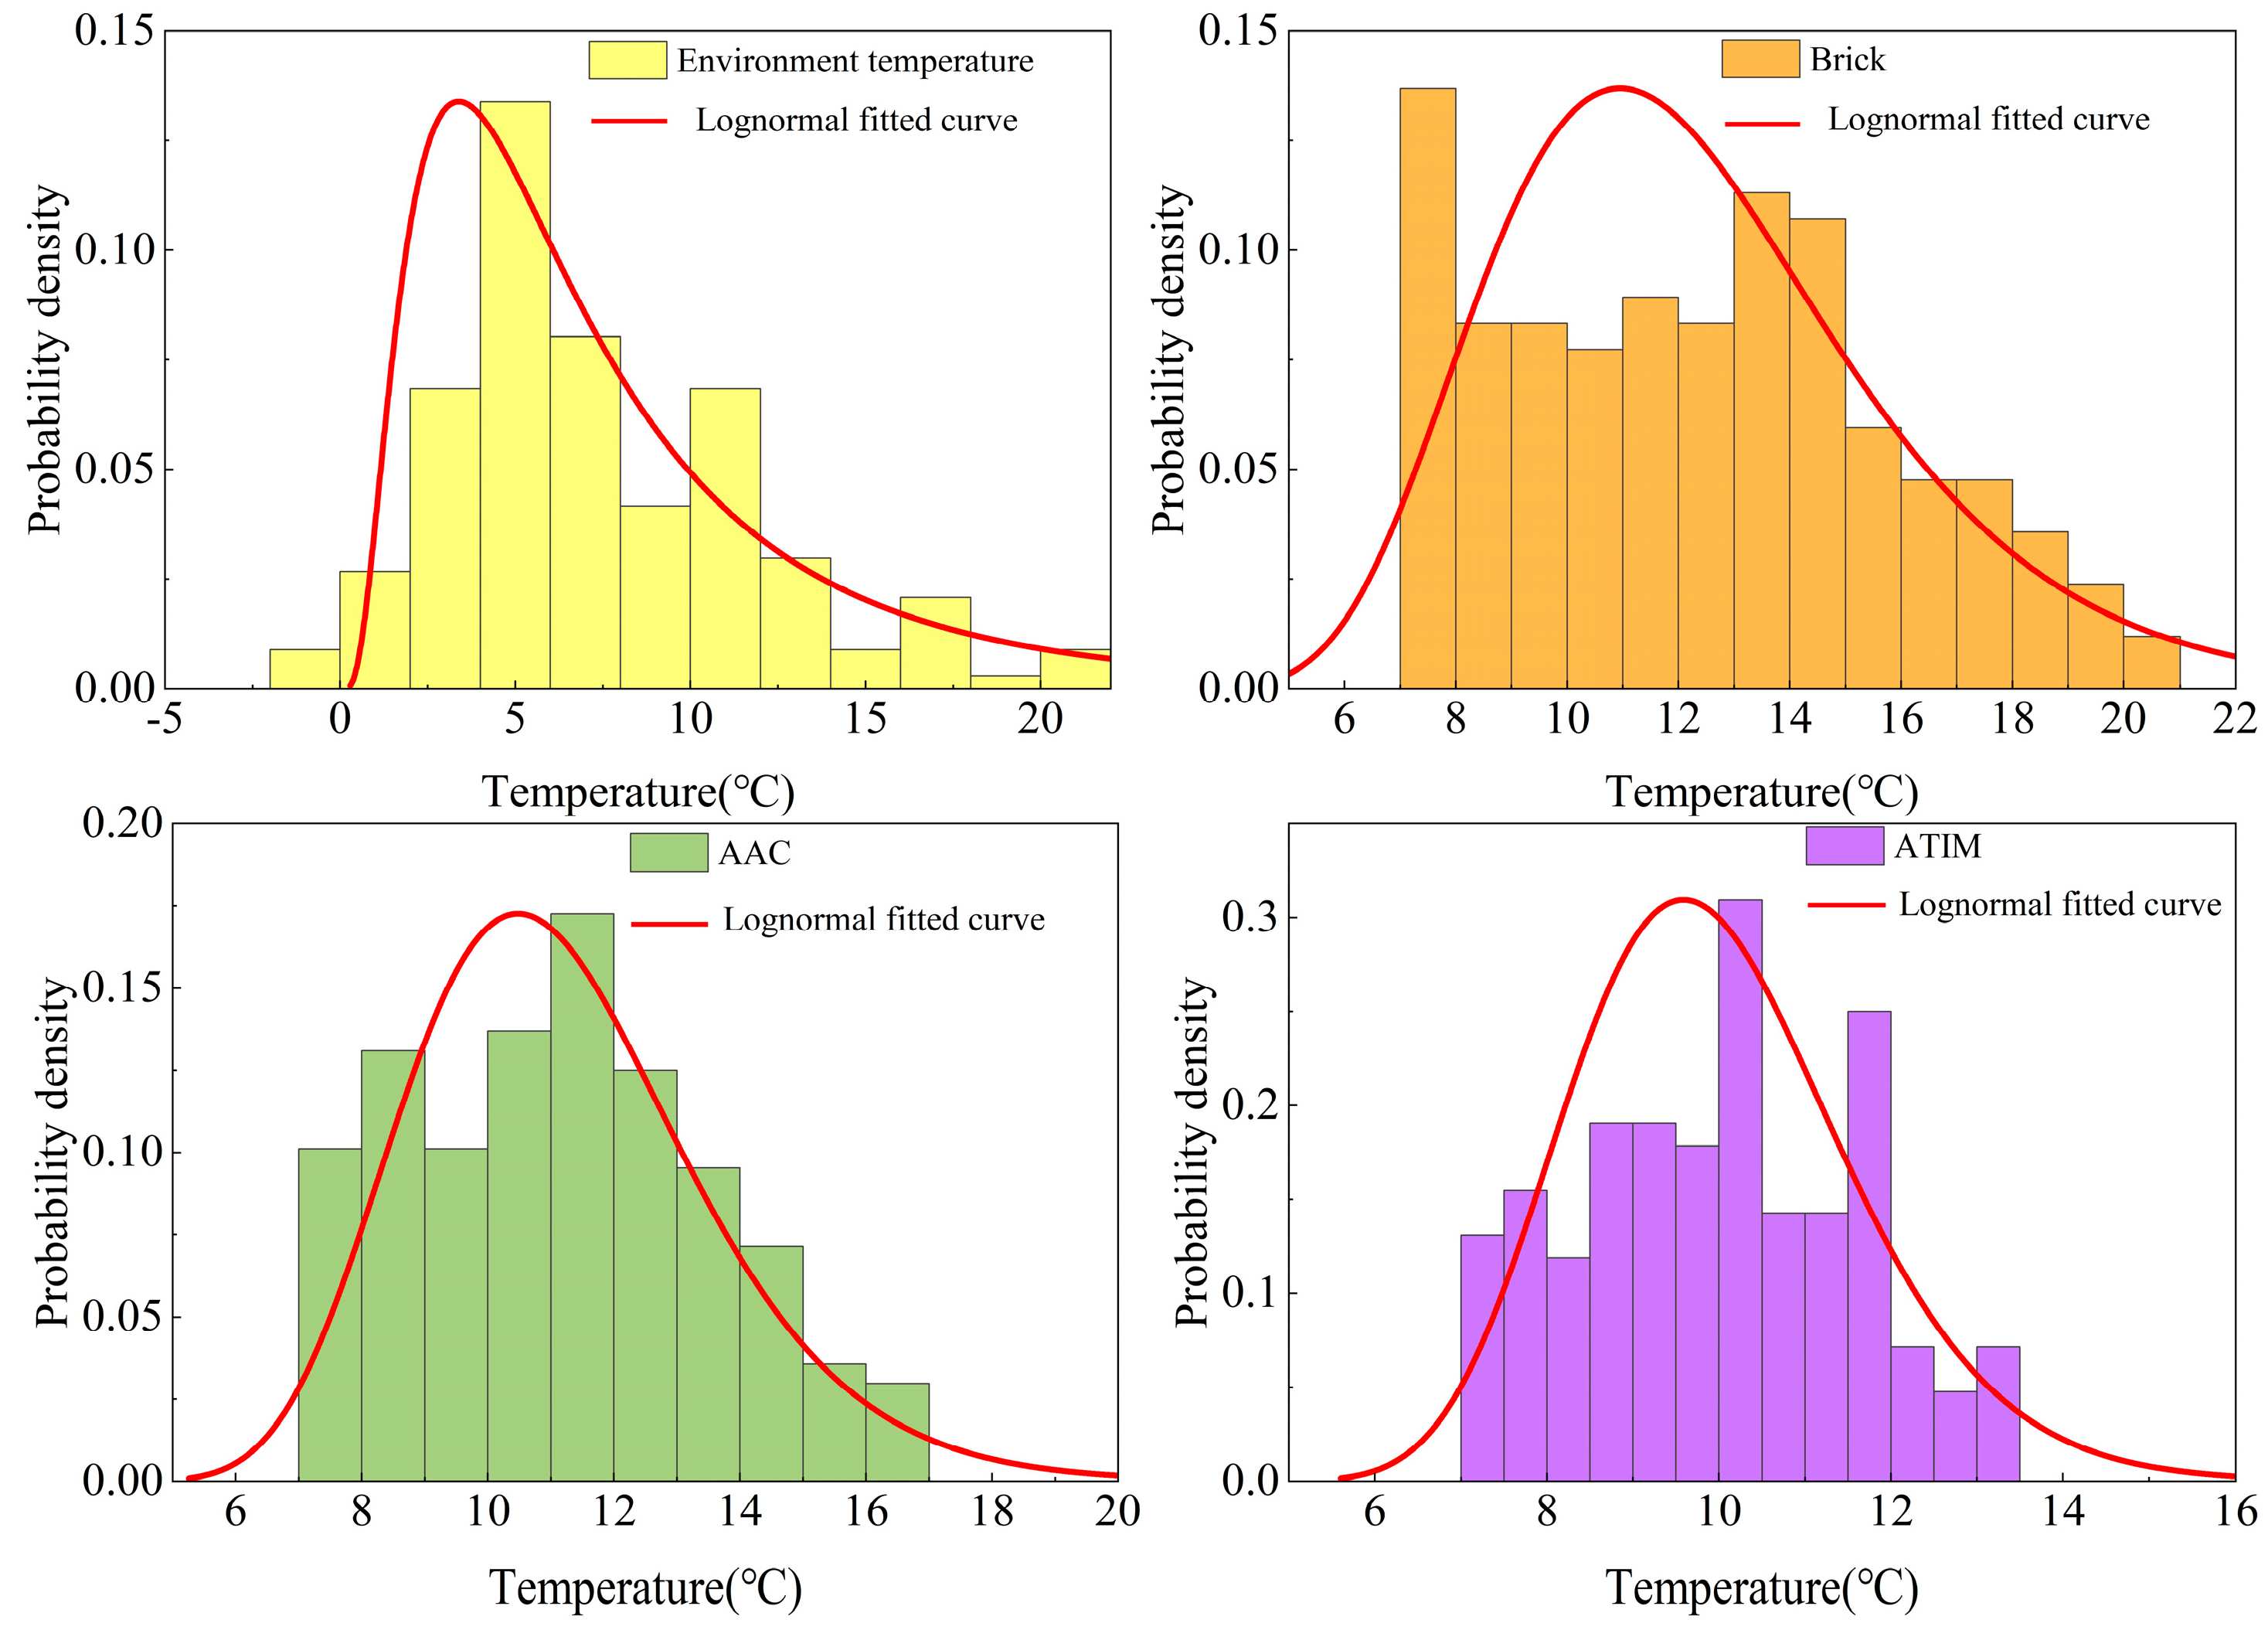
As indicated by the data in Table 3, the environmental temperature exhibits the highest standard deviation (4.54) and a mean value of 7.37, suggesting pronounced variability and a broad fluctuation range. The standard deviations of the internal temperatures for the three wall types decrease sequentially from brick (3.47) to AAC (2.34) and ATIM (1.61), demonstrating that the ATIM wall substantially suppresses indoor temperature fluctuations and provides the most effective thermal regulation. In terms of mean internal temperature, brick exhibits the highest value (12.39 °C), followed by AAC (11.21 °C) and ATIM (9.99 °C), indicating that optimized thermal insulation structures enhance indoor thermal stability and promote thermal comfort. The logarithmic mean and standard deviation further reveal that the ATIM and AAC walls have more centralized temperature distributions with reduced occurrences of extreme values, reflecting superior thermal control performance compared to the brick wall. Overall, both AAC and ATIM walls enhance the stability and comfort of the indoor thermal environment, with the ATIM wall exhibiting the most outstanding insulation and regulation performance.
Figure 10 illustrates that the environmental temperature distribution is markedly right-skewed, with values predominantly clustered in the lower temperature range. The internal temperature distribution of the brick wall is relatively symmetrical, with temperatures primarily ranging from 10 °C to 14 °C and a uniformly distributed probability density, reflecting moderate variability. The AAC wall exhibits a more concentrated distribution with a left-skewed profile, indicating enhanced insulation capability and reduced sensitivity to external fluctuations. The ATIM wall demonstrates the most centralized distribution, characterized by a pronounced left skew, the highest peak in probability density, and the narrowest fluctuation range, thereby underscoring its exceptional thermal insulation and temperature control performance.
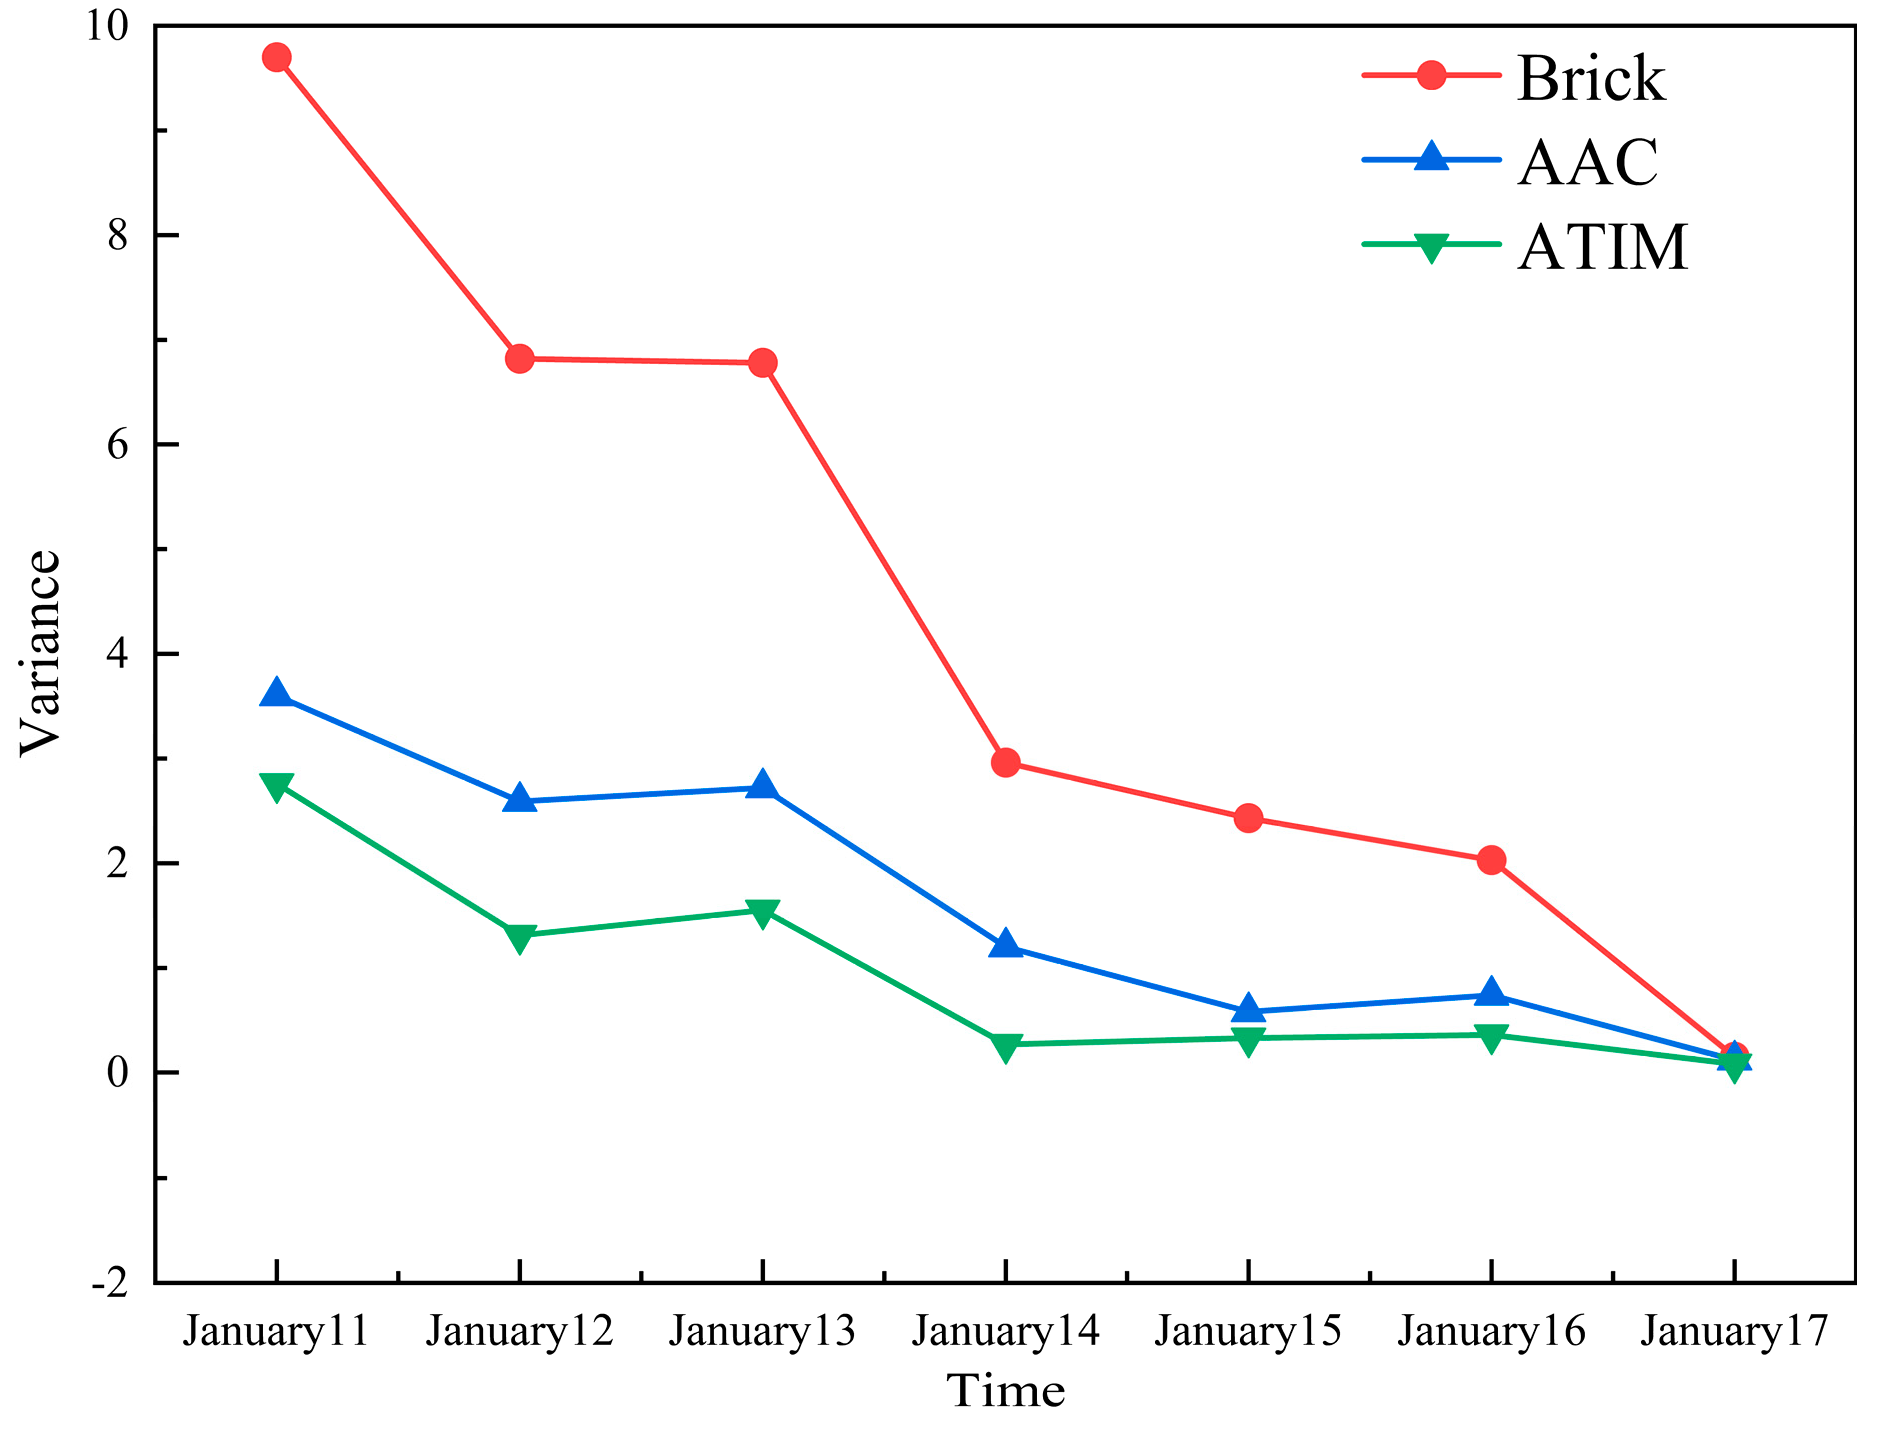
Figure 11 presents the daily temperature variance of brick, AAC, and ATIM walls from 11 to 18 January. The brick wall exhibits the highest internal variance, peaking at approximately 10 on 13 January—coincident with maximal ambient temperature fluctuations—indicating high sensitivity to external thermal changes and poor insulation. The AAC wall reduces variance to 6.78 on 13 January, reflecting moderate buffering capacity against ambient temperature swings. The ATIM wall maintains the lowest variance, never exceeding 4, demonstrating superior thermal stability and effective attenuation of external temperature variations.

4.2. Index of Thermal Performance

4.2.1. Heat Storage Coefficient and Thermal Inertia Index

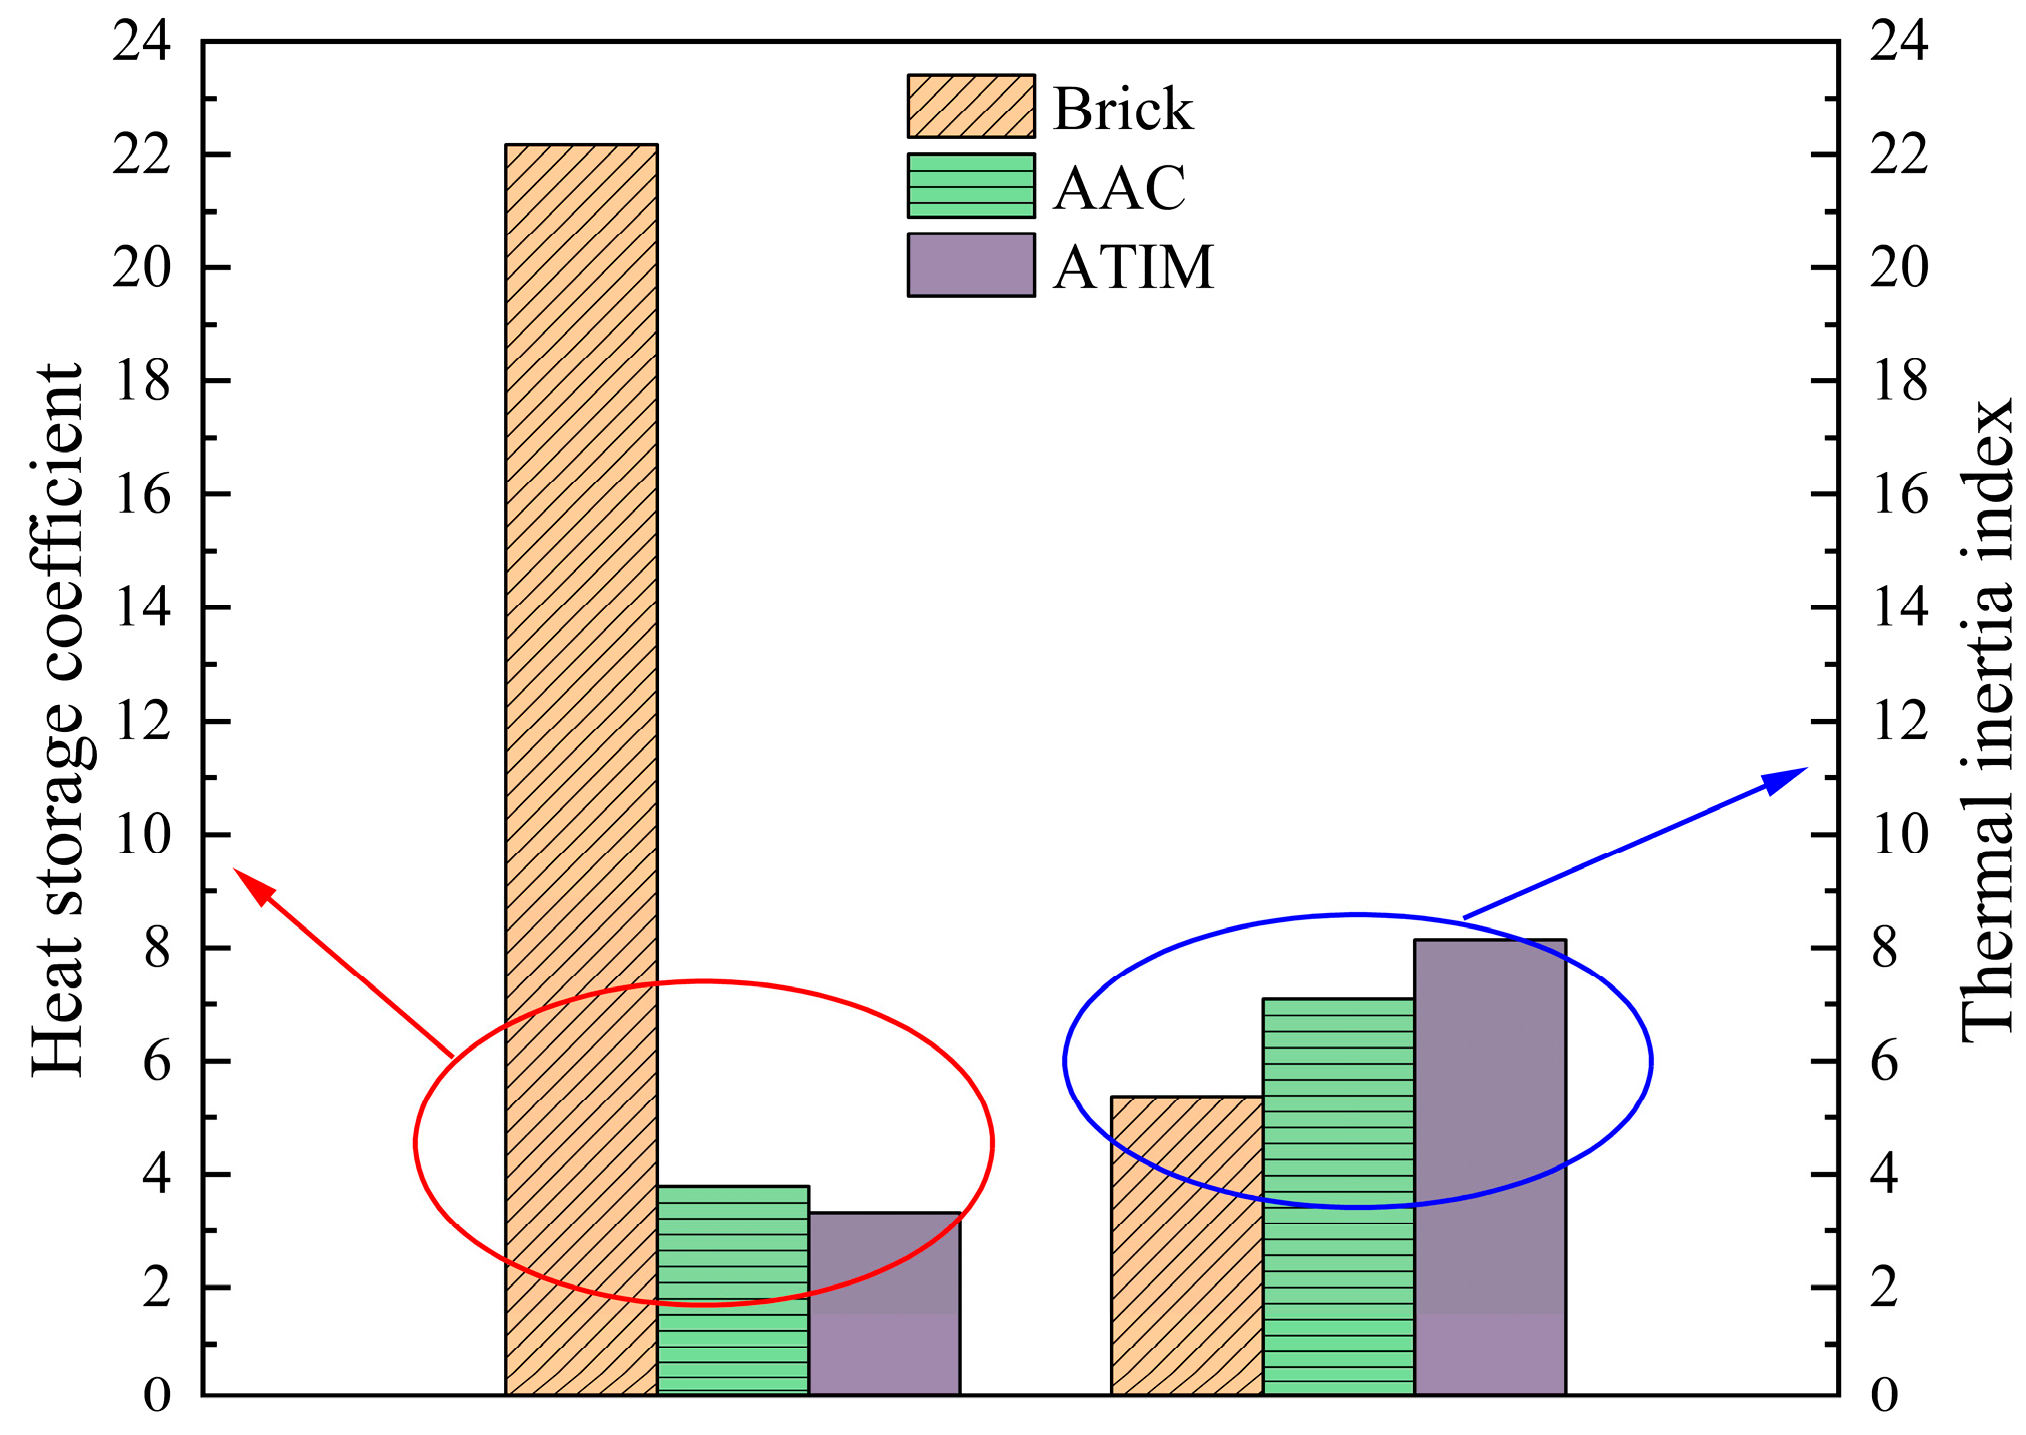
The heat storage coefficient and thermal inertia index of the enclosure materials, computed from Equations (3) and (4) and shown in Figure 12, indicate that brick exhibits the highest storage coefficient (22.17 W/(m2·K)), followed by AAC (3.79 W/(m2·K)) and ATIM (3.32 W/(m2·K)), corresponding to reductions of 18.61 W/(m2·K) and 19.08 W/(m2·K) for AAC and ATIM relative to brick. The thermal inertia index is 5.37 W/(m2·K) for brick, 7.10 W/(m2·K) for AAC, and 8.14 W/(m2·K) for ATIM, representing increases of 32.22% and 51.5% for AAC and ATIM, respectively, compared to brick. Elevated storage coefficients reflect enhanced heat-storage capacity, while higher inertia indices denote improved thermal stability [36]. These results demonstrate that ATIM provides superior thermal insulation when applied to the south-facing wall.

4.2.2. Thermal Delay Time

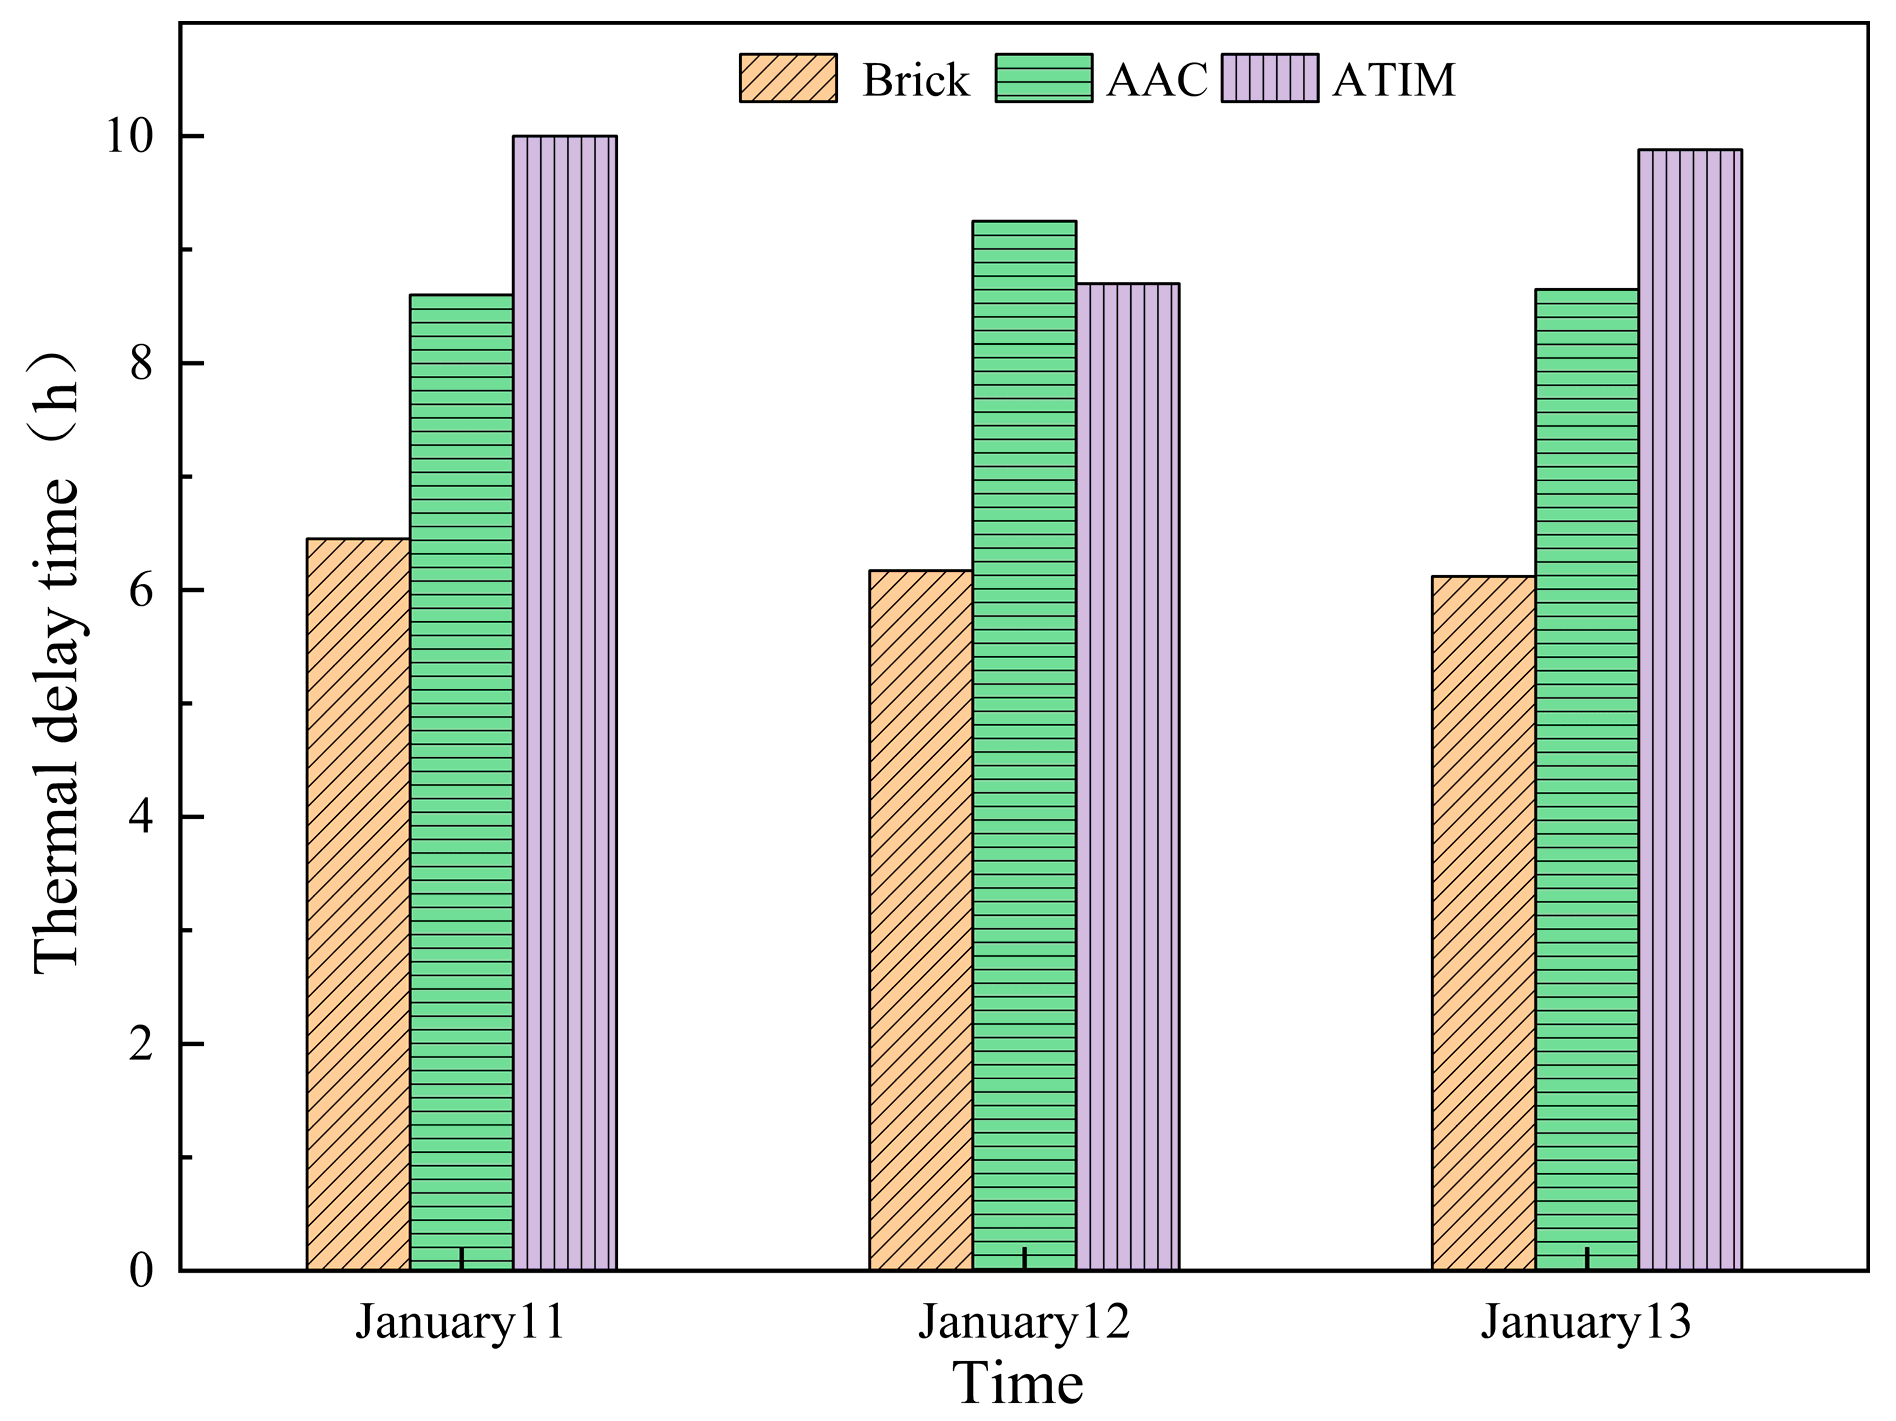
The thermal delay time, calculated from Equation (6) and depicted in Figure 13, reveals that during 11–17 January, days with strong solar irradiation (11th–13th, 15th) exhibited pronounced surface temperature peaks between 13:00 and 14:00 for all wall types. The corresponding interior-surface temperature maxima occurred at approximately 20:00 for the brick wall, 21:40 for the AAC wall, and 22:40 for the ATIM wall, yielding lag times of 6.45, 8.60, and 10.00 h on 11 January; 6.17, 9.25, and 8.70 h on 12 January; and 6.12, 8.65, and 9.88 h on 13 January for brick, AAC, and ATIM walls, respectively. Compared to the brick wall, the AAC and ATIM walls extended thermal lag by 41.28% and 52.48%, respectively, with the ATIM wall further improving lag time by 7.9% over the AAC wall. These results demonstrate the superior thermal inertia of ATIM, which effectively buffers external temperature fluctuations.

4.2.3. Thermal Amplitude Attenuation Multiple

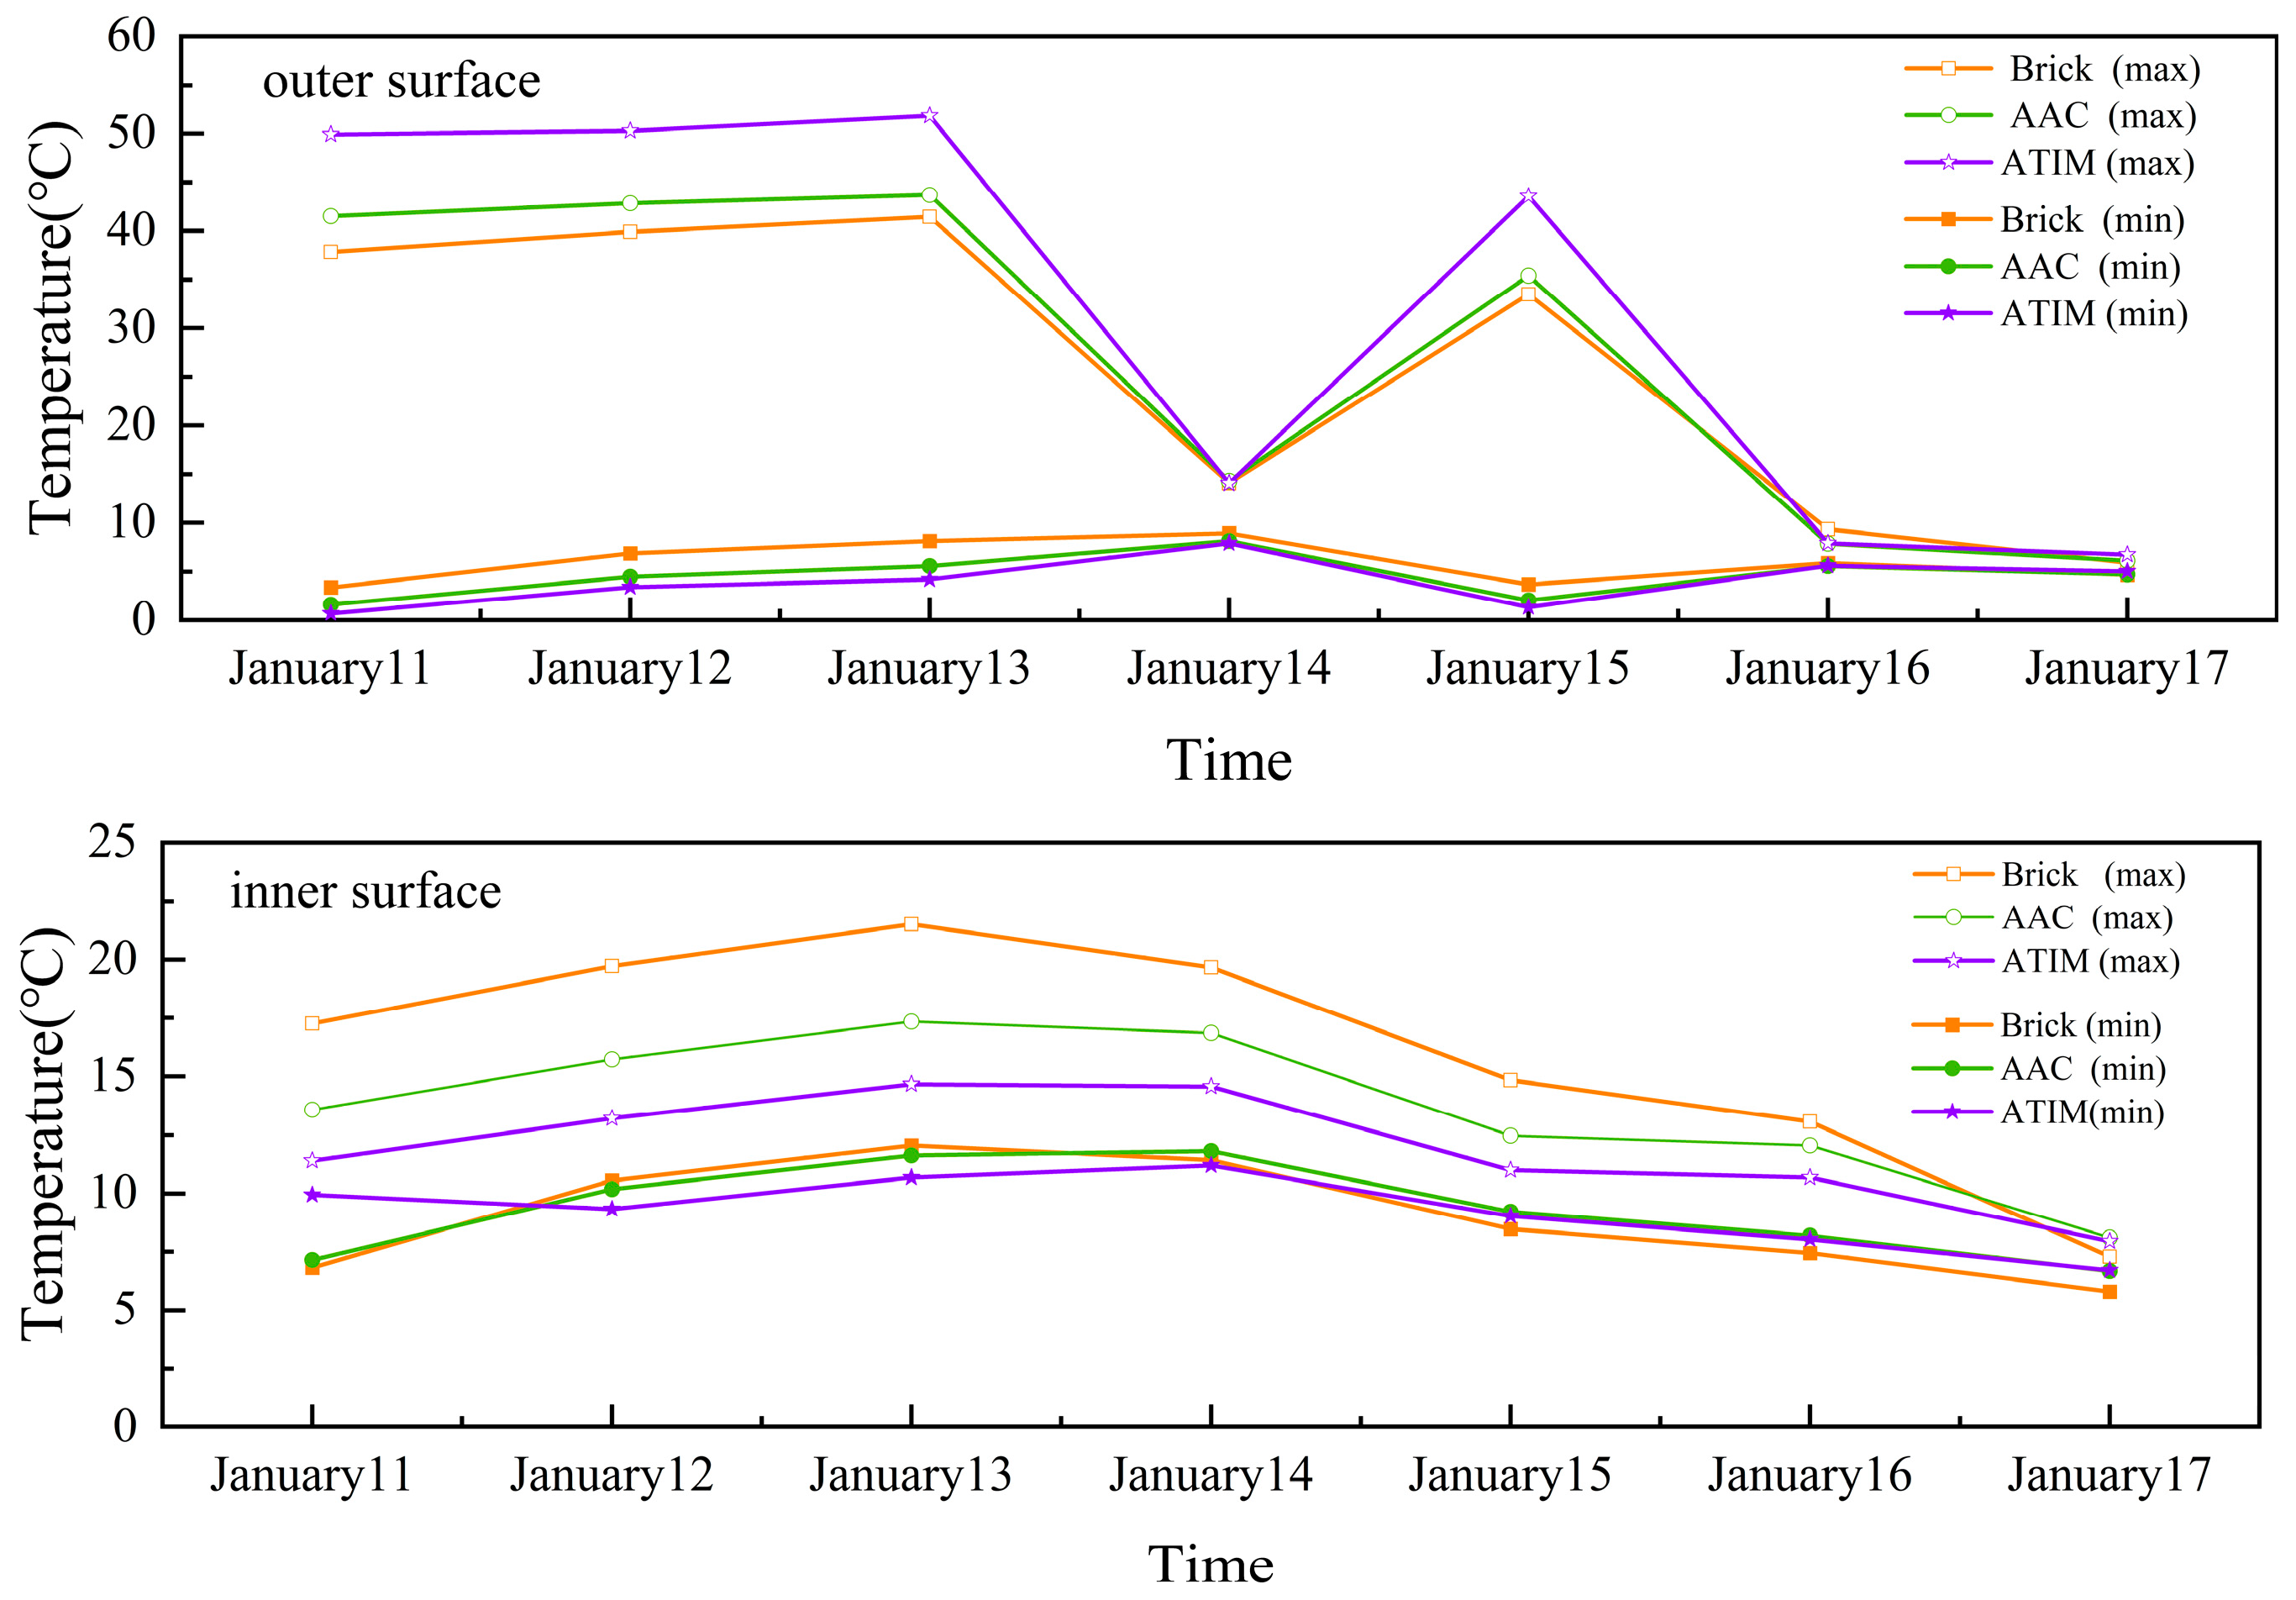
Figure 14 shows that over the preceding three days, the outer–inner surface temperature differentials were 20.93 °C, 20.40 °C, and 20.36 °C for the brick wall; 28.65 °C, 27.82 °C, and 27.85 °C for the AAC wall; and 39.00 °C, 37.82 °C, and 38.31 °C for the ATIM wall. Comparison of peak interior-surface temperatures indicates that ATIM and AAC walls reduced peak internal temperatures by 26% and 14.8%, respectively, relative to the brick wall. These results demonstrate that the ATIM wall provides the greatest attenuation of thermal transfer from exterior to interior surfaces and exhibits superior thermal buffering capacity.
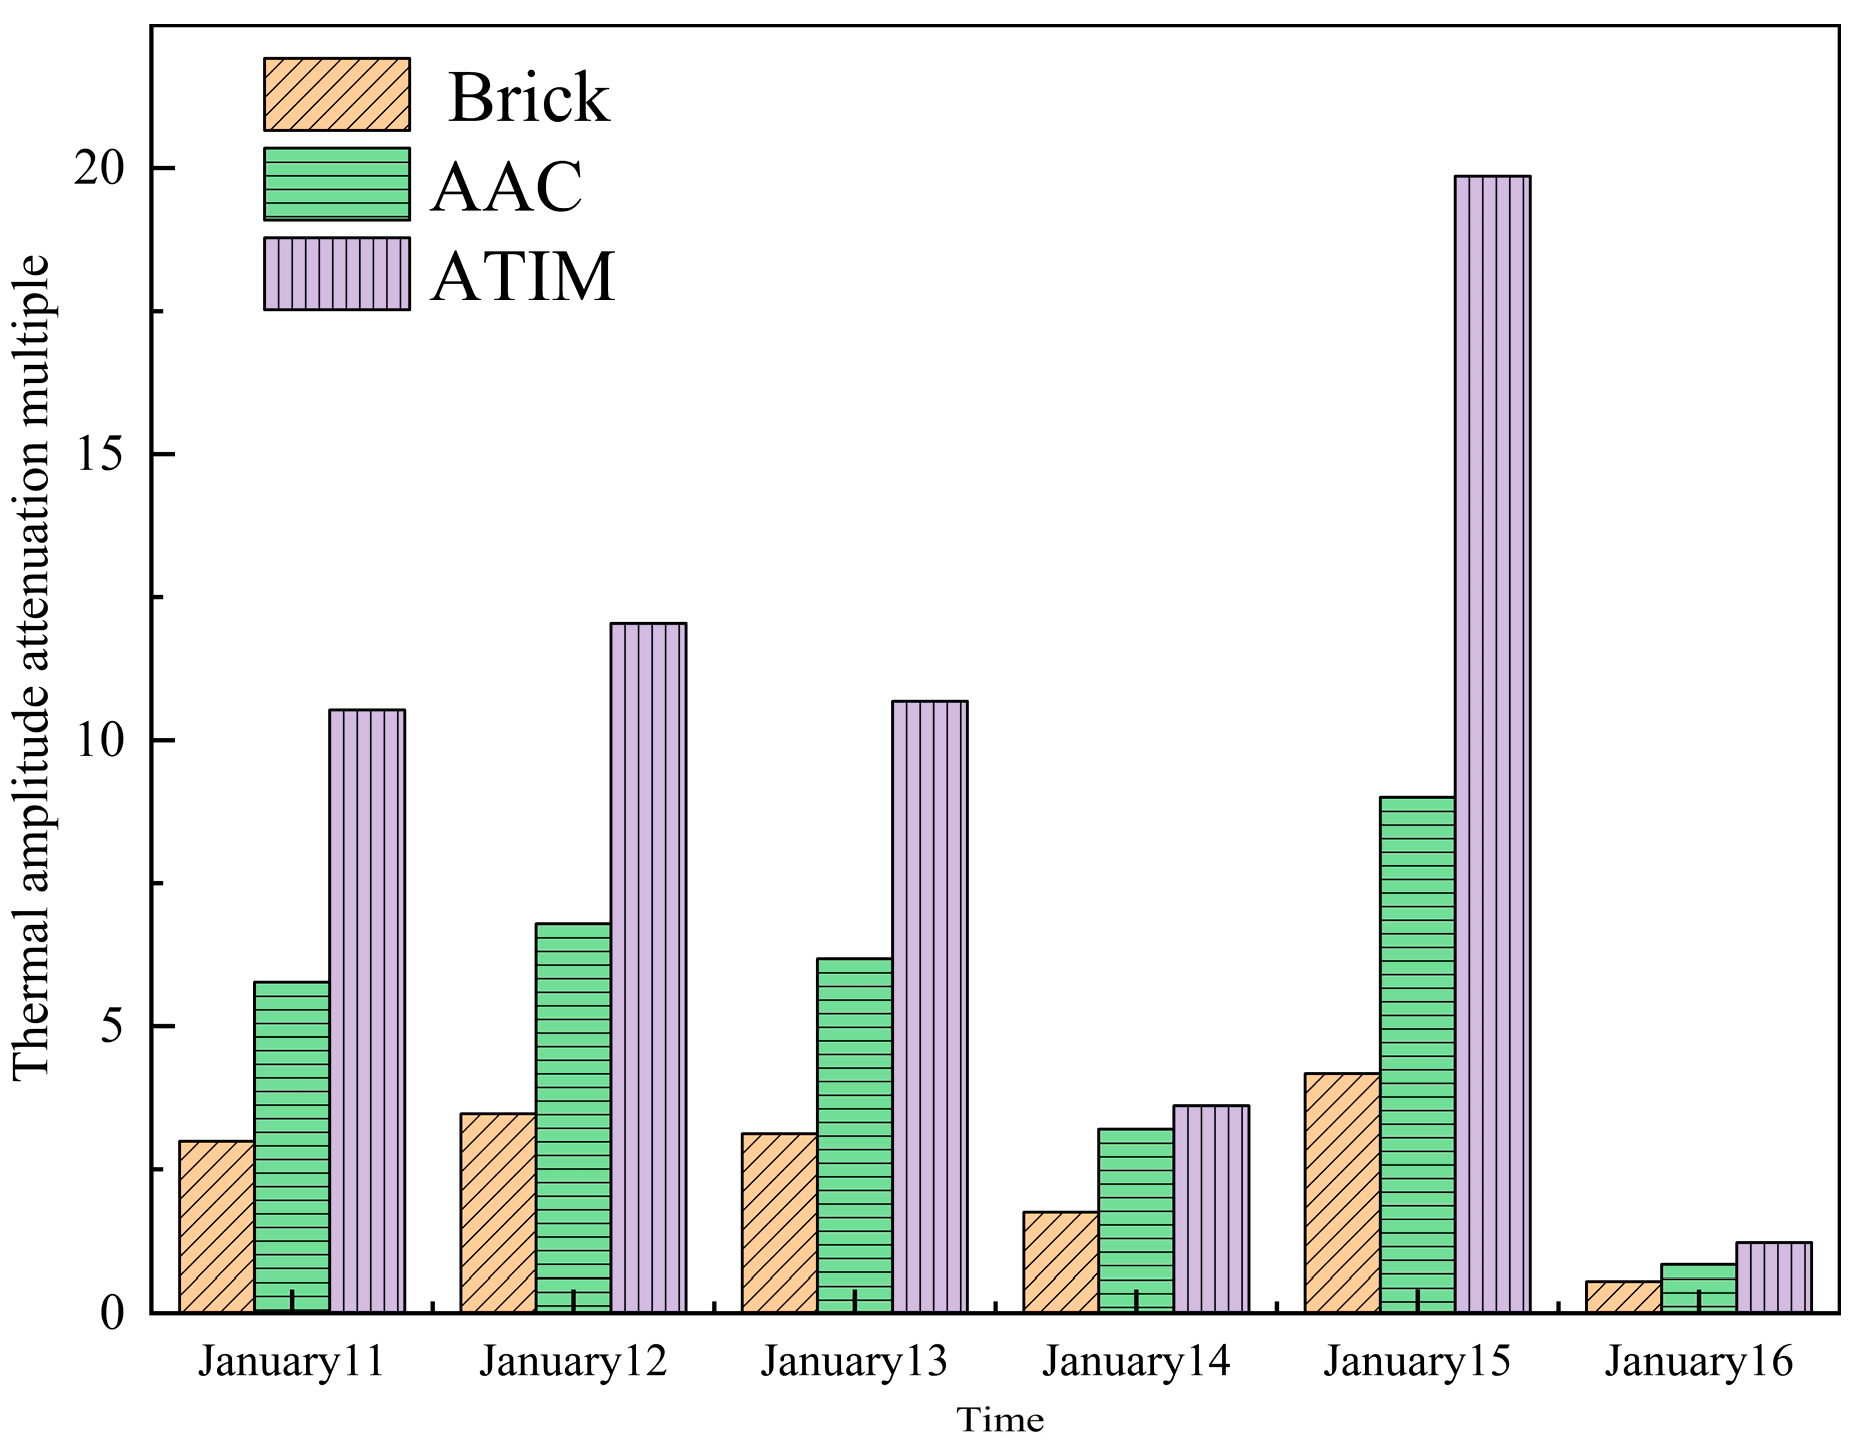
The thermal amplitude attenuation multiple, as defined by Equation (7), is presented in Figure 15. The mean attenuation multipliers for brick, AAC, and ATIM walls are 3.16, 6.25, and 11.08, respectively. Relative to the brick wall, AAC and ATIM walls exhibit improvements of 3.09 and 7.92, while the ATIM wall further surpasses the AAC by 4.83. These results demonstrate that brick walls possess the lowest resistance to thermal waves and the poorest insulation performance; AAC walls offer enhanced resistance and improved insulation; and ATIM walls achieve optimal thermal-wave attenuation and superior insulation. Consequently, an AAC–rock wool sandwich configuration more effectively suppresses temperature fluctuations, stabilizes indoor temperatures, and thereby enhances occupant comfort and building energy efficiency.

4.3. Heat Gain

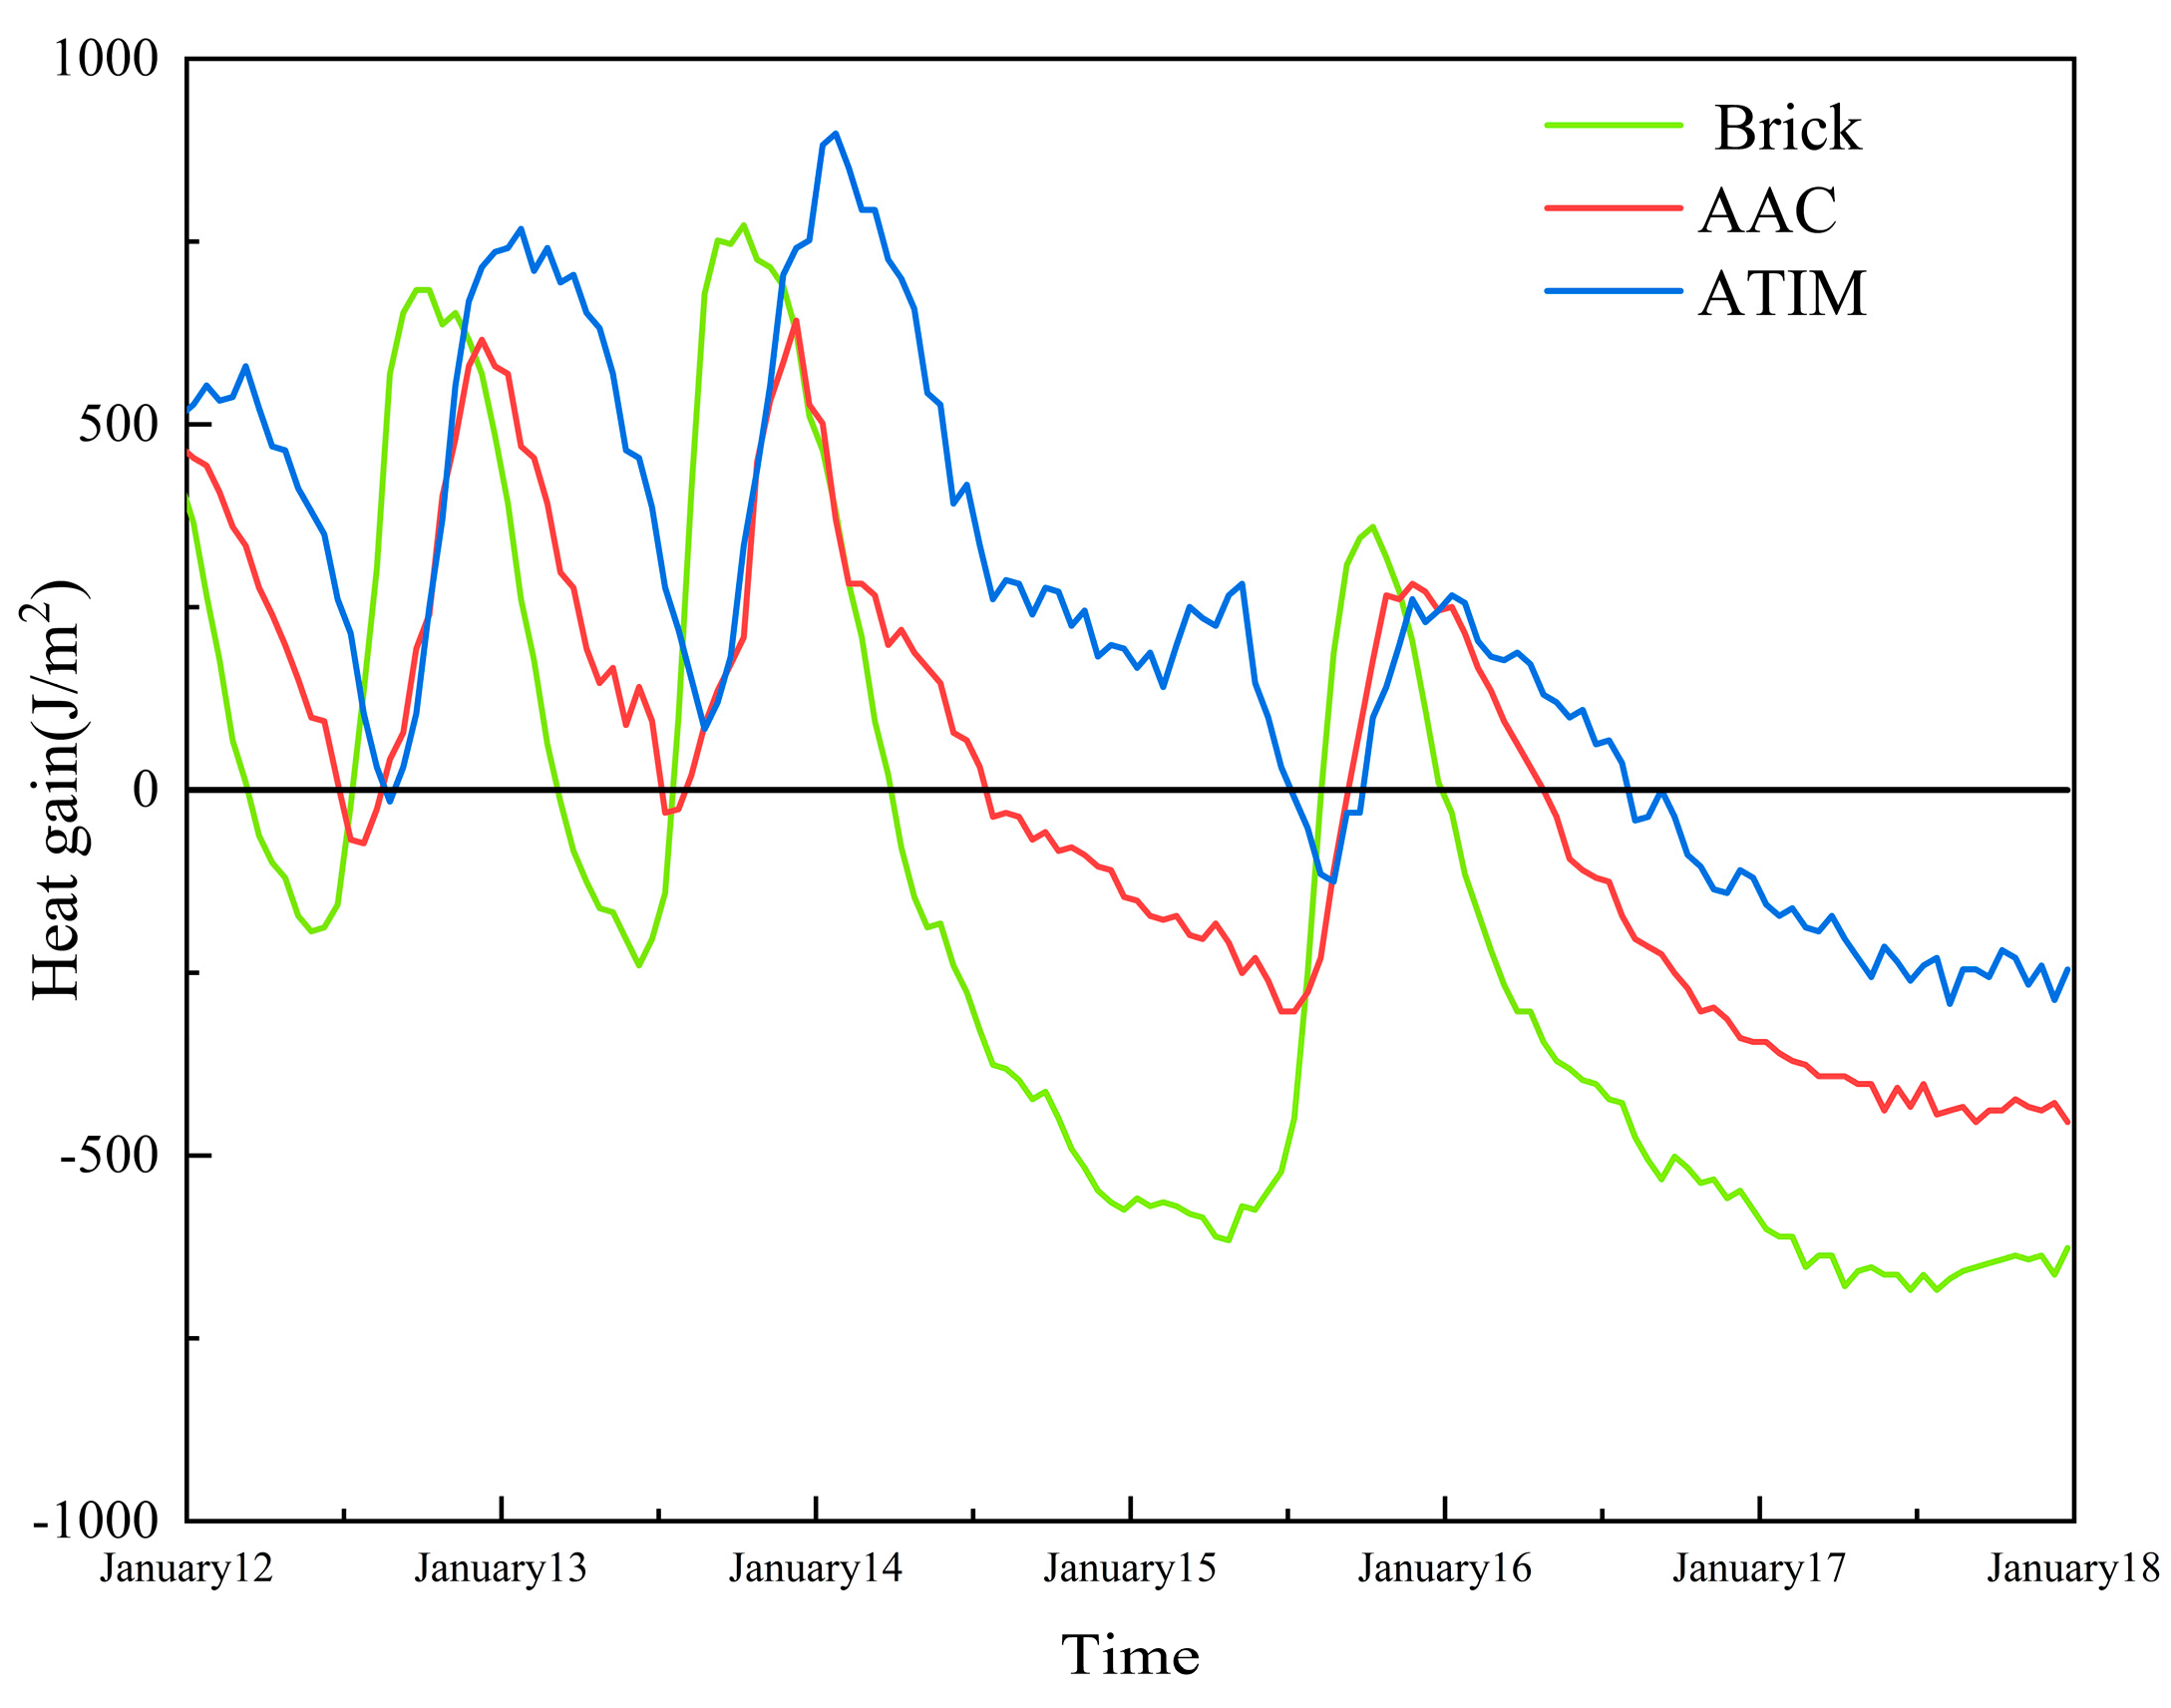
Figure 16 illustrates the results derived from Equations (8) and (9). Between 12 and 14 January, all wall types exhibited increasing heat gain due to solar radiation; however, the peaks in the brick and AAC walls occurred earlier than the peak in the ATIM wall, indicating ATIM’s greater thermal inertia and buffering capacity. From 16 to 18 January, reduced solar input and lower ambient temperatures decreased heat gains across all walls, yet ATIM maintained the smallest variability. During 07:00–19:00, the average heat-flux densities of the brick, AAC, and ATIM walls were −12.88 W/m2, 18.92 W/m2, and 25.73 W/m2, respectively. These results indicate that, under low-temperature winter conditions, the brick wall exhibits pronounced heat loss even in the presence of solar radiation, whereas the AAC and ATIM walls sustain net heat gains. Using Equation (13), the estimated electricity cost savings under low-temperature conditions are approximately 0.036 RMB/(m2·day) and 0.044 RMB/(m2·day) for AAC and ATIM, respectively, demonstrating their significant winter energy-saving advantages.

4.4. Heat Consumption

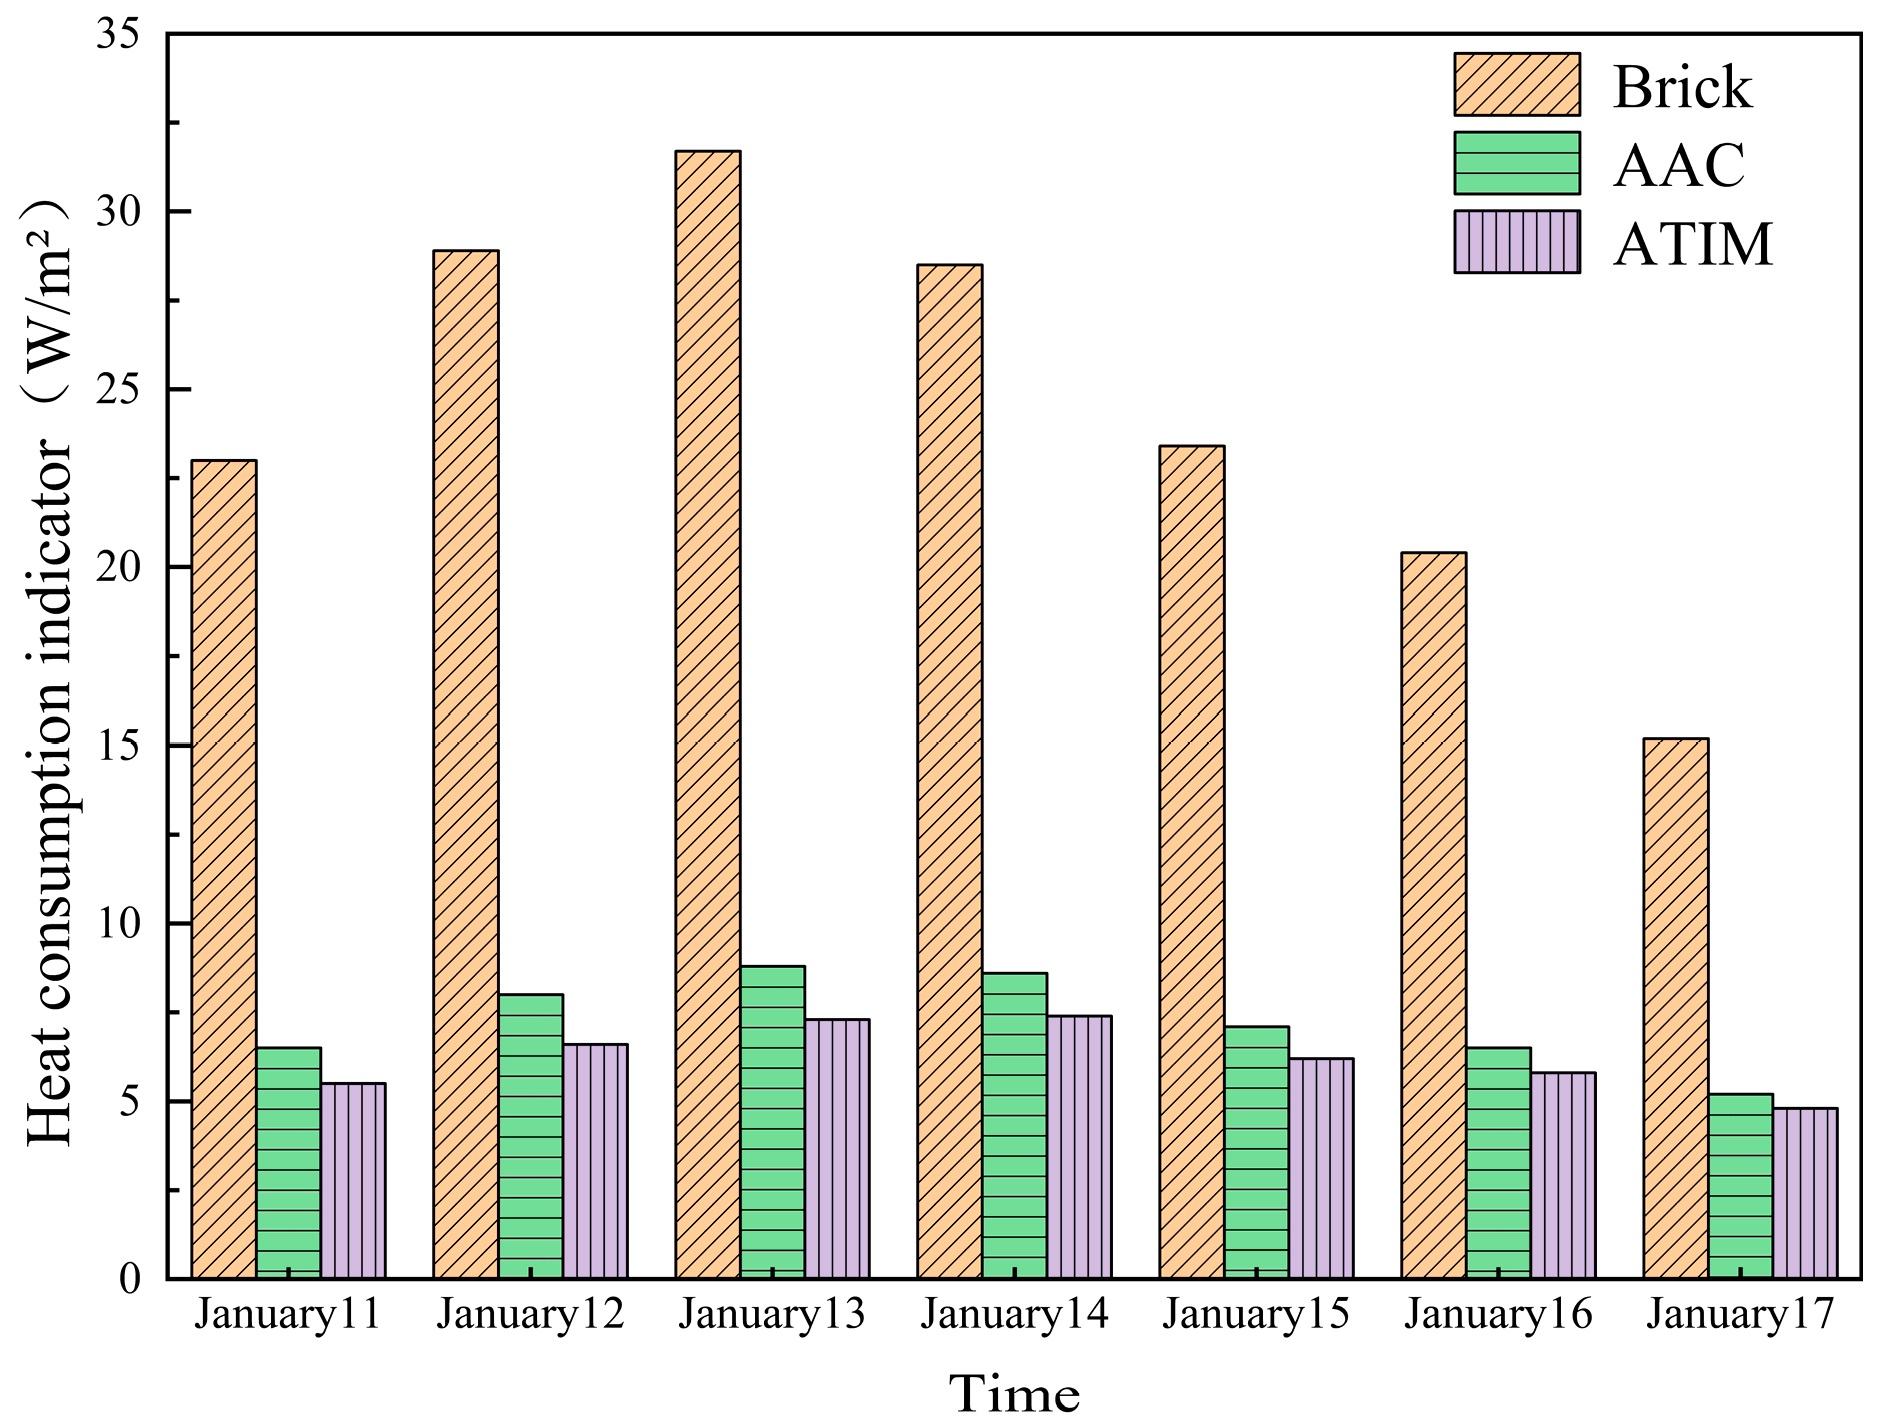
The results derived from Equations (10)–(12) are presented in Figure 17. Significant temporal differences in unit-area heat consumption are observed among the wall materials. The mean heat-consumption indices for brick, AAC, and ATIM walls are 24.44 W/m2, 7.24 W/m2, and 6.23 W/m2, respectively; relative to brick, AAC and ATIM reduce heat consumption by 70.37% and 74.5%, respectively, and ATIM is 14% lower than that of AAC. Elevated consumption between 11 and 13 January corresponds to larger indoor–outdoor temperature differentials driven by intense solar radiation, whereas subsequent declines in ambient temperature and solar input on 16–17 January reduce consumption across all wall types. Nonetheless, brick consistently exhibits the greatest heat loss, while ATIM persistently minimizes heat consumption, underscoring its pronounced energy-saving advantage. These findings confirm that ATIM walls provide superior control of building energy demand and are particularly suited to high-energy-efficiency designs. Although AAC walls improve energy performance relative to brick, they remain inferior to ATIM. Consequently, deploying ATIM walls can effectively reduce energy use, enhance indoor thermal stability, and improve overall energy-utilization efficiency.

4.5. Uncertainty

According to Equation (14), the uncertainties in inner-surface temperature are 4.96%, 1.58%, and 3.81% for brick, AAC, and ATIM, respectively; the corresponding uncertainties in indoor temperature are 4.02%, 2.00%, and 3.84%, respectively. According to Equation (15), the uncertainty of the multichannel data-acquisition instrument ranges from 4.04 to 8.08 μV/(W·m2), and the thermocouple uncertainty is 0.06 °C.

5. Conclusions

In this study, the temperature variation and heat transfer behavior within three models, namely brick, AAC, and ATIM, were investigated and numerically analyzed. Based on the results of the numerical analysis, the following conclusions were drawn:
(1) The average decrease in internal temperature of the three models, brick, AAC, and ATIM, is 13.51%, 9.54% and 6.95%, respectively, under the influence of ambient and solar radiation, and the average decrease under the influence of temperature only reaches 26.16%, 19.38% and 15.73%.
(2) Evaluation of thermal performance indicates heat storage coefficients of 22.17 for brick, 3.79 for AAC, and 3.32 for ATIM. Compared with brick, the thermal inertia index of AAC and ATIM increases by 32.22% and 51.5%, respectively, while their thermal lag times increase by 41.28% and 52.48%. The average thermal amplitude attenuation factors are 3.16 for brick, 6.25 for AAC, and 11.08 for ATIM. These results demonstrate that the AAC sandwich configuration more effectively attenuates temperature fluctuations and maintains stable indoor conditions.
(3) The brick wall exhibits a mean heat flux density of −12.88 W/m2, indicating net heat loss, whereas the AAC and ATIM walls show mean heat flux densities of 18.92 W/m2 and 25.73 W/m2, respectively, reflecting net heat gain and a clear advantage in mitigating thermal losses. Economically, AAC and ATIM yield average electricity savings of approximately 0.036 RMB/(m2·day) and 0.044 RMB/(m2·day), respectively, conferring favorable long-term benefits. Moreover, ATIM’s heat-consumption index is, on average, 14% lower than that of AAC and 74.5% lower than that of brick. These findings underscore ATIM’s superior energy-saving performance, making it particularly suitable for buildings with stringent energy-efficiency requirements by effectively reducing indoor energy demand and stabilizing interior temperatures.
The rock wool core, with ultralow thermal conductivity and moderate heat capacity, affords high through-thickness thermal resistance and suppresses both steady-state and transient heat transfer, while AAC facings add insulation and, owing to their low thermal diffusivity, increase interior time lag and damp temperature waves. This layered synergy—rock wool limiting conduction and AAC enhancing thermal inertia—underpins ATIM’s superior indoor temperature control and reduced heating and cooling demand. From a life-cycle perspective, these attributes translate into substantial energy savings and direct economic benefits. However, validation has largely been confined to hot-summer–cold-winter regions, and systematic assessments in hot-summer–warm-winter climates remain scarce. Practical challenges also persist at the wall–structure interface, where inadequate detailing can cause thermal bridges or moisture ingress, compromising energy performance and durability.

Author Contributions

J.T., formal analysis, investigation, methodology, writing—review and editing, supervision; L.F., formal analysis, investigation, writing—original draft, visualization; C.Y., formal analysis, conceptualization, methodology, writing—review and editing; G.C., conceptualization, methodology, writing—review and editing; J.L., conceptualization, writing—review and editing; R.Z., conceptualization, writing—review and editing. All authors have read and agreed to the published version of the manuscript.

Funding

This research was funded by Anhui Province Key Research and Development Program Projects (2022l07020005); West College of Anhui High-level Talent Research Project (WGKQ2022021); and Innovative Team in Natural Sciences (WXZR202402). The key project of Anhui University Natural Science (2023AH052636).

Data Availability Statement

The data presented in this study are available on request from the corresponding author due to the ownership of the data belonging to the respective institution, and they cannot be disclosed due to privacy concerns.

Conflicts of Interest

The authors declared that there is no conflict of interest.

Abbreviations

Nomenclature
S heat storage coefficient (W/(m2·K))
c specific heat capacity (kJ/(kg·K))
Z time period (24 h)
R thermal resistance ((m2·K)/W)
t time
T temperature (°C)
q heat flux (W/m2)
h heat transfer coefficient (W/(m2·K))
K heat transfer coefficient of the envelope structure
F enclosure structure area
A area (m2)
N number of air changes
V air change volume
Greek Symbols
σ standard deviation
μ mean value
σ L logarithmic standard deviation
μ L logarithmic mean
ρ density (kg/m3)
λ thermal conductivity (W/(m·K))
δ wall thickness (mm)
τ heat transfer time (s)
ξ thermal delay time (h)
Subscripts
i n inter surface
o u t outer surface
i a indoor air
a t r average indoor temperature of all rooms
a o t average outdoor temperature
a air
Abbreviations
Bricksintered brick
AACautoclaved aerated concrete
ATIMautoclaved aerated concrete–rock wool

References

  1. Chen, X.; Lin, B. Towards carbon neutrality by implementing carbon emissions trading scheme: Policy evaluation in China. Energy Policy 2021, 157, 112510. [Google Scholar] [CrossRef]
  2. Gan, L.; Liu, Y.; Shi, Q.; Cai, W.; Ren, H. Regional inequality in the carbon emission intensity of public buildings in China. Build. Environ. 2022, 225, 109657. [Google Scholar] [CrossRef]
  3. Zhang, S.; Wang, D.; Cheng, H.; Song, Y.; Yuan, K.; Du, W. Key technologies and challenges of low-carbon integrated Energy System Planning for Carbon Emission Peak and Carbon Neutrality. Autom. Electr. Power Syst. 2022, 46, 189–207. Available online: https://kns.cnki.net/nzkhtml/xmlRead/xml.html?pageType=web&fileName=DLXT202208021&tableName=CJFDTOTAL&dbCode=CJFD&fileSourceType=1&appId=KNS_BASIC_PSMC&invoice=i3Ib1gFeSpdmPGIXTkjZac+zxtHJOksFMQw1xoKJEMlJOOg0HA1j98X8wqPa/qGUy6OFfxTnODCdynZFr9RO+w4u8zh2eGbmsjL/HuQxctHQwAJiuCCtPRzGn4jwCDdFXIu7MvMwSRXhF8rr5ClcN7r4b/UpisI6tZI5Pd0QcxA= (accessed on 21 January 2022).
  4. Siddique, M.B.; Nielsen, P.S.; Rosendal, M.B.; Jensen, I.G.; Keles, D. Impacts of earlier natural gas phase-out & heat-saving policies on district heating and the energy system. Energy Policy 2023, 174, 113441. [Google Scholar] [CrossRef]
  5. Tan, Y.Y.; Awang, H.; Kaus, N.H.M. Integration of fly ash and ground granulated blast furnace slag into palm oil fuel ash based geopolymer concrete: A review. Sustain. Struct. 2024, 4, 000050. [Google Scholar] [CrossRef]
  6. Gómez, P.J.R.; Yero, A.M.G.; Riverón, G.C. Design and construction of houses with Guadua cane and rice husk in Ecuador as an alternative to local development. Sustain. Struct. 2024, 4, 000047. [Google Scholar] [CrossRef]
  7. Sathiparan, N.; Subramaniam, D.N. Optimizing fly ash and rice husk ash as cement replacements on the mechanical characteristics of pervious concrete. Sustain. Struct. 2025, 5, 000065. [Google Scholar] [CrossRef]
  8. Chowdhury, J.A.; Islam, S.; Islam, A.; Al Bari, A.; Debnath, A.K. Analysis of mechanical properties of fly ash and boiler slag integrated geopolymer composites. Sustain. Struct. 2025, 5, 000073. [Google Scholar] [CrossRef]
  9. Mohamed, O.A.; Zuaiter, H.A.; Jawa, M.M. Carbonation and chloride penetration resistance of sustainable structural concrete with alkali-activated and ordinary Portland cement binders: A critical. Sustain. Struct. 2025, 5, 000075. [Google Scholar] [CrossRef]
  10. Jiang, J.; Ma, B.; Cai, Q.; Shao, Z.; Hu, Y.; Qian, B.; Wang, J.; Ma, F.; Wang, L. Utilization of ZSM-5 waste for the preparation of autoclaved aerated concrete (AAC): Mechanical properties and reaction products. Constr. Build. Mater. 2021, 297, 123821. [Google Scholar] [CrossRef]
  11. Kočí, V.; Maděra, J.; Černý, R. Computer aided design of interior thermal insulation system suitable for autoclaved aerated concrete structures. Appl. Therm. Eng. 2013, 58, 165–172. [Google Scholar] [CrossRef]
  12. Wang, C.; Xiong, D. Leaching assessment of aerated concrete made of recycled shale gas drilling cuttings: Particular pollutants, physical performance and environmental characterization. J. Clean. Prod. 2021, 282, 125099. [Google Scholar] [CrossRef]
  13. Feng, W.; Li, Z.; Long, Q.; Tang, S.; Zhao, Y. Study on the properties of autoclaved aerated concrete with high content concrete slurry waste. Dev. Built Environ. 2024, 17, 100338. [Google Scholar] [CrossRef]
  14. Ji, X.; Pan, T.; Fu, C.; Han, F.; Zhao, W.; Sha, J.; Liu, J. Hydration, microstructure and mechanical properties of cement-based materials with heat-modified autoclaved aerated concrete waste. Constr. Build. Mater. 2024, 419, 135482. [Google Scholar] [CrossRef]
  15. Michelini, E.; Ferretti, D.; Miccoli, L.; Parisi, F. Autoclaved aerated concrete masonry for energy efficient buildings: State of the art and future developments. Constr. Build. Mater. 2023, 402, 132996. [Google Scholar] [CrossRef]
  16. Liu, X.; Peng, X.; Wang, H.; Li, W.; Wang, P. Preparation and performance optimization of non-autoclaved aerated concrete based on orthogonal tests. China Powder Sci. Technol. 2024, 30, 74–84. [Google Scholar] [CrossRef]
  17. Miccoli, L.; Fontana, P.; Silva, N.; Klinge, A.; Cederqvist, C.; Kreft, O.; Qvaeschning, D.; Sjöström, C. Composite UHPC-AAC/CLC facade elements with modified interior plaster for new buildings and refurbishment. Materials and production technology. J. Facade Des. Eng. 2015, 3, 91–102. [Google Scholar] [CrossRef]
  18. Yang, R.; Zhu, J.; Wu, Z.; Wu, Z.; Li, M.; Peng, C. Thermal insulation and strength of autoclaved light concrete. J. Wuhan Univ. Technol.-Mater. Sci. Ed. 2011, 26, 132–136. [Google Scholar] [CrossRef]
  19. Chen, G.; Li, F.; Geng, J.; Jing, P.; Si, Z. Identification, generation of autoclaved aerated concrete pore structure and simulation of its influence on thermal conductivity. Constr. Build. Mater. 2021, 294, 123572. [Google Scholar] [CrossRef]
  20. Yu, C.; Shen, D.; Tu, J.; Chen, G.; Chai, L. Numerical Analysis on Thermal Behavior of Composite Wall Combined Autoclaved Aerated Concrete With Thermal Insulting Material in Summer Day. J. Therm. Sci. Eng. Appl. 2024, 16, 111002. [Google Scholar] [CrossRef]
  21. Stepien, A.; Dachowski, R.; Piotrowski, J.Z. Insulated Autoclaved Cellular Concretes and Improvement of Their Mechanical and Hydrothermal Properties. In Thermal Insulation and Radiation Control Technologies for Buildings; Springer International: Cham, Switzerland, 2022. [Google Scholar]
  22. Sharma, U.; Tariq, S.M.N. Computational Analysis of Autoclaved Aerated Concrete Block Walls for Heat Optimization-A Case Study of Frank & Debbie Islam Management Complex, Aligarh Muslim University, Aligarh, India. In International Conference on Signal, Machines, Automation, and Algorithm; Springer: Singapore, 2023. [Google Scholar]
  23. Sang, G. Study on Construction System of Low Energy consumption Residential Buildings in Tibet Plateau. Ph.D. Thesis, Xi’an University of Architecture and Technology, Xi’an, China, 2009. [Google Scholar]
  24. Zhu, X. Research and Evaluation on Thermal Insulation Performance of the External Envelope Structure of the Fabricated Composite Wall Structure System Dwellings. Master’s Thesis, Xi’an University of Architecture and Technology, Xi’an, China, 2018. [Google Scholar]
  25. Ma, X. Study on Optimization of Thermal Performance of Prefabricated Sandwich Wall Panels in Northwest Cold Regions. Master’s Thesis, Ningxia University, Yinchuan, China, 2021. [Google Scholar]
  26. Xue, W.; Xu, Y.; Zhu, Y. Development of a New Type of Precast Concrete Inorganic Insulation Sandwich Wall Panel and Study on Its Thermal Performance. China Concr. Cem. Prod. 2013, 8, 55–57. [Google Scholar]
  27. Liu, L. The Research on Thermal Insulation Properties and Mechanical Properties of EPS Interlayer Wall. Master’s Thesis, Yangtze University, Jingzhou, China, 2012. [Google Scholar]
  28. O’Hegarty, R.; Reilly, A.; West, R.; Kinnane, O. Thermal investigation of thin precast concrete sandwich panels. J. Build. Eng. 2020, 27, 100937. [Google Scholar] [CrossRef]
  29. Dong, X. Research on the Performance and Design of External Thermal Insulation Sandwich Wall Panels in Severe Cold Areas. Master’s Thesis, Harbin Institute of Technology, Harbin, China, 2021. [Google Scholar] [CrossRef]
  30. Tu, J.; Chen, G.; Yu, C. Experimental study on energy saving and thermal insulation of AAC walls and sandwich structures. Case Stud. Therm. Eng. 2024, 61, 104999. [Google Scholar] [CrossRef]
  31. Yang, H.; Yi, J.; Tian, G.; Tan, H. Application and performance analysis of common organic thermal insulation materials in building. Energy Conserv. 2020, 39, 18–21. [Google Scholar]
  32. Yan, X.; Ye, C.; Yan, Y.; Shi, B.; Qiu, Z. The design and research on a new type of inorganic insulation materials. New Build. Mater. 2014, 41, 73–76. [Google Scholar]
  33. GB/T 11969-2020; Test Methods of Autoclaved Aerated Concrete. China National Standardization Administration: Beijing, China, 2020.
  34. Zhao, J.; Li, J.; Dang, W. Quantitative mechanism of thermal inertia index on thermal stability of building envelope. J. Harbin Inst. Technol. 2018, 50, 182–188. Available online: https://link.cnki.net/urlid/23.1235.T.20181010.1630.032 (accessed on 23 July 2025).
  35. Zhao, J.; Dang, W. Comparative study on parameter systems of building envelope thermal storage performance. Heat. Vent. Air Cond. 2018, 48, 72–79. [Google Scholar] [CrossRef]
  36. Zhang, H. Study on Thermal and Energy Saving Performance of Aerogel Foamed Concrete Insulation Wall. Master’s Thesis, Guangzhou University, Guangzhou, China, 2024. Available online: https://kns.cnki.net/reader/flowpdf?invoice=DuSVJ1jZ6Hkab4DIxz10WUqTlJAdLKKVjaRUhauhwlyDe3%2FnyXq9uqFmArSgS4Z9Q2kFK4uGWwLRbpzDy%2B0695lj%2FF49etIPJUQ%2FHAEwD%2FmUUqpp8axqNbjkS7%2FDAHCORbIKMxS5O0TFAkUADJ%2F%2BUVyEfqLA1QYO5KSzP459fSw%3D&platform=NZKPT&product=CDFD&filename=1024522038.nh&tablename=cdfdlast2025&type=DISSERTATION&scope=trial&dflag=pdf&pages=&language=CHS&trial=&nonce=8606BFCC29C0439580FD1CC6D70E5249&cflag=pdf (accessed on 16 February 2025).
Figure 1. Structural layout of the experimental room (unit: mm).
Buildings 15 03332 g001
Figure 2. A 1-1 cross-sectional diagram (unit: mm).
Buildings 15 03332 g002
Figure 3. South wall materials and experimental models: (a) sintered brick; (b) AAC; (c) TIM (rock wool); (d) brick wall; (e) AAC wall; (f) ATIM wall; (g) experimental model.
Buildings 15 03332 g003
Figure 4. Multi-channel collector.
Buildings 15 03332 g004
Figure 5. Solar radiometer.
Buildings 15 03332 g005
Figure 6. Thermocouple.
Buildings 15 03332 g006
Figure 7. Thermocouple layout points.
Buildings 15 03332 g007
Figure 8. Comparison of indoor and outdoor temperatures.
Buildings 15 03332 g008
Figure 9. Average of ambient and room temperatures.
Buildings 15 03332 g009
Figure 10. Logarithmic normal distribution.
Buildings 15 03332 g010
Figure 11. Daily variance of temperature.
Buildings 15 03332 g011
Figure 12. Comparison of heat storage coefficient and thermal inertia index of brick, AAC and ATIM materials.
Buildings 15 03332 g012
Figure 13. Comparison of thermal delay time of brick, AAC and ATIM materials.
Buildings 15 03332 g013
Figure 14. Maximum and minimum temperatures of inner and outer surfaces of brick, AAC, ATIM.
Buildings 15 03332 g014
Figure 15. Thermal amplitude attenuation multiple for brick, AAC, and ATIM materials.
Buildings 15 03332 g015
Figure 16. Heat gain.
Buildings 15 03332 g016
Figure 17. Heat consumption indicators.
Buildings 15 03332 g017
Table 1. Material parameters.
MaterialDensity (kg/m3)Thermal Conductivity (W/m·K)Specific Heat Capacity (J/kg·K)
Sintered Brick27001.0710
AAC476.6120.128900
Rock Wool1200.04750
Table 2. Material composition of AAC panels.
Raw MaterialWaterCementLimeActivatorAluminum Powder
3850 kg160 kg350 kg300 kg1.7%2.9%
Table 3. Parameters of the logarithmic normal distribution.
σ μ σ L μ L
Environment4.547.371.512.00
Brick3.4712.391.242.52
AAC2.3411.210.852.42
ATIM1.619.990.482.30
Disclaimer/Publisher’s Note: The statements, opinions and data contained in all publications are solely those of the individual author(s) and contributor(s) and not of MDPI and/or the editor(s). MDPI and/or the editor(s) disclaim responsibility for any injury to people or property resulting from any ideas, methods, instructions or products referred to in the content.