Article

Towards a Generative Frame System of Ancient Chinese Timber Architecture: Structural Generation and Optimization of “Column Reduction” and “Column Relocation”

1
School of Architecture and Urban Planning, Chongqing University, Chongqing 400044, China
2
Key Laboratory of New Technology for Construction of Cities in Mountain Area, Chongqing University, Chongqing 400044, China
*
Author to whom correspondence should be addressed.
Buildings 2025, 15(18), 3329; https://doi.org/10.3390/buildings15183329
Submission received: 21 July 2025 / Revised: 18 August 2025 / Accepted: 26 August 2025 / Published: 15 September 2025
(This article belongs to the Section Architectural Design, Urban Science, and Real Estate)

Abstract

In traditional Chinese timber architecture, “column reduction” (Jian Zhu Zao) and “column relocation” (Yi Zhu Zao) enhances spatial continuity, yet often produces bending-dominated, material-intensive frames. This study develops a generative frame system that encodes raised beam logic into a parametric line-model workflow and couples it with simulation-based optimization. Informed by case analysis, the tool implements three lateral strategies—ridge-support revision, insertion of inclined members, and inclination of originally horizontal members—and one longitudinal strategy—longitudinal truss formation—whose use is governed by a user-defined historical authenticity parameter. Structural responses were evaluated using Karamba3D, and cross-section sizing was searched using Wallacei under gravity-dominant loading. The results indicate clearer load paths, greater axial-force participation, and reduced bending, yielding lower maximum displacements at comparable self-weight; moreover, the performance ranking aligns with the calibrated authenticity loss schedule, suggesting that the authenticity controller also acts as a practical proxy for expected stiffness gains. The framework improves design and modeling efficiency while offering quantitative decision support for culturally sensitive conservation and imitation design. Limitations include line-model idealization, simplified timber and joint behavior, gravity-only loading, and a modest historical corpus. The approach is extensible to other traditional systems via parameter and rule adaptation.

1. Introduction

Architectural heritage serves as a critical vessel of human civilization and traditional construction wisdom, with its preservation and revitalization constituting essential subjects in contemporary architectural research [1]. Current studies primarily focus on the physical structures of architecture and the cultural implications and historical values they embody [2]. Timber structures, widely disseminated across East Asian countries such as China, Japan, and Korea due to their environmental friendliness, affordability, and resource accessibility, have become a significant focus within architectural heritage research [3,4,5]. Present research on timber architectural heritage conservation often adopts multidisciplinary perspectives, including philosophy, esthetics, and mechanics [6,7,8,9]. From the perspective of structure, contemporary studies not only extend the profound understanding of material properties and structural systems embedded in traditional construction techniques, but also leverage modern experimental methodologies to establish scientific performance evaluation systems. For example, Yinlan Shen et al. investigated the seismic performance of traditional timber–stone hybrid residential structures in Northern China using static cyclic tests, revealing that stone-filled walls significantly enhance lateral stiffness and ductility, although incompatibility between timber and stone deformation can result in localized structural damages [10]. Ru-yuan Yang et al. explored the failure mechanisms, repair principles, and reinforcement methods of traditional timber structures, highlighting their technological inadequacies and providing essential guidelines for conserving irreplaceable timber heritage [5]. Furthermore, Yidan Han et al. employed Computational Fluid Dynamics (CFD) simulations and Finite Element Method (FEM) analyses to quantify the effects of terrain and surrounding building environments on the wind conditions of the Baoguo Temple, establishing a wind-induced response prediction model that accounted for structural aging, thereby addressing a significant gap in traditional timber architecture wind load research [10].
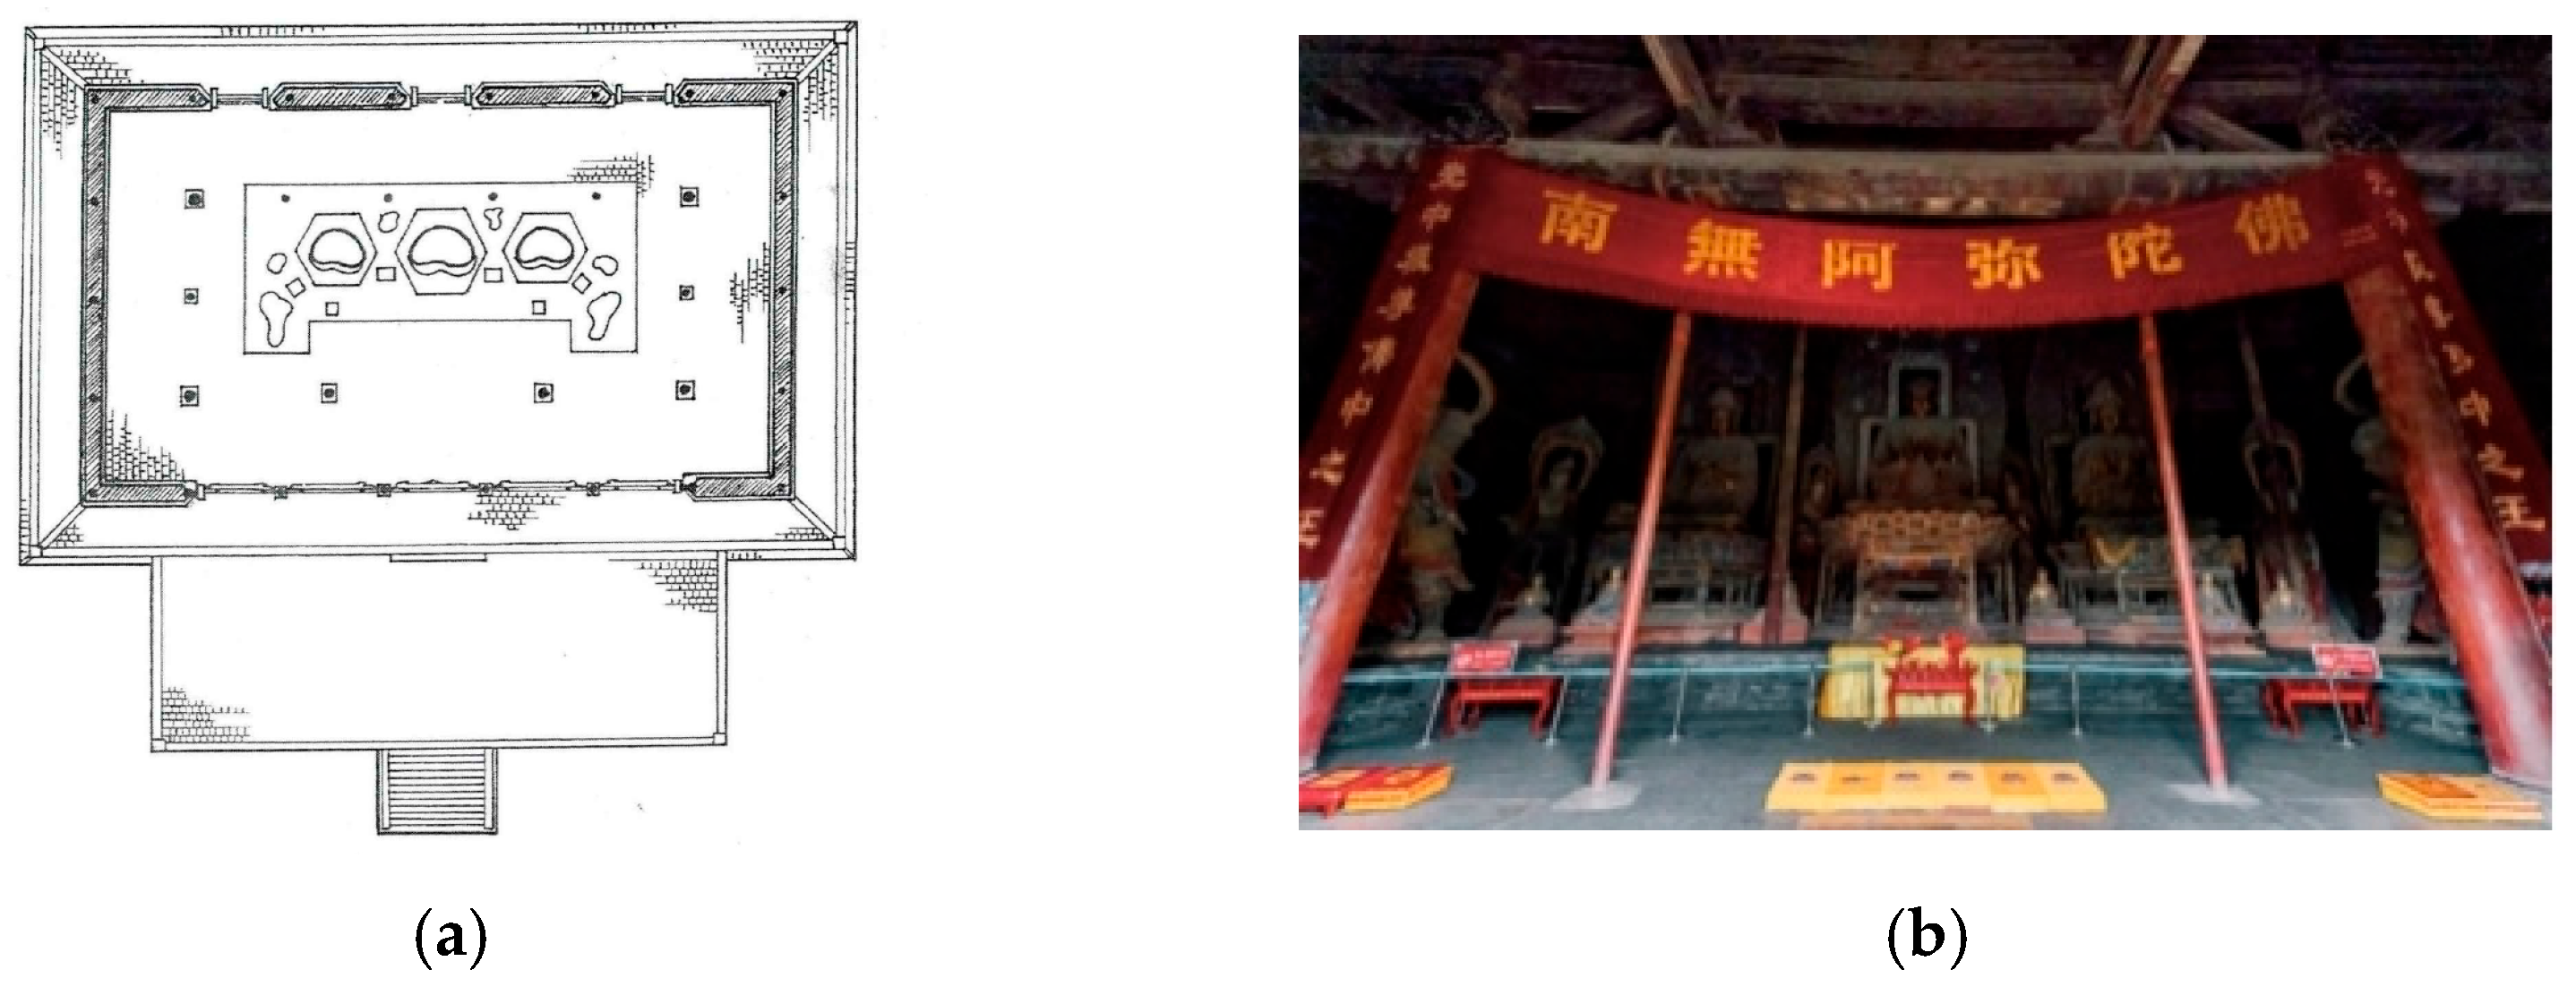
Ancient Chinese timber architecture possesses a long history and mature technological tradition. The Yingzao Fashi, an important architectural treatise compiled during the Northern Song Dynasty (1103 AD), systematically documents four types of column grids and nineteen hall layouts, reflecting the high degree of standardization in traditional construction and revealing flexible design concepts [11]. In prevalent raised beam structural systems, roof loads are transmitted downward layer by layer through purlins, short posts, and beams, forming an orthogonal load transfer pathway (Figure 1a), thus shaping the unique structural logic and esthetic expression of Chinese timber architecture [12]. However, this structural system demonstrates evident inefficiencies in material utilization, with beams experiencing high stress concentrations at their top and bottom edges while leaving the neutral axis relatively unstressed, resulting in underutilized central cross-sectional capacity [13]. This uneven stress distribution not only leads to material waste, but also limits further structural span enhancements [14]. “Column reduction” (“Jian Zhu Zao”) and “column relocation” (“Yi Zhu Zao”) in ancient Chinese timber construction represent spatial optimization strategies deeply informed by structural and material wisdom. “Column reduction” involves strategically omitting interior columns while maintaining the regularity of peripheral column grids, effectively reconstructing load transfer pathways by reducing vertical support points [15,16,17,18]. “Column relocation” involves deliberately deviating columns from standard grid positions to fulfill specific functional requirements, thereby altering spatial and visual relationships to enhance ceremonial significance [19,20]. However, these practices will increase horizontal member spans, posing structural design challenges (Figure 1b). Ancient craftsmen addressed these structural issues by enlarging member cross-sections, converting straight beams into curved beams (moon beams) and adding decorative brackets [19]. Nonetheless, these localized reinforcements did not fundamentally enhance overall structural efficiency. This is because such measures merely address stress concentrations in specific components rather than optimizing the load transfer mechanism of the entire frame. The orthogonal structural system remained bending-dominated, with most horizontal members still subject to uneven stress distribution—high stress at the edges and underutilization at the neutral axis—resulting in persistent material waste. Lacking systematic structural theories, craftsmen relied heavily on empirical adjustments, which constrained the systematic advancement of traditional methods [21].
Parametric digital technologies offer a more systematic and scientific perspective for architectural heritage conservation, providing new paradigms to address historical challenges [22,23,24,25]. Given the extensive and stringent regulations of Chinese ancient architectural components, current computational studies primarily utilize modular systems such as “Cai Fen Zhi” or “Dou Kou Zhi” for rapid and precise modeling. For instance, Xu Wang et al. developed a Grasshopper-based parametric algorithm for generating bracket sets and tiles according to Yingzao Fashi [26]; Ren Pu et al. used Bayesian networks to identify structural combinations from 3D model data [27]. Nevertheless, systematic generative parametric studies specifically addressing “column reduction” and “column relocation” remain scarce. Notably, while parametric digital technologies have advanced architectural heritage research—with studies utilizing modular systems for rapid modeling—systematic computational optimization methods specifically targeting “column reduction” and “column relocation” remain scarce. This gap limits the ability to scientifically balance structural performance, material efficiency, and historical authenticity in heritage conservation and imitation design.
This study innovatively constructs a three-stage “case-driven—generative system—simulation validation” framework integrating digital technology with traditional construction logic. Initially, historical architectural cases are analyzed to distill structural wisdom and shortcomings associated with “column reduction” and “column relocation,” proposing optimization pathways for timber structures. Subsequently, parametric tools automatically generate raised beam structural line models from user-defined column grid inputs and then, based on a user-defined historical authenticity parameter, produce optimized model variants that balance heritage fidelity with contemporary energy efficiency requirements. Ultimately, structural simulation tools are employed to validate the performance of these optimized models. This generative design methodology not only bridges the digital gap inherent in traditional construction techniques, but also provides a rigorous, science-based decision-making foundation for material renewal in heritage conservation.

2. Materials and Methods

This study innovatively constructs a three-stage “case-driven—generative system—simulation validation” framework (Figure 2), systematically integrating traditional timber architectural wisdom and contemporary digital technology, aiming to provide scientifically robust solutions for structural optimization in ancient building restoration and imitation design. The detailed implementation process is as follows:
(1)
Stage One: Case-Driven—Extraction of Traditional Construction Prototypes
This stage focuses on a systematic analysis of representative cases of “column reduction” and “column relocation” from the Song Dynasty (960–1279 CE) to Qing Dynasty (1644–1912 CE). Using field investigations, drawing analyses, and literature reviews, typical architectural examples from various regions, periods, and types were collected and studied. An in-depth analysis of beam-frame systems and load transfer paths within these cases was conducted. Using multidimensional classification and comparative analysis, the intrinsic relationship and trade-off mechanisms between structural economy and historical authenticity were explored. Ultimately, universally applicable structural response prototypes were distilled, laying a solid theoretical foundation for subsequent parametric tool development.
(2)
Stage Two: Generative System—Development of Structural Generation and Optimization System
In this stage, the “Generative Structural Generation and Optimization System” was developed using the Rhino8/Grasshopper platform combined with Python 3.10 scripting. This system comprises two core modules: (1) A Frame Generation Module, which formulates algorithmic rules based on the basic principles of traditional raised beam structures, allowing for users to automatically generate structural line models conforming to raised beam framework regulations by inputting basic column-grid adjustments. (2) A Frame Optimization Module, which digitally encodes the structural prototype logic extracted from the first stage, automatically matches corresponding structural optimization strategies based on user-defined parameters for historical authenticity, and produces optimized structural line model solutions.
(3)
Stage Three: Simulation Validation—Evaluation of Structural Mechanical Performance
In this stage, the Karamba3D platform was utilized for numerical simulation analyses of structural line models to assess improvements in structural efficiency after optimization. The simulation model strictly adhered to traditional timber member cross-sectional forms and material properties, considering hinged support conditions at column bases, and applying self-weight and uniformly distributed linear loads on the purlins. Additionally, employing the Wallacei multi-objective genetic algorithm, structural self-weight and maximum displacement were set as optimization objectives, generating a series of Pareto-optimal solution sets using the parametric adjustment of member cross-sectional dimensions. By comparing the degree of optimization before and after implementation regarding average structural self-weight and maximum deformation, the effectiveness of optimization strategies in enhancing traditional timber architectural structural performance was systematically validated.

3. Research Results

3.1. Stage 1: Case Studies for Algorithm Logic Identification

In ancient Chinese timber architecture, the primary structural function of beam frames is to transfer roof loads transmitted by purlins to column tops. To fundamentally enhance material utilization efficiency, the structural design strategy should aim to minimize internal bending moments, extensively utilize axial members, and align members along axial force pathways [28]. Typically, the line connecting purlins and column tops is diagonal, inevitably introducing inclined members into the structure (Figure 3a).
However, inclined members appear notably unconventional within the orthogonal structural system predominant in Chinese ancient architecture. With increasing symbolic and cultural value, the construction of ancient Chinese timber architecture became more ritualized, and the flexible use of inclined members gradually diverged from the trend of orthogonal structural systems [29]. Nevertheless, inclined members appeared early in timber architecture and persisted through feudal times, providing valuable insights for larger-span roof frame designs resulting from column reduction and relocation.
Horizontal members in ancient Chinese timber architecture primarily include beams and tie beams, with beams directly participating in roof load transmission through bending, while tie beams primarily perform tensile and compressive roles. Typically, beams are arranged laterally and tie beams longitudinally, forming interconnected frames (Figure 3b). Horizontal members between frames ensure coordinated structural behavior. Therefore, this research analyzes inclined members’ applications separately in lateral and longitudinal directions.

3.1.1. Lateral Load Transfer Utilizing Inclined Members

(1)
Cha Shou (Forked Brackets)
Cha Shou (forked brackets), along with supporting brackets (Tuo Jiao), are the most commonly used inclined members within a roof frame. Although the following examples do not explicitly involve “column reduction” or “column relocation,” the structural logic they convey remains highly instructive. The ridge purlin can be supported in four basic ways, as illustrated in (Figure 4).
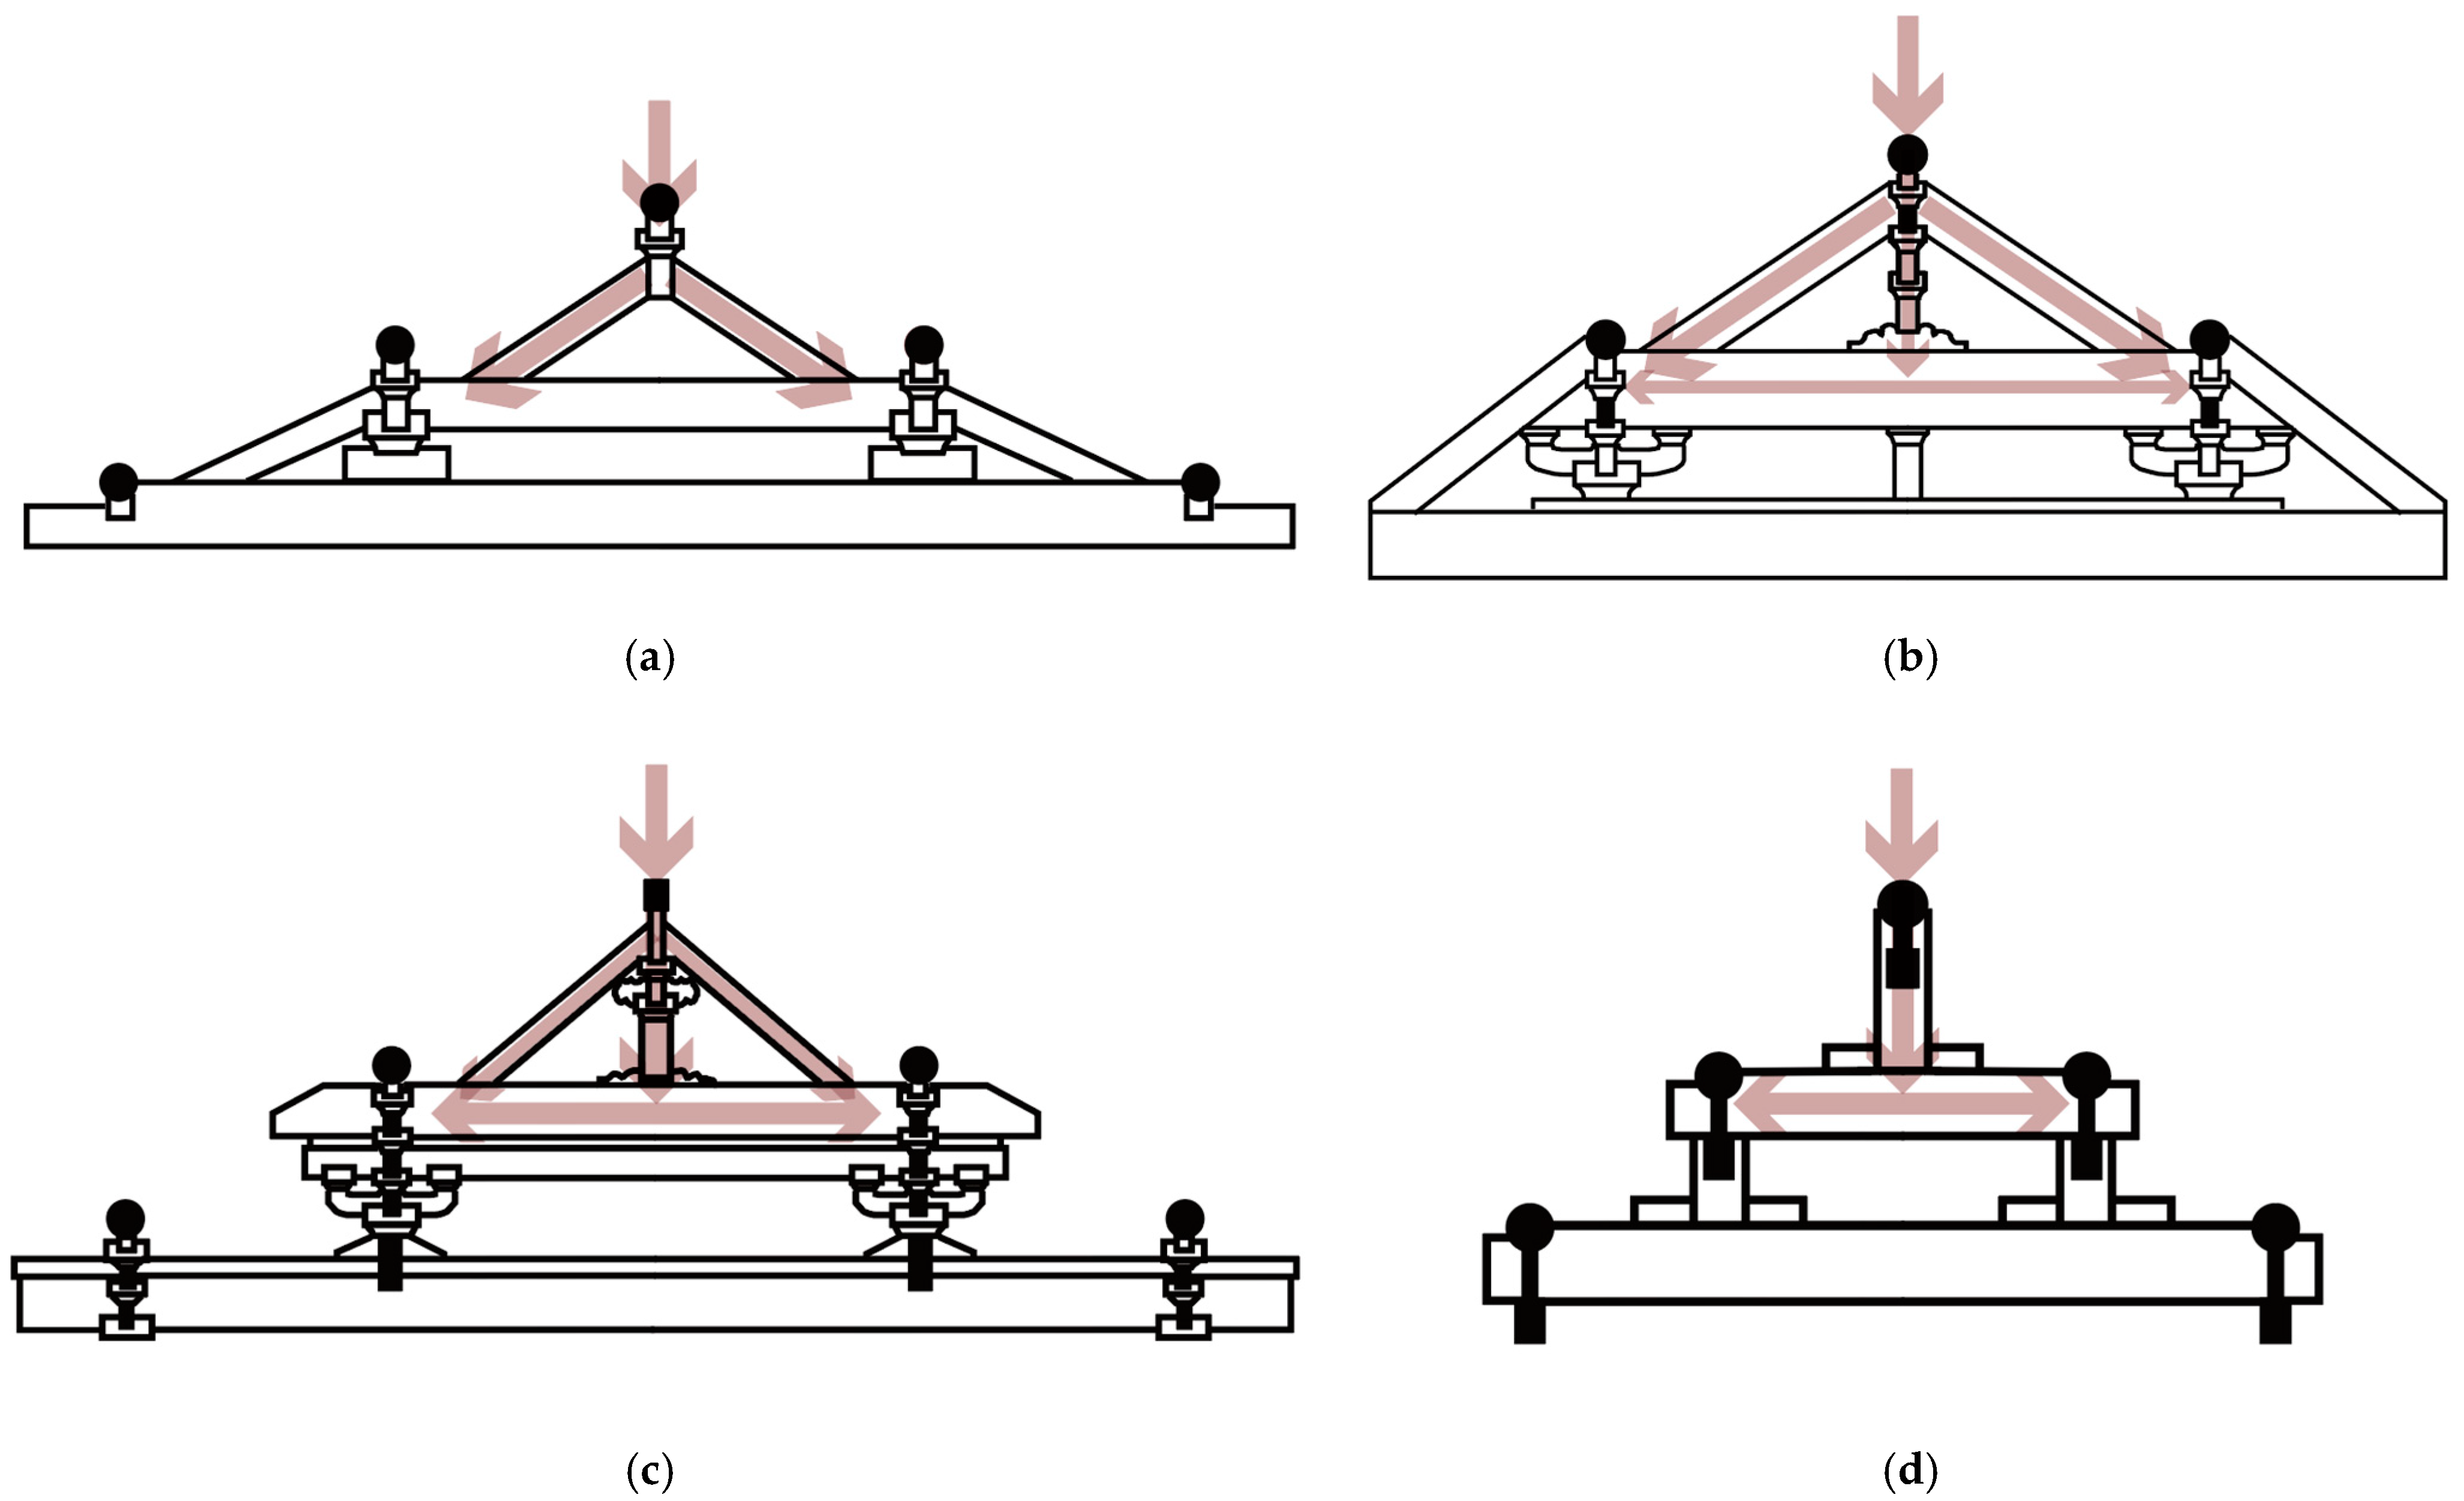
As depicted in Figure 5a, the Main Hall of Foguang Temple on Mount Wutai, Shanxi Province, uniquely employs only Cha Shou to support the ridge purlin. Here, roof loads are directly transferred via inclined Cha Shou, with horizontal components balanced by axial tension in the tie beams. This pathway ensures efficient material utilization through axial forces.
In Figure 5b, the Gate of Dule Temple in Jixian, Hebei Province, uses both Cha Shou and short post; however, the Cha Shou are substantial, and the short post usage is minimal. The prominent supporting brackets below directly support the purlin. The greater dimensions of the Cha Shou compared to the short post clearly indicate the craftsmen’s intent for the Cha Shou to bear most of the roof load.
In Figure 5c, the Main Hall of Shanhua Temple in Datong, Shanxi Province, also adopts Cha Shou alongside short post, but here the use of Cha Shou is relatively minor, and short posts dominate. Consequently, the roof loads are primarily transferred via short posts and horizontal bending in beams, resulting in lower material efficiency.
Figure 5d illustrates the En Hall of the Ming Tombs in Changping, Hebei Province, which exclusively employs short posts, omitting both Cha Shou and supporting brackets. In this scenario, the entire roof load of the ridge purlin is transferred via short posts to beams, resulting in even lower material utilization.
From a structural efficiency perspective, the evolution from large, inclined Cha Shou and supporting brackets to their eventual elimination represents a regressive trend in ancient Chinese timber architecture. As construction practices matured, inclined members gradually disappeared due to prevailing esthetic preferences, despite their structural efficiency, provided that structural safety was maintained. Optimizing the ridge purlin support method is designated lateral optimization strategy 1.
(2)
Addition of Inclined Members to Existing Raised Beam Frame
In the Guanyin Hall of Chongfu Temple in Shuozhou, Shanxi Province, inclined members appear in unconventional positions due to the “column reduction” approach. As shown in the plan diagram (Figure 6a), the removal of the front inner columns prevents direct vertical support for the upper purlins. These newly introduced inclined members form triangular frameworks with existing inclined supports, efficiently transferring roof loads from the upper purlins to the front eave and rear inner columns, ensuring a clear and efficient load path (Figure 6b,c).
Similarly, at Longxing Temple’s Revolving Sutra Cabinet Hall in Zhengding, Hebei Province, the existence of the revolving sutra cabinet necessitated relocating the inner columns laterally, thereby increasing the span. To mitigate additional loads, inclined members were introduced to transfer the purlin loads. Liang Sicheng’s manuscripts explicitly label these members as “TRUSS,” acknowledging their function analogous to modern truss structures.
These inclined members primarily carry axial forces, effectively reducing bending moments in beams, sharing structural principles with the Cha Shou and short posts discussed previously. While slightly disrupting the orthogonal order of raised beam frames, these structures provide enhanced stability and material economy. Adding inclined members to existing raised beam frames is designated lateral optimization strategy 2.
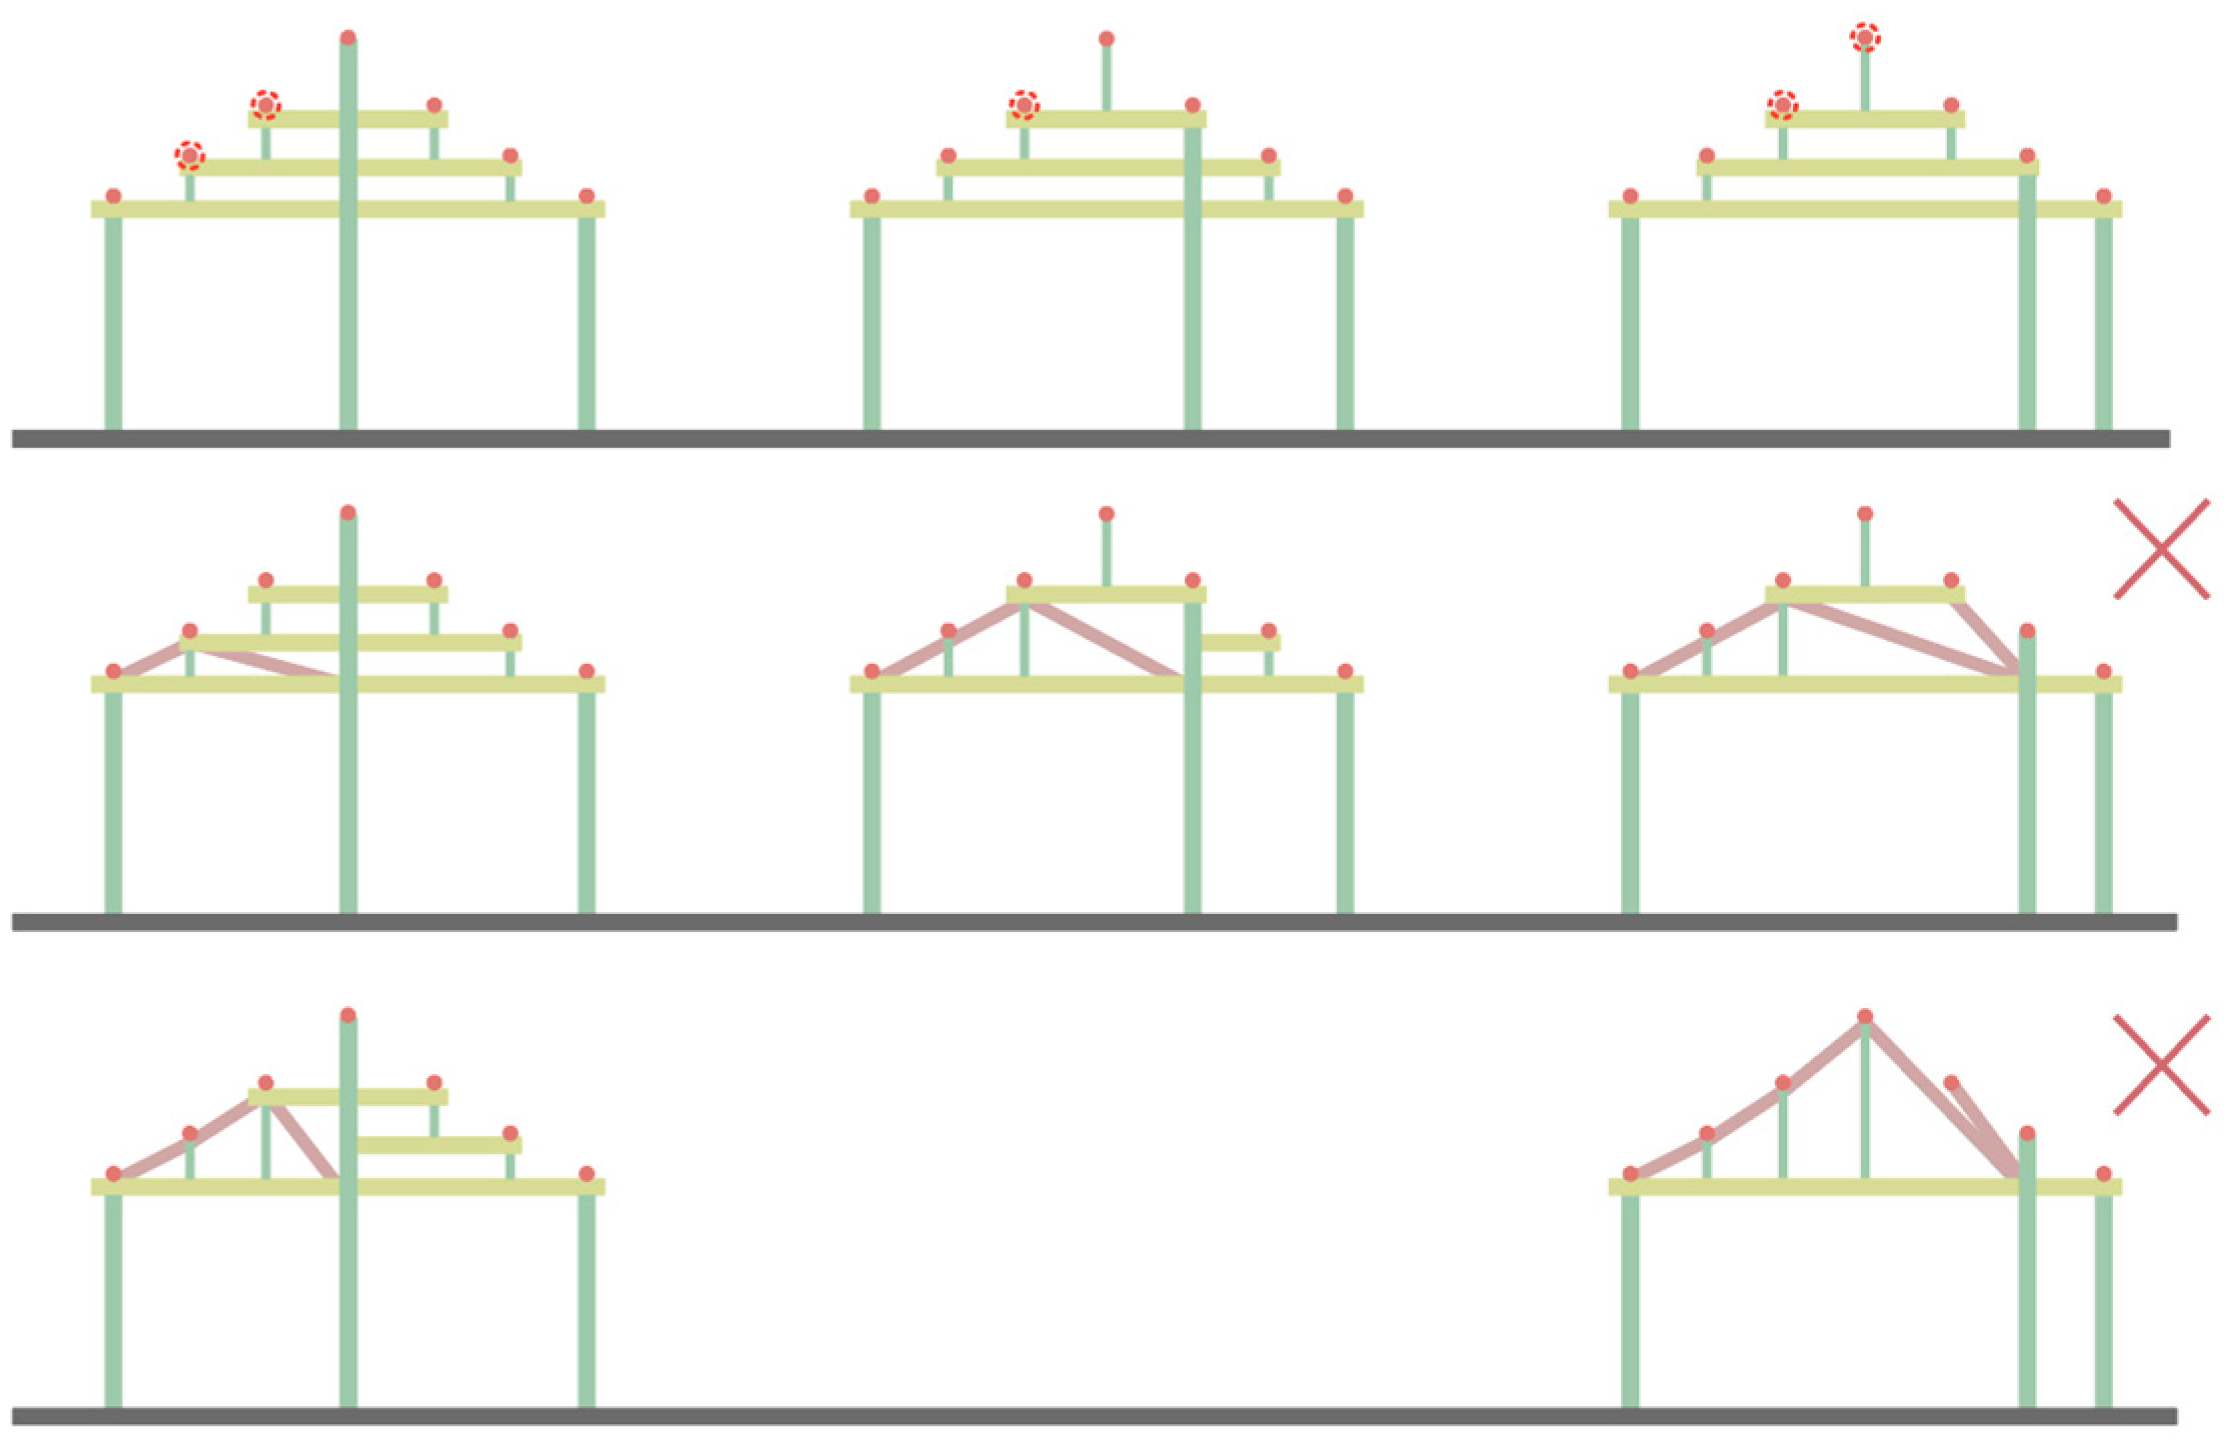
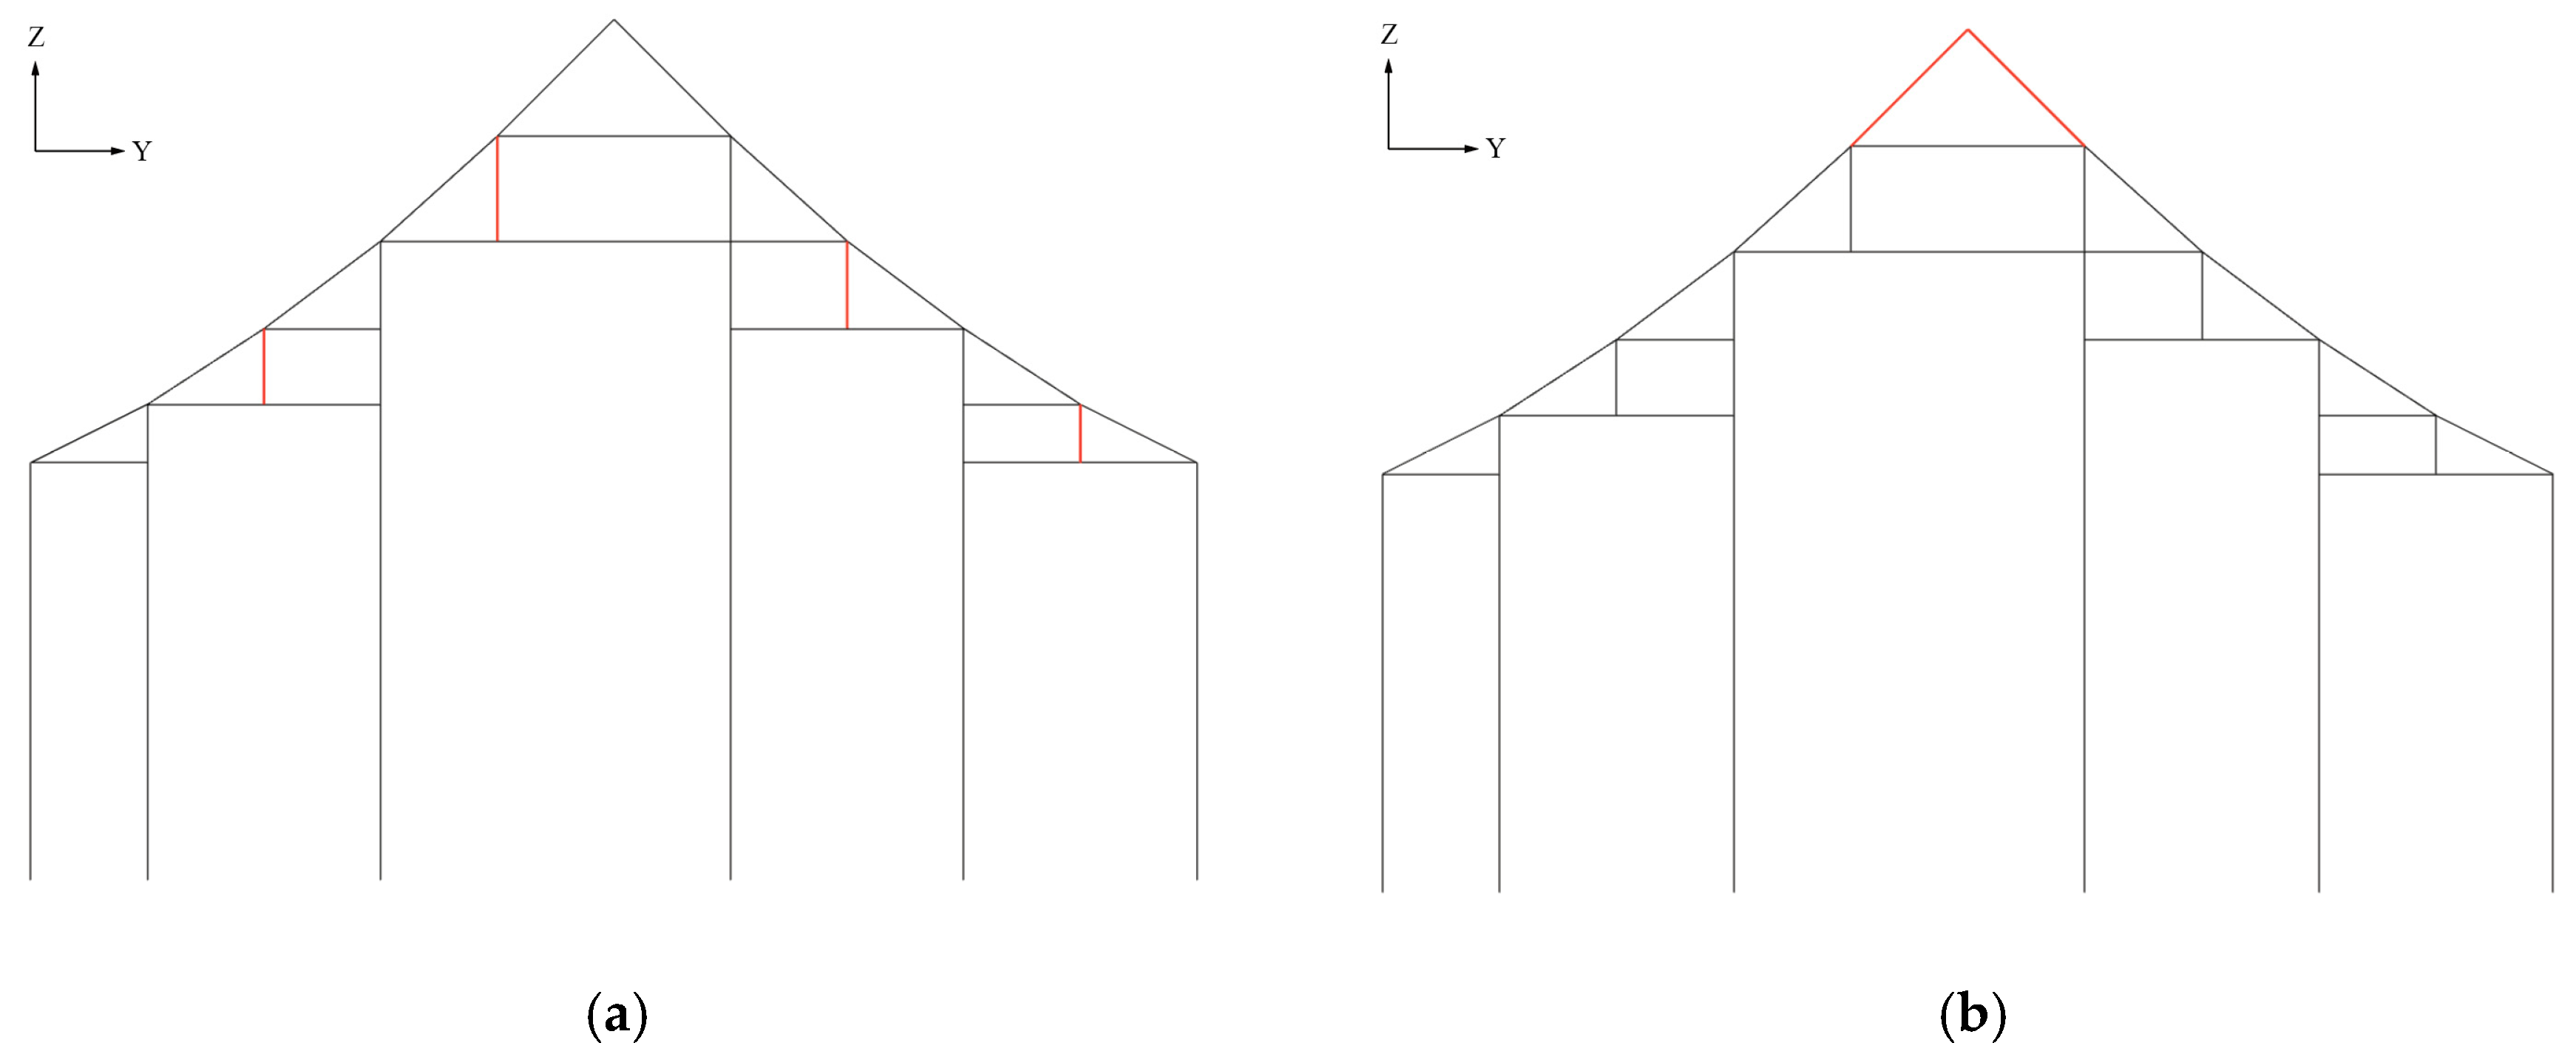
Regarding lateral optimization strategy 2, because the bending moment is greatest at the mid-span of the horizontal members, it is sufficient to optimize only the purlins at the span’s center, whether this involves a single purlin or the two adjacent purlins. By enumerating the seven-purlin and nine-purlin configurations in the figure below, we find that not every arrangement satisfies the structural requirements (Figure 7 and Figure 8). As shown, in some cases the purlin loads cannot be accommodated by the standard member placement rules. Hence, it is concluded that at least one column must be located within the three central purlin bays.
(3)
Inclining Horizontal Members in Original Raised Beam Frames
Inclining original horizontal members (Xie Fu) in raised beam frames represents another structural optimization method. In Amitabha Hall of Guangsheng Upper Temple in Hongtong, Shanxi Province, lever-type inclined beams replace traditional horizontal beams. These inclined beams are supported at the front by column-top brackets and at the rear by large longitudinal beams, effectively simplifying the overall structural framework and clarifying load paths (Figure 9).
A similar approach occurs in Pujing Temple in Xiangfen, Shanxi Province, where inclined beams simplify the structure further by terminating directly at inner longitudinal beams without intermediate support, enhancing structural clarity [29]. Inclining existing horizontal members within raised beam frames constitutes lateral optimization strategy 3 (Figure 10).
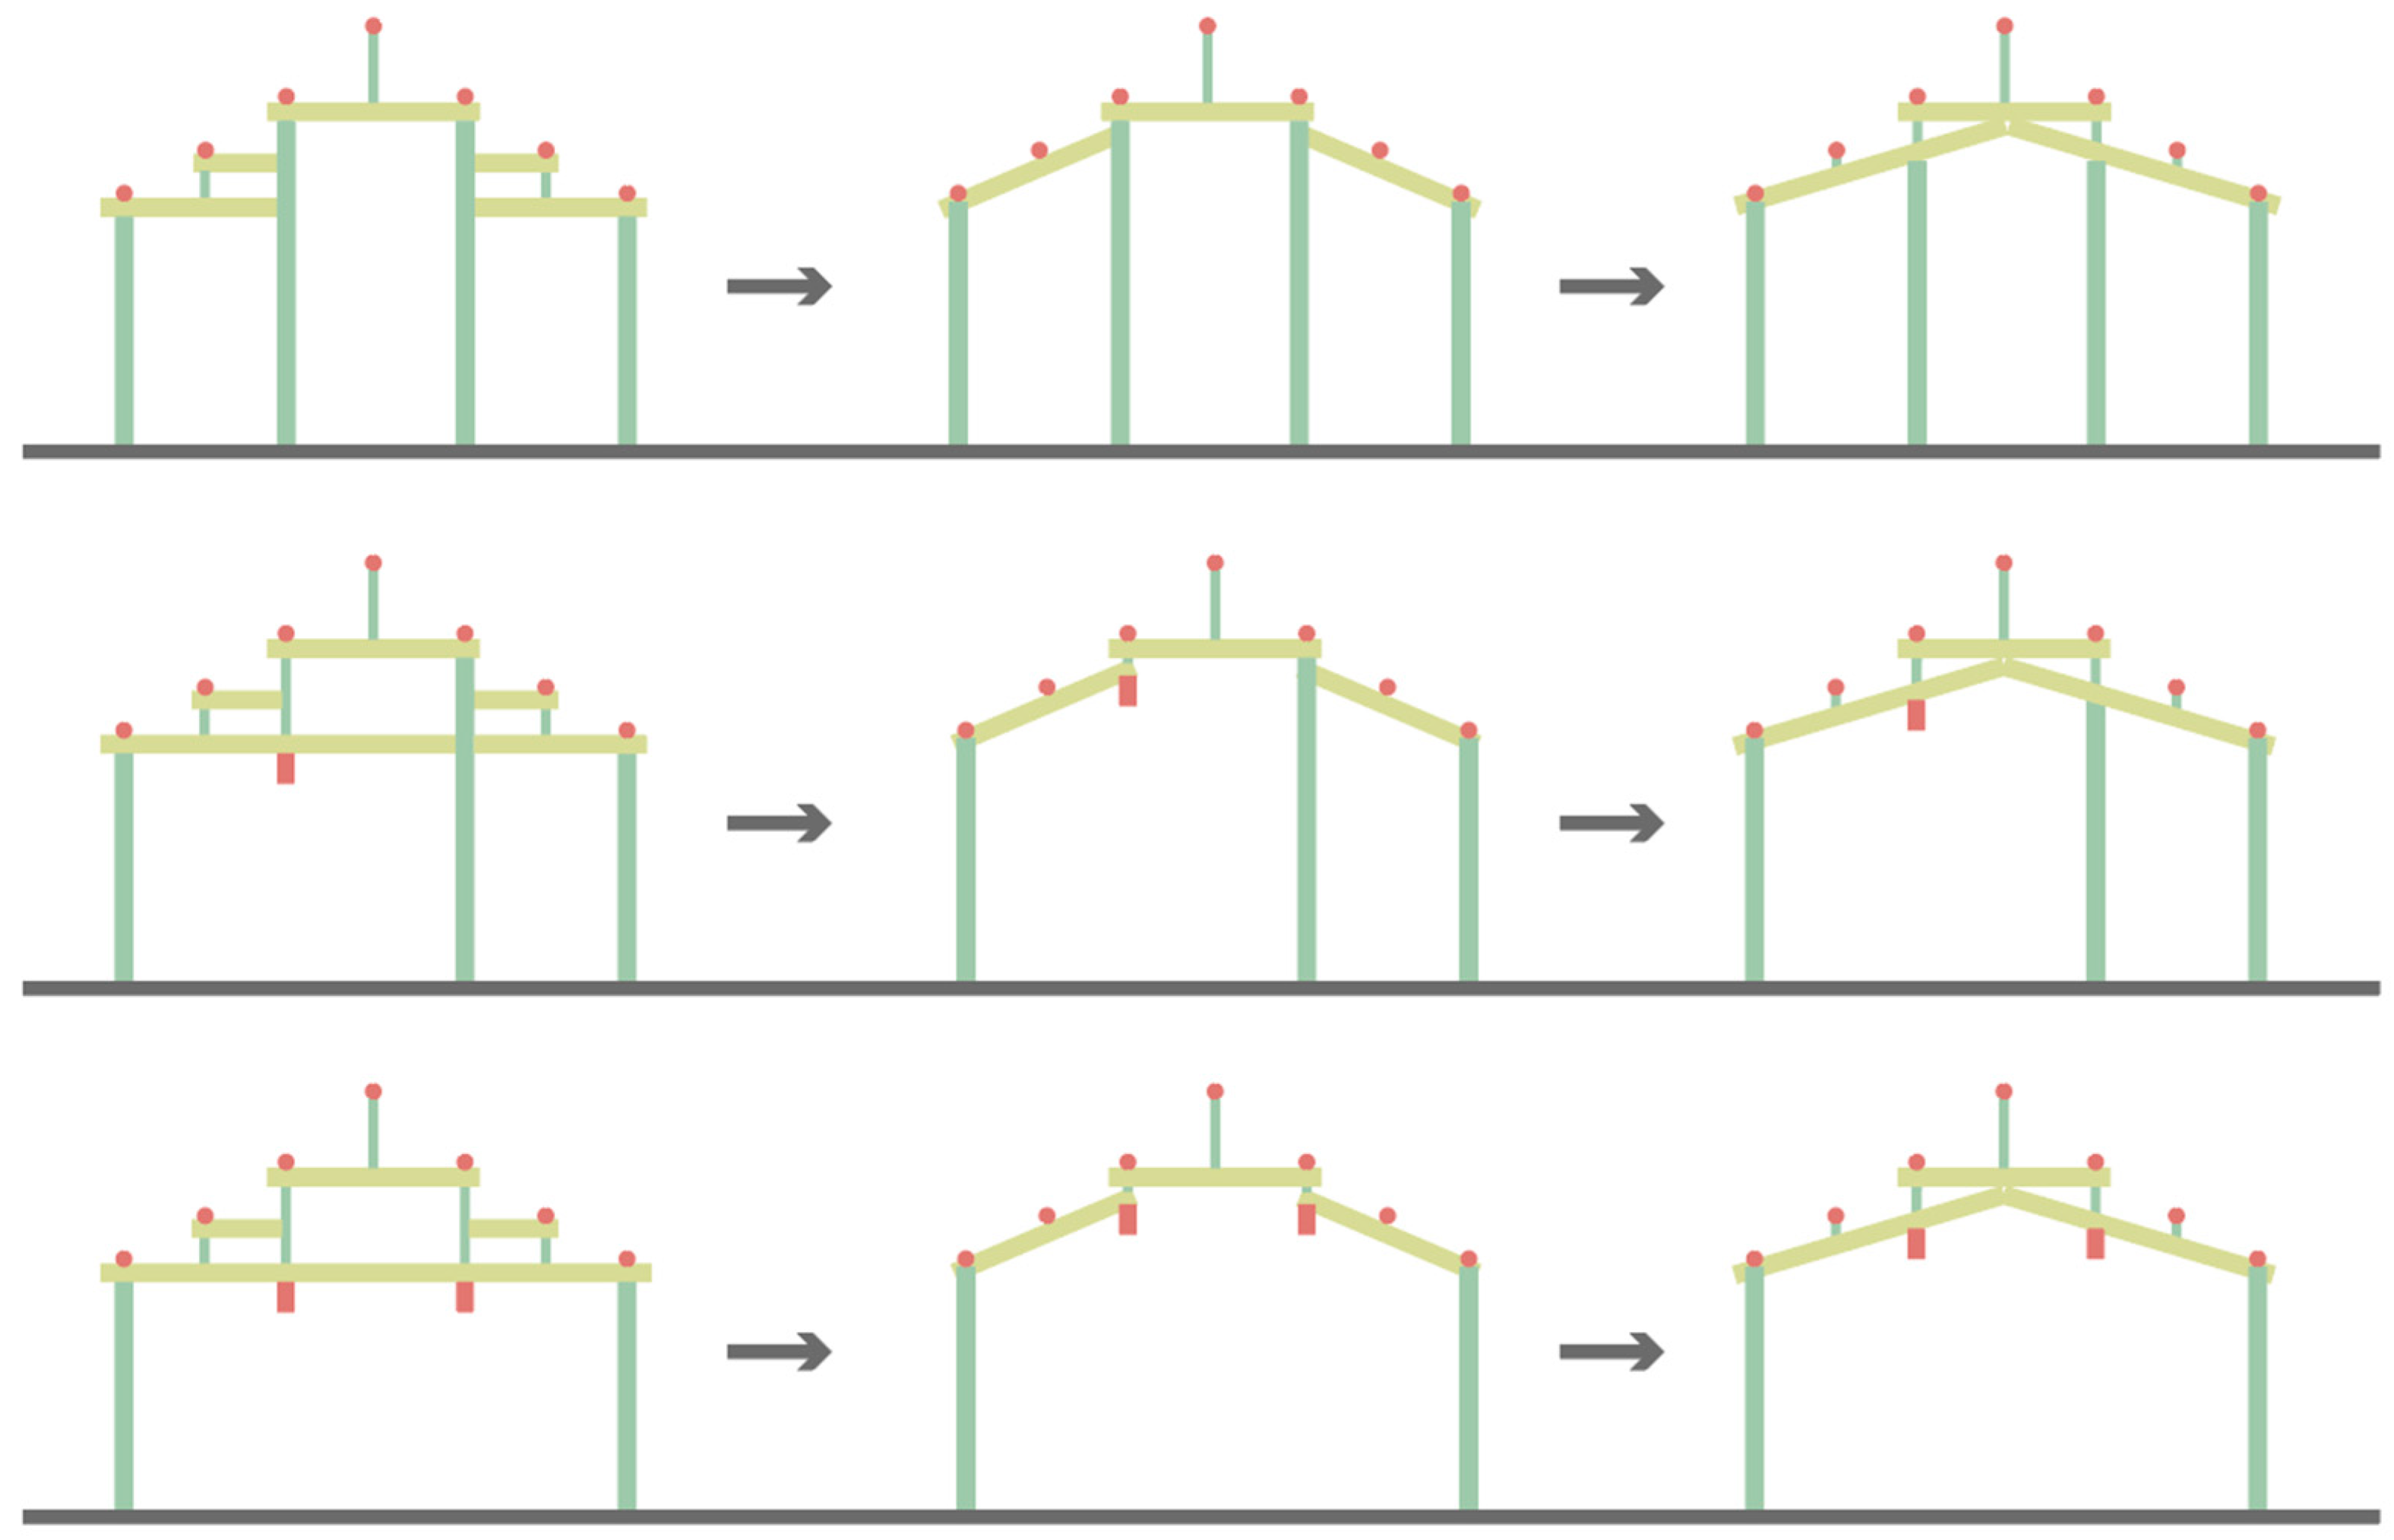
Inclining the horizontal members in the original raised beam frame is designated lateral optimization strategy 3. The member layout for it is shown below (Figure 11).

3.1.2. Longitudinal Load Transfer Utilizing Inclined Members

(1)
Longitudinal Truss
After column reduction and relocation, when roof loads encounter excessively large spans or inadequate stiffness in lateral load transfer, it becomes essential to enhance longitudinal load transfer pathways by employing members with substantial longitudinal bending stiffness. A representative historical example can be traced to the Yuan Dynasty (1271–1368), when the Da’e structural system emerged. In this system, beams were directly supported on large horizontal beams (“E”), enabling roof loads to transfer longitudinally through bending. This innovative approach allowed for material conservation and internal space enlargement. While this method provided a new perspective for beam frame designs involving column reduction and relocation, it still faced inherent inefficiencies due to bending-induced material underutilization. The following examples illustrate the application of inclined members forming modern truss-like structures longitudinally, offering comparable functionality with improved material efficiency.
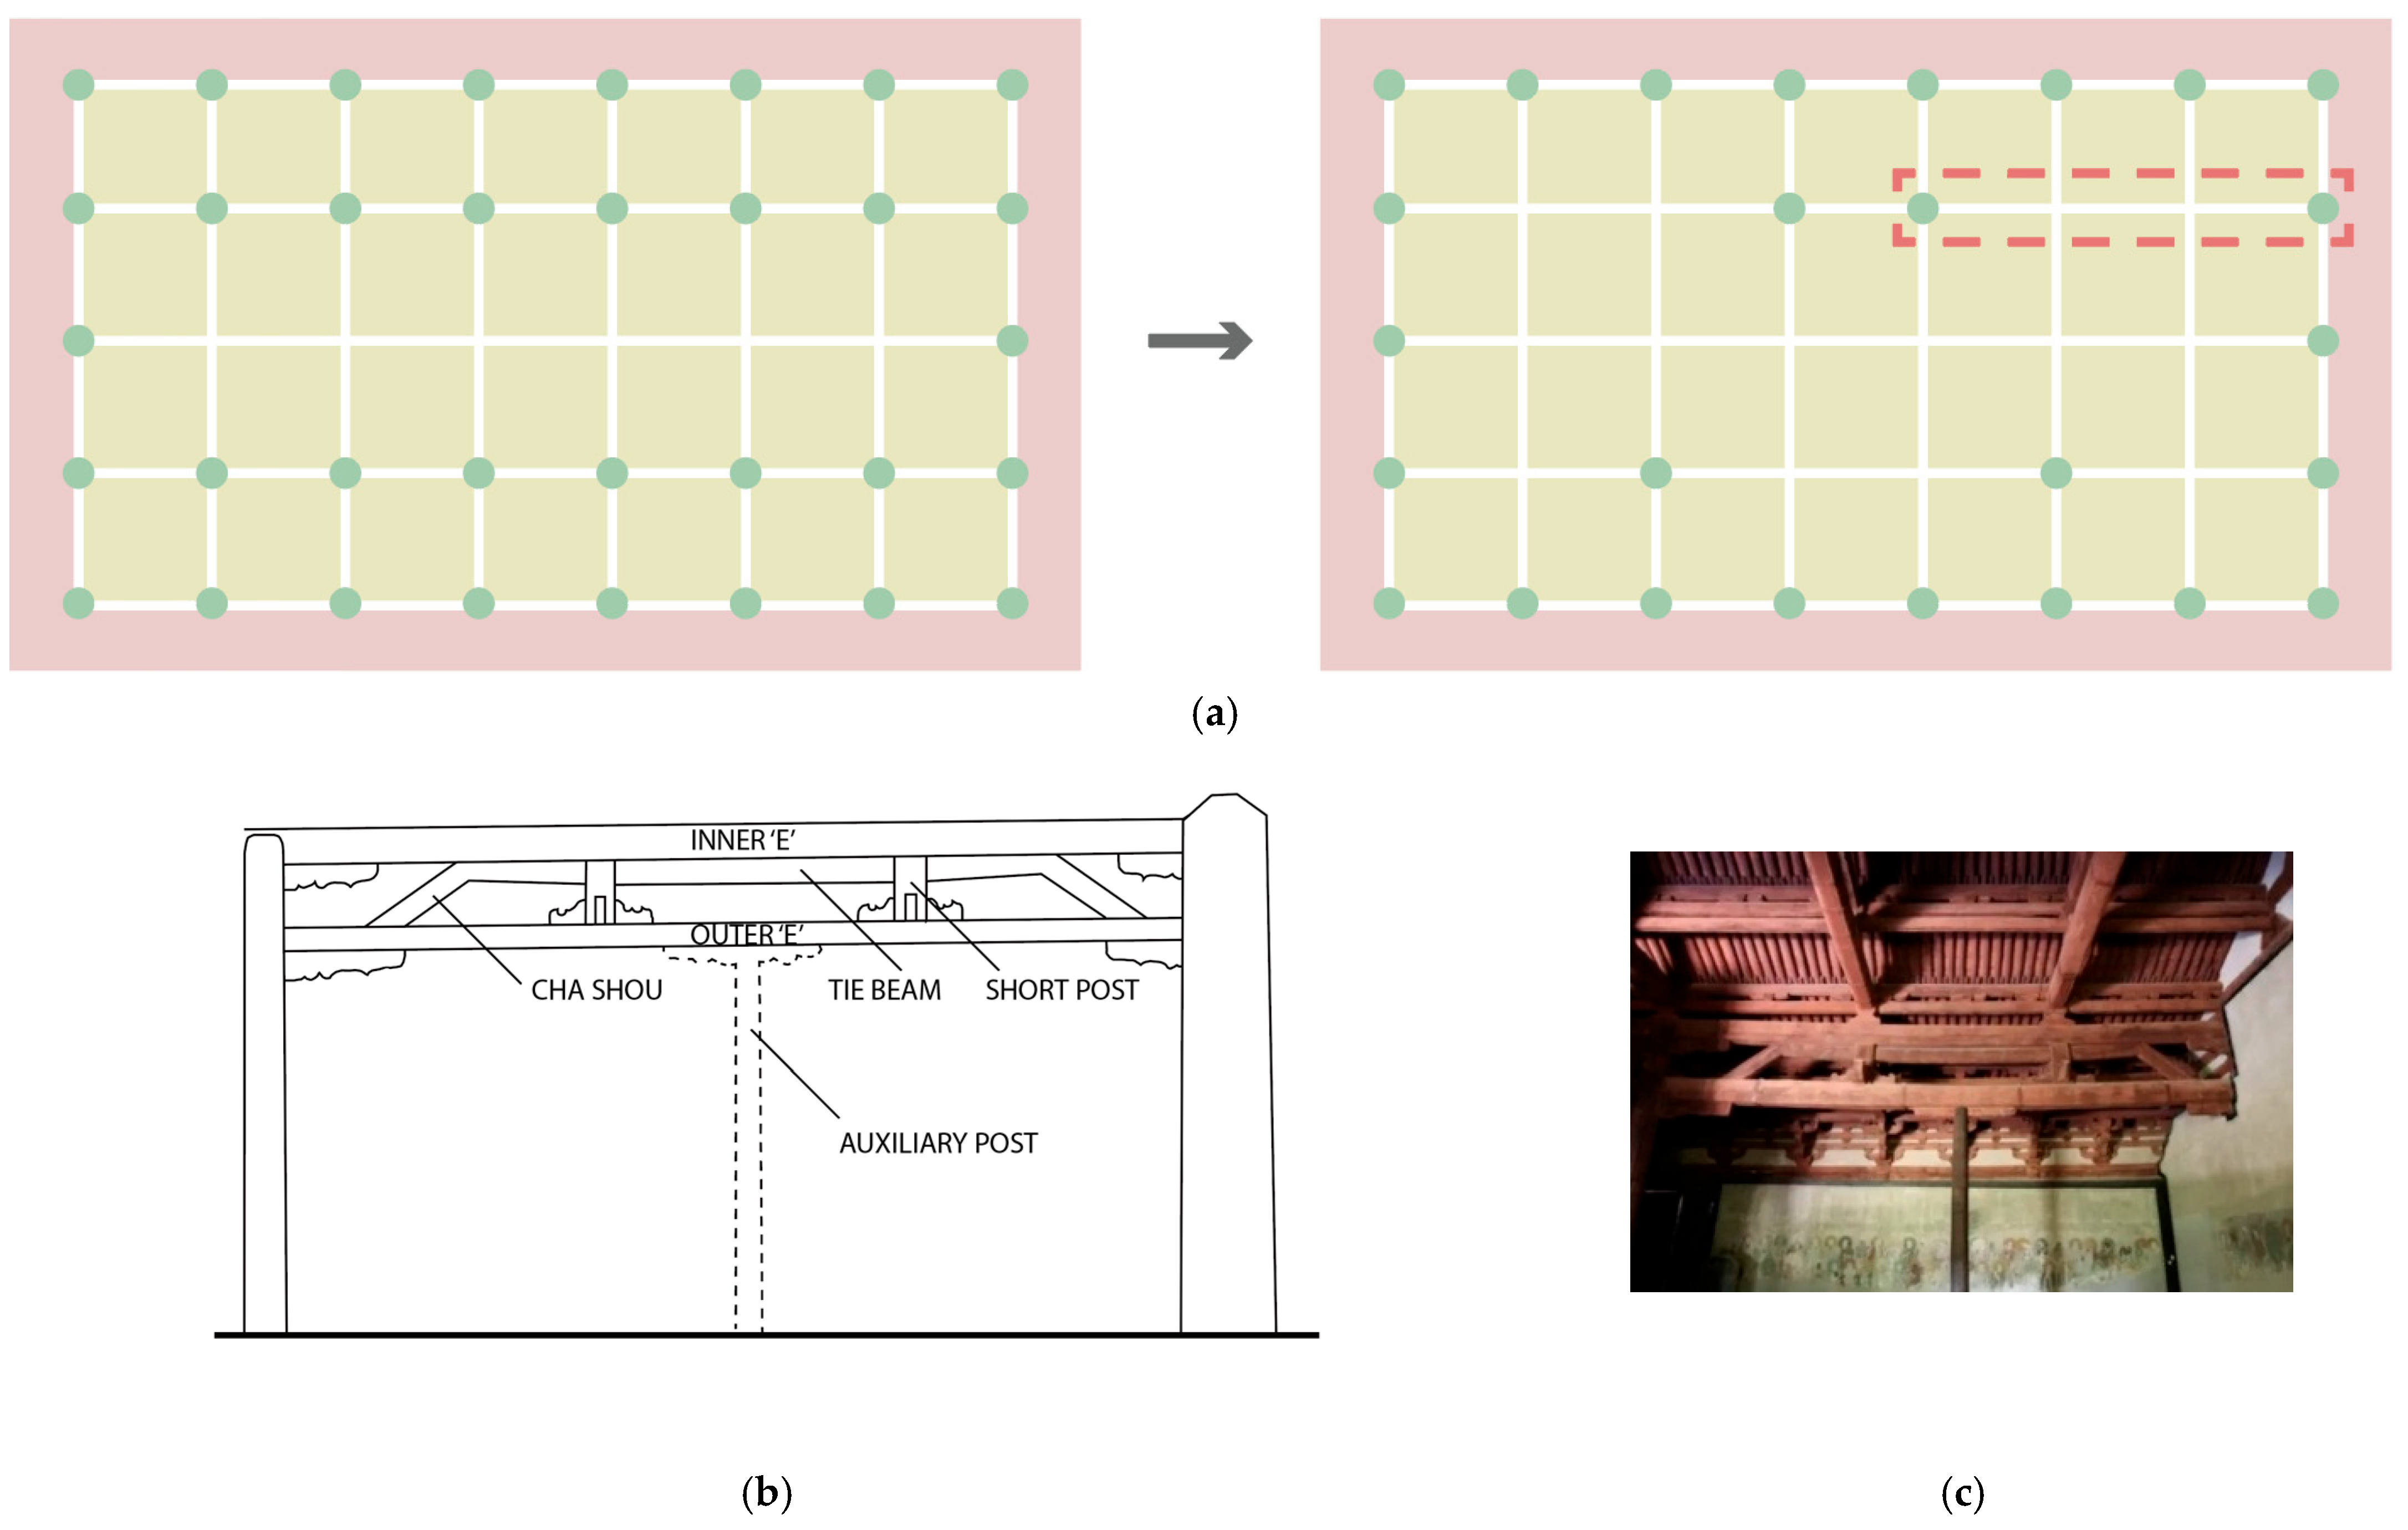
In the Wenshu Hall of Foguang Temple on Mount Wutai, Shanxi Province, column reduction reaches its peak application, where eight columns were removed—four each from the front and rear bays—significantly expanding interior space (Figure 12a). However, the span of the “E” increased from one bay to three bays, requiring special structural techniques. Between the inner and outer “E,” inclined members (Cha Shou), short post, and tie beams were used to form a truss structure resembling the modern “Queen Post Truss” (Figure 12b). Due to excessive deformation, later interventions added an additional small supporting column at mid-span (Figure 12c).
Similarly, at the Amitabha Hall of Chongfu Temple in Shuozhou, Shanxi Province, removal of two front bay columns doubled the maximum span. The “E” was structured in two layers, connected by inclined members and short posts, creating truss-like formations for larger spans (Figure 13). Despite their elegance and material economy, these structures eventually experienced significant deformation, necessitating additional columns underneath the short posts. The author believes that the main issue arises from portions between the short posts resembling modern open-web trusses, which primarily depend on joint stiffness. Traditional wooden mortise-tenon joints offer limited bending stiffness, resembling hinged connections, preventing coordinated truss action between the upper and lower layers. Reducing open-web portions could mitigate this issue. Introducing longitudinal truss is designated as the longitudinal optimization strategy.
(2)
Renzi Gong (Inverted-V Brackets)
Renzi Gong—inclined members serving a similar purpose—appear in the Yungang Grottoes (late Northern Wei Dynasty, ca. 5th century CE), Tianlongshan Grottoes (Northern Qi to Tang Dynasty, 6th–8th centuries CE), and tombs from the Northern and Southern Dynasties (420–589 CE), although they have not been observed in existing timber structures. Standard Renzi Gong comprises two inclined members placed above horizontal beams (“E”), featuring straight or curved legs, typically combined with bracket complexes. Dense arrangements of Renzi Gong depicted in murals at Mogao Grottoes from the Sui Dynasty (581–618 CE) illustrate forms resembling modern trusses, effectively addressing the open-web structural issues mentioned previously (Figure 14).

3.1.3. Planar Oblique Application of Inclined Members

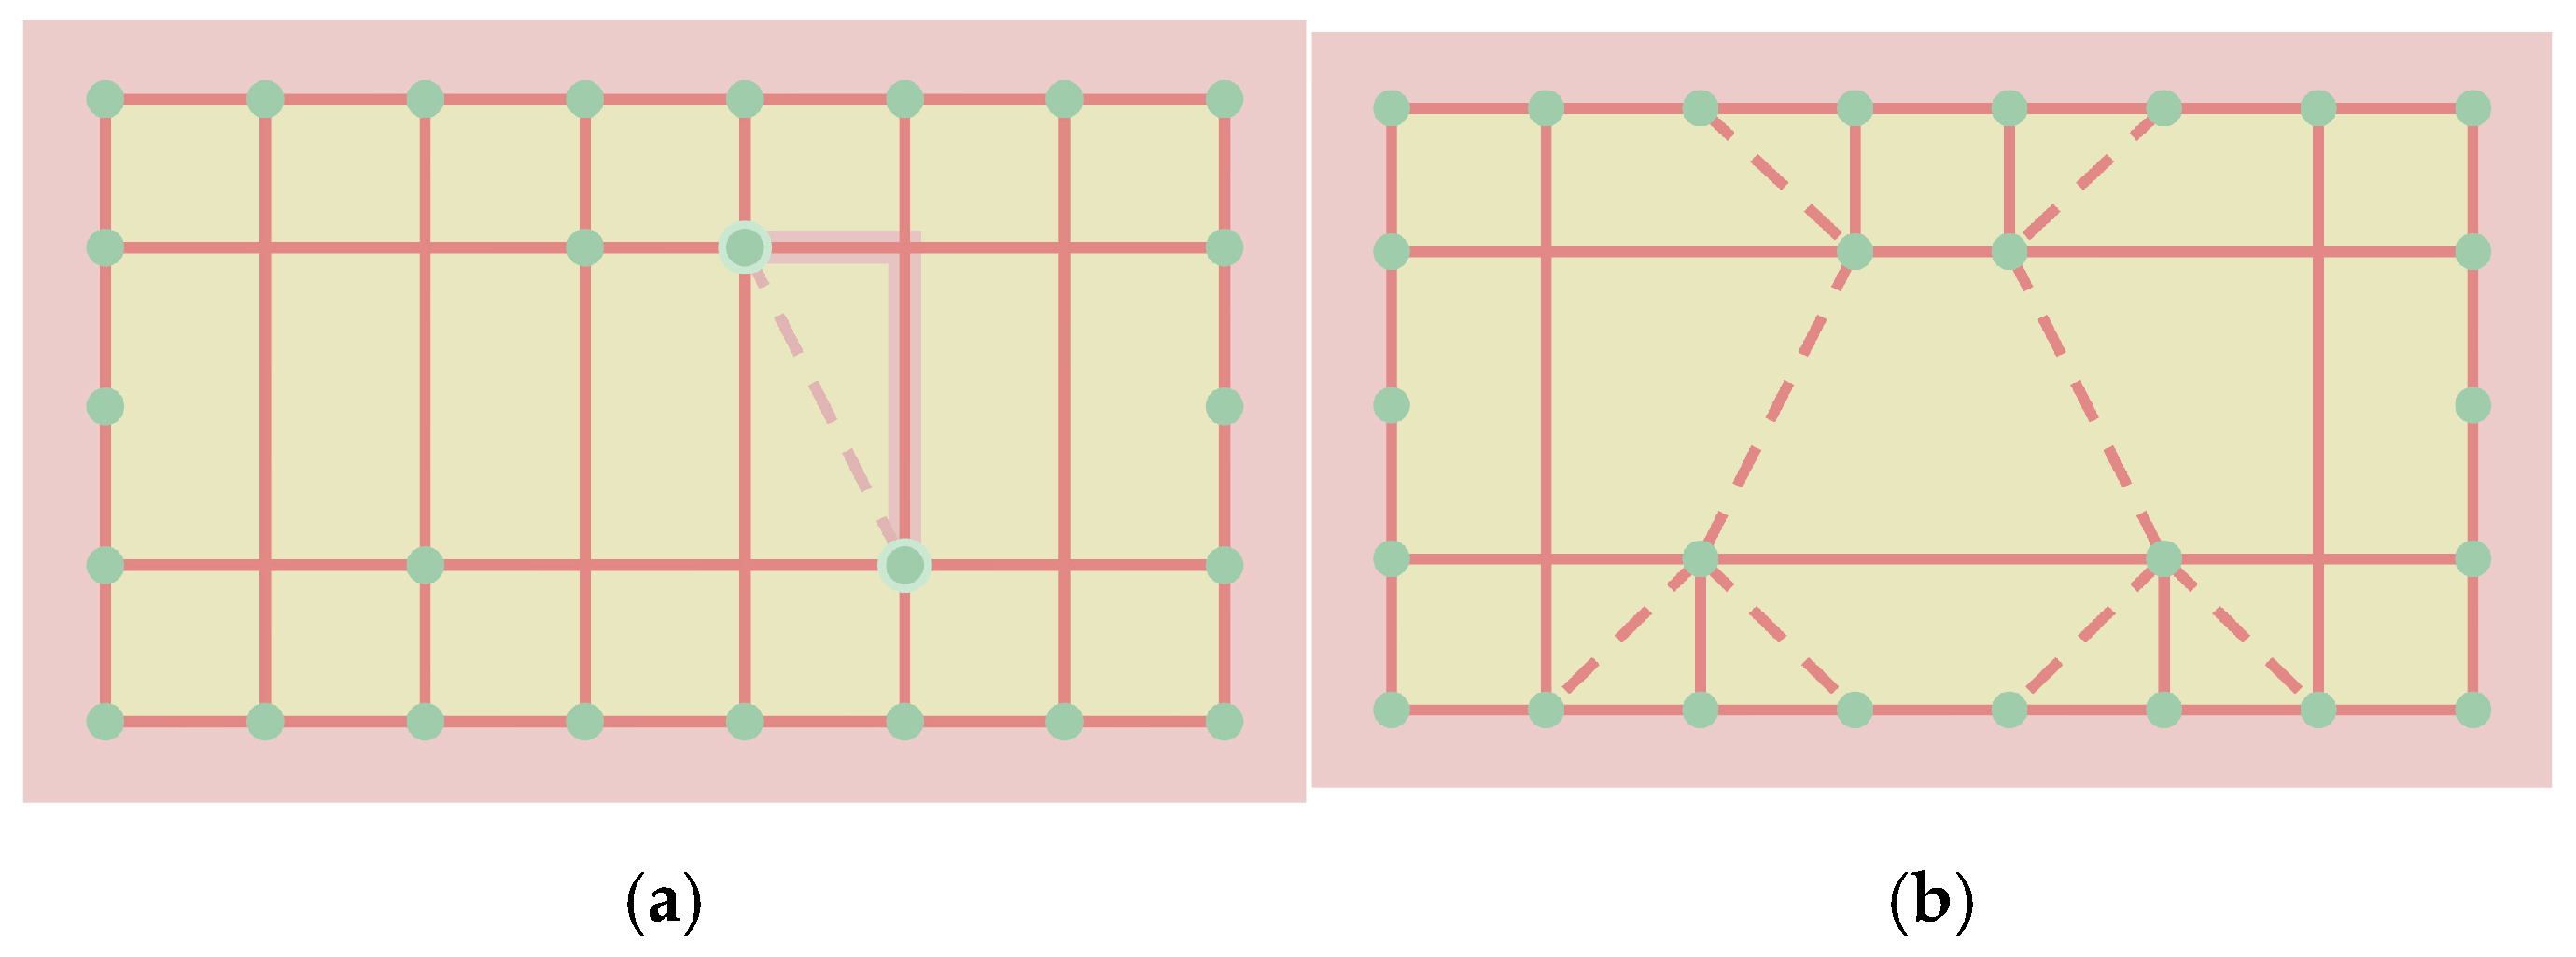
In the case of Wenshu Hall at Foguang Temple, the four inner columns formed a trapezoidal rather than rectangular grid due to column reduction and relocation, leading to inefficient orthogonal “L”-shaped load transfer paths. Adopting an alternative layout by introducing planar oblique members, as shown with dashed lines, would result in a more direct and material-efficient load transfer. Although this is unprecedented in ancient Chinese timber halls, certain historical details support its rationality (Figure 15).
In multi-story wooden pagodas, octagonal plan constraints necessitate non-orthogonal structural layouts. For example, the Yingxian Wooden Pagoda features beams and columns intersecting at 135°, prompting radial oblique load transfer strategies. Empirical measurements reveal irregular intersection angles ranging from 122° to 138°, dynamically adapting to the octagonal plan. Additionally, bracket complexes (Dougong) historically adapted their orientation to structural demands. Conventional orthogonal Dougong reflect orthogonal load paths, while corner Dougong evolved 45° inclined forms to accommodate oblique loads, evident in Yingxian Pagoda. Numerous instances of 45°, 60°, and single-outward inclined brackets in Southeast Shanxi further exemplify structurally rational decorative details, offering historical precedents for oblique structural systems (Figure 16).

3.1.4. Strategy of Structural Optimization

Modern structural mechanics allows for the precise determination of optimal frame layouts given defined load conditions and boundary support. However, purely mechanical optimization may conflict with traditional Chinese architectural conventions and esthetics. Thus, balancing structural optimization with historical authenticity—termed “historical authenticity”—is central to this research. By quantifying “historical authenticity,” this study systematically controls the number and distribution of inclined members, precisely managing structural historical characteristics.
Through multidimensional analyses of numerous historical “column reduction” and “column relocation” cases, this study identifies three dimensions—lateral, longitudinal, and planar oblique—for inclined member application, optimizing historical authenticity and material economy. Specific strategies and corresponding authenticity reduction values are lateral ridge purlin support optimization (5% reduction), adding inclined members in existing raised beam structures (10% reduction), and inclining original horizontal members (20% reduction); longitudinal truss structures (25% reduction) further reduce by 10% if Renzi Gong is incorporated to minimize open-web areas. Users can flexibly combine these strategies to accurately control the final structural design expression. Planar oblique optimization is currently unexplored due to the lack of a historical precedent.

3.2. Stage 2: Prototype of the Generative Frame System

The development of the parametric tool Generative Frame System includes two main steps: frame generation and frame optimization.
The example below adopts a five-bay hall configuration with a gable roof (Xuan Shan Roof), constructed in a ten-rafter-depth arrangement, featuring front one-purlin beam and two-purlin beam and double rear two-purlin beams, supported by six columns. The applied “Column Reduction” and “Column Relocation” operations involve removing the front lower intermediate columns in the two central frames (Ming Jian) and relocating the rear lower intermediate columns one rafter span backward.
Hereafter, only brief procedures of the operations for each component are provided; more detailed and rigorously specified pseudo-code is available in Appendix A. The output generated by each component is highlighted in red in the figures, and their first occurrence in the text is set in bold.

3.2.1. Step 1: Generation of the Raised Beam Frame

Traditional Chinese timber architecture is based on a continuous bay structural logic, so the raised beam system is generated in two stages: First an individual bay is created, and then bays are linked together. User-defined “Column Reduction” and “Column Relocation” operations to the column grid are similarly implemented by supplying bay-specific data. Within each bay, generative logic classifies all members as columns: main beams, which span directly between two columns; secondary beams, which have at least one end unsupported by a column; and short posts, whose bases rest on beams rather than directly on the foundation.
(1)
Component 1-1: Generate the column bottom points and purlin line
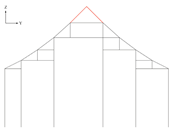
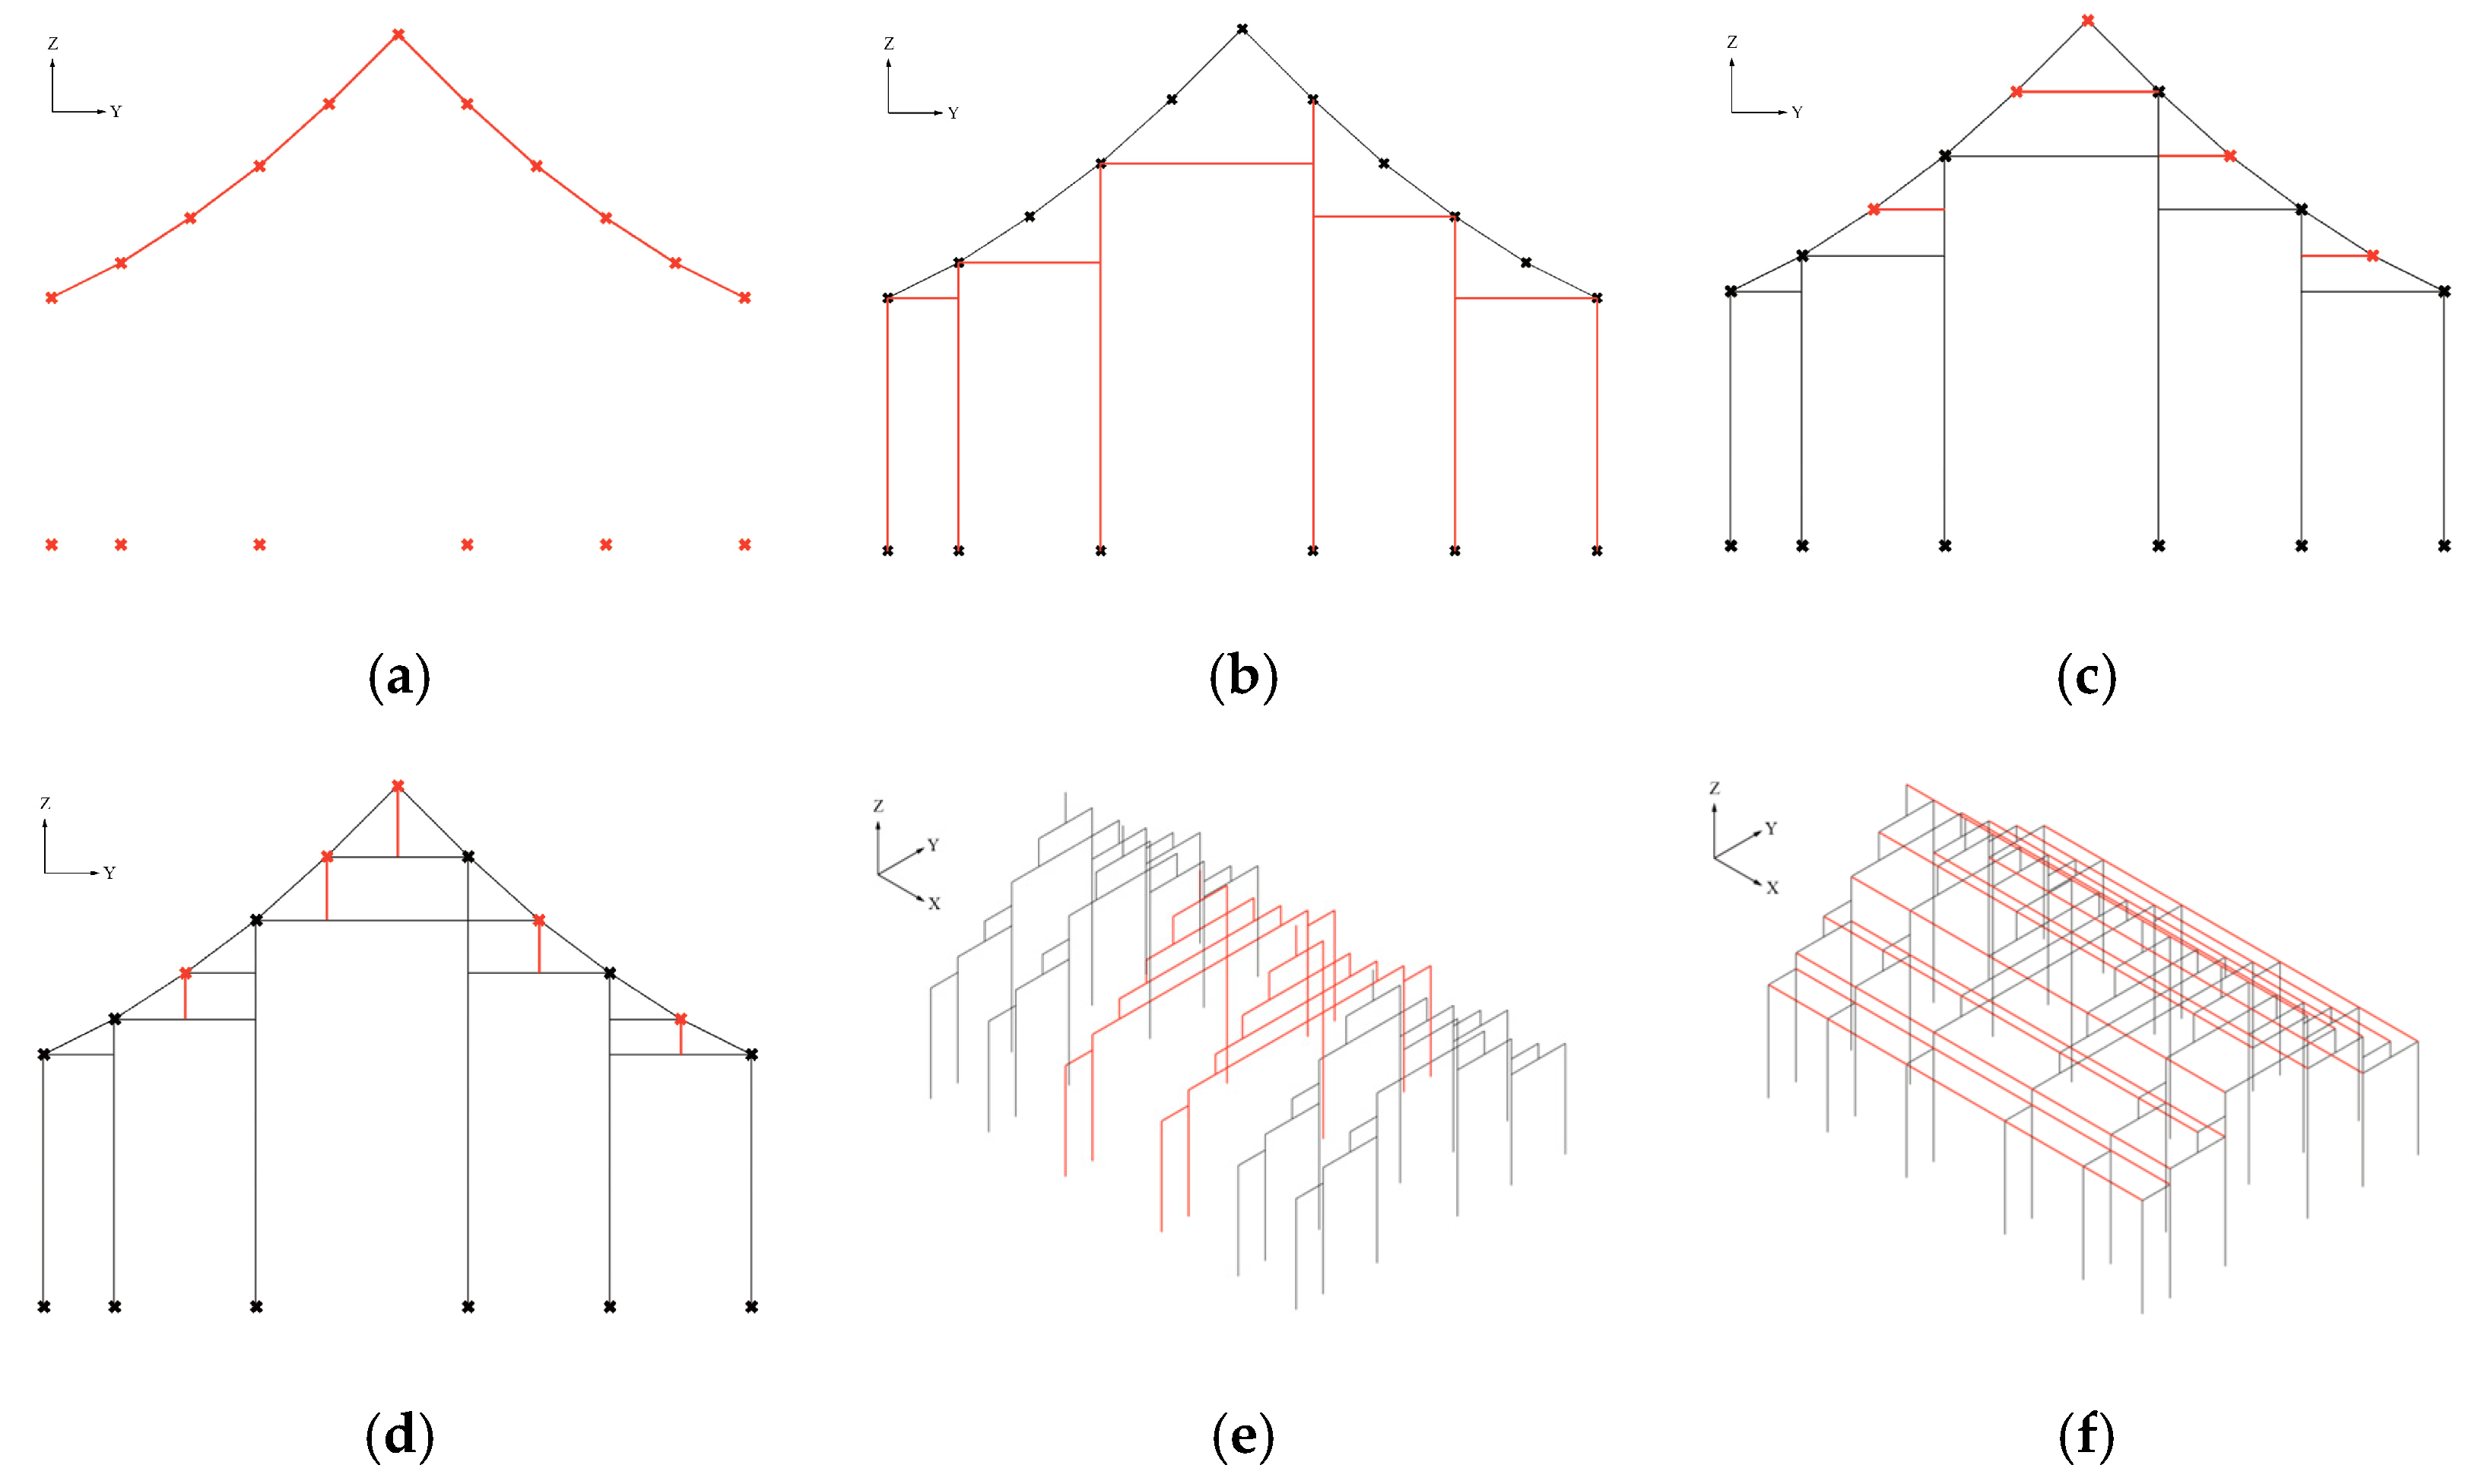
Define depthRafterCounts as the number of rafters of between two columns, the figure below is 1, 2, 3, 2, 2. Define rafterLength as the horizontal length of one rafter. Define eaveColumnHeight as the height of the column at the two edges of the frame. Define raiseFactors as the vertical distance between two adjacent purlins in the frame divided by the corresponding horizontal bay length. Define columnBottomPoints as the bottom points of each column. Define purlinPoints as the points of each purlin in the lateral section of the frame. Define purlinLine as the polyline connecting all of the purlin points.
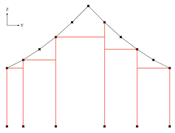
Component 1-1 outputs columnBottomPoints, purlinPoints, and purlinLine by inputting depthRafterCounts, rafterLength, eaveColumnHeight, and raiseFactors. The output results are highlighted in red in Figure 17a.
Component 1-1 can be operated using the following brief procedures: Determine each column’s bottom point’s Y coordinate by multiplying depthRafterCounts with rafterLength to obtain columnBottomPoints. Calculate each purlin point’s Z coordinate by multiplying rafterLength by raiseFactors and then adding eaveColumnHeight. Combine Y coordinate with Z coordinate to obtain purlinPoints. Create the purlinLine by connecting all purlinPoints into a polyline.
(2)
Component 1-2: Generate the columns and main beams
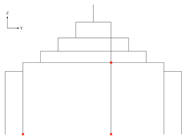
Define yCoordinateOfPurlinMidpoint as the y coordinate of the midpoint of the purlin, which is the highest purlin point in the lateral section figure. Define columns as the vertical lines of columns, which connects the top points and bottom points of the columns. Define mainBeams as the horizontal lines span between the adjacent two columns, with one or two endpoints at the top of the columns.
Component 1-2 outputs columns and mainBeams by inputting columnBottomPoints, purlinLine, and yCoordinateOfPurlinMidpoint. The output results are highlighted in red in Figure 17b.
Component 1-2 can be operated using the following brief procedures: Project each columnBottomPoint in the +Z direction until it intersects the purlinLine. Define columns as the lines connecting columnBottomPoints to their corresponding intersection points (columnTopPoints). Project every columnTopPoints toward +/−Y direction until it intersects the columns. Define mainBeams as the lines connecting columnTopPoints to their corresponding intersection points.
(3)
Component 1-3: Generate the secondary beams and short posts
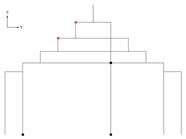
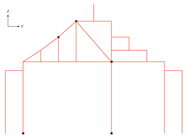
Define secondaryBeams as the horizontal lines connecting the points which are contained in the purlin points, but not in the top points of the columns and the certain points at the midsection of the columns. Define shortPosts as the vertical lines connecting the points which are contained in the purlin points, but not in the top points of columns, and the certain points at the midsection of main beams or secondary beams. Define frame as the set of columns, main beams, secondary beams, and short post.
Component 1-3 outputs secondaryBeams, shortPosts, and frame by inputting purlinPoints, columnTopPoints, columns, and mainBeams. The output results are highlighted in red in Figure 17c,d.
Component 1-3 can be operated using the following brief procedures: Define all nonColumnPurlinPoints as those purlinPoints not contained in columnTopPoints. Project every nonColumnPurlinPoints in the +/−Y direction until it intersects columns. Define seceondaryBeams as the lines connecting nonColumnPurlinPoints and their corresponding intersection points. (The generation of secondaryBeams may encounter certain special cases, the details of which are specified in the pseudo-code logic provided in Appendix A, and are therefore not elaborated here.) Project every nonColumnPurlinPoints in the −Z direction until it intersects mainBeams or secondaryBeams. Define shortPosts as the lines connecting nonColumnPurlinPoints and their corresponding intersection points. Combine columns, mainBeams, secondaryBeams, and shortPosts to form frame.
(4)
Component 1-4: Generate all bays of frame, as well as the purlins and tiebeams.
Define widths as the distances between each two bays of frames. Define frames as the set of all of the bays of the frames. Define purlins as the lines connecting every purlin point in the X axis. Define tiebeams as the lines connecting every point intersected by columns and the lowest beams in the X axis.
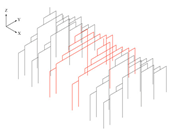
Component 1-4 outputs frames, purlins, and tiebeams by inputting widths, frame, purlinPoints, and columnBottomPoints. The output results are highlighted in red in Figure 17e,f.
Component 1-4 can be operated using the following brief procedures: Multiply the existing frame by the specified widths to create frames. Multiply the purlinPoints by the same widths to generate purlins. Project every columnBottomPoints in the +Z direction until it intersects mainBeams or secondaryBeams. Define the intersection points as tiebeamPoints. Multiply the tiebeamPoints by the widths to create tiebeams.

3.2.2. Step 2: Generation of the Frame Line Model After Optimization

Grounded in the case analysis, there are three lateral strategies encoded—revising ridge-purlin support, inclining originally horizontal members, and inserting inclined members within the raised beam frame—and one longitudinal strategy—forming a longitudinal truss—all of which can be deployed singly or concurrently to satisfy the user-defined degree of historical authenticity.
Lateral Optimization Strategy 1—Modification of the Ridge Purlin Support Method
(1)
Component 2-1-1: Determine if any column lies at the center and remove the top short post
Define newShortPosts as the short post after optimization.
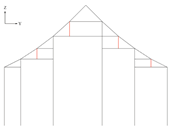
Component 2-1-1 outputs newShortPosts or frame by inputting columnTopPoints, yCoordinateOfPurlinMidpoint, shortPosts, and frame. The output results are highlighted in red in Figure 18a.
Component 2-1-1 can be operated using the following brief procedures: Determine whether a column is present at the center of a single-bay structure (with the ridge point of the sloped roof taken as the center). If no column exists, the central short post is removed to generate newShortPosts; if a column is present, lateral optimization 1 cannot be performed and returns frame.
(2)
Component 2-1-2: Preserve the top Purlin line (top chords) and generate the frame after optimization
Define newShortPosts as the short post after optimization. Define topChords as the top two purlin line segments. Define frameAfterOptimization1 as the frame after optimization using the lateral optimization strategy 1.
Component 2-1-2 outputs topChords and frameAfterOptimization1 by inputting purlinLine, columns, mainBeams, and secondaryBeams. The output results are highlighted in red in Figure 18b.
Component 2-1-2 can be operated using the following brief procedures: Keep the two purlin segments at the top and define two segments as topChords. Combine columns, mainBeams, secondaryBeams, newShortPosts, and topChords to form the frameAfterOptimization1.
Lateral Optimization Strategy 2—Introducing Inclined Members into the Original Raise-Beam Frame
(1)
Component 2-2-1: Identify the column spans to be optimized
Define columnA as the column which is closest to the center and where the top point of columnA lies within the top three purlin points. Define columnB as the column which is nearest to column A on the opposite side. Define pointX as the intersection point between columnA and the tiebeam.
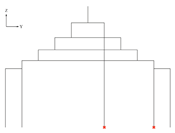
Component 2-2-1 outputs columnABottomPoint, columnBBottomPoint, pointX, or frame by inputting columnBottomPoints, purlinLine, yCoordinateOfPurlinMidpoint, and frame. The output results are highlighted in red in Figure 19a.
Component 2-2-1 can be operated using the following brief procedures: Identify the column closest to the center of the single-bay structure, defined as columnA, and its bottom point as columnABottomPoint. Verify that column A is located within the middle three purlins; if it is not, return the frame. If it is, then search on the opposite side of columnA for the nearest column, defined as columnB, and its bottom point as columnBBottomPoint. Project the top point of columnB in the +/−Y direction until it intersects with columnA, and define the intersection point as pointX.
(2)
Component 2-2-2: Identify the purlin points at mid-span
Define pointM and/or pointN as the purlin point(s) at the mid-span between the columnA and columnB and where point M or N is not one rafter away from any column. The optimization point will be pointM and/or pointN because the bending moment is the largest at the mid-span.
Component 2-2-2 outputs pointM and/or pointN or frame by inputting the purlinPoints, columnABottomPoint, columnBBottomPoint, and rafterLength. The output results are highlighted in red in Figure 19b.
Component 2-2-2 can be operated using the following brief procedures: Among the purlin points located between Column A and Column B, identify the central one or two points, defined as pointM and/or pointN. Verify that the distance between pointM (and/or pointN) and where Column B is greater than the span of one rafter; otherwise, return the frame.
(3)
Component 2-2-3: Generate the frame after optimization
Define frameAfterOptimization2 as the frame after optimization using lateral optimization strategy 2.
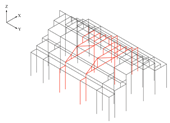
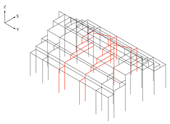
Component 2-2-3 outputs frameAfterOptimization2 by inputting the columns, mainBeams, secondaryBeams, shortPosts, columnA, columnB, PointX, pointM, and pointN. The output results are highlighted in red in Figure 19c–e.
Component 2-2-3 can be operated using the following brief procedures: To transfer the loads of pointM, define inclinedMember1 as the line connecting with pointX and pointM. Identify the purlin points between columnB and pointM (including columnBTopPoint and pointM), defined as inclinedMember2Points, and connect all points into a polyline, defined as inclinedMember2. Project every inclinedMember2Points in the −Z direction to generate the new short posts. Remove the short posts and secondary beams which have intersections with new short posts and inclined members. Combine the columns, mainBeams, secondaryBeams, shortPosts, inclinedMember1, and inclinedMember2 to form the frameAfterOptimization2. The load transfer at pointN follows the same principle as that at pointM. Hence, it will not be elaborated further here.
Lateral Optimization Strategy 3—Inclining Horizontal Members into the Original Raise-Beam Frame
(1)
Component 2-3-1: Identify the column spans to be optimized
Define columnA and columnB as the column lines which are on the same side and have the largest Y difference, where that Y difference must exceed one rafter.
Component 2-3-1 outputs columnABottomPoint, columnBBottomPoint, or frame by inputting columnBottomPoints and yCoordinateOfPurlinMidpoint. The output results are highlighted in red in Figure 20a.
Component 2-3-1 can be operated using the following brief procedures: Identify two columns which are on the same side in single bay and have the largest distance as columnA and columnB. And define their bottom points as columnABottomPoint and columnBBottomPoint. Verify that the distance between columnA and columnB is greater than the span of one rafter; otherwise, return the frame.
(2)
Component 2-3-2: Generate the inclined member
Define inclinedMember as the newly inserted inclined member.
Component 2-3-2 outputs inclinedMember by inputting columnABottomPoint, columnBBottomPoint, purlinLine, and rafterLength. The output results are highlighted in red in Figure 20b.
Component 2-3-2 can be operated using the following brief procedures: Select the purlin point that is located at a distance of exactly one rafter span from columnB and positioned closer to columnA and define this point as pointM. Connect the top point of columnB with pointM and extend the line until it intersects columnA at pointN. Define the line connecting pointN and the top point of columnB as the inclinedMember.
(3)
Component 2-3-3: Generate the frame after optimization
Define frameAfterOptimization3 as the frame after optimization using lateral optimization strategy 3.
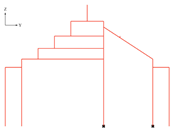
Component 2-3-3 outputs inclinedMember by inputting columnABottomPoint, columnBBottomPoint, purlinLine, and rafterLength. The output results are highlighted in red in Figure 20c,d.
Component 2-3-3 can be operated using the following brief procedures: Remove the main beams, secondary beams, and short posts which have intersections with the inclinedMember. Select the purlin points between columnA and columnB and project them in the −Z direction until they intersect with inclinedMember. Define the lines connecting those purlin points and intersection points as tinyMembers. Combine the columns, mainBeams, secondaryBeams, shortPosts, inclinedMember, and tinyMembers to form frameAfterOptimization3. For the other side of the frame, the same principle applies, and no further details are elaborated here.
Longitudinal Optimization Strategy—Generate the Longitudinal Truss
(1)
Component 2-4-1: Identify the column spans to be optimized
Define maxSpanLine as lines that have the maximum longitudinal span among all column bottom points.
Component 2-4-1 outputs maxSpanLine by inputting columnBottomPoints and widths. The output results are highlighted in red in Figure 21a.
Component 2-4-1 can be operated using the following brief procedures: Group columnBottomPoints based on their y coordinates, and create the spanLines by connecting points one by one for each group of points sharing the same y coordinates. Find the maxSpanLine and verify that it is larger than any widths.
(2)
Component 2-4-2: Generate the longitudinal truss
Define normalMainBeams as the main beam lines in the original frame. Define trussSpanHeightRatio as the ratio of the height of the truss to its span. Define vierendeelTrussBool as a Boolean toggle to determine whether to keep the diagonal web member at the center of the truss or not. The vierendeelTrussBool is set to True by default. When vierendeelTrussBool is False, the truss will keep the diagonal web members at the center to enhance the bending stiffness of the truss. Define newFrames as the newly generated frame, assuming support from the columns where the truss exists.
Component 2-4-2 outputs newFrames and truss by inputting all of the inputs of the generation of the raised beam structure, normalMainBeams, trussSpanHeightRatio, and vierendeelTrussBool. The output results are highlighted in red in Figure 21b,c.
Component 2-4-2 can be operated using the following brief procedures: Move the maxSpanLine in the +Z direction until they intersect normalMainBeams. Define the resulting lines as topChords. Move the topChord in the −Z direction by (length of topChords/trussSpanHeightRatio). Define the resulting lines as bottomChords. Assume that the frame is supported by columns where the truss exists. Generate a new frame in this assumption using Component 1-1–1-4, labeled as newFrames. Find the intersection points between topChords and newMainBeams plus newSecondaryBeams. Project these points in the −Z direction until they intersect the bottomChords. Define the lines connecting these points and their corresponding intersection points as verticalWebs. Subdivide each topChord into four segments and each bottomChord into two segments. Connect the points to create diagonalWebs. Remove the middle two diagonalWebs if vierendeelTrussBool is True. Combine topChords, bottomChords, verticalWebs, and diagonalWebs to form truss.
(3)
Component 2-4-3: Revise some members and generate the frame after optimization
Define revisedFrames as the frames after revision, especially the shortened columns. Define frameAfterOptimization4 as the frame after optimization using the longitudinal optimization strategy.
Component 2-4-3 outputs revisedFrames and frameAfterOptimization4 by inputting newFrames, newColumns, newMainBeams, newSecondaryBeams, newShortPosts, tieBeams, truss, and normalFrames. The output results are highlighted in red in Figure 21d,e.
Component 2-4-3 can be operated using the following brief procedures: Shorten the newColumns which have intersections with any topChords. Remove the tiebeams which have intersections with any topChords. Combine newColumns, newMainBeams, newSecondaryBeams, newShortPosts, tiebeams, and truss to form revisedFrames. Combine revisedFrames and normalFrames to form frameAfterOptimization4.

3.3. Stage 3: Validation via Structural Simulation

3.3.1. Step 1: Structural Simulation Analysis Based on Karamba3D

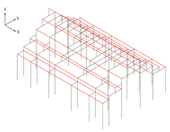
To verify the improvement in structural efficiency of the optimized structural line models, this research employs numerical simulations using Karamba3D, analyzing two key indicators: structural self-weight and maximum deformation. The simulation utilizes case studies from Stage 2, employing lateral optimization strategies 2 and 3 simultaneously. Parameters for the structural simulation model are as follows (Figure 22):
(1)
Member Specification: Reflecting authentic traditional Chinese timber construction characteristics, four categories—columns, short post, purlins, and slender rods introduced by lateral optimization strategy 3—are modeled with solid circular cross-sections. Main beams, secondary beams, longitudinal tie beams (fang), and inclined members resulting from lateral optimization strategies adopt solid rectangular cross-sections. Material properties for timber members are defined as follows: Young’s Modulus: 1050 kN/cm2; in-plane shear modulus: 360 kN/cm2; transverse shear modulus: 360 kN/cm2; specific weight: 6 kN/m3; coefficient of thermal expansion: 5.0 × 10⁻⁶ °C−1; tensile strength: 1.3 kN/cm2; compressive strength: −1.3 kN/cm2.
(2)
Support Conditions: In traditional Chinese timber architecture, columns typically rest on masonry bases, forming hinged connections via the “column plinth—column base—column foot” support system. This study models column base supports as hinged at ground level, restricting translational movements in all three directions while allowing for rotational freedom. It should be noted that column base tenons, socketed stone plinths, iron ties, interface friction, and localized bearing crushing collectively provide a finite, state-dependent rotational stiffness at the base. Modeling the support as an ideal hinge suppresses this restraint, thereby reducing lateral support stiffness, lengthening the fundamental period, and shifting part of the bending demand to neighboring joints. Such an idealization can bias predictions of drift and member demand, thereby reducing the accuracy of the simulation.
(3)
Load Conditions: Ancient Chinese structures primarily experience three load types: vertical loads (self-weight, snow, and rain), horizontal loads (wind and seismic activities), and incidental loads (temperature and moisture variations, uneven foundation settlement). For single-story hall structures, vertical loads dominate. Given that traditional strategies for addressing horizontal loads mainly involve brick shear walls and subtle column adjustments, such as “column inclination” and “raising,” which have limited direct interaction with the beam frame system, this study simplifies the load model to structural self-weight and uniformly distributed linear loads (5 kN/m) on each purlin, excluding horizontal and other special loads.
(4)
Joint definition: Traditional mortise–tenon joints are neither perfectly pinned, nor perfectly rigid. Geometric interlock and frictional pre-tightening provide rotational restraint, whereas assembly tolerance, wood compressibility, and micro-slip make the joint softer at small rotations and stiffer after bearing closes; under cyclic actions, energy dissipation and stiffness degradation occur, yielding an overall semi-rigid behavior. For computational tractability, all joints are idealized as rigid in this study. This increases global stiffness and alters internal force paths and deformation patterns, potentially underestimating drifts and overestimating end actions, thereby imposing inherent limits on simulation accuracy.
Simulation analyses yield structural self-weight (t) and maximum vertical deformation (mm) under specified member cross-sectional combinations, comparing models before and after optimization. Structural economy typically reflects lower self-weight, smaller maximum deformation, and reduced total strain energy. However, maximum deformation and total strain energy both represent structural stiffness, with the former focusing on critical stiffness points and the latter considering overall stiffness. Due to column reduction and relocation inducing pronounced stiffness vulnerabilities—specifically at the largest spans of horizontal members—this research selects maximum deformation as the critical indicator for evaluating overall structural stiffness rather than total strain energy.

3.3.2. Step 2: Multi-Objective Optimization Design Based on Wallacei

Significant changes in load transfer paths and member stress states before and after structural optimization make direct comparisons using uniform cross-sections inappropriately. Therefore, this study incorporates the Wallacei multi-objective evolutionary algorithm, setting structural self-weight and maximum vertical deformation as simultaneous optimization goals, with member cross-sectional dimensions as variables (“genes”). The algorithm automatically adjusts dimensions, generating Pareto-optimal solution sets for equitable structural performance comparison (Figure 23 and Figure 24).
Considering practical feasibility and computational simplification, member cross-sectional dimensions (diameters for circular sections, lengths and widths for rectangular sections) are constrained to the range [300, 400, 500, 600, 700, 800, 900, 1000] mm. Wallacei parameters are set with a generation size of 25 and a generation count of 40. Post-iteration, the top 50 Pareto-optimal solutions undergo statistical analysis (Table 1).
Comparative analysis reveals that optimized structures exhibit slightly lower average structural self-weight (57.60 t) compared to pre-optimized structures (57.96 t), while the average maximum vertical deformation significantly decreases from 22.20 mm to 15.59 mm—a reduction of 29.8%. This demonstrates that the optimization strategy effectively enhances overall structural efficiency by nearly 30%.
Furthermore, optimized Pareto solutions exhibit uniform and stable structural performance, with maximum deformation consistently under 22 mm. In contrast, pre-optimized models exhibited extreme deformation scenarios up to 66 mm, even with maximum cross-sectional dimensions (1000 mm) for primary and secondary beams at central frames, failing to effectively control deformation. Such scenarios do not occur post-optimization, indicating that the optimization approach significantly enhances mechanical efficiency, practical constructability, and economic feasibility, particularly advantageous for large-scale hall-type timber structures by effectively managing maximum component sizes.
To ensure comparability across optimization methods, the same simulation–optimization workflow was applied to each method, and solutions with comparable structural self-weights were selected from the corresponding Pareto fronts. The resulting maximum displacements exhibit a consistent pattern: schemes that depart further from historical orthodoxy achieve proportionally greater stiffness gains—that is, smaller maxima—with rank order and magnitude broadly in line with the authenticity loss values assigned earlier to each strategy. This cross-check indicates that the “historical authenticity” controller not only encodes cultural deviation, but also, to some extent, serves as a practical proxy for the expected mechanical benefit under gravity-dominant conditions (Figure 25).

4. Conclusions and Discussions

4.1. Conclusions

This research introduces a parametric digital technology-based generative frame system, achieving an effective balance between structural optimization and historical authenticity for “column reduction” and “column relocation” in ancient Chinese timber architecture. Historical case analyses highlight the structural advantages of inclined members and clarify the inherent trade-offs between structural economy and ceremonial esthetics. Based on these insights, this study develops an innovative optimization strategy that quantitatively adjusts “historical authenticity” and creates an automatic generation and optimization tool—the “Frame Generator”—for raised beam structures. Simulations and multi-objective optimization indicate a 30% deformation reduction under a user-defined 30% decrease in historical authenticity compared to traditional orthogonal beam frame structures, avoiding extreme deformations and demonstrating outstanding material and performance efficiency through inclined members.
Additionally, the parametric tool notably improves design and modeling efficiency, offering quantitative decision-making support for culturally sensitive heritage preservation and imitation designs. Engineering applicability analyses confirm extensive versatility across various scales, enhancing economic viability and construction convenience, especially in large-span ancient buildings. The findings further suggest that the structural economy, articulated through legible load transfer paths and disciplined member sizing, may be meaningfully approached in conjunction with historical authenticity. By treating historical authenticity as a calibrated design variable, the two aims can be pursued as coequal objectives; in practice, this framing supports their simultaneous evaluation and makes the trade-offs between them explicit for decision making.

4.2. Cross-System Adaptability

Although the “Frame Generator” is devised for Chinese raised beam halls, the core pipeline—rule-based frame generation, authenticity-aware structural variants, and multi-objective sizing—has methodological universality and can be extended to other timber traditions with codified component grammars, including Japanese shrine and temple carpentry, European king-post and queen-post and hammer-beam roofs, Korean hanok, and the truss practices of Southeast Asian stilt houses.
In operational terms, adaptation rests on two coupled moves: First, the structural ontology and generative grammar must be re-authored so that the rule set faithfully maps the target system’s bay and module logic, the hierarchy of primary and secondary members such as posts, beams, purlins, rafters, and braces, the admissible obliquity of members, and the discrete dimensional increments, thereby ensuring forms that are structurally coherent and typologically legible. Second, the historical authenticity controller should be reframed as a tradition-specific parameter space grounded in canonical proportioning and cultural prescriptions—for example, the kiwari module ratios used in Japanese shrines, proportion rules for hammer beam construction, and the characteristic curvature of eaves in hanok architecture—and these should be exposed as tunable design genes rather than rigid thresholds to enable continuous fidelity steering. With these two layers re-specified, the existing computational engine can, without altering its solver, generate culturally plausible design families and explore Pareto-optimal trade-offs, while issues such as joint semi-rigidity and material grading remain downstream verification and engineering refinement. This preserves the tool’s efficiency and interpretability within a grammar-driven, authenticity-sensitive framework, and provides a clear pathway for robust transfer across traditions.

4.3. Limitations and Future Work

This study evaluates the proposed frames, primarily under gravity effects and a vertical line load along the purlins. Such a setting is appropriate for early-stage comparison and for halls where vertical actions often dominate daily service conditions. However, it does not yet represent wind suction/uplift or earthquake-induced inertia, which govern sideways behavior, roof–frame compatibility, and the demand on bracing and joints during rare but critical events. Consequently, the reported gains should be read mainly as improvements in vertical-load-dominated performance; a scheme that is efficient under gravity may still require verification of drift control and torsional stability under lateral actions. In future versions of the workflow, we will incorporate combined load cases with region-level wind/seismic presets and lightweight lateral checks so that gravity and lateral performance can be read on the same dashboard.
For modeling efficiency, all joints are idealized as fully rigid, while, in reality, traditional mortise-tenon and bracketed connections are semi-rigid and state-dependent: they tend to be softer at small rotations, stiffen after bearing closes, and dissipate energy under cyclic action. A rigid assumption raises overall stiffness, alters how forces find their paths, and may understate sideways deformation while concentrating demands near member ends. This can bias the sections selected by the optimizer and may overstate the gravity-side advantages of adding inclined members. Going forward, we will expose joint stiffness as a user parameter through calibrated archetypes and include quick sensitivity bands so that recommended sizes remain robust across plausible joint behaviors.
A similar simplification is adopted at the supports: column bases are treated as perfect hinges at ground level, whereas the historical column–plinth interface often offers partial rotational restraint through tenons, sockets, friction, and local bearing. The perfect-hinge assumption can lengthen the modeled flexibility and shift bending demand to upper joints; together with rigid joints aloft, these two assumptions may offset or amplify each other in non-obvious ways. Future releases will allow for users to choose base fixity from pin to near-fixed and will visualize how this choice changes sideways drift and internal force paths, with warnings when solutions become assumption-sensitive.
Beyond boundary conditions, the structure used here is a line model. Member geometry is represented by nominal sections, and the model does not explicitly capture local phenomena at nodes—such as bearing contact, slight slip, or compression around tenons—nor the variability of wood properties with moisture and grain. This abstraction is fit for purpose in comparative studies and concept sizing. As a result, the apparent optimum chosen by the Frame Generator may shift when local effects are considered. To bridge this gap without sacrificing speed, we plan a refinement mode for shortlisted schemes that introduces a small library of parametric sections and simple node-level stiffness elements, together with material-variability bands.
Finally, the evidence base of historical cases remains limited. The number of well-documented exemplars of “column reduction” and “column relocation” is relatively small, which constrains the breadth of the patterns distilled in Section 4. While the extracted strategies are consistent with the surveyed material, they may still be region-, period-, or type-biased. This is a limitation of coverage rather than simulation precision. Future work will enlarge the corpus across regions and dynasties, annotate each case with function, span, and ritual constraints, and make the tool’s recommendations “evidence-aware,” indicating whether a suggested move is strongly or weakly supported by cases similar to the current brief.
In practical terms, the Frame Generator should presently be read as a concept exploration and preliminary sizing aid under gravity-dominant conditions to be followed by lateral checks and, where needed, local detail verification. As lateral modules, joint/base parameterization, and section–node refinement are added, the tool will progressively co-optimize cultural authenticity and structural economy across multiple actions, and will report not only performance, but also robustness to modeling assumptions and the strength of historical evidence behind each recommendation.

Author Contributions

T.L.: conceptualization, methodology, investigation (field research and photography), literature review, data analysis, system development, structural validation, writing; B.Z.: conceptualization of research significance and methodology, literature review, writing—review and editing; Y.Z.: project administration, funding acquisition, supervision, writing—review and editing. All authors have read and agreed to the published version of the manuscript.

Funding

This study was funded by the National Natural Science Foundation of China (No. 52308009).

Data Availability Statement

The raw data supporting the conclusions of this article will be made available by the authors on request.

Acknowledgments

We acknowledge any support given which is not covered by the author’s contribution or funding sections.

Conflicts of Interest

The authors declare no conflicts of interest.

Appendix A. Pseudo-Code of All Components in Stage 2

Appendix A.1. Step 1: Generation of the Raised Beam Frame

Traditional Chinese timber architecture is based on a continuous-bay structural logic, so the raised beam system is generated in two stages: First, an individual bay is created, and then the bays are linked together. User-defined modifications to the column grid—such as column reduction and relocation—are similarly implemented by supplying bay-specific data. Within each bay, generative logic classifies all members as columns; main beams, which span directly between two columns; secondary beams, which have at least one end unsupported by a column; and short post, whose bases rest on beams rather than directly on the foundation.
(1)
Component 1-1: Generate the column bottom points and purlin line
Define depthRafterCounts as the number of rafters of between two columns, the figure below is 1, 2, 3, 2, 2. Define rafterLength as the horizontal length of one rafter. Define eaveColumnHeight as the height of a column at the two edges of the frame. Define raiseFactors as the vertical distance between two adjacent purlins in the frame divided by the corresponding horizontal bay length. Define columnBottomPoints as the bottom points of each column. Define purlinPoints as the points of each purlin in the lateral section of the frame. Define purlinLine as the polyline connecting all the purlin points.
Component 1-1 outputs columnBottomPoints, purlinPoints, and purlinLine by inputing depthRafterCounts, rafterLength, eaveColumnHeight, and raiseFactors. The following table (Table A1) shows the detailed implementation steps. The output results are highlighted in red in the figure.
Table A1. Pseudo-code of component 1-1.
FigureComponent
Buildings 15 03329 i001Input: depthRafterCounts, rafterLength, eaveColumnHeight, raiseFactors
Output: columnBottomPoints, purlinPoints, purlinLine
  • Determine each column’s bottom point’s Y coordinate by multiplying depthRafterCounts with rafterLength to obtain columnBottomPoints.
  • Calculate each purlin point’s Z coordinate by multiplying rafterLength by raiseFactors, then adding eaveColumnHeight, and gather these points into purlinPoints.
  • Create the purlinLine by connecting all purlinPoints into a polyline.
(2)
Component 1-2: Generate the columns and main beams
Define yCoordinateOfPurlinMidpoint as the y coordinate of the midpoint of the purlin, which is the highest purlin point in the lateral section figure. Define columns as the vertical lines of columns, which connects the top points and bottom points of the columns. Define mainBeams as the horizontal lines span between adjacent two columns, with one or two endpoints at the top of the columns.
Component 1-2 outputs columns and mainBeams by inputting columnBottomPoints, purlinLine, and yCoordinateOfPurlinMidpoint. The following table (Table A2) shows the detailed implementation steps. The output results are highlighted in red in the figure.
Table A2. Pseudo-code of component 1-2.
FigureComponent
Buildings 15 03329 i002Input: columnBottomPoints, purlinLine, yCoordinateOfPurlinMidpoint
Output: columns, mainBeams
  • Project each columnBottomPoint in the +Z direction until it intersects the purlinLine. Define the intersection points as columnTopPoints. Define columns as the lines connecting columnBottomPoints to their corresponding columnTopPoints.
  • for each point i in columnTopPoints:
    if y(i) > yCoordinateOfPurlinMidpoint:
      project point i toward −Y until it intersects the columns, create a new line from point i to that intersection, and append it to mainBeams.
    elif y(i) < yCoordinateOfPurlinMidpoint:
      project point i toward +Y until it intersects the columns, create a new line from point i to that intersection, and append it to mainBeams.
(3)
Component 1-3: Generate the secondary beams and short post
Define secondaryBeams as the horizontal lines connecting the points contained in the purlin points, but not in the top points of the columns, and the certain points at the midsection of the columns. Define shortPosts as the vertical lines connecting the points which are contained in the purlin points, but not in the top points of the columns, and the certain points at the midsection of the main beams or secondary beams. Define frame as the set of columns, main beams, secondary beams, and short post.
Component 1-3 outputs secondaryBeams, shortPosts, and frame by inputting purlinPoints, columnTopPoints, columns, and mainBeams. The following table (Table A3) shows the detailed implementation steps. The output results are highlighted in red in the figure.
Table A3. Pseudo-code of component 1-3.
FigureComponent
Buildings 15 03329 i003Buildings 15 03329 i004Input: purlinPoints, columnTopPoints, columns, mainBeams
Output: secondaryBeams, shortPosts, frame
  • Define all nonColumnPurlinPoints as those purlinPoints not contained in columnTopPoints.
  • for each point i in nonColumnPurlinPoints:
    if y(i) is larger than yCoordinateOfPurlinMidpoint:
      project i in the −Y direction until it intersects the columns, and create a line connecting i to that intersection, and append it to secondaryBeams
    elif y(i) is less than yCoordinateOfPurlinMidpoint:
      project i in +Y direction and append the line to secondaryBeams
3.
for each point i in nonColumnPurlinPoints:
    for each point j in nonColumnPurlinPoints, excluding point i:
      if y(i) is equal to y(j):
        for each point m in columnBottomPoints:
          if no m exists whose Y coordinate lies between y(i) and y(j):
            create a line connecting i and j, and append it to secondaryBeams.
4.
for each point i in nonColumnPurlinPoints:
    project i in the −Z direction until it intersects the secondary columns, create a line connecting i to that intersection, and append it to shortPosts.
5.
Combine columns, mainBeams, secondaryBeams, and shortPosts to form frame.
(4)
Component 1-4: Generate all bays of frame, as well as the purlins and tiebeams
Define widths as the distances between each two bays of the frames. Define frames as the set of all of the bays of the frames. Define purlins as the lines connecting every purlin point in the X axis. Define tiebeams as the lines connecting every point intersected by columns and the lowest beams in the X axis.
Component 1-4 outputs secondaryBeams, shortPosts, and frame by inputting purlinPoints, columnTopPoints, columns, and mainBeams. The following table (Table A4) shows the detailed implementation steps. The output results are highlighted in red in the figure.
Table A4. Pseudo-code of component 1-4.
FigureComponent
Buildings 15 03329 i005Buildings 15 03329 i006Input: widths, frame, purlin Points, column Bottom Points
Output: frames, purlins, tie beams
  • Multiply the existing frame by the specified widths to create frames. (Users may specify different depthRafterCount values to generate various frames. The depthRafterCount of the special two central frames is 1, 5, 3, 1, which is highlighted in red in the first figure)
  • Multiply the purlinPoints by the same widths to generate purlins.
  • for each point i in columnBottomPoints:
    project i in the +Z direction until it intersects mainBeams or secondaryBeams, append this intersection in tiebeamPoints.
4.
Multiply the tiebeamPoints by the widths to generate tiebeams

Appendix A.2. Step 2: Generation of the Frame Line Model After Optimization

  • Lateral Optimization Strategy 1—Modification of the Ridge Purlin Support Method
(1)
Component 2-1-1: Determine if any column lies at the center and remove the top short post
Define newShortPosts as the short post after optimization.
Component 2-1-1 outputs newShortPosts or frame by inputting columnTopPoints, yCoordinateOfPurlinMidpoint, shortPosts, and frame. The following table (Table A5) shows the detailed implementation steps. The output results are highlighted in red in the figure.
Table A5. Pseudo-code of component 2-1-1.
FigureComponent
Buildings 15 03329 i007Input: columnTopPoints, yCoordinateOfPurlinMidpoint, shortPosts, frame
Output: newShortPosts or frame
  • for each point i in columnTopPoints:
    if y(i) is equal to yCoordinateOfPurlinMidpoint:
      return frame and stop further steps
    else:
      proceed to the next steps
2.
for each line i in shortPosts:
    remove line i with the highest endpoint
3.
return remaining short post labeled as newShortPosts
(2)
Component 2-1-2: Preserve the top Purlin line (top chords) and generate the frame after optimization
Define newShortPosts as the short post after optimization. Define topChords as the top two purlin line segments. Define frameAfterOptimization1 as the frame after optimization using lateral optimization strategy 1.
Component 2-1-2 outputs topChords and frameAfterOptimization1 by inputting purlinLine, columns, mainBeams, and secondaryBeams. The following table (Table A6) shows the detailed implementation steps. The output results are highlighted in red in the figure.
Table A6. Pseudo-code of component 2-1-2.
FigureComponent
Buildings 15 03329 i008Input: purlinLine, columns, mainBeams, secondaryBeams
Output: topChords, frameAfterOptimization1
  • Explode the purlin as purlinSegments
    for each line i in purlinSegments:
      only keep two line i with the highest endpoint
      return two segments collectively labeled as topChords
2.
Combine columns, mainBeams, secondaryBeams, newShortPosts, topChords to form the frameAfterOptimization1.
  • Lateral Optimization Strategy 2—Introducing inclined members into the original raise-beam frame
(1)
Component 2-2-1: Identify the column spans to be optimized
Define columnA as the column which is closest to the center and the top point of columnA lies within the top three purlin points. Define columnB as the column which is nearest to column A on the opposite side. Define pointX as the intersection point between columnA and the tiebeam.
Component 2-2-1 outputs columnABottomPoint, columnBBottomPoint, pointX, or frame by inputting columnBottomPoints, purlinLine, yCoordinateOfPurlinMidpoint, and frame. The following table (Table A7) shows the detailed implementation steps. The output results are highlighted in red in the figure.
Table A7. Pseudo-code of component 2-2-1.
FigureComponent
Buildings 15 03329 i009Input: columnBottomPoints, purlinLine, yCoordinateOfPurlinMidpoint, frame
Output: columnABottomPoint, columnBBottomPoint, PointX or frame
  • for each point i in columnBottomPoints:
      identify the point i whose y(i) value has the smallest absolute difference from yCoordinateOfPurlinMidpoint, and label that point as columnABottomPoint.
  for each point j in purlinLine:
      sort the absolute differences in y(j) from yCoordinateOfPurlinMidpoint.
      keep the three smallest values in centralPurlinPointYDifference.
      if (y(j) − yCoordinateOfPurlinMidpoint) is within centralPurlinPointYDifference:
          append j in centralPurlinPoints.
      if the y(columnABottomPoint) is contained in the y(centralPurlinPoints):
          return columnABottomPoint and proceed to the next steps.
      else:
          return frame and stop further steps.
2.
for each point i in columnBottomPoints:
      if (y(i) − yCoordinateOfPurlinMidpoint) multiplied by (y(columnABottomPoint) −       yCoordinateOfPurlinMidpoint) is less than zero:
          append i in columnBottomPointsOpposite
for each point i in columnBottomPointsOpposite:
      sort the absolute differences between y(i) and y(columnABottomPoint).
      take the smallest result and assign i as columnBBottomPoint.
3.
for each point m in purlinLine:
      if y(m) is equal to y(columnBBottomPoint):
          define columnBTopPoint as point m.
          project columnBTopPoint along either +Y or −Y until it intersects columnA,
          define PointX as the intersection point.
(2)
Component 2-2-2: Identify the purlin points at mid-span
Define pointM and (or) pointN as the purlin point(s) at mid-span between the columnA and column and with point M or N less than a rafter away from any column. The optimization point will be pointM and(or) pointN because the bending moment is the largest at mid-span.
Component 2-2-2 outputs pointM and (or) pointN by inputting purlinPoints, columnABottomPoint, columnBBottomPoint, and rafterLength. The following table (Table A8) shows the detailed implementation steps. The output results are highlighted in red in the figure.
Table A8. Pseudo-code of component 2-2-2.
FigureComponent
Buildings 15 03329 i010Input: purlinPoints, columnABottomPoint, columnBBottomPoint, rafterLength
Output: pointM, pointN
  • for each point i in purlinPoints:
    if the y coordinate of i lies strictly between the y(columnABottomPoint) and y(columnBBottomPoint):
      append point i in purlinPointsInBetween.
2.
Determine the total number of points in purlinPointsInBetween.
if this number is even:
    pointM is the element at index (count/2) − 1, and pointN is the element at index (count/2).
elif this number is odd:
    pointM and pointN both refer to the middle element at index (count − 1)/2.
3.
if the absolute difference between y(pointM) (or y(pointN)) and y(columnBBottomPoint) equals rafterLength:
    remove pointM or pointN
(3)
Component 2-2-3: Generate the frame after optimization
Define frameAfterOptimization2 as the frame after optimization using lateral optimization strategy 2.
Component 2-2-3 outputs frameAfterOptimization2 by inputting columns, mainBeams, secondaryBeams, shortPosts, columnA, columnB, PointX, pointM, and pointN. The following table (Table A9) shows the detailed implementation steps. The output results are highlighted in red in the figure.
Table A9. Pseudo-code of component 2-2-3.
FigureComponent
Buildings 15 03329 i011
Buildings 15 03329 i012 Buildings 15 03329 i013
Input: columns, mainBeams, secondaryBeams, shortPosts, columnA, columnB, PointX, pointM, pointN
Output: frameAfterOptimization2
  • To transfer the loads of pointM,
  define inclinedMember1 as the line connecting with intersectionPointX and pointM.
    for each point i in purlinPoints:
      if the y coordinate of i lies between y(columnBBottomPoints) and y(PointM):
        append point i in inclinedMember2Points.
        inclinedMember2 is the polyline connecting all inclinedMember2Points.
2.
Connect the columnATopPoint and columnBTopPoint to form lineAB,
for each point i in inclinedMember2Point:
    project point i in the −Z direction until it intersects lineAB.
    connect the point i and the intersection point to form the newShortPosts.
for each line i in shortPosts:
    for each line j in newShortPosts:
      if line i’ s endpoint shares a Y coordinate with line j’s endpoint:
        remove line i.
        append the newShortPosts to the shortPosts.
3.
for each line i in secondaryBeam:
    if line i intersects with inclinedMember1:
      remove line i.
4.
Combine columns, mainBeams, secondaryBeams, shortPosts, inclinedMember1, inclinedMember2 to form the frameAfterOptimization2.
5.
The load transfer at pointN follows the same principle as that at pointM. Hence, it will not be elaborated further here.
  • Lateral Optimization Strategy 3—Inclining horizontal members into the original raise-beam frame
(1)
Component 2-3-1: Identify the column spans to be optimized
Define columnA and columnB as the column lines that are on the same side and have the largest Y difference, where that Y difference must exceed one rafter.
Component 2-3-1 outputs columnABottomPoint, columnBBottomPoint, or frame by inputting columnBottomPoints and yCoordinateOfPurlinMidpoint. The following table (Table A10) shows the detailed implementation steps. The output results are highlighted in red in the figure.
Table A10. Pseudo-code of component 2-3-1.
FigureComponent
Buildings 15 03329 i014Input: columnBottomPoints, yCoordinateOfPurlinMidpoint
Output: columnABottomPoint, columnBBottomPoint or frame
  • for each point i in columnBottomPoints:
    compare y(i) and yCoordinateOfPurlinMidpoint to divide them into largeColumnBottomPoints and smallColumnBottomPoints.
2.
for each point i in largeColumnBottomPoints:
    calculate the difference between y(i) and y(previous point of point i)
    append each y difference to yDifferenceLargeColumnBottomPoints.
for each i in yDifferenceLargeColumnBottomPoints:
    if i is equal to one rafter:
      return frame and stop further steps.
    else:
      proceed to the next steps.
3.
Sort yDifferenceLargeColumnBottomPoints to obtain the columnABottomPoint which has the largest y difference from the previous point labeled as columnBBottomPoint.
(2)
Component 2-3-2: Generate the inclined member
Define inclinedMember as the newly inserted inclined member.
Component 2-3-2 outputs inclinedMember by inputting columnABottomPoint, columnBBottomPoint, purlinLine, and rafterLength. The following table (Table A11) shows the detailed implementation steps. The output results are highlighted in red in the figure.
Table A11. Pseudo-code of component 2-3-2.
FigureComponent
Buildings 15 03329 i015Input: columnABottomPoint, columnBBottomPoint, purlinLine, rafterLength
Output: inclinedMember
  • Project columnABottomPoint in the +Z direction until it intersects purlinLine
 define the intersection as columnATopPoint.
2.
Project columnBBottomPoint in the +Z direction until it intersects the purlinLine
 define the line connecting the intersection with columnBBottomPoint as columnB.
3.
Subtract y(columnABottomPoint) by rafterLength to find the previous purlin point of columnATopPoint labeled as pointM. Create a vector from columnATopPoint to pointM. Project columnATopPoint in this vector direction until it intersects columnB. Label the new intersection as pointN.
4.
Define the line connecting with columnATopPoint and pointN as inclinedMember.
(3)
Component 2-3-3: Generate the frame after optimization
Define frameAfterOptimization3 as the frame after optimization using lateral optimization strategy 3.
Component 2-3-3 outputs inclinedMember by inputting columnABottomPoint, columnBBottomPoint, purlinLine, and rafterLength. The following table (Table A12) shows the detailed implementation steps. The output results are highlighted in red in the figure.
Table A12. Pseudo-code of component 2-3-3.
FigureComponent
Buildings 15 03329 i016Buildings 15 03329 i017Input: columns, mainBeams, secondaryBeams, shortPosts, inclinedMember
Output: frameAfterOptimization3
  • for each line i in mainBeams:
    if line i intersects inclinedMember:
      remove line i from mainBeams.
2.
Apply the same removal method to secondaryBeams and shortPosts.
3.
for each point i in purlinPoints:
    select the point i whose y coordinate strictly lies between y(columnABottomPoint) and y(columnBBottomPoint).
    Project those points in the +Z direction until they intersect purlinLine.
    Define the lines connecting those points with intersections as tinyMembers.
4.
Combine columns, mainBeams, secondaryBeams, shortPosts, inclinedMember and tinyMembers to form frameAfterOptimization3.
5.
For the other side of the frame, the same principle applies, and no further details are elaborated here.
  • Longitudinal optimization strategy
(1)
Component 2-4-1: Identify the column spans to be optimized
Define maxSpanLine as lines which have the maximum longitudinal span among all of the columns’ bottom points.
Component 2-4-1 outputs maxSpanLine by inputting columnBottomPoints and widths. The following table (Table A13) shows the detailed implementation steps. The output results are highlighted in red in the figure.
Table A13. Pseudo-code of component 2-4-1.
FigureComponent
Buildings 15 03329 i018Input: columnBottomPoints, widths
Output: maxSpanLine
  • Group columnBottomPoints based on their y coordinate.
for each group of points sharing the same y coordinate:
    create the spanLines connecting points one by one.
2.
Measure the length of lines to find the maxSpanLine.
for each i in maxSpanLine:
    if i is not strictly larger than any widths:
      remove i.
(2)
Component 2-4-2: Generate the longitudinal truss
Define normalMainBeams as the main beam lines in original frame. Define trussSpanHeightRatio as the ratio of height of truss to its span. Define vierendeelTrussBool as a Boolean toggle to determine whether to keep the diagonal web member at the center of the truss or not. The vierendeelTrussBool is set to True by default. When vierendeelTrussBool is False, the truss will keep the diagonal web members at the center to enhance the bending stiffness of truss. Define newFrames as the newly generated frame assuming with the support by columns where the truss exists.
Component 2-4-2 outputs newFrames and truss by inputting all inputs of generation of raised beam structure, normalMainBeams, trussSpanHeightRatio, and vierendeelTrussBool. The following table (Table A14) shows the detailed implementation steps. The output results are highlighted in red in the figure.
Table A14. Pseudo-code of component 2-4-2.
FigureComponent
Buildings 15 03329 i019 Buildings 15 03329 i020Input: All inputs of generation of raised beam structure, normalMainBeams, trussSpanHeightRatio, vierendeelTrussBool
Output: newFrames, truss
  • Move the maxSpanLine in the +Z direction until they intersect normalMainBeams.
 Define the resulting lines as topChords.
2.
Move the topChord in the −Z direction by (length of topChords/trussSpanHeightRatio). Define the resulting lines as bottomChords.
3.
Assume the frame is supported by columns where the truss exists. Generate a new frame in this assumption by Component 1-1 to 1-4 labeled as newFrames.
 Find the intersection points between topChords and newMainBeams plus newSecondaryBeams. Project these points in the −Z direction until they intersect the bottomChords. Define the lines connecting these points and their corresponding intersection points as verticalWebs.
4.
Subdivide each topChord into four segments, and each bottomChord into two segments. Connect the points to create diagonalWebs.
if vierendeelTrussBool is True:
    remove the middle two diagonalWebs.
5.
Combine topChords, bottomChords, verticalWebs, diagonalWebs to form truss.
(3)
Component 2-4-3: Revise some members and generate the frame after optimization
Define revisedFrames as the frames after revision especially the shortened columns. Define frameAfterOptimization4 as the frame after optimization using the longitudinal optimization strategy.
Component 2-4-3 outputs revisedFrames and frameAfterOptimization4 by inputting newFrames, newColumns, newMainBeams, newSecondaryBeams, newShortPosts, tieBeams, truss, and normalFrames. The following table (Table A15) shows the detailed implementation steps. The output results are highlighted in red in the figure.
Table A15. Pseudo-code of component 2-4-3.
FigureComponent
Buildings 15 03329 i021 Buildings 15 03329 i022Input: newFrames, newColumns, newMainBeams, newSecondaryBeams, newShortPosts, tieBeams, truss, normalFrames
Output: revisedFrames, frameAfterOptimization4
  • for each line i in newColumns:
    for each line j in topChords:
      if line i intersects line j:
        shorten line i at the intersection.
2.
for each segment i in tieBeams:
    if segment i coincides with topChords:
      remove segment i.
3.
Combine newColumns, newMainBeams, newSecondaryBeams, newShortPosts, tieBeams and truss to form revisedFrames.
4.
Combine revisedFrames and normalFrames to form frameAfterOptimization4.

References

  1. Liang, W.; Ahmad, Y.; Mohidin, H.H.B. The Development of the Concept of Architectural Heritage Conservation and Its Inspiration. Built Herit. 2023, 7, 21. [Google Scholar] [CrossRef]
  2. Karadag, İ. Machine Learning for Conservation of Architectural Heritage. OHI 2023, 48, 23–37. [Google Scholar] [CrossRef]
  3. Yamato, S. The Tradition of Wooden Architecture in Japan; Agency for Cultural Affairs: Kyoto, Japan, 2006. [Google Scholar]
  4. Wibowo, A.S. Conservation of Wooden Architecture: Willingness, Support and Tradition. Procedia-Soc. Behav. Sci. 2015, 184, 388–393. [Google Scholar] [CrossRef][Green Version]
  5. Zhang, J.; Wang, Z.; Wang, W. Application of Smart Modelling Framework for Traditional Wooden Architecture. Buildings 2024, 14, 2130. [Google Scholar] [CrossRef]
  6. Abdelmoniem, A.M. Preserving the Wooden Heritage of the National Police Museum: Challenges and Conservation Strategies. J. Infrastruct. Preserv. Resil. 2025, 6, 14. [Google Scholar] [CrossRef]
  7. Jardim, P.I.L.G.; Monteiro, S.N.; Azevedo, A.R.G.D.; De Araújo, V.A.; Panzera, T.H.; Christoforo, A.L. Preservation and Maintenance of Wood-Based Structures of Historic Buildings: A Systematic Literature Review on Structural Recovery Techniques. Case Stud. Constr. Mater. 2025, 22, e04706. [Google Scholar] [CrossRef]
  8. Lapshina, E.G.; Eshchin, D.V. Wooden Houses of Penza Town of the 19th–Early 20th Centuries and the Problem of Heritage Preservation. IOP Conf. Ser. Mater. Sci. Eng. 2020, 775, 012068. [Google Scholar] [CrossRef]
  9. Valetti, L.; Floris, F.; Pellegrino, A. Renovation of Public Lighting Systems in Cultural Landscapes: Lighting and Energy Performance and Their Impact on Nightscapes. Energies 2021, 14, 509. [Google Scholar] [CrossRef]
  10. Han, Y.; Chun, Q.; Xu, X.; Teng, Q.; Dong, Y.; Lin, Y. Wind Effects on Chinese Traditional Timber Buildings in Complex Terrain: The Case of Baoguo Temple. J. Build. Eng. 2022, 59, 105088. [Google Scholar] [CrossRef]
  11. Guo, Q. Yingzao Fashi: Twelfth-Century Chinese Building Manual. Archit. Hist. 1998, 41, 1–13. [Google Scholar] [CrossRef]
  12. Shiqiao, L. Reconstituting Chinese Building Tradition: The Yingzao Fashi in the Early Twentieth Century. J. Soc. Archit. Hist. 2003, 62, 470–489. [Google Scholar] [CrossRef]
  13. Lin, F.C.-h. Chinese Architecture and Metaphor: Song Culture in the Yingzao Fashi Building Manual. Asian Stud. Rev. 2014, 38, 301–302. [Google Scholar] [CrossRef]
  14. Hang, T. Beside Yingzao: An Index of Chinese Building Traditions. Master’s Thesis, Yale University, New Haven, CT, USA, 2022. (In Chinese). [Google Scholar]
  15. Liang, S.C. History of Chinese Architecture; Hualing Press: Beijing, China, 2023; ISBN 978-7-5169-2638-3. (In Chinese) [Google Scholar]
  16. Lin, H.Y. Lin Huiyin on Architecture; Jiuzhou Press: Beijing, China, 2005; ISBN 978-7-80195-313-1. (In Chinese) [Google Scholar]
  17. Piao, S.Y.; Phoenix Space. The Wisdom Hidden in Wood: Notes on Traditional Chinese Architecture; Jiangsu Phoenix Science and Technology Press: Nanjing, China, 2020; ISBN 978-7-5713-1493-4. (In Chinese) [Google Scholar]
  18. Wang, Q.J. The Miracle of Timber Frames: Great Ancient Chinese Architecture; China Architecture & Building Press: Beijing, China, 2023; ISBN 978-7-111-72581-7. (In Chinese) [Google Scholar]
  19. Zheng, W. A Study on the Technique of Reducing and Shifting Columns in the Timber Structure of Huizhou-Style Residential Halls in Hongcun, Southern Anhui. Archit. Cult. 2019, 227–229. (In Chinese) [Google Scholar]
  20. Zou, C.; Li, H. A study on the reasons for the prevalence and historical significance of the column-reduction technique in Yuan Dynasty timber architecture. Anhui Archit. 2014, 20, 33–35. (In Chinese) [Google Scholar]
  21. Gámez, O.; Bignon, J.-C.; Duchanois, G. Assisted Construction of Non-Standard Wooden Walls and Envelope Structures by Parametric Modeling. In Communications in Computer and Information Science; Springer: Berlin/Heidelberg, Germany, 2015; pp. 291–308. ISBN 978-3-662-47385-6. [Google Scholar]
  22. Khidmat, R.P.; Fukuda, H. Kustiani Design Optimization of Hyperboloid Wooden House Concerning Structural, Cost, and Daylight Performance. Buildings 2022, 12, 110. [Google Scholar] [CrossRef]
  23. Massafra, A.; Prati, D.; Predari, G.; Gulli, R. Wooden Truss Analysis, Preservation Strategies, and Digital Documentation through Parametric 3D Modeling and HBIM Workflow. Sustainability 2020, 12, 4975. [Google Scholar] [CrossRef]
  24. Prati, D.; Zuppella, G.; Mochi, G.; Guardigli, L.; Gulli, R. Wooden trusses reconstruction and analysis through parametric 3D modeling. Int. Arch. Photogramm. Remote Sens. Spatial Inf. Sci. 2019, XLII–2/W9, 623–629. [Google Scholar] [CrossRef]
  25. Wang, X.; Wu, C.; Que, R.; Bai, C. Algorithm modeling of ancient architecture for heritage documentation. Int. Arch. Photogramm. Remote Sens. Spatial Inf. Sci. 2019, XLII–2/W15, 1209–1213. [Google Scholar] [CrossRef]
  26. Ren, P.; Zhou, M.; Wu, Z.; Zhang, J.; Huang, Y.; Shui, W. Data-Driven Modeling for Chinese Ancient Architectures. In Proceedings of the Symposium on VR Culture and Heritage—Volume 2, Proceedings of the the 15th International Conference on Virtual-Reality Continuum and its Applications in Industry, Zhuhai, China, 3–4 December 2016; ACM: New York, NY, USA, 2016; pp. 59–62. [Google Scholar]
  27. Song, X.; Wu, X.; Yan, B.; Meng, J.; Chen, S. Design Principles and Case Analysis of Student Structural Design Competition Projects. Mech. Pract. 2020, 42, 388–393. [Google Scholar]
  28. Li, B. A Study on the Main Inclined Timber Components in Traditional Chinese Architecture. Master’s Thesis, Shaanxi Normal University, Xi’an, China, 2017. [Google Scholar]
  29. Liang, S.; Fei, W. Illustrated History of Chinese Architecture: Chinese–English Bilingual Edition; Liang, C., Translator; Baihua Literature and Art Publishing House: Beijing, China, 2001. [Google Scholar]
  30. Liu, J. An Investigation of the Architectural Artistic Characteristics of the Jin Dynasty Based on Chongfu Temple at Shuozhou. Master’s Thesis, Shanxi University, Taiyuan, China, 2015. (In Chinese). [Google Scholar]
  31. Zhang, Y. Measured Drawings of Guangsheng Temple in Hongtong, Shanxi. J. Chin. Archit. Hist. Theory 2014, 433–443. (In Chinese) [Google Scholar]
  32. Hua, Y. Archaeological Observations on the Curved-Foot Transformation of Renzi Gong Brackets. J. Image Hist. 2022, 135–161. (In Chinese) [Google Scholar]
Figure 1. The basic characteristics of a raised beam frame: (a) Load transfer path of the raised beam frame (the red dashed line represents the direction of force transmission.); (b) Frame configuration changes before and after column reduction and column relocation operations (the red solid circles represent the purlins that are sectioned; the vertical green lines represent columns or short posts; the horizontal yellow lines represent beams.). (diagram drawn by the author).
Buildings 15 03329 g001
Figure 2. Research methodology diagram (diagram drawn by the author).
Buildings 15 03329 g002
Figure 3. Structural logic of each frame and overall frames: (a) Diagram of the connection line between purlins and column tops (diagram drawn by the author; (b) Diagram of the logic of interconnected frames (data from Wisdom Hidden in Wood) [17].
Buildings 15 03329 g003
Figure 4. Four basic methods for supporting the ridge purlin: (a) Exclusively by Cha Shou; (b) By Cha Shou in combination with short post, with prominent Cha Shou; (c) By Cha Shou in combination with short post, with smaller Cha Shou; (d) Exclusively by short post (diagram drawn by the author).
Buildings 15 03329 g004
Figure 5. Examples for four basic methods for supporting the ridge purlin: (a) Main Hall of Foguang Temple on Mount Wutai, Shanxi Province; (b) Gate of Dule Temple in Jixian, Hebei Province; (c) Main Hall of Shanhua Temple in Datong, Shanxi Province; (d) Sacrificial Hall of the Ming Tombs in Changping, Hebei Province(red arrows represent the force transfer direction) (redrawn by the authors based on the data from Illustrated History of Chinese Architecture) [29].
Buildings 15 03329 g005
Figure 6. Column reduction in Guanyin Hall: (a) Plan before and after column reduction (the red area in the figure represents the platform base, the yellow area indicates the building interior, the solid green circles represent columns, and the white lines denote the column grid axes.) (diagram drawn bt the author); (b) Special structural solution (photo by the author); (c) Measured sectional drawing (the red highlighted members represent inclined structural elements, while the red dashed lines indicate the positions of the columns before the column-reduction operation.) (data from An Investigation of the Architectural Artistic Characteristics of the Jin Dynasty Based on Chongfu Temple at Shuozhou) [30].
Buildings 15 03329 g006
Figure 7. Member layout for lateral optimization strategy two in the seven-purlin configuration (red cross indicates that this case is not applicable) (diagram drawn by the author).
Buildings 15 03329 g007
Figure 8. Member layout for lateral optimization strategy two in the nine-purlin configuration (red cross indicates that this case is not applicable) (diagram drawn by the author).
Buildings 15 03329 g008
Figure 9. Column reduction and column relocation in Amitabha Hall of Guangsheng Upper Temple: (a) Plans before and after column reduction and relocation (diagram drawn by the author); (b) Sections before and after column reduction and relocation (diagram drawn by the author); (c) Special structural solution (photo by the author); (d) Measured sectinal drawing (data from Measured Drawings of Guangsheng Temple in Hongtong, Shanxi) [31].
Buildings 15 03329 g009
Figure 10. Sections for Pujing Temple before and after column reduction and relocation (diagram drawn by the author).
Buildings 15 03329 g010
Figure 11. Member layout for lateral optimization strategy three (diagram drawn by the author).
Buildings 15 03329 g011
Figure 12. Column reduction and column relocation in Wenshu Hall: (a) Plans before and after column reduction and relocation (the red dashed box highlights the structural component shown in the figure below) (diagram drawn by the author); (b) Measured sectional drawing (redrawn by the author based on the data from Illustrated History of Chinese Architecture) [29]; (c) Special structural solution (photo by the author).
Buildings 15 03329 g012
Figure 13. Column reduction and column relocation in Amitabha Hall of Chongfu Temple: (a) Measured plan drawing (data from An Investigation of the Architectural Artistic Characteristics of the Jin Dynasty Based on Chongfu Temple at Shuozhou) [30]; (b) Special structural solution (The central text in the figure reads: Namo Amitabha) (photo by the author).
Buildings 15 03329 g013
Figure 14. Renzi Gong combined with bracket complexes (redrawn by the authors based on the data from Archaeological Observations on the Curved-Foot Transformation of Renzi Gong) [32].
Buildings 15 03329 g014
Figure 15. Analysis of Wenshu Hall: (a) Plan of the column grid and beam frame line; (b) Plan of the column grid and beam frame line introducing palar oblique members(diagram drawn by the author) (the red dashed line represents the possible better beam positions).
Buildings 15 03329 g015
Figure 16. Examples of various irregularly-shaped bracket sets: (a) Orthogonal corner bracket set; (b) Oblique corner bracket set; (c) 60° inclined bracket set; (d) 45° inclined bracket set; (e) Single-projection inclined bracket set. (photo by the author).
Buildings 15 03329 g016
Figure 17. The output results of every component in Step 1: Frame Generation: (a) Outputs of Component 1-1; (b) Outputs of Component 1-2; (c,d) Outputs of Components 1-3; (e,f) Outputs of Components 1-4 (The newly generated output of each component is highlighted in red, while the existing information is shown in black) (diagram drawn by the author).
Buildings 15 03329 g017
Figure 18. The output results of every component in lateral optimization strategy 1: (a) Outputs of Component 2-1-1; (b) Outputs of Component 2-1-2 (The newly generated output of each component is highlighted in red, while the existing information is shown in black) (diagram drawn by the author).
Buildings 15 03329 g018
Figure 19. The output results of every component in lateral optimization strategy 2: (a) Outputs of Component 2-2-1; (b) Outputs of Component 2-2-2; (ce) Outputs of Components 2-2-3 (The newly generated output of each component is highlighted in red, while the existing information is shown in black) (diagram drawn by the author).
Buildings 15 03329 g019
Figure 20. The output results of every component in lateral optimization strategy 3: (a) Outputs of Component 2-3-1; (b) Outputs of Component 2-3-2; (c,d) Outputs of Component 2-3-3 (The newly generated output of each component is highlighted in red, while the existing information is shown in black) (diagram drawn by the author).
Buildings 15 03329 g020
Figure 21. The output results of every component in the longitudinal optimization strategy: (a) Outputs of Component 2-4-1; (b,c) Outputs of Component 2-4-2; (d,e) Outputs of Components 2-4-3 (diagram drawn by the author).
Buildings 15 03329 g021
Figure 22. Settings for structural line model before and after optimization: (a) before optimization; (b) after optimization(diagram drawn by the author).
Buildings 15 03329 g022
Figure 23. Structural displacement diagram of all Pareto solutions before and after optimization: (a) Before optimization; (b) After optimization (diagram drawn by the author).
Buildings 15 03329 g023
Figure 24. All parameters before and after optimization in Wallacei: (a) Before optimization; (b) After optimization (diagram drawn by the author).
Buildings 15 03329 g024
Figure 25. Balance between historical authenticity and structural economy (diagram drawn by the author).
Buildings 15 03329 g025
Table 1. Structure self-weight and maximum displacement of front 50 Pareto solutions before and after optimization.
NO.Before OptimizationAfter Optimization
Structure Self-Weight
(t)
Maximum Displacement
(mm)
Structure Self-Weight
(t)
Maximum Displacement
(mm)
164.4017.7956.4914.56
281.6613.4956.4914.56
375.5014.5951.4916.55
482.3313.4584.3511.56
545.8923.3851.4916.55
645.8923.3850.3616.85
764.4017.7945.1821.19
882.3313.4569.5511.99
968.7014.6084.3511.56
1075.5014.5945.1821.19
1144.3525.1250.3616.85
1244.0127.1245.1821.19
1364.4017.7958.2313.69
1444.6525.0245.5519.90
1543.5127.1450.3616.85
1652.1521.7358.2313.69
1782.3313.4556.4914.56
1868.7014.6049.4217.24
1946.5623.3350.3616.85
2056.2318.4045.1821.19
2152.3420.2983.3811.56
2254.9918.7886.2911.53
2380.7213.6970.4911.85
2453.9619.9852.6515.55
2582.3313.4545.5519.90
2639.3938.6358.2313.69
2782.3313.4586.2911.53
2846.5623.3347.8717.72
2956.7418.3145.9019.61
3054.9918.7851.2416.68
3138.8838.8070.4911.85
3243.5127.1447.3418.04
3335.5666.1658.2313.69
3464.4017.7948.6017.39
3537.5144.0574.2511.60
3643.5127.1452.6515.55
3755.9218.7846.5419.40
3876.8714.2251.5115.55
3956.7418.3157.8714.06
4065.0215.1155.7915.38
4147.6421.9345.5519.90
4245.3224.9262.1613.46
4339.9035.4956.4914.56
4439.3938.6362.4612.79
4556.7418.3165.6712.45
4666.3915.1045.5519.90
4739.6938.4047.3418.04
4882.3313.4568.0112.40
4978.3614.0658.2313.69
5046.4023.3772.9611.66
Average57.9622.2057.6015.59
Disclaimer/Publisher’s Note: The statements, opinions and data contained in all publications are solely those of the individual author(s) and contributor(s) and not of MDPI and/or the editor(s). MDPI and/or the editor(s) disclaim responsibility for any injury to people or property resulting from any ideas, methods, instructions or products referred to in the content.