Article

Experimental and Theoretical Studies on Shear Performance of Corrugated Steel–Concrete Composite Arches Considering the Shear–Compression Ratio

1
Harbin Institute of Technology, School of Civil Engineering, Harbin 150090, China
2
Heilongjiang Province Longjian Road & Bridge The First Engineering Co., Ltd., Harbin 150090, China
3
China Railway 19TH Bureau Group Corporation Limited, Dalian 116000, China
*
Author to whom correspondence should be addressed.
Buildings 2025, 15(18), 3316; https://doi.org/10.3390/buildings15183316
Submission received: 21 August 2025 / Revised: 7 September 2025 / Accepted: 11 September 2025 / Published: 13 September 2025
(This article belongs to the Section Building Structures)

Abstract

Corrugated steel–concrete (CSC) composite arches, an innovative structural system with simplified construction and enhanced stiffness, are widely used in bridge and tunnel modular engineering. However, insufficient research on their shear performance limits prefabricated applications. Similarly to beams, their shear behavior is significantly affected by loading location. Specifically, as a parameter significantly affected by the loading location, the shear–compression ratio exerts a notable influence on the shear bearing capacity of CSC arches by altering the development pattern of cracks and the inclination angle of shear cracks. To investigate the influence mechanism of the loading location, this study is the first to systematically link shear–compression ratio variation to load location in CSC arches. In this context, shear performance tests were conducted on two CSC specimens with different loading locations (mid-span and quarter-point) to investigate the influence of loading locations on the shear behavior of CSC arches. To further investigate the impact of key parameters on the shear bearing capacity of CSC arches, a validated finite element model was employed to support the parametric analysis. The parameters involved include the span-to-rise ratio, shear connector spacing, strength and thickness of corrugated steel, as well as strength and thickness of concrete. Theoretical calculations for internal forces under varying rise-to-span ratios and loading methods are conducted, proposing an analytical solution method. Validation using 2 experiments and 96 finite element results show that a modified method is applicable, with a mean value of 1.066, corresponding to a standard deviation of 0.071, and all relative errors within 15%. By introducing the shear–compression ratio, this study extends existing methods to make them applicable under single-point loading, thereby enabling their use for guiding engineering. Similarly, the internal force analysis method proposed herein can serve as a theoretical foundation, providing a valuable reference for future research on shear capacity calculation methods for CSC arches with varying cross-sectional configurations and those where bending moments play a more significant role.

1. Introduction

Corrugated steel–concrete (CSC) composite arches represent an innovative type of steel–concrete composite structural system. The corrugated steel component can serve as a formwork, enabling support-free construction [1,2,3]. As a composite structural form, CSC arches exhibit improved overall stiffness [4,5,6,7], which effectively mitigates the stability concerns inherent to conventional corrugated steel arches [8,9,10]. This performance advantage makes them widely applied in various engineering practices, including utility tunnels, bridges, and culverts [11,12,13]. Moreover, due to their excellent corrosion resistance and the protective support provided by corrugated steel to the concrete, CSC arches address critical technical issues in urban utility tunnel construction, such as reinforcement corrosion and concrete spalling during prefabricated assembly processes [14,15,16]. Nevertheless, the complex internal force distribution caused by the arch-shaped geometry and external loading conditions results in distinct failure behaviors compared to traditional beams and columns [17,18,19,20]. Consequently, the accurate assessment of the static performance of CSC arches has long been a key challenge in their design practice.
Since the introduction of the CSC arch structural form, scholars have conducted a sequence of investigations and have proposed well-established design methods for CSC arches under axial compression and compression-bending conditions [21,22,23,24,25]. However, the absence of specific design provisions for the shear performance of CSC arches may significantly impede their application in prefabricated construction. Furthermore, existing research findings and engineering practices have indicated [26,27] that CSC arches with low slenderness ratios tend to shear failure. While current design standards (Eurocode 2 [28], ACI 318M-08 [29], GB/T 50010 [30]) provide detailed provisions for RC member shear bearing capacity, CSC arches exhibit two fundamental behavioral distinctions. (1) Arch structures experience substantial axial forces, which is beneficial to the shear performance of structures, and this conclusion is widely proposed in related studies. (2) The incorporation of corrugated steel components can effectively improve the shear bearing capacity of structures. In related studies on composite beams and shear walls, employing corrugated steel has been proven effective [31,32,33,34,35,36,37]. Currently, only Chen et al. [38] have researched the shear behavior of CSC arches, and the same pattern was found. Furthermore, they have discovered that the application of current design codes significantly underestimates the shear bearing capacity of CSC arches.
Similarly to beam structures, the loading location is recognized as a critical factor influencing the shear bearing capacity. It directly affects the failure modes and crack patterns, thereby significantly impacting the shear performance [39,40,41,42]. Furthermore, in studies related to the compression-bending performance of arch structures, it has been demonstrated that the loading location alters the characteristics of internal force distribution, consequently significantly affecting their compression-bending performance [43,44,45]. However, no study has yet considered the influence of loading location on the shear behavior and shear bearing capacity of CSC arches. Chen et al. [38] identified that internal forces have a significant influence on the shear bearing capacity of CSC arches. However, they did not investigate how the distribution of internal forces affects the shear capacity of CSC arches, nor did they directly consider the critical factor of the shear–compression ratio. Furthermore, when the loading location changes, the shear–compression ratio can significantly alter, thereby influencing the shear capacity of CSC arches. Therefore, the applicability of this formula under different loading locations requires further evaluation.
In this context, shear performance tests were conducted on two CSC arch specimens with different loading locations (mid-span and quarter-point). Subsequently, a finite element analysis model validated against the experimental data was developed, and a systematic parametric study was conducted. Additionally, supported by the data from both experiments and the finite element model, this paper: (1) Performed theoretical calculations of the internal forces for all sections of CSC arches with varying rise-to-span ratios and loading methods, proposing a theoretical calculation method for obtaining analytical solutions of the internal force in CSC arches. (2) Using the results from the 2 specimens and 141 sets of finite element calculations presented in this paper to validate the applicability of existing calculation methods.

2. Experimental Program

2.1. Specimen Design

As shown in Table 1, two CSC composite arch specimens, designated as CSCA, were designed, differing primarily in loading condition as the key experimental parameter: mid-span point loading (CSCA-M) and quarter-span point loading (CSCA-Q). To mitigate in-plane stability failure, the slenderness ratio was maintained between 23.0 and 33 [46] The composite arches featured a span of 3 m and a concrete topping thickness of 150 mm. For two specimens, the rise-to-span ratio (f/L) of 1/4 is adopted, corresponding to the rise height (f) of 750 mm. In accordance with JTG D61—2005 [47] (requiring the width-to-span ratio > 0.05), a specimen width of 0.6 m was adopted to prevent out-of-plane instability. A commonly employed corrugated steel cross-sectional geometry of 200 mm × 55 mm was selected, and the corrugated steel thickness (tcs) is set at 3 mm to ensure the steel content remains within a reasonable range. The characteristic concrete compressive strength (fck) was specified as 50 MPa.
Figure 1 details the specimen cross-section, shear connector configuration, and reinforcement layout. Dowel-type shear connectors were fabricated from 8 mm diameter HRB335 bars and welded at the interface between longitudinal reinforcement and corrugated steel [25,45]. To accommodate both positive and negative bending moments in the arch structure, the top reinforcement ratio was designed to match the bottom corrugated steel ratio (2.4%). To achieve this, seven HRB335 longitudinal bars (20 mm in diameter) were used. They were spaced at 100 mm across the arch width, with a 20 mm concrete cover. Span-wise distribution reinforcement consisted of 8 mm diameter HRB335 transverse bars at 200 mm. A concrete loading platform was monolithically cast with the arch surface to ensure the integrity of load introduction [45].

2.2. Material Performance Testing

Due to the differing extents of bending applied to the steel at the crest, middle, and trough positions during the rolling and bending phases of fabrication, variations in mechanical properties were anticipated. Consequently, specimens were sampled from these three locations, respectively, with flat steel plate specimens from the same parent material serving as the control group. Tensile tests were conducted following GB/T 228.1-2021 [48], comprising four groups (each containing three identical specimens). Figure 2 presents the stress–strain relationship curves for the four groups of steel. As illustrated, the yield strengths of the corrugated steel at the crest, middle, and trough after cold working were similar, at 332.5 MPa, 341.2 MPa, and 340.2 MPa, respectively. These values differed insignificantly from the yield strength of the flat steel plate (340.7 MPa). It can therefore be concluded that significant strengthening of the corrugated steel did not occur during the cold working process. Therefore, variations in mechanical properties across different locations of the corrugated steel are not considered.
To determine the concrete mechanical properties during the fabrication of CSC arch specimens, tests on the material properties of concrete cured for 28 days were conducted according to GB/T 50081-2019 [49]. The concrete exhibited a compressive cube strength of 50.1 MPa and an elastic modulus of 28.9 GPa. Additionally, tensile tests of rebar steel were conducted following GB/T 228.1-2021 [48]. The rebars with diameters of 8 mm and 20 mm exhibited a yield strength of 361.7 MPa and 341.2 MPa, respectively.

2.3. Test Setup

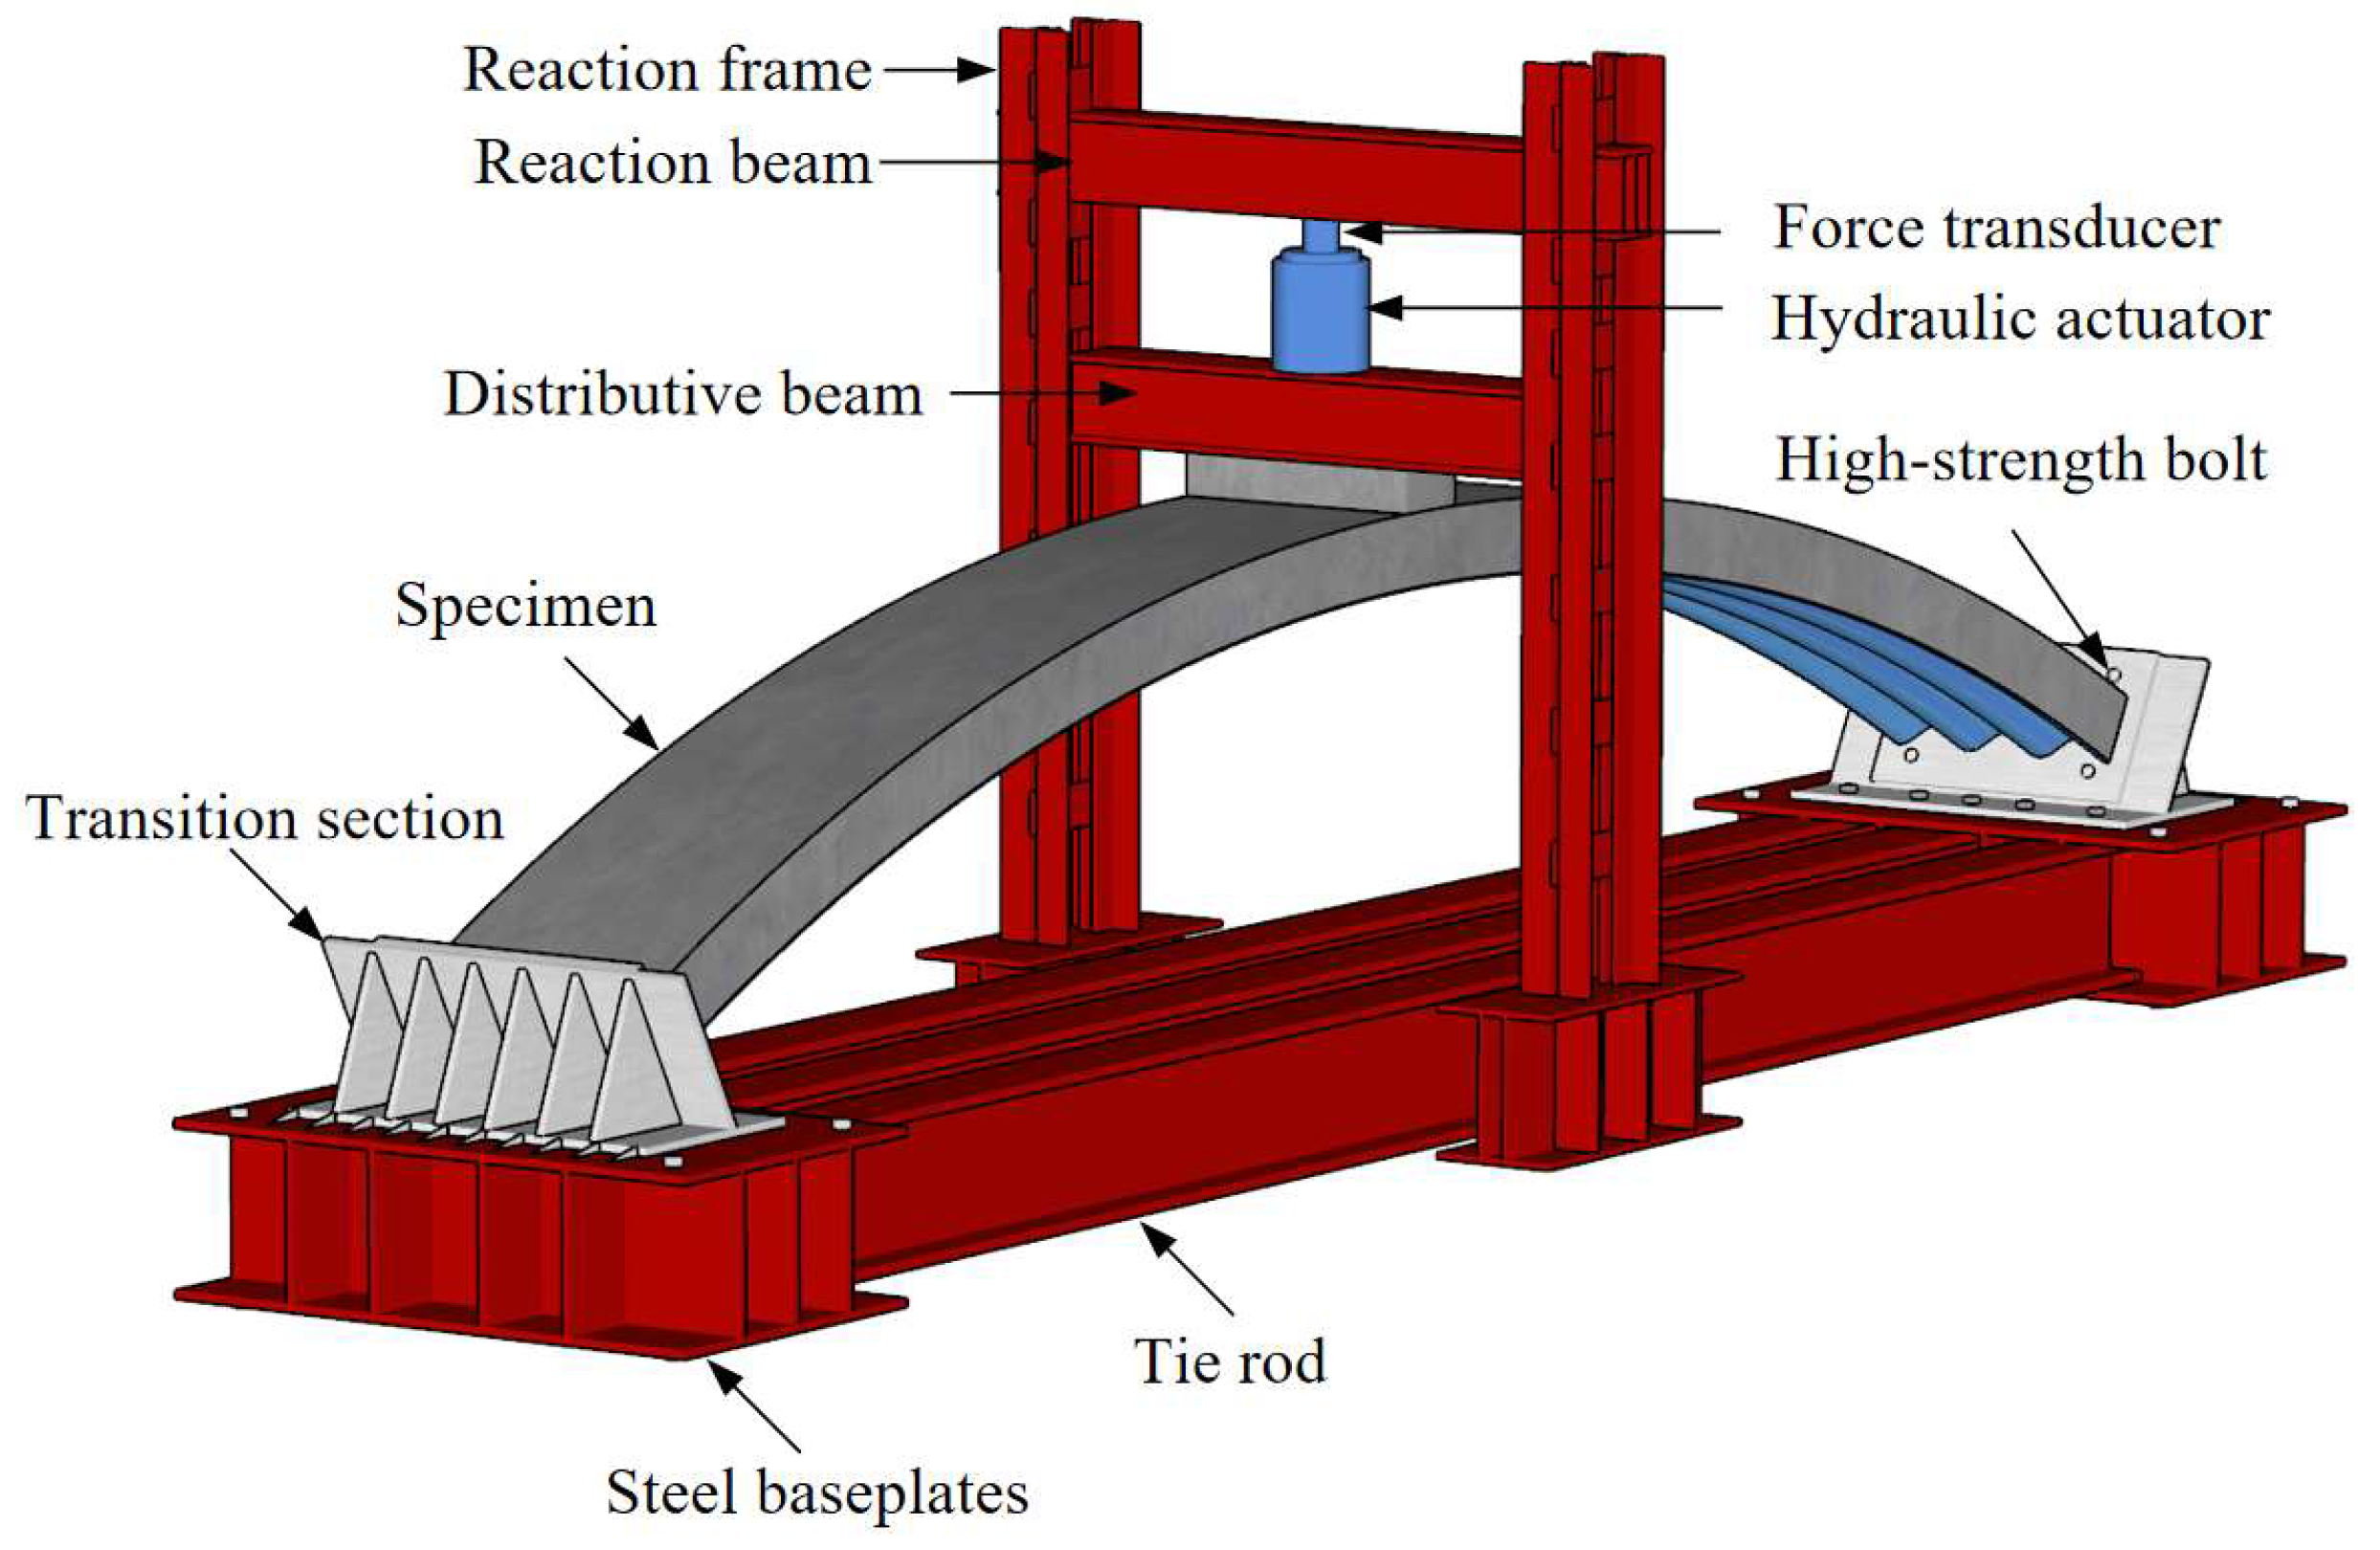
As illustrated in Figure 3, the loading system was categorized into three subsystems: foundation assembly (two steel baseplates, two transition sections, six tie rods), reaction frame system (one reaction frame, one reaction beam), and loading system (one hydraulic actuator with a maximum capacity of 300 tons, one force transducer, one distributive beam). Single-point loading was employed to investigate the shear performance of CSC arches. Rigid plates were installed at both specimen ends and secured to transition sections via high-strength bolts to preclude premature concrete crushing. To approximate fixed boundary conditions, transition sections were connected to steel baseplates mechanically anchored to ground embedments. Additionally, six H-shaped steel tie rods connected the baseplates to limit relative displacement in the span direction.
The hydraulic actuator applied loads through a distribution beam. This process converted concentrated forces into a linear load distribution. To eliminate any gaps, the preloading level was set to 30% of the estimated ultimate load (Pu). This preload was maintained for 5 min to ensure full contact and stress stabilization. The formal loading process adopted a graded loading protocol, which was divided into three phases with distinct load increment sizes and stabilization periods as follows: (1) Below 0.3 Pu: Loads were applied in increments of 50 kN, and a 30 s stabilization period was maintained in each increment. (2) Between 0.3 Pu and 0.7 Pu: The load increment was reduced to 30 kN. Each increment was followed by a 90 s stabilization period. (3) Beyond 0.7 Pu: Given the increasing risk of structural damage in the high-load stage, continuous loading was adopted instead of stepwise increments until specimen failure. The following two scenarios are considered structural failure: Displacement continues to increase rapidly while the load remains unchanged or decreases; The load drops to 70% of the peak load.

2.4. Measurement Arrangement

Figure 4 details the displacement and strain instrumentation layout. As illustrated in Figure 4a, deformation of specimens was monitored using linear variable differential transformers positioned at one-eighth span points (two of each location, a total of 14 LVDTs with the least count of 0.1 mm). To verify whether the fixed support boundary condition was satisfied at the specimen ends, horizontal LVDTs at arch ends were adopted to monitor displacements of steel baseplates. Strain measurement configurations as illustrated in Figure 4b: To capture strain distributions across corrugated steel profiles (crest, middle, trough) at all one-eighth span locations, six strain gauges were instrumented. To investigate the variation in concrete deformation at different locations of the specimen, three vertical strain gauges were spaced at 50 mm intervals to measure concrete sectional strains on side surfaces at each quarter-point.

3. Experimental Results and Discussion

3.1. Failure Modes

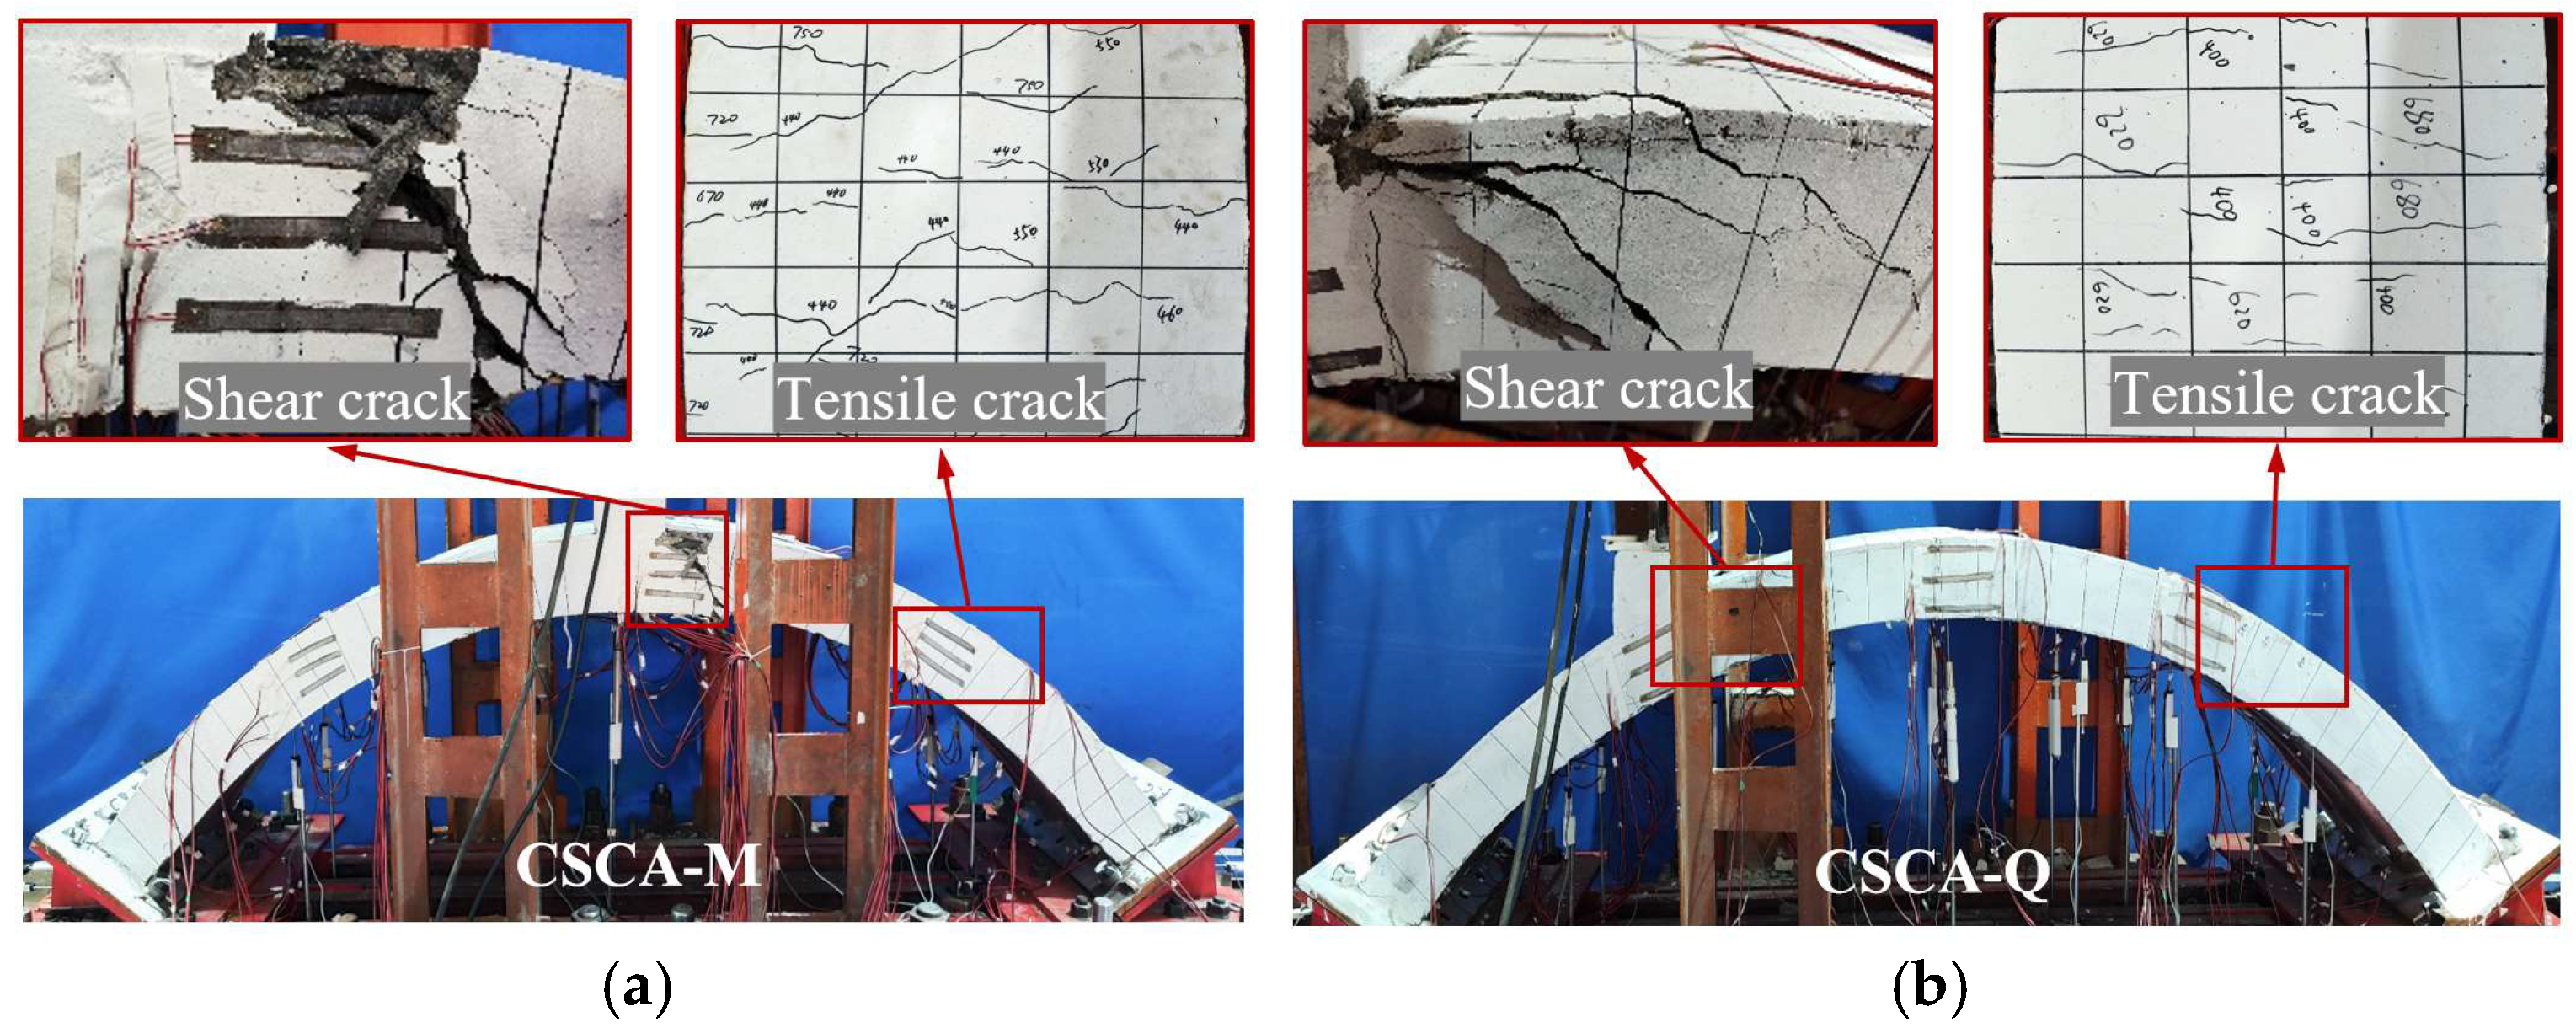
As illustrated in Figure 5, both CSCA-M (subjected to midspan concentrated loading) and CSCA-Q (under quarter-point loading) exhibited a consistent overall failure process, with both experiencing loss of load-bearing capacity due to the penetration of shear diagonal cracks through the section. However, notable differences were observed in their crack development characteristics. For specimen CSCA-M, during the elastoplastic stage, initial tensile cracks first appeared on the top surface of the concrete within the negative moment region at the crown (corresponding to the quarter points of the specimen). Near the peak load, a single shear diagonal crack formed directly in the midspan region and rapidly propagated through the section. In contrast, for specimen CSCA-Q, as the load increased, multiple diagonal cracks initially emerged near the loading points; with further load increase, one of these cracks gradually developed into a dominant diagonal crack, whose width increased significantly and eventually penetrated through the section, resulting in the loss of load-bearing capacity. The significant differences in failure modes stem from the restructuring effect of loading location on the internal force distribution in CSC arches. As systematically demonstrated by existing research and in Section 5.1 of this paper, the axial force in the arch sections under mid-span loading is significantly higher than that under quarter-point loading. This difference in axial force directly leads to a differentiation in the crack development mechanisms of the concrete: The high axial force state in the mid-span loading specimen effectively suppresses the initiation and propagation of diagonal shear cracks, resulting in the formation of only a single dominant through-thickness shear crack at failure (whose width is significantly larger than that in the multi-crack pattern). Conversely, the low axial force level in the quarter-point loading specimen weakens the confinement effect on crack development, leading to the continuous generation of multiple diagonal shear cracks throughout the loading process, and ultimately exhibiting a distributed crack pattern at failure.

3.2. Load–Displacement Curves

As shown in Figure 6, the ultimate resistance of the specimen gradually decreases when the location point is from L/2 to L/4. The ultimate resistance of CSCA-M and CSCA-Q are 1221.72 kN and 1102.52 kN, respectively, with the ultimate resistance of CSCA-M being 10.8% higher than that of CSCA-Q. Although the difference in peak loads between the two specimens is relatively small, the shear forces at the failure sections when reaching the peak load vary significantly. Specifically, the shear bearing capacity of specimen CSCA-M is 615.86 kN, while that of specimen CSCA-Q is 413.45 kN, meaning the sectional shear bearing capacity of CSCA-M is 48.4% higher than that of CSCA-Q. The primary reason for this phenomenon is that different loading locations significantly alter the shear–compression ratio of the failure section. For the mid-span loaded specimen CSCA-M, where sectional internal forces are dominated by axial force, the shear–compression ratio of the failure section reaches 0.54; in contrast, the shear–compression ratio of the failure section for CSCA-Q is 0.84. A smaller sectional shear–compression ratio indicates a larger axial force in the section under the same shear force condition. This axial force can effectively inhibit the development of shear cracks, thereby significantly enhancing the structural shear bearing capacity.
The two specimens exhibited comparable initial stiffness. However, as the load increased, the rate of increase in vertical displacement to load for the quarter-point loaded specimen CSCA-Q became significantly higher than that for the midspan-loaded specimen CSCA-M. This discrepancy is induced by the differences in the bending moment distribution of CSCA under two loading locations. Compared to midspan loading, quarter-point loading generates negative bending moments of larger magnitude and wider distribution. Consequently, this promoted more extensive concrete cracking in CSCA-Q, leading to a more significant degradation of the overall structural stiffness during the elastoplastic stage compared to CSCA-M. Ultimately, the specimen CSCA-Q produced a larger increment in vertical displacement under identical load increments.
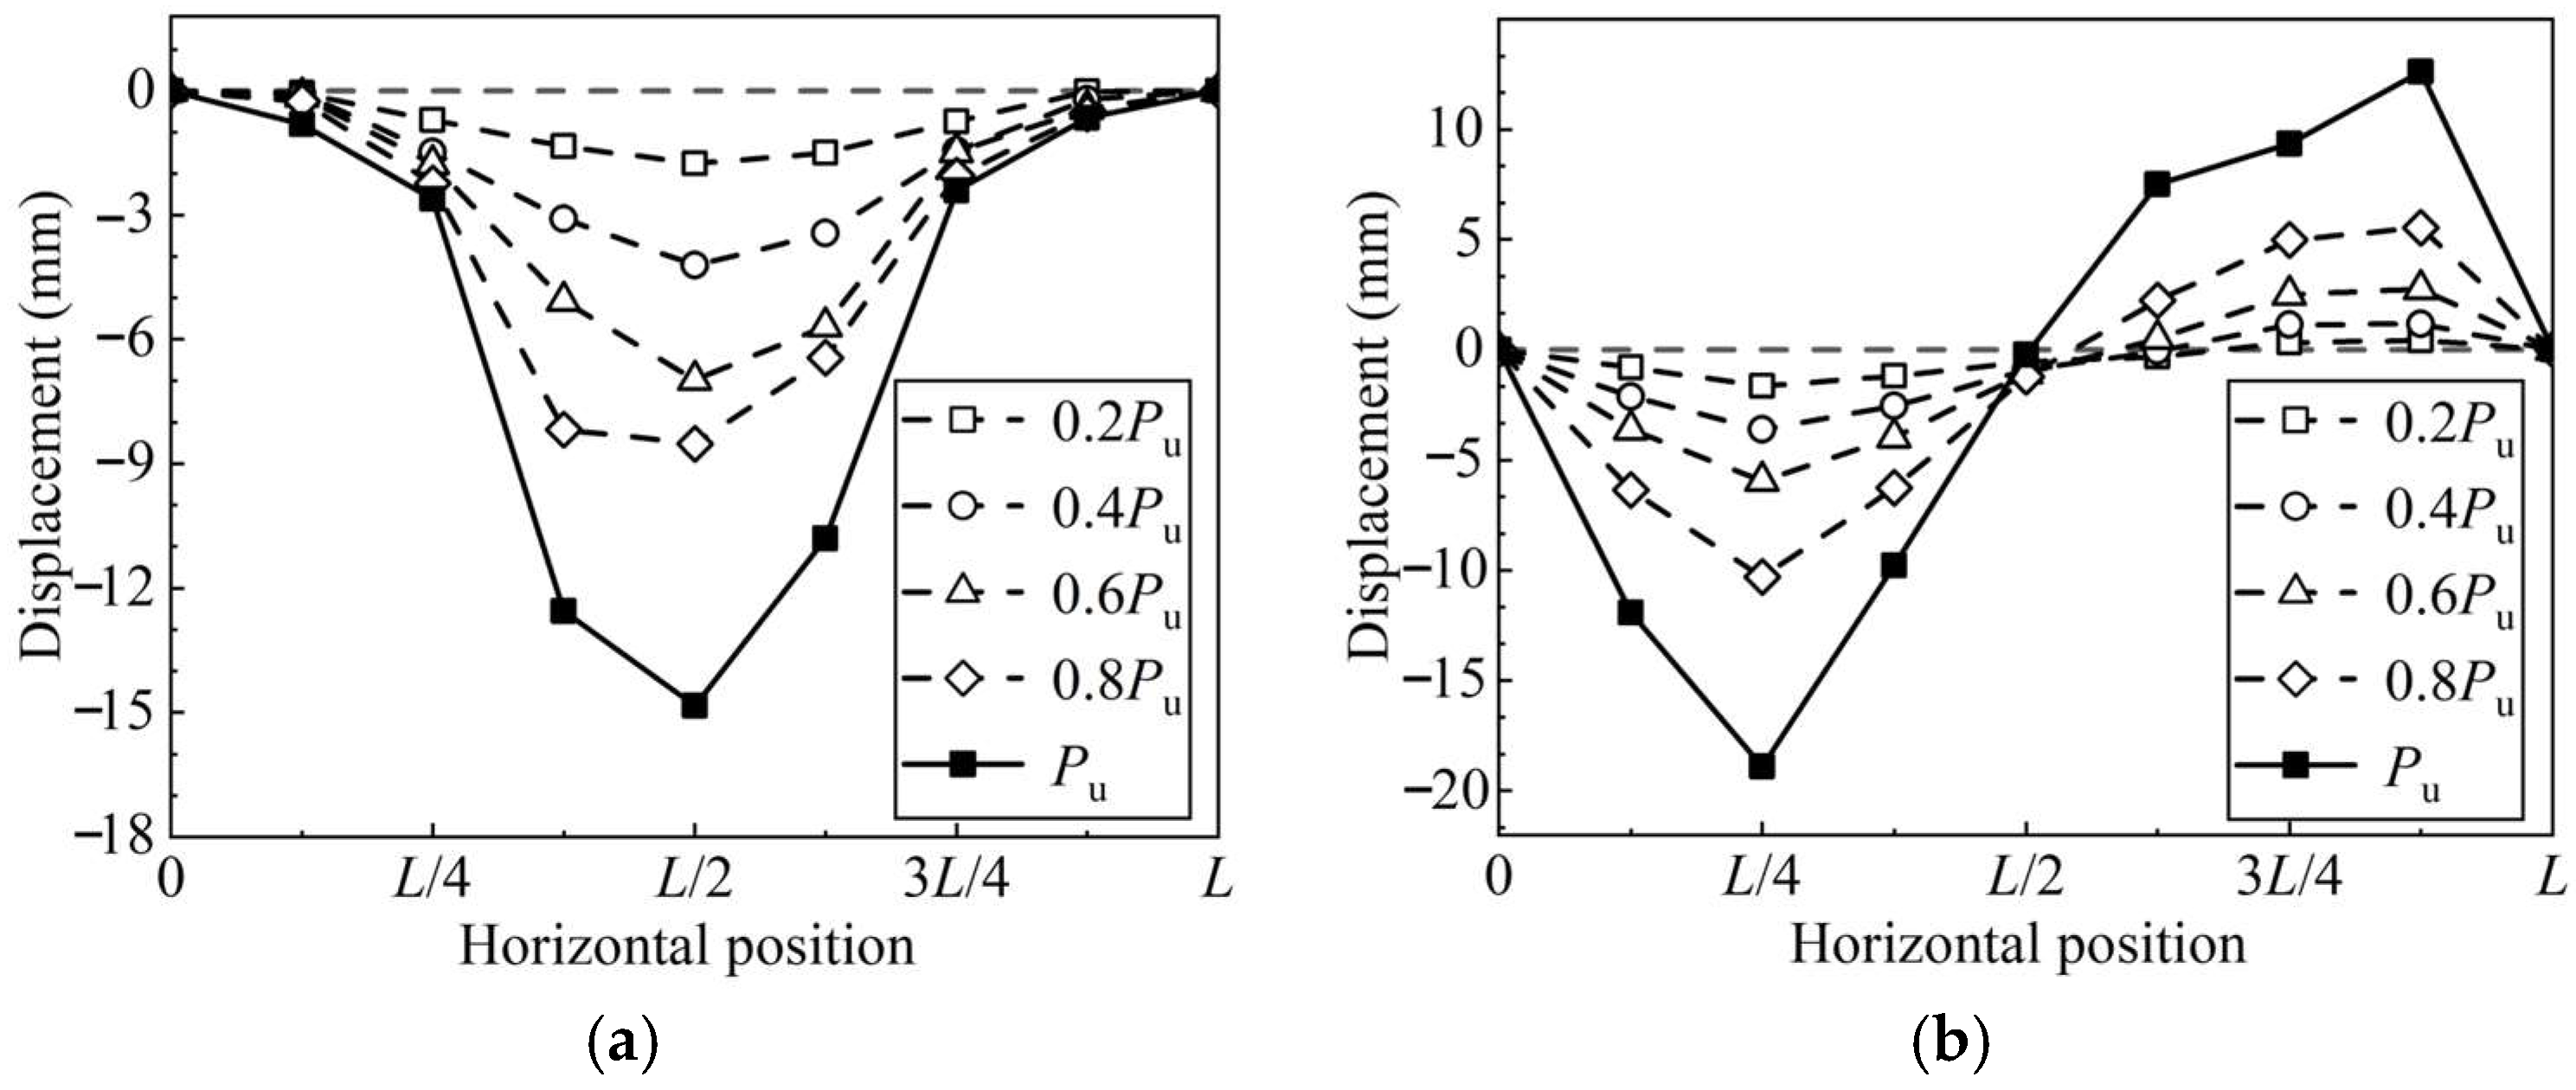
The load-vertical displacement curves for each specimen are presented in Figure 7. As illustrated, for the midspan-loaded specimen CSCA-M, the vertical displacement distribution was symmetric about the midspan section throughout the loading process, with the maximum vertical displacement consistently occurring beneath the loading point. During the elastic stage, the maximum deflection at midspan was approximately twice that at its quarter points. Upon the elastoplastic stage, the deflection growth at the quarter points was relatively gradual, whereas the deflection at midspan increased rapidly. In contrast, the load-vertical displacement curve for the quarter-point loaded specimen CSCA-Q exhibited distinctly antisymmetric characteristics about the midspan section. Moreover, the vertical displacement at the midspan location remained close to zero throughout the entire loading process. These deformation characteristics, which are closely related to the loading configuration (i.e., symmetric/antisymmetric distribution, location of maximum deflection, and its evolution pattern), are consistent with findings in existing research on corrugated steel–concrete composite arches.

3.3. Strain Analysis of Corrugated Steel Troughs

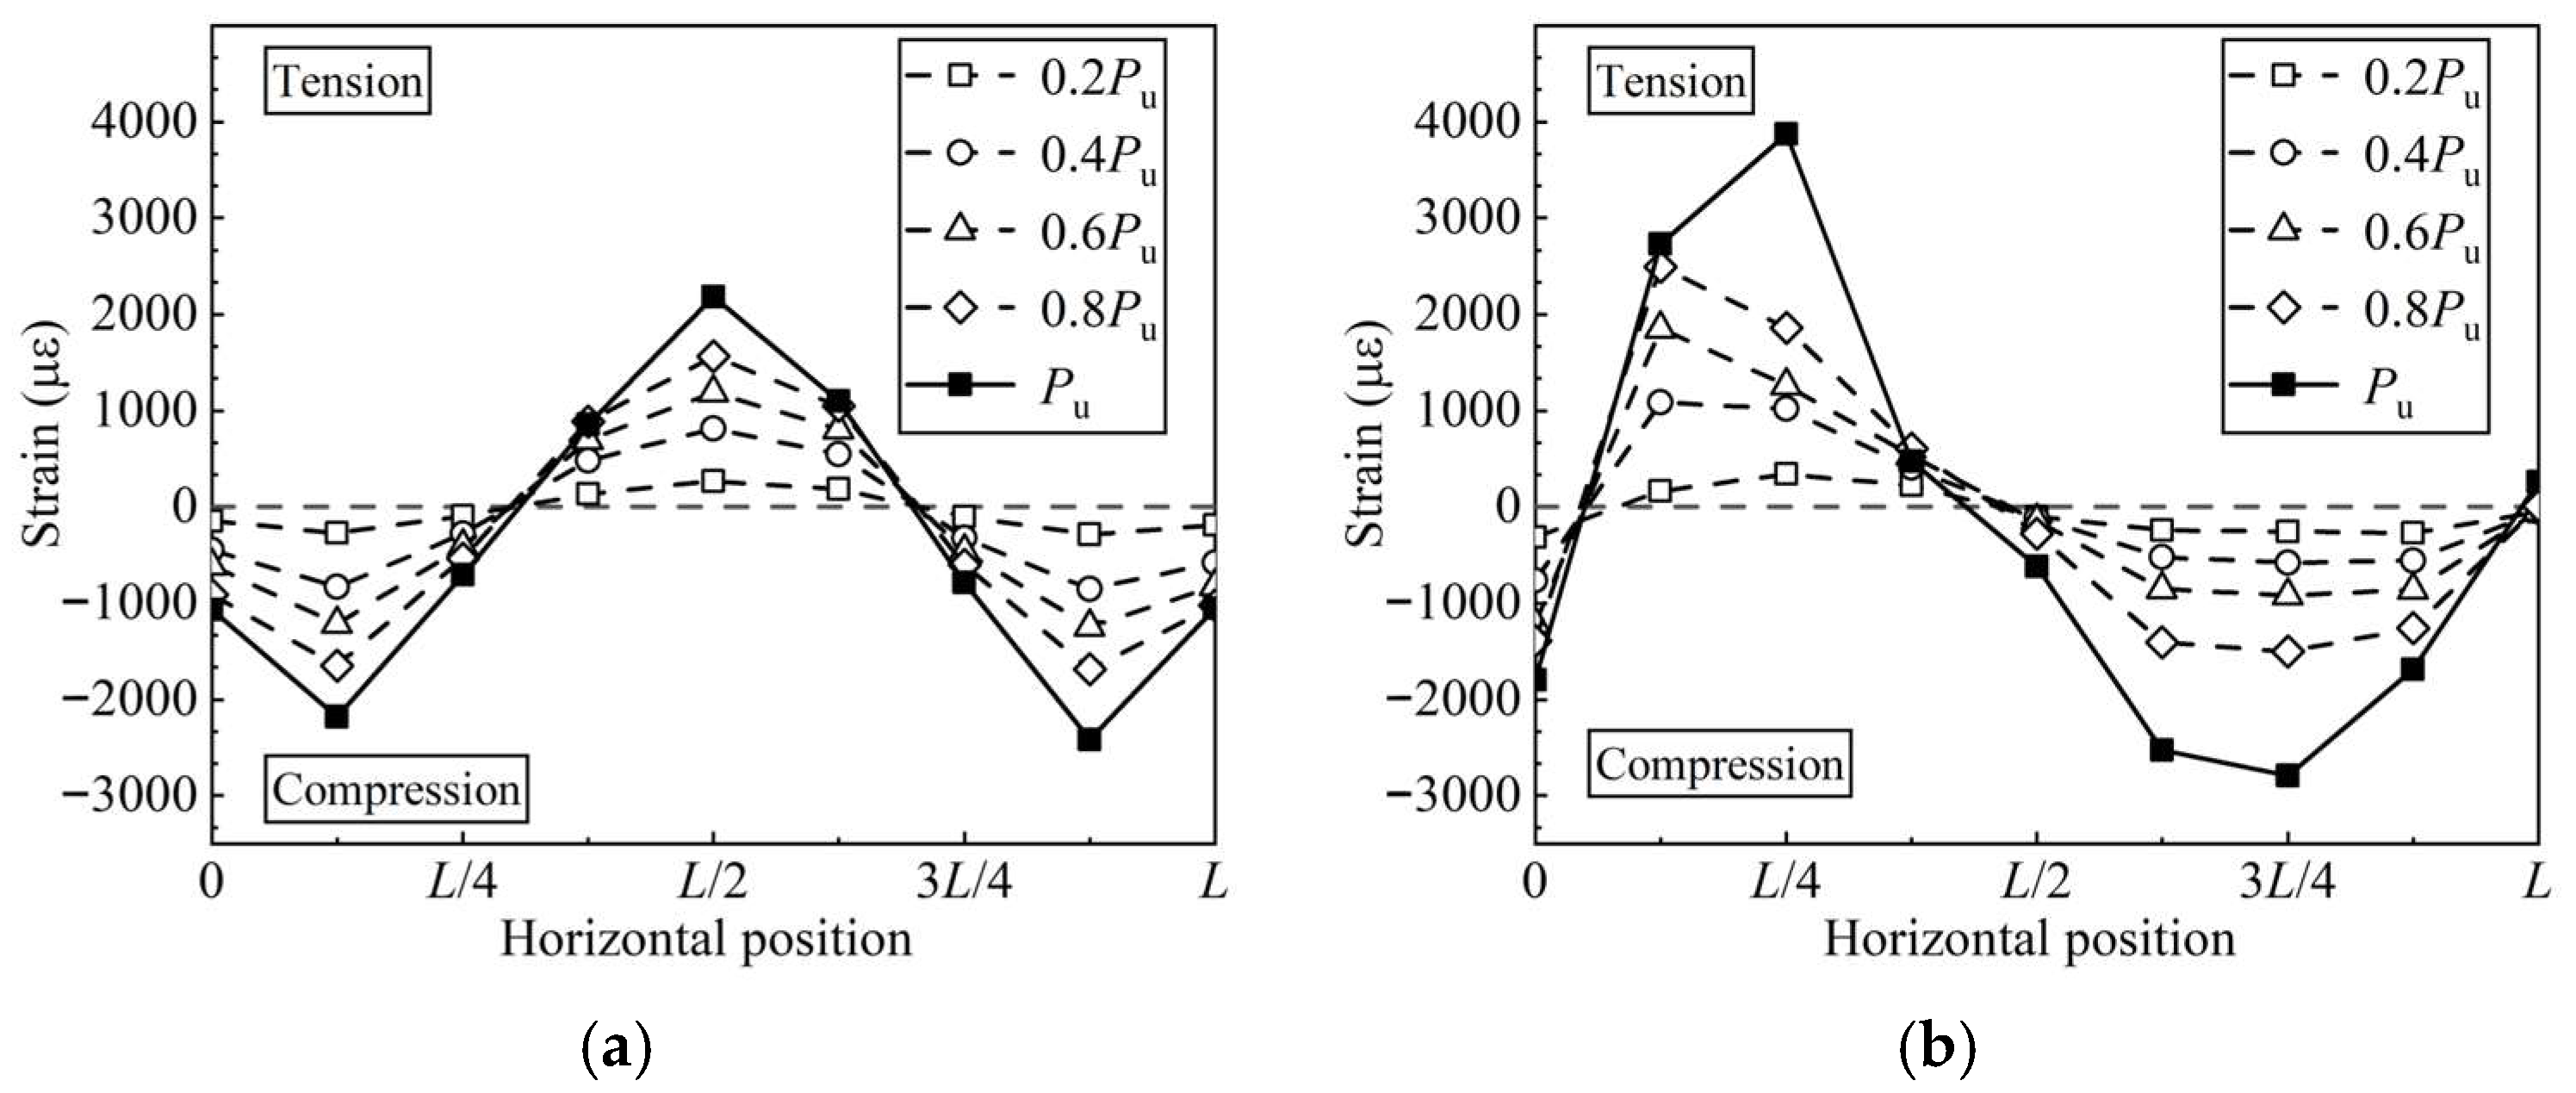
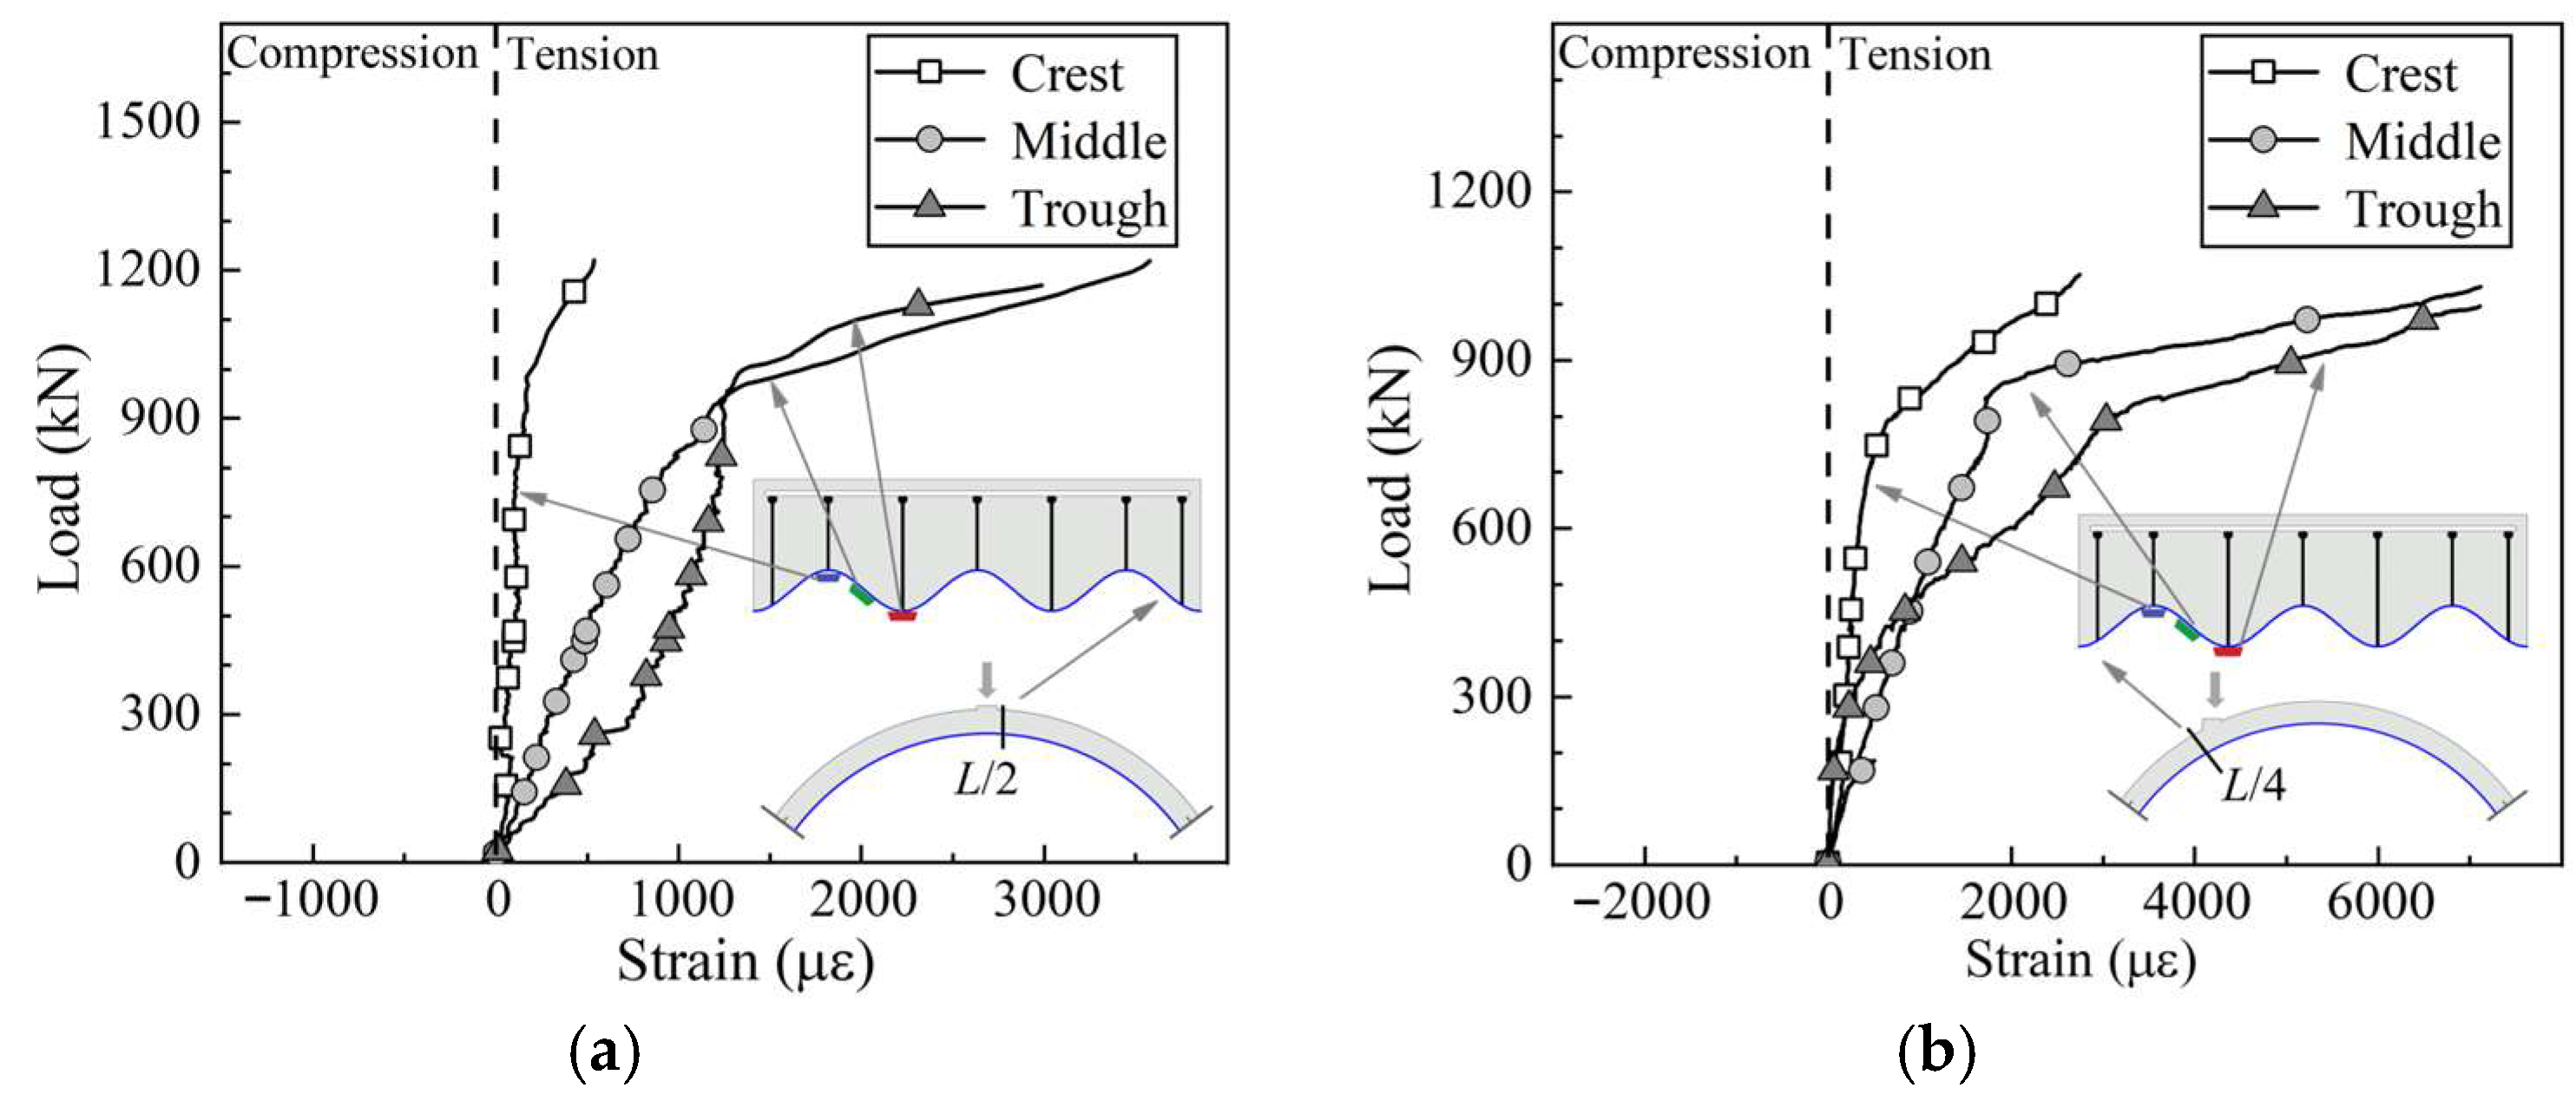
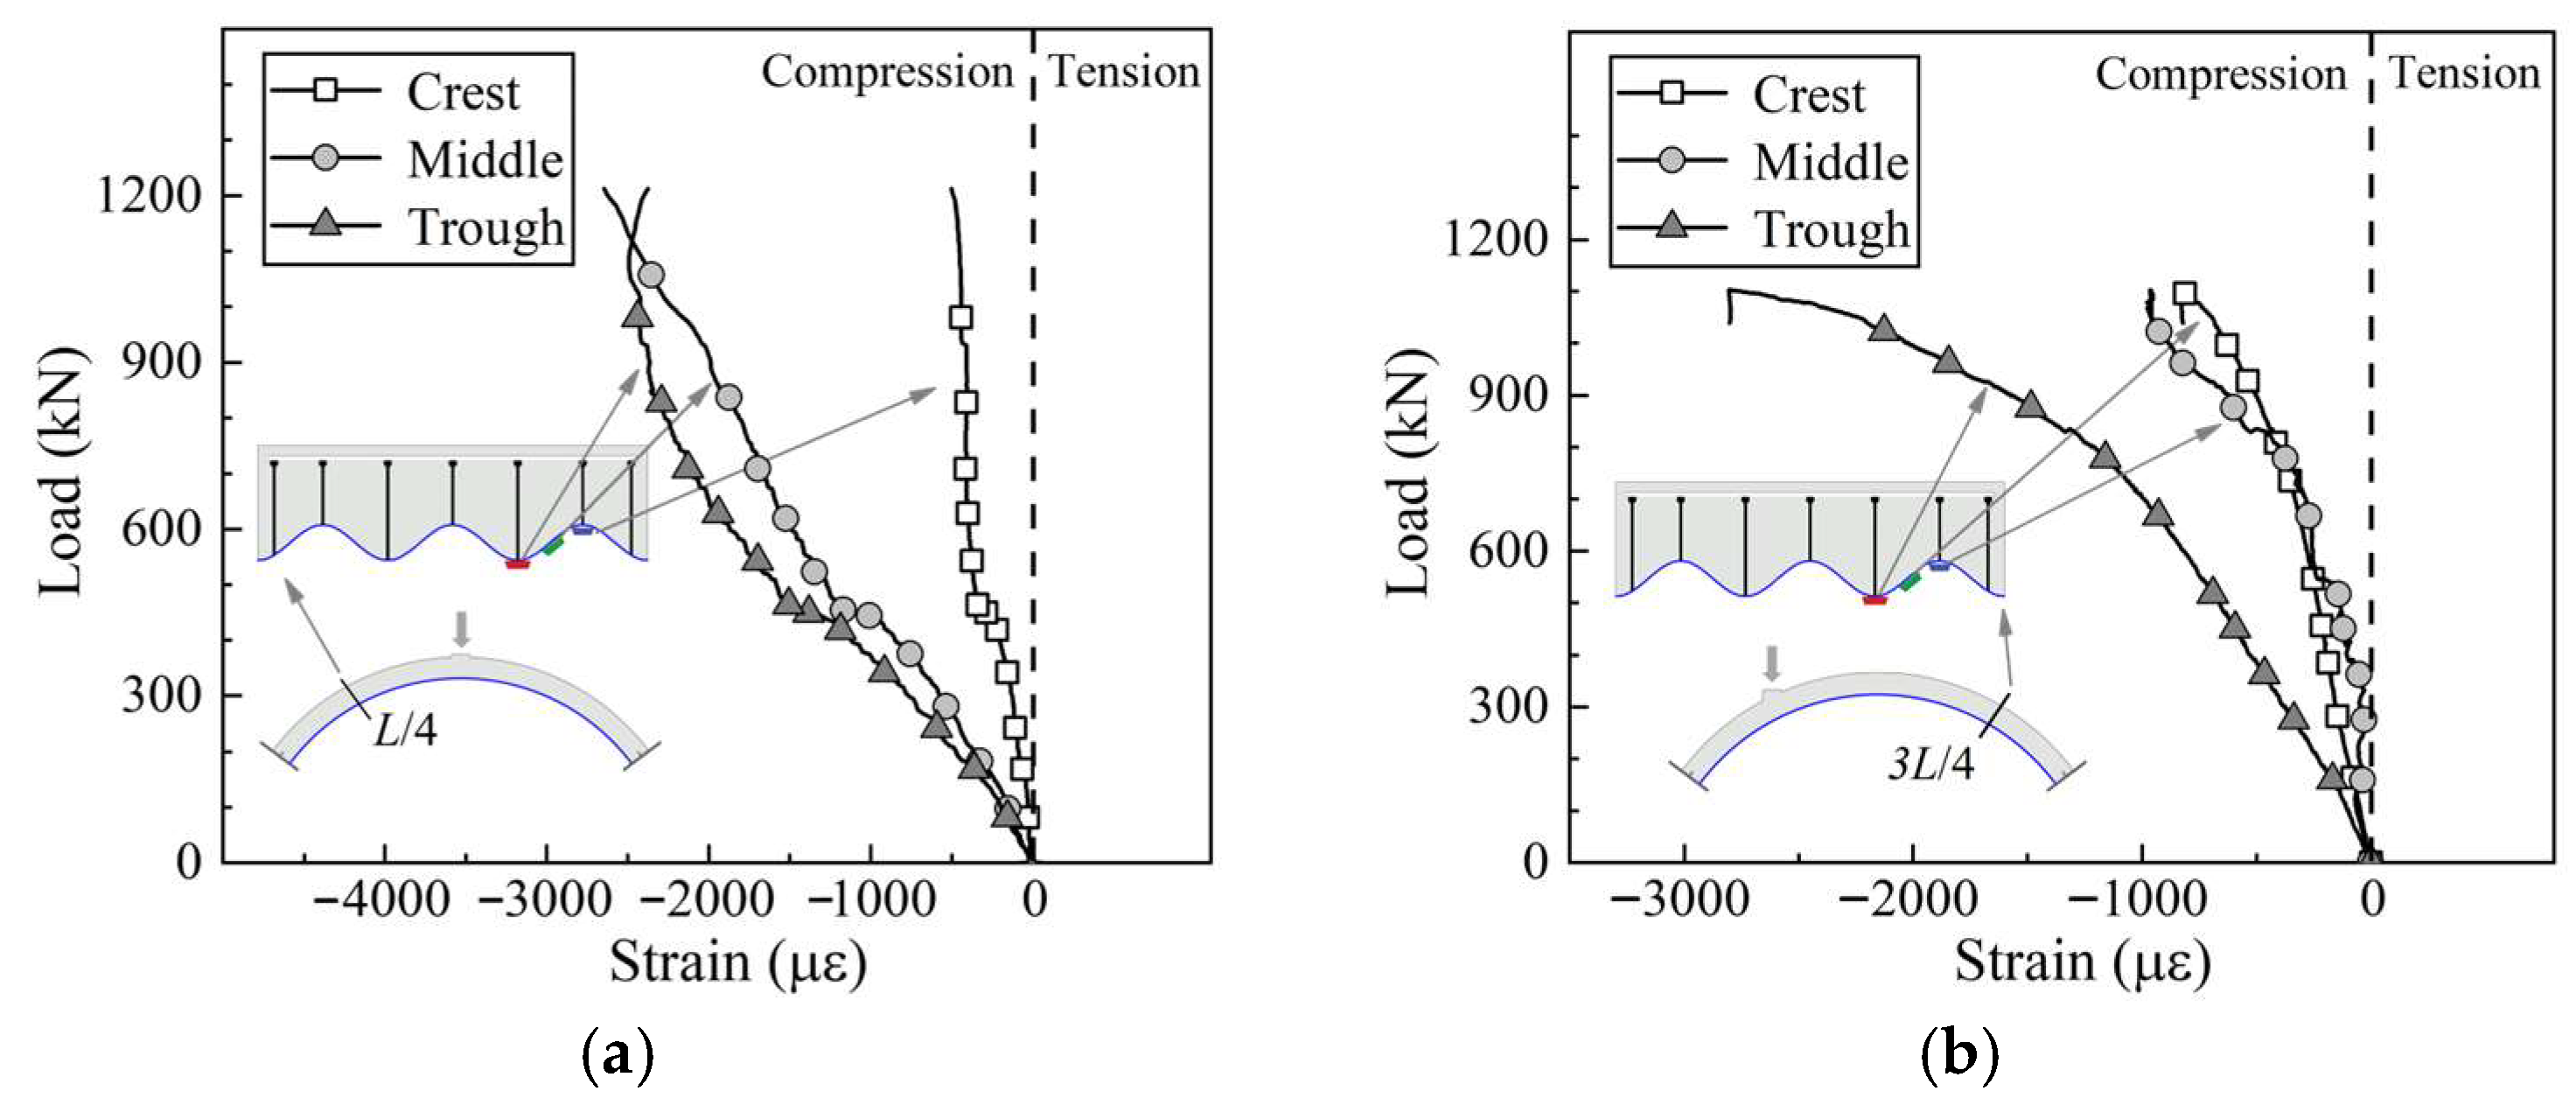
Figure 8 depicts the strain distribution at the corrugated steel (CS) troughs during the loading process. For the CSCA-M specimen (Figure 8a), the strain distribution in the CS troughs exhibited symmetry about the midspan section along the span direction. The mid-span region lies within the positive bending moment zone, where the CS troughs are subjected to tensile forces, and the magnitude of tensile strain increases with the applied load. Throughout the entire loading process, the CS within the negative moment regions of the specimen, located symmetrically at the L/8 and 7L/8 cross-sections, remained in compression. On the contrary, for the CSCA-Q specimen (Figure 8b), the strain distribution displayed antisymmetry about the midspan section along the span direction. The loading point lies within the region of positive bending moment, resulting in significant tensile strains in the corresponding CS troughs. At the cross-section of 3L/4, the CS troughs are under compression.

3.4. Composite Action Analysis

The sectional composite action of CSC arches significantly influences their shear failure modes. Thus, an evaluation of the composite action in the specimens is necessary. In this study, strain distributions in the CS were analyzed to evaluate composite action within the arches. Effective composite behavior is evidenced by a neutral axis positioned above the CS, inducing uniformly tensile or compressive strains across the entire CS cross-section. Conversely, deficient composite action manifests through an independent neutral axis within the CS itself, generating opposing strain directions between crests and troughs [35].
Figure 9 presents strain distributions across the CS in the positive bending moment regions of CSCA-M and CSCA-Q specimens. The data presented in the figure are the average values derived from strain gauge readings collected from symmetric positions on the cross-section (Figure 4). Both configurations exhibit consistent strain development: tensile strains occurred as soon as loading began and increased with applied load throughout the CS cross-section. This uniform tensile response confirms effective composite action in the positive moment region, as trough-to-crest strain in the same direction prevents independent neutral axis formation within the CS profile.
Figure 10 illustrates strain distributions in CS cross-sections under negative bending moments for both CSCA-M and CSCA-Q specimens. Consistent compressive strains develop across the CS from initial loading, progressively intensifying with applied load magnitude. This uniform compressive response confirms effective composite action between concrete and CS in negative moment regions, as the absence of strain reversal indicates no independent neutral axis formation within the CS profile. Collectively, these results demonstrate that 100 mm × 100 mm shear connector spacing ensures good composite action throughout the CSCA system.

4. FE Analysis

4.1. Establishment of the FE Model Based on ABAQUS

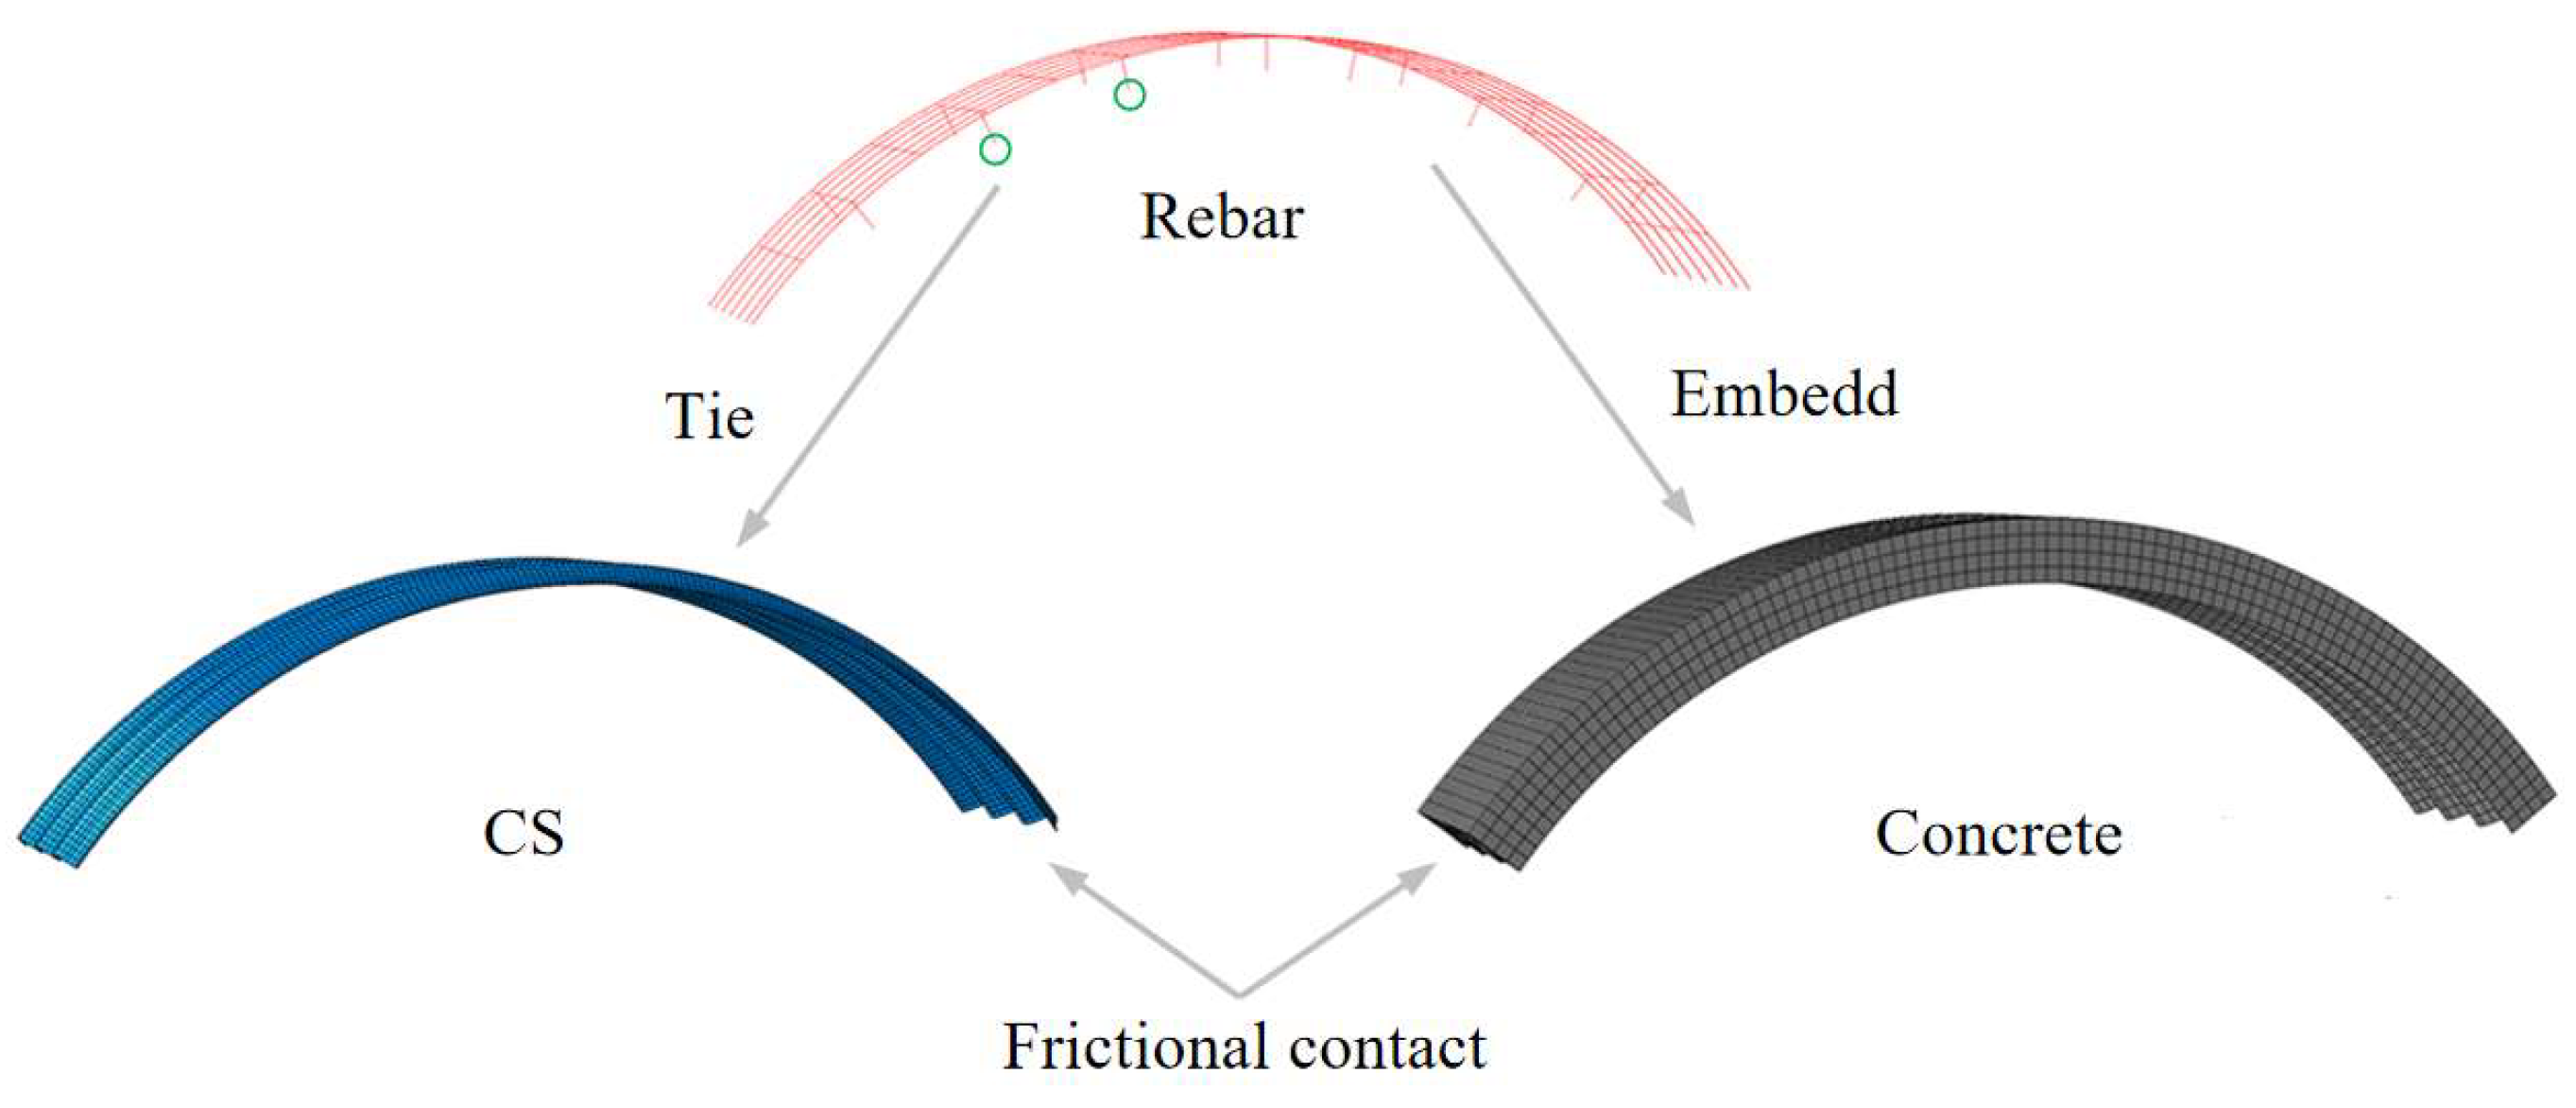
Following recommendations from the existing research [17,18,19,20,25,43,44,45], a finite element model (Figure 11) based on ABAQUS was developed to investigate the shear bearing capacity of CSC arches, which employs “S4R” shell elements for corrugated steel, “C3D8R” hexahedral elements for concrete, and “B31” beam elements for rebar webs. Based on current research, “surface-to-surface” contact is adopted to simulate corrugated steel–concrete interaction, in which “hard” normal behavior and “penalty” friction (μ = 0.2) in the tangential direction were used. “Tie” constraints are used to simulate welding between steel and rebar. Experimental boundary conditions were replicated by coupling specimen ends to reference points, constraining all degrees of freedom except horizontal translation while implementing horizontal springs with test-calibrated stiffness at reference points. Initial geometric imperfections of S/1000 (where S denotes arch arc length) were incorporated. Mesh sensitivity studies were executed, determining optimal element sizes of hc/8 for concrete and hc/15 for corrugated steel, balancing computational accuracy with efficiency.
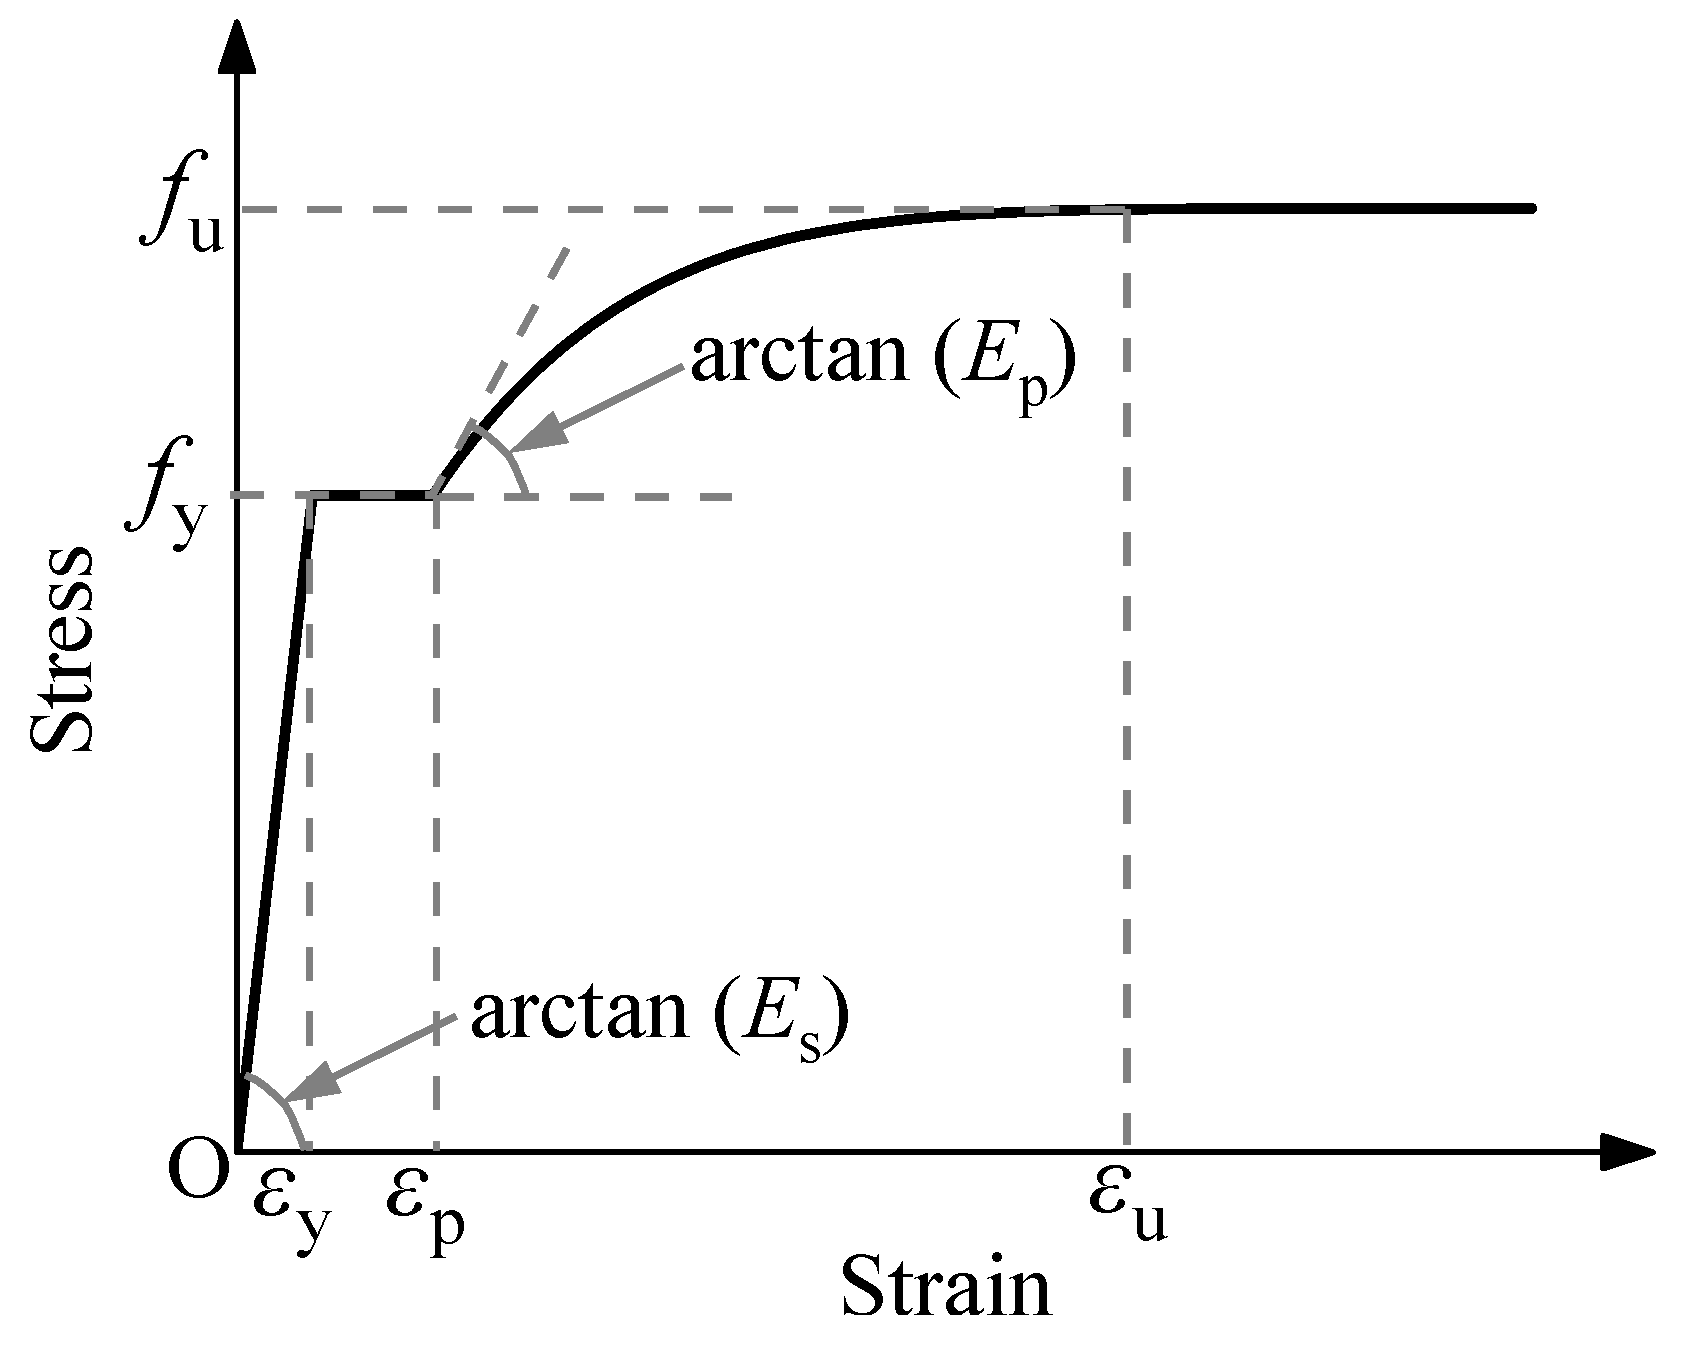
The constitutive model considering strain hardening was adopted for the steel (Figure 12). The stress–strain relations as shown in Equations (1) and (2), where Es is the elastic modulus of steel; fy and fu are the yield strength and ultimate strength of the steel, respectively; εy is the strain corresponding to yield strength; εp and εu represent the maximum strain at the yield plateau and the strain corresponding to the ultimate strength, respectively; p is the hardening index; Ep indicates the elastic modulus in the plastic stage, Ep = 0.02Es.
σ = E s ε f y f u ( f u f y ) ( ε u ε ε u ε p ) p f u 0 ε < ε y ε y ε < ε p ε p ε < ε u ε u ε
p = E p ( ε u ε p f u f y )
Conversely, the concrete was modeled using the plain concrete constitutive relationship specified in GB 50010-2010 [30]. To enhance model fidelity, tensile and compressive damage factors were incorporated to predict localized concrete damage patterns, serving as critical validation metrics for numerical reliability. The stress–strain relationship for concrete under compression is shown in Equations (3)–(7):
σ = ( 1 d c ) E c ε
d c = 1 ρ c n n 1 + x n 1 ρ c α c ( x 1 ) 2 + 2 ( x 1 ) ( x > 1 )
ρ c = f c , r E c ε c , r
n = E c ε c , r E c ε c , r f c , r
x = ε ε c , r
The stress–strain relationship for concrete under tension is shown in Equations (8)–(11):
σ = ( 1 d t ) E c ε
d t = 1 ρ t 1.2 0.2 x 5 1 ρ t α t ( x 1 ) 1.7 + x ( x 1 ) ( x > 1 )
x = ε ε t , r
ρ t = f t , r E c ε t , r
where dc and dt denote the damage evolution parameters of concrete under uniaxial compression and tension, respectively; Ec represents the concrete elastic modulus; fc,r, and ft,r are the uniaxial compressive and tensile strengths of concrete, respectively; εc,r, and εt,r represent the corresponding peak strains in compression and tension, respectively.

4.2. Validation of the FE Model

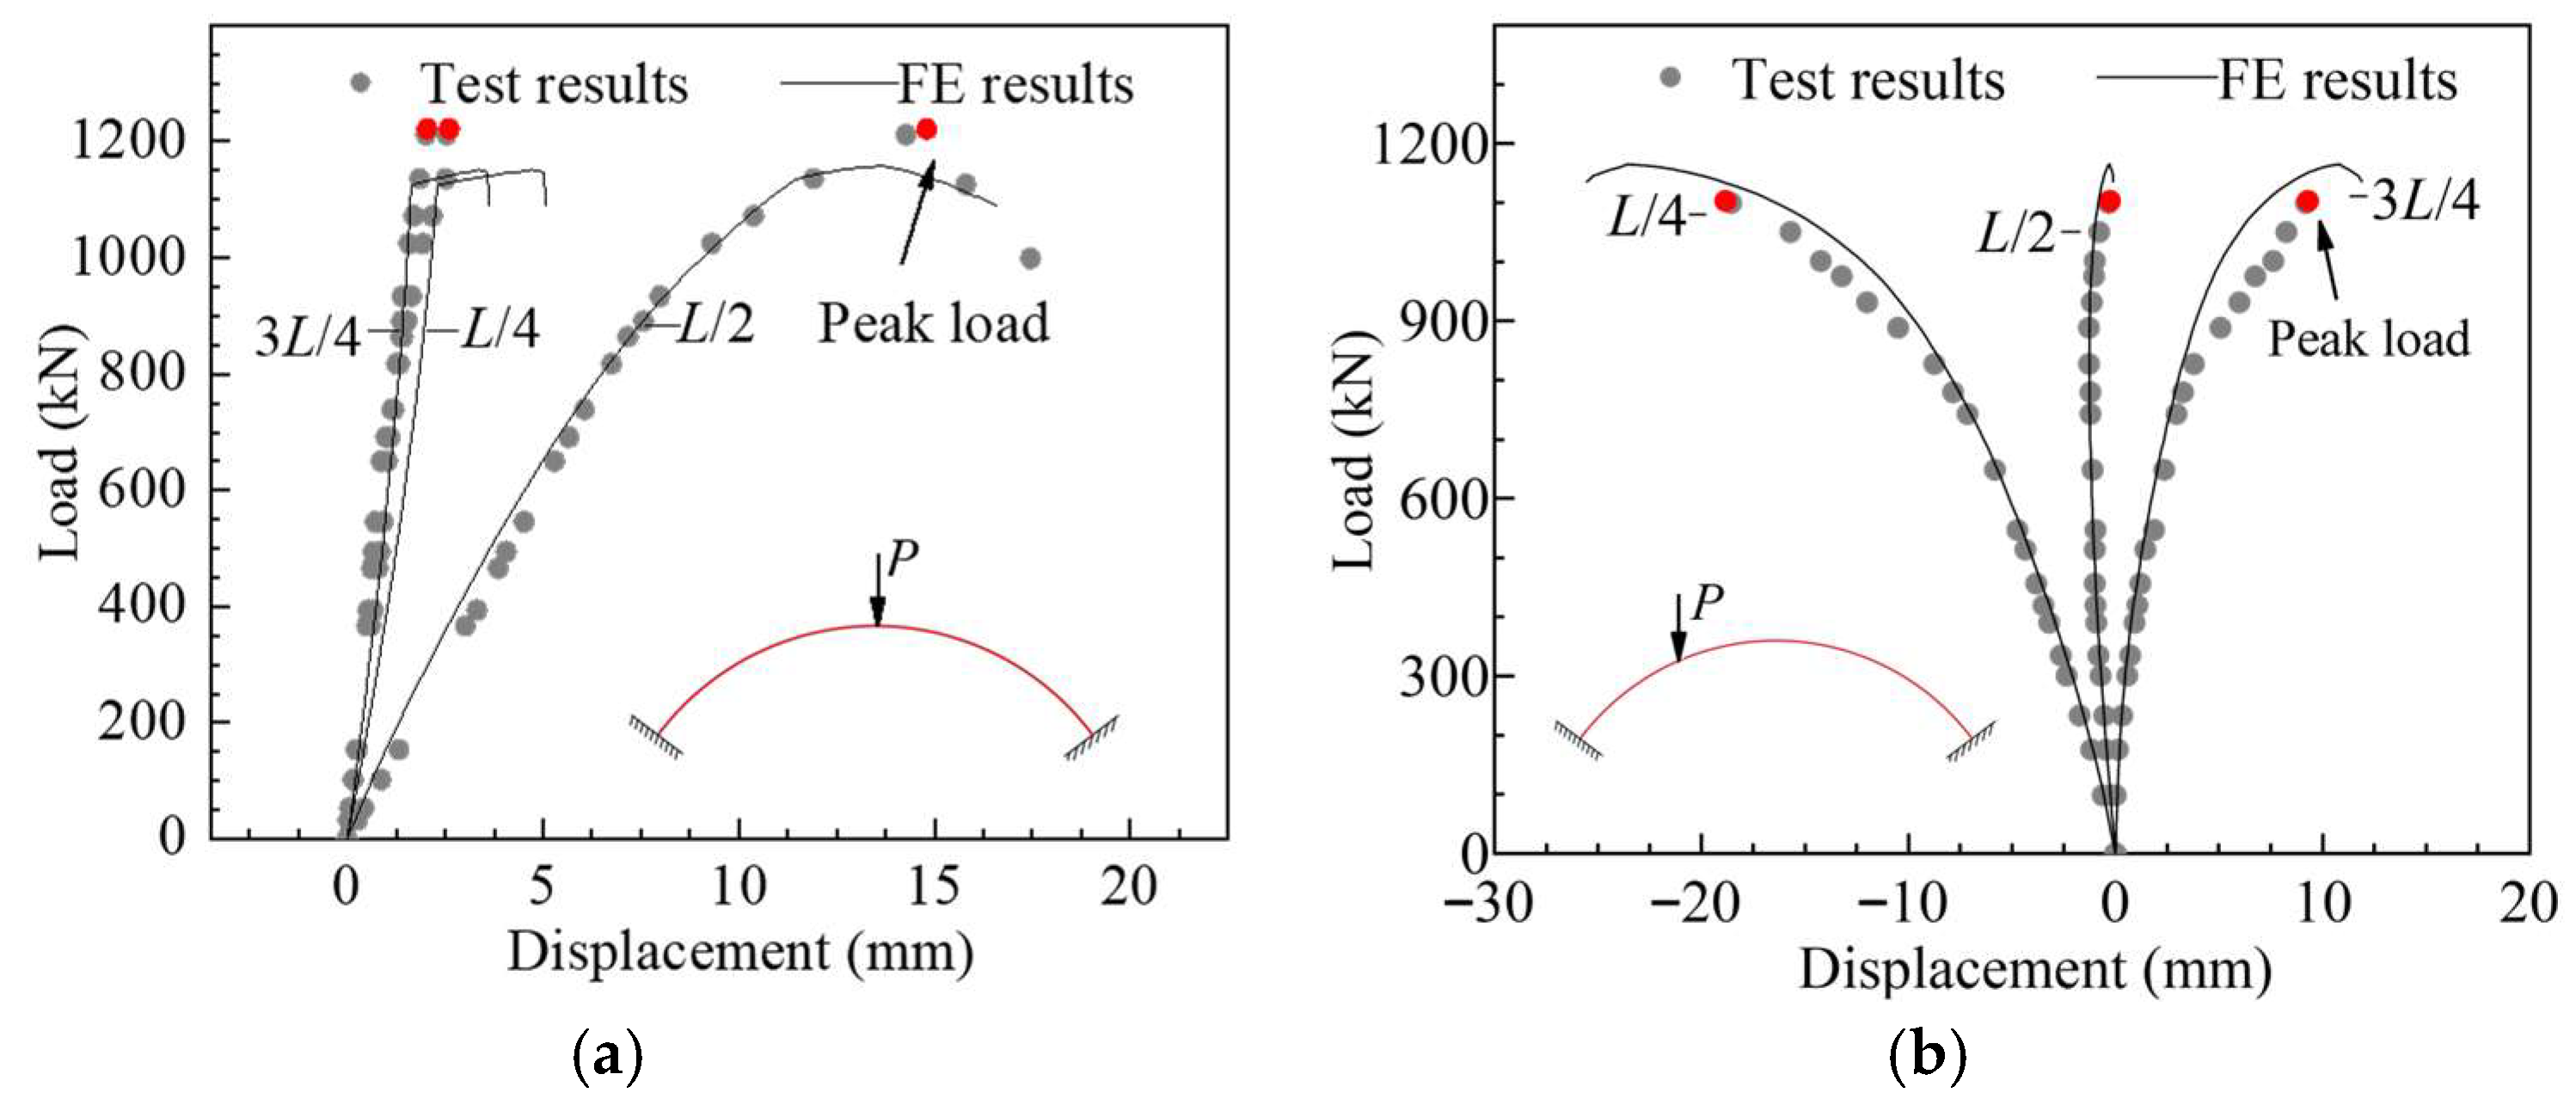
Figure 13 demonstrates the load–displacement curves, confirming the model’s accuracy in simulating composite arch behavior. Ultimate shear bearing capacity predictions exhibited a maximum deviation of 8.6% from experimental values.
To further validate the reliability of the FE model, Figure 14 presents a comparative analysis of damage patterns between test results and numerical simulations in composite arches. The FE-predicted concrete damage distribution exhibits strong agreement with test results. Specifically, the tensile damage in the FE model concentrates on both sides of the loading points, corresponding to shear diagonal crack propagation observed during testing. These localized damage mechanisms provide conclusive evidence of the reliability of the FE model.

4.3. Parametric Analysis

The validated finite element (FE) model was utilized for parametric analysis to investigate the effects of geometric and material parameters on the shear bearing capacity of CSC arches. Firstly, an analysis of the influence of loading locations was conducted. Figure 15 presents the shear capacities of CSC arches under different loading locations and span-to-rise ratios, where the abscissa represents the distance from the loading location to the left support. As the loading location approaches the mid-span section, the shear bearing capacity of the CSC arch first increases significantly and then tends to stabilize. The primary reason for this phenomenon is that different loading locations significantly alter the internal force distribution pattern of the CSC arch. Specifically, as the loading location moves closer to the mid-span section, the axial force at the failure section of the CSC arch first increases and then stabilizes; the increase in sectional axial force can effectively enhance the shear bearing capacity of the structure.
Based on the results of the loading location analysis, this study selects typical loading locations (mid-span loading and quarter-span loading) as the subjects for parameter analysis. The load location of L/2 and L/4, represented as Load-ms and Load-qs, respectively. The remaining parameters were selected following GB/T 34567-2017 [50] to ensure practical relevance, with details provided in Table 2. The parametric analysis encompassed the following key parameters: shear connector spacing (s); rise-to-span ratios (f/L); shear connector diameters (ds); compressive strength (fck) of concrete and yield strength (fy) of corrugated steel (CS), thickness of concrete (hc) and (tcs) CS; corrugation profiles. Numerical simulations were conducted on 141 arch configurations, establishing a comprehensive database that not only clarifies the influence of different parameters but also provides critical validation data for developing a shear bearing capacity prediction model.

4.3.1. Influence of Concrete Strength and Thickness

Figure 16 analyzes the influence of concrete thickness (hc) and concrete compressive strength (fck) on the ultimate resistance (Pu) of the CSC arches under different loading locations. As revealed, Pu increases with both hc and fck, but the influence of hc is considerably more significant. Compared to the reference specimen with hc = 150 mm and fck = 30 MPa, increasing hc from 150 mm to 250 mm resulted in Pu increases of 52.4% and 63.7% under midspan loading (Load-ms) and quarter-point loading (Load-qs), respectively. Conversely, increasing fck from 30 MPa to 50 MPa led to significantly smaller Pu increases of 3.7% and 6.9% for the same loading cases. It can be observed that the shear bearing capacity of CSC arches under quarter-span loading is more significantly affected by variations in concrete strength and thickness. This phenomenon arises from the distinct internal force distribution patterns induced by different loading modes. Specifically, the sectional internal force of quarter-span loaded specimens is dominated by the bending moment. Since increasing concrete thickness and strength can effectively enhance the sectional moment of inertia and flexural stiffness, their impact on the ultimate resistance is more pronounced. Furthermore, under identical parameter conditions, the ultimate resistance of specimens subjected to quarter-span loading consistently exceeds that of specimens under mid-span loading. This is because the sectional internal force in mid-span loaded specimens is dominated by axial force, which is roughly 50% higher than in quarter-span loaded specimens. As a result, under the same parameters, the ultimate load for mid-span loaded specimens is lower than for those loaded at quarter-span.

4.3.2. Influence of Corrugated Steel Strength and Thickness

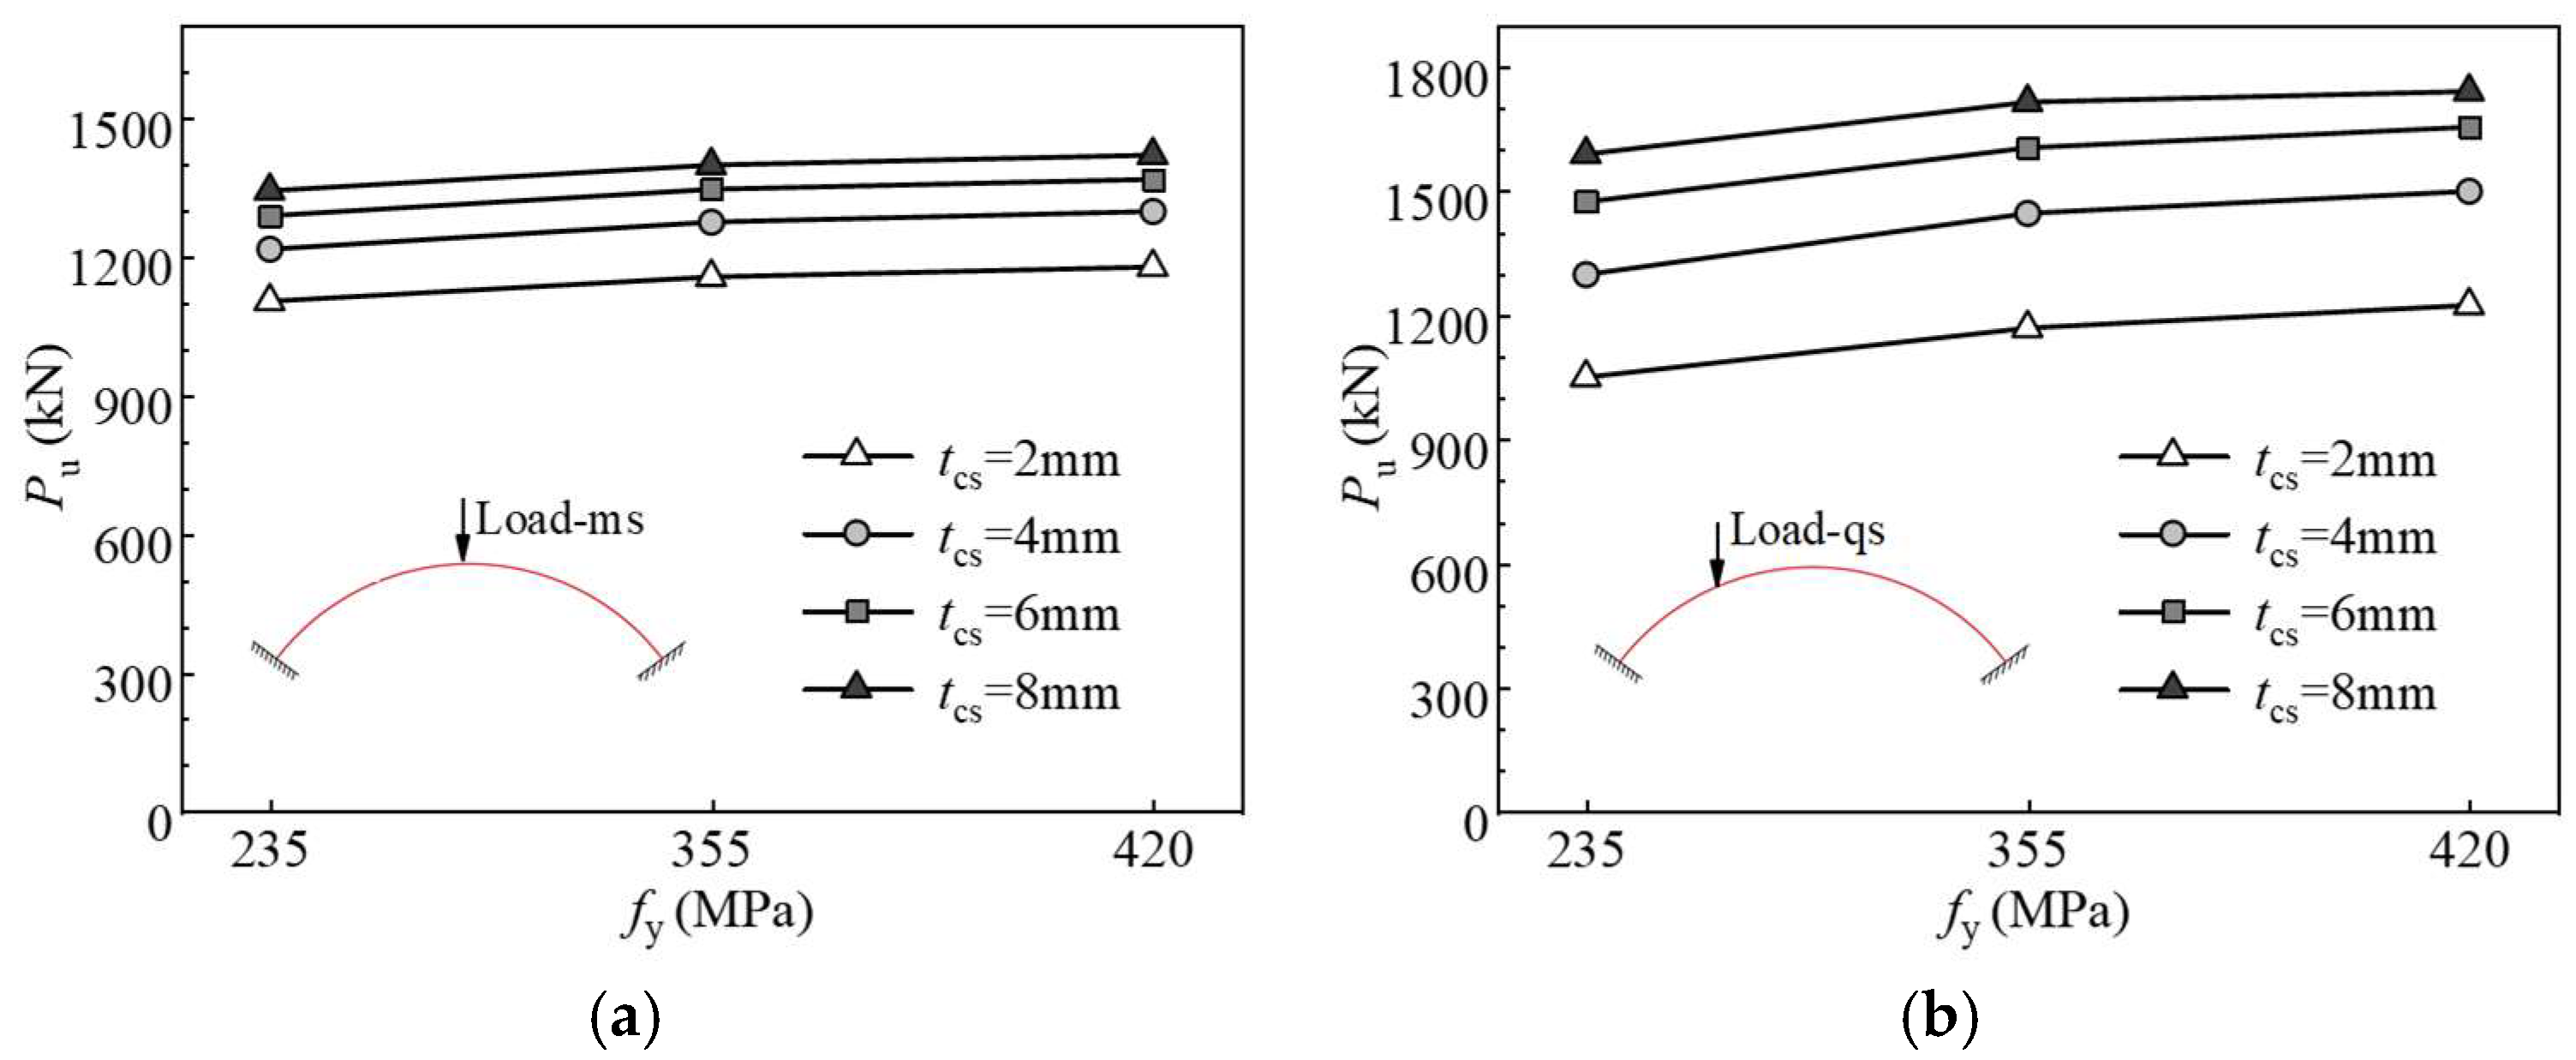
Figure 17 analyzes the influence of corrugated steel thickness (tcs) and yield strength (fy) on the ultimate resistance (Pu) of the CSC arches with varying loading configurations. As revealed, Pu increases with both tcs and fy, but the effect of tcs is more pronounced. Compared to the reference specimen with tcs = 2 mm and fy = 235 MPa, increasing tcs from 2 mm to 8 mm resulted in fy increases of 21.6% and 51.5% under midspan loading (Load-ms) and quarter-point loading (Load-qs), respectively. Conversely, increasing fy from 235 MPa to 420 MPa led to Pu increases of 6.7% and 17.7% for the same loading cases. The ultimate resistance of the quarter-point loaded specimen is more significantly influenced by variations in corrugated steel strength and thickness. This phenomenon can be attributed to the distinct mechanical behavior exhibited by the arches under the two loading locations. The midspan-loaded specimen experiences internal forces dominated by axial force with relatively low bending moments, while the quarter-point loaded specimen is governed by significant bending moments with lower axial forces. Enhancing the strength and thickness of the corrugated steel contributes more substantially to improving the section’s bending stiffness than its compressive resistance. Consequently, the enhancements in flexural performance derived from increased corrugated steel parameters are more fully utilized in the moment-dominated specimens under quarter-point load, leading to a more significant increase in ultimate resistance.

4.3.3. Influence of Rise-to-Span Ratio and Shear Connector Spacing

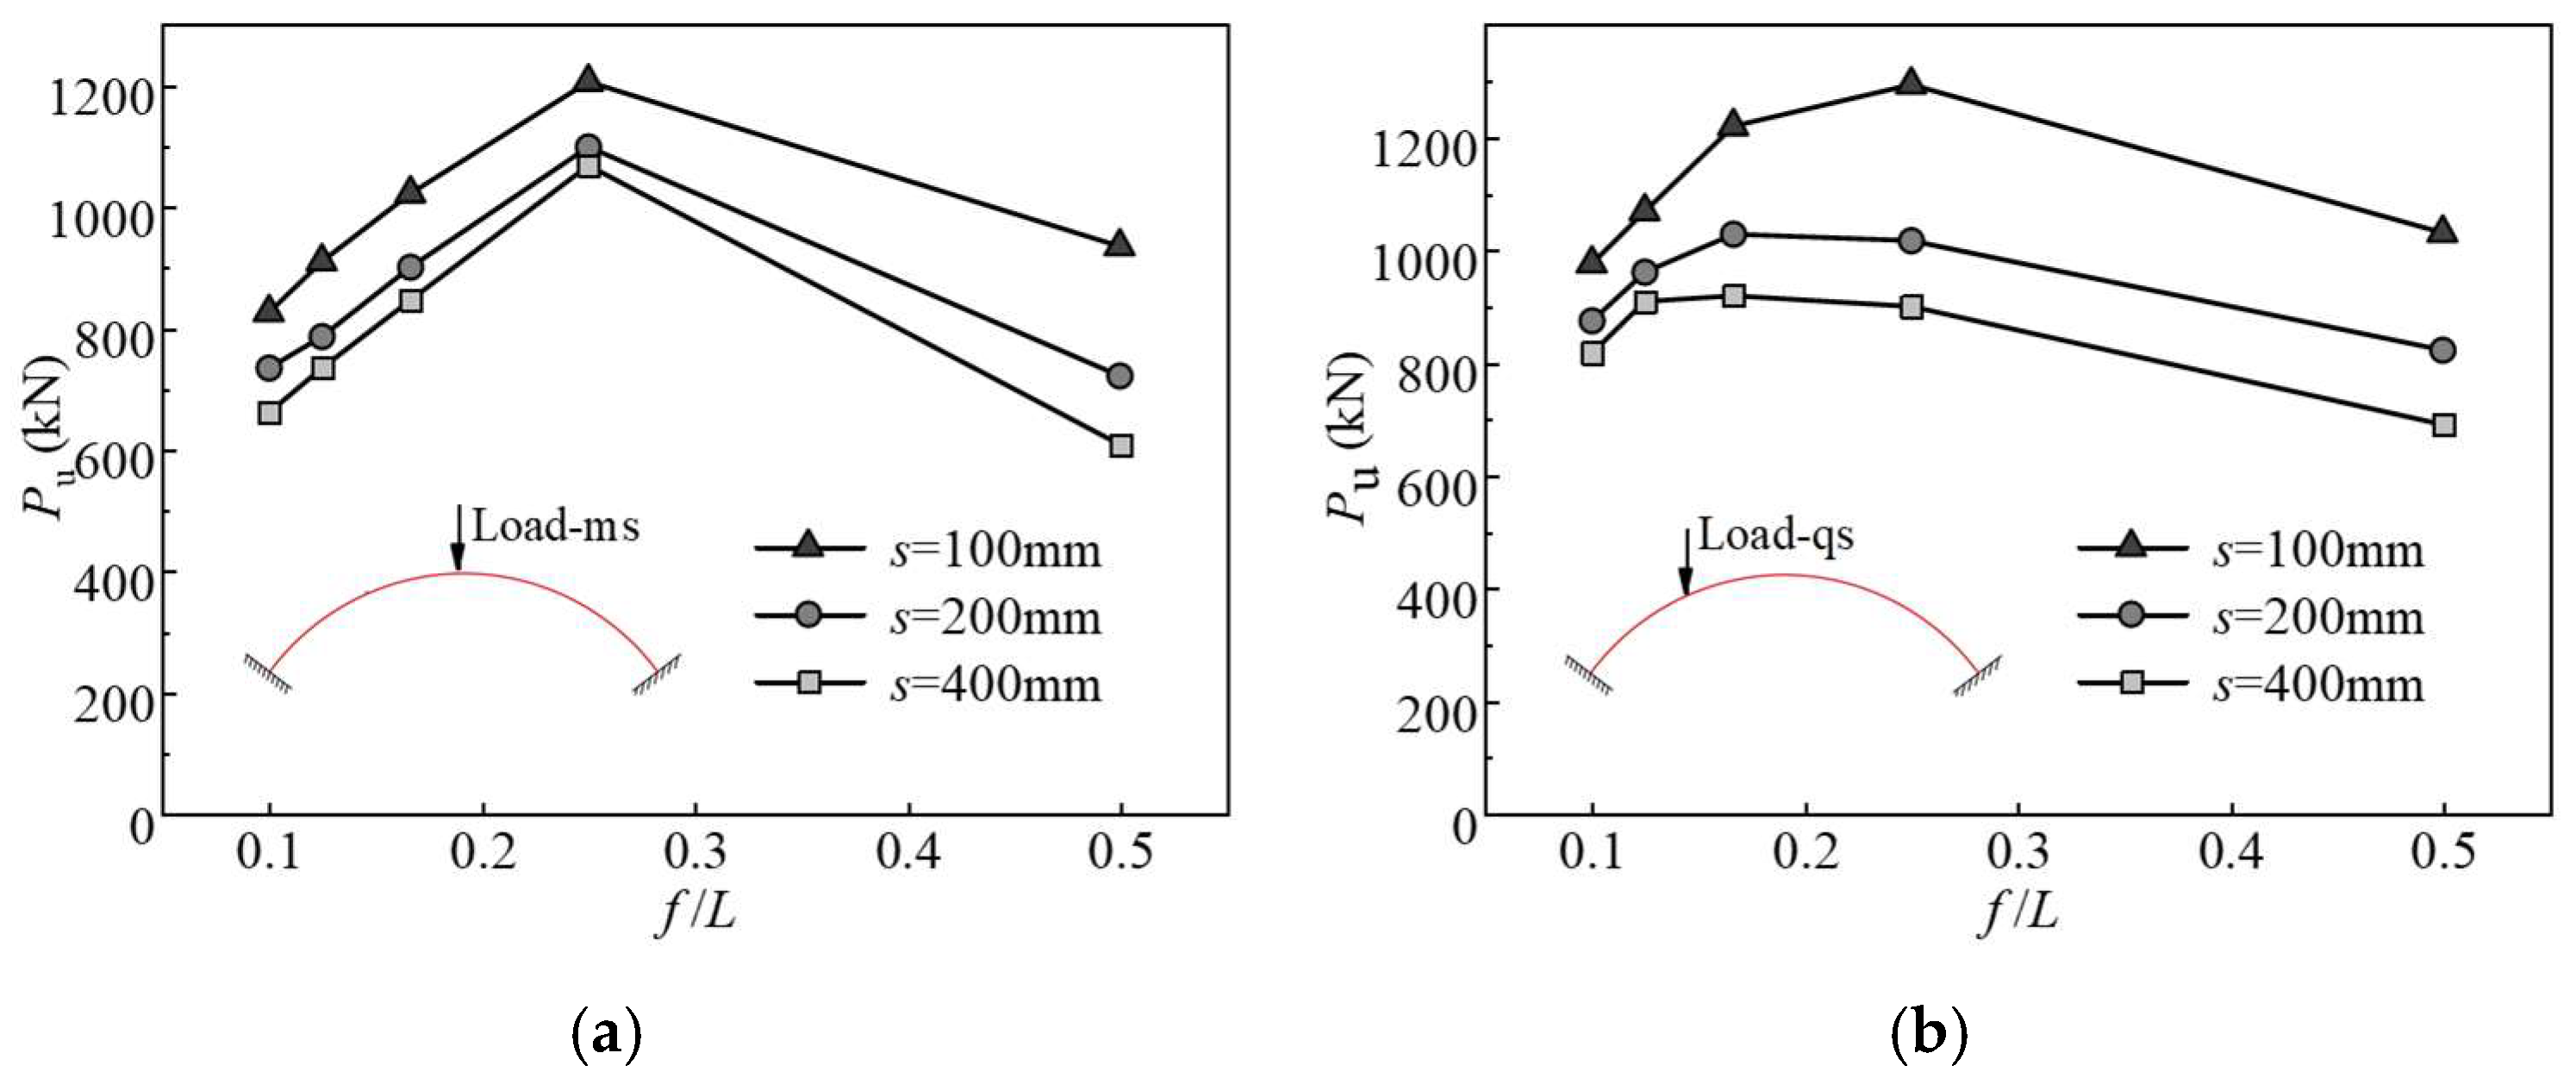
Figure 18 analyzes the influence of the rise-to-span ratio (f/L) and the shear connector spacing (s) on the ultimate resistance (Pu) of the CSC arches. The analysis reveals that Pu initially increases and then decreases as the rise-to-span ratio increases. This non-monotonic behavior arises from substantial modifications in the internal force distribution within the structure with varying f/L, which consequently modifies parameters such as the shear–compression ratio and stress field distribution pattern. This phenomenon has been reported in numerous studies investigating the static behavior of CSC arches [35,36]. Furthermore, the ultimate resistance of CSC arches under quarter-point loading is more significantly affected by variations in shear connector spacing. Specifically, for CSC arches subjected to mid-span loading, the reduction in ultimate resistance ranges from 11.5% to 23.9% when the shear connector spacing increases from 100 mm to 400 mm. In contrast, for those under quarter-point loading, the reduction ranges from 25.4% to 33.1% for the same increase in spacing. This phenomenon may also be ascribed to the substantial modification of the internal force distribution pattern in CSC arches, which is induced by different loading locations. In CSC arches under quarter-point loading, bending moments predominate in the internal forces along the arch body, whereas an increase in shear connector spacing weakens the composite action and consequently reduces the flexural rigidity of the sections. Therefore, for arches where bending moments are significant, an increase in shear connector spacing results in a more pronounced decrease in ultimate resistance.

5. Experimental Program

5.1. Internal Force Analysis of CSC Arches Based on Load Decomposition

Both experimental and FE results demonstrate that the rise-to-span ratio (f/L) and the loading location are key parameters influencing the ultimate resistance of the composite arches. The fundamental reason lies in their significant influence on the internal force distribution of CSC arches. This phenomenon is consistent with findings from existing research on corrugated steel–concrete composite arches. However, current analyses of internal forces in composite arches primarily rely on finite element software computations. Furthermore, the parameter values used in these analyses (such as loading location, rise-to-span ratio, and span) are often specific to particular scenarios, and no general theoretical analytical method has been established yet. Given that the CSC arch constitutes a triply statically indeterminate structure, its internal force distribution is subject to the coupling effects of multiple factors, including load type, loading location, rise-to-span ratio, and span, making direct theoretical calculation complex.
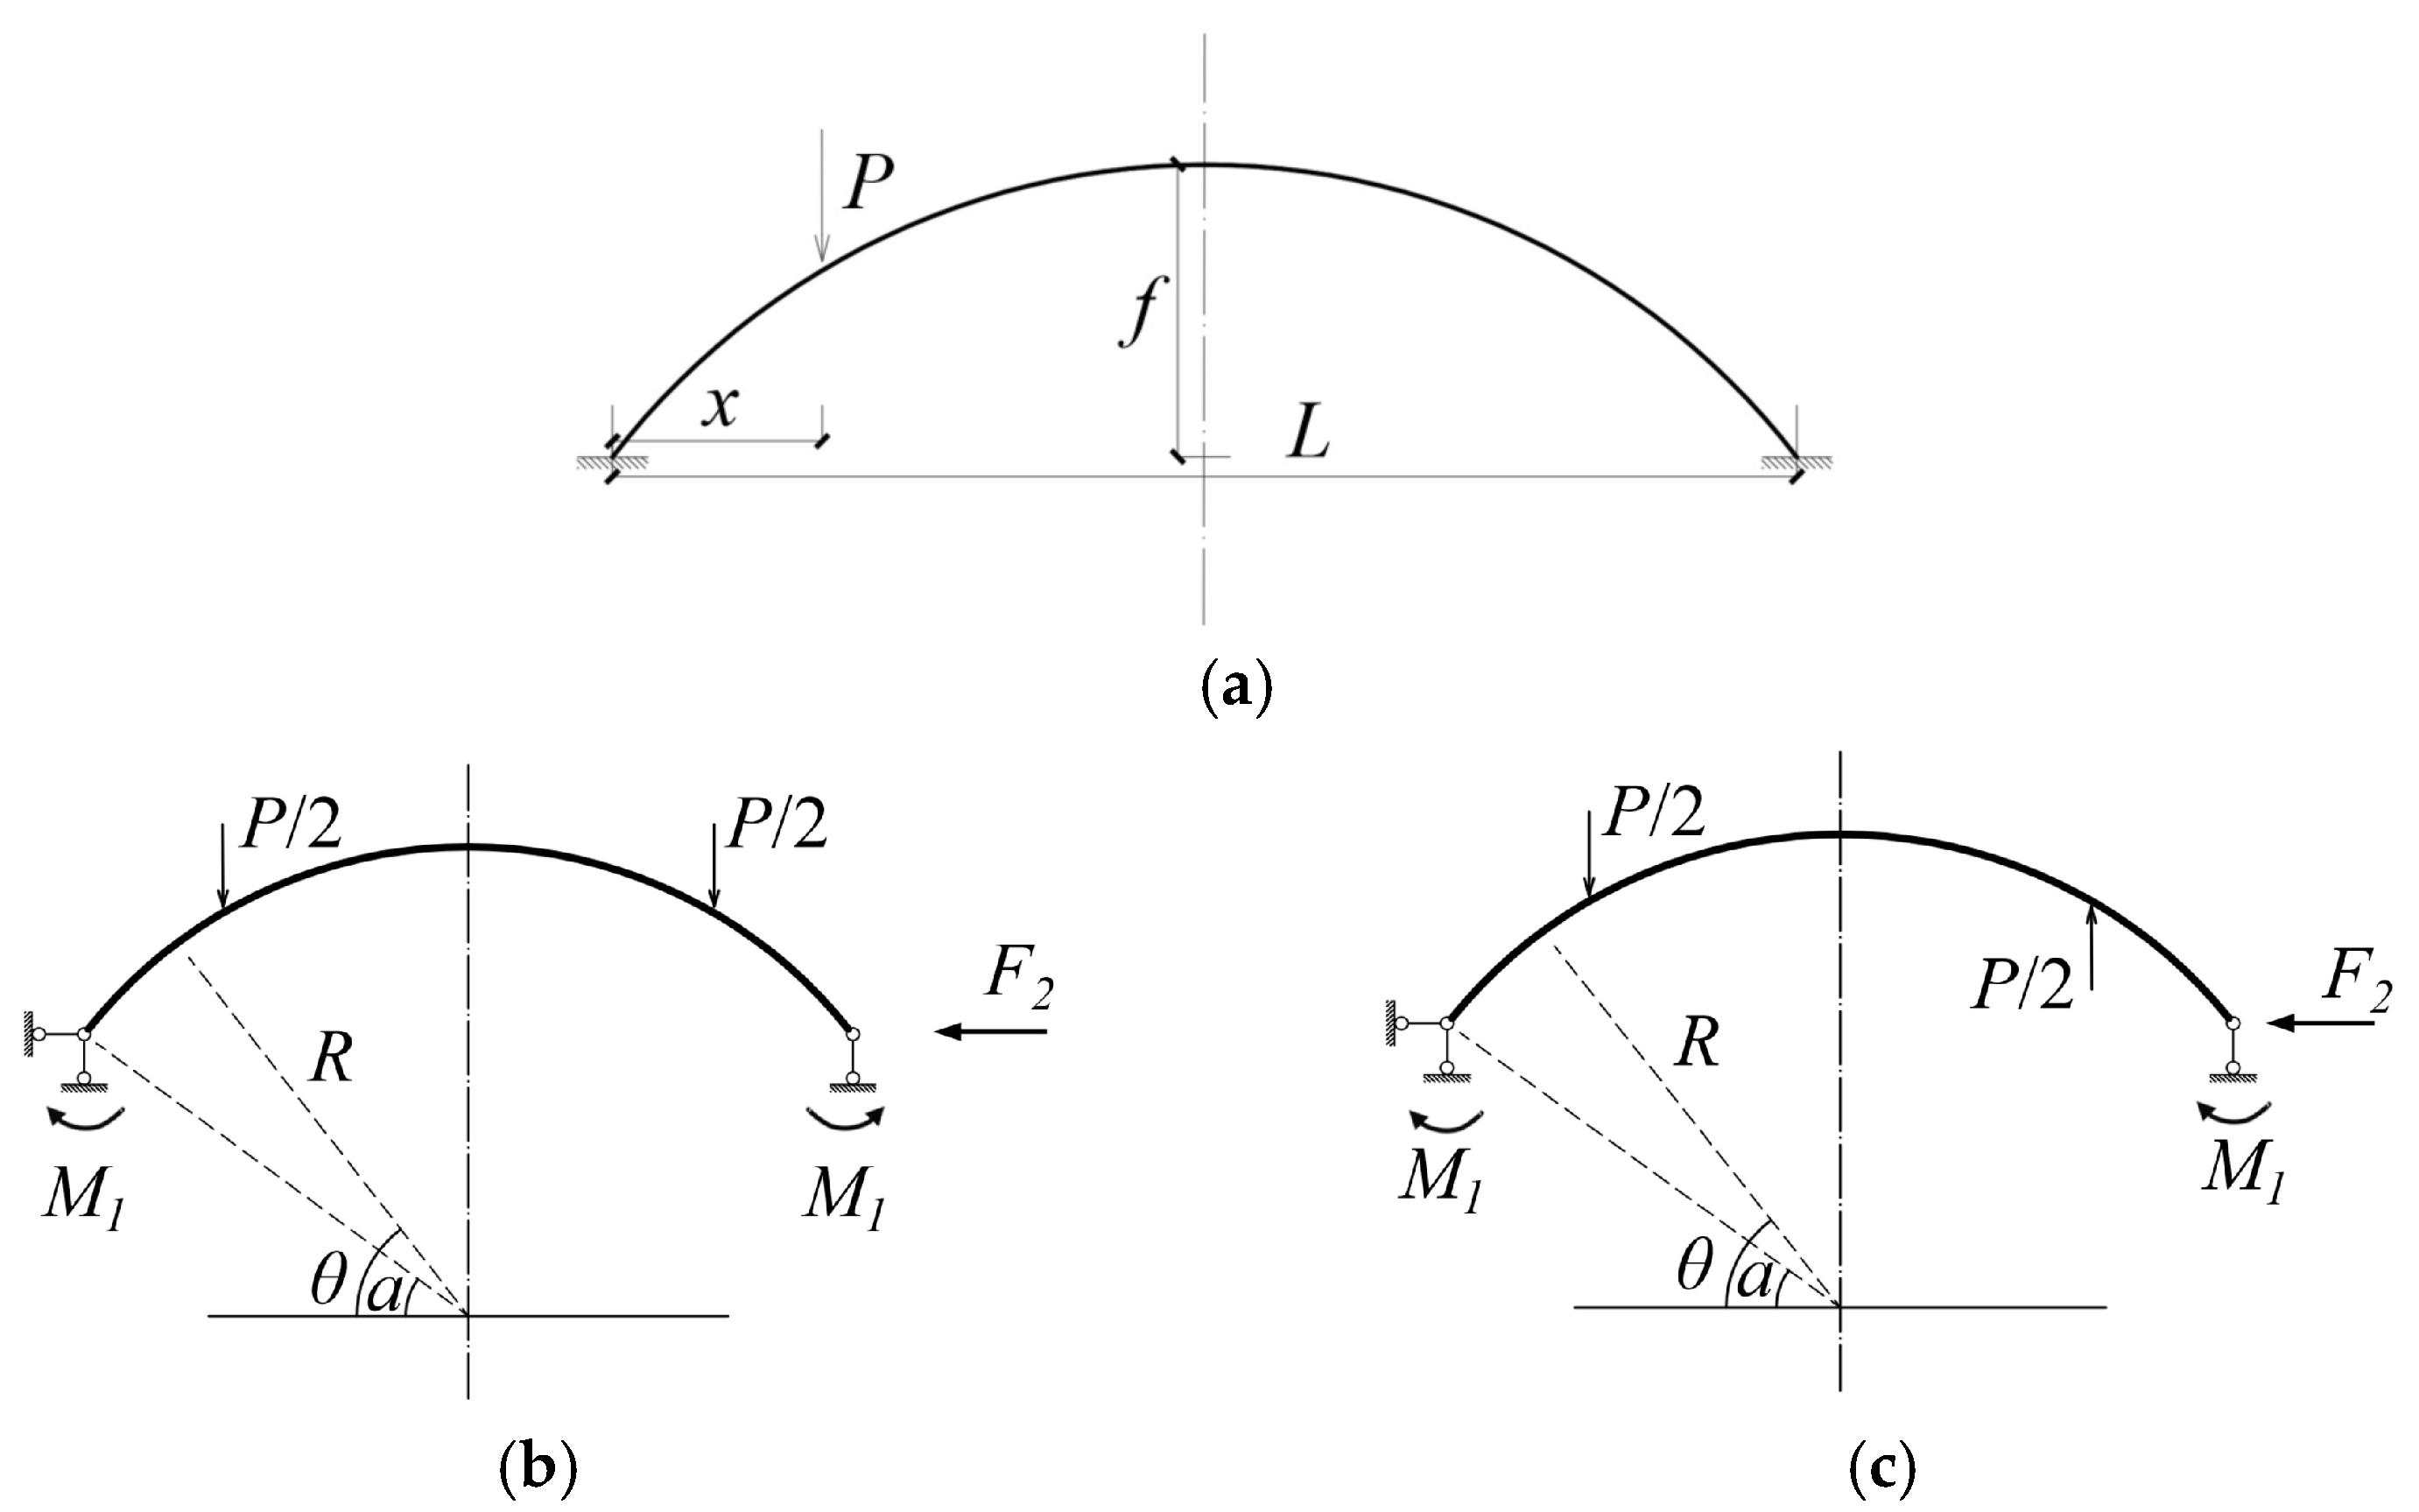
To address the aforementioned issues, a theoretical analytical method based on the principles of small deformation theory and the superposition method is developed in this section. To simplify the computational process, this method fully exploits the geometric symmetry of the CSC arch through load decomposition (Figure 19). In Figure 19a, x represents the distance from the loading point to the support. As illustrated, any load acting at an arbitrary position on the composite arch can be equivalently decomposed into a symmetric load component and an antisymmetric load component (Figure 19b,c). By solving the internal force responses for these two fundamental load cases separately and then superposing the results according to the principle of superposition, the complete internal force distribution of the CSC arches under any loading location can be obtained.
For the symmetric load component, a symmetric couple of moments and a horizontal support reaction can be selected as the fundamental redundants in the force method. Similarly, for the antisymmetric load component, an antisymmetric couple of moments and a horizontal support reaction can be selected as the fundamental redundants in the force method. This selection scheme effectively considers the structural symmetry, reducing the original triply statically indeterminate problem to a doubly statically indeterminate problem. Subsequently, based on the fundamental principles of the force method, the canonical equations Equation (12) are established to solve for the fundamental redundants. Here, M1 represents the symmetric bending moment, and F2 represents the horizontal restraint reaction at the support. Once M1 and F2 are obtained, the internal force response of the structure under the symmetric loading can be determined. The detailed calculations of the complex flexibility matrix and free terms are not elaborated here; refer to Appendix A for details.
δ 11 δ 12 δ 21 δ 22 M 1 s F 2 s + Δ 1 P Δ 2 P = 0
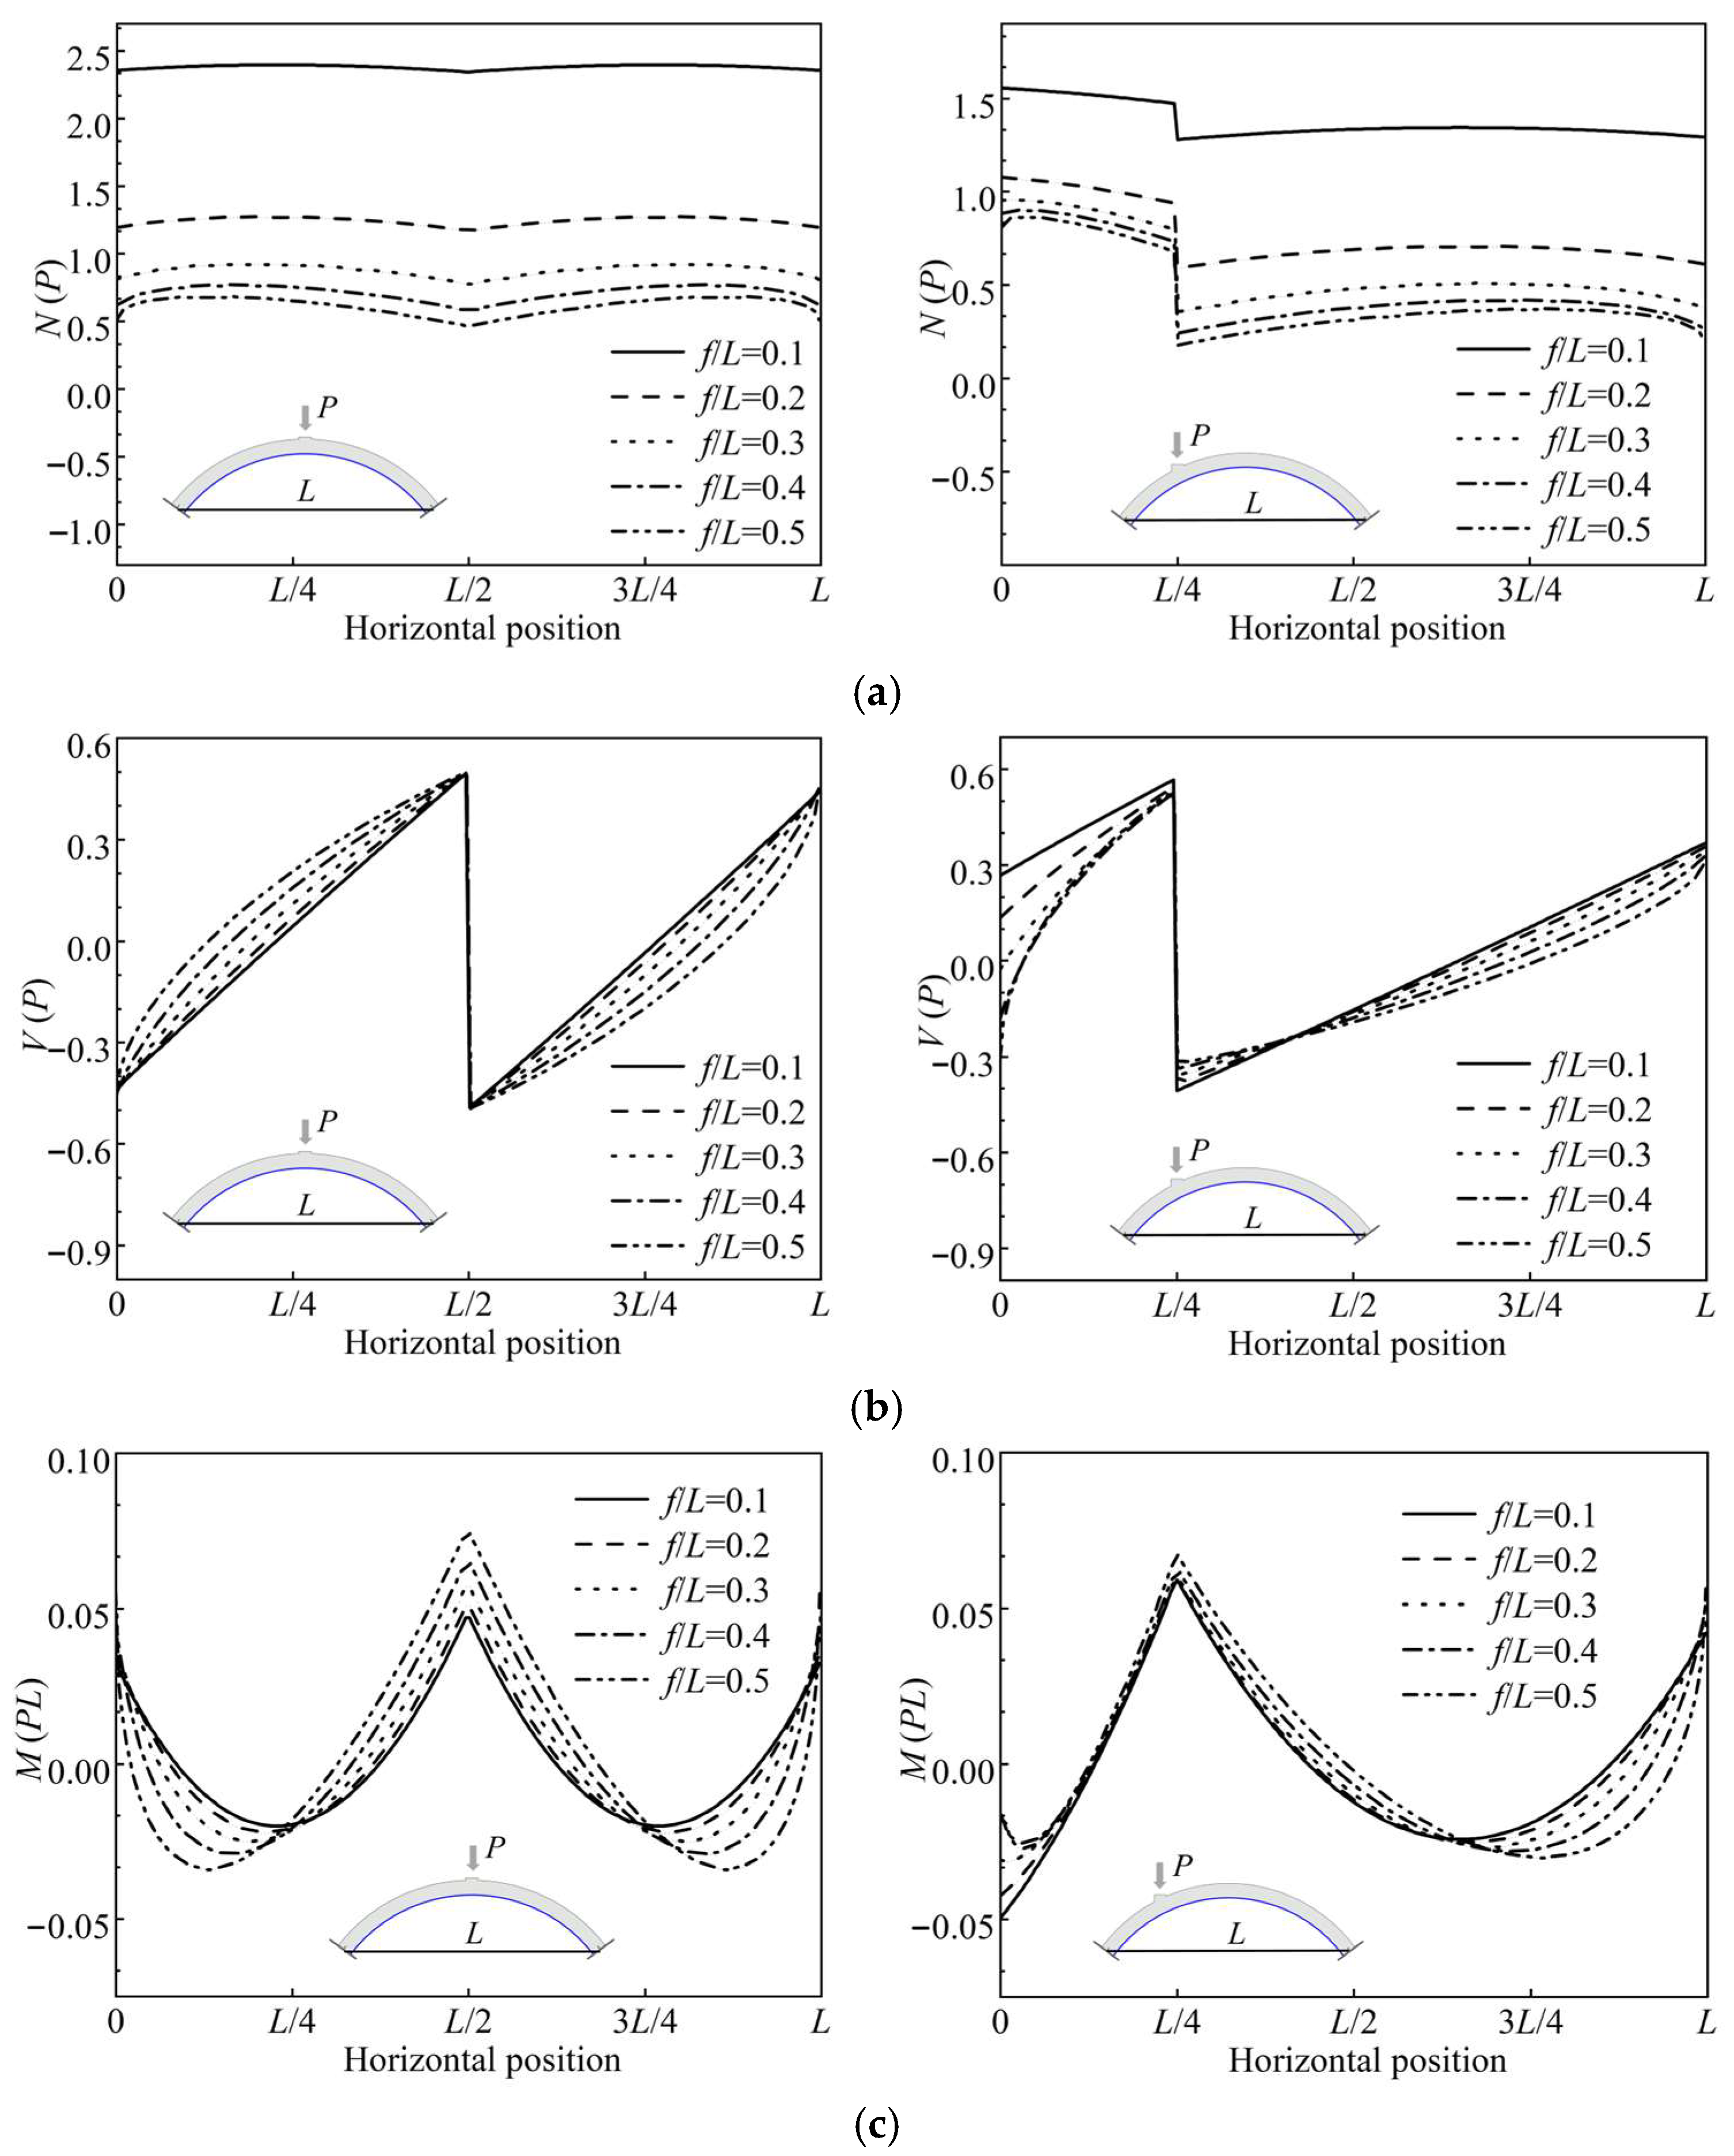
The internal forces in CSC arches, particularly the axial force (N), significantly influence the shear resistance capacity of these composite structures, necessitating an investigation into their distribution patterns under varying parameters. This section examines the effects of rise-to-span ratio, span, and loading location using the proposed theoretical method to analyze full-section internal forces, with specific results presented in Figure 20, where the vertical axis represents the ratio of the internal force to the load P, or the ratio of the bending moment to PL, with L denoting the span length. Analysis of Figure 20 reveals that the loading location has a relatively minor influence on the distribution patterns of bending moment (M) and shear force (V) but a significant effect on axial force (N) distribution. Specifically, regarding M and V distributions, regardless of parameter changes, the maximum positive bending moment consistently occurs directly beneath the loading point, and a discontinuity in shear force is always observed at the loading point. Conversely, for axial force distribution, under midspan loading, the N distribution is relatively smooth with no observed discontinuities, while under quarter-point loading, it exhibits a significant discontinuity at the loading point, accompanied by a marked difference in axial force levels on either side. This distinct axial force behavior arises from the arch’s curvature: a non-radial concentrated load can be decomposed into radial and tangential components, and it is the tangential component that directly induces the abrupt change in axial force at the point of loading.

5.2. Verification of the Calculation Method for Shear Bearing Capacity

The formula for calculating the shear bearing capacity of RC beams in Eurocode 2 is provided in Equations (13)–(15). The total shear bearing capacity (Vu) comprises contributions from shear reinforcement (VRd,s) and concrete (VRd,c). The parameter k relates to sectional geometry, and σcp represents concrete compressive stress (other parameters are defined in Eurocode 2).
V u = V Rd , c + V Rd , s
V Rd , s = A sw s z f ywd ( cot θ + cot α ) sin α
V Rd , c = [ C Rd , c k ( 100 ρ l f ck ) 1 / 3 + k 1 σ cp ] b w d
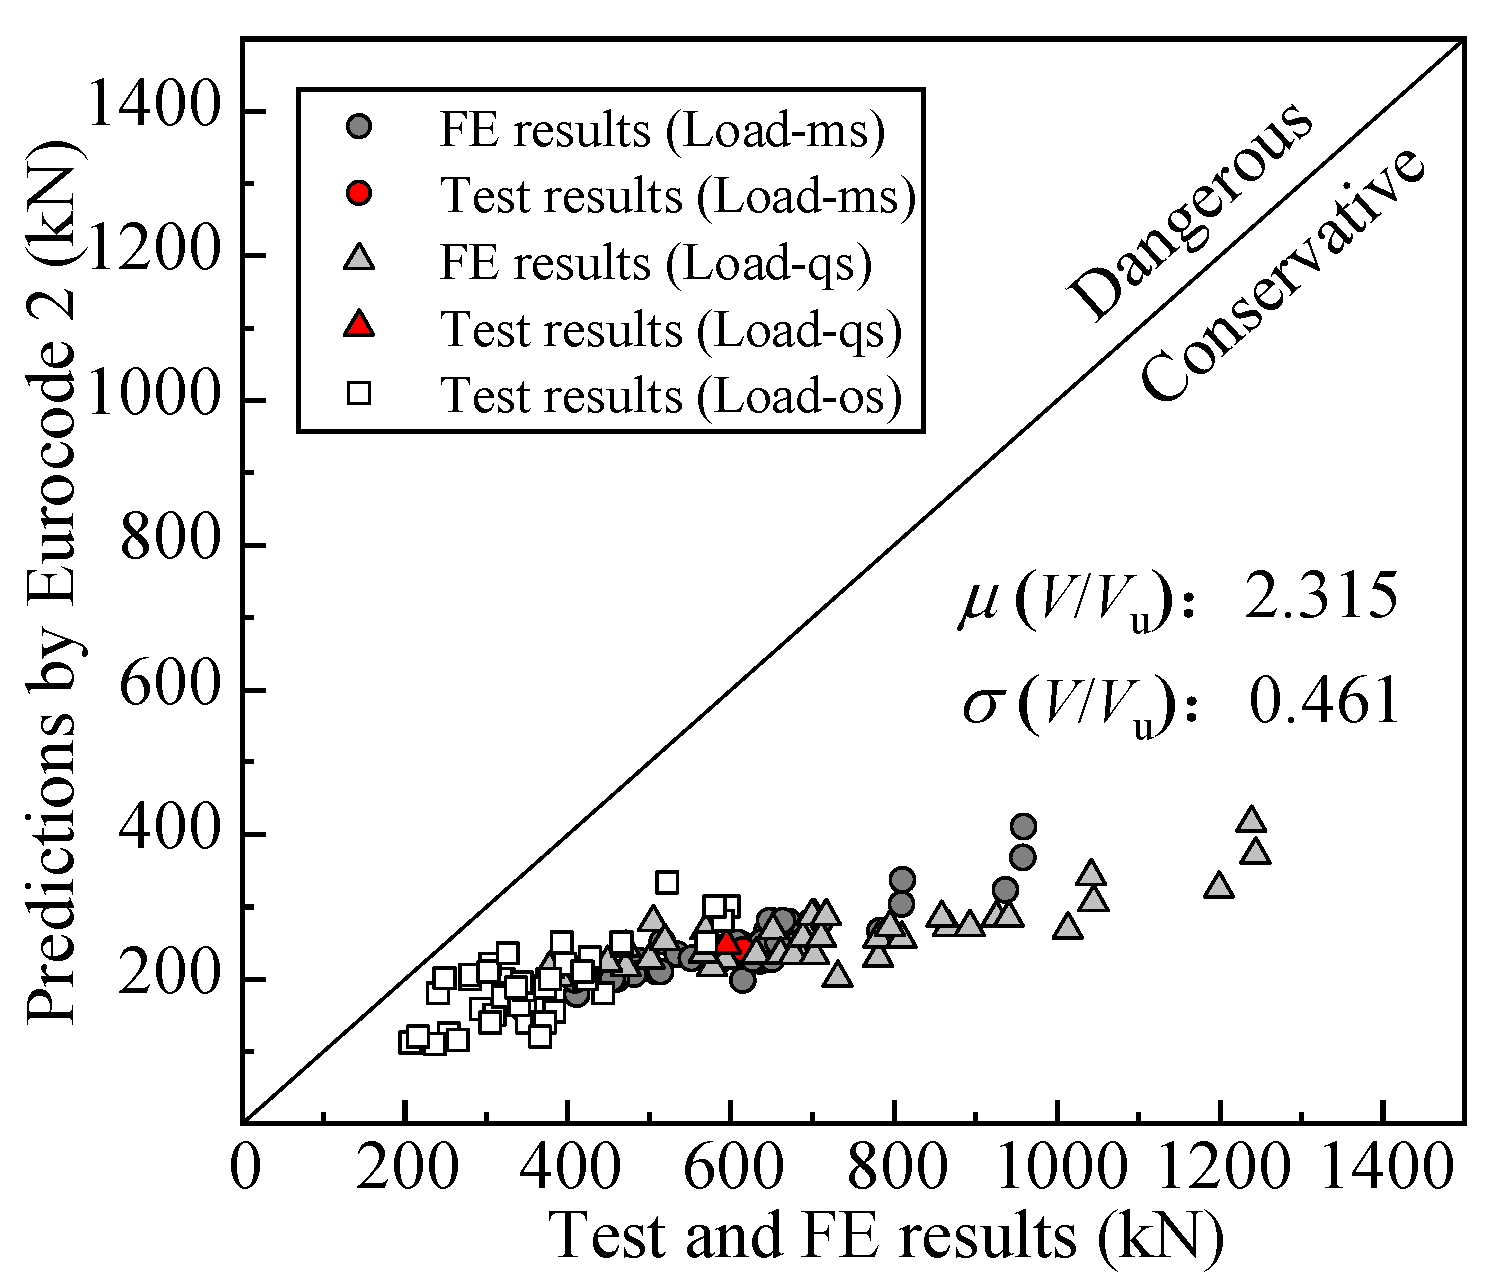
Figure 21 compares the shear capacities of the specimens, finite element models, and those calculated using the Eurocode 2 code. As shown, the shear bearing capacity predictions of CSC arches using the Eurocode 2 calculation method are relatively conservative, with an average value of 2.315, corresponding to a standard deviation of 0.461. There are two main reasons for the conservatism of the current code: (1) It fails to fully account for the positive effect of compressive stress on the structural shear bearing capacity. Specifically, Eurocode 2 specifies a limit for considering the positive contribution of compressive stress, i.e., the compressive stress level of the structure should be less than 0.2fcd, where fcd represents the cylindrical compressive strength of concrete. (2) It does not incorporate the positive influence of corrugated steel on the structural shear bearing capacity, while existing studies have confirmed that the incorporation of corrugated steel elements can remarkably improve the shear bearing capacity of structural systems.
The calculation method proposed by Chen. Reference [38] incorporates two critical parameters based on Eurocode 2, accounting for the shear resistance contribution from the corrugated steel component and fully considering the beneficial influence of high compressive stress levels through replace Equation (15) by Equation (16). Consequently, compared to the calculation methods for shear bearing capacity in current design codes, this formulation more accurately reflects the shear failure mechanism of CSC arches. The key parameters in the formulas include the geometric characteristic coefficient of the composite section (kcsc) and the equivalent section compressive stress ( σ c p c s c ).
V Rd , c csc = [ C Rd , c k csc ( 100 ρ l f ck ) 1 / 3 + k 1 σ cp csc ] b w d
In Equation(16), kcsc quantifies the difference between the composite section of CSC arches and the rectangular section of beams, and it is calculated by Equation (17), where K s represents the sectional shear stiffness for rectangular beams, and K s c s c represents the sectional shear stiffness for CSC arches.
k csc = K s csc K s 1 + 200 d
The other parameter, σ c p c s c , reflects the enhancement of the axial force on the shear bearing capacity and is given by Equation (18), in which k represents the section shear–compression ratio (V/N), defined as the ratio of the sectional shear force (V) to the sectional axial force (N).
σ cp csc = σ cp σ cp < 0.2 f cd 11.62 k σ cp 0.64 f cd σ cp 0.2 f cd
Although this calculation approach yields reasonably precise estimations of the shear bearing capacity of structures when CSC arches are subjected to midspan loading, it neither systematically accounts for the influence of different loading locations nor adequately incorporates the differences in internal force distribution across sections at different locations. To objectively assess the scope of applicability of this calculation method, this section first conducts a systematic calculation of the full-section internal forces in the composite arches based on the sectional internal force calculation method established in Section 5.1. Then, the predictions from the formula are compared with both the results of specimens and FE models, thereby evaluating its applicability.
Figure 22 compares the shear bearing capacity of the CSC arches obtained from experimental data, finite element results, and predictions by the modified model. As illustrated, the shear bearing capacities calculated by the theoretical formulas exhibit close agreement. The mean value (μ) of the ratio V/Vu is 1.066, with a corresponding standard deviation (σ) of 0.071. The maximum relative error is within 15%. As this result demonstrates, while different loading locations significantly influence the internal force distribution of CSC arches, this calculation method remains effective in predicting their shear bearing capacity by incorporating the shear–compression ratio. It is noteworthy that for CSC arches under quarter-span loading, there exist significant differences in the shear force and axial force levels on both sides of the loading point. Consequently, the shear capacities calculated using the modified model for these two sections also show considerable discrepancies. In practical design, both sections should be treated as critical control sections for shear bearing capacity verification.

6. Discussion

6.1. Research Significance

In this study, a theoretical internal force analysis method for circular arches was proposed, thereby revealing the influence of loading location on the shear behavior of CSC arches. Based on experimental and numerical investigations of shear behavior, this study validated theoretical methods from existing codes and research, identifying that the modified model proposed in this study offers satisfactory predictive accuracy by incorporating the shear–compression ratio. Compared to existing research on the shear capacity of CSC arches and similar arch structures [5,31,32,33,34,35,36,40,43,46,48], this study is the first to systematically link shear–compression ratio variation to load location in CSC arches. The influence mechanism of loading location on the shear performance of CSC arches was revealed from the internal force analysis. Furthermore, a theoretical analytical method for determining the internal force distribution in arch structures is proposed, which can serve as a valuable reference for future investigations into the static performance of related structures.

6.2. Practical Application

From a practical perspective, due to corrugated steel components and high-level compressive stress in CSC arches, this structural form clearly exceeds the scope of application for the shear capacity calculation formula specified in current codes. Consequently, applying the current standards may result in more conservative results, which could lead to unnecessary material waste in engineering practice. In contrast, the modified model in this study, incorporating the shear–compression ratio, is applicable under single-point loading. Therefore, this method can be directly adopted in the design of CSC arches, as it was specifically developed for the composite sections of CSC arches.

6.3. Research Limitations and Future Research

Given that shear failure primarily occurs in CSC arches with low slenderness ratios, the calculation method for shear capacity investigated in this study is also primarily targeted at such arches with relatively short spans. For these arches, the internal forces along the arch are dominated by axial force and shear, with a relatively minor influence from bending moment. Consequently, the effect of the bending moment on the shear capacity of CSC arches can be neglected in this study. Conversely, in CSC arches with larger spans, bending moments often become the dominant internal force, and the structures typically fail in a compression-bending mode. However, even for larger-span CSC arches, verification of the structural shear capacity is often necessary under specific loading conditions or for joint design, and the influence of bending moment cannot be ignored in these cases. For the scenarios described above, the influence of loading location on the structural shear capacity becomes more significant, as the loading location considerably alters the sectional bending moment. Based on this understanding, subsequent research will focus on developing shear capacity calculation methods that account for the effect of bending moment, ultimately aiming to establish a comprehensive method for determining the ultimate structural capacity that integrates the effects of bending moment, axial force, and shear force.

7. Conclusions

This study investigates the shear behavior of CSC arches under varying loading locations. Shear tests were first conducted on two specimens with different loading locations. A FE model was then developed and validated to analyze the shear performance, followed by a systematic parametric study. Finally, the accuracy of a shear capacity prediction model for CSC arches was assessed. The main findings are summarized as follows:
  • The loading location significantly influences the structural shear capacity by altering the shear–compression ratio at the failure section. Under identical sectional shear force, the mid-span loaded specimen develops a larger axial force, which restrains the formation of shear cracks and thereby increases the shear capacity of the specimen.
  • Compared to mid-span loading, the shear capacity under quarter-point loading exhibits a higher sensitivity to variations in shear connector spacing and corrugated steel thickness. This behavior occurs because CSC arches under quarter-point loading are primarily bending-dominated. Changes in corrugated steel thickness and shear connector spacing significantly alter the flexural stiffness of the structure.
  • The direction and location of the applied loads govern internal force discontinuities in CSC arches. Under non-radial concentrated loads, the arches exhibit discontinuities in both shear and axial forces at the loading point. In contrast, radial concentrated loads induce only a shear force discontinuity.
  • Validation against results from tests and numerical simulation cases reveals that the predictive model incorporating shear–compression ratio in this study achieves excellent agreement with actual shear bearing capacities, with a mean value (μ) of 1.066 and a corresponding standard deviation (σ) of 0.071. The relative error is consistently within 15%.

Author Contributions

X.X. Investigation, Methodology, Software, Formal Analysis, Writing, Writing—Review and Editing. T.L. Software, Formal Analysis. B.C. Methodology, Formal Analysis, Writing—Review and Editing. J.Y. Investigation, Methodology. X.H. Investigation, Methodology, Formal Analysis. Z.Y. Software, Formal Analysis. C.W. Methodology, Formal Analysis. H.Z. Software, Formal Analysis. All authors have read and agreed to the published version of the manuscript.

Funding

This research received no external funding.

Data Availability Statement

The original contributions presented in the study are included in the article, further inquiries can be directed to the corresponding author.

Conflicts of Interest

Author Tianyu Li was employed by the Heilongjiang Province Longjian Road & Bridge The First Engineering Co., Ltd. Author Hongwei Zhao was employed by the China Railway 19TH Bureau Group Corporation Limited. The remaining authors declare that the research was conducted in the absence of any commercial or financial relationships that could be construed as a potential conflict of interest.

Appendix A. Theoretical Analysis for Internal Forces in CSC Arches

Under the principle of virtual work, the flexibility coefficients (δij) and the free terms (Δip) are calculated (where i, j = 1, 2). To simplify the computational process, during the application of the force method, only the contribution of bending deformation to the flexibility coefficients and displacement terms is taken into account, while the effects of axial deformation and shear deformation are neglected. This simplification was verified through comparative analysis, showing that the error compared to calculations considering all deformation components is within 1%.
The geometric properties of the composite arch, including radius of the arch axis R and initial angle a, are given by Equations (A1) and (A2), respectively.
R = 4 f 2 + L 2 8 f
cos a = 4 f L 4 f 2 + L 2
Accordingly, the internal force distribution under symmetric loading can be calculated using Equations (A3) and (A4):
ω = arccos ( R cos a x R )
M p ( θ ) = 0.5 R ( cos a cos θ ) 0.5 x a < θ < ω ω < θ < π / 2
When a unit value is applied to the fundamental redundants M 1 s and F 2 s , the corresponding bending moment distributions along the arch are given by Equations (A5) and (A6), respectively:
M M ( θ ) = 1
M F ( θ ) = R ( sin θ sin a )
The flexibility coefficients and the structural free terms are calculated by performing integrations along the arc segment of the arch, as detailed in Equations (A7)–(A11):
δ 11 = 2 a π 2 1 E I d R θ
δ 12 = δ 21 = 2 a π 2 R ( sin θ sin a ) E I d R θ
δ 22 = 2 a π 2 R 2 ( sin θ sin a ) 2 E I d R θ
Δ 1 P = 2 a ω R ( cos a cos θ ) 2 E I d R θ + 2 ω π 2 x 2 E I d R θ
Δ 2 P = 2 a ω R 2 ( cos a cos θ ) ( sin θ sin a ) 2 E I d R θ + 2 ω π 2 x R ( sin θ sin a ) 2 E I d R θ
Therefore, the internal force response under symmetric loading can be represented by Equation (A12):
M s ( θ ) = M P ( θ ) + M 1 s M M ( θ ) + F 2 s M F ( θ ) N s ( θ ) = N P ( θ ) + M 1 s N M ( θ ) + F 2 s N F ( θ ) V s ( θ ) = V P ( θ ) + M 1 s V M ( θ ) + F 2 s V F ( θ )
For the antisymmetric load component, the relevant geometric parameters and the force method calculation procedure are detailed as follow.
Initially, the vertical support reaction can be calculated using Equation (A13).
F R = 1 2 x L
Consequently, the internal force distribution under antisymmetric loading can be determined using Equation (A14).
M p ( θ ) = F R R ( cos a cos θ ) x R L cos θ a < θ < ω ω < θ < π 2
When a unit value is applied to the fundamental redundants M 1 as as and F 2 as as respectively, the corresponding bending moment distributions along the arch are given by Equations (A15) and (A16).
M M ( θ ) = 2 R L cos θ
M F ( θ ) = R ( sin θ sin a )
The flexibility coefficients and the free terms are calculated via Equations (A17)–(A21).
δ 11 = 2 a π 2 ( 2 R cos θ ) 2 E I L 2 d R θ
δ 12 = δ 21 = 0
δ 22 = 2 a π 2 R 2 ( sin θ sin a ) 2 E I d R θ
Δ 1 P = 2 E I a ω 2 F R R 2 L cos θ ( cos a cos θ ) d R θ + 2 E I ω π 2 2 x R 2 L 2 cos 2 θ d R θ
Δ 2 P = 0
Therefore, the internal force response under antisymmetric loading can be represented by Equation (A22).
M as ( θ ) = M P ( θ ) + M 1 as M M ( θ ) + F 2 as M F ( θ ) N as ( θ ) = N P ( θ ) + M 1 as N M ( θ ) + F 2 as N F ( θ ) V as ( θ ) = V P ( θ ) + M 1 as V M ( θ ) + F 2 as V F ( θ )
Finally, applying the principle of superposition, the complete internal force response under any arbitrary loading can be obtained from Equation (A23).
M ( θ ) = M s ( θ ) + M as ( θ ) N ( θ ) = N s ( θ ) + N as ( θ ) V ( θ ) = V s ( θ ) + V as ( θ )

References

  1. Sun, K.; Hong, Y.; Xu, W.; Liu, H.; Zhen, Y.; Qin, J. Analysis and Prediction of the Mechanical Behavior of Corrugated Plate as Primary Support in Tunnels with Elastoplastic Constitution. Tunn. Undergr. Space Technol. 2022, 124, 104451. [Google Scholar] [CrossRef]
  2. Casariego, P.; Casafont, M.; Ferrer, M.; Marimon, F. Analytical Study of Flat and Curved Trapezoidal Cold Formed Steel Sheets by Means of the Yield Line Theory. Part 2: Curved Sheets with Transverse Corrugations. Thin Walled Struct. 2019, 141, 693–712. [Google Scholar] [CrossRef]
  3. Sun, K.; Hong, Y.; Xu, W.; Hou, Z.; Liu, X.; Yu, M.; Yuan, Z. Analysis and Prediction of Mechanical Characteristics of Corrugated Plate as Primary Support in Tunnels. Tunn. Undergr. Space Technol. 2021, 111, 103845. [Google Scholar] [CrossRef]
  4. Yu, S.; Wu, H.; Zhang, G.; Wang, Z.; Yao, J.; Li, H.; Liu, C. Experimental Study on Anti-Shallow-Buried-Explosion Capacity of a Corrugated Steel-Plain Concrete Composite Structure. Int. J. Impact Eng. 2023, 172, 104393. [Google Scholar] [CrossRef]
  5. Chen, B.; Zhang, T.; Geng, Y.; Wang, Q.; Zhao, G.; Yang, J. Longitudinal Shear Tests and Design Methods for Corrugated Steel–Concrete Composite Slabs with Recycled Coarse Aggregate. Constr. Build. Mater. 2023, 400, 132870. [Google Scholar] [CrossRef]
  6. Yan, J.-B.; Fan, J.; Ding, R.; Nie, X. Steel-Concrete-Steel Sandwich Composite Structures: A Review. Eng. Struct. 2024, 302, 117449. [Google Scholar] [CrossRef]
  7. Yan, M.; Wang, L.; Chen, B.; He, Y. Assessment of Mid-Span Deflection of Curved Steel-Concrete-Steel Sandwich Shells under Concentrated Loading. Structures 2024, 70, 107618. [Google Scholar] [CrossRef]
  8. Zhang, X.; Chen, K.; Lu, X.; Xu, G.; Chen, T. Constructional Behavior of Multi-Span Corrugated Steel Arch Culverts Stiffened by Concrete Rings. J. Constr. Steel Res. 2024, 218, 108751. [Google Scholar] [CrossRef]
  9. Luo, Y.; Alaghbandrad, A.; Genger, T.K.; Hammad, A. History and Recent Development of Multi-Purpose Utility Tunnels. Tunn. Undergr. Space Technol. 2020, 103, 103511. [Google Scholar] [CrossRef]
  10. Yan, J.-B.; Qian, X.; Liew, J.Y.R.; Zong, L. Damage Plasticity Based Numerical Analysis on Steel–Concrete–Steel Sandwich Shells Used in the Arctic Offshore Structure. Eng. Struct. 2016, 117, 542–559. [Google Scholar] [CrossRef]
  11. Fang, Y.; Wang, Y.; Yang, H.; Lin, X. Experimental Behavior of Concrete-Filled Thin-Walled Corrugated Steel Tubes with Large Helical Angles under Monotonic and Cyclic Axial Compression. Thin Walled Struct. 2022, 173, 109043. [Google Scholar] [CrossRef]
  12. Fang, Y.; Gai, W.; Yang, H.; Lu, B. Modelling and Lock-Seam Effects on Compressive Behaviour of Concrete-Filled Helical Corrugated Steel Tubes. Structures 2023, 58, 105321. [Google Scholar] [CrossRef]
  13. Fang, Y.; Yang, H.; Chan, T.; Wang, Y. Experimental Investigation on Seismic Behaviour of Concrete-Filled Corrugated Steel Tubes under Cyclic Torsional Loads. Eng. Struct. 2024, 309, 118062. [Google Scholar] [CrossRef]
  14. Yang, G.; Wang, G.; Lu, W.; Zhao, X.; Yan, P.; Chen, M. Numerical Modeling of Surface Explosion Effects on Shallow-Buried Box Culvert Behavior during the Water Diversion. Thin Walled Struct. 2018, 133, 153–168. [Google Scholar] [CrossRef]
  15. Ding, W.; Huang, X.; Li, S.; Liu, W.; Zhang, Q. Flexural Stiffness Characterization of the Corrugated Steel–Concrete Composite Structure for Tunnel Projects. Undergr. Space 2023, 12, 18–30. [Google Scholar] [CrossRef]
  16. Guo, Y.-L.; Chen, H.; Pi, Y.-L.; Bradford, M.A. In-Plane Strength of Steel Arches with a Sinusoidal Corrugated Web under a Full-Span Uniform Vertical Load: Experimental and Numerical Investigations. Eng. Struct. 2016, 110, 105–115. [Google Scholar] [CrossRef]
  17. Yang, J.; Liu, F.; Chen, B.; Liu, C.; Sun, D.; Wang, Y. Compressive-Bending Behavior of Corrugated Steel-Concrete Composite Arches: Testing, Modelling and Design. Eng. Struct. 2025, 342, 120952. [Google Scholar] [CrossRef]
  18. Yu, Z.; Liu, F.; Liu, C.; Yang, H.; Wang, Y.; Pei, Y. Experimental and Numerical Studies on Corrugated Steel Retrofitted Damaged Reinforced Concrete Arches. Thin Walled Struct. 2024, 205, 112386. [Google Scholar] [CrossRef]
  19. Yang, J.; Liu, F.; Chen, B.; Liu, C.; Sun, D.; Wang, Y. Axial Compression Behavior of Corrugated Steel-Concrete Composite Arches. J. Constr. Steel Res. 2025, 234, 109772. [Google Scholar] [CrossRef]
  20. Han, X.; Wei, C.; Hu, Q.; Liu, C.; Wang, Y. In-Plane Nonlinear Buckling Analysis and Design Method of Concrete-Filled Steel Tubular Catenary Arches. J. Constr. Steel Res. 2024, 214, 108485. [Google Scholar] [CrossRef]
  21. Sun, J.-Q.; Geng, Y.; Liew, J.Y.R.; Wang, Y.-T.; Wang, Y.-Y. Experimental and Numerical Study on Out-of-Plane Post Creep Buckling Behavior of Concrete-Filled Steel Tubular Arch. Eng. Struct. 2025, 329, 119843. [Google Scholar] [CrossRef]
  22. Xia, Q.; Wang, Y.; Jelovica, J.; Liu, C.; Sun, D. Experimental Study on Corrugated Steel–Concrete Composite Semicircular Arches under Midspan Loading. Structures 2022, 38, 1137–1150. [Google Scholar] [CrossRef]
  23. Wu, Z.; Wang, Y.; Mei, Y.; Liu, F.; Liu, C. Static Behavior of Corrugated Steel-Shotcrete Composite Arches. Thin Walled Struct. 2024, 195, 111429. [Google Scholar] [CrossRef]
  24. Wu, Z.; Liu, C.; Wang, Y.; Yang, H.; Liu, F.; Yu, Z. Experimental and Numerical Studies on the Behavior of Corrugated Steel-Sprayed ECC Composite Arches with Full-Shear-Connection. Eng. Struct. 2024, 309, 118096. [Google Scholar] [CrossRef]
  25. Tong, J.-Z.; Chen, Y.-L.; Li, Q.-H.; Dai, J.-B.; Wang, G.-Z.; Shen, J.-J.; Gao, W.; Xu, S.-L. Flexural Performance and Crack Width Prediction of Steel-UHTCC Composite Bridge Decks with Wet Joints. Eng. Struct. 2025, 323, 119264. [Google Scholar] [CrossRef]
  26. Huang, Z.; Liew, J.Y.R. Experimental and Analytical Studies of Curved Steel–Concrete–Steel Sandwich Panels under Patch Loads. Mater. Des. 2016, 93, 104–117. [Google Scholar] [CrossRef]
  27. Leng, Y.; Song, X. Shear Strength of Steel–Concrete–Steel Sandwich Deep Beams: A Simplified Approach. Adv. Struct. Eng. 2019, 22, 42–53. [Google Scholar] [CrossRef]
  28. EN 1992-2:2005; Eurocode 2: Design of Concrete Structures–Part 2: Concrete Bridges–Design and Detailing Rules. European Committee for Standardization: Brussels, Belgium, 2005.
  29. ACI 318-05; Building Code Requirements for Structural Concrete. American Concrete Institute: San Bernardino, CA, USA, 2005.
  30. GB 50010-2010; Code for Design of Concrete Structures. China Architecture & Building Press: Beijing, China, 2015.
  31. Wen, C.-B.; Zuo, J.-Q.; Zhu, B.-L.; Sun, H.-J.; Guo, Y.-L.; Zheng, W.-J.; Deng, L.-L. Shear Resistance Design of Prefabricated Corrugated Steel Plate Shear Walls with Reinforced Boundary Elements. Structures 2024, 68, 107067. [Google Scholar] [CrossRef]
  32. Wu, R.-M.; Tong, J.-Z. Shear Strength and Post-Ultimate Behavior of Multi-Stiffened Corrugated Steel Plate Shear Walls. J. Constr. Steel Res. 2025, 229, 109480. [Google Scholar] [CrossRef]
  33. Tong, J.; Zhang, J.; Yu, C.; Tong, G.; Li, Q.; Xu, S. Seismic Experiments and Shear Resistance Prediction of Multi-celled Corrugated-plate CFST Walls. Earthq. Engng Struct. Dyn. 2024, 53, 1681–1704. [Google Scholar] [CrossRef]
  34. Bi, Z.; Yang, G. Shear Strength of Steel-Concrete Composite I-Beams with Corrugated Steel Webs. Structures 2024, 69, 107317. [Google Scholar] [CrossRef]
  35. Wang, S.; He, J.; Liu, Y. Shear Behavior of Steel I-Girder with Stiffened Corrugated Web, Part I: Experimental Study. Thin Walled Struct. 2019, 140, 248–262. [Google Scholar] [CrossRef]
  36. Xie, Z.; Shi, L.; Peng, L.; Zhang, S.; Zhou, D.; Zhang, X.; Yu, C. Behaviour of a Cold-Formed Steel Shear Wall with Centre-Corrugated Steel Sheathing under Cyclic Loading. Eng. Struct. 2024, 318, 118650. [Google Scholar] [CrossRef]
  37. Yu, J.-G.; Feng, X.-T.; Carvelli, V. Hysteretic Performance of Foam-Infilled Corrugated FRP-Steel Sandwich Shear Wall. Eng. Struct. 2023, 294, 116775. [Google Scholar] [CrossRef]
  38. Chen, B.; Xia, X.; Liu, C.; Zhang, H.; Wang, Y. Calculation method for shear bearing capacity of corrugated steel-concrete composite arches based on experimental and theoretical studies. Eng. Struct. Under review. 2025. [Google Scholar]
  39. Ghali, M.K.; Said, M.; Mustafa, T.S.; El-Sayed, A.A. Behaviour of T-Shaped RC Deep Beams with Openings under Different Loading Conditions. Structures 2021, 31, 1106–1129. [Google Scholar] [CrossRef]
  40. Fayyadh, M.M.; Abdul Razak, H. Impact of Design Parameters and Cycles of Damage Loads on CFRP Repair Effectiveness of Shear-Deficient RC Structures. Constr. Build. Mater. 2022, 347, 128465. [Google Scholar] [CrossRef]
  41. Liu, X.; Yang, Y.; Yu, Y.; Hao, N. Shear Performance of Prestressed Partially-Precast Steel Reinforced Concrete Beam: Experiments and Analyses. Structures 2024, 62, 106329. [Google Scholar] [CrossRef]
  42. Setiawan, A.; Cantone, R.; Fernández Ruiz, M.; Muttoni, A. Verification of Shear Failures of Cantilever Bridge Deck Slabs Subjected to Concentrated Loads. Eng. Struct. 2024, 303, 117491. [Google Scholar] [CrossRef]
  43. Hu, Q.; Liu, C.; Yuan, C.; Wang, Y.; Zhang, S. Experimental Investigation into In-Plane Stability of Concrete-Filled Steel Tubular Parabolic Arches Under Five-Point Concentrated Loads. Int. J. Steel Struct. 2020, 20, 2038–2050. [Google Scholar] [CrossRef]
  44. Yang, J.; Sun, Y.; Liu, F.; Liu, C.; Wang, Y. Dynamic Response and Energy Dissipation Mechanism of Corrugated Steel-Concrete-Corrugated Steel Sandwich Composite Arches under Impact Loading. Structures 2025, 80, 109713. [Google Scholar] [CrossRef]
  45. Sun, D.; Liu, C.; Wang, Y.; Xia, Q.; Liu, F. Static Performance of a New Type of Corrugated Steel-Concrete Composite Shell under Mid-Span Loading. Structures 2022, 37, 109–124. [Google Scholar] [CrossRef]
  46. Li, Y.; Liao, Y.; Xie, Z.; Peng, L. Stability Analysis of Curved Beams Based on First-Order Shear Deformation Theory and Moving Least-Squares Approximation. Buildings 2024, 14, 3887. [Google Scholar] [CrossRef]
  47. JTG D61—2005; Code for Design of Highway Masonry Bridges and Culverts. China Communications Press: Beijing, China, 2016.
  48. GB/T 228.1-2021; Metallic Materials—Tensile Testing—Part 1: Method of Test at Room Temperature. Standards Press of China: Beijing, China, 2021.
  49. GB/T 50081-2019; Standard for Test Methods of Concrete Physical and Mechanical Properties. China Architecture & Building Press: Beijing, China, 2019.
  50. GB/T 34567-2017; Cold-Formed Corrugated Steel Pipes. Standards Press of China: Beijing, China, 2017.
Figure 1. Details of the specimens (unit: mm).
Buildings 15 03316 g001
Figure 2. Steel tensile curve.
Buildings 15 03316 g002
Figure 3. Experimental loading system.
Buildings 15 03316 g003
Figure 4. Layout of instrumentation. (a) Overall arrangement; (b) cross-section.
Buildings 15 03316 g004
Figure 5. Failure modes of specimens. (a) CSCA-M. (b) CSCA-Q.
Buildings 15 03316 g005
Figure 6. Load–displacement curves.
Buildings 15 03316 g006
Figure 7. Deflection development of specimens. (a) CSCA-M. (b) CSCA-Q.
Buildings 15 03316 g007
Figure 8. Troughs strain distribution of specimens. (a) CSCA-M. (b) CSCA-Q.
Buildings 15 03316 g008
Figure 9. Strain in CS toughs under positive bending moment zones. (a) L/2 cross-section of CSCA-M. (b) L/4 cross-section of CSCA-Q.
Buildings 15 03316 g009
Figure 10. Strain in CS toughs under negative bending moment zones. (a) L/4 cross-section of CSCA-M. (b) 3L/4 cross-section of CSCA-Q.
Buildings 15 03316 g010
Figure 11. Finite element model.
Buildings 15 03316 g011
Figure 12. Stress–strain curve of steel.
Buildings 15 03316 g012
Figure 13. Load–displacement curves. (a) CSCA-M. (b) CSCA-Q.
Buildings 15 03316 g013
Figure 14. Comparison of damage patterns between the test result and numerical simulation.
Buildings 15 03316 g014
Figure 15. Influence of rise-to-span ratio and loading location on the ultimate resistance of CSC arches.
Buildings 15 03316 g015
Figure 16. Ultimate resistance of CSC arches with different fck and hc. (a) Load-ms. (b) Load-qs.
Buildings 15 03316 g016
Figure 17. Ultimate resistance of CSC arches with different fy and tcs. (a) Load-ms. (b) Load-qs.
Buildings 15 03316 g017
Figure 18. Ultimate resistance of CSC arches with different f/L and s. (a) Load-ms. (b) Load-qs.
Buildings 15 03316 g018
Figure 19. Load decomposition for CSCA. (a) Axis of CSC arches. (b) Symmetrical load. (c) Antisymmetrical load.
Buildings 15 03316 g019
Figure 20. Internal force analysis for CSC arches with different loading locations. (a) Axial force. (b) Shear force. (c) Bending moment.
Buildings 15 03316 g020
Figure 21. Comparison of results from FE and tests with predictions obtained by Eurocode 2.
Buildings 15 03316 g021
Figure 22. Comparison of results from FE and tests with predictions obtained by modified model.
Buildings 15 03316 g022
Table 1. Specimen details.
Specimenf (mm)L (mm)f/Lw (mm)tc (mm)fck (MPa)Load Location
CSCA-M75030001/460015050L/2
CSCA-QL/4
Table 2. The values employed in the parametric analysis.
ParameterValues
s (mm)100, 200, 400
f/L1/2, 1/4, 1/6, 1/8, 1/10
ds (mm)6, 8, 10, 12
fck (MPa)30, 40, 50
hc (mm)150, 200, 250
tcs (mm)2, 4, 6, 8
fy (MPa)235, 355, 420
CS size (mm)125 × 25, 200 × 55, 300 × 110
Load locationL/2, L/4
Disclaimer/Publisher’s Note: The statements, opinions and data contained in all publications are solely those of the individual author(s) and contributor(s) and not of MDPI and/or the editor(s). MDPI and/or the editor(s) disclaim responsibility for any injury to people or property resulting from any ideas, methods, instructions or products referred to in the content.