Article

Optimization of Energy Consumption and Light Environment for Three-Domain Division Cadmium Telluride Photovoltaic Windows Based on Entropy Weight–TOPSIS

School of Architectural Engineering, Yan’an University, Yan’an 716000, China
*
Author to whom correspondence should be addressed.
Buildings 2025, 15(18), 3296; https://doi.org/10.3390/buildings15183296
Submission received: 24 July 2025 / Revised: 7 September 2025 / Accepted: 9 September 2025 / Published: 12 September 2025
(This article belongs to the Special Issue Advanced Technologies in Building Energy Saving and Carbon Reduction)

Abstract

To address the limitations of traditional cadmium telluride (CdTe) photovoltaic (PV) windows in comprehensively considering overall building energy consumption, indoor lighting comfort, and outdoor visibility, this study proposes a three-domain division CdTe PV window design, which divides the window into three areas, each undertaking different functions. This study utilized the Energy Plus 9.3.0 software and Radiance 1.6.0 software for numerical simulation to explore the impact of different design parameters (such as coverage rate and arrangement mode of PV) of the three-domain division PV windows on building energy consumption and the proportion of indoor effective natural lighting (UDI300lx–2000lx) in single-story office buildings in Yan’an. Additionally, this study employed the entropy weight–TOPSIS method to conduct a comprehensive evaluation of 84 schemes. The results indicate that both the coverage rate and the arrangement mode of PV significantly influence building energy-saving and indoor lighting environment. The energy-saving rate initially increases and then decreases with higher PV coverage, while UDI300lx–2000lx generally exhibits an upward trend and slightly decreases later. The V3-V1 or H3-V1 arrangement mode demonstrates superior energy-saving performance, whereas the H3-V1 or V3-H1 arrangement mode provides better indoor lighting comfort. The evaluation weights for energy-saving rate and effective daylighting are 0.38 and 0.62, respectively. Based on the comprehensive evaluation, the optimal configuration is determined to be V1-90%-V2-10%-H3-90%, achieving an energy-saving rate of 11.1% and a UDI300lx–2000lx value of 56.95%.

1. Introduction

The construction industry accounts for 40% of total global energy consumption, with energy loss from building exterior windows accounting for as much as 50–60% [1,2]. Therefore, building exterior windows have remarkable potential in building energy-saving [3]. As an important component of the building envelope structure, windows exhibit multiple functions [4,5]: (1) reducing the loss of indoor heat to lower the heat load in winter, and increasing the air circulation between indoors and outdoors to reduce the cooling load in summer; (2) increasing the transparency of natural light to reduce lighting energy consumption; and (3) expanding the view to enhance the visual experience. In recent years, PV technology has experienced rapid development both domestically and internationally due to its environmental benefits. In its 14th Five-Year Plan, China emphasized the need to vigorously promote solar PV technology in order to increase the share of non-fossil energy in the overall energy mix. In 2022, China issued the Implementation Plan for Carbon Peak in Urban and Rural Construction, which stipulates that by 2025, at least 50% of the rooftops of newly constructed public buildings and industrial facilities should be equipped with PV systems. Statistical data indicate that China’s installed BIPV capacity reached 306 GW in 2021, with projections suggesting that this figure will rise to 1110 GW by 2025. These policy initiatives have established a solid foundation for the growth of BIPV and signal the likelihood of further regulatory enhancements and refinements aimed at achieving these targets. As the integration of solar PV systems with windows continues to advance, the application of cadmium telluride PV windows is becoming increasingly widespread. Key design parameters such as light transmittance, PV coverage rate, and window-to-wall ratio significantly influence both building energy consumption and the indoor lighting environment. Among these, although high-coverage-rate cadmium telluride PV windows generate greater amounts of electricity, they tend to obstruct indoor daylighting and outdoor visibility, thereby increasing lighting energy demand. Conversely, low-coverage-rate windows mitigate these issues but suffer from inferior thermal insulation performance, leading to reduced indoor thermal comfort, increased heating and cooling loads, and lower electricity generation [6,7]. Higher transmittance allows solar cells to absorb more light. However, higher transmittance is not always preferable, as solar cells cannot absorb light of all wavelengths, such as infrared and violet light [8,9]. Excessively high transmittance thus leads to an increase in heat energy from these non-effective light wavelengths, causing a rise in the temperature of solar cells and thereby reducing their conversion efficiency.
Xu [10] found that PV coverage rate has a significant impact on the energy consumption of semi-transparent cadmium telluride (CdTe) PV facades. The optimal coverage rate can save 13% of total energy consumption compared to the worst-case scenario. This result is mainly related to the room depth, window-to-wall ratio (WWR), and orientation. Wang [11] et al. proposed an approach of integrating cadmium telluride batteries onto double-layer ventilated windows attached to the windows, and investigated its energy-saving effect in three representative cities with high, medium, and low latitudes. As the proportion of PV installations increases, the net energy consumption in all three cities showed a trend of first decreasing and then increasing. The optimal PV coverage rates for the three representative cities, Harbin, Hefei, and Haikou, were 50%, 60%, and 70%, respectively. Sun [12] investigated the impact of design parameters (WWR and light transmittance) of PV windows on building energy efficiency and indoor lighting conditions across various climate zones. The findings indicated that PV windows achieved the highest energy-saving performance in cold regions, whereas the energy-saving rate was lowest in regions characterized by hot summers and cold winters. Furthermore, when the WWR was below 30%, the energy-saving benefits were minimal, suggesting that the application of PV windows may not be advisable under such conditions. A-H [13] conducted experiments and numerical simulations to study the energy-saving potential of CdTe PV in building facades. The results showed that compared with ordinary glass facades, CdTe PV facades could significantly reduce the annual energy consumption of buildings, and the lower the transparency, the more significant the energy-saving effect. Liu [14] conducted a simulation of the indoor light environment of buildings using Radiance and analyzed the effects of four different transparency levels (20%, 30%, 40%, 50%) of CdTe PV windows on the amount and quality of indoor lighting. The results indicated that CdTe PV windows could increase the time proportion of UDI300lx–2000lx, especially for buildings with a large WWR. Wang [15] proposed a CdTe double-skin ventilated (CdTe-DSV) window based on the traditional single-layer PV window, and the results indicated that the CdTe-DSV window had better thermal insulation performance, with the thermal comfort value of PMV reaching up to 90%. Alrashidi [16] conducted a study on the total heat transfer coefficient and solar heat gain of ordinary glass windows and CdTe PV windows, and found that the solar heat gain of CdTe PV windows was 73% lower than that of single-layer glass windows. Guo [17] compared the heat load, lighting electricity consumption and photovoltaic power generation of a single-layer PV glass system, double-layer PV glass system, and natural ventilation PV glass system in Shanghai office buildings. Taking ordinary glass windows as the reference benchmark, the energy-saving rate of the single-layer PV glass system was 3.6%, while that of the double-layer PV glass system and the natural ventilation PV glass system was 4.8% and 6.7%, respectively. Li [6] et al. investigated the impact of vertically and horizontally arranged semi-transparent cadmium telluride solar cells on visual characteristics through a combination of experiments and numerical simulations, and proposed a visual model for optimizing the cell swelling width (CSW) and coverage rate (CCR). The results showed that (1) the vertical layout has a lower glare probability than the horizontal layout, and (2) the optimal CCR is determined by CSW, viewing distance, latitude, and climate zone, and using a larger CCR in high-latitude areas can reduce glare. Ghasaban [18] conducted a study on the influence of WWR and transmittance on visual comfort in four cities: Helsinki, Toronto, Riyadh, and Tetisab. The results indicated that both WWR and PV transmittance have an impact on indoor lighting, and the optimal transmittance varies among cities with different climates. Liu [14] investigated the performance of CdTe PV windows under different WWR from the perspectives of light quality and quantity, and found that the WWR affects the selection of PV windows. When the WWR is small, high-transmittance CdTe PV windows can improve the uniformity of light; conversely, CdTe PV windows can increase the useful illuminance (UDI100–2000lx) and ideal illuminance (UDI500–2000lx), and reduce CCT, while maintaining excellent color rendering (Ra > 95). Peng [19] proposed a novel ventilation photovoltaic double-skin façade (PV-DSF) and demonstrated that the SHGC of PV-DSF is significantly lower than that of single-layer PV windows. This study also explored the impact of the air gap width and ventilation methods of PV-DSF on building energy performance, finding that the optimal air gap range for PV-DSF is between 400 mm and 600 mm. Moreover, compared with non-ventilated PV-DSF, the naturally ventilated PV-DSF can reduce energy consumption by approximately 35%.
Most of the existing studies have focused on the energy consumption or light environment optimization of the entire CdTe PV window, while there are very few studies that comprehensively consider building lighting, energy-saving rate, and outdoor visual effect. Therefore, based on Refs. [20,21], this study proposed a three-domain division CdTe PV window that takes into account the comprehensive energy consumption of the building, indoor lighting, and outdoor visual effects, and can also meet the height requirements of most people. The CdTe PV window is divided into three different functional areas, and the influence of different factors (coverage rate and arrangement mode of PV) on the building is comprehensively considered to achieve a relative balance between building energy consumption, indoor light comfort, and outdoor visibility. The main innovations of this study are as follows. (1) Compared with most existing studies that apply CdTe solar cells only on the entire window surface, the three-domain division PV window proposed in this study takes into account multiple requirements from multiple aspects. (2) This study set the energy-saving rate and indoor light comfort as the optimization objectives, and used the entropy weight–TOPSIS method for comprehensive evaluation, providing reference for the selection of PV window schemes in cold regions (Yan’an).

2. Building Model

This study focuses on single-story office buildings in Yan’an, a cold region. Firstly, the modeling was completed using SketchUp 2019 software, and then the model parameters were set according to the climate conditions of the region.

2.1. Modeling Establishment

According to the average temperature of the coldest and hottest months, as well as the cumulative daily average temperature days, China is divided into five climate zones: hot summer and cold winter climate, hot summer and warm winter climate, mild climate, cold climate, and freezing climate. This study focuses on single story office buildings in Yan’an, a cold climate region. Yan’an is located at 36.3° N latitude and 109.48° E longitude, where the temperature shows significant seasonal variations. This area experiences cold winters, with the lowest temperature reaching −20 °C, and the average summer temperature is around 34 °C. The region is rich in solar energy resources, which belong to category 2. The solar radiation is the highest at 281.72 W/m2 in summer and 190.35 W/m2 in winter. Based on the above information, a reference building model of the research object was constructed using SketchUp, as shown in Figure 1. This office building is arranged facing south, with dimensions of 6 m (length) × 8 m (width) × 3.3 m (height) and a floor area of 48 m2. A 6 mm-thick conventional glass window is installed on the south-facing façade of the room. The window measures 2.2 m in height and 5.6 m in width, with a sill height of 0.4 m and a WWR of 62%. This study focuses specifically on single-story office buildings and does not account for the full diversity of office building types in Yan’an. Consequently, the findings are applicable primarily to small and medium-sized single-story office buildings in the vicinity of Yan’an that are free from surrounding obstructions, and may not be generalizable to multi-story or high-rise buildings.

2.2. Parameter Settings

The air conditioning system in this study adopts an ideal air conditioning system, meaning that any cooling or heating demands in the room can be met [22]. Based on the investigation of the air conditioning operation time of office buildings in Yan’an area, the operating time of the air conditioning system was determined as 8:00–18:00 every day. However, during the summer operation period, it was from 31 May to 31 August, and during the winter operation period, it was from 1 January to 28 February and from 1 November to 31 December. According to the energy-saving regulations and office design standards [23,24], the settings of parameters such as lighting power density, power density of electrical equipment, per capita occupied building area, and hourly ventilation frequency are shown in Table 1. The cooling temperature in summer is set at 26 °C; that is, the air conditioning system is turned on when the indoor temperature is higher than 26 °C, otherwise it is turned off. The heating temperature in winter is set at 18 °C; that is, the HVAC system is turned on when the indoor temperature is lower than 18 °C, otherwise it is turned off. The calculation of lighting energy consumption adopts the step adjustment method in Energy Plus. The critical value of illuminance is set at 300 lx, and the number of steps is 1. That means that when the illuminance at the indoor lighting point is less than 300 lx, the lamps will be turned on, otherwise they will be turned off. One lighting point is set in the research object room, and the sensor is placed in the center of the room, 0.75 m above the ground.

3. Research Methods

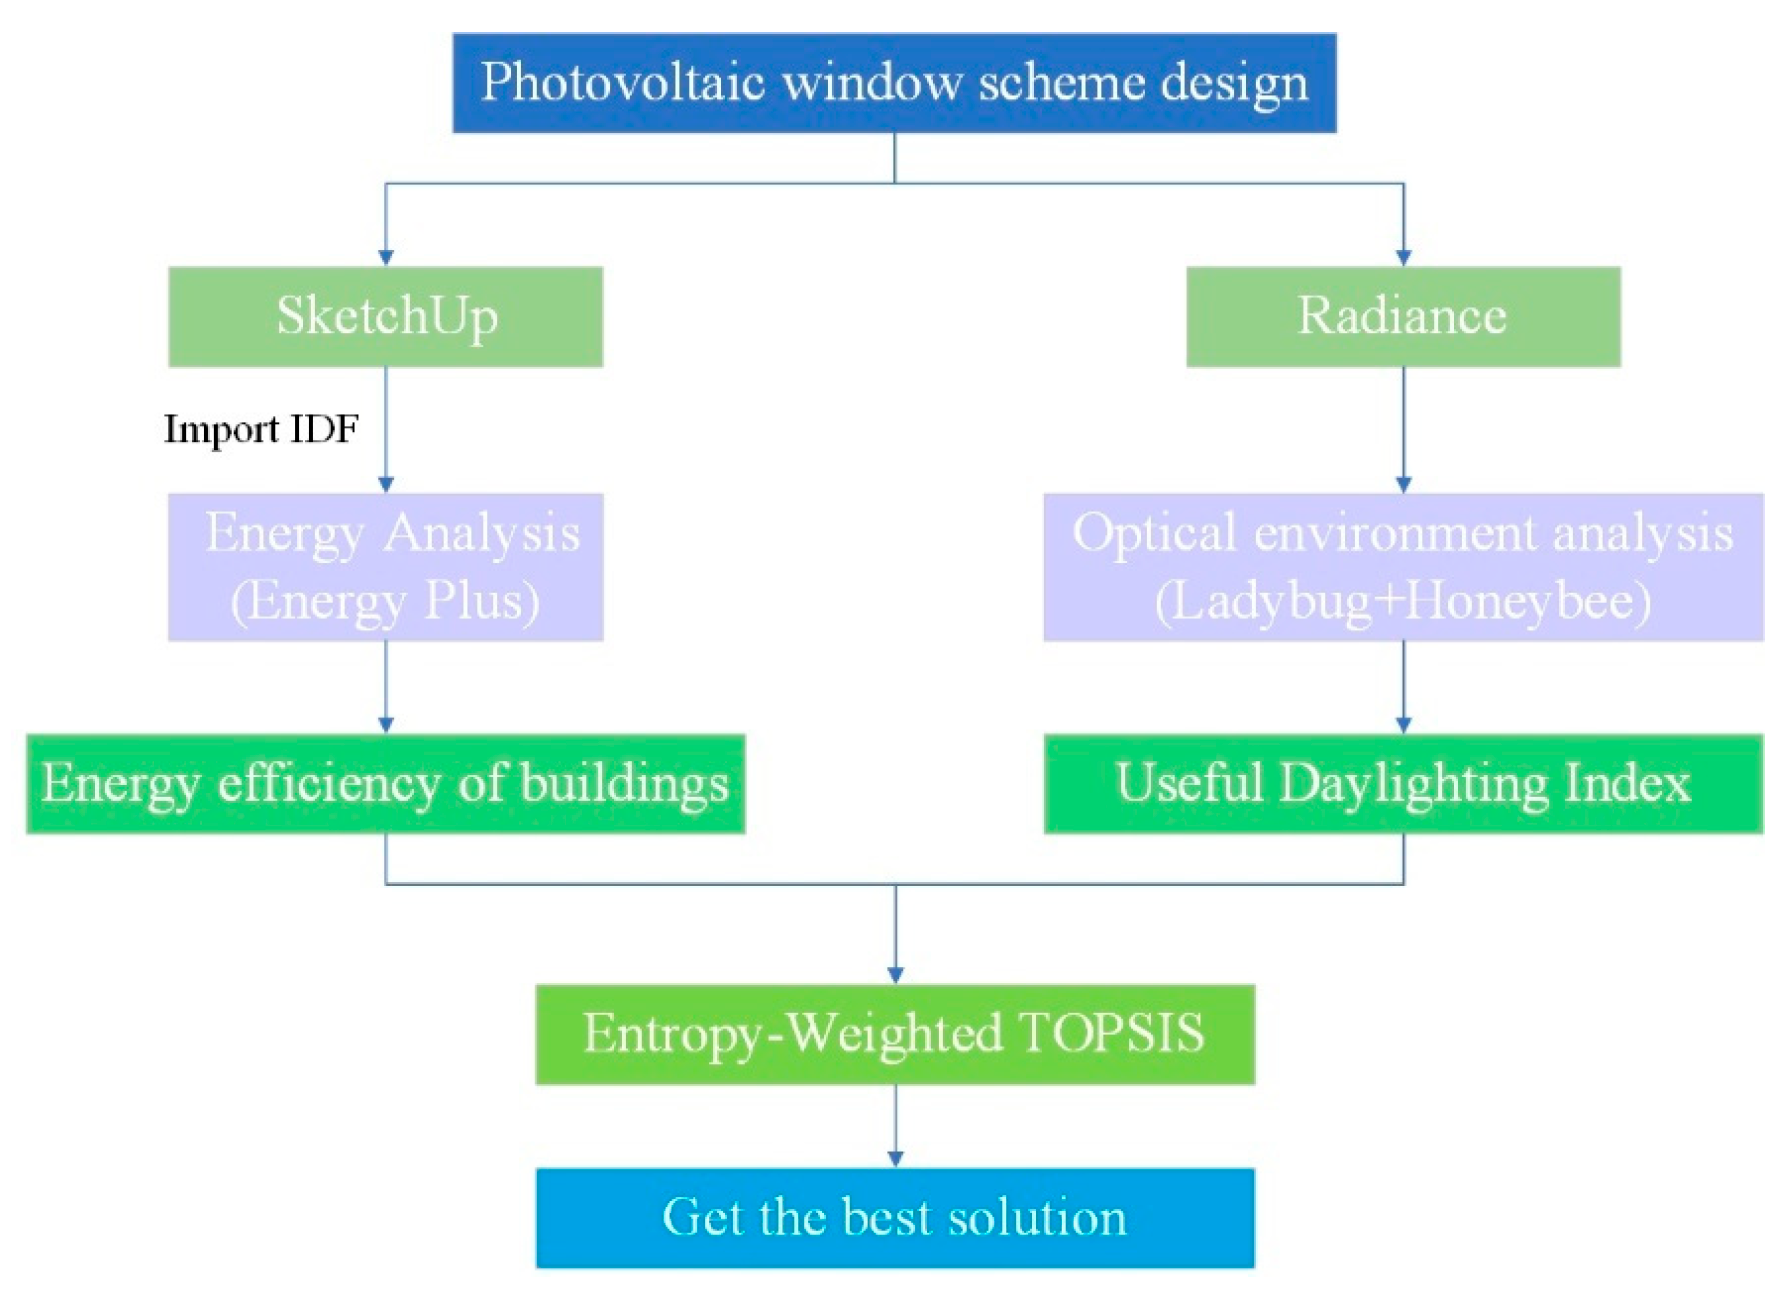
The research mainly consists of three parts: scheme design, building energy consumption and light environment simulation, and comprehensive evaluation. The detailed process is shown in Figure 2. Based on the shortcomings of traditional CdTe PV windows, this study proposes a three-domain division CdTe PV window that meets the height requirements of most people, and designs 84 schemes to analyze the influence of different design parameters (coverage rate and arrangement mode) of CdTe PV windows on building comprehensive energy consumption and indoor light comfort. This content has been introduced in Section 3.1 of the manuscript. The building energy consumption, indoor light environment simulation software, and evaluation indicators, as well as various simulation schemes of the three-domain division CdTe PV window, are clarified in Section 3.2 and Section 3.3. Section 3.4 focuses on describing the principle and steps of the comprehensive entropy weight–TOPSIS evaluation method, aiming to comprehensively evaluate the energy consumption and daylight performance of different schemes of PV windows and thereby obtain the optimal scheme.

3.1. Design Schemes of Three-Domain Division CdTe PV Windows

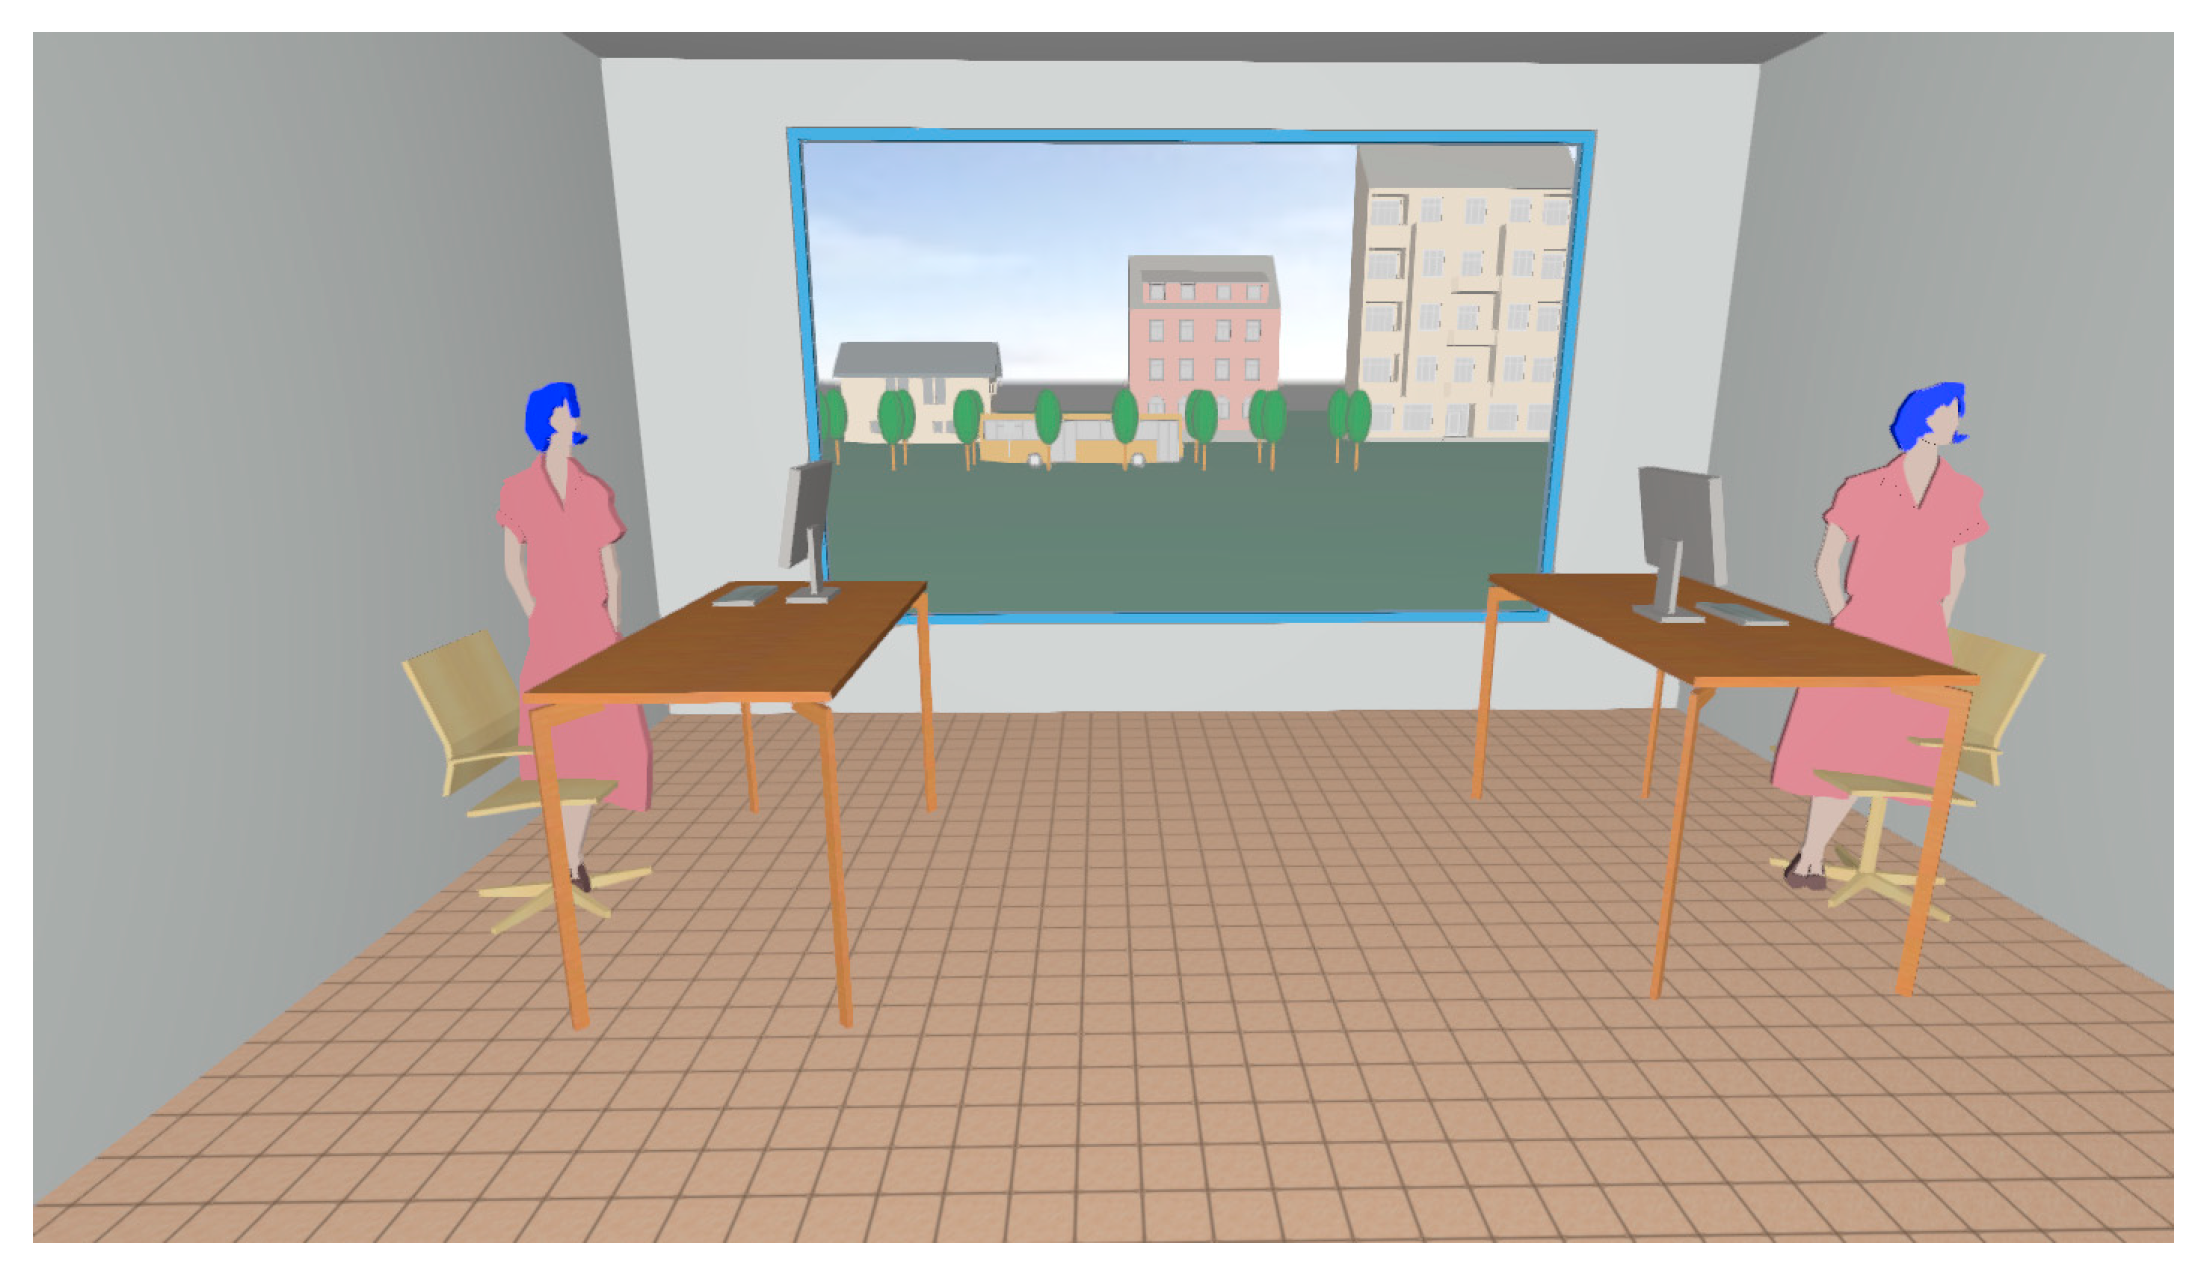
PV windows can convert solar energy into electricity to meet the power demands of buildings. In daily office environments, windows play a crucial role in providing sufficient light to the work surface to maintain efficient work efficiency, while also offering a broad view that helps alleviate stress and visual fatigue for staff, as shown in Figure 3. However, most current PV windows are applied to the entire window, achieving different coverage rates by adjusting the layout between the opaque battery components and the transparent glass. The alternating arrangement of transparent and opaque areas on the window causes uneven light distribution to some extent [25,26,27] and also hinders the indoor view, preventing people from enjoying an unobstructed outdoor landscape.
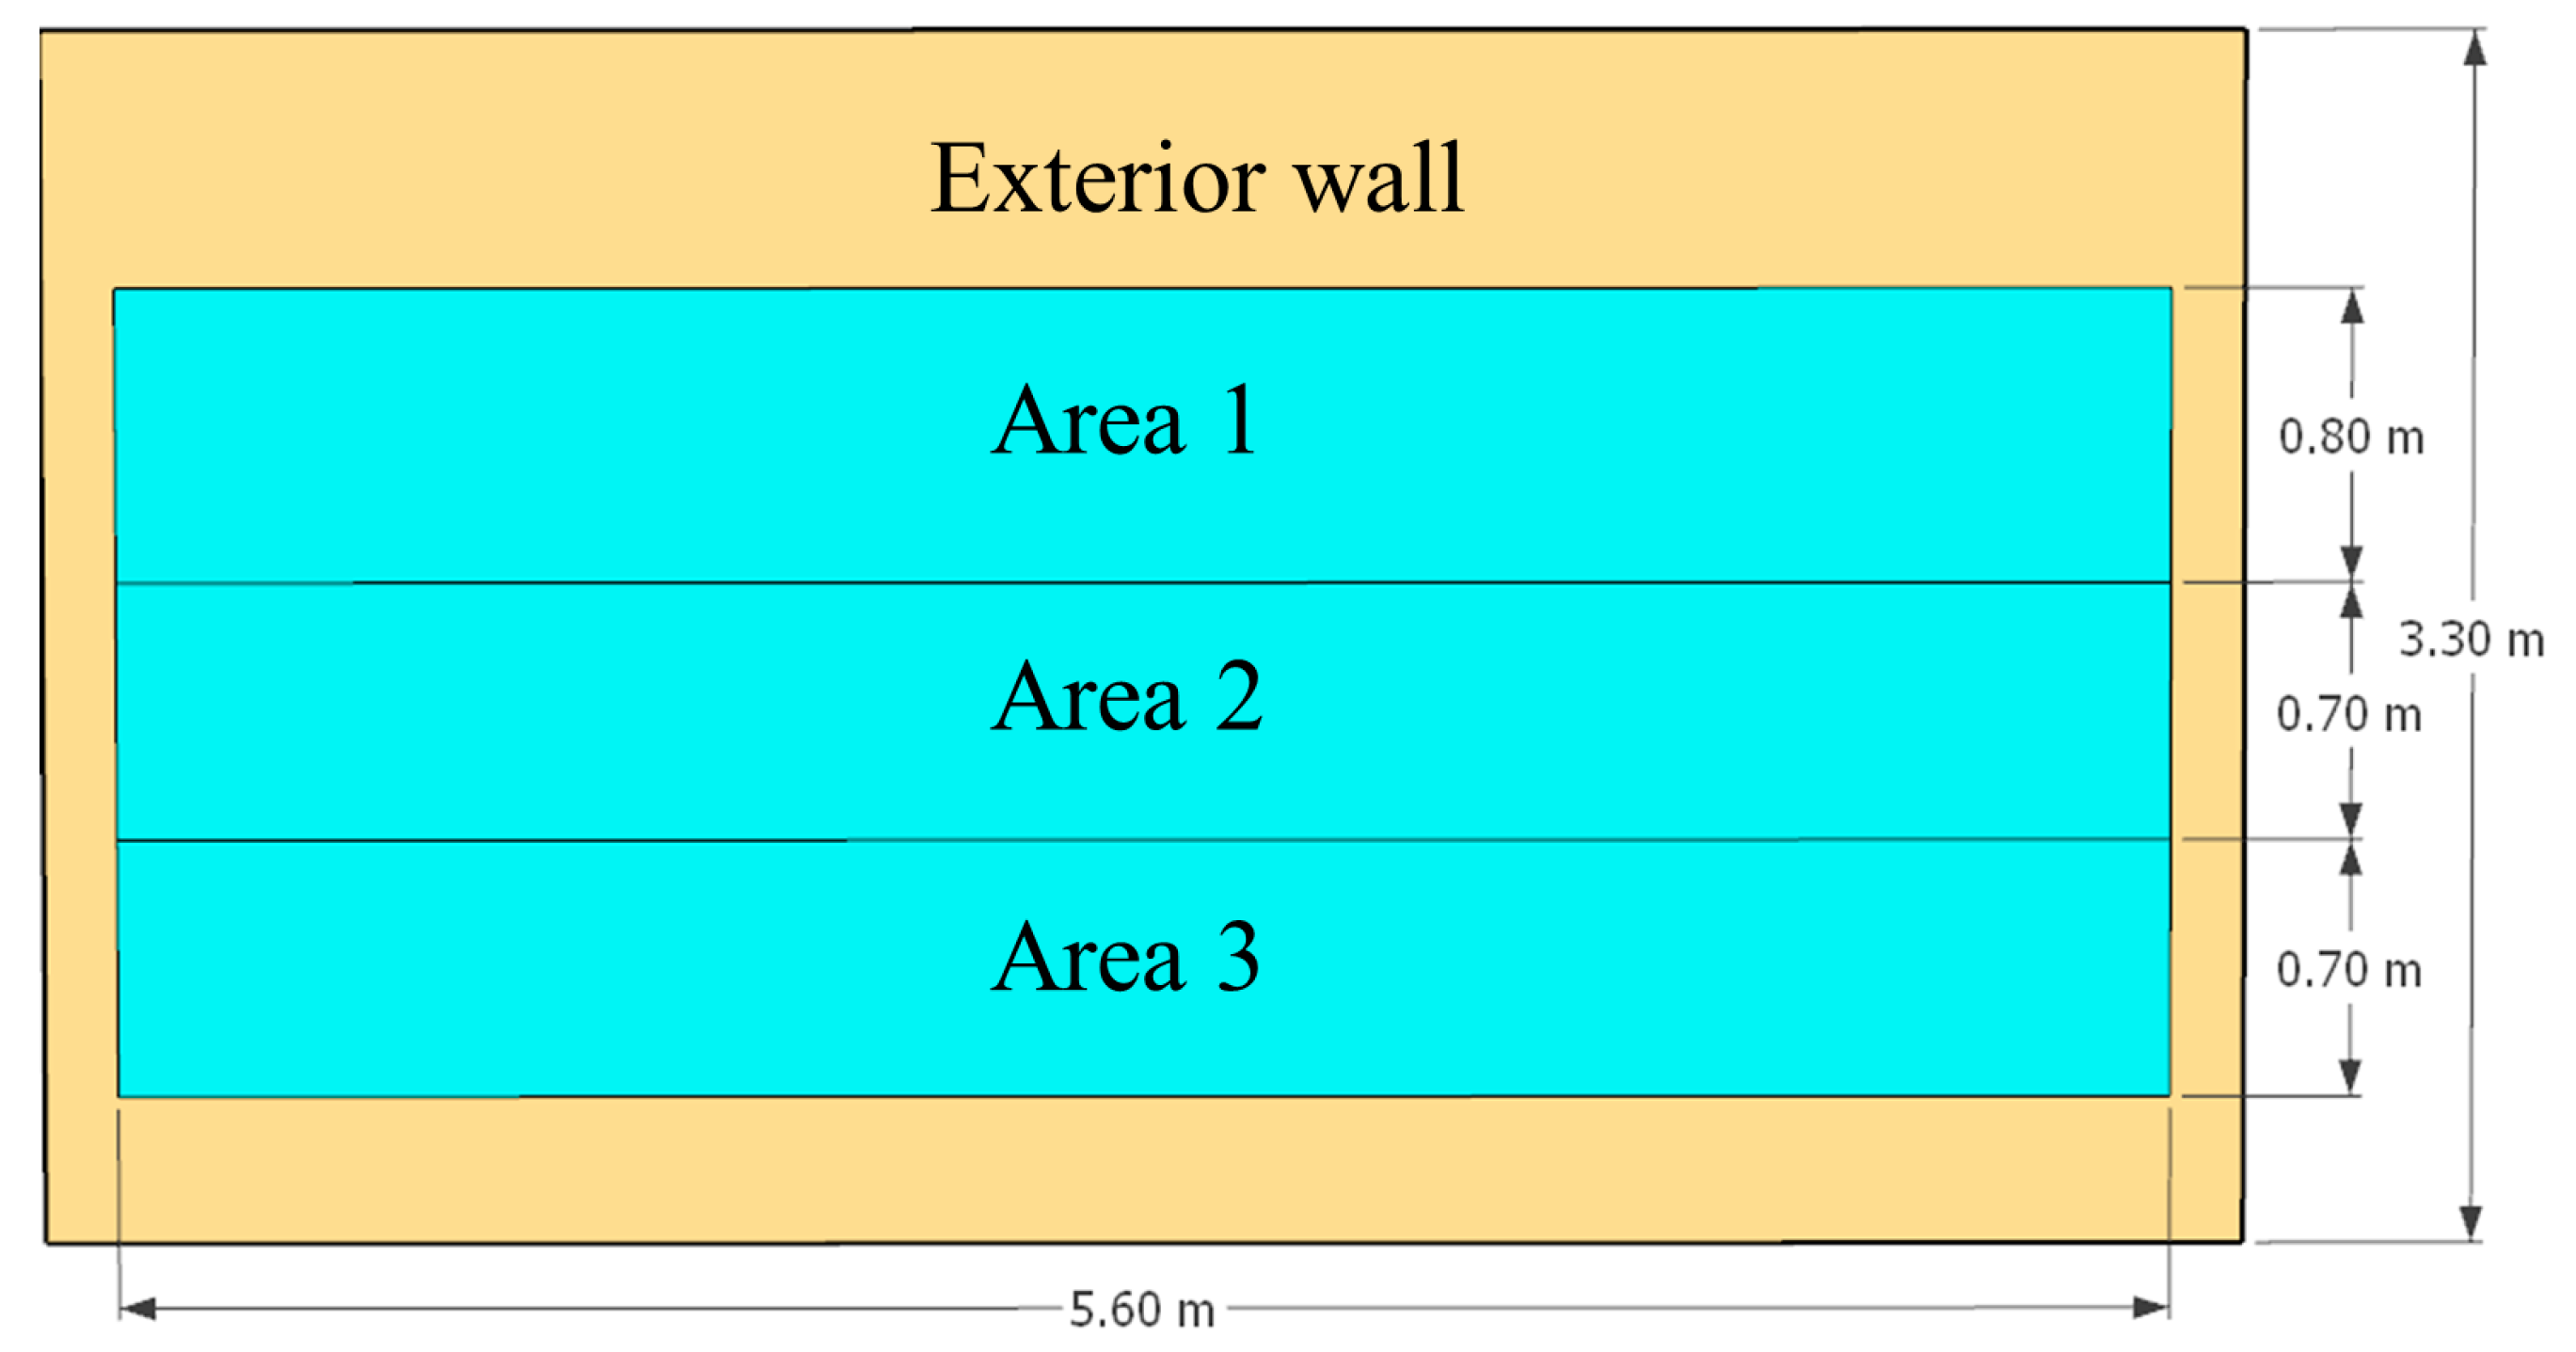
In view of this, based on the traditional CdTe PV window, this study divided the window into three areas—Area 1, Area 2, and Area 3, enabling each area to perform different functions and meet various needs. Figure 4 shows the differences between the traditional photovoltaic window and the three-domain division photovoltaic window. Among them, the main functions of Area 1 and Area 3 are to carry out PV power generation and undertake a small portion of lighting tasks; Area 2 focuses on meeting the indoor visual landscape and lighting requirements and also undertakes a small portion of the power generation responsibility. To meet the needs of most people of various heights, the upper and lower parts of Area 2 are 1.1 m–1.8 m away from the floor. The design dimensions of the three-domain division CdTe PV window are shown in Figure 5.
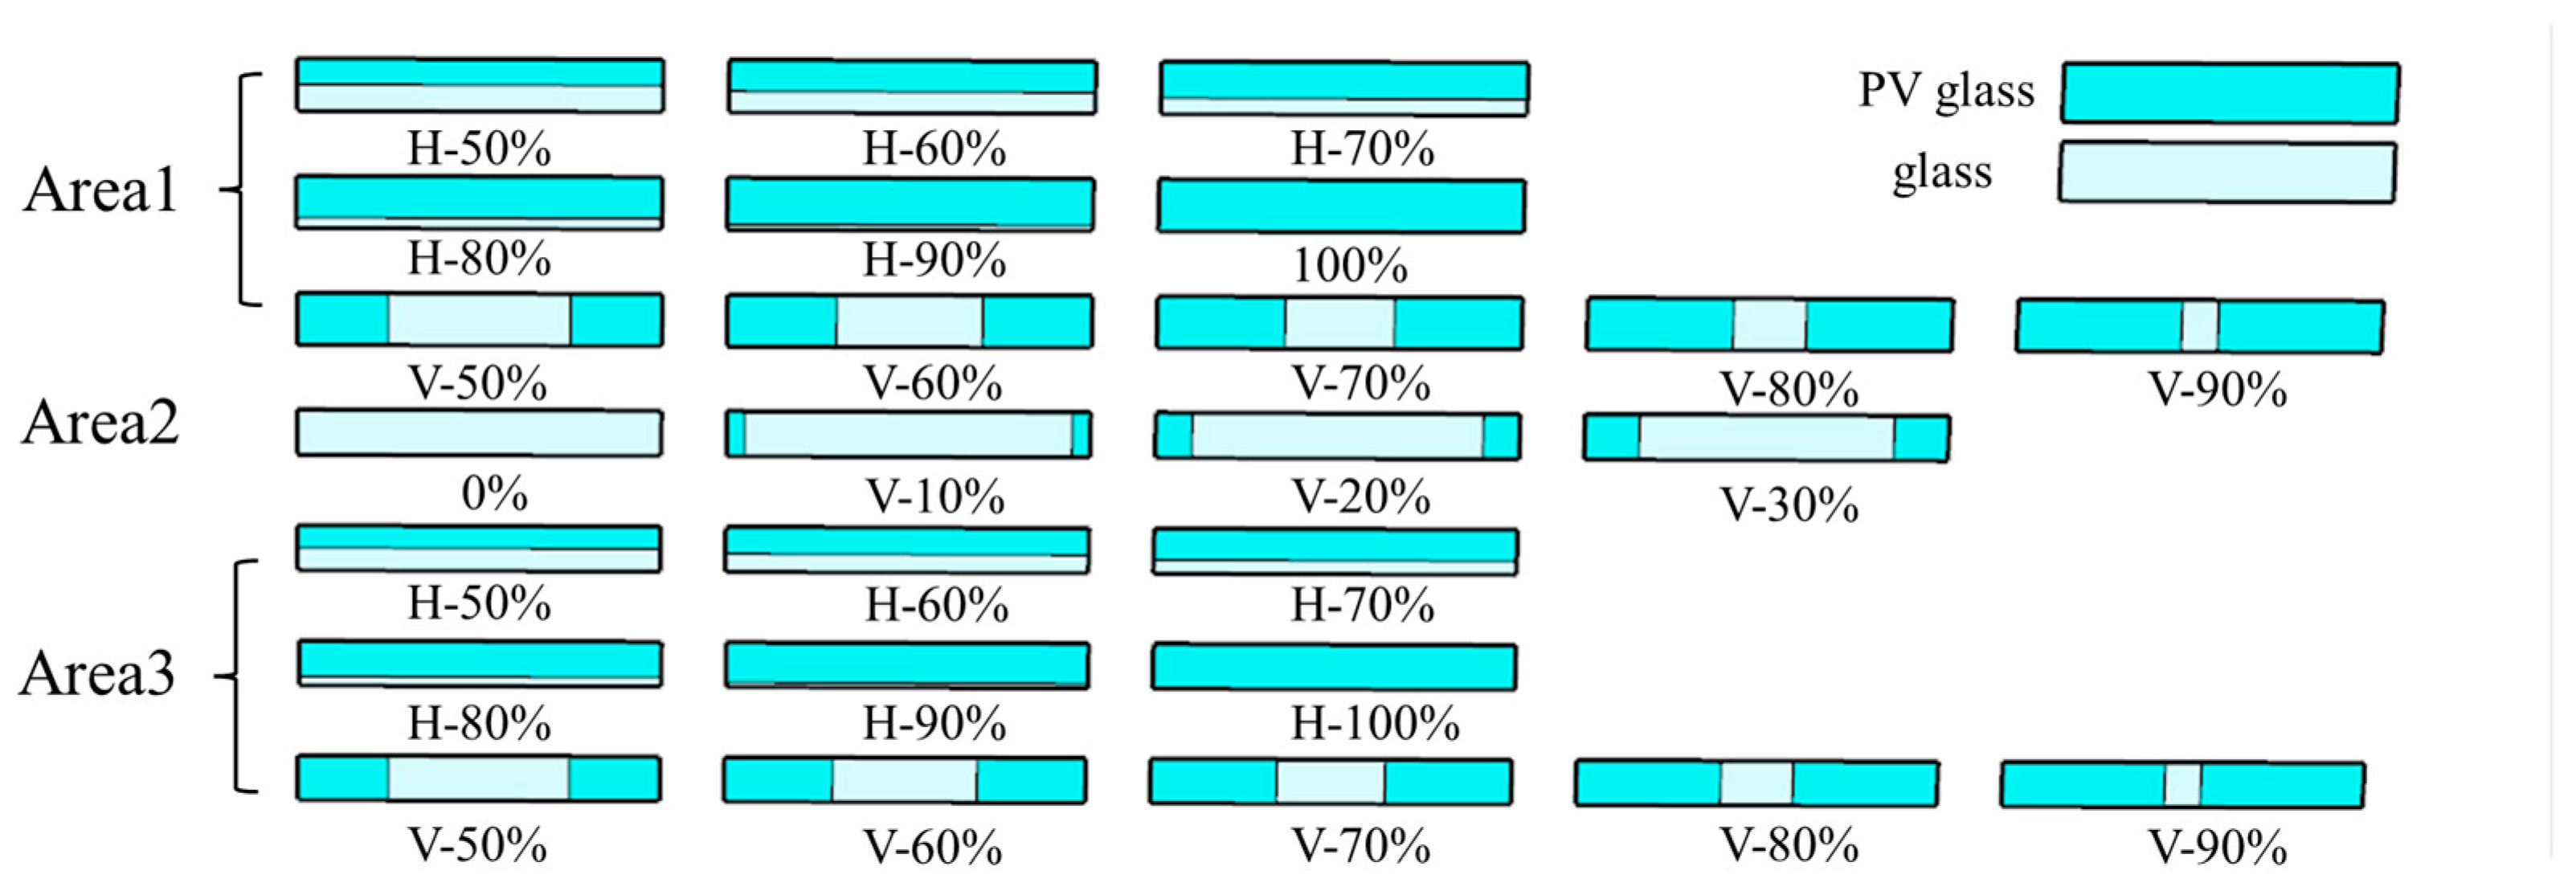
Sun [12] proposed the combined application of ordinary transparent glass and PV glass. Not only does this combination enhance the aesthetic value through the differences in color and texture between them, but also the use of ordinary transparent glass provides better visual transparency. In this study, this approach was adopted in each region. The parameters of ordinary glass and PV glass are shown in Table 2 [28,29,30]. Considering the main functions of each area and referring to relevant literature [20], a 50–100% PV coverage rate was used in Area 1 and Area 3, while Area 2 used a 0–30% PV coverage rate, which refers to the ratio of the area of PV modules to the total area of the region. A coverage of 100% means that CdTe PV is installed in this area, while 0% coverage means that this area is all ordinary glass and no PV modules are used. This study also considers the impact of the layout method of solar cells (i.e., horizontal and vertical) on the power generation of PV systems and the indoor lighting environment. To ensure the continuity of the visual effect, the horizontal PV panels in Area 1 are arranged from top to bottom, while the horizontal PV panels in Area 3 are arranged in the opposite direction, from bottom to top. The vertical PV panels in both areas are arranged following the principle of from both sides to the middle. In Area 2, only the vertical arrangement of the PV panels is considered. As shown in Figure 6, this study has proposed a total of 84 schemes. To simplify the expression, H and V are used to represent the horizontal and vertical layouts of PV panels, respectively. For example, H3-50%-V2-20%-V1-70% represents the horizontal layout of PV panels in Area 3, with a coverage rate of 50%; the vertical layout of PV panels in Area 2, with a coverage rate of 20%; and the vertical layout of PV panels in Area 1, with a coverage rate of 70%.

3.2. Simulation Software

To comprehensively evaluate the overall performance of each scheme, this study conducted simulations of building energy consumption and indoor lighting environment using different software. The specific details of the software are as follows.

3.2.1. Energy Consumption Simulation Software

The currently widely used energy consumption simulation software includes Dest 3.0, DesignBuilder 7.3.1.003, Energy Plus 9.3.0, and TRNSYS 18.0. In this study, the Energy Plus software was selected to simulate the energy consumption of building air conditioning, lighting, and PV power generation. Energy Plus load calculation adopts a thermal balance model, which obtains the thermal state of the hot zone by solving the thermal balance equations of indoor air, interior and exterior walls, roofs, and floors, making the simulation results more accurate and reliable. The lighting energy consumption was calculated using the stepwise method, as mentioned before. Energy Plus has a highly accurate and comprehensive PV power generation module compared to other energy consumption software, and it offers three power generation calculation models: Simply model, Equivalent One-Diode model, and Sandia model. In this study, the Simply model was used for the calculations. The core calculation logic of the Simple model is to output the power generation under different PV coverage rates based on solar radiation and component conversion efficiency. Therefore, the core parameter of this model is the component conversion efficiency, and the component conversion efficiency selected in this study is 14%. The Simple model is easy to operate and has a faster calculation speed than the other two models while ensuring computational accuracy, but it also has certain limitations. Specifically, the power generation efficiency of its components is a fixed value, without taking into account the dynamic impact of various environmental factors on the efficiency. Moreover, the circuit connection is assumed to be in an ideal state, without considering the power loss in series/parallel circuits.

3.2.2. Light Environment Simulation Software

Radiance 1.6.0 is software based on the ray-tracing algorithm in reverse direction, and its simulation accuracy has been verified through multiple studies [31,32]. First, the model needs to be created using the Rhino 7 software, and then the indoor dynamic daylighting simulation is conducted using Grasshopper–Honeybee. In this study, Annual Daylight is used as the core battery to calculate UDI300lx–2000lx. The height from the light source to the ground is set at 0.75 m, and it is divided into 192 small squares of 0.5 m × 0.5 m as the light test points. The calculation accuracy is set as medium.

3.3. Evaluation Indicators

To scientifically quantify the building energy-saving performance and indoor lighting performance of different schemes, this study selects the building energy-saving rate as the evaluation index for building energy conservation and clearly defines the effective natural lighting ratio (UDI300lx–2000lx) as the evaluation index for light comfort.

3.3.1. Energy Consumption

This study uses Energy Plus to calculate the energy consumption of buildings, which specifically includes winter heating, summer cooling, and indoor lighting. The building energy efficiency rate, as the ratio between the benchmark building energy consumption and the actual building energy consumption, is an important indicator for evaluating the energy-saving effect of the building. Therefore, in this study, the building energy efficiency rate is used as the evaluation criterion for the building’s energy-saving effect. The specific calculation formula is as follows [33]:
E = E 1 E 2 E 1 × 100 %
E1: Baseline building energy consumption, which refers to the energy consumption of the building without any energy-saving measures, kWh;
E2: Actual building energy consumption, which refers to the actual energy consumption of the building after implementing energy-saving measures, kWh.

3.3.2. Light Comfort

Previous studies mainly evaluated the quality of indoor lighting environment in buildings from the following four aspects: daylight quantity, daylight distribution, glare, and daylight quality [34]. The evaluation indicators for daylight quantity mainly include illuminance, daylight coefficient, and the proportion of effective natural lighting; the evaluation indicators for daylight distribution mainly include luminance uniformity and illuminance uniformity; the evaluation of glare mainly includes luminance, luminance ratio, effective illuminance ratio, and the probability of daylight glare; and the evaluation indicators for light quality mainly include color rendering, color temperature, etc. This study takes office buildings as an example, and the quality of indoor lighting environment significantly affects work quality. For instance, dim light will affect vision and cause excessive eye fatigue, while excessive light will stimulate the eyes and make it difficult to concentrate. Therefore, this study selects the effective natural lighting proportion UDI300lx–2000lx, which refers to the time proportion of each point in the space having illuminance within the range of 300 lx to 2000 lx as the evaluation index for indoor light comfort.

3.4. Comprehensive Entropy Weight–TOPSIS Evaluation

The comprehensive evaluation methods commonly used in previous studies include the following three: (1) the entropy weight–TOPSIS method, (2) the Analytic Hierarchy Process (AHP), and (3) the Multi-criteria Compromise Solution Ranking Method (VIKOR). Among them, the entropy weight–TOPSIS method allocates weights to the data based on the degree of dispersion of the original data, and calculates the Euclidean distance of different schemes to obtain the ranking of the schemes. This method is free from the interference of subjective factors, takes into account the objectivity of the weights and the scientificity of the scheme ranking, and has high accuracy in the calculation results. The AHP method decomposes complex problems into three levels—the target layer, the criterion layer, and the solution layer—and determines the weights of indicators through expert subjective judgment. This method heavily relies on experts’ subjective judgment and experience, so the results may have significant deviations. The VIKOR method is a compromise ranking method, whose core principle is to rank decision-making solutions based on maximizing group utility (S) and minimizing individual regret (R). The compromise coefficient (V) is mainly determined based on the subjective preferences of decision-makers. If the preferences of the decision-makers vary significantly, it may lead to deviations in the results. Therefore, in order to reduce the deviation in results caused by subjective factors, this study adopts the entropy weight–TOPSIS evaluation method. That is, the entropy weight method is used to determine the weights of each indicator, and the Technique for Order Preference by Similarity to Ideal Solution (TOPSIS) is used for comprehensive evaluation [35]. Suppose there are m evaluation objects and n evaluation indicators.
Due to the different dimensions of various indicators, in order to ensure the comparability of the results, it is necessary to first standardize the original data so that the data of each indicator are on the same scale (0, 1). The common methods for data processing include min–max standardization, z-score standardization, the linear proportion method, etc. In this study, the min–max standardization method was selected. An indicator with a higher value being better is called a positive indicator, such as comfort level, while an indicator with a lower value being better is called a negative indicator, such as building energy consumption. The standardized calculation formulas for positive indicators and negative indicators are as follows [36]:
Y i j = X i j min i X i j max i X i j min i X i j ( i = 1,2 m ; j = 1,2 n )
Y i j = m a x i ( X i j ) X i j m a x i ( X i j ) m i n i ( X i j ) ( i = 1,2 m ; j = 1,2 n )
Xij: The original data of the j-th indicator in the i-th evaluation object;
Yij: The standard data of the j-th indicator in the i-th evaluation object.
After the original data are standardized, the entropy method is used to determine the weights of each evaluation indicator. The steps are as follows [37,38]:
(1)
Calculate the proportion of the j-th indicator in the i-th evaluation object:
P i j = Y i j i = 1 m Y i j
(2)
Calculate the entropy value ej of the j-th evaluation indicator:
e j = 1 l n m i = 1 m P i j l n P i j
A smaller entropy value indicates a greater degree of variation in indicator values and provides more information. Therefore, it should be given a higher weight in the comprehensive assessment. On the contrary, a higher entropy value indicates that the difference in the indicator values is smaller, and the provided information is also less. Therefore, in the comprehensive assessment, it should be assigned a lower weight.
(3)
Calculate the coefficient of variation in the i-th evaluation indicator:
g j = 1 e j
(4)
Calculate the weight of the j-th evaluation indicator:
w j = g j j = 1 n g j
Subsequently, TOPSIS is applied for comprehensive evaluation, with the following steps:
(5)
Construct a weighted normalization matrix Z:
Z = ( Y i j ) m n × w j
Z = z 11 z 1 n z m 1 z m n
(6)
Determine the positive and negative ideal solutions zj+ and zj:
z j + = m a x ( z 1 j , z 2 j , z m j , )
z j = m i n ( z 1 j , z 2 j , z m j , )
(7)
Calculate the Euclidean distance between the positive and negative ideal solutions Di+ and Di:
D i + = j = 1 n ( z i j z j + ) 2
D i = j = 1 n ( z i j z j ) 2
(8)
Comprehensive evaluation:
C i = D i D i + D i +
A larger Ci indicates a better evaluation result, and vice versa. By comparing the Ci values of different schemes, the maximum and minimum values obtained correspond to the optimal scheme and the worst scheme, respectively.

4. Results and Analysis

Through numerical simulation, this study obtained the comprehensive energy consumption and the proportion of effective natural lighting of buildings under different PV coverage rates and PV arrangement modes. Detailed analyses are presented as follows.

4.1. Energy Consumption Analysis

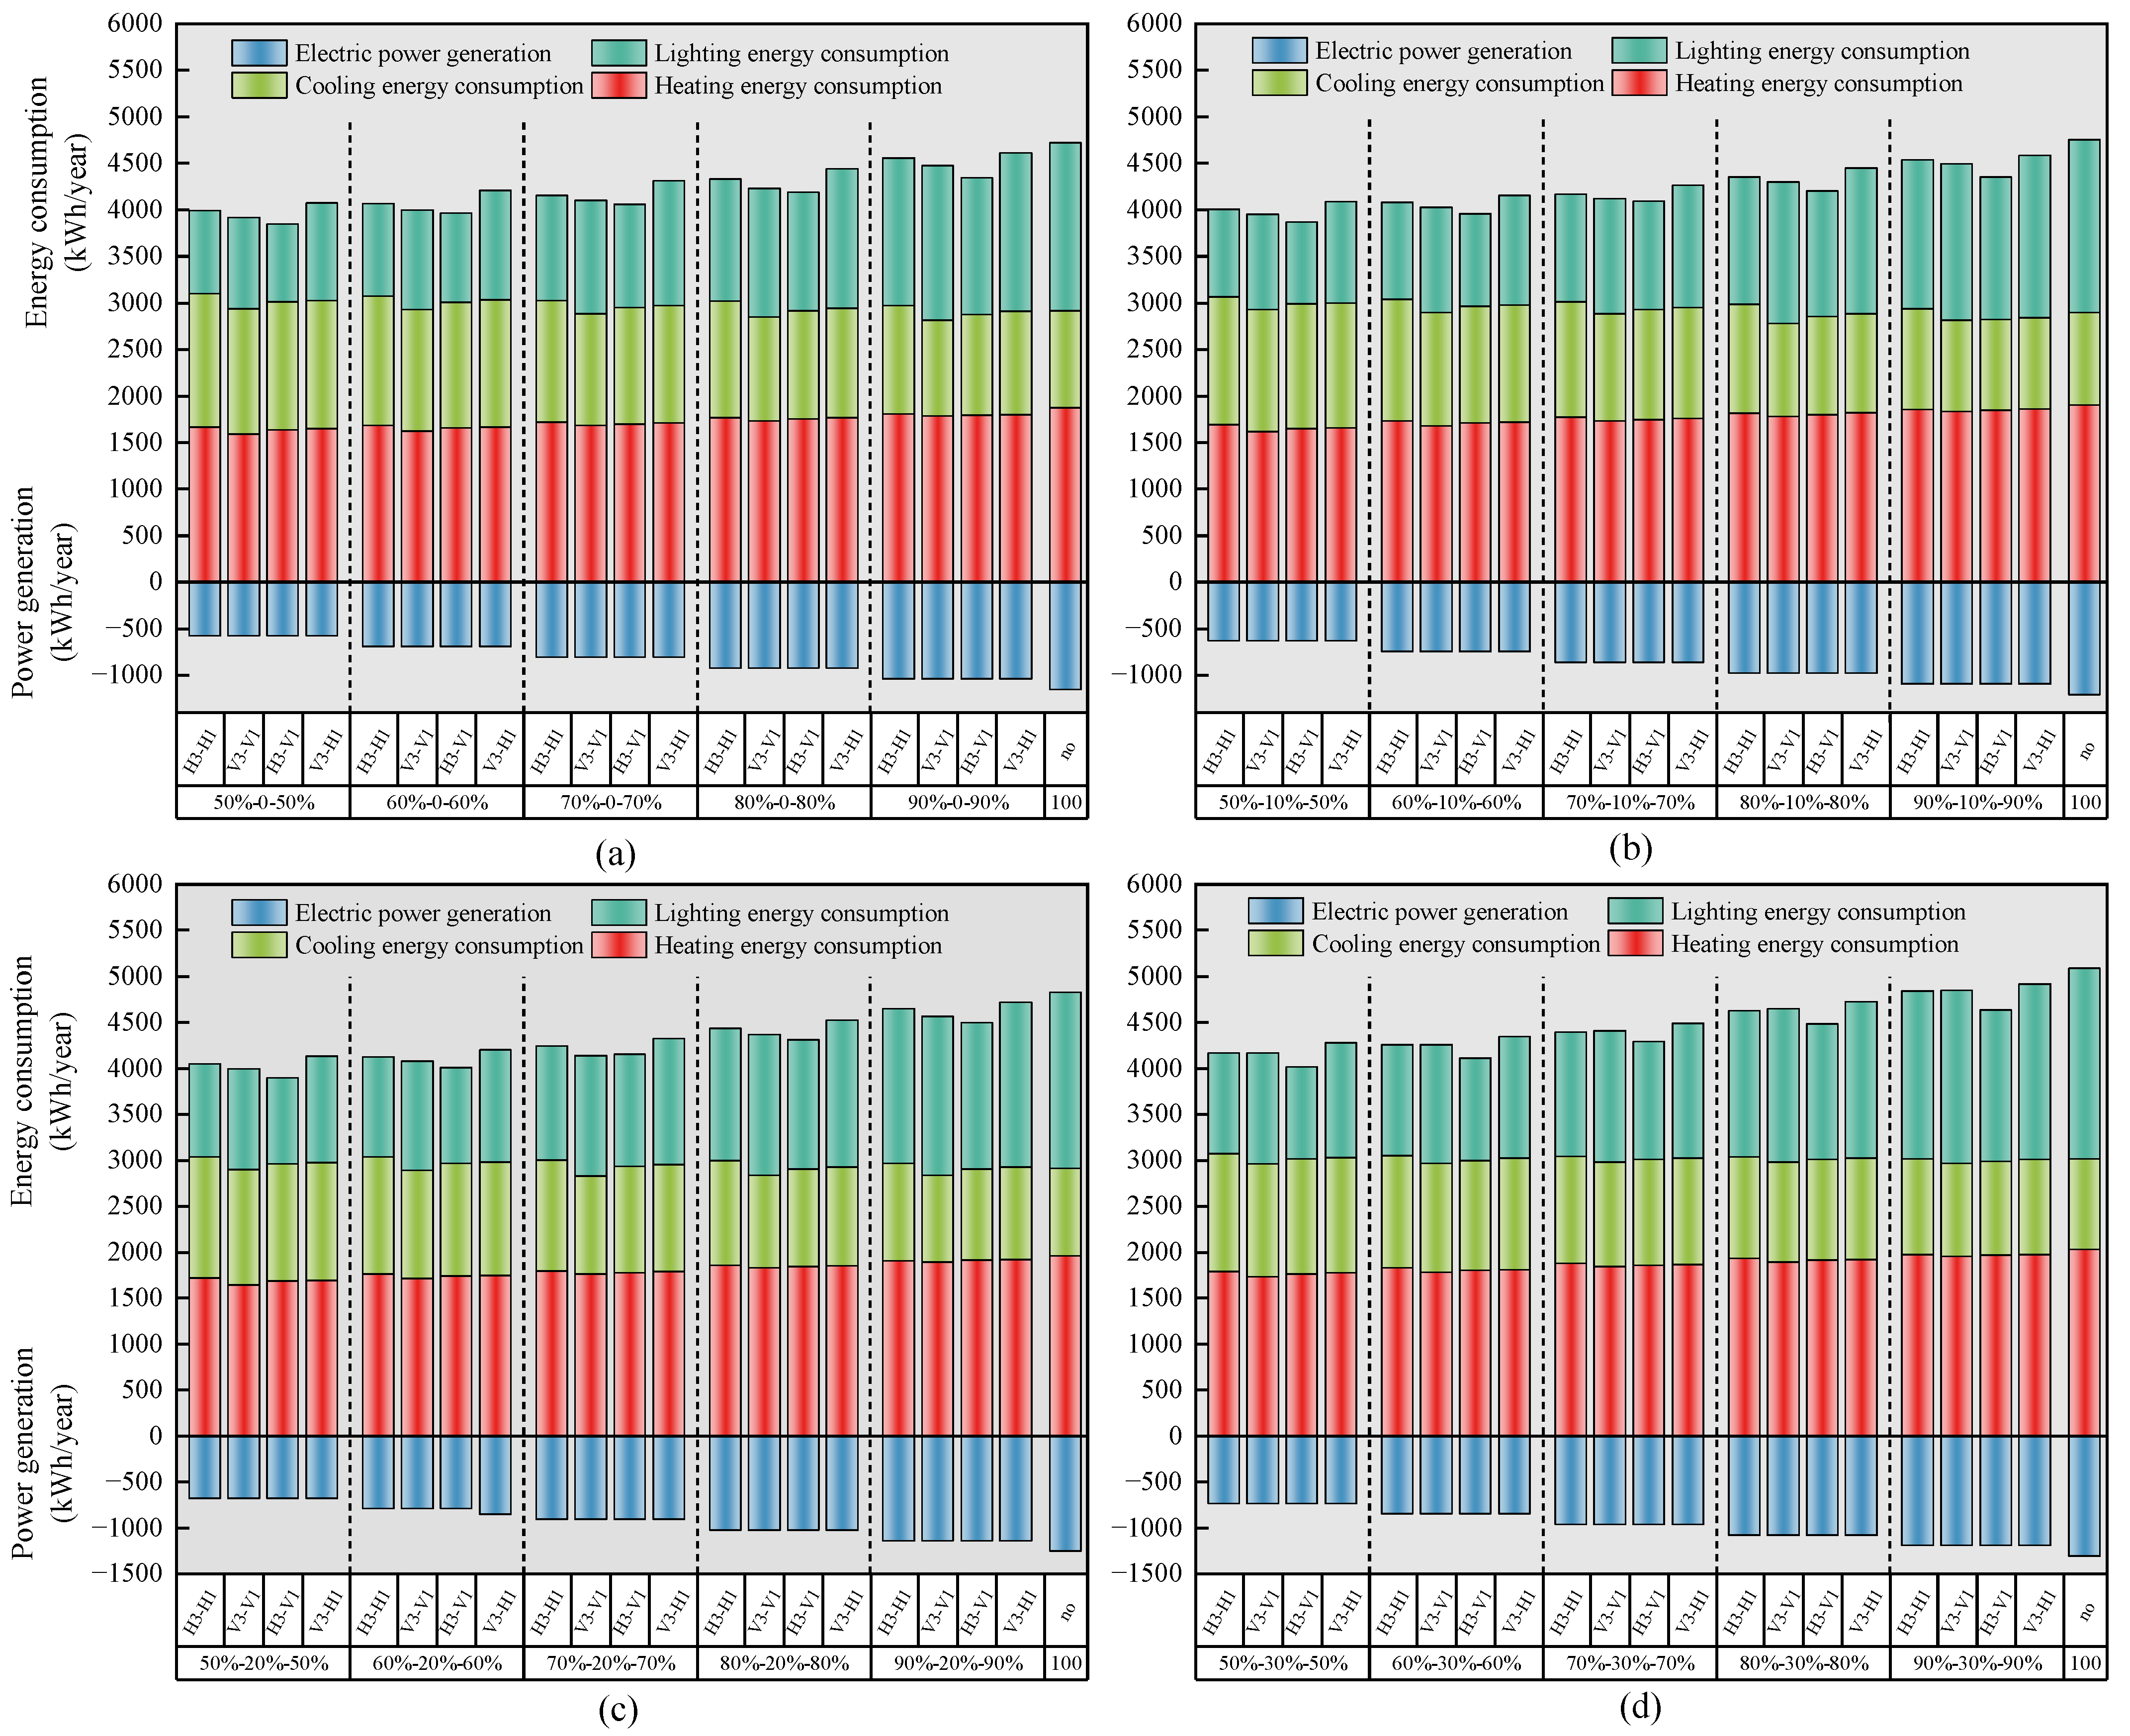
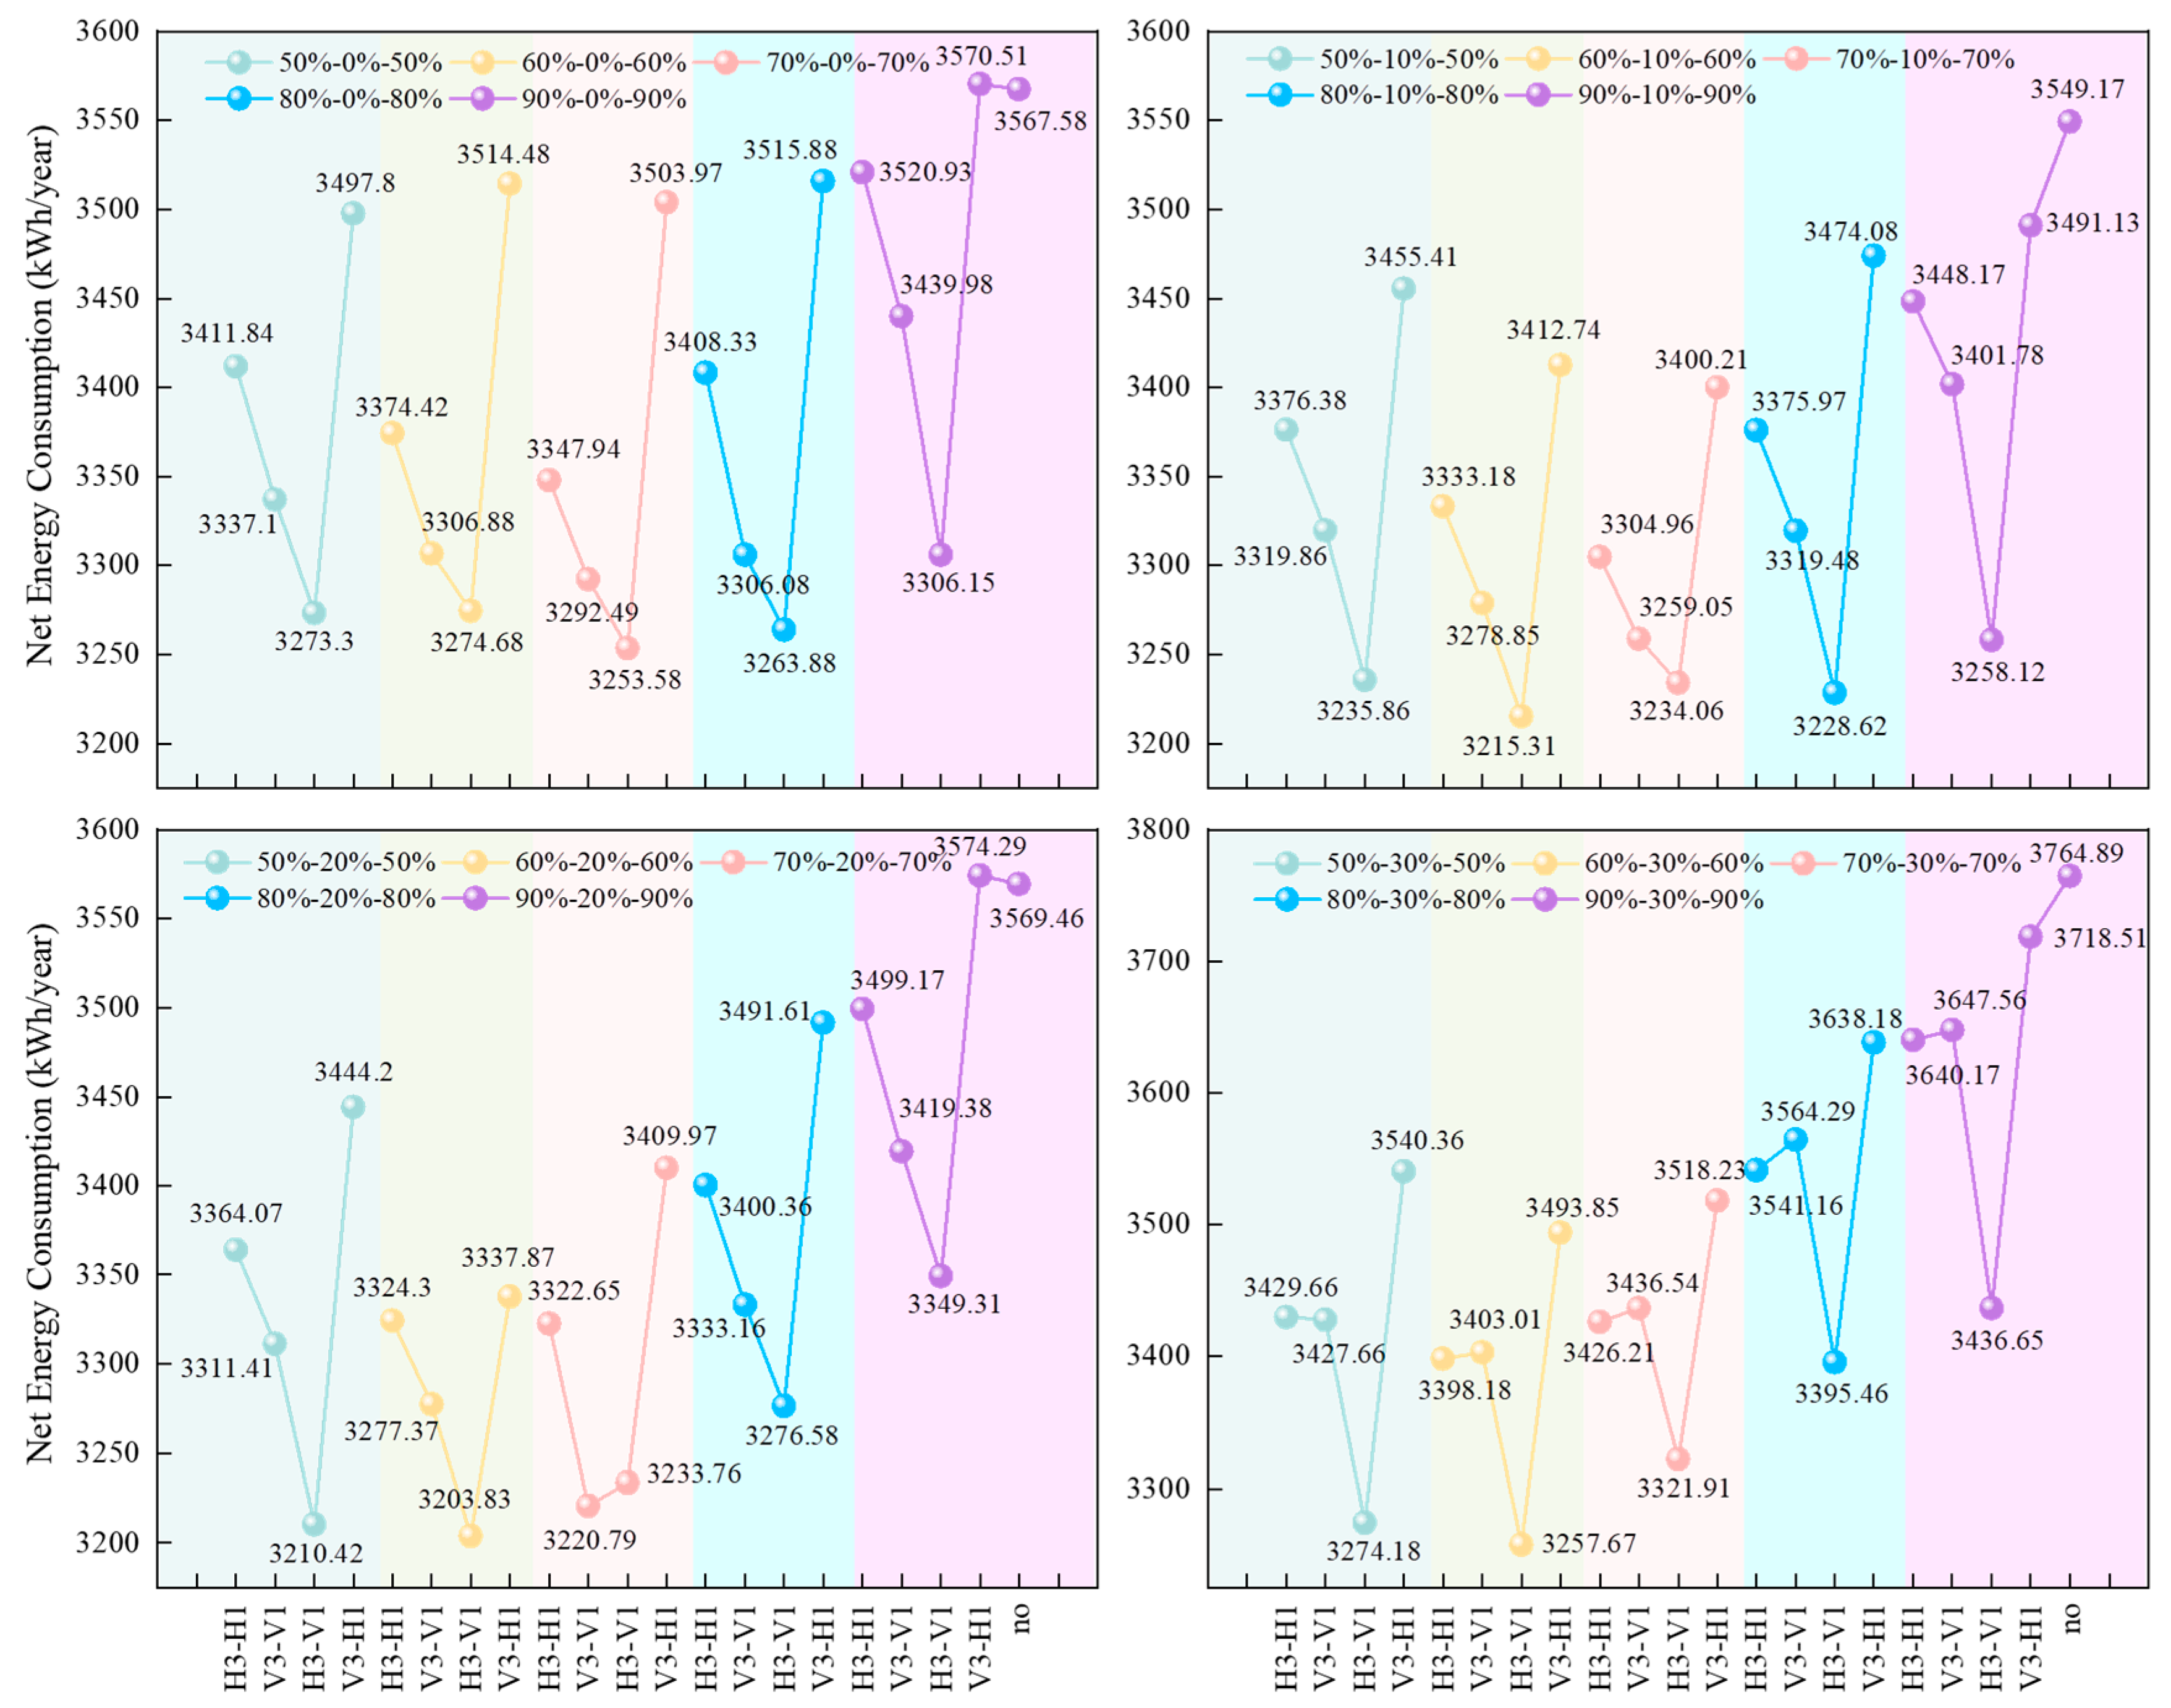
Figure 7 illustrates the annual energy consumption of the building, including summer heat load, winter cold load, and lighting load, as well as the annual photovoltaic power generation under varying PV coverage rates and arrangement modes. Figure 7a–d represent scenarios in which the PV coverage rate on the lighting area (Area 2) is 0%, 10%, 20%, and 30%, respectively. An increase in PV coverage results in a progressive reduction in solar heat gain indoors. Consequently, under the same layout configuration, the building’s heat load increases gradually with higher coverage rates, while the cold load exhibits a decreasing trend. As shown in Figure 7, lighting energy consumption increases progressively with the rise in PV coverage. Initially, the growth rate is relatively moderate, but it becomes more pronounced in later stages. This phenomenon is primarily attributed to the lower transmittance of cadmium telluride PV glass compared to conventional glass. As the PV coverage rate increases, the amount of natural light entering the indoor space decreases accordingly. When the PV coverage rate remains below a certain threshold, natural light can generally satisfy the minimum indoor illuminance requirement of 300 lx. In such cases, artificial lighting is not required, resulting in relatively stable lighting energy consumption with minimal fluctuations. However, once the coverage rate surpasses this threshold, indoor natural light intensity falls below 300 lx, necessitating the use of artificial lighting to compensate for the deficiency. As the coverage rate continues to rise, the intensity of natural light further diminishes, leading to a significant increase in lighting energy consumption in the subsequent stages. For instance, in Figure 7a, the lighting energy consumption values for the configurations H3-50-H1-50, H3-60-H1-60, H3-70-H1-70, H3-80-H1-80, and H3-90-H1-90 are 889.07 kWh, 994.84 kWh, 1128.66 kWh, 1313.45 kWh, and 1590.64 kWh, respectively, with corresponding increments of 105.77 kWh, 133.82 kWh, 184.79 kWh, and 277.19 kWh. When the PV coverage rate is held constant, the arrangement mode significantly influences the building’s overall energy consumption. Figure 8 illustrates the net energy consumption across various configurations. It can be observed that the overall energy consumption associated with the H3-H1 and V3-H1 layout methods is considerably higher than that of V3-V1 and H3-V1. Under identical coverage rates, the four PV arrangement modes (H3-H1, V3-V1, H3-V1, V3-H1) result in a net energy consumption trend that initially decreases and subsequently increases. This variation can be attributed to the differing angles at which natural light enters the indoor space throughout the day. The horizontal or vertical arrangement of PV panels exerts varying shading effects on light at different angles. Although PV power generation increases with higher coverage rates, the arrangement mode has minimal impact on the overall power generation.
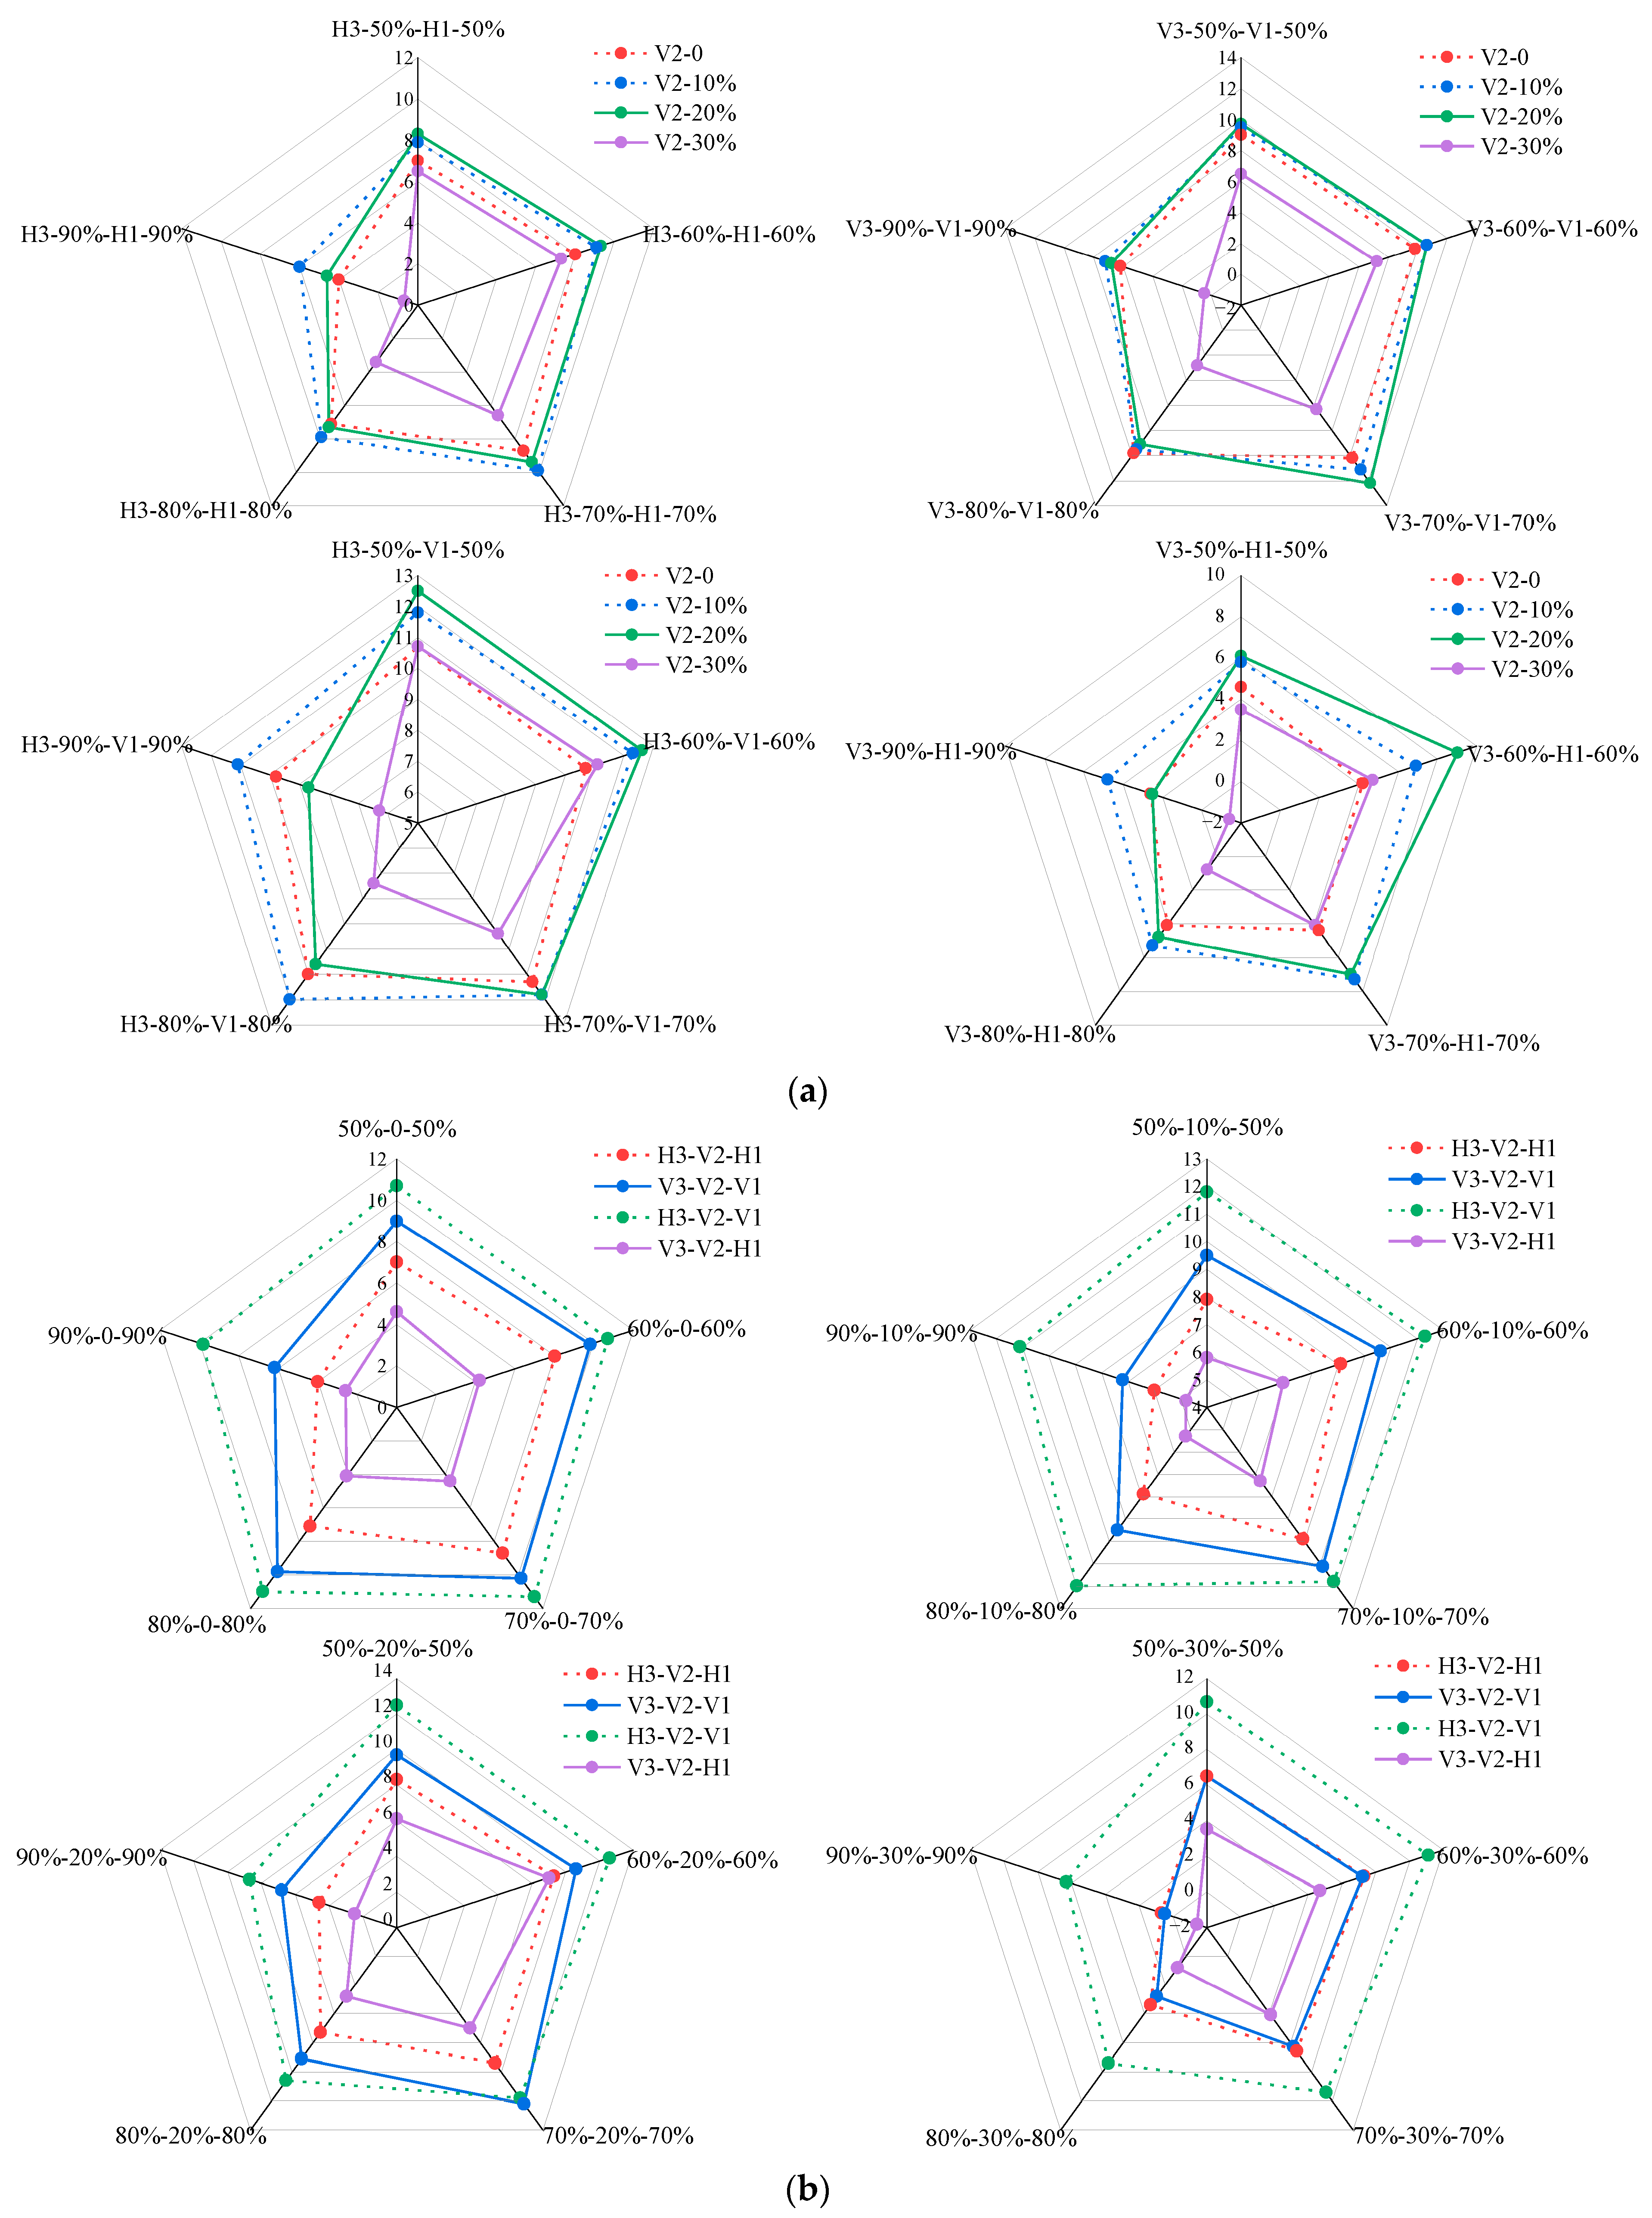
Figure 9a,b illustrate the influence of varying regional PV coverage rates and PV arrangement modes, respectively, on the building energy efficiency rate. As shown in Figure 9a, when the PV coverage rates of Areas 1 and 3 are held constant, an increase in the coverage rate of Area 2 generally results in an initial rise followed by a decline in the building energy-saving rate. Typically, after reaching a coverage rate of 10–20%, the energy efficiency rate begins to decrease. When the PV coverage rate of Area 2 is fixed, a similar trend is observed with increasing coverage rates of Areas 1 and 3. However, in general, changes in the PV coverage rates of Areas 1 and 3 have a more pronounced effect on enhancing the building energy-saving rate. For instance, taking the configuration H3-50%-H1-50% as a reference, when the PV coverage rate of Area 2 increases from 0% to 30%, the building energy-saving rate decreases by 0.5%. In contrast, when the coverage rates of Areas 1 and 3 increase from 50% to 80%, the building energy-saving rate increases by 0.1%. Therefore, appropriately increasing the PV coverage in Areas 1 and 3 proves to be more effective in improving building energy efficiency than increasing coverage in the shading region.
Figure 9b presents the impact of PV arrangement modes on the building energy-saving rate. A negative energy efficiency rate indicates that the actual building energy consumption increases after the installation of the PV system, exceeding the baseline energy consumption. As shown in the figure, except for the fourth subfigure, all other configurations exhibit a decreasing trend in energy-saving rate under the layouts H3-V2-V1, V3-V2-V1, H3-V2-H1, and V3-V2-H1. The energy-saving rates of H3-50%-V2-0%-V1-50%, V3-50%-V2-0%-V1-50%, H3-50%-V2-0%-H1-50%, and V3-50%-V2-0%-H1-50% are 10.7%, 9%, 7%, and 4.6%, respectively. Compared to the lowest value of 4.6%, the improvements are 6.1%, 4.4%, and 2.4%, respectively. Therefore, a well-designed PV arrangement in the windows can significantly reduce building energy consumption. In summary, among the 84 configurations analyzed, the layout H3-60%-V2-20%-V1-60% demonstrates the highest energy-saving performance, achieving an energy-saving rate of 12.6%. This corresponds to a vertical and horizontal PV arrangement in Areas 1 and 3 with coverage rates of 60% and 20%, respectively, and a PV coverage rate of 20% in Area 2.

4.2. Analysis of Light Comfort

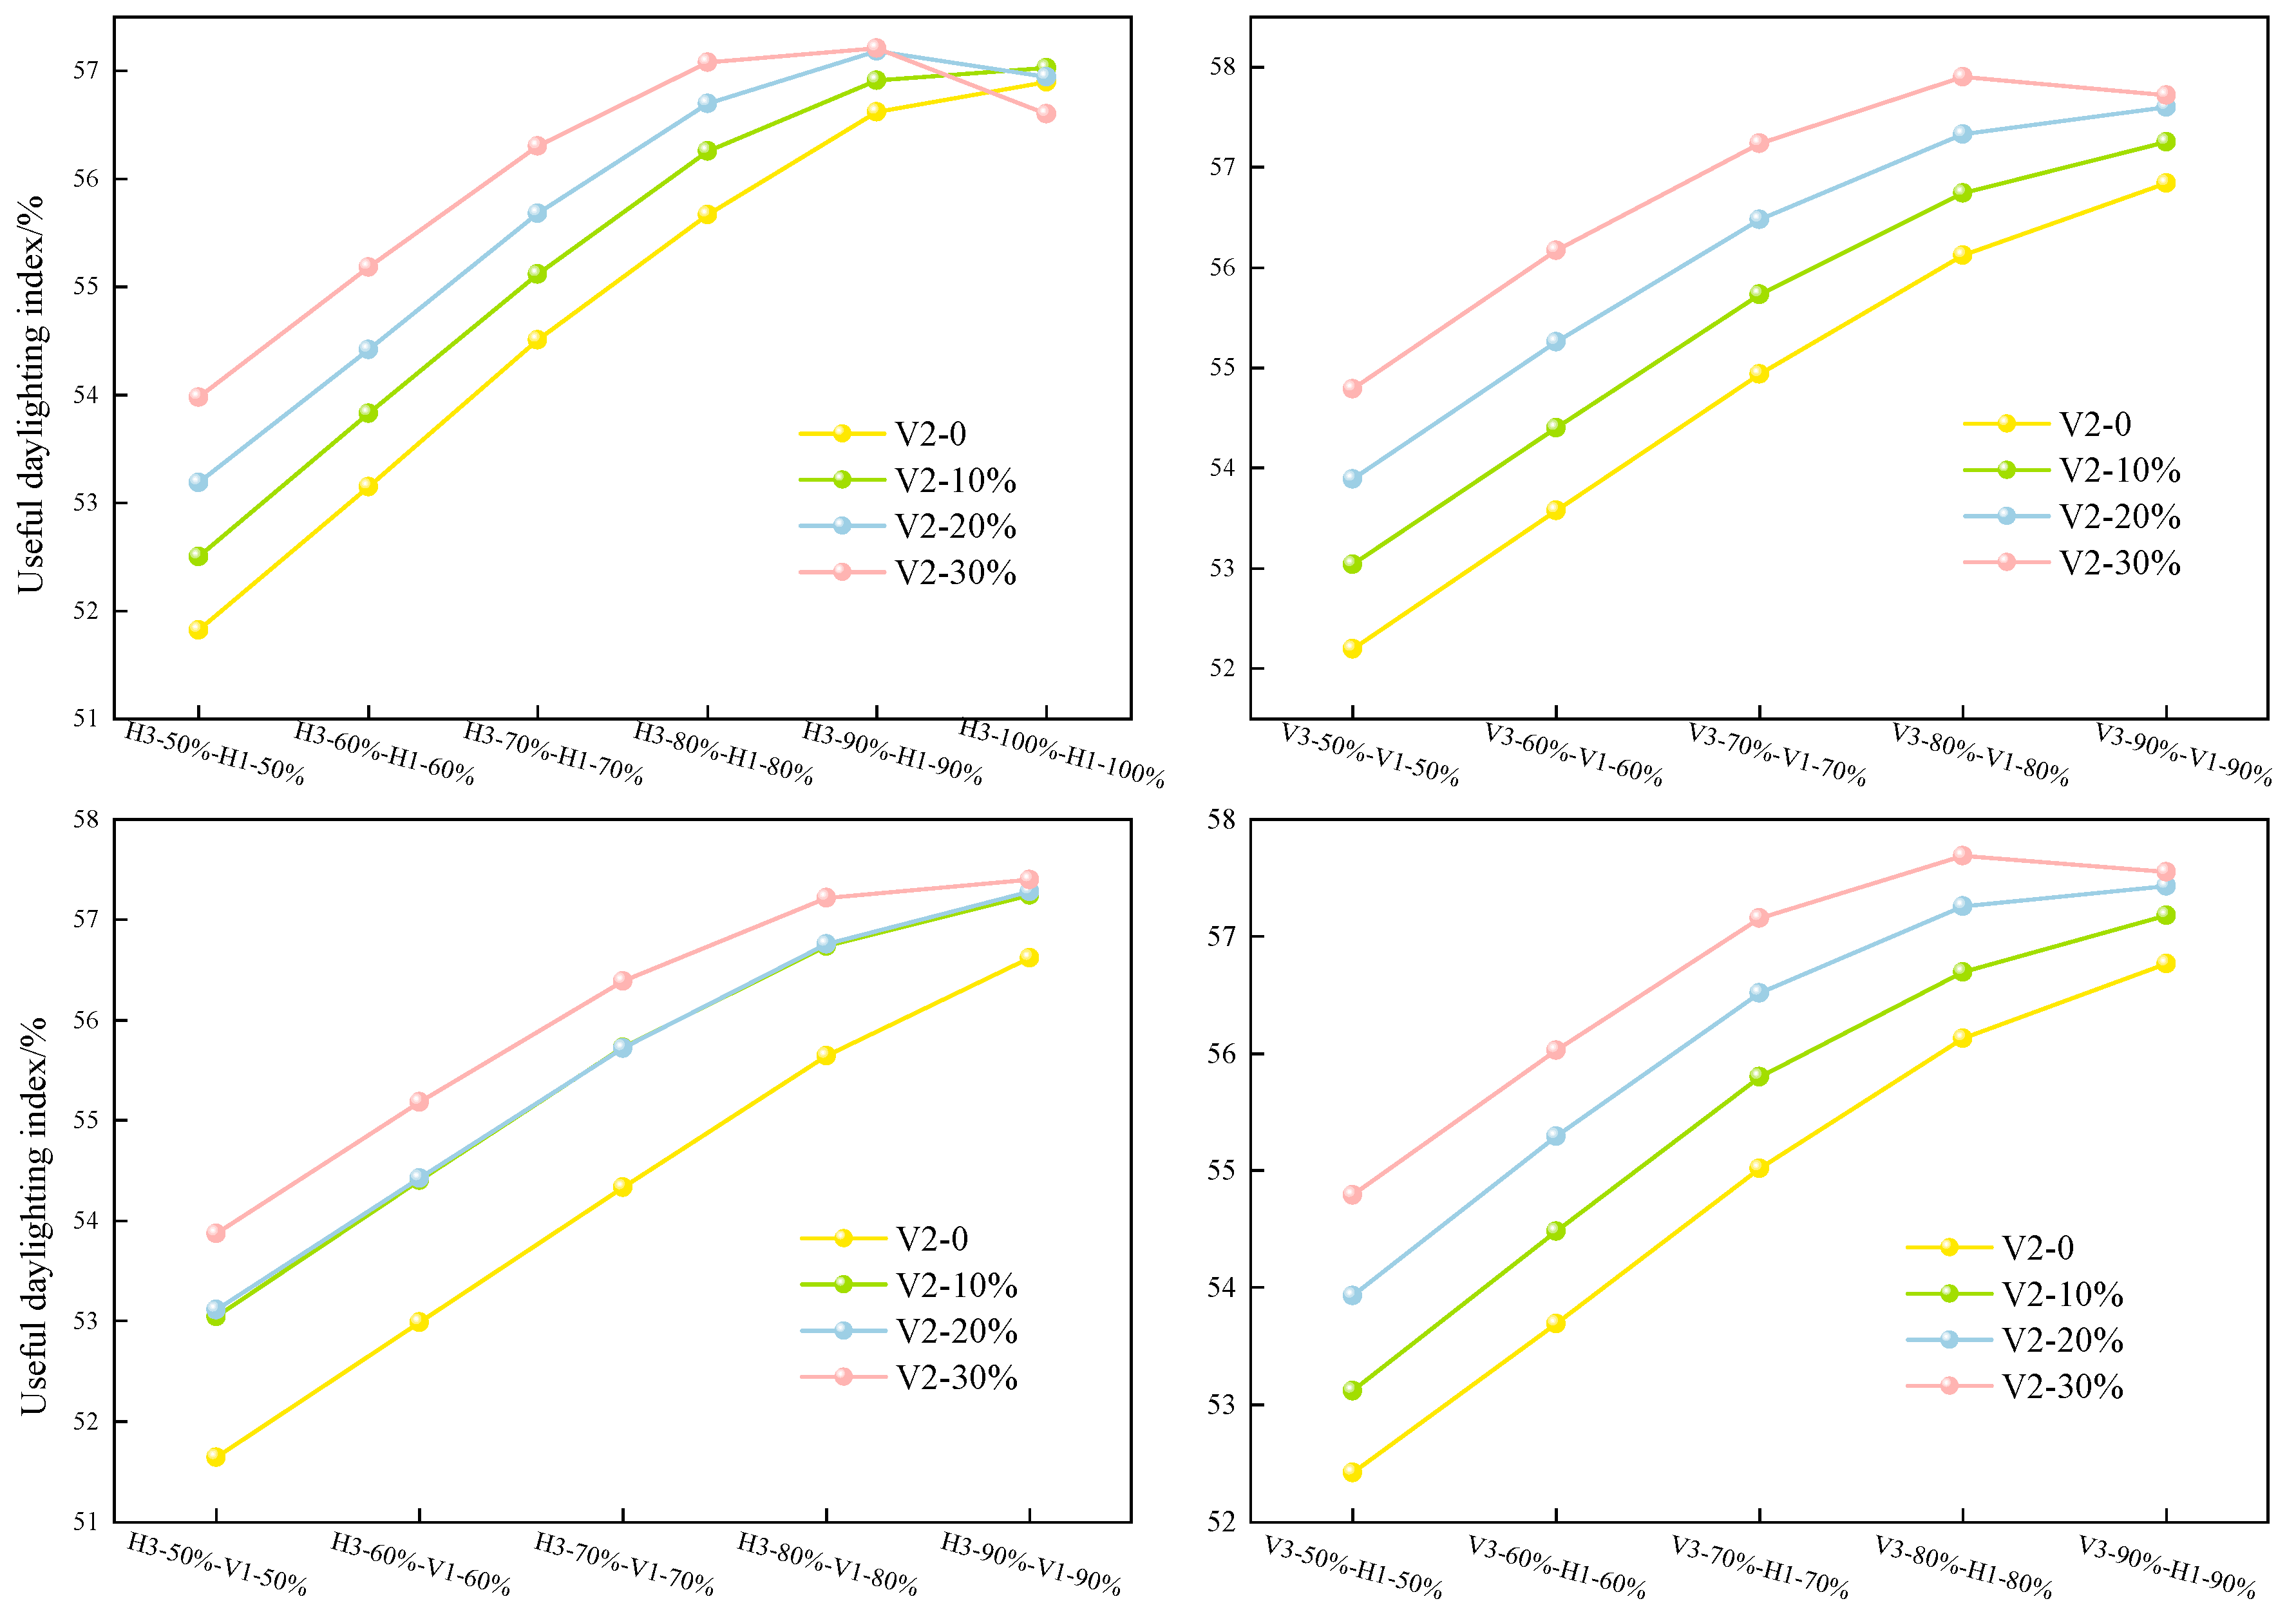
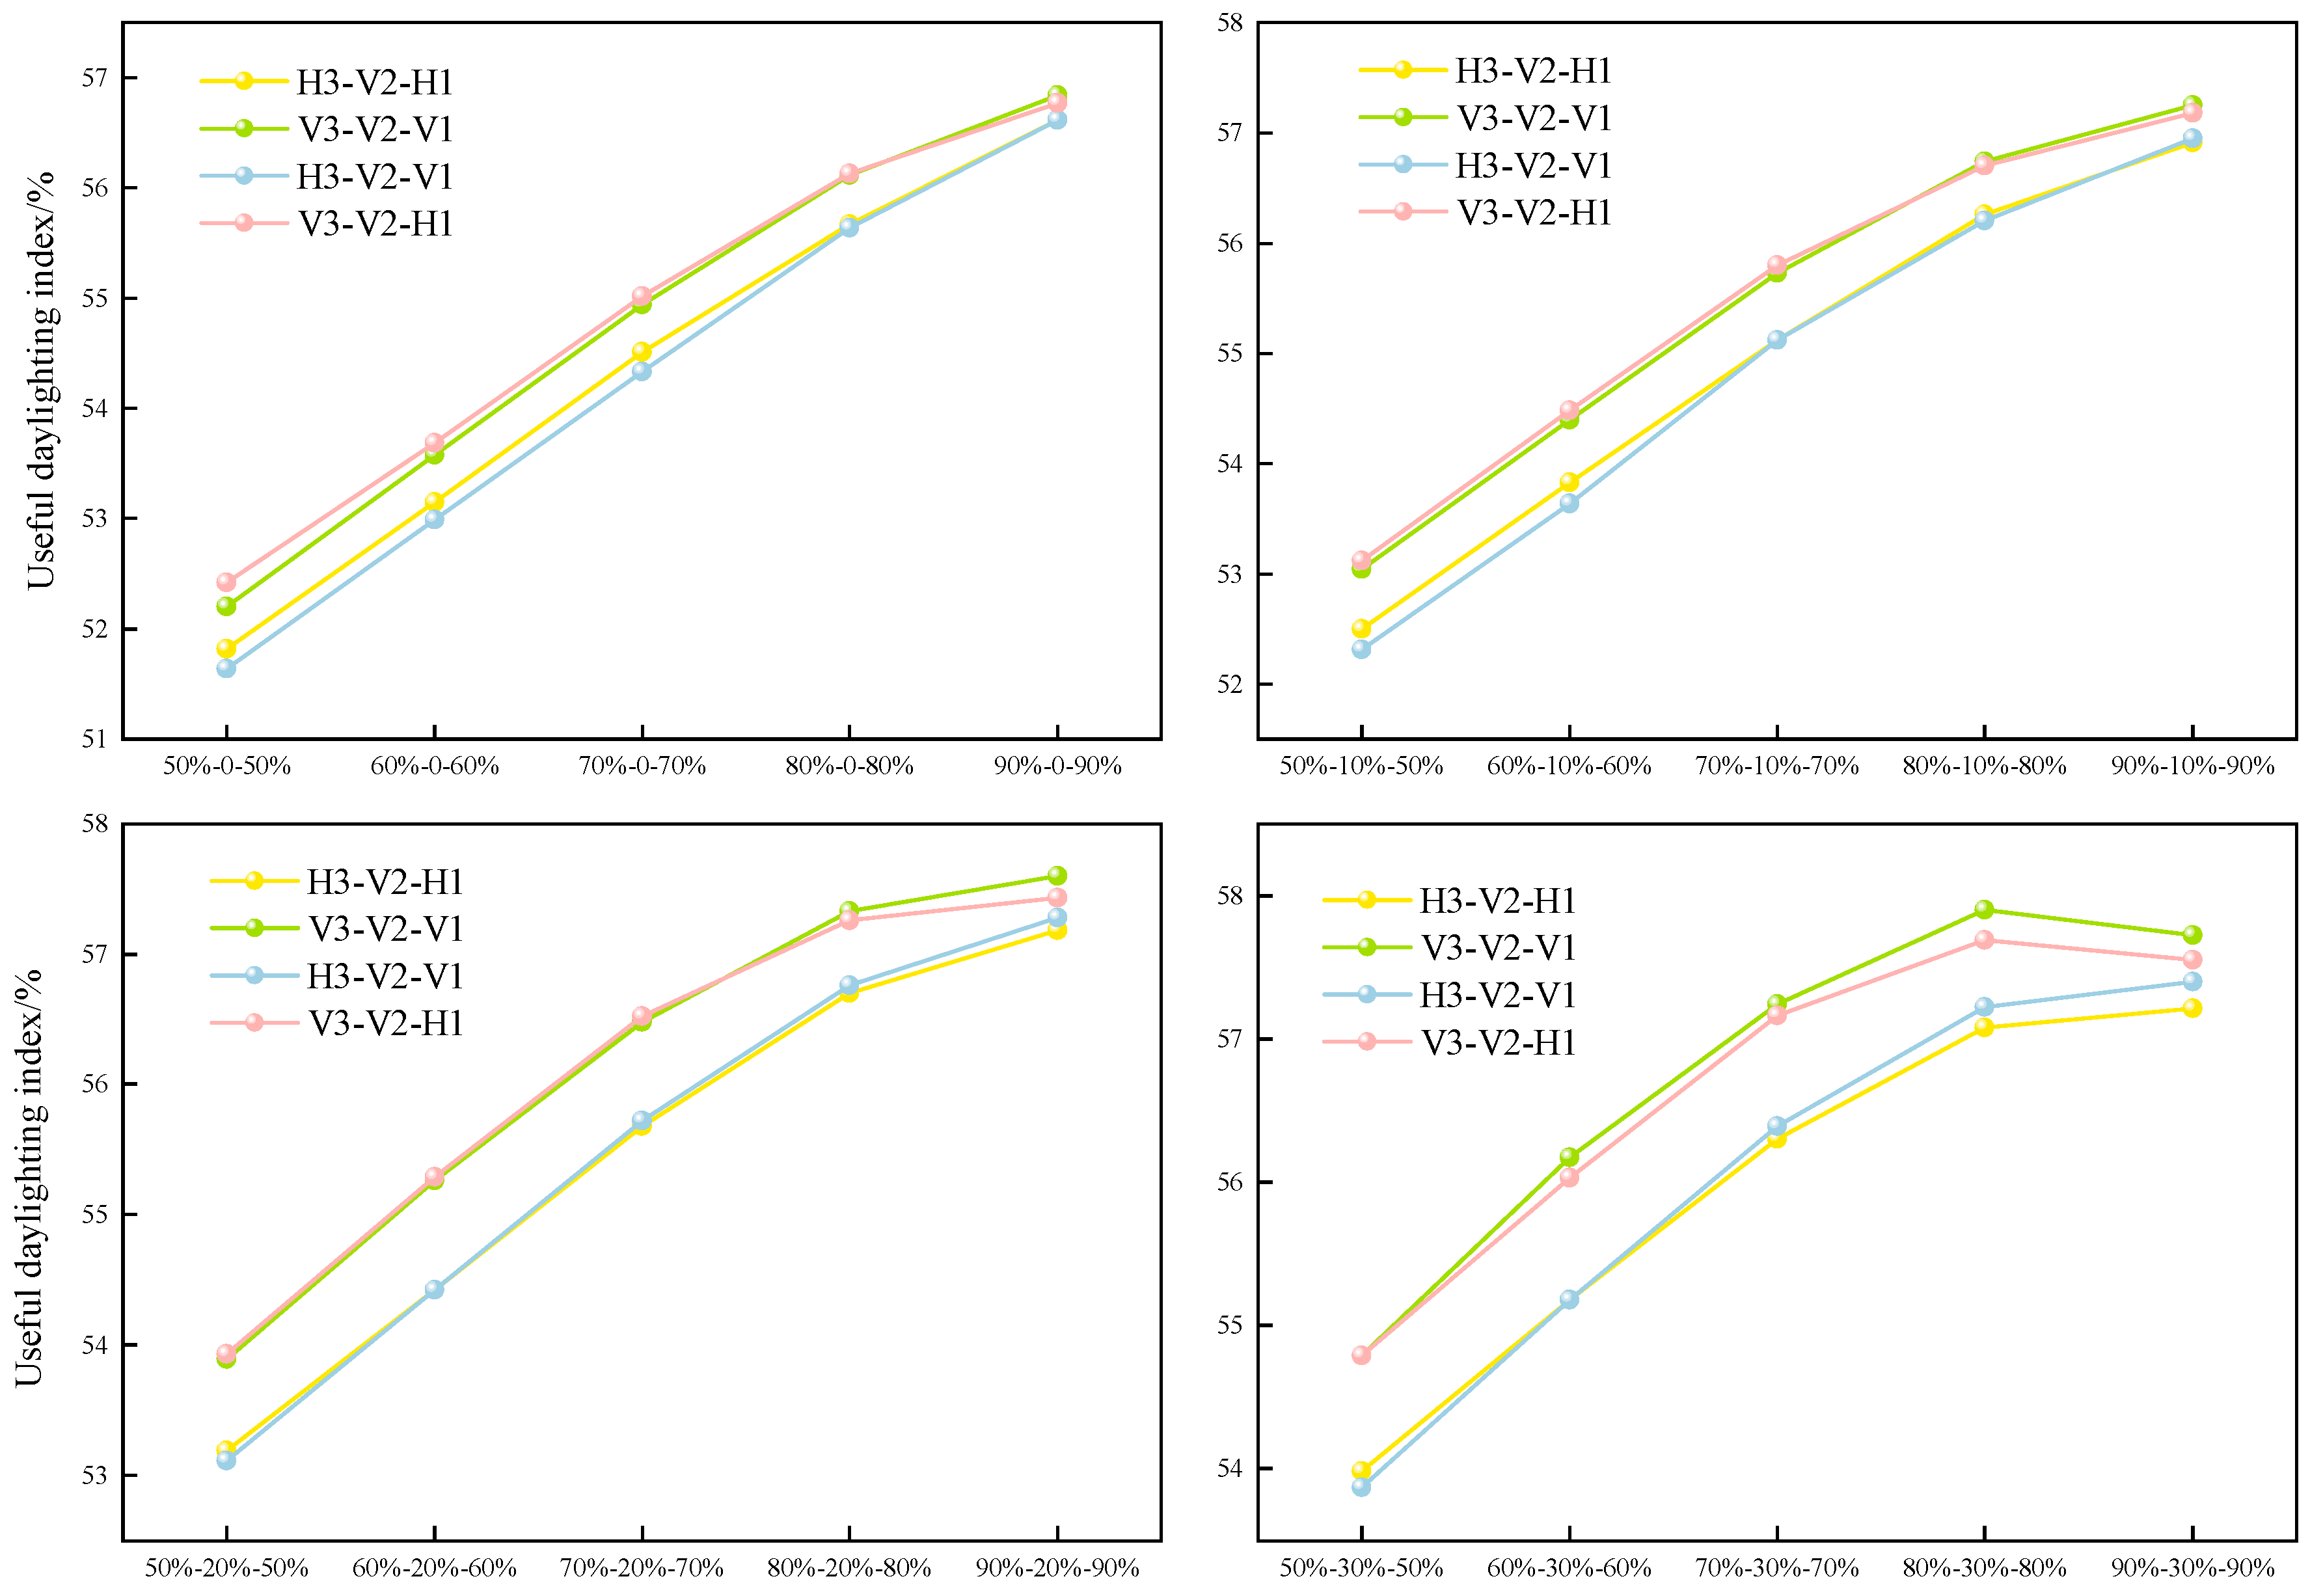
Indoor illuminance exceeding 2000 lx or falling below 300 lx can both cause visual discomfort. Therefore, UDI300lx–2000lx was used to evaluate the effective natural illuminance within indoor spaces. Figure 10 illustrates the impact of PV coverage rates across three areas on the proportion of indoor effective natural lighting time in buildings, and the four subfigures represent different PV arrangement modes, respectively. As shown in Figure 10, as the PV coverage rate in the lighting area increases, the proportion of effective indoor natural lighting time gradually rises. For example, when Areas 1 and 3 adopt the H3-70%-H1-70% layout and the PV coverage rate in Area 2 increases from 0% to 30%, the corresponding UDI ratios are 54.51%, 55.12%, 55.68%, and 56.3%, respectively. When the coverage rate in Area 2 is held constant, an increase in the coverage rates of Areas 1 and 3 also leads to a gradual rise in UDI, although the growth rate progressively diminishes. For instance, under the H3-V2-0-H1 configuration, when the coverage rates of Areas 1 and 3 increase from 50% to 100%, the UDI increases by 2.6%, 2.5%, 2.1%, 1.7%, and 0.5%, respectively. However, in certain configurations, the UDI may slightly decrease once the coverage rate reaches a certain threshold. For example, when the PV coverage rate in Area 3 is fixed at 30%, and the coverage rate of H3-H1 increases from 90% to 100%, the UDI time ratio decreases from 57.21% to 56.2%. This is primarily due to the lower transmittance of PV glass compared to conventional glass. During periods of strong daylight, ordinary glass may result in indoor illuminance exceeding 2000 lx, whereas photovoltaic glass reduces the proportion of such excessive illuminance, with the effect becoming more pronounced as the coverage rate increases. However, beyond a certain threshold, the reduced transmittance of PV glass may cause an increase in the proportion of indoor illuminance below 300 lx, leading to a decline in UDI in some cases. Therefore, selecting an appropriate PV coverage rate can effectively enhance indoor lighting comfort.
Figure 11 shows the impact of four different PV arrangement modes, including H3-H1, H3-V1, V3-V1, and V3-H1, on the proportion of effective natural lighting time in the building interior. From the figure, it can be seen that the effects of the four arrangement modes can be divided into two categories: V3-V1 and V3-H1 belong to one category, while H3-H1 and H3-V1 belong to another. All four subfigures show that the indoor light comfort effect of the former is better than that of the latter. For example, with a coverage rate of 50%-0-50%, the UDI300lx–2000lx values under the four arrangement modes are 51.82%, 51.64%, 52.2%, and 52.42%, respectively.
To further reveal the impact of CdTe PV arrangement on the indoor lighting environment, this study observed the observation point at a distance of 1.25 m from the window and simulated the illumination changes on the indoor working plane from 10 a.m. to 4 p.m. on April 20th. From Figure 12, it can be clearly observed that when the layout of Area 3 is the same, the horizontal and vertical layouts of Area 1 have little effect on the illuminance. The vertical layout of the window has a slightly higher illuminance than the horizontal layout. However, when the layout of Area 1 is the same, Area 3 has a more significant impact on the indoor illuminance. At the same time, the illuminance of H3-50%-V1-50% is less than that of V3-50%-V1-50% at 15 o’clock, with the illuminance being 2206.06 lx and 1923.68 lx, respectively. This indicates that the vertical layout of the PV panels in Area 3 can resist more direct sunlight, while the layout of Area 1 has little effect. During the day, the light mainly enters at a low angle and covers Areas 2 and 3; only at noon does the light mainly enter at a high angle, and most of it is directed at Areas 1 and 2. The vertical layout of the PV panels in Area 3 presents a continuous strip-like shading for low-angle oblique sunlight; while the horizontal strip shading blocks the light more dispersedly.
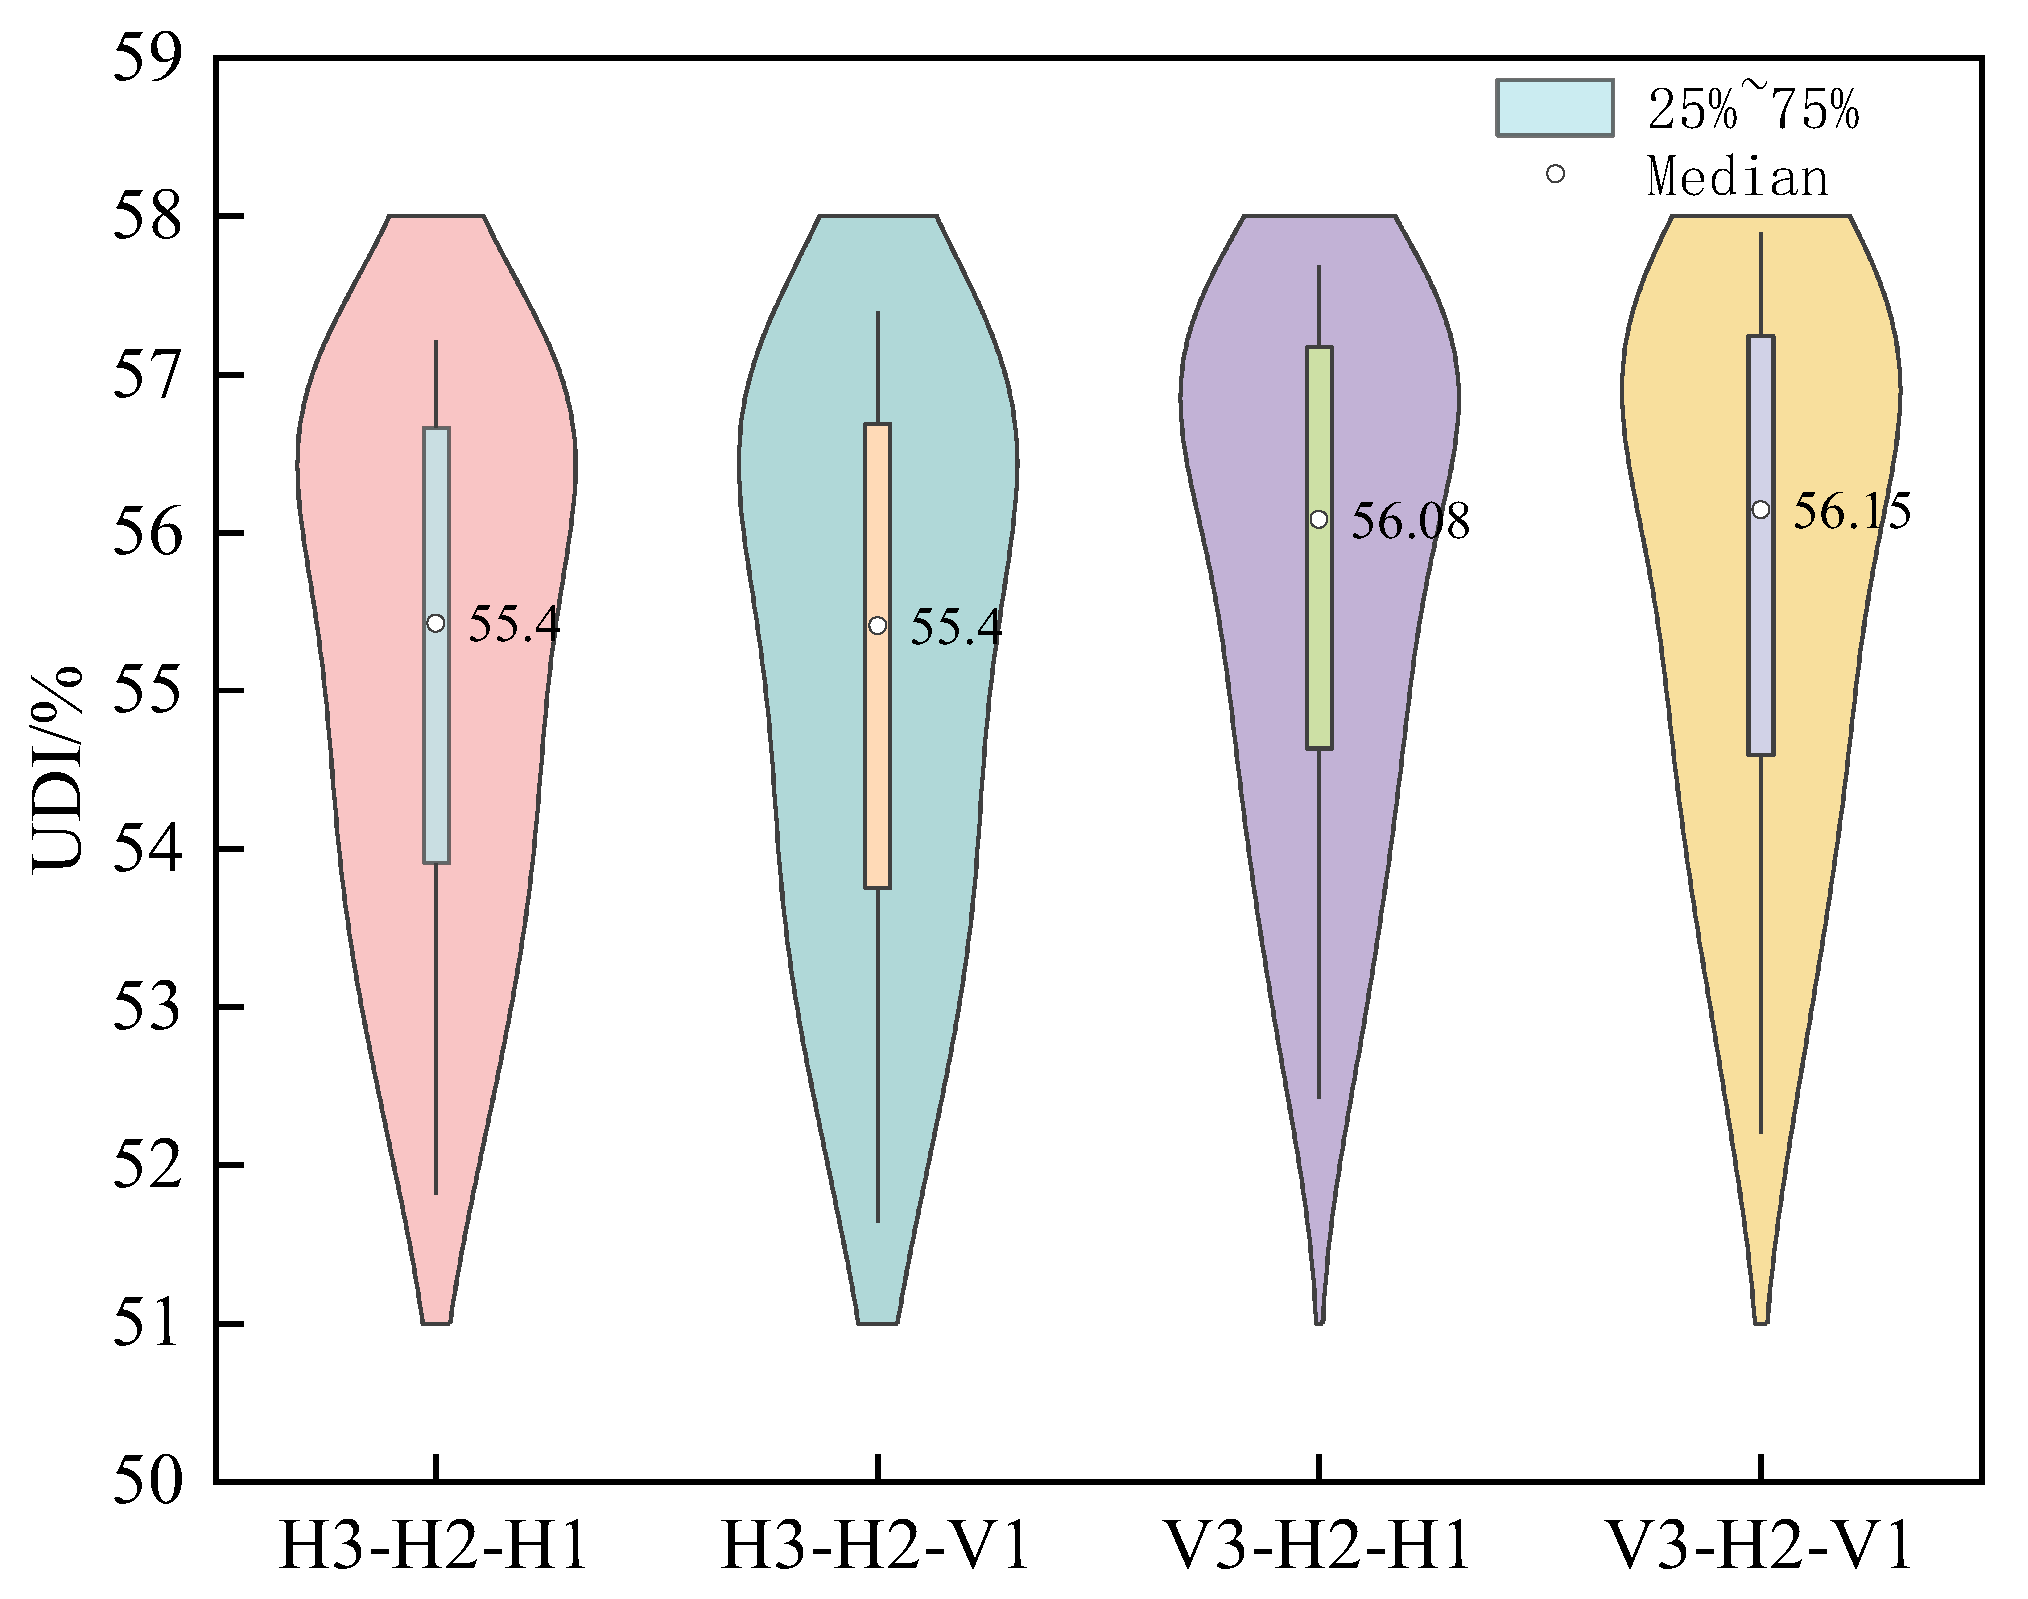
As shown in Figure 13, this study conducted a statistical analysis of the effective natural lighting percentage for all 84 schemes. The median values of their UDI300lx–2000lx were 55.4%, 55.4%, 56.08%, and 56.15% respectively. Therefore, the use of CdTe PV windows with V3-V1 or V3-H1 layout can effectively improve the indoor light comfort.

4.3. Comprehensive Evaluation

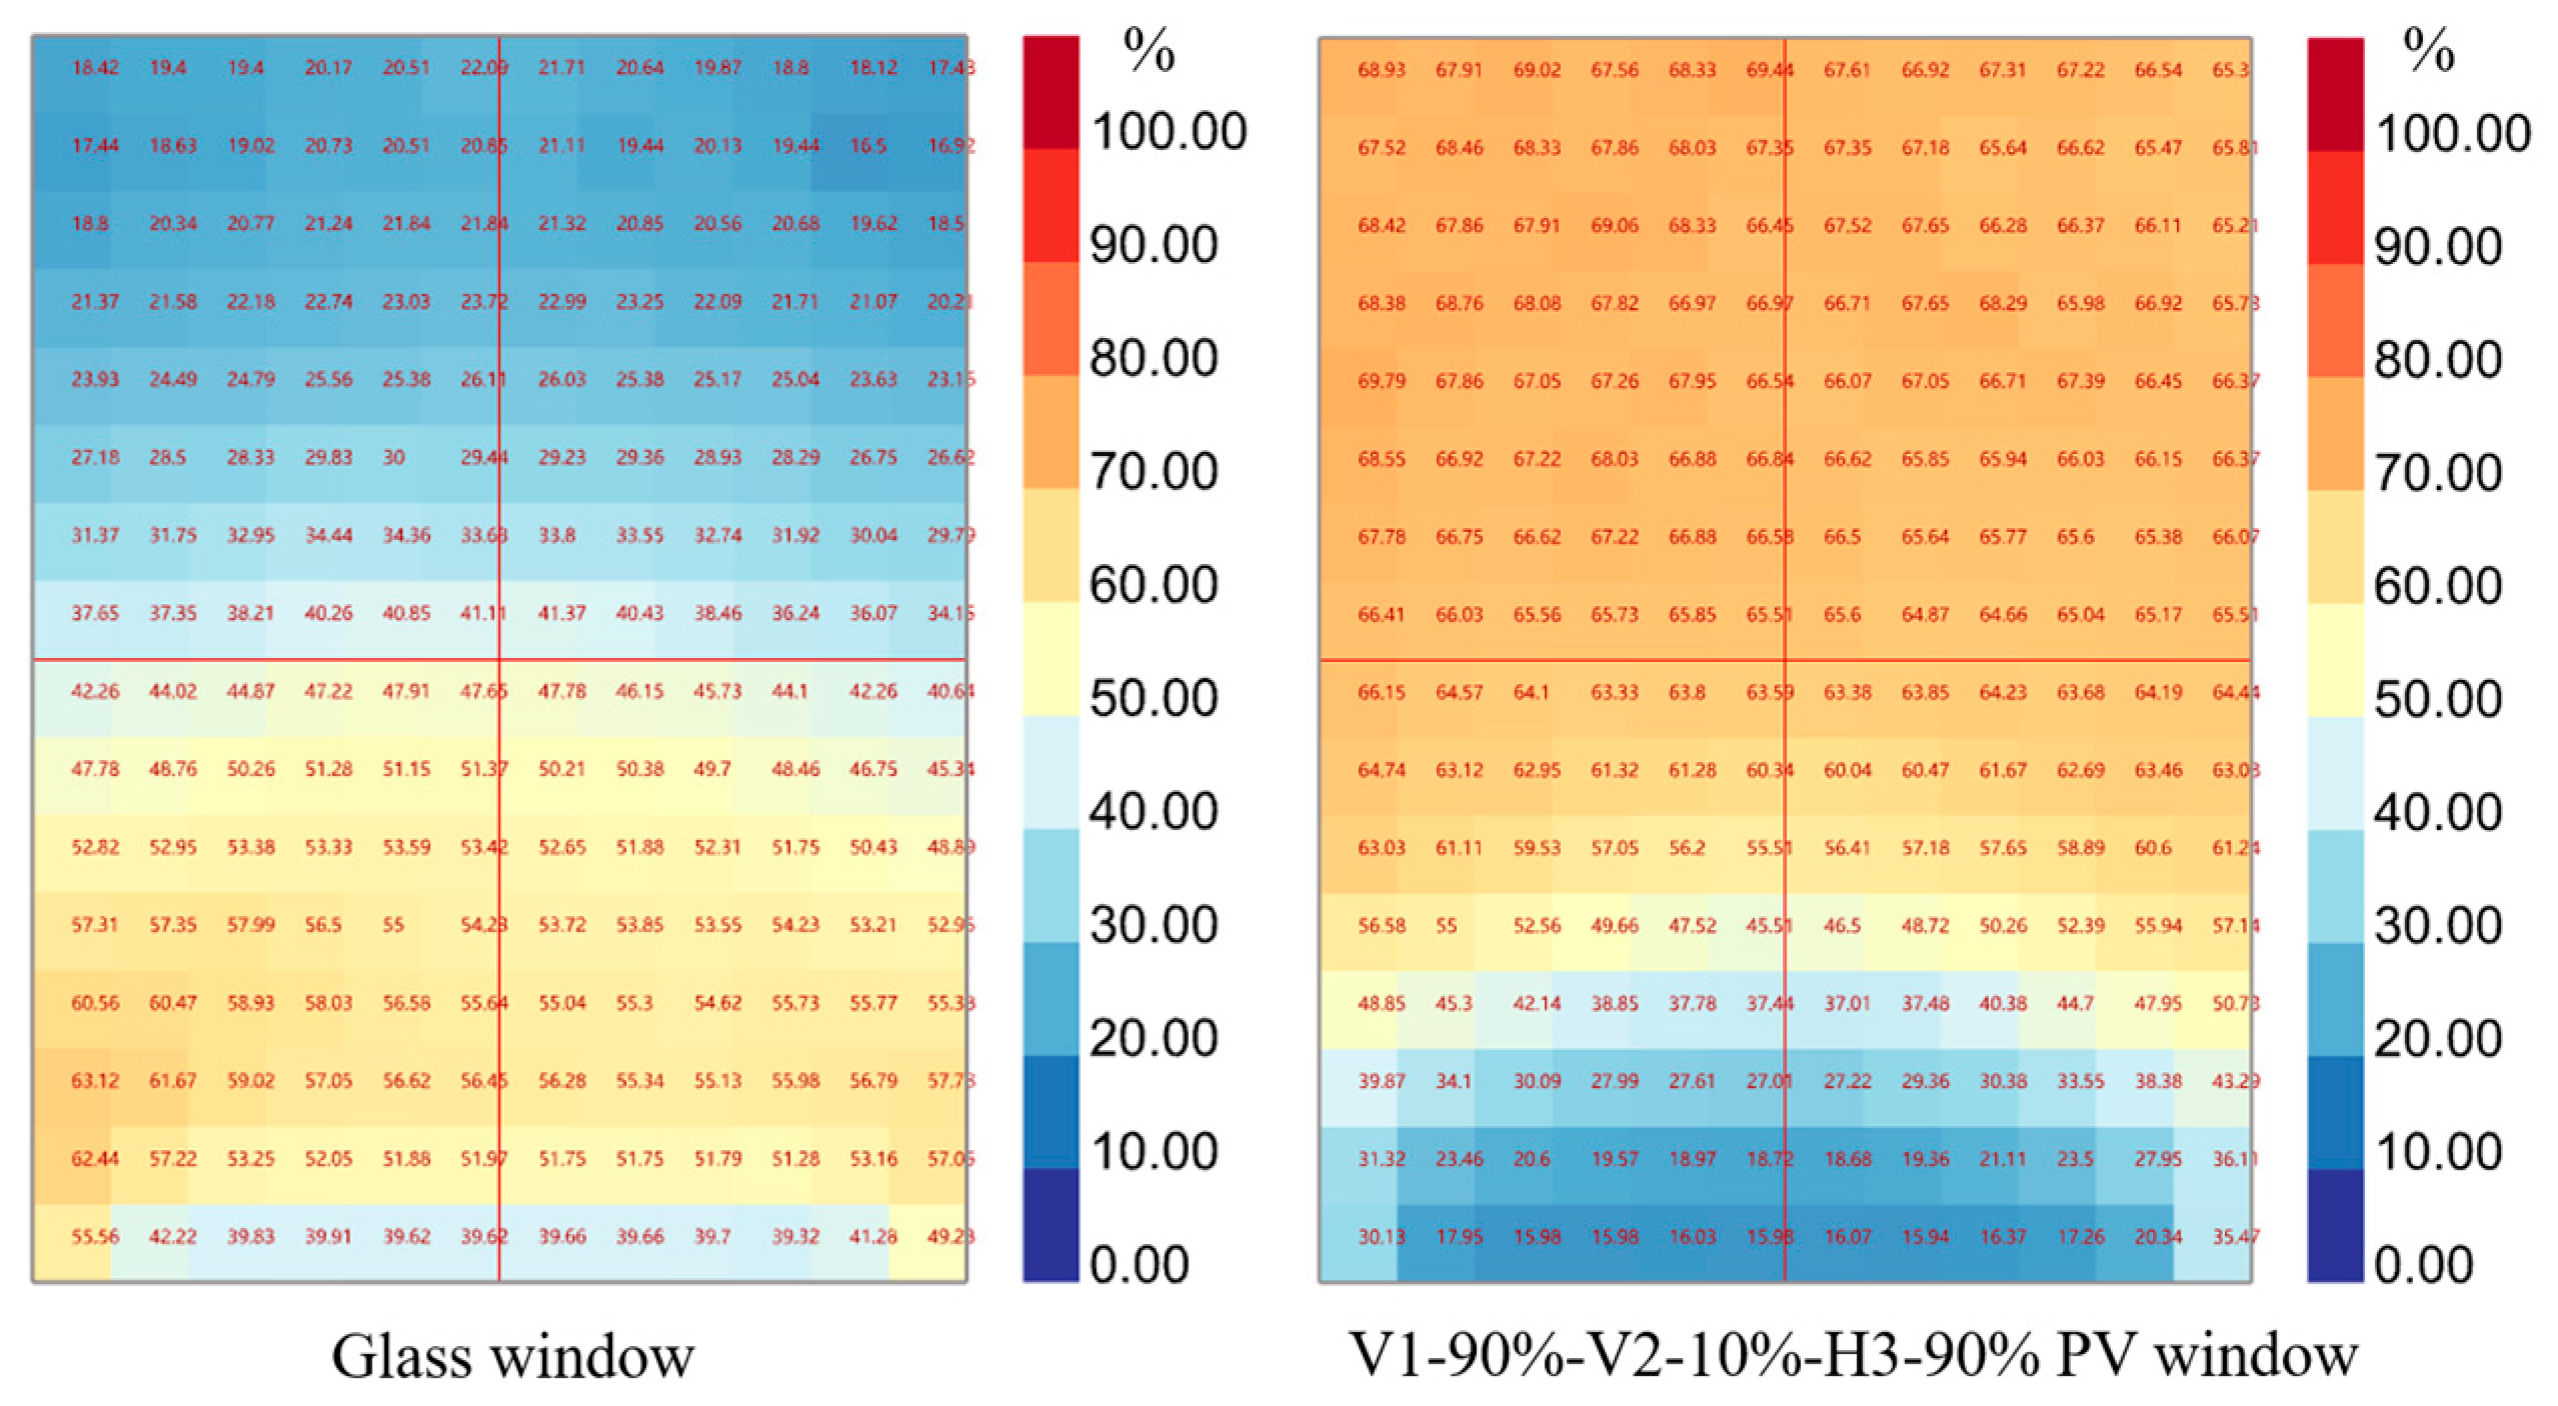
This study calculated the weights of the energy-saving rate index and the UDI300lx–2000lx index using the entropy weight–TOPSIS method, which were 0.38 and 0.62, respectively, and the comprehensive scores of 84 cadmium telluride PV window design schemes were obtained. In Table 3, the top five comprehensive scoring schemes and the optimal schemes considering only energy consumption or light comfort are listed. Among them, the comprehensive optimal solution is V1-90%-V2-10%-H3-90%, the solution with the highest energy-saving rate is V1-60%-H2-20%-H3-60%, and the optimal solution for light comfort is V1-80%-V2-30%-V3-80%. Figure 14 shows the UDI300lx–2000lx distribution map of the V1-90%-V2-10%-H3-90% CdTe PV window, which is the comprehensive optimal solution, and the ordinary glass window. From the figure, it can clearly be seen that the UDI300lx–2000lx of the V1-90%-V2-10%-H3-90% CdTe PV window is greater than that of the ordinary glass window. The time proportion of UDI300lx–2000lx of the V1-90%-V2-10%-H3-90% CdTe PV window is 56.95%, which is 18.33% higher than that of the ordinary glass window (38.62%). This is mainly because the ordinary glass window has a high transmittance and a poor shading effect, which easily causes light spots, and the illuminance at these light spot areas is often greater than 2000 lx. From the figure, it can also be observed that with the increase in the building depth, the proportion of UDI300lx–2000lx first increases and then decreases, and the UDI300lx–2000lx near the window is smaller, while the UDI300lx–2000lx near the center of the room is the largest.

5. Conclusions

This study proposes a three-domain division CdTe PV window that takes into account building energy consumption, indoor light environment, and outdoor visibility. Numerical simulations were conducted using Energy Plus and Radiance to evaluate the energy consumption and light comfort of different coverage rates and arrangement modes of PV windows. The main conclusions are as follows:
  • Compared with ordinary glass windows, buildings integrated with CdTe PV windows generally exhibit higher energy-saving rates and a greater proportion of usable daylight (UDI300lx–2000lx), thereby fully demonstrating the advantages of CdTe PV windows in improving building energy performance and enhancing the indoor lighting environment.
  • Increasing the coverage of PV panels can significantly improve the building energy-saving rate initially, but after reaching a certain level, the energy-saving rate begins to decline. The proportion of effective natural lighting UDI300lx–2000lx generally increases with the increase in PV panel coverage, but when the coverage reaches a certain high level, UDI300lx–2000lx slightly decreases.
  • Reasonable arrangement of CeTe PV windows can effectively improve the building energy-saving rate and indoor light comfort. In terms of energy-saving rate, the energy efficiency of the V3-V1 or H3-V1 layout is better than that of H3-H1 and V3-H1; as for the proportion of UDI300lx–2000lx, the V3-V1 or V3-H1 layout is more effective in improving indoor light comfort.
  • The weights of building energy-saving rate and UDI300lx–2000lx indicators are 0.38 and 0.62, respectively. The optimal design scheme obtained through comprehensive evaluation is V1-90%-V2-10%-H3-90%, with an energy-saving rate of 11.1% and an UDI300lx–2000lx of 56.95%, which is 18.33% higher than that of ordinary windows in UDI300lx–2000lx. If the sole objective is the energy-saving rate, the optimal design scheme is V1-60%-V2-20%-H3-60%, with an energy-saving rate of 12.6%. However, if the goal is light comfort, the optimal design scheme is V1-80%-V2-30%-V3-80%, with an UDI300lx–2000lx of 57.9%.

Author Contributions

Conceptualization, H.-X.Y. and C.-Y.H.; methodology, H.-X.Y. and C.-Y.H.; validation, C.-Y.H.; formal analysis, C.-Y.H.; writing-original draft, C.-Y.H.; writing-review & editing, H.-X.Y. and H.Z.; visualization, C.-Y.H.; funding acquisition, H.-X.Y. and X.-R.W. All authors have read and agreed to the published version of the manuscript.

Funding

The research was funded by the Natural Science Foundation of Shaanxi Province, China (No.2025JC-YBMS-588), and the Natural Science Foundation of Shaanxi Province, China (No. 2022SF-528).

Data Availability Statement

The original contributions presented in this study are included in the article. Further inquiries can be directed to the corresponding author.

Conflicts of Interest

The authors declare no conflict of interest.

References

  1. Xuan, Q.; Li, G.; Zhao, B.; Jiang, B.; Sun, D.; Zhang, X.; Tang, J.; Zhuang, Y.; Liu, J.; Li, L. Evaluation of the smart daylighting control performance of the concentrating photovoltaic/daylighting system as the skylight in the building. Sol. Energy 2022, 238, 17–29. [Google Scholar] [CrossRef]
  2. Herrando, M.; Cambra, D.; Navarro, M.; de la Cruz, L.; Millán, G.; Zabalza, I. Energy Performance Certification of Faculty Buildings in Spain: The gap between estimated and real energy consumption. Energy Convers. Manag. 2016, 125, 141–153. [Google Scholar] [CrossRef]
  3. Tan, Y.; Peng, J.; Luo, Y.; Luo, Z.; Curcija, C.; Fang, Y. Numerical heat transfer modeling and climate adaptation analysis of vacuum-photovoltaic glazing. Appl. Energy 2022, 312, 118747. [Google Scholar] [CrossRef]
  4. Sun, Y.; Liu, D.; Flor, J.F.; Shank, K.; Baig, H.; Wilson, R.; Liu, H.; Sundaram, S.; Mallick, T.K.; Wu, Y. Analysis of the daylight performance of window integrated photovoltaics systems. Renew. Energy 2020, 145, 153–163. [Google Scholar] [CrossRef]
  5. Li, X.; Peng, J.; Li, N.; Wu, Y.; Fang, Y.; Li, T.; Wang, M.; Wang, C. Optimal design of photovoltaic shading systems for multi-story buildings. J. Clean. Prod. 2019, 220, 1024–1038. [Google Scholar] [CrossRef]
  6. Li, X.; Peng, J.; Tan, Y.; He, Y.; Li, B.; Ju, X.; Ji, J.; Zhang, S.; Li, N.; Chen, Y. Optimal design of inhomogeneous semi-transparent photovoltaic windows based on daylight performance and visual characters. Energy Build. 2023, 283, 112808. [Google Scholar] [CrossRef]
  7. Qiu, C.Y.; Yang, H.X. Daylighting and overall energy performance of a novel semi-transparent photovoltaic vacuum glazing in different climate zones. Appl. Energy 2020, 276, 112808. [Google Scholar] [CrossRef]
  8. Wang, H.; Li, W.; Huang, Y.; Wang, Y.; Yang, S.; Zou, B. Efficiency enhancement of organic solar cells by inserting PbS quantum dots film as the infrared absorption layer. Mater. Lett. 2017, 187, 136–139. [Google Scholar] [CrossRef]
  9. Matsui, T.; Sai, H.; Bidiville, A.; Hsu, H.J.; Matsubara, K. Progress and limitations of thin-film silicon solar cells. Sol. Energy 2018, 170, 486–498. [Google Scholar] [CrossRef]
  10. Xu, S.; Liao, W.; Huang, J.; Kang, J. Option PV cell coverage ration for semi-transparent photovoltaic on office building facades in cental China. Energy Build. 2014, 77, 130–138. [Google Scholar] [CrossRef]
  11. Wang, C.; Uddin, M.M.; Ji, J.; Yu, B.; Wang, J. The performance analysis of a double-skin ventilated window integrated with CdTe cells in typical climate regions. Energy Build. 2021, 241, 110922. [Google Scholar] [CrossRef]
  12. Sun, Y.; Shanks, K.; Baig, H.; Zhang, W.; Hao, X.; Li, Y.; He, B.; Wilson, R.; Liu, H.; Sundaram, S.; et al. Integrated semi-transparent cadmium telluride photovoltaic glazing into windows: Energy and daylight performance for different architecture designs. Appl. Energy 2018, 231, 972–984. [Google Scholar] [CrossRef]
  13. Alrashidi, H.; Issa, W.; Sellami, N.; Ghosh, A.; Mallick, T.K.; Sundaram, S. Performance assessment of cadmium telluride-based semi-transparent glazing for power saving in facade buildings. Energy Build. 2020, 215, 109585. [Google Scholar] [CrossRef]
  14. Liu, D.; Sun, Y.; Wilson, R.; Wu, Y. Comprehensive evaluation of window-integrated semi-transparent PV for building daylight performance. Renew. Energy 2020, 145, 1399–1411. [Google Scholar] [CrossRef]
  15. Wang, C.; Ji, J.; Uddin, M.M.; Yu, B.; Song, Z. The study of a double-skin ventilated window integrated with CdTe cells in a rural building. Energy 2020, 215, 119043. [Google Scholar] [CrossRef]
  16. Alrashidi, H.; Ghosh, A.; Issa, W.; Sellami, N.; Mallick, T.K.; Sundaram, S. Thermal performance of semitransparent CdTe BIPV window at temperate climate. Sol. Energy 2020, 195, 536–543. [Google Scholar] [CrossRef]
  17. Guo, W.W.; Qiu, Z.Z.; Li, P.; He, J.; Zhang, Y.; Li, Q.M. Application of PV Window for Office Building in Hot Summer and Cold Winter Zone of China. Adv. Mater. Res. 2011, 347, 81–88. [Google Scholar] [CrossRef]
  18. Ghasaban, M.; Yeganeh, M.; Irani, M. Optimizing daylight, sky view and energy production in semi-transparent photovoltaic facades of office buildings: A comparative study in four climate zones. Appl. Energy 2025, 377, 124707. [Google Scholar] [CrossRef]
  19. Peng, J.; Curcija, D.C.; Lu, L.; Selkowitz, S.E.; Yang, H.; Zhang, W. Numerical investigation of the energy saving potential of a semi-transparent photovoltaic double-skin facade in a cool-summer Mediterranean climate. Appl. Energy 2016, 165, 345–356. [Google Scholar] [CrossRef]
  20. Tan, Y.; Peng, J.; Luo, Z.; Luo, Y.; Ma, T.; Ji, J.; Yang, H.; Wang, F.; Zhu, M. Multi-function partitioned design method for photovoltaic curtain wall integrated with vacuum glazing towards zero-energy buildings. Renew. Energy 2023, 218, 119257. [Google Scholar] [CrossRef]
  21. Tan, Y.; Peng, J.; Luo, Z.; Luo, Y.; Ma, T.; Ji, J.; Yang, H.; Wang, F.; Zhu, M. Simulation of façade and envelope design options for a new institutional building. Sol. Energy 2007, 81, 1088–1103. [Google Scholar] [CrossRef]
  22. Ke, W.; Ji, J.; Zhang, C.; Wang, C.; Xie, H.; Tian, X. A seasonal experimental study on a novel CdTe based multi-layer PV ventilated window system integrated with PCM under different operating modes. Energy 2023, 285, 129440. [Google Scholar] [CrossRef]
  23. GB 55015-2021; General Code for Building Energy Efficiency and Renewable Energy Utilization. Ministry of Housing and Urban-Rural Development, China Architecture & Building Press: Beijing, China, 2021.
  24. JGJ/T 67-2019; Design Standard for Office Buildings. Ministry of Housing and Urban-Rural Development, China Architecture & Building Press: Beijing, China, 2019.
  25. El-Sawi, A.; Haghighat, F.; Akbari, H. Assessing long-term performance of centralized thermal energy storage system. Appl. Therm. Eng. 2014, 62, 313–321. [Google Scholar] [CrossRef]
  26. Peng, J.; Lu, L.; Yang, H.; Ma, T. Validation of the Sandia model with indoor and outdoor measurements for semi-transparent amorphous silicon PV modules. Renew. Energy 2015, 80, 316–323. [Google Scholar] [CrossRef]
  27. Peng, J.; Curcija, D.C.; Lu, L.; Selkowitz, S.E.; Yang, H.; Mitchell, R. Developing a method and simulation model for evaluating the overall energy performance of a ventilated semi-transparent photovoltaic double-skin facade. Prog. Photovolt. Res. Appl. 2016, 24, 781–799. [Google Scholar] [CrossRef]
  28. Marei, Y.A.; Emam, M.; Ahmed, M.E.; Attia, A.A.; Abdelrahman, M.A. Thermal and optical investigations of various transparent wall configurations and building integrated photovoltaic for energy savings in buildings. Energy Convers. Manag. 2024, 299, 117817. [Google Scholar] [CrossRef]
  29. Touma, A.A.; Ouahrani, D. Evaporatively-cooled façade integrated with photovoltaic thermal panel applied in hot and humid climates. Energy 2019, 172, 409–422. [Google Scholar] [CrossRef]
  30. Park, K.E.; Kang, G.H.; Kim, H.I.; Yu, G.J.; Kim, J.T. Analysis of thermal and electrical performance of semi-transparent photovoltaic (PV) module. Energy 2010, 35, 2681–2687. [Google Scholar] [CrossRef]
  31. Reinhart, F.C.; Herkel, S. The simulation of annual daylight illuminance distributions—A state-of-the-art comparison of six RADIANCE-based methods. Energy Build. 2000, 32, 167–187. [Google Scholar] [CrossRef]
  32. Reinhart, F.C.; Andersen, M. Development and validation of a Radiance model for a translucent panel. Energy Build. 2006, 38, 890–904. [Google Scholar] [CrossRef]
  33. Fan, Y.; Xia, X. Energy-efficiency building retrofit planning for green building compliance. Build. Environ. 2018, 136, 312–321. [Google Scholar] [CrossRef]
  34. Carlucci, S.; Causone, F.; De Rosa, F.; Pagliano, L. A review of indices for assessing visual comfort with a view to their use in optimization processes to support building integrated design. Renew. Sustain. Energy Rev. 2015, 47, 1016–1033. [Google Scholar] [CrossRef]
  35. Cheng, P.Y. Effects of the entropy weight on TOPSIS. Expert Syst. Appl. 2020, 168, 114186. [Google Scholar] [CrossRef]
  36. Yang, H.; Liu, N.; Li, M.; Gu, M.; Gao, Q. Design and optimization of heat pipe-assisted liquid cooling structure for power battery thermal management based on NSGA-II and entropy Weight-TOPSIS method. Appl. Therm. Eng. 2025, 272, 126416. [Google Scholar] [CrossRef]
  37. Aires, F.D.F.R.; Ferreira, L. A new approach to avoid rank reversal cases in the TOPSIS method. Comput. Ind. Eng. 2019, 132, 84–97. [Google Scholar] [CrossRef]
  38. Salvatore, C.; Menelaos, T. A robust TOPSIS method for decision making problems with hierarchical and non-monotonic criteria. Expert Syst. Appl. 2023, 214, 119045. [Google Scholar]
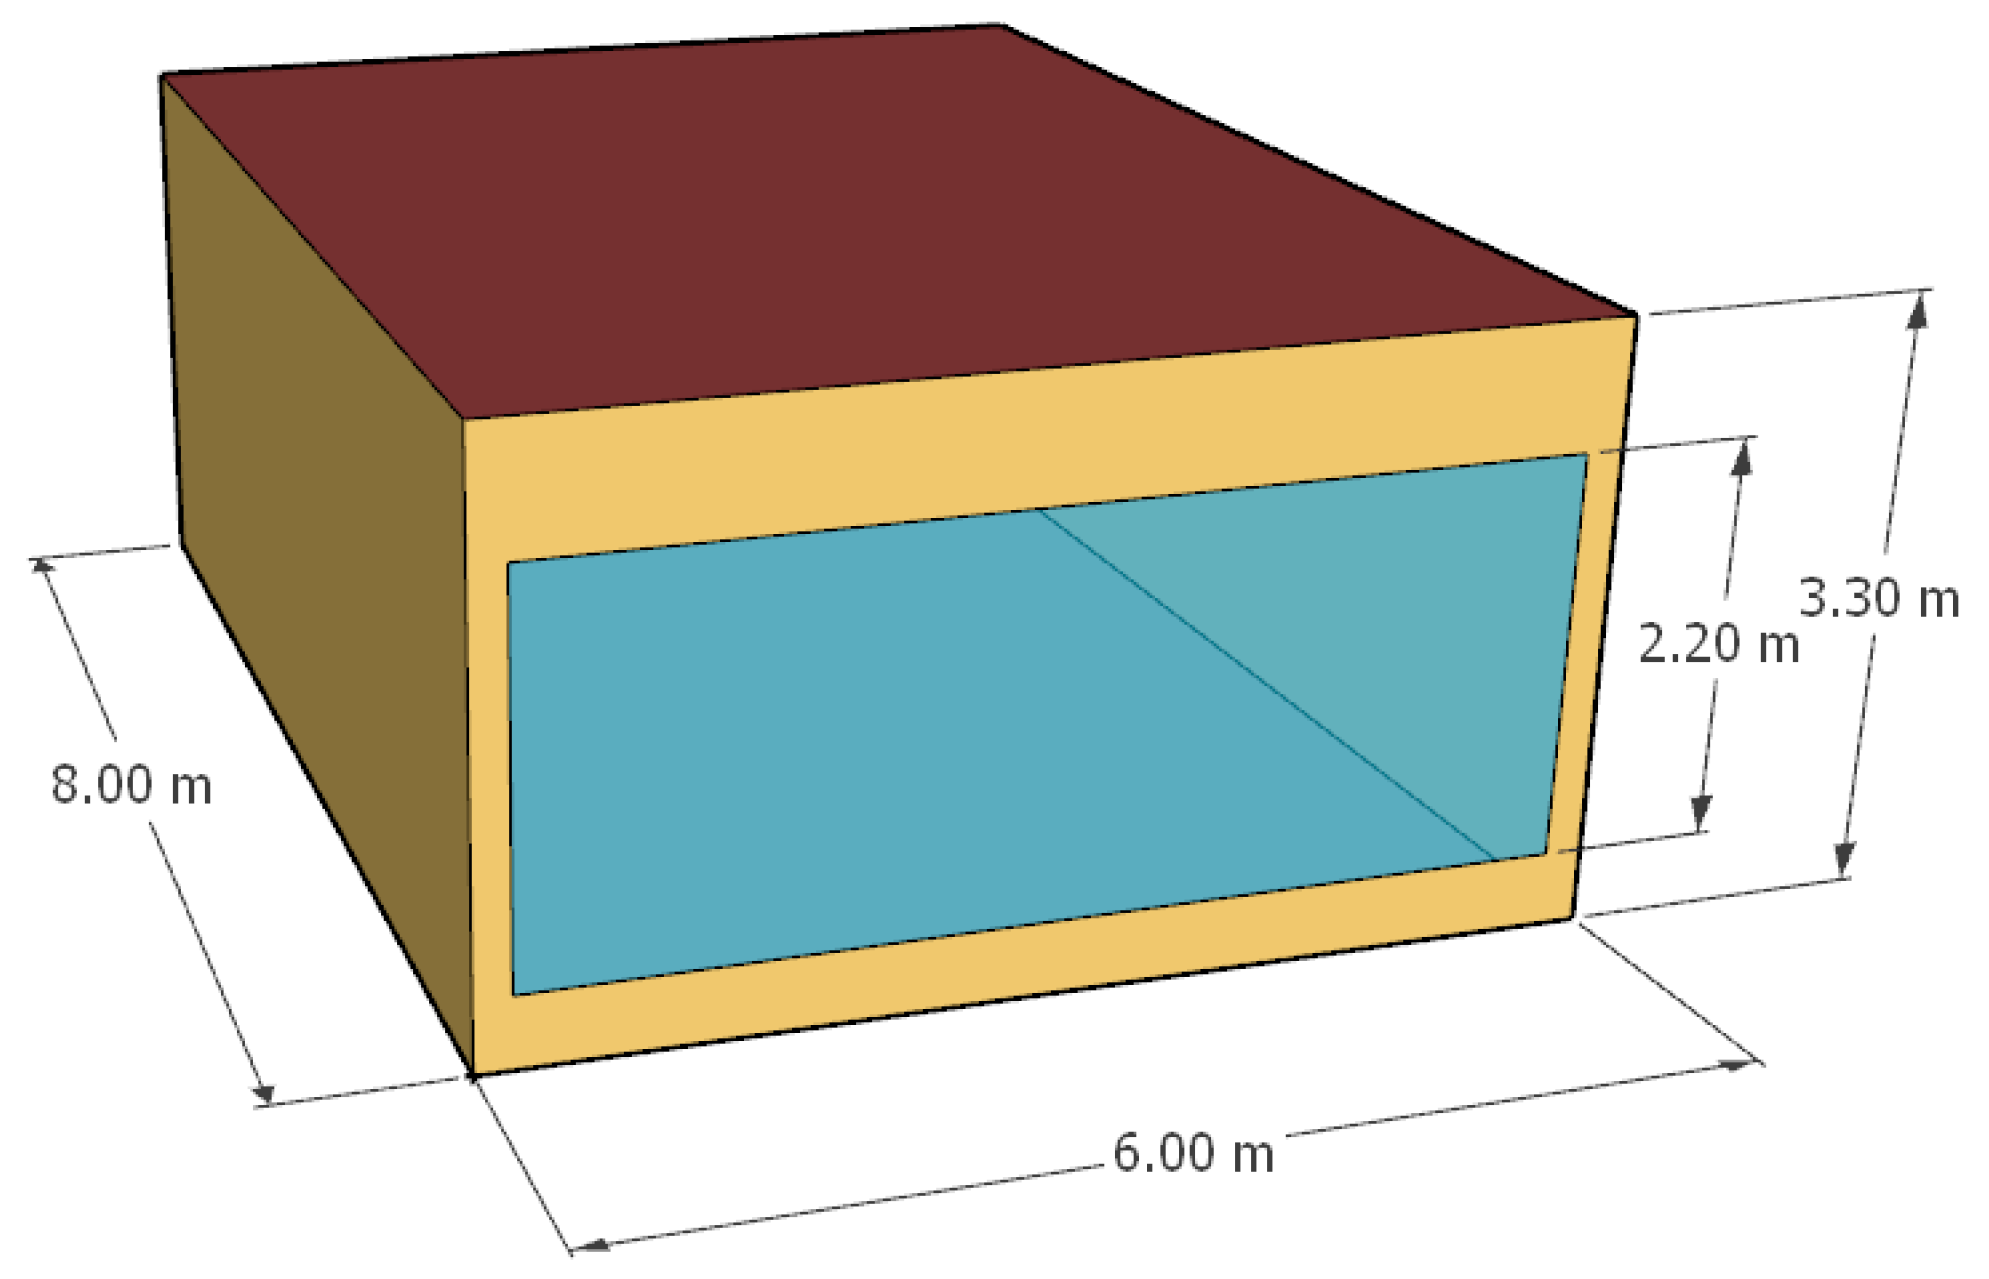
Figure 1. Architectural model.
Buildings 15 03296 g001
Figure 2. Flowchart.
Buildings 15 03296 g002
Figure 3. Office working environment.
Buildings 15 03296 g003
Figure 4. Schematic diagrams of different PV windows.
Buildings 15 03296 g004
Figure 5. Three-domain functional CdTe PV window plane design.
Buildings 15 03296 g005
Figure 6. Design of three-domain utilitarian CdTe PV window.
Buildings 15 03296 g006
Figure 7. Building energy consumption value of different schemes: (a) Area2 0%; (b) Area2 10%; (c) Area2 20%; (d) Area2 30%.
Buildings 15 03296 g007
Figure 8. Building net energy consumption value of different schemes.
Buildings 15 03296 g008
Figure 9. The impact of photovoltaic coverage (a) and layout on (b) building energy-saving rate.
Buildings 15 03296 g009
Figure 10. The impact of PV coverage on UDI.
Buildings 15 03296 g010
Figure 11. The influence of photovoltaic layout on UDI.
Buildings 15 03296 g011
Figure 12. Horizontal illumination.
Buildings 15 03296 g012
Figure 13. Indoor UDI300lx–2000lx in different layouts.
Buildings 15 03296 g013
Figure 14. Time ratio of UDI300lx–2000lx for different windows.
Buildings 15 03296 g014
Table 1. Parameter settings.
ItemValue
Winter indoor temperature18 °C
Summer indoor temperature26 °C
Lighting power density12 W/m2
Electrical equipment power density13 W/m2
Per capita occupied floor area10 m2/person
Air change rate per hour0.5 times/hours
Table 2. Glass parameters.
Density
/(kg/m3)
Specific Heat Capacity/(J/(kg∙K))Thermal Conductivity
/(W/(m∙K))
Solar Transmittance/%Visible Light Transmittance/%
Photovoltaic Glass30006910.81516
Glass25008200.767389
Table 3. The top five programs with a comprehensive score.
SchemeESR/%UDI300lx–2000lx/%
The top five schemes with comprehensive scoringV1-90%-V2-10%-H3-90%11.156.95
V1-80%-V2-20%-V3-80%9.157.33
V1-90%-V2-20%-H3-90%8.757.28
V1-80%-V2-20%-H3-80%10.656.76
V1-90%-V2-20%-V3-90%6.857.6
The optimal scheme for energy-saving rateV1-60%-V2-20%-H3-60%12.654.42
The optimal scheme for light comfortV1-80%-V2-30%-V3-80%2.857.9
Disclaimer/Publisher’s Note: The statements, opinions and data contained in all publications are solely those of the individual author(s) and contributor(s) and not of MDPI and/or the editor(s). MDPI and/or the editor(s) disclaim responsibility for any injury to people or property resulting from any ideas, methods, instructions or products referred to in the content.