Article

Research on the Distribution of the Energy-Saving Benefits of Building Geometric Parameters Under Different Climate Conditions

1
China Building Technique Group Co., Ltd., Beijing 100013, China
2
School of Architecture, Inner Mongolia University of Technology, Hohhot 010051, China
3
China Academy of Building Research, Beijing 100013, China
4
Ningxia Building Technology and Industrialization Development Center, Yinchuan 750004, China
*
Author to whom correspondence should be addressed.
Buildings 2025, 15(17), 3176; https://doi.org/10.3390/buildings15173176
Submission received: 2 July 2025 / Revised: 18 August 2025 / Accepted: 2 September 2025 / Published: 4 September 2025
(This article belongs to the Special Issue Advanced Technologies in Building Energy Saving and Carbon Reduction)

Abstract

Building geometric parameters are key factors influencing energy-efficient building design. However, the systematic influence of building geometric parameters on energy use intensity (EUI) across varying climate regions and building envelope thermal performance levels remains incompletely elucidated, hindering the quantitative assessment of their energy-saving benefits in diverse regions and operational scenarios. This study employs a zonal sensor-optimized coupled daylighting–thermal simulation to analyze the impact of building geometric parameters and their values on annual total EUI across different climate regions and building envelope thermal performance levels. The interquartile range (IQR), sensitivity analysis (SA), and energy saving rate (ESR) analysis are utilized. The results showed the following: (1) The energy-saving benefits of geometric parameters were the greatest in severe cold (SevC) and temperate regions (TRs), with IQRs ranging from 28.50 to 39.87 kWh/m2, followed by hot summer–warm winter (HS-WW), cold (Cld), and hot summer–cold winter (HS-CW) regions. While high-performance building envelopes significantly reduce EUI, the energy-saving benefits associated with geometric parameters remain undiminished. (2) The WWR is the parameter most sensitive to EUI, with SA reaching a maximum of 41.19%, notably exceeding 20% in HS-CW regions, HS-WW regions, and TRs; floor height has the lowest sensitivity, with SA reaching a maximum of 5.65%. (3) In different climate regions, the influence of floor height and building footprint area on the ESR shifts between positive and negative correlations, while the WWR and window sill height consistently exhibit positive correlations with the ESR in all climate regions. This study provides a quantitative decision-making basis for optimizing building geometric parameters in different climate regions to achieve high-performance building shapes during the early stages of architectural design.

1. Introduction

The building sector is one of the top three energy-consuming sectors, alongside industry and transportation, accounting for 40–55% of total societal energy consumption, with a continuing upward trend [1]. Building geometric design forms an energy-efficient foundation and is a critical component of the building sector [2]. Compared to selecting high-performance materials or improving active equipment, geometric design can significantly reduce costs and enhance energy efficiency [3]. In this context, high-performance building geometric design strategies focused on energy conservation have represented a key strategy for addressing the challenges posed by rising building energy use intensity (EUI).
Climate conditions are a primary consideration in building energy-efficient design [4]. Previous studies have shown that building EUI exhibits high sensitivity to changes in building geometric parameters, and the same building geometric parameters may necessitate different energy-efficient design strategies under different climate conditions [5]. In cold regions, the focus is on reducing winter heat loss, while in hot regions, the emphasis is on promoting ventilation and heat dissipation. Regions with cold winters and hot summers, as well as temperate regions, require a balance between seasonal climate changes. This is primarily because geometric parameters influence the amount of solar radiation a building receives and the convective heat transfer rate between the building and its surrounding microclimate [6]. Therefore, exploring the energy-saving design patterns of building geometric parameters adapted to climate conditions holds significant importance for the overall EUI and emission reduction efforts of the construction industry [7].
Studies have been conducted in specific climate regions to investigate the mechanisms underlying the interaction between climate conditions and building geometric parameters. Goia [8] et al. researched temperate marine climate conditions and examined the effects of orientation, the window-to-wall ratio (WWR), and three different geometric shapes on annual heating, cooling, and lighting consumption in single-layer curtain wall office buildings. The results indicated that regardless of building orientation and facade area when the transparent portion accounts for 35–45% of the total curtain wall module area, total EUI is minimized. Additionally, the surface area-to-volume ratio (SA: V) influences total EUI but does not alter the optimal WWR. Shadram [9] et al. also studied the impact of different WWRs and six different geometric shapes on the lifecycle EUI of multi-family residential buildings under temperate marine climate conditions. They found that rectangular and H-shaped buildings have the lowest and highest lifecycle EUIs, respectively, and that a WWR between 0.2 and 0.5 is typically an ideal range. Giouri [10] et al. found that compact building shapes offer advantages for reducing cooling loads in Mediterranean climates. Meanwhile, elongated rectangular shapes, benefiting from their smaller depth, offer advantages for natural lighting, thereby reducing artificial lighting loads. Another study [11] conducted on a high-rise office building in China’s cold climate region found that linear floor plans and point-type buildings had the lowest EUI, and there were significant differences in EUI between different building shapes and floor plan layouts (up to 17%). Singh [12] et al. found that in mixed humid climates, office building EUI exhibited the highest sensitivity to the WWR and aspect ratio. Susorova [13] et al. reported a significant correlation between geometric parameters in extremely cold climates and EUI, whereas Sekki [14] et al. found no significant correlation.
In addition, researchers have begun to include multiple climate regions and conduct comparative analyses of the energy-saving patterns of building geometric parameters in different climate regions. Gonca [15] divided Turkey into five climate regions based on Turkish climate standards and examined the impact of 15 different building geometric shapes, WWRs, and building orientations on heating and cooling EUI in industrial buildings, using five representative cities as case studies. Their study concluded that the optimal building geometries varied under different urban climate conditions and that different climate regions have distinct requirements for the WWR. Deng [16] et al. used library buildings in China’s four major climate regions as examples to investigate the effects of four different building geometric parameters on building energy efficiency. The results indicate that slab-shaped buildings demonstrate higher energy efficiency in most climate regions under the same building area. In contrast, block-shaped and E-shaped buildings are more suitable for hot summer–warm winter regions. Another study [17] demonstrated, through three high-rise building cases in New York, Beijing, and Shenzhen, that rectangular shapes generally exhibit higher energy efficiency.
From a review of the studies above, it is evident that even for buildings of the same type, researchers often reach divergent conclusions. In some cases, these conclusions are even completely contradictory. The primary reason stems from significant variations in simulation methods and parameter settings, which hinder the comprehensive comparison of research conclusions and impede the systematic identification of patterns influencing building EUI under different climate conditions. Therefore, it is necessary to employ a unified modeling method to analyze the impact of varying climate conditions on building EUI and explore the most influential geometric parameters in each climate [18]. In addition, apart from building geometric parameters, the thermal performance of building envelopes significantly impacts the overall EUI. However, the relationship between geometric parameters and building EUI under different thermal performance conditions of building envelopes remains poorly understood [19].
Addressing the aforementioned research gaps, this study develops a unified analytical framework to systematically investigate the influence of building geometric parameters on total annual EUI. This study selected five representative climate regions in China and considered two levels of building envelope thermal performance: standard and enhanced. Taking high-rise office buildings as the research object, a novel coupled daylighting–thermal simulation method was adopted. Utilizing correlation analysis, an interquartile range (IQR) analysis of EUI data, a sensitivity analysis (SA) of geometric parameters, and energy saving rate (ESR) analysis, this paper quantitatively elucidates the influence mechanisms and quantifies the energy-saving benefits of fundamental geometric parameters across different climate regions and building envelope thermal performance levels. These findings provide quantitative evidence and decision support for optimizing high-performance building geometries during the early design stages.

2. Methods

2.1. Variable Settings

Four geometric parameters—floor height, building footprint area, WWR, and window sill height—significantly influencing building EUI were selected as variables [3,20,21]. Each geometric parameter was set at four values, with one designated as the typical value. The geometric parameters and their values are shown in Table 1. This study employed a control variable approach to design the experimental scheme. When investigating the effect of one geometric parameter, the other three parameters were held constant at typical values. The simulation scheme encompassed five climate regions. Three representative cities were selected per region, and two envelope performance levels, standard and enhanced, were simulated for each city. This resulted in a total of 390 simulation cases.
Key criteria for selecting the four geometric parameters as variables lie in their near-universal applicability. These parameters constitute fundamental geometric elements essential to any building morphology (whether complex or simple), exhibiting high operational feasibility and exerting a direct impact on building EUI. In contrast, parameters such as building aspect ratio, orientation, number of stories, and floor plan shape exhibit values that are often significantly constrained by specific project site conditions and external regulatory codes. Hence, this study developed a clear and directly applicable combination of geometric variables for design practice, grounded in these four core parameters which are relatively unaffected by external constraints.

2.2. Simulation Model

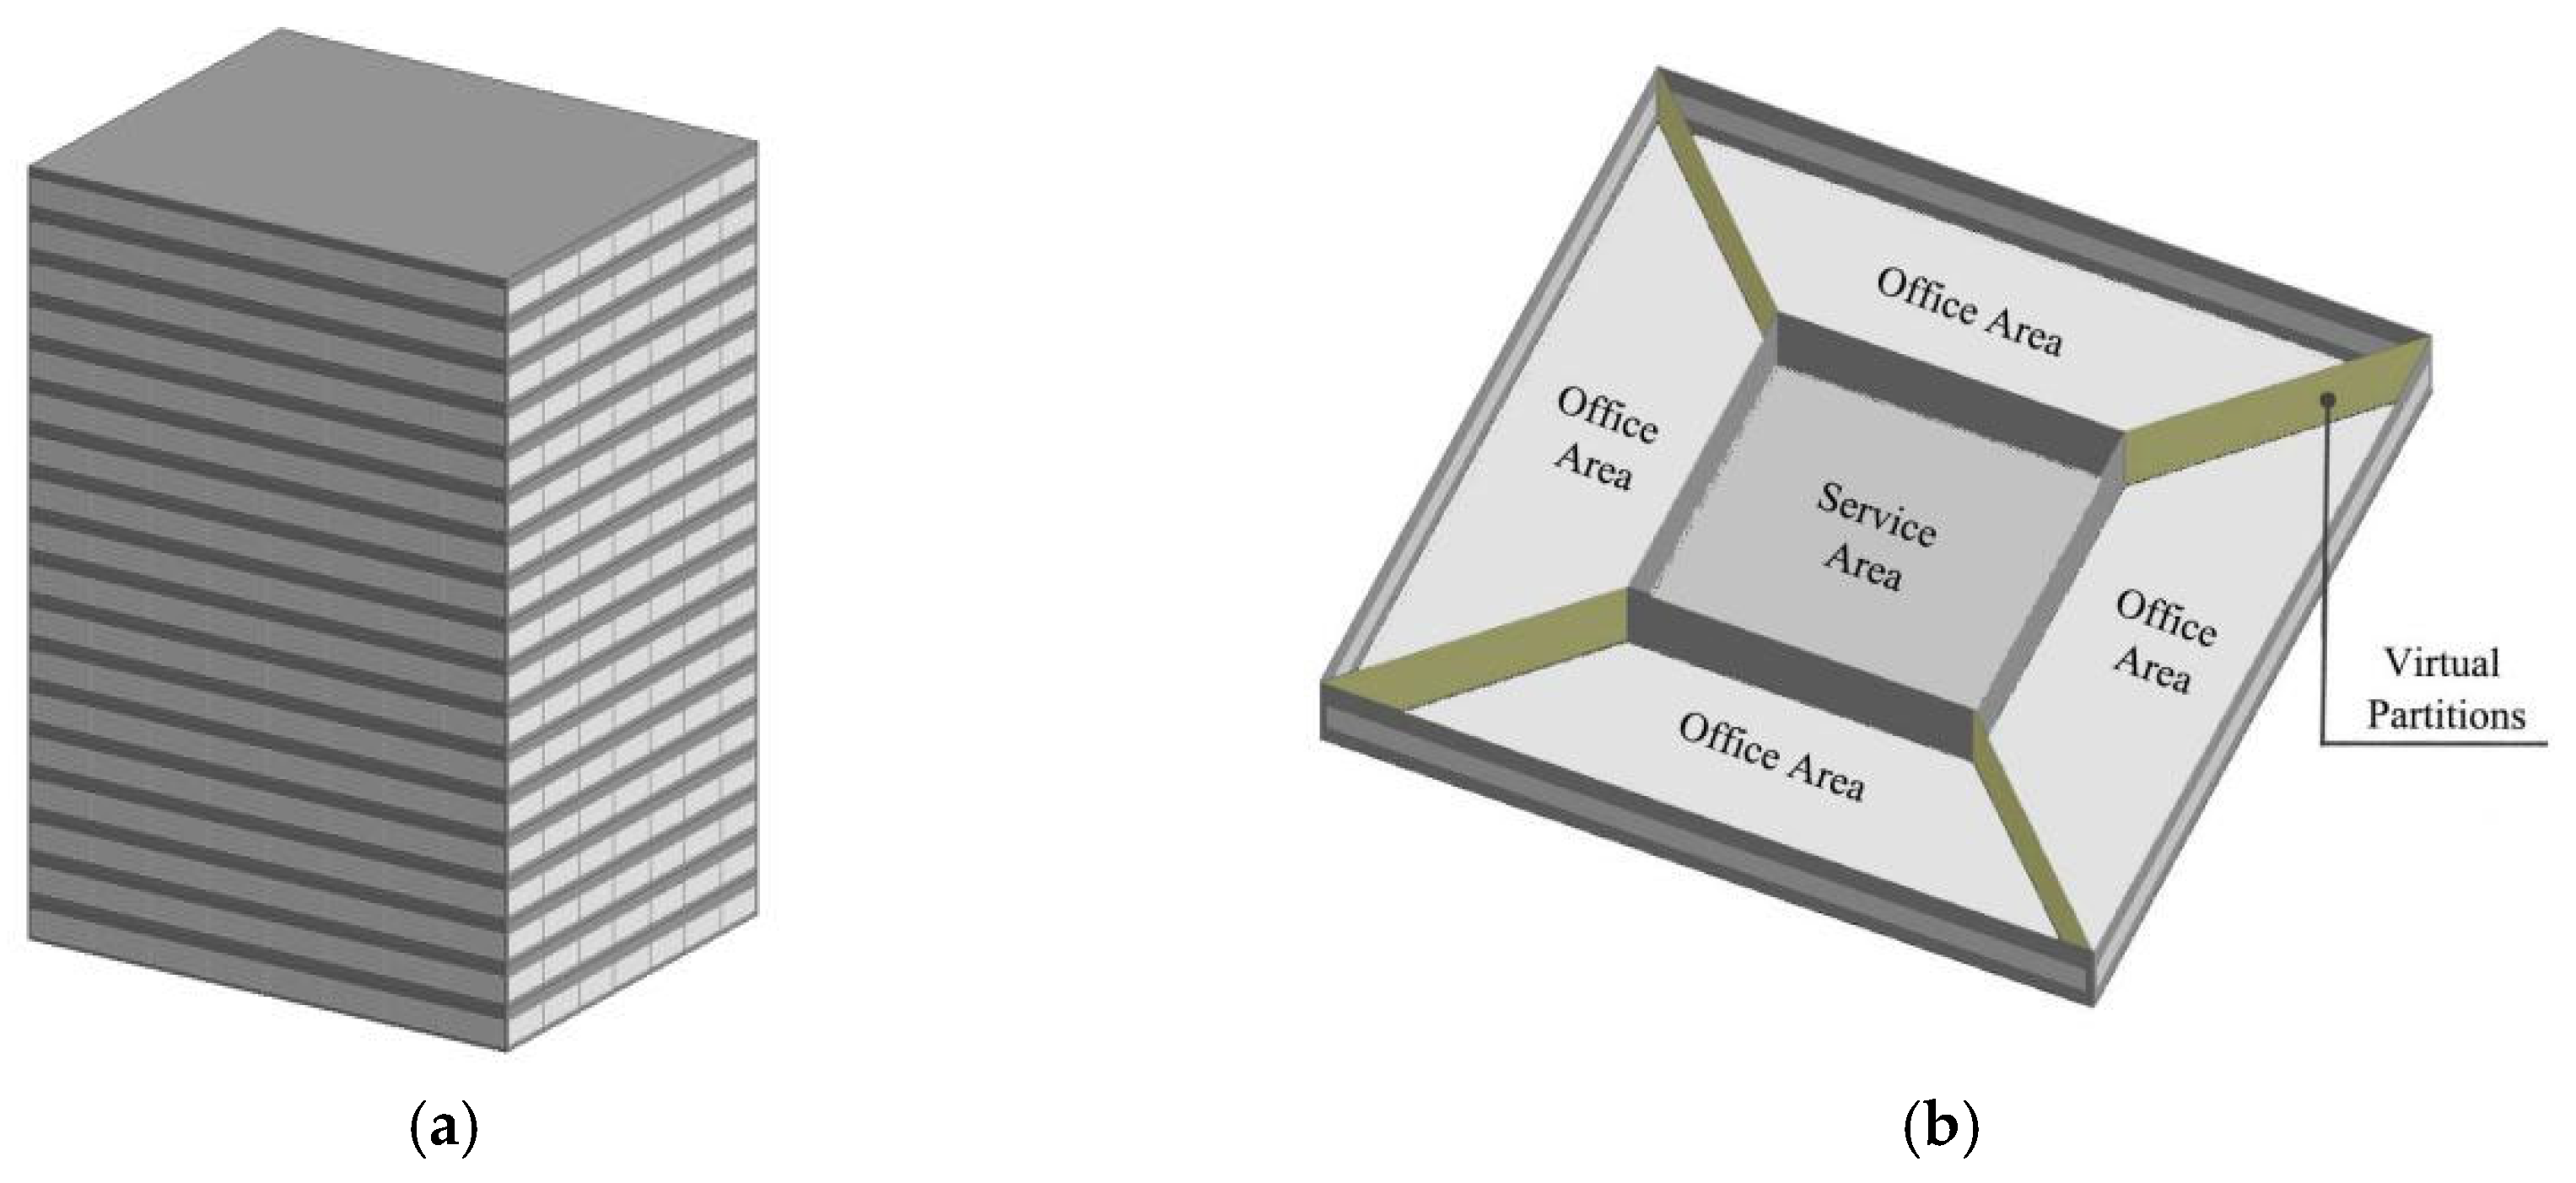
Based on the typical values derived from survey data on the geometric parameters of 60 high-rise office buildings in four regions, Beijing, Ningxia, Inner Mongolia, and Chongqing, the geometric parameter values for the simulation model were established [22]. The simulation model is a point-type high-rise office building with a rectangular plan and an aspect ratio of 5:4. Each floor plan consists of two types of spaces: office area and service area. The service area is located at the center of the plan, occupying 20% of each floor area, and houses elevators, restrooms, and other auxiliary functions. The geometric characteristics of the simulation model are shown in Figure 1.
Critical input parameters—including occupant density, indoor design temperature, design illuminance, office equipment power density, lighting power density, fresh air volume, and Coefficient of Performance (COP) values for the HVAC system—were referenced from the specified limits in relevant Chinese standards [23,24,25,26]. Detailed values are provided in Table 2. The air conditioning system selected is the commonly used fan coil system in office buildings, and the fresh air system in the service area uses the return air from the office area. Therefore, the heating and cooling EUI of the service area is not included in the total EUI calculation.

2.3. Climate Data and Operating Condition Settings

China comprises five climate regions, and the relationship between building geometric parameters and EUI varies significantly across these regions [2]. These climate regions are as follows: severe cold region (SevC), cold region (Cld), hot summer–cold winter region (HS-CW), hot summer–warm winter region (HS-WW), and temperate region (TR). China’s building energy efficiency design standards impose strict requirements on building envelope thermal performance for each climate region. Standard EnergyPlus weather files (EPW) are selected as climate data to simulate EUI for each city.
Two building envelope thermal performance levels were established: standard and enhanced. The thermal performance parameters for building envelopes under standard and enhanced conditions were set based on Standard 1 [27] and Standard 2 [28], respectively, including the thermal transmittance (U-value) of windows, walls, and roofs; the solar heat gain coefficient (SHGC) of windows; and the window airtightness level. Standard 1 [27] is the foundational mandatory standard for the energy-efficient design of public buildings. Standard 2 [28] is a higher-level technical standard targeting nearly zero-energy buildings, with significantly stricter requirements for the thermal performance of building envelopes than Standard 1. The thermal performance of exterior walls, roofs, and windows under different envelope performance conditions is shown in Table 3, Table 4 and Table 5, respectively.

2.4. Simulation Method

DesignBuilder v7.0 was used as a simulation tool. DesignBuilder utilizes EnergyPlus as its simulation engine [29]. The simulation calculates the EUI of lighting, heating, and cooling and sums these components to obtain the total EUI. Internal heat gains from lighting and office equipment were included in the simulation method.
Based on the daylighting simulation results, a zonal sensor-optimized coupled daylighting–thermal simulation was implemented in the simulation model to calculate the lighting EUI more accurately. As shown in Figure 2, when the depth is less than 6 m, natural illuminance exceeds the indoor design illuminance value, and a natural lighting zone is identified. When the depth exceeds 6 m, natural illuminance falls below the design illuminance, and an artificial lighting zone is identified.
To ensure adequate illuminance throughout the entire office area, light sensors were placed at points of minimum natural illuminance: sensors were placed in the natural lighting zone at the 6 m depth, while in the artificial lighting zone, they were placed 2.1 m from interior walls, considering the reflective contribution of interior walls. Each sensor controlled lighting equipment proportional to its zone’s floor area ratio, while a continuous dimming algorithm dynamically adjusted electric lighting output in response to daylight availability.
It is worth noting that previous research approximated the illumination EUI by placing a single illuminance sensor at the geometric center of space [30]. This may result in insufficient illumination in deep areas, leading to lighting EUI calculations with errors potentially reaching 9% to 14% [31]. In contrast, zonal sensor-optimized coupled daylighting–thermal simulation divided the entire area into natural and artificial lighting areas to respond to the linear changes in natural light through two illuminance sensors. This can ensure that the whole office area could meet the illuminance requirements, making the lighting EUI calculation results more realistic.

2.5. Data Analysis Methods

The influence of geometric parameters on total EUI was analyzed using the interquartile range (IQR), sensitivity analysis (SA), and energy saving rate (ESR). The dispersion of EUI data provides valuable insight for revealing the energy-saving benefits of design parameters [32]. The IQR measures the dispersion of EUI data. The IQR is the core indicator of the middle 50% of EUI data dispersion. A larger IQR indicates greater energy-saving benefits, while a smaller IQR indicates the opposite. SA quantifies the relative influence of specific geometric parameters on EUI, where a higher SA value indicates stronger parametric influence on EUI [33]. The ESR quantifies the energy-saving effect of specific design parameter values on EUI, with higher values indicating more favorable configurations for EUI reduction [34].
The IQR is calculated as follows:
I Q R = Q 3 Q 1
where I Q R is the interquartile range; Q 1 is the first quartile, the value at the 25% position after sorting the EUI data from smallest to largest; and Q 3 is the third quartile, the value at the 75% position. The ESR for a specific geometric parameter value is calculated as follows:
ξ c = ( E r e f E a l t ) E r e f × 100 %
where ξ c is the energy saving rate for a specific geometric parameter value; E r e f is the EUI obtained when the geometric parameter adopts a typical value kWh/m2; E a l t is the EUI obtained when the geometric parameter adopts a non-typical value kWh/m2. The sensitivity of a geometric parameter is defined as follows:
ξ m a x ξ m i n = ξ c o
where ξ m a x is the maximum ESR obtained by the geometric parameter, ξ m i n is the minimum ESR obtained by the geometric parameter, and ξ c o is the sensitivity of the geometric parameter to EUI.
In addition, Spearman rank correlation analysis was employed to quantify the statistical associations between geometric parameters (e.g., floor height, WWR), climate regions, envelope performance, and EUI values. This analysis allowed for the identification of dominant influencing factors and their interdependencies, complementing the IQR, SA, and ESR frameworks.

3. Results

3.1. EUI Distribution

Figure 3 shows the distribution of EUI data for all simulation cases. Under standard envelope performance, SevC is the climate region with the highest EUI, with an average EUI of around 50 kWh/m2, followed by HS-WW, HS-CW, Cld, and the TR. Under enhanced envelope performance, HS-WW has the highest EUI, with an average EUI of approximately 42 kWh/m2, followed by HS-CW, SevC, Cld, and the TR. It is evident that during the transition from standard envelope performance to enhanced, EUI in SevC decreases significantly, with a reduction of approximately 13 kWh/m2. In some cases, EUI even falls below that of Cld. Additionally, due to its mild winters and cool summers, the TR consistently has the lowest EUI among the five climate regions, with an average EUI of approximately 25 kWh/m2.

3.2. Correlation Analysis

Across all test groups, the correlation analysis between geometric parameters, climate region, envelope performance, and EUI is presented in Table 6. Spearman correlation analysis indicates that the WWR exhibits a statistically significant association with EUI values at the 0.01 level (p = 0.001). Window sill height also shows a statistically significant association with EUI at the 0.05 level (p = 0.074). Concurrently, both climate region and envelope performance demonstrate stronger correlations with EUI. This underscores the dominant influence of climate conditions and envelope performance on EUI, highlighting their primary role in determining building energy consumption.
Notably, the correlations for floor height (p = 0.818) and building footprint area (p = 0.831) with EUI did not reach statistical significance. However, this absence of correlation does not imply that their influence is negligible. The effects of these geometric parameters may exhibit strong climate region dependency: for instance, floor height demonstrates a significantly positive correlation with EUI in the Cld region, yet a significantly negative correlation is seen in temperate regions. This relationship causes the opposing effects to neutralize each other in statistical analysis, resulting in a lack of overall correlation.

3.3. IQR Analysis

The energy-saving benefits were evaluated based on the IQR of geometric parameters in different climate regions, as shown in Figure 4. The ranking of climate regions by energy-saving benefits remained consistent under both envelope performance levels. Under standard envelope performance, SevC and TR exhibited the most significant energy-saving benefits, with IQRs of 39.87 and 28.50 kWh/m2, respectively. These were followed by HS-WW (21.20 kWh/m2), Cld (8.80 kWh/m2), and HS-CW (5.06 kWh/m2). Under enhanced envelope performance, TR and SevC still exhibited the greatest benefits, with IQRs of 31.61 and 31.15 kWh/m2, respectively. These were followed by HS-WW (18.08 kWh/m2), Cld (15.06 kWh/m2), and HS-CW (6.25 kWh/m2).
Crucially, the IQR showed no significant reduction under enhanced envelope performance. The mean IQR across all regions was 20.69 kWh/m2 under standard envelope performance and 20.43 kWh/m2 under enhanced performance, representing only a marginal decrease of 0.26 kWh/m2. This means that despite significant reductions in absolute EUI under enhanced envelope performance, the relative influence of geometric parameters on total EUI remained basically unchanged.

3.4. SA

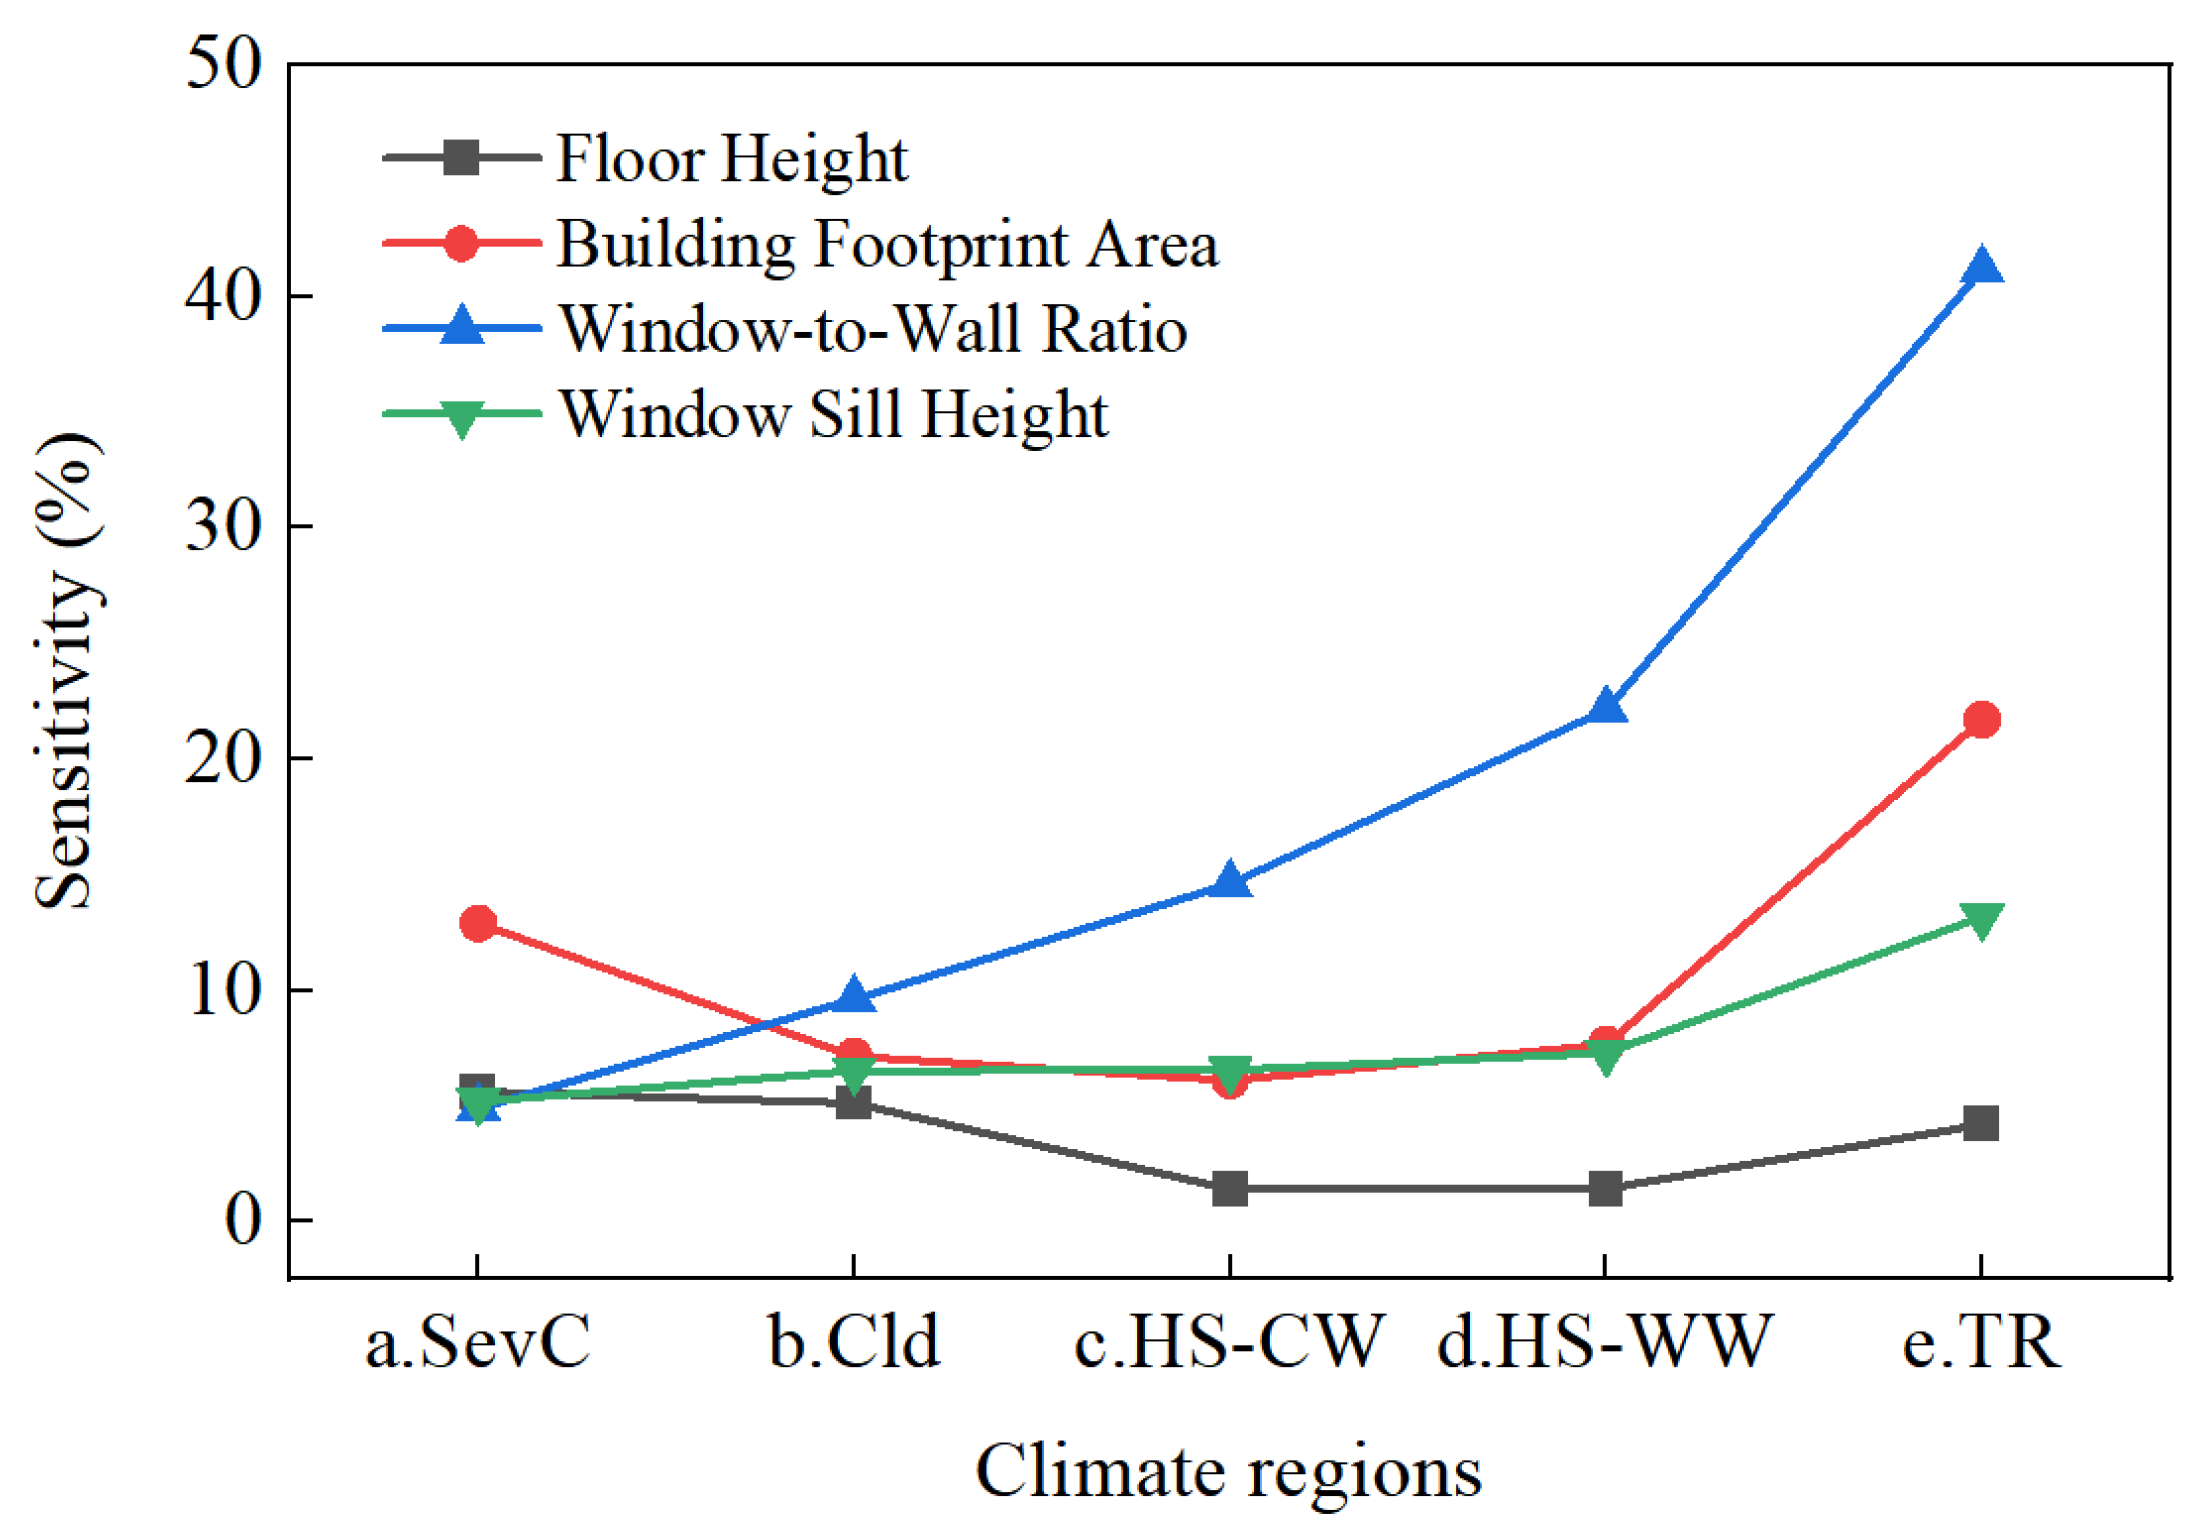
The sensitivity of geometric parameters to total EUI is presented in Figure 5 and Figure 6. WWR sensitivity ranged from 4.91% to 41.19% across both envelope performance levels. The WWR consistently exhibited the highest sensitivity, except in the SevC region under standard envelope performance, exceeding 20% in HS-CW, HS-WW, and the TR. The sensitivity of floor height ranged from 0.49% to 5.65%, the lowest among the four parameters. The sensitivity of building footprint area and window sill height ranged from 0.89% to 22.69% and 5.20% to 13.48%, respectively. Except in the SevC region under standard envelope performance, the sensitivity of building footprint area and window sill height was lower than that for the WWR but higher than that for floor height.

3.5. ESR Analysis

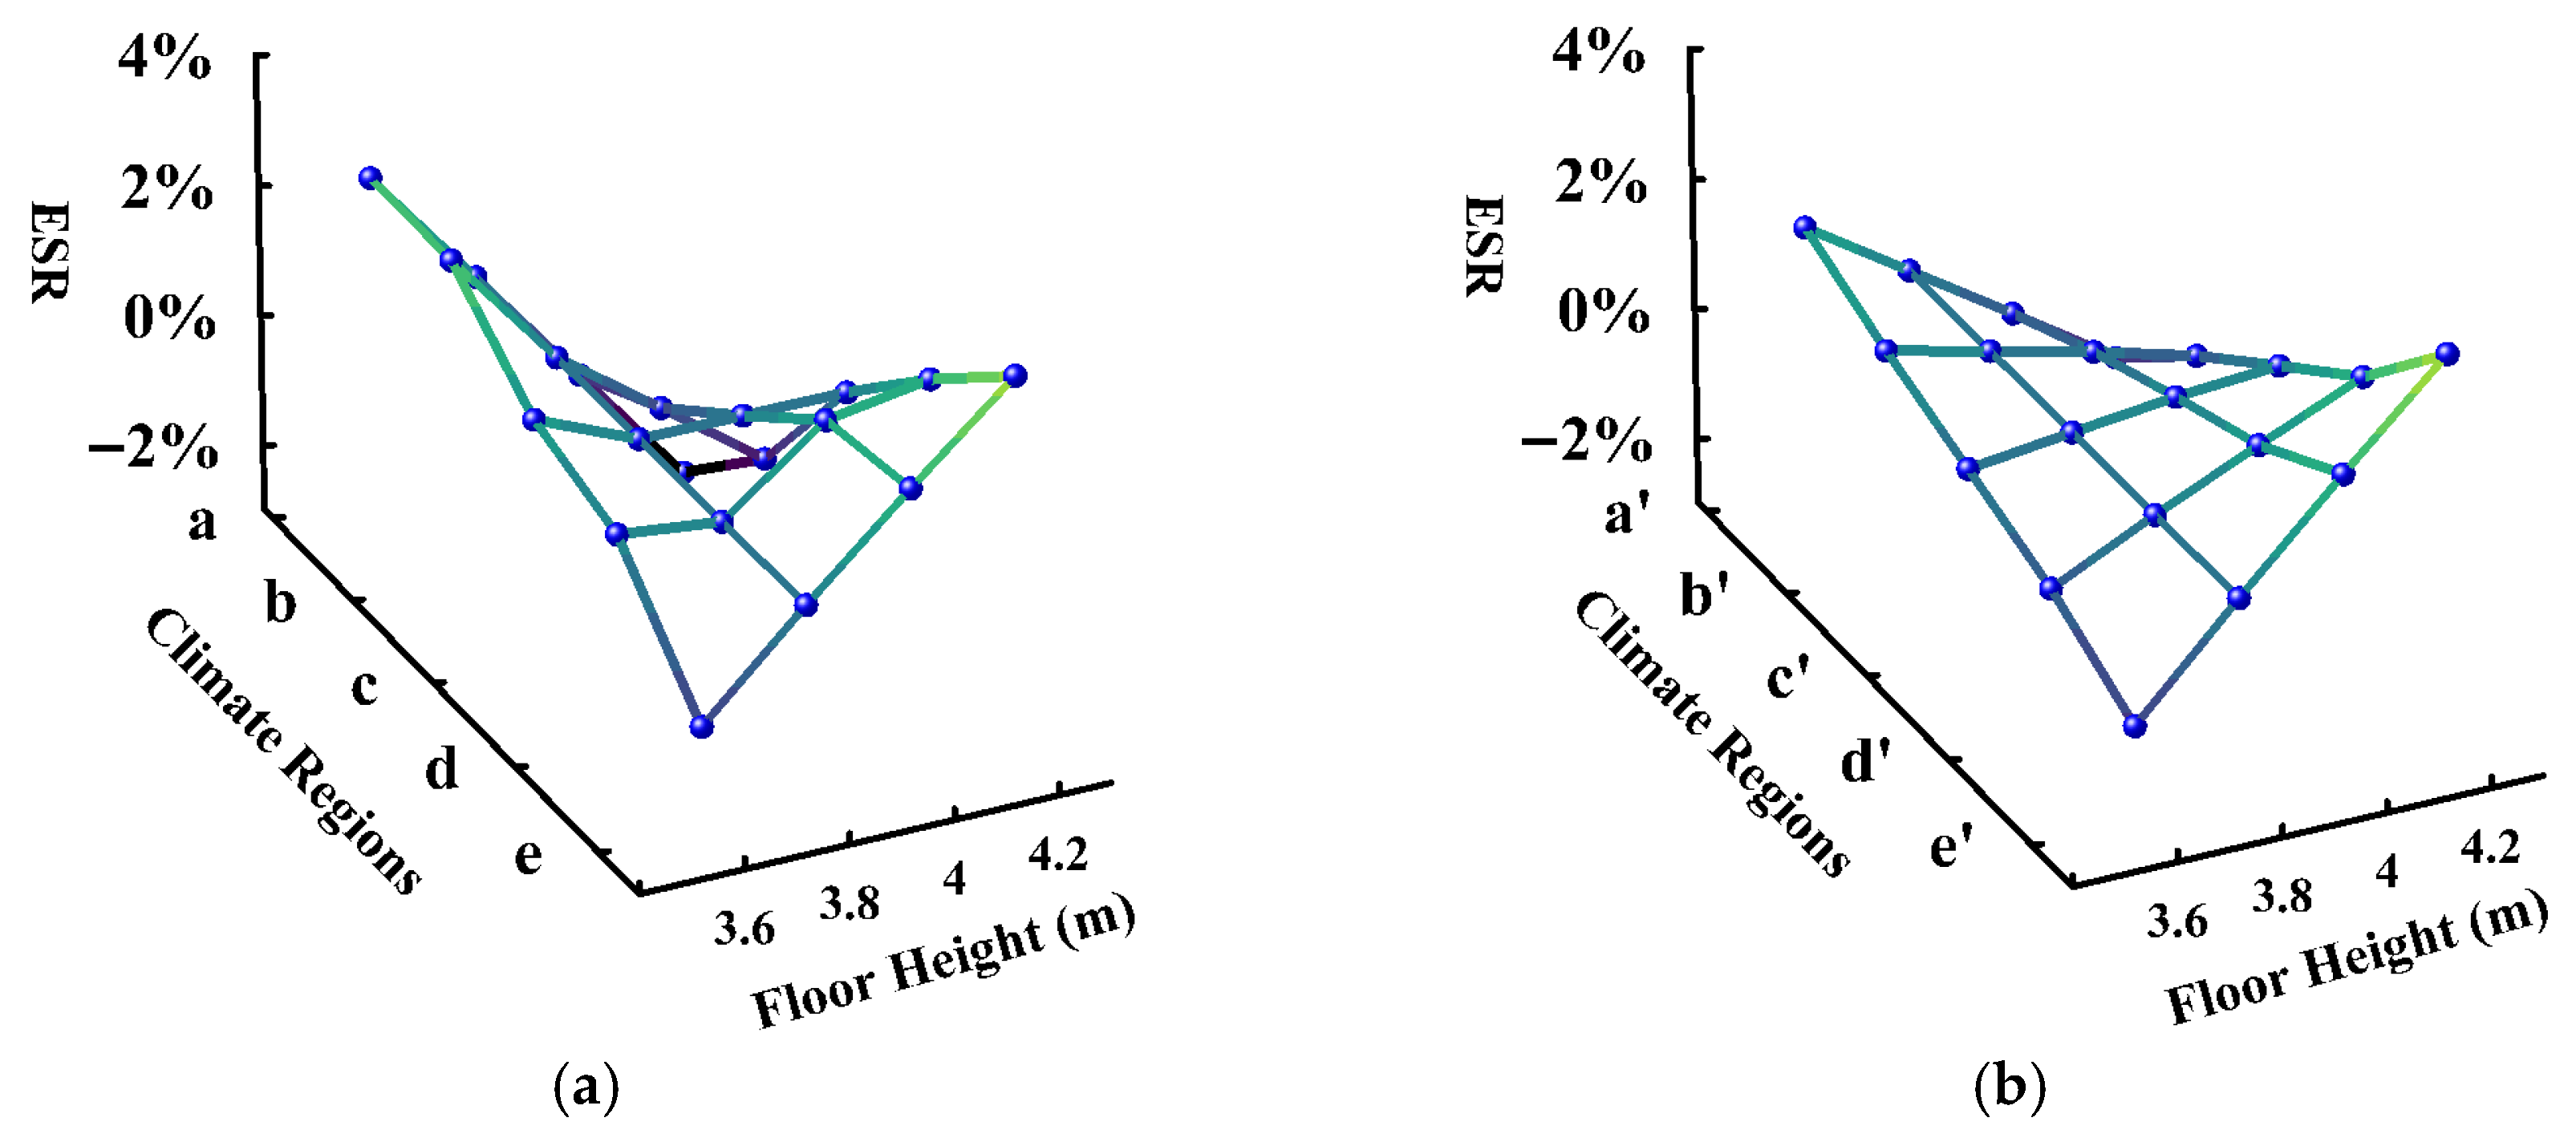
Figure 7 presents the ESR for different floor heights. Under standard envelope performance, increasing floor height led to a decreased ESR in the SevC and Cld regions but an increased ESR in HS-WW and the TR. Under enhanced envelope performance, the ESR trend for floor height was consistent.
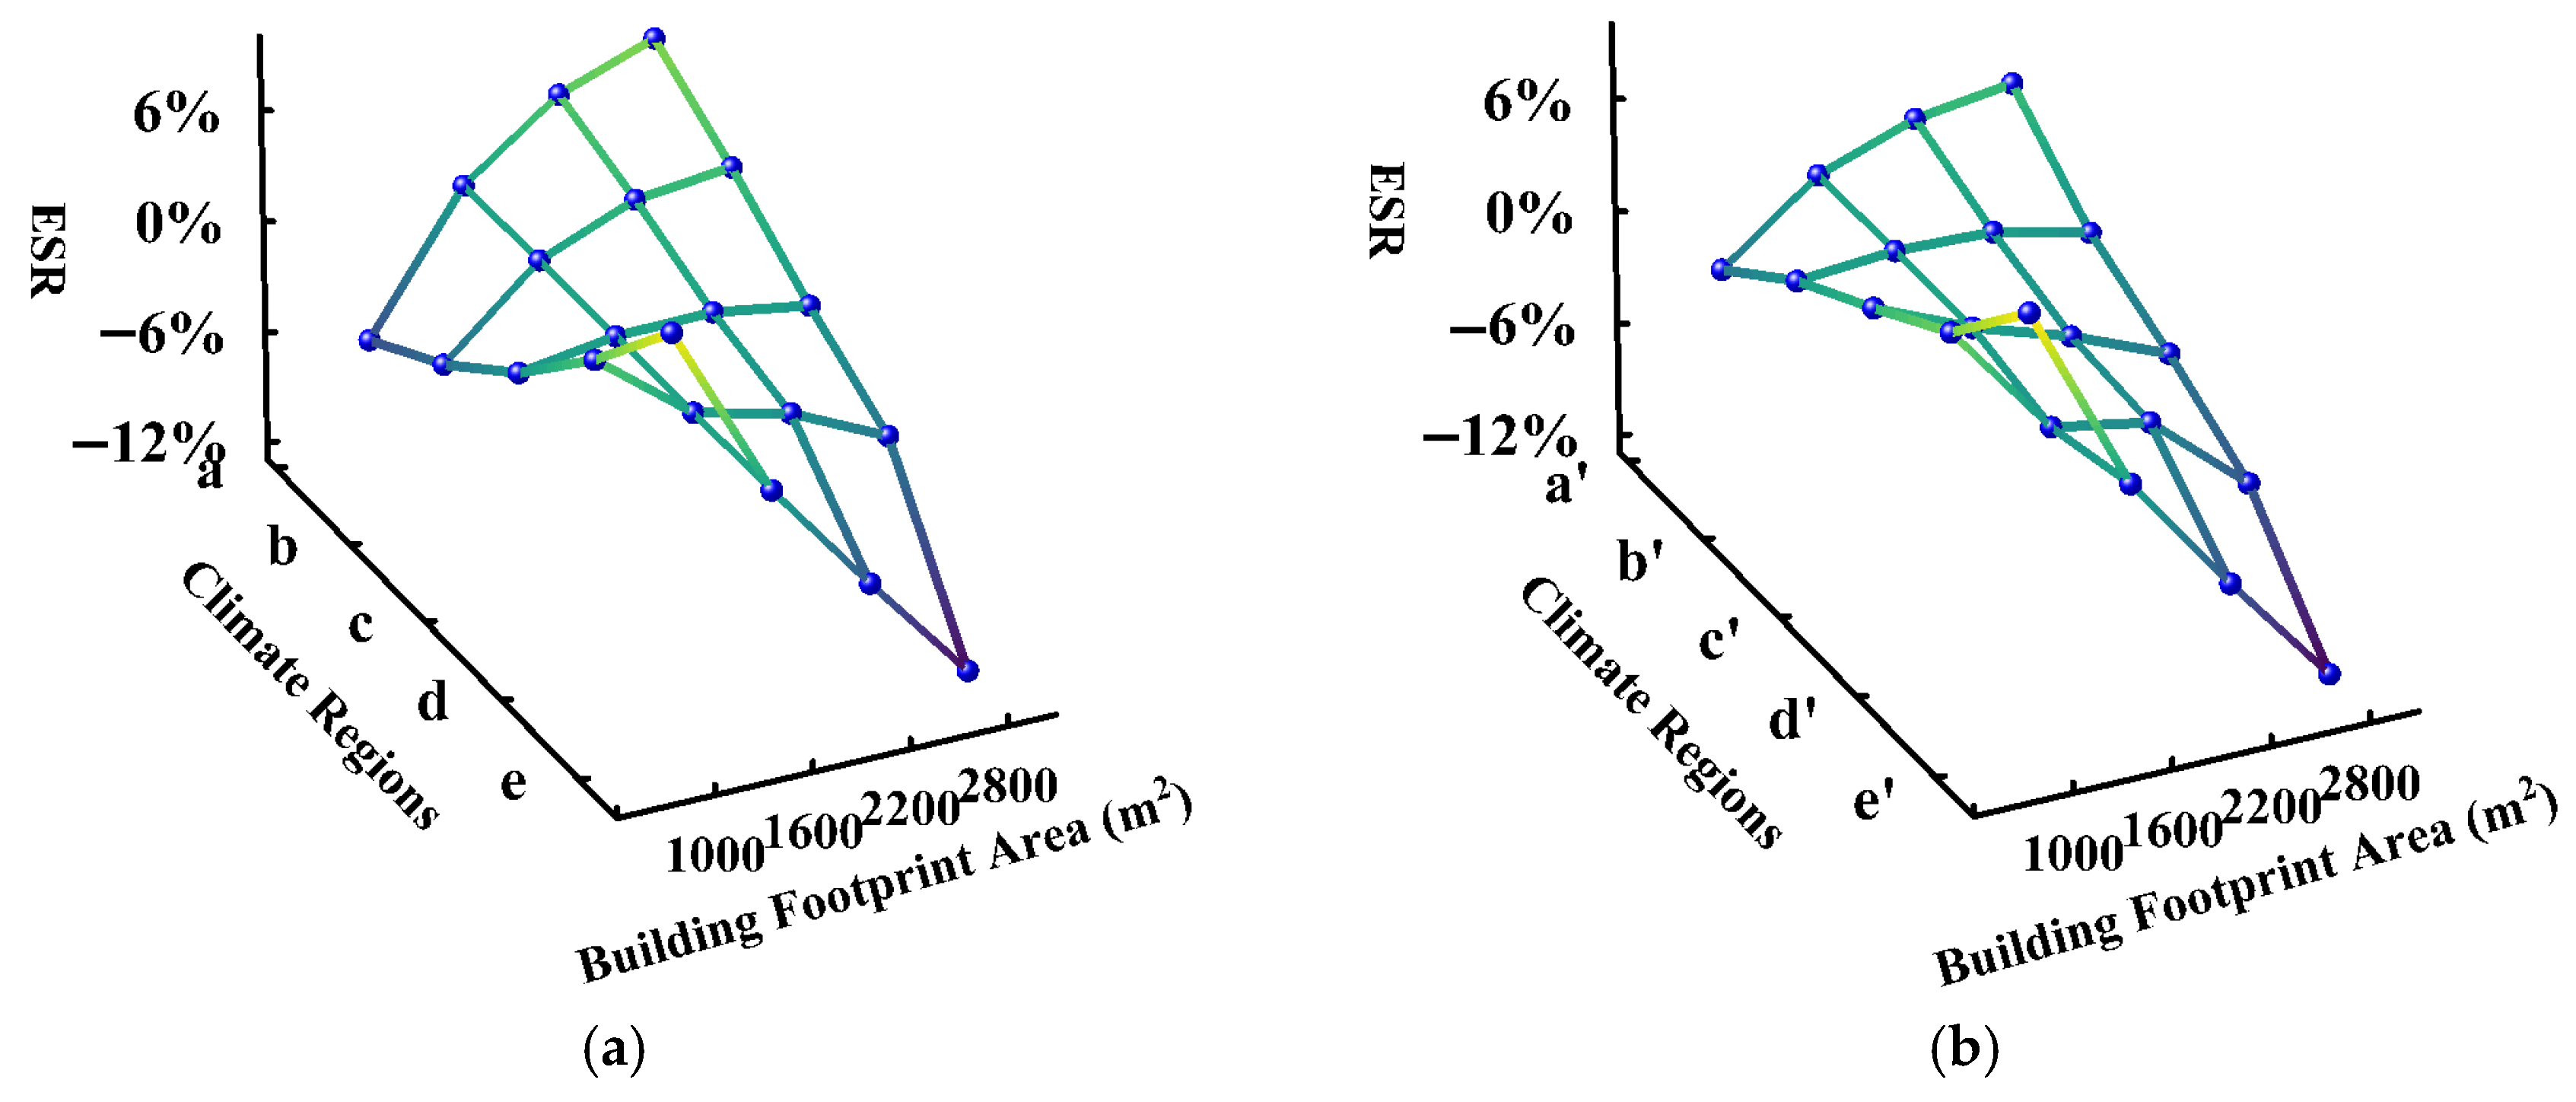
Figure 8 shows the ESR for different building footprint areas. The ESR trend for building footprint area was opposite to that for floor height. Under standard envelope performance, expanding the building footprint area increased the ESR in the SevC and Cld regions but decreased the ESR in HS-CW and the TR. Under enhanced envelope performance, the ESR trend in building footprint area remained consistent with that under standard envelope performance.
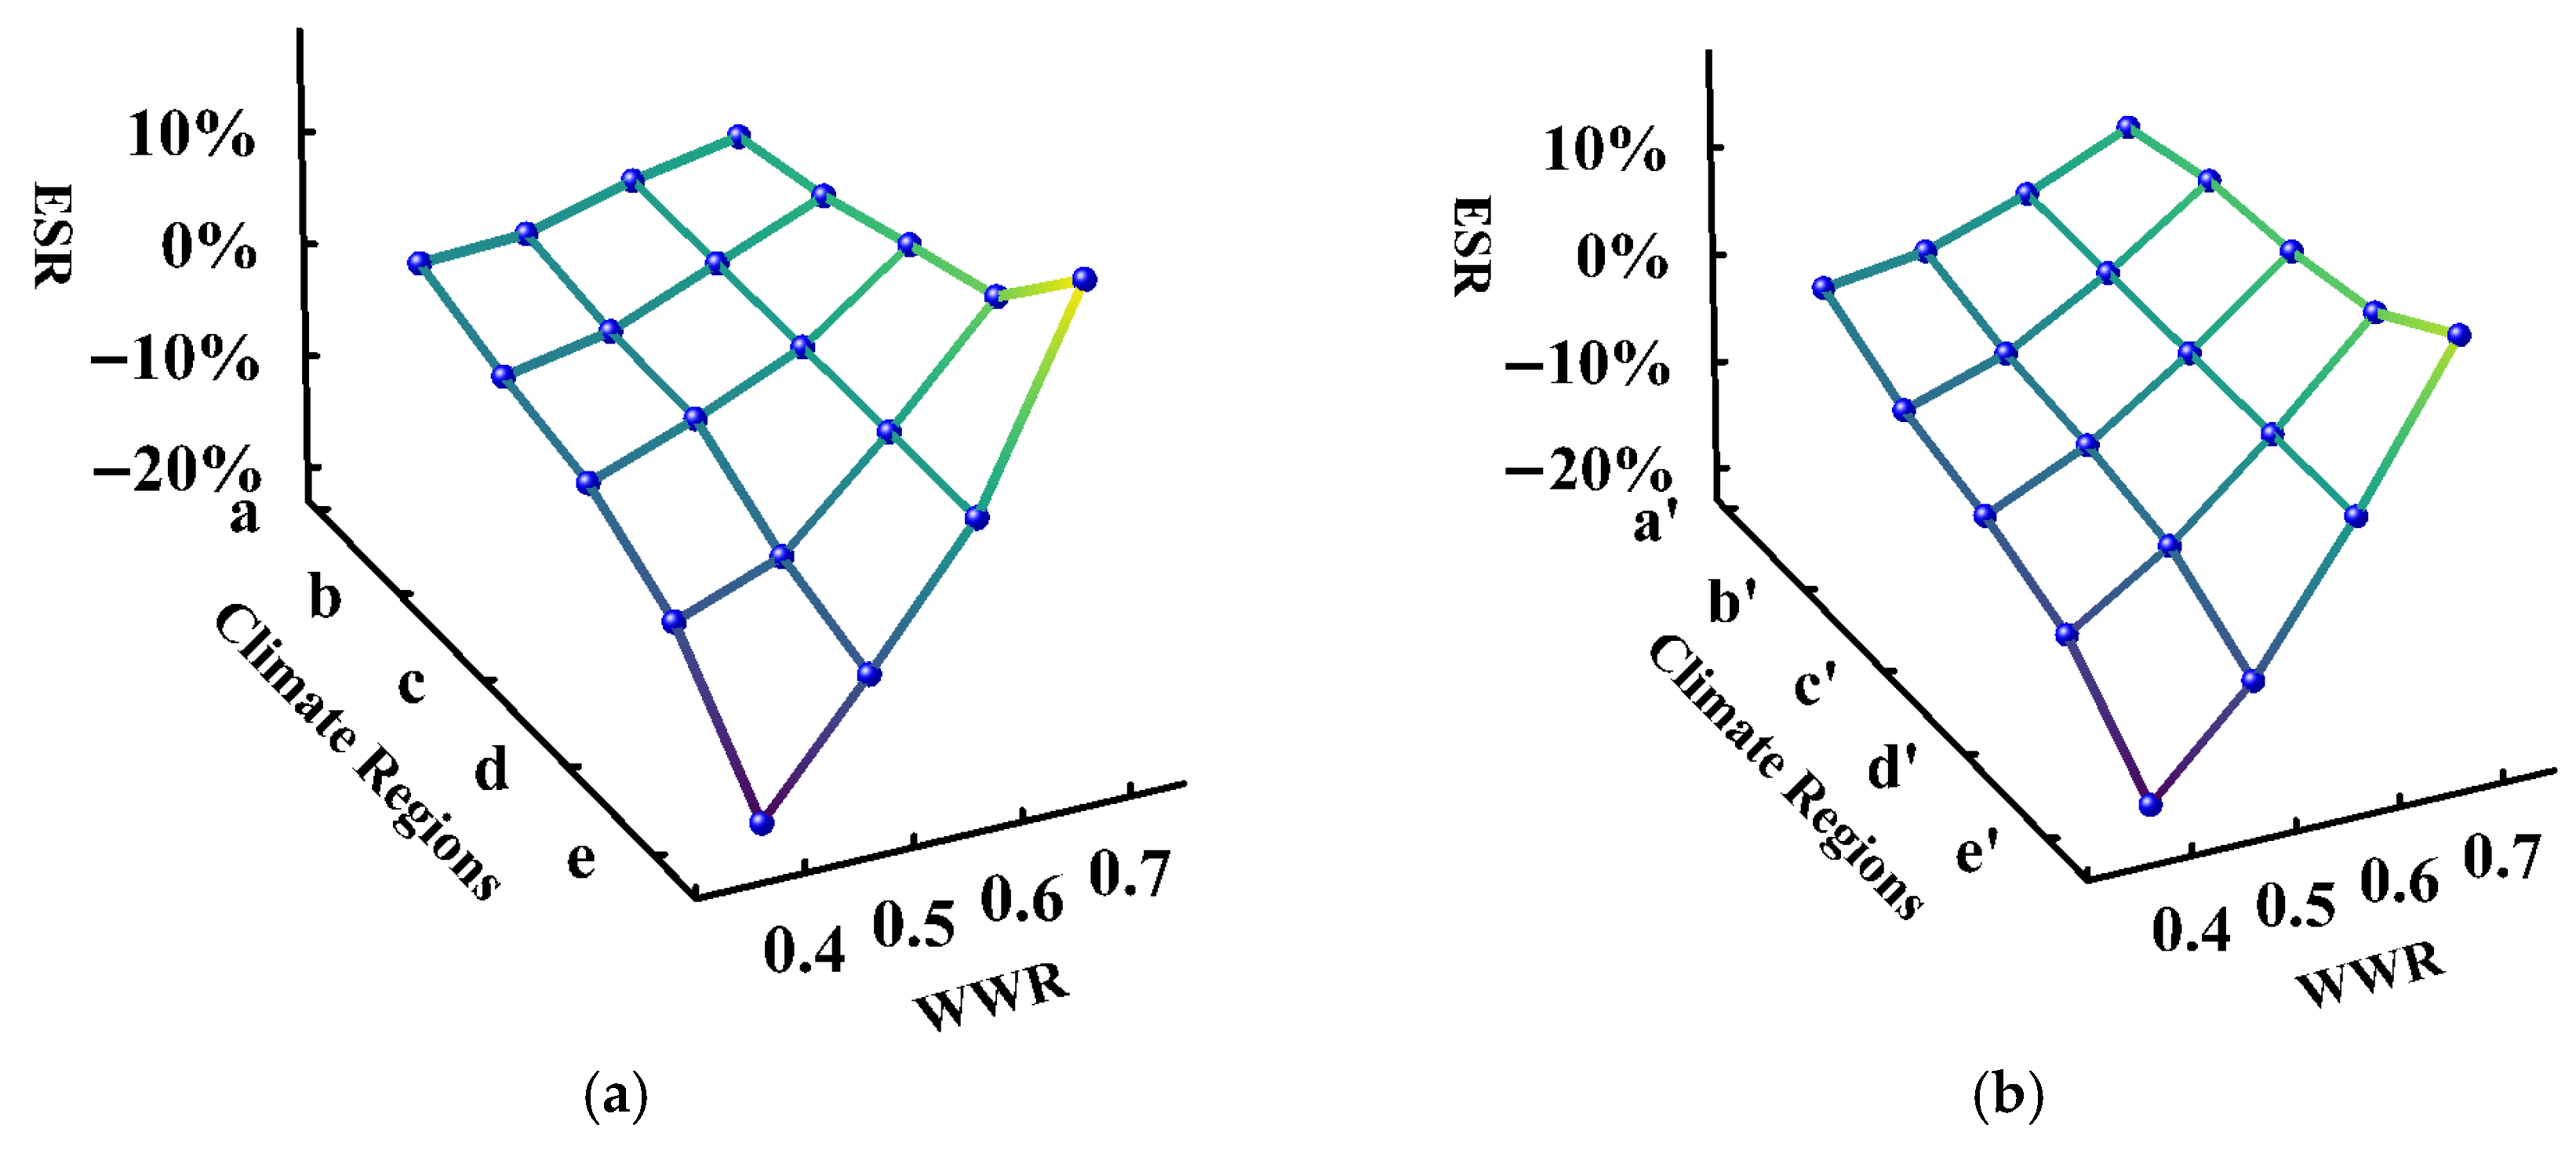
Figure 9 shows the ESR for different WWRs. In contrast to floor height and building footprint area, the ESR increased with an increasing WWR across all climate regions. The magnitude of ESR increase followed the following order: SevC < Cld < HS-CW < HS-WW < TR.
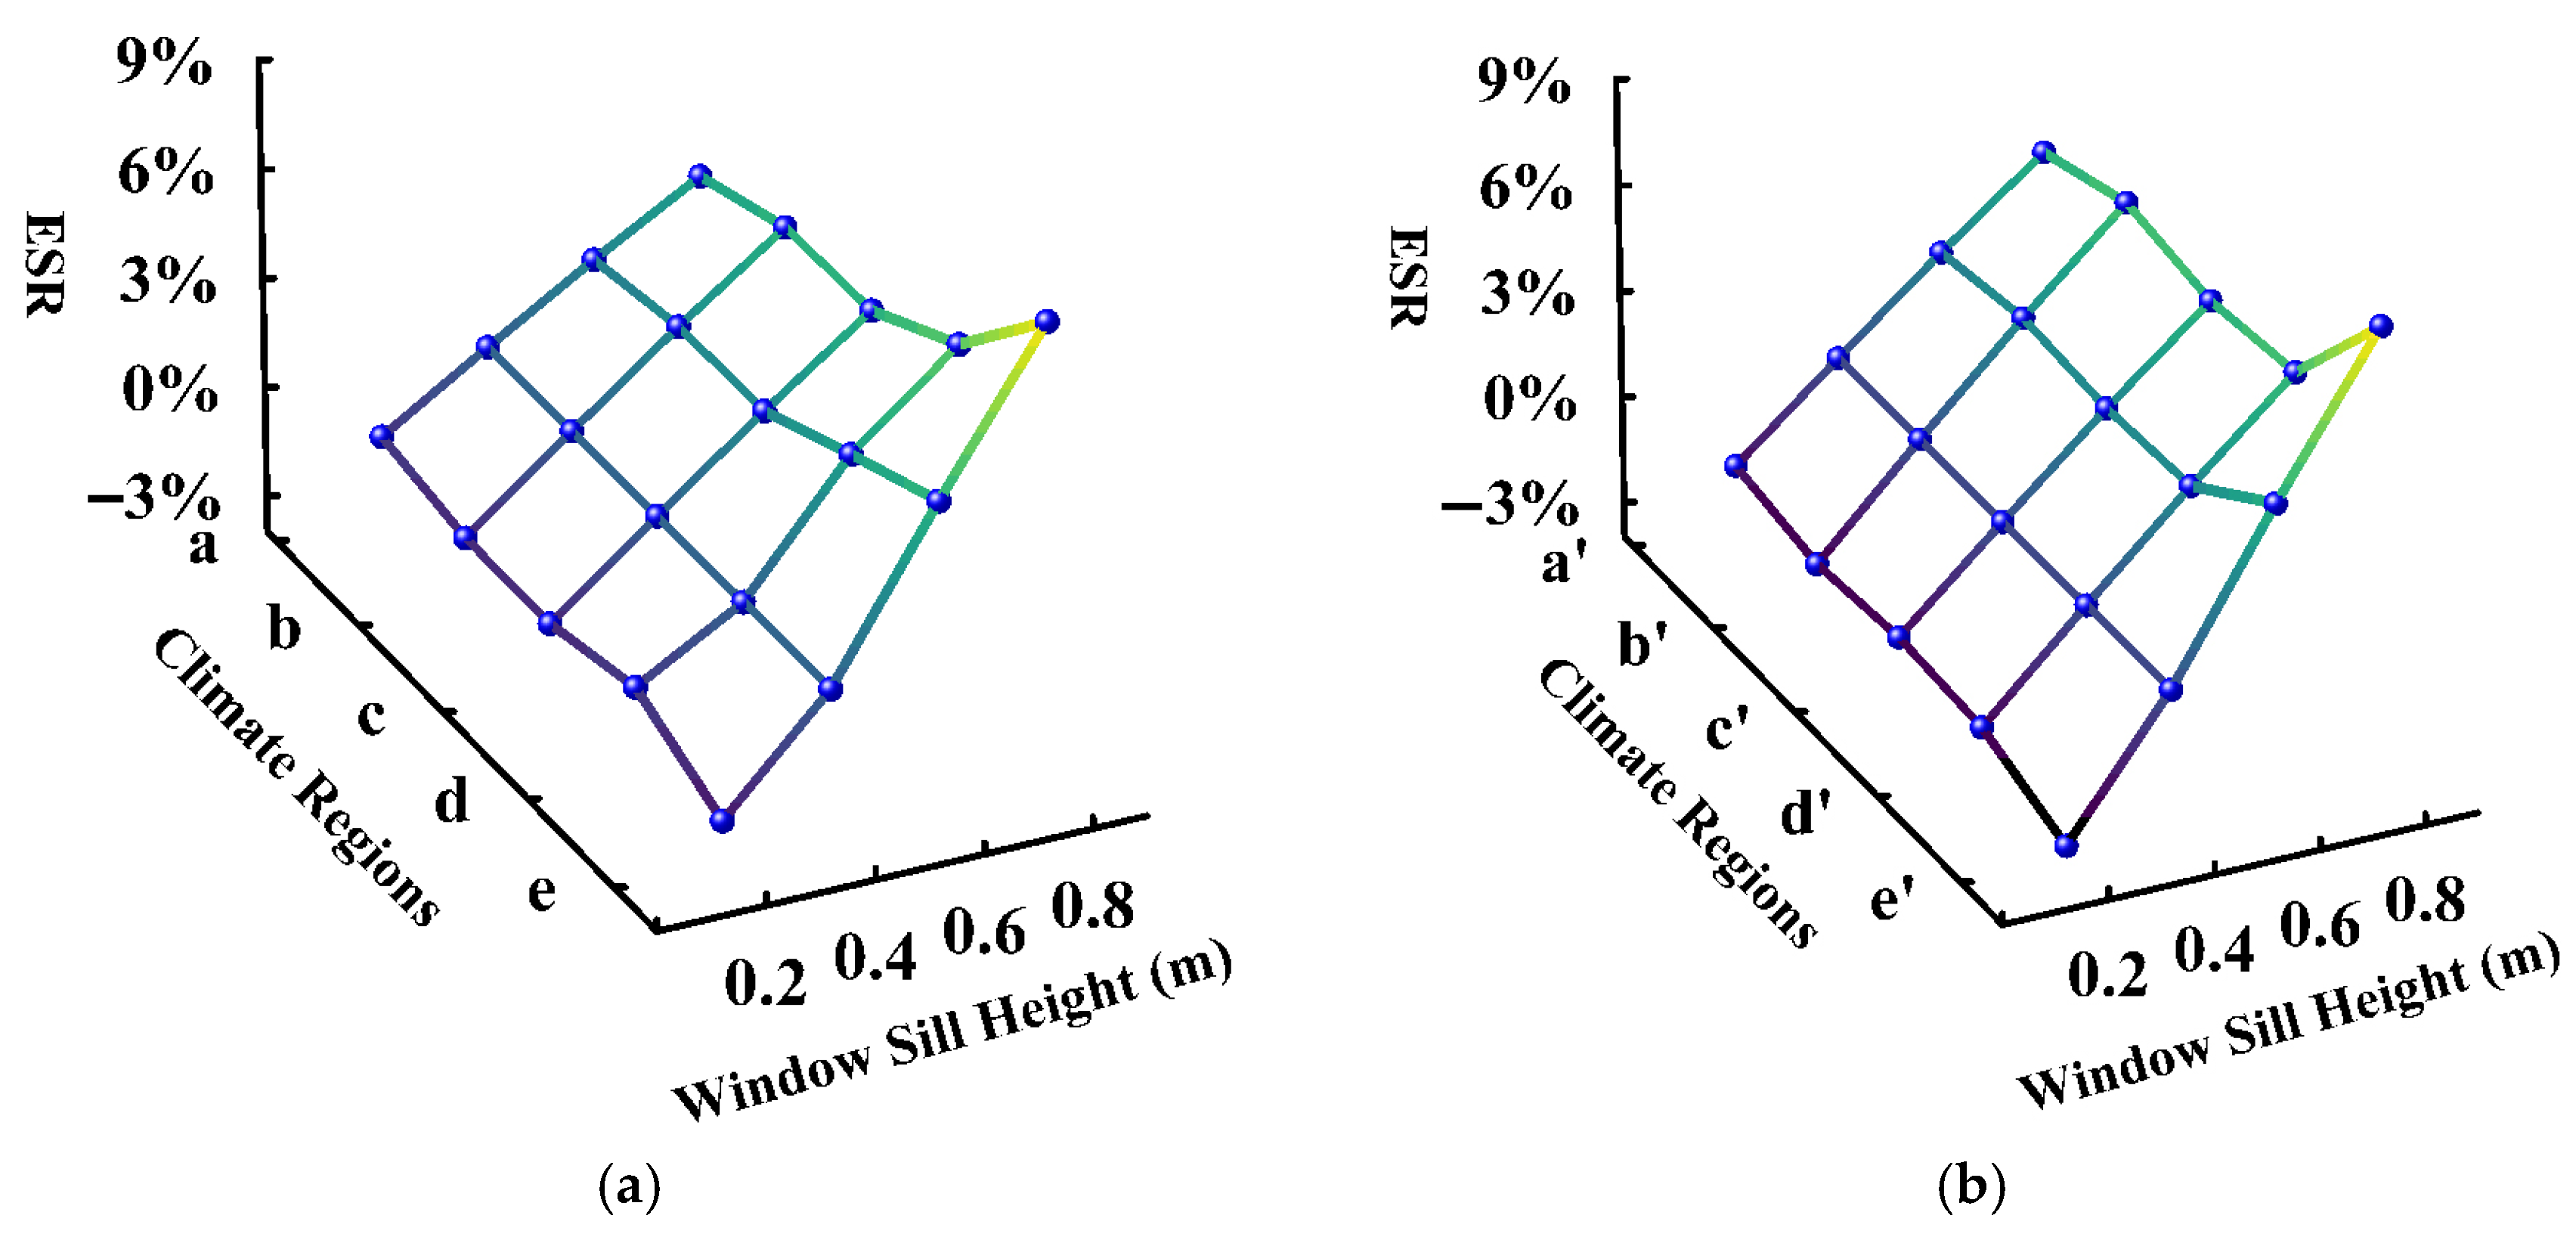
Figure 10 shows the ESR for different window sill heights. The ESR trend for window sill height was similar to that for the WWR, with the ESR increasing with higher window sill height values across all climate regions. Furthermore, the magnitude of window sill height ESR increase followed the following order: SevC < Cld < HS-CW < HS-WW < TR. The ranges were highly similar under both performance levels.
At the same time, the ESR trends for the WWR and window sill height—showing consistent positive correlations—are validated by their significant correlations in Table 6, while the opposing ESR trends in floor height and building footprint area in different climate regions verified the regional dependencies highlighted in the correlation analysis. For precise numerical comparison, ESR values under different geometric parameters, climate regions, and envelope performance conditions are provided in Appendix A, as shown in Table A1 and Table A2.

4. Discussion

4.1. Geometric Parameters

The ESR of floor height ranges between −3.76% and 2.85% in SevC and Cld regions, with a negative correlation between parameter value and ESR. Conversely, in HS-WW and the TR, the ESR of floor height ranges between −1.58% and 3.97%, exhibiting a positive correlation between parameter value and ESR. This highlights the region-dependent impact of floor height on building EUI. This can be explained by increasing floor height, which enlarges the envelope surface area per unit floor area, resulting in increased air infiltration heat loss and conductive heat transfer, thereby increasing heating loads. This effect dominates regions with significant heating demands (SevC, Cld). Conversely, higher floor height (at constant WWR) improves daylight penetration depth, reducing lighting EUI. Consequently, in regions with low heating demand (HS-WW, TR), larger floor heights can achieve a higher ESR.
The ESR of building footprint area ranges between −7.24% and 5.67% in SevC and Cld regions, exhibiting a positive correlation between parameter value and ESR. Conversely, in HS-WW and the TR, the ESR of building footprint area ranges between −12.52% and 10.17%, with a negative correlation between parameter value and ESR. This mirrors the opposing trend observed for floor height, highlighting that both parameters significantly influence building EUI differently across climatic conditions. The underlying mechanism stems from differences in air infiltration rates per unit volume. For instance, in the simulated model under Grade 7 airtightness, a smaller building footprint area (1000 m2) resulted in an air infiltration rate of 0.288 ACH. In comparison, a larger building footprint area (2800 m2) reduced this to 0.171 ACH. Consequently, a larger building footprint area minimizes envelope surface area per unit volume, reducing infiltration heat loss—a critical advantage in heating-dominated regions (SevC, Cld). Conversely, an increased building footprint area restricts daylight penetration depth, elevating lighting EUI. Consequently, larger building footprints become disadvantageous for EUI in regions with low heating demand (HS-WW, TR).
The correlation analysis (Section 3.2, Table 6) reveals that floor height and building footprint area lack overall statistical significance with EUI, which can be attributed to their opposing effects in different climates. For instance, in heating-dominated regions (SevC, Cld), larger floor heights increase heat loss (negative ESR), but in cooling-dominated regions (HS-WW, TR), they enhance daylighting (positive ESR). This regional cancelation effect, identified through correlation analysis, underscores the need for climate-specific geometric optimization rather than universal guidelines.
Only under standard performance in the SevC region did building footprint area sensitivity exceed that of the WWR. This likely occurs because, under severe cold conditions with standard envelope performance, the influence of the surface-area-to-volume ratio (SA:V) is amplified. On the one hand, a larger building footprint area results in a lower SA:V ratio. On the other hand, as the U-value of windows is significantly higher than that of walls, a larger WWR may cause excessive heat loss. Consequently, the energy-saving benefits of the WWR in SevC become negligible, as shown in Figure 9a, offsetting its daylight advantages.
Across all test groups, the average sensitivity of the WWR reached 19.38%, making it the highest among all geometric parameters. Furthermore, its parameter value exhibited a positive correlation with the ESR. This phenomenon was particularly pronounced in HS-WW and the TR, where the sensitivity reached a maximum of 41.19% under certain conditions. The fundamental reason for this is that although the increase in the WWR reduces overall insulation performance and improves heating EUI, it also increases indoor illumination and reduces lighting EUI. Therefore, in regions where lighting EUI dominates (HS-WW and TR), the energy-saving benefits of the WWR are more significant. In contrast, in regions where heating EUI dominates (SevC, Cld), the energy-saving benefits are lower, sometimes even inferior to those of the building footprint area.
The average sensitivity of window sill height is 8.29%, and in all test groups, there is a positive correlation between the parameter value and ESR. This occurs because increasing the window sill height enhances illuminance in deeper building spaces, thereby reducing lighting EUI. Consequently, in regions where lighting EUI accounts for a low proportion of total EUI (SevC and Cld), the improvement in energy efficiency is relatively low. Conversely, in regions with a higher proportion of lighting EUI (HS-CW, HS-WW, and TR), the increase in energy efficiency is significant.

4.2. Contributions

Against the backdrop of prior studies [8,9,10,11,12,13] often focusing on specific climate regions, this study advances the field by establishing a unified climate-responsive framework. This framework quantifies the interactive effects of geometric parameters, climate conditions, and building envelope thermal performance on energy-saving benefits. The key theoretical contributions of this study encompass three aspects.
Decoupling of climate-dependent mechanisms. The influence of the same geometric parameter on EUI varies significantly across different climate regions, even exhibiting a reversal from beneficial to detrimental effects. These findings resolve long-standing contradictions in prior research—for instance, Goia [8] identified significant geometric parameter impacts on EUI, while Sekki [14] reported no significant correlation.
Dynamic prioritization of geometric parameters. The WWR was identified as the universally dominant sensitivity factor, whereas floor height and building footprint area require optimization contingent upon the specific climate context. This provides a differentiated prioritization for building geometric parameters, moving beyond static numerical recommendations [9,10].
Incorporation of diverse envelope performance. While enhanced envelope performance reduced absolute EUI, it did not diminish the relative energy-saving potential of geometric parameters. Furthermore, the prioritization of geometric parameters and the nature of their influence remained unchanged. This addresses the previously unresolved question [19] regarding the relationship between geometric parameters and building EUI under differing envelope performance conditions.

4.3. Applications

The IQR analysis in Figure 4 reveals that climate region is the key determinant of the energy-saving potential of geometric parameters. The energy-saving benefits from geometric optimization are the most significant in SevC regions and TRs, meaning that investing effort in optimizing building shape in these climates yields the greatest energy-saving benefit. In contrast, the influence of geometric parameters is relatively limited in the HS-CW region, suggesting that design resources could be appropriately focused on other aspects.
The ESR analysis in Figure 7 and Figure 8 provides granular guidance for adjusting specific parameter values. Its value lies in revealing the non-linear and regional reversal characteristics of parameter influence. In heating-dominated SevC and Cld regions, reducing floor height or increasing building footprint area effectively reduces envelope heat loss and improves the ESR. However, in cooling-dominated HS-WW regions and TRs, this trend is completely reversed. These diametrically opposed design principles highlight the danger of mechanically applying uniform design rules and emphasize the necessity of selecting parameter values based on the specific climate region.
The ESR trends for the WWR and window sill height presented in Figure 9 and Figure 10 are relatively consistent. Increasing the values of these two parameters is generally beneficial for reducing EUI, and this positive effect is the most pronounced in the TR. In projects, architects can refer to the specific ESR curve slopes in these charts according to the target climate region to evaluate the expected energy-saving benefits of adjusting different parameter values. This enables data-supported decisions during the early design stage. For example, architects can consciously opt for larger WWRs and higher window sills in projects located in the TR to maximize energy-saving benefits.
In summary, the practical application value of the research findings lies in providing a clear quantitative decision-making basis for selecting building geometric design parameters, serving the early stages of architectural design before occupant behavior, operational patterns, and other conditions significantly impacting total EUI are definitively determined. These decision-making bases remain applicable under different building envelope thermal performance levels.
It should be emphasized that the ESR/IQR results presented in this study are not intended to prescribe fixed values. Instead, they enable designers to identify the key geometric parameters for each climate region and quantify trade-offs. For instance, through the optimization of the building footprint area in the SevC region, a deliberate increase in lighting EUI can be performed to achieve a greater reduction in heating EUI, thereby lowering the total EUI.

4.4. Limitations

This study systematically analyzed the impact of building geometric parameters—floor height, building footprint area, WWR, and window sill height—on annual total EUI across various climate regions and building envelope performance conditions. One limitation of this study is that it used a standardized model for rectangular-plan high-rise office buildings, which limits the direct applicability of the findings to buildings with complex geometries such as curved facades or irregular shapes. However, the core findings, particularly the energy-saving benefits of the WWR and parameter sensitivity, retain validity and significance. This is justified for two reasons: On the one hand, the selected geometric parameters represent fundamental drivers underlying all building shapes and significantly impact EUI. On the other hand, this study focuses on providing a practical framework for the early-stage design of a project. Focusing on these foundational parameters facilitates a rapid understanding of key principles and optimizes conceptual designs, thereby laying a foundation for understanding the EUI characteristics of complex building shapes.
Another limitation of this study lies in the adoption of a one-factor-at-a-time approach for investigating geometric parameters, which does not comprehensively address potential interaction effects among variables such as floor height, building footprint area, WWR, and window sill height. This methodological choice, while enabling the controlled isolation of individual parameter influences through fixed typical values for other variables, may overlook synergistic or antagonistic interdependencies that could alter EUI outcomes in real-world designs—for instance, combined variations in the WWR and window sill height might amplify or diminish daylighting benefits differently than when assessed independently. However, the core conclusions regarding the dominant sensitivity of the WWR, climate-dependent ESR trends (e.g., the consistent positive correlation of WWR and window sill height with ESR across all regions), and the undiminished energy-saving benefits of geometric optimization under enhanced envelope performance remain robustly valid, as these findings derive from systematic analyses of each parameter’s isolated impact, which fundamentally drives EUI regardless of interactions.
5. Conclusions

This study investigated the influence of fundamental geometric parameters—floor height, building footprint area, WWR, and window sill height—on the total annual EUI of buildings in different climate regions and building envelope performance conditions. Using a zonal sensor-optimized coupled daylighting–thermal simulation method, combined with correlation analysis, the IQR, SA, and ESR analysis, the following key conclusions were drawn:
The geometric optimization energy-saving benefit exhibits significant variation across different climate regions. The greatest energy-saving benefits were observed in the SevC region and TR, followed by HS-WW, Cld, and HS-CW regions. Notably, enhancing envelope thermal performance significantly reduces absolute EUI but does not diminish the relative influence of geometry on EUI. This emphasizes that both geometric parameter optimization and high-performance envelopes are critical pathways to energy savings. Furthermore, correlation analysis highlighted climate region and envelope performance as dominant factors influencing EUI, underscoring the primary role of external conditions.
The WWR consistently exhibited the highest sensitivity. Among the four geometric parameters analyzed, the WWR remained the most influential factor influencing annual total EUI, ranging from 4.91% to 41.19%. Its sensitivity exceeded 20% in HS-CW, HS-WW, and the TR. In contrast, floor height exhibited the lowest sensitivity, ranging from 0.49% to 5.65%. Only under standard performance in SevC did building footprint area sensitivity briefly exceed WWR sensitivity.
The impact of parameter values on EUI showed distinct regional dependencies. Floor height and building footprint area exhibited contrasting influence trends across regions. Increasing floor height decreased the ESR in SevC and Cld but increased the ESR in HS-WW and the TR. Conversely, expanding building footprint area increased the ESR in SevC and Cld but decreased the ESR in HS-WW and the TR. Correlation analysis confirmed that the lack of overall statistical significance for these parameters stems from these opposing regional effects canceling each other out in the global dataset.
The WWR and window sill height consistently demonstrated positive correlations with the ESR across all regions, with the strongest effects observed in the TR. This consistent positive trend for the WWR and window sill height was further validated by their statistically significant negative correlations with EUI in the correlation analysis. The magnitude of ESR increase followed the following order: SevC < Cld < HS-CW < HS-WW < TR. The ranges were highly similar under both envelope performance levels.

Author Contributions

Conceptualization, X.L. and Y.D.; methodology, D.C. and X.S.; software, D.C. and Y.L.; validation, Y.D., T.T., and Y.C.; formal analysis, X.L.; investigation, D.C.; resources, Y.L.; data curation, T.T.; writing—original draft preparation, D.C.; writing—review and editing, D.C.; visualization, X.L.; supervision, Y.D.; project administration, Y.D.; funding acquisition, Y.D. All authors have read and agreed to the published version of the manuscript.

Funding

This research was funded by Ningxia Green Low-Carbon Building and Efficient Use of New Energy Key Technology Research and Development Project, grant number 2023BEG01005.

Data Availability Statement

The original contributions presented in the study are included in the article, further inquiries can be directed to the corresponding author.

Conflicts of Interest

Authors Dun Cao and Yanyi Li were employed by the company China Building Technique Group Co., Ltd. The remaining authors declare that the research was conducted in the absence of any commercial or financial relationships that could be construed as a potential conflict of interest.

Abbreviations

The following abbreviations are used in this manuscript:
EUIEnergy Use Intensity
IQRInterquartile Range
SASensitivity Analysis
ESREnergy Saving Rate
SevCSevere Cold Region
CldCold Region
HS-CWHot Summer–Cold Winter Region
HS-WWHot Summer–Warm Winter Region
TRTemperate Region
U-valueThermal Transmittance
SHGCSolar Heat Gain Coefficient
WWRWindow-to-Wall Ratio

Appendix A

Table A1. ESR (%) values for geometric parameters under standard envelope performance across climate regions.
Geometric ParameterValuesSevC_StdCld_StdHS-CW_StdHS-WW_StdTR_Std
Floor Height (mm)36001.882.850.460.57−1.48
3800 (Typ)0.000.000.000.000.00
4000−1.88−1.14−0.461.181.40
4200−3.76−2.29−0.951.442.74
Building Footprint Area (m2)1000−7.24−4.46−0.794.039.57
1600 (Typ)0.000.000.000.000.00
22003.782.110.10−1.24−6.21
28005.672.69−0.73−3.65−12.14
Window-to-Wall Ratio (WWR)0.4−3.10−5.76−7.69−12.39−22.47
0.5−2.62−3.91−4.17−8.81−11.59
0.6 (Typ)0.000.000.000.000.00
0.71.813.876.929.7618.72
Window Sill Height (mm)200−1.81−2.27−2.28−1.64−4.59
400 (Typ)0.000.000.000.000.00
6001.752.212.213.354.42
8003.394.274.285.668.59
Table A2. ESR (%) values for geometric parameters under enhanced envelope performance across climate regions.
Geometric ParameterValuesSevC_EnhCld_EnhHS-CW_EnhHS-WW_EnhTR_Enh
Floor Height (mm)36001.030.37−0.20−0.76−1.58
3800 (Typ)0.000.000.000.000.00
4000−1.02−0.370.180.701.52
4200−2.07−0.800.301.372.97
Building Footprint Area (m2)1000−3.89−0.422.235.0410.17
1600 (Typ)0.000.000.00−1.160.00
22001.85−0.17−1.65−2.11−6.48
28002.08−1.40−3.77−6.56−12.52
Window-to-Wall Ratio (WWR)0.4−4.52−8.45−10.73−14.15−22.18
0.5−3.23−5.35−6.37−8.13−12.94
0.6 (Typ)0.000.000.000.000.00
0.74.096.457.279.0714.44
Window Sill Height (mm)200−2.41−2.87−2.59−2.76−4.70
400 (Typ)0.000.000.000.000.00
6002.342.772.532.674.52
8004.535.374.895.198.78

References

  1. Wang, J.; Yu, C.W.; Cao, S.-J. Technology pathway of efficient and climate-friendly cooling in buildings: Towards carbon neutrality. Indoor Built Environ. 2021, 30, 1307–1311. [Google Scholar] [CrossRef]
  2. Li, J.; Liang, C.; Zhou, W. A Review of Building Physical Shapes on Heating and Cooling Energy Consumption. Energies 2024, 17, 5766. [Google Scholar] [CrossRef]
  3. Kheiri, F. A review on optimization methods applied in energy-efficient building geometry and envelope design. Renew. Sustain. Energy Rev. 2018, 92, 897–920. [Google Scholar] [CrossRef]
  4. Ekonomou, G.; Menegaki, A.N. The Role of the Energy Use in Buildings in Front of Climate Change: Reviewing a System’s Challenging Future. Energies 2023, 16, 6308. [Google Scholar] [CrossRef]
  5. Elgheriani, L.; Cody, B. The Impact of High-Rise Residential Building Design Parameters on the Thermal and Energy Performance: A Literature Review. In Proceedings of the 9th Asia Pacific International Conference on Environment-Behaviour Studies (AicE-Bs), Faculty of Agriculture, University of Lisbon, Lisbon, Portugal, 3–4 July 2019; pp. 81–91. [Google Scholar]
  6. Mostafavi, F.; Tahsildoost, M.; Zomorodian, Z. Energy efficiency and carbon emission in high-rise buildings: A review (2005–2020). Build. Environ. 2021, 206, 108329. [Google Scholar] [CrossRef]
  7. Chen, X.F.; Xu, Z.Q.; Qiu, Y.Q.; Hu, H.X.; Wang, X.T. China’s newest design of apartment buildings with modernized façade: A comparative evaluation of its energy performance in five major climate zones. Sustain. Cities Soc. 2024, 117, 105954. [Google Scholar] [CrossRef]
  8. Goia, F.; Haase, M.; Perino, M. Optimizing the configuration of a facade module for office buildings by means of integrated thermal and lighting simulations in a total energy perspective. Appl. Energy 2013, 108, 515–527. [Google Scholar] [CrossRef]
  9. Shadram, F.; Mukkavaara, J. Exploring the effects of several energy efficiency measures on the embodied/operational energy trade-off: A case study of swedish residential buildings. Energy Build. 2019, 183, 283–296. [Google Scholar] [CrossRef]
  10. Giouri, E.D.; Tenpierik, M.; Turrin, M. Zero energy potential of a high-rise office building in a Mediterranean climate: Using multi-objective optimization to understand the impact of design decisions towards zero-energy high-rise buildings. Energy Build. 2020, 209, 109666. [Google Scholar] [CrossRef]
  11. Liu, L.G.; Lin, B.R.; Peng, B. Correlation analysis of building plane and energy consumption of high-rise office building in cold zone of China. Build. Simul. 2015, 8, 487–498. [Google Scholar] [CrossRef]
  12. Singh, R.; Buddhi, D.; Thapa, S.; Prakash, C.; Singh, R.; Sharma, A.; Sheoran, S.; Saxena, K.K. Sensitivity Analysis for Decisive Design Parameters for Energy and Indoor Visual Performances of a Glazed Facade Office Building. Sustainability 2022, 14, 14163. [Google Scholar] [CrossRef]
  13. Susorova, I.; Tabibzadeh, M.; Rahman, A.; Clack, H.L.; Elnimeiri, M. The effect of geometry factors on fenestration energy performance and energy savings in office buildings. Energy Build. 2013, 57, 6–13. [Google Scholar] [CrossRef]
  14. Sekki, T.; Airaksinen, M.; Saari, A. Measured energy consumption of educational buildings in a Finnish city. Energy Build. 2015, 87, 105–115. [Google Scholar] [CrossRef]
  15. Yaman, G. Determination of Optimum Passive Design Parameters for Industrial Buildings in Different Climate Zones Using an Energy Performance Optimization Model Based on an Artificial Neural Network (ANN) and Particle Swarm Optimization (PSO). Sustainability 2025, 17, 2357. [Google Scholar] [CrossRef]
  16. Deng, X.M.; Wang, M.Y.; Sun, D.X.; Fan, Z.Y. Effect of Building Form on Energy Consumption of Academic Library Buildings in Different Climate Zones in China. IOP Conf. Ser. Earth Environ. Science 2020, 531, 012060. [Google Scholar] [CrossRef]
  17. Samuelson, H.; Claussnitzer, S.; Goyal, A.; Chen, Y.J.; Romo-Castillo, A. Parametric energy simulation in early design: High-rise residential buildings in urban contexts. Build. Environ. 2016, 101, 19–31. [Google Scholar] [CrossRef]
  18. Roka, R.; Figueiredo, A.; Vieira, A.; Cardoso, C. A Systematic Review of Sensitivity Analysis in Building Energy Modeling: Key Factors Influencing Building Thermal Energy Performance. Energies 2025, 18, 2375. [Google Scholar] [CrossRef]
  19. Gassar, A.A.A.; Koo, C.; Kim, T.W.; Cha, S.H. Performance Optimization Studies on Heating, Cooling and Lighting Energy Systems of Buildings during the Design Stage: A Review. Sustainability 2021, 13, 9815. [Google Scholar] [CrossRef]
  20. Leskovar, V.Z.; Premrov, M. An approach in architectural design of energy-efficient timber buildings with a focus on the optimal glazing size in the south-oriented facade. Energy Build. 2011, 43, 3410–3418. [Google Scholar] [CrossRef]
  21. Hachem-Vermette, C. Multistory building envelope: Creative design and enhanced performance. Sol. Energy 2018, 159, 710–721. [Google Scholar] [CrossRef]
  22. Cao, D. Research on Energy-Saving Design of High-Rise Office Building Spatial Form. Master’s Thesis, Inner Mongolia University of Technology, Hohhot, China, 2023. [Google Scholar] [CrossRef]
  23. JGJ/T 67-2019; Standard for Design of Office Buildings. China Architecture & Building Press: Beijing, China, 2019. (In Chinese)
  24. GB 50736-2012; Design Code for Heating Ventilation and Air Conditioning of Civil Buildings. China Architecture & Building Press: Beijing, China, 2012. (In Chinese)
  25. GB 50034-2013; Standard for Lighting Design of Buildings. China Architecture & Building Press: Beijing, China, 2013. (In Chinese)
  26. JGJ/T 449-2018; Standard for Green Performance Calculation of Civil Buildings. China Architecture & Building Press: Beijing, China, 2018. (In Chinese)
  27. GB 50189-2015; Design Standard for Energy Efficiency of Public Buildings. China Architecture & Building Press: Beijing, China, 2015. (In Chinese)
  28. GB/T 51350-2019; Technical Standard for Nearly Zero Energy Buildings. China Architecture & Building Press: Beijing, China, 2019. (In Chinese)
  29. Gonzalo, F.D.; Santamaría, B.M.; Burgos, M.J.M. Assessment of Building Energy Simulation Tools to Predict Heating and Cooling Energy Consumption at Early Design Stages. Sustainability 2023, 15, 1920. [Google Scholar] [CrossRef]
  30. Qin, S.Q.; Liu, Y.; Yu, G.; Li, R.L. Assessing the Potential of Integrated Shading Devices to Mitigate Overheating Risk in University Buildings in Severe Cold Regions of China: A Case Study in Harbin. Energies 2023, 16, 6259. [Google Scholar] [CrossRef]
  31. Rucinska, J.; Trzaski, A. Measurements and Simulation Study of Daylight Availability and Its Impact on the Heating, Cooling and Lighting Energy Demand in an Educational Building. Energies 2020, 13, 2555. [Google Scholar] [CrossRef]
  32. Bienvenido-Huertas, D.; Rubio-Bellido, C.; Farinha, F.; Oliveira, M.J.; Pérez-Ordóñez, J.L. Evaluating the potential of adaptive comfort approach using historic data to reduce energy consumption in buildings in southern Spain. Build. Environ. 2020, 185, 107313. [Google Scholar] [CrossRef] [PubMed]
  33. Pang, Z.H.; O’Neill, Z.; Li, Y.F.; Niu, F.X. The role of sensitivity analysis in the building performance analysis: A critical review. Energy Build. 2020, 209, 109659. [Google Scholar] [CrossRef]
  34. Zhao, X.K.; Li, C.X.; Ma, F.D.; Jin, G.Y.; Shi, Z.L. Research on Micro-Intervention Strategies for Energy-Saving Renovation of the Envelope Structures in Existing Brick-Wood Ancient-Style Buildings. Buildings 2025, 15, 1569. [Google Scholar] [CrossRef]
Figure 1. Geometric characteristics of simulation model. (a) Building shape. (b) Floor plan layout.
Buildings 15 03176 g001
Figure 2. The daylighting simulation results for a south-facing area in Hohhot.
Buildings 15 03176 g002
Figure 3. Distribution of EUI data for all simulation cases. (a) Standard envelope performance. (b) Enhanced envelope performance.
Buildings 15 03176 g003
Figure 4. Distribution of IQR of geometric parameters in different climate regions.
Buildings 15 03176 g004
Figure 5. Sensitivity of geometric parameters under standard envelope performance.
Buildings 15 03176 g005
Figure 6. Sensitivity of geometric parameters under enhanced envelope performance.
Buildings 15 03176 g006
Figure 7. ESR variation in different floor heights across climate regions. (a) Standard envelope performance. (b) Enhanced envelope performance.
Buildings 15 03176 g007
Figure 8. ESR variation in different building footprint areas across climate regions. (a) Standard envelope performance. (b) Enhanced envelope performance.
Buildings 15 03176 g008
Figure 9. ESR variation in different WWRs across climate regions. (a) Standard envelope performance. (b) Enhanced envelope performance.
Buildings 15 03176 g009
Figure 10. ESR variation in different window sill heights across climate regions. (a) Standard envelope performance. (b) Enhanced envelope performance.
Buildings 15 03176 g010
Table 1. Geometric parameters and values.
Geometric ParameterValuesTypical Value
Floor Height (mm)3600, 3800, 4000, 42003800
Building Footprint Area (m2)1000, 1600, 2200, 28001600
Window-to-Wall Ratio (WWR)0.4, 0.5, 0.6, 0.70.6
Window Sill Height (mm)200, 400, 600, 800400
Table 2. Key input parameters for occupancy, thermal comfort, lighting, and office equipment.
ParameterOffice AreaService AreaReference
Occupant density (persons/m2)0.1250.02Standard for design of office buildings (JGJ/T 67-2019) [23]
Indoor design temperature (°C)Heating: 20; Cooling: 26Linked to office area return air
Design illuminance (lux)450150Standard for lighting design of buildings (GB 50034-2013) [25]
Lighting power density (W/m2 per 100 lux)33Standard for green performance calculation of civil buildings (JGJ/T 449-2018) [26]
Office equipment power density (W/m2)15N/A
Fresh air volume (m3/(h·person))30N/ADesign code for heating ventilation and air conditioning of civil buildings (GB 50736-2012) [24]
SevC and Cld regionsHeating COP1.6N/AStandard for green performance calculation of civil buildings (JGJ/T 449-2018) [26]
Cooling COP2.5N/A
HS-CW regions, HS-WW regions, and TRsHeating COP2.2N/A
Cooling COP2.8N/A
Table 3. Thermal performance of roofs and external walls under different envelope performance conditions.
Climate RegionsRepresentative CitiesEnvelope PerformanceU-Value (W/(m2·K))
External WallsRoofs
SevCHarbin, Qiqihar, Hohhota. Standard (SevC AB: Harbin, Qiqihar)0.380.28
a. Standard (SevC: Hohhot)0.430.35
a’. Enhanced0.250.20
CldBeijing, Xian, Yinchuanb. Standard0.500.45
b’. Enhanced0.300.30
HS-CWWuhan, Shanghai, Lishuic. Standard0.600.40
c’. Enhanced0.400.35
HS-WWGuangzhou, Zhanjiang, Liuzhoud. Standard0.800.50
d’. Enhanced0.800.60
TRKunming, Mengzi, Chuxionge. Standard0.800.50
e’. Enhanced0.800.60
Note: GB 50189-2015 [27] sets stricter thermal requirements for building envelopes in the SevC AB zone (Harbin, Qiqihar) than the SevC C zone (Hohhot).
Table 4. Thermal performance of windows under standard envelope performance.
Climate RegionsU-Value (W/(m2·K))SHGC (Orientation: E, S, W/N)Airtightness Level
WWR 0.4WWR 0.5WWR 0.6WWR 0.7WWR 0.4WWR 0.5WWR 0.6WWR 0.77
SevC2.21.91.61.50.50.500.50.47
Cld2.42.22.01.90.480.430.400.35/0.607
HS-CW2.62.42.22.20.40/0.440.35/0.400.35/0.400.30/0.357
HS-WW3.02.72.52.50.35/0.440.35/0.400.26/0.350.24/0.307
TR3.02.72.52.50.40/0.440.35/0.400.35/0.400.30/0.357
ReferenceDesign standard for energy efficiency of public buildings (GB 50189-2015) [27]
Table 5. Thermal performance of windows under enhanced envelope performance.
Climate RegionsU-Value (W/(m2·K))SHGC (Summer/Winter)Airtightness Level
SevC1.20.30/0.458
Cld1.50.30/0.458
HS-CW2.20.15/0.408
HS-WW2.80.15/0.158
TR2.20.3/0.38
ReferenceTechnical standard for nearly zero-energy buildings (GB/T 51350-2019) [28]
Table 6. Results of correlation analysis between climate region, envelope performance, and geometric parameters with EUI.
Influencing FactorMetricValue
Geometric ParametersFloor HeightSpearman CC.0.011
Sig.0.818
Building Footprint AreaSpearman CC.0.01
Sig.0.831
WWRSpearman CC.−0.145 ***
Sig.0.001
Window Sill HeightSpearman CC.−0.082
Sig.0.074 *
Climate RegionSpearman CC.−0.304 ***
Sig.0.000
Envelope PerformanceSpearman CC.−0.358 ***
Sig.0.000
Note: *** indicates significant at the 0.01 level; * indicates significant at the 0.1 level.
Disclaimer/Publisher’s Note: The statements, opinions and data contained in all publications are solely those of the individual author(s) and contributor(s) and not of MDPI and/or the editor(s). MDPI and/or the editor(s) disclaim responsibility for any injury to people or property resulting from any ideas, methods, instructions or products referred to in the content.