Article

Mechanical Performance and Parameter Sensitivity Analysis of Small-Diameter Lead-Rubber Bearings

School of Civil Engineering, Chang’an University, Xi’an 710061, China
*
Author to whom correspondence should be addressed.
Buildings 2025, 15(18), 3284; https://doi.org/10.3390/buildings15183284
Submission received: 18 August 2025 / Revised: 4 September 2025 / Accepted: 8 September 2025 / Published: 11 September 2025
(This article belongs to the Special Issue Low Carbon and Green Materials in Construction—3rd Edition)

Abstract

Small-diameter lead-rubber bearings (LRBs) are widely employed in shaking table tests of isolated structures, particularly reinforced concrete base-isolated structures. Accurately determining their mechanical properties and identifying their restoring force model parameters are essential for seismic response analysis and numerical simulation of scaled models. In this study, quasi-static tests and shaking table tests were conducted to obtain the compression–shear hysteresis curves of LRBs under various loading amplitudes and frequencies, as well as the hysteresis curves under seismic wave excitation. The variation patterns of mechanical performance indicators were systematically analyzed. A parameter identification method was developed to determine the restoring force model of small-diameter LRBs using a genetic algorithm, and the effects of pre-yield stiffness and yield force of the isolation layer on structural response were investigated based on an equivalent two-degree-of-freedom model. By incorporating appropriately identified restoring force model parameters, a damping modeling method for the reinforced concrete high-rise over-track structures with an inter-story isolation system was proposed. The results indicate that, when the maximum bearing deformation reached 150% shear strain, the post-yield stiffness and horizontal equivalent stiffness under seismic excitation increased by 11.97% and 19.40%, respectively, compared with the compression–shear test results, while the equivalent damping ratio increased by 18.18%. Directly adopting mechanical parameters obtained from quasi-static tests would lead to an overestimation of the isolation layer displacement response. The discrepancies in the mechanical indicators of the small-diameter LRB between the theoretical hysteresis curve, obtained using the identified Bouc–Wen model parameters, and the compression–shear test results are less than 10%. In OpenSees, the seismic response of the scaled model can be accurately simulated by combining a segmented damping model with an isolation-layer hysteresis model in which the pre-yield stiffness is amplified by a factor of 1.15.

1. Introduction

Due to the stable mechanical performance and strong energy dissipation capacity, lead-rubber bearings (LRBs) have been widely used in various isolated structures, including steel structures, reinforced concrete, and ultra-high-performance concrete (UHPC) systems [1,2,3], in addition to numerous historical constructions [4]. The effectiveness of seismic isolation has been extensively verified through theoretical analyses based on simplified models [5,6,7], numerical simulations using finite element models [8,9], seismic measurements of prototype structures, and shaking table tests on scaled or full-scale models. For example, a twin-tower building with a large base-isolation system above Tokyo Station in Japan demonstrated excellent seismic isolation performance during the M5.5 Ibaraki Prefecture earthquake in 2016 and the M7.4 Fukushima offshore earthquake, with the maximum accelerations above the isolation layer being reduced by 31% and 62%, respectively, compared with those below the isolation layer [10]. Li et al. [11,12] investigated the seismic mitigation effects in both vertical and horizontal directions of a high-rise base-isolated structure above a railway depot that was employing LRBs with a diameter of 120 mm through scaled shaking table tests. Liu et al. [13] experimentally verified the effectiveness and reliability of base-isolated nuclear power plants through shaking table tests.
As the key components supporting the total weight of the superstructure, seismic isolation bearings have a design vertical compressive stress- and a horizontal loading capacity, which directly influence critical mechanical properties such as the yield strength, pre-yield stiffness, post-yield stiffness, and yield displacement of the isolation layer [14]. These properties not only constitute the basis for determining the parameters of the restoring force model but also serve as essential prerequisites for seismic isolation design and performance verification. Previous studies have indicated that the stability of the bearings under static loads and their shear deformation capacity are critical requirements for achieving effective seismic isolation.
Haringx [15,16] proposed a stability evaluation method base on the Southwell procedure and Euler’s buckling load theory. Gent [17] calculated the reduction in lateral stiffness caused by an increase in axial load, and this result was subsequently validated by Haringx’s theory. Large-scale shear failure tests of rubber bearings conducted by Nishi [18] revealed that the ultimate shear deformation could reach 300–450%, with failure predominantly occurring due to rubber fracture, while the bonding strength between the rubber and the steel plates remained high. Cardone et al. [19] investigated the critical behavior of slender bearings under various strain amplitudes to analyze the influence of shear strain on the critical load of low-shape-factor isolation devices and to evaluate existing design methods. Their findings indicated that the critical load decreases with increasing shear strain, and the horizontal stiffness decreases with increasing axial load and horizontal displacement.
The shape factor, a dimensionless parameter describing bearing geometry, is defined as the ratio of the loaded area to the free bulge area [20]. Yabana et al. [21] evaluated the mechanical properties of thick rubber bearings (S2 = 0.5) through static, dynamic, and failure tests. Vemuru et al. [22] reported substantial differences in horizontal–vertical coupling behavior between quasi-static and dynamic loading, suggesting that stiffness-displacement models derived from quasi-static tests may not accurately predict dynamic responses. Orfeo et al. [23] developed a simplified model for low-shape-factor bearings and validated it through shaking table tests. However, comparative investigations into the mechanical performance of bearings under different loading and testing conditions remain insufficient.
Sanchez et al. [24] analyzed the critical load and stability of rubber bearings under static and dynamic loads. Rahnavard et al. [25] found that, under dynamic loading, the initial stiffness was higher, stability was reduced due to inertial effects, and hysteretic dissipation increased. These results indicate that static analysis cannot fully replace dynamic analysis for novel rubber-core bearings. Akazawa et al. [26] revised the velocity-dependent coefficient model for low-friction spherical sliding bearings after finding that low-speed test values were 34.6% higher than predictions, and were validated the revision via shaking table tests. Wu et al. [27] reported 6.4% differences in equivalent stiffness and yield force between quasi-static and theoretical estimates and shaking table results because seismic excitation is characterized by a broad frequency spectrum with dominant high-frequency components. Moreover, discrepancies between the vertical compressive stresses of bearings in service and those under testing conditions can cause their mechanical behavior under seismic loading to differ substantially from that under static conditions. Consequently, relying solely on static analysis may underestimate the dynamic response of bearings.
To address this issue, small-diameter LRBs, which are widely used in shaking table tests of base-isolated structures, were selected as the focus of this study. Quasi-static and shaking table tests were conducted to obtain compression–shear hysteresis curves under various loading amplitudes and frequencies, as well as under seismic wave excitation. The variation of mechanical performance indicators was then systematically analyzed. On this basis, a parameter identification method for the restoring force model of the bearings was developed using a genetic algorithm. The effects of pre-yield stiffness and yield force of the isolation layer on structural response were then investigated through an equivalent two-degree-of-freedom model. By incorporating appropriately identified restoring force model parameters, a damping modeling method was subsequently proposed for the high-rise over-track structure with inter-story isolated system, providing a reference for both scaled-model testing and seismic analysis of prototype structures.

2. Design and Testing of Seismic Isolation Bearings

2.1. Design of Small-Diameter Bearings

In structural shaking table tests, small-sized LRBs with diameters of 80–100 mm are typically employed to satisfy the similarity requirements of scaled models. This range of diameters exceeds the minimum diameter specified for commonly used isolation bearings in current design codes. Compared with full-scale LRBs, small-diameter bearings must simultaneously meet the requirements for both the first and second shape factors. As a result, the thickness of each rubber layer is relatively small. Furthermore, to ensure similarity of the isolation layer parameters between the scaled model and the prototype structure, the diameter of the internal lead core is correspondingly reduced.
In this study, the size design process for lead-rubber isolation bearings is specified in GB/T 20688.3-2006 [28]. Figure 1a was adopted to design the small-diameter bearings used in testing, as Figure 1b shows. The main steps are as follows: (1) Given the design value of the yield force Fy, the diameter of the internal lead core di is determined using Equation (1). (2) With the outer diameter D of the bearing and the lead core diameter di known, the single-layer rubber thickness tr is determined using Equation (2). (3) The number of rubber layers nr and the total rubber thickness Tr are determined using Equation (3). (4) The number of internal steel plates ns is set to be one less than the number of rubber layers.
F y = τ p A p = τ p π d i 2 4
where τP denotes the yield strength of lead, which is taken as 8.5 MPa.
S 1 = D d i 4 t r 15
where S1 is the first shape factor of the bearing, with a minimum allowable value of 15.
S 2 = D n r t r = D T r 5
where S2 denotes the second shape factor of the bearing, with a minimum allowable value of 5.
Based on the aforementioned design parameters, the post-yield stiffness Kd, the equivalent horizontal stiffness Kh, and the equivalent damping ratio heq of the isolation bearing can be calculated using Equations (4)–(6):
K d = G × A n t r
K h = K d + F y / T r
h eq = 2 F y / π δ K h
where G denotes the shear modulus of the rubber, and δ represents the shear strain of the bearing.
Following the aforementioned procedure and using parameters including the yield force Fy, equivalent horizontal stiffness Kh, pre-yield stiffness K0, and post-yield stiffness Kd, a 100 mm- diameter LRB (LRB100) was designed for the shaking table test, as shown in Figure 1c. The corresponding design parameters are listed in Table 1.

2.2. Compression–Shear Test

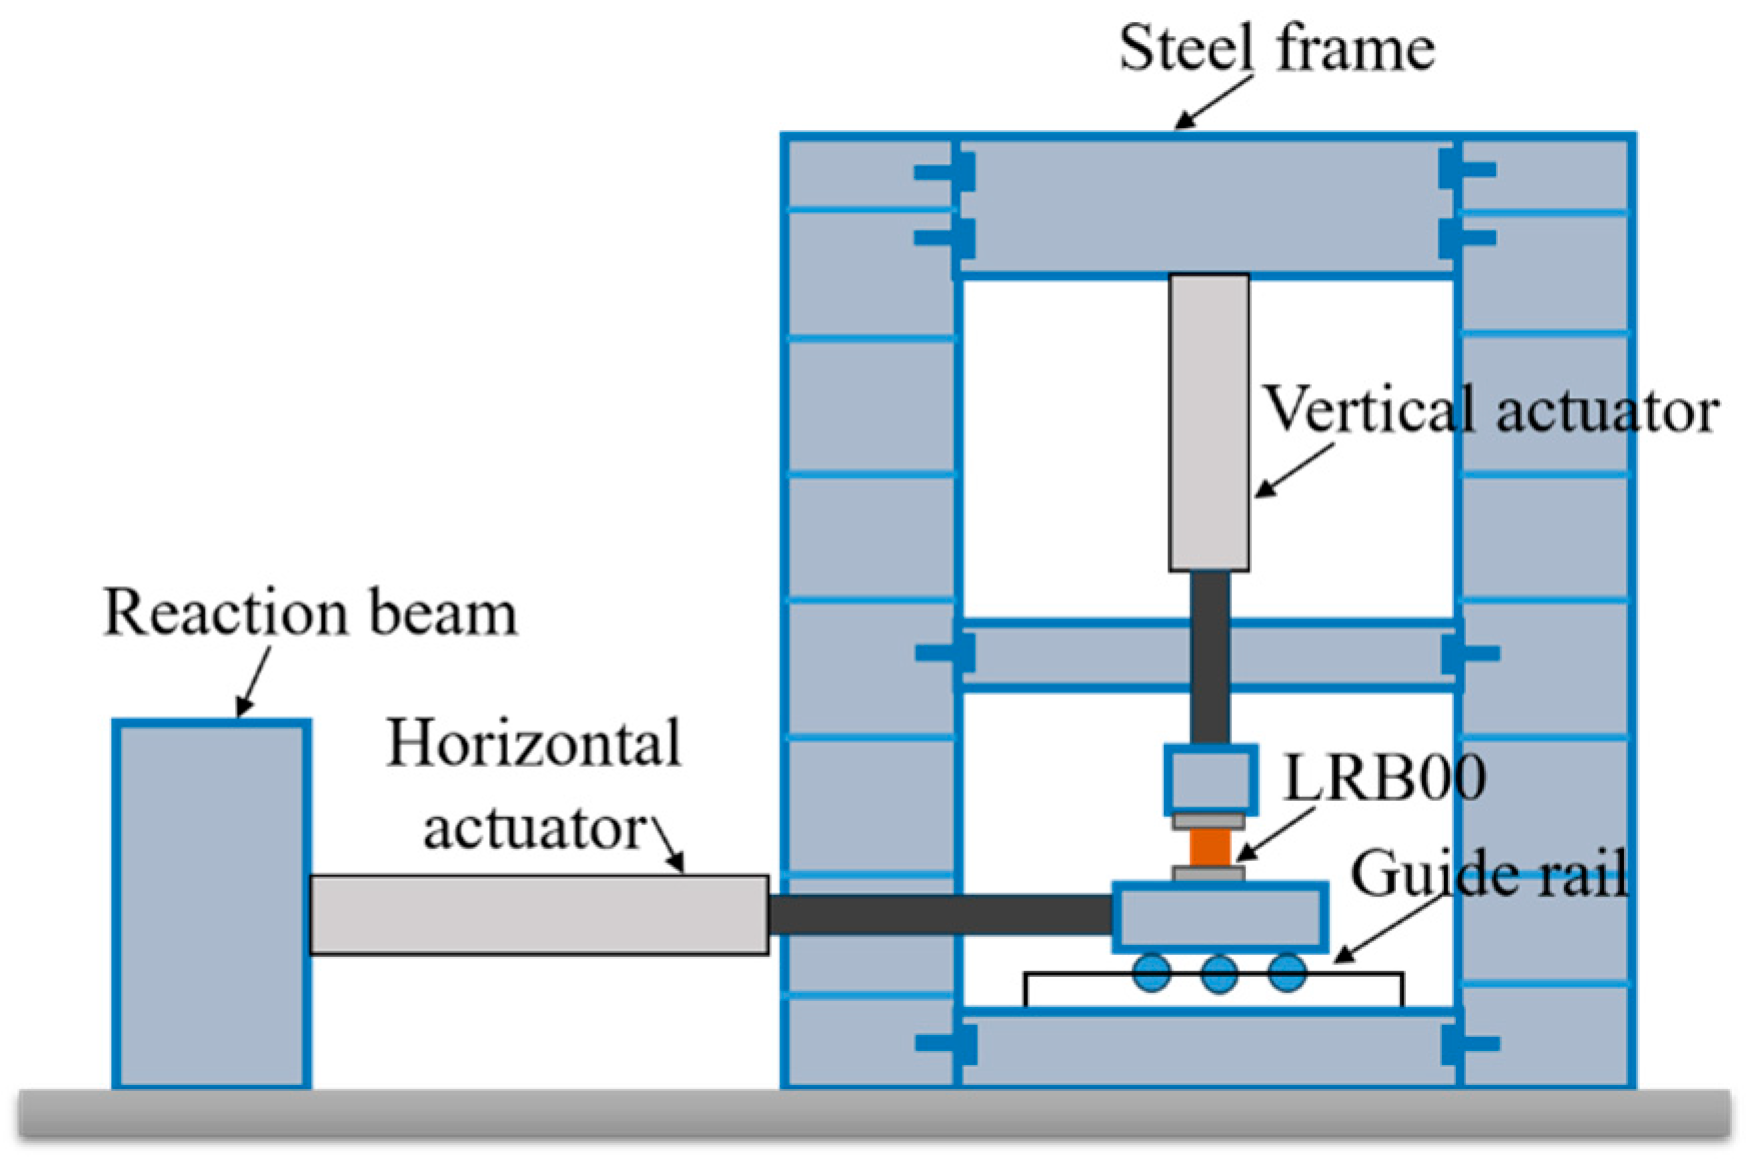
The compression–shear tests were conducted using the test apparatus shown in Figure 2. The test system consisted of a servo-hydraulic actuator with a vertical loading capacity of 1000 kN and a horizontal loading capacity of 630 kN, together with a computer-based data acquisition and analysis system. During the tests, the vertical load was maintained constant, while a sinusoidal displacement input was applied in the horizontal direction under displacement control. The test variables included shear strain amplitude and the loading frequency. The shear strain amplitudes γ were ±50% (9 mm), ±100% (18 mm), ±150% (27 mm), and ±200% (36 mm). The loading frequencies f were 0.05 Hz, 0.2 Hz, and 0.5 Hz. For each loading condition, five consecutive cycles were performed [13]. The detailed test conditions are summarized in Table 2. During the shaking table test, the superstructure above the isolation layer had a weight of 87.6 kN, corresponding to about 14.6 kN per bearing. Therefore, a uniform vertical load of 16 kN was applied to each bearing.

2.3. Dynamic Testing of Bearings

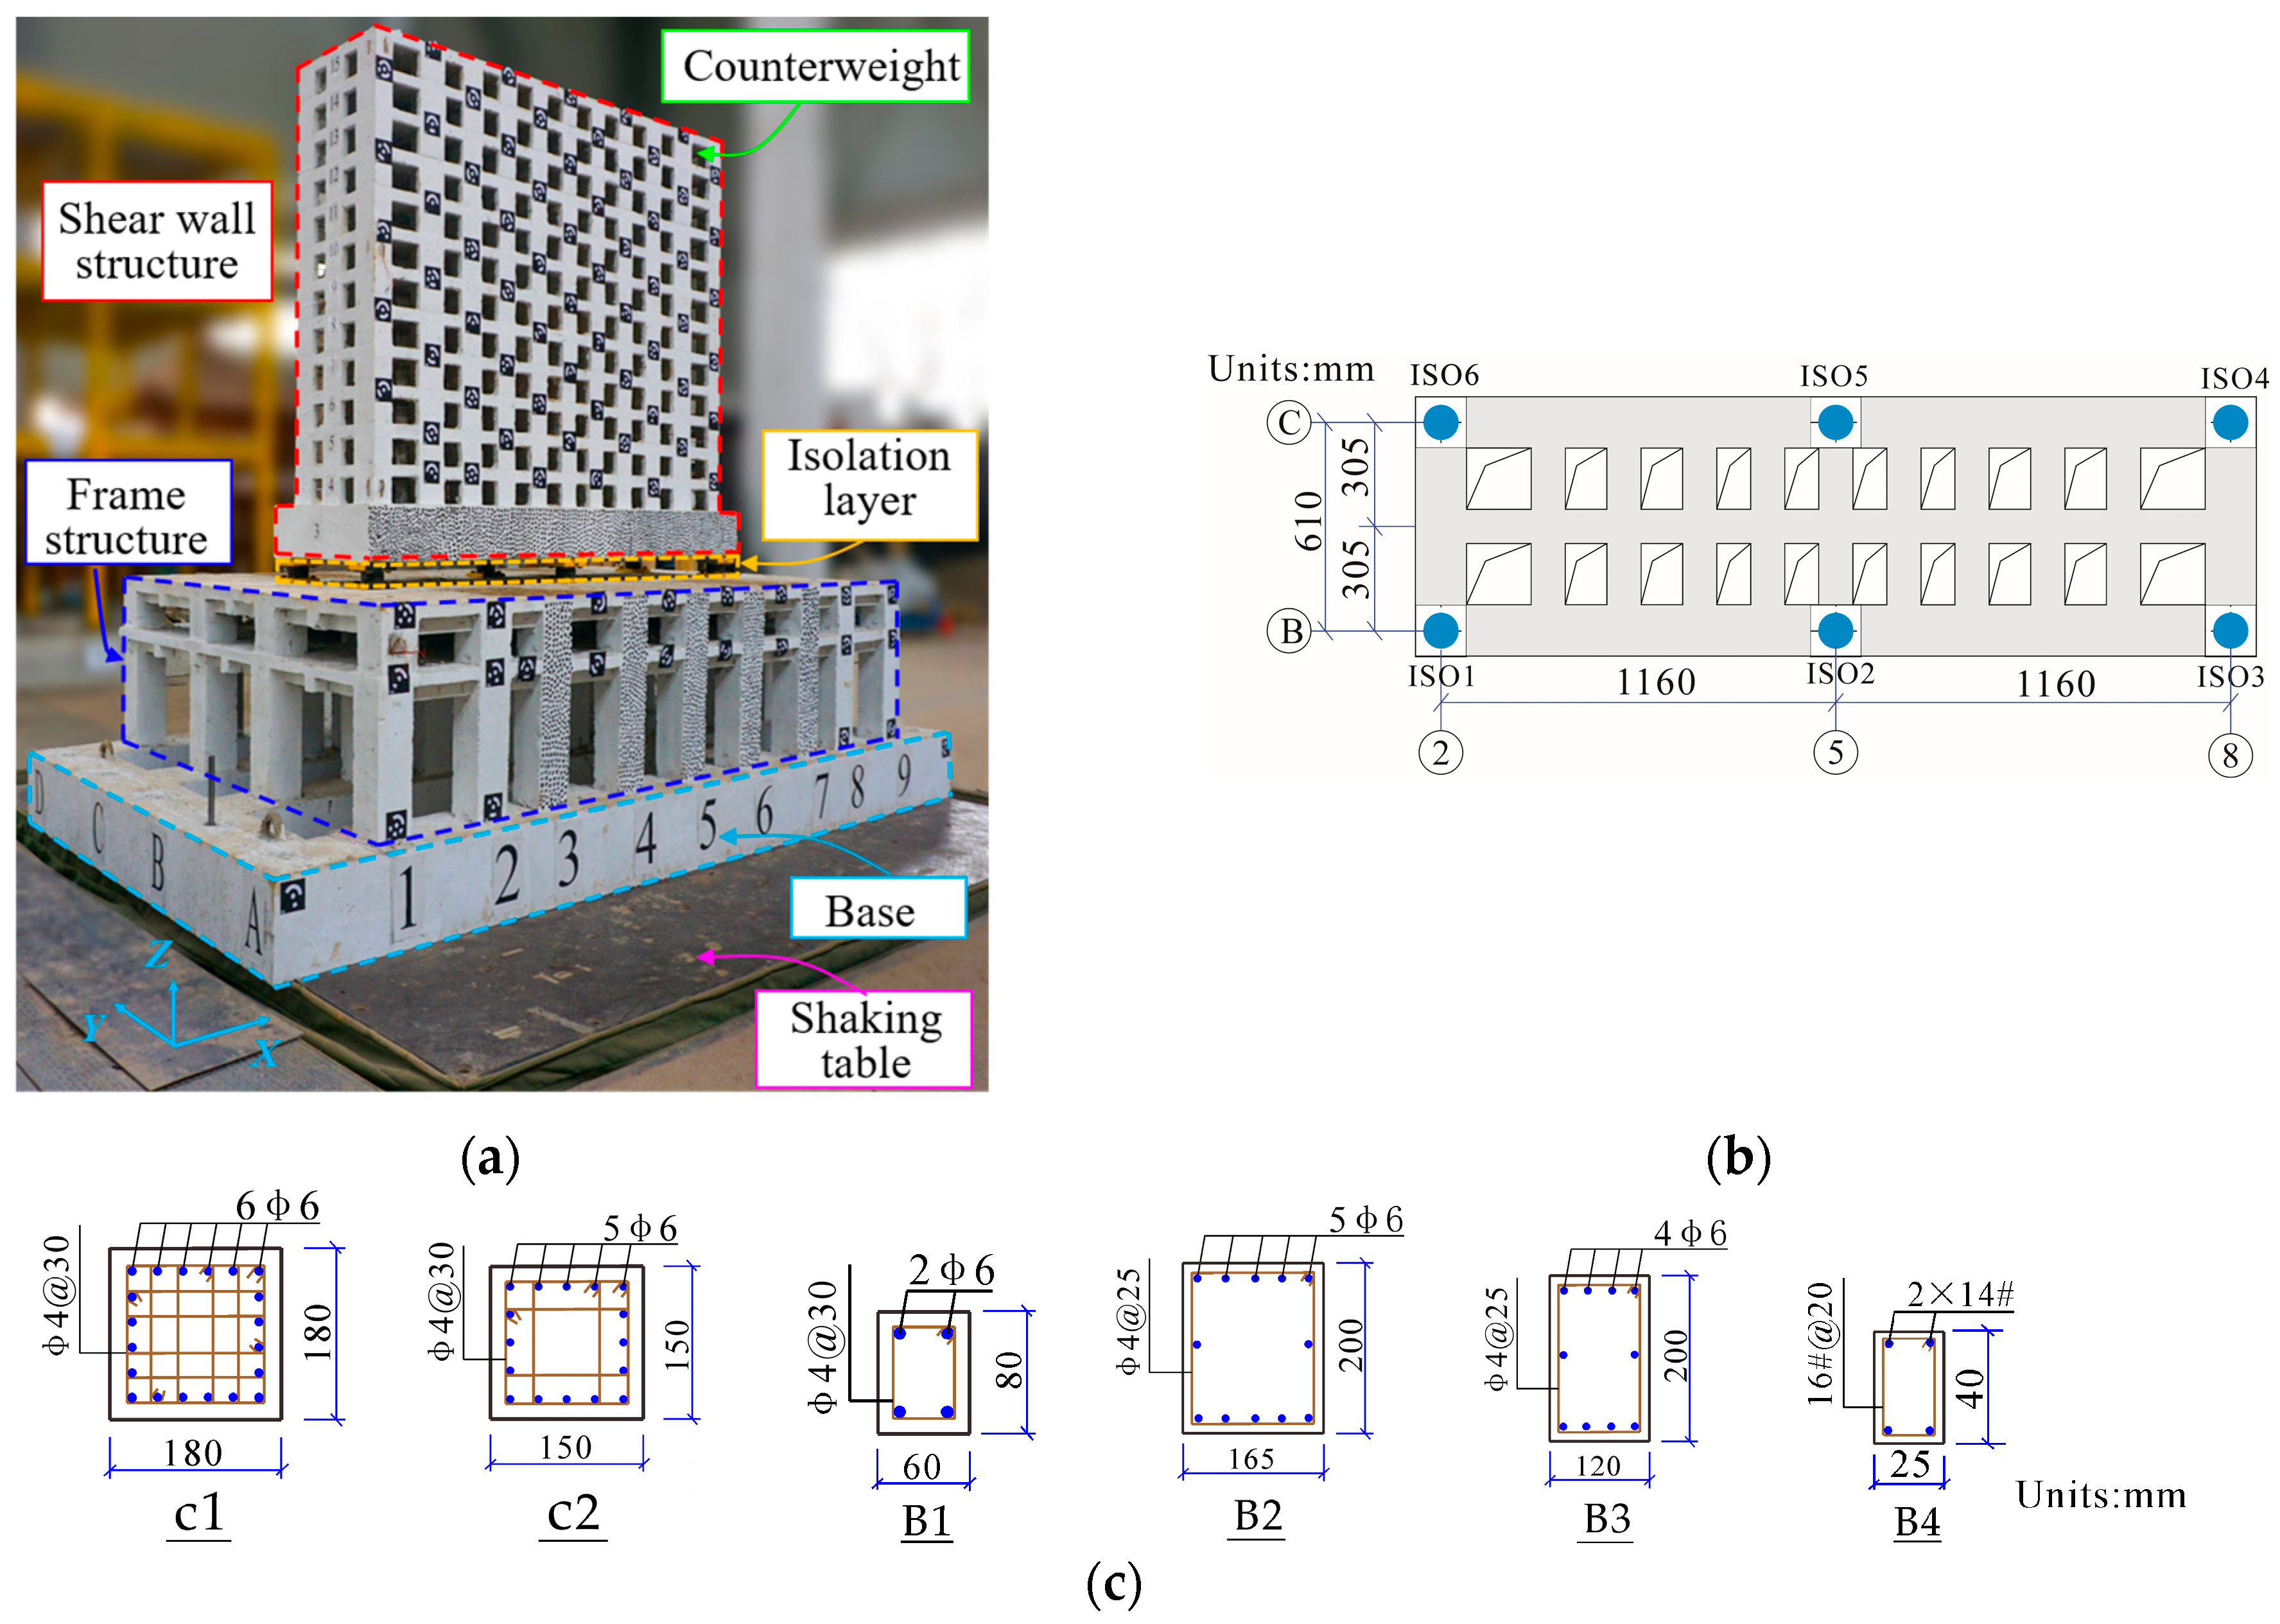
To investigate the dynamic performance of the LRB100 bearings under seismic excitation, a series of shaking table tests were conducted on a scaled model of a seismically isolated high-rise structure constructed above a subway depot [29]. The similarity ratios of the scaled model are listed in Table 3. The overall schematic of the scaled model is shown in Figure 3a. The lower portion is a reinforced concrete frame structure, while the upper portion is a reinforced concrete shear wall structure. A transfer story was placed between the two structural systems. Six LRB100 bearings were installed at the corners and mid-spans of the edge bays in the transfer story. The plan layout of the isolation layer is illustrated in Figure 3b. The cross-sectional reinforcement of the model is shown in Figure 3c. In this figure, C1 and C2 denote the frame columns directly supporting the isolation bearings and the other frame columns, respectively. B1–B4 represent the frame beams of the substructure, the peripheral beams of the transfer story, the internal beams of the transfer story, and the coupling beams of the shear walls.
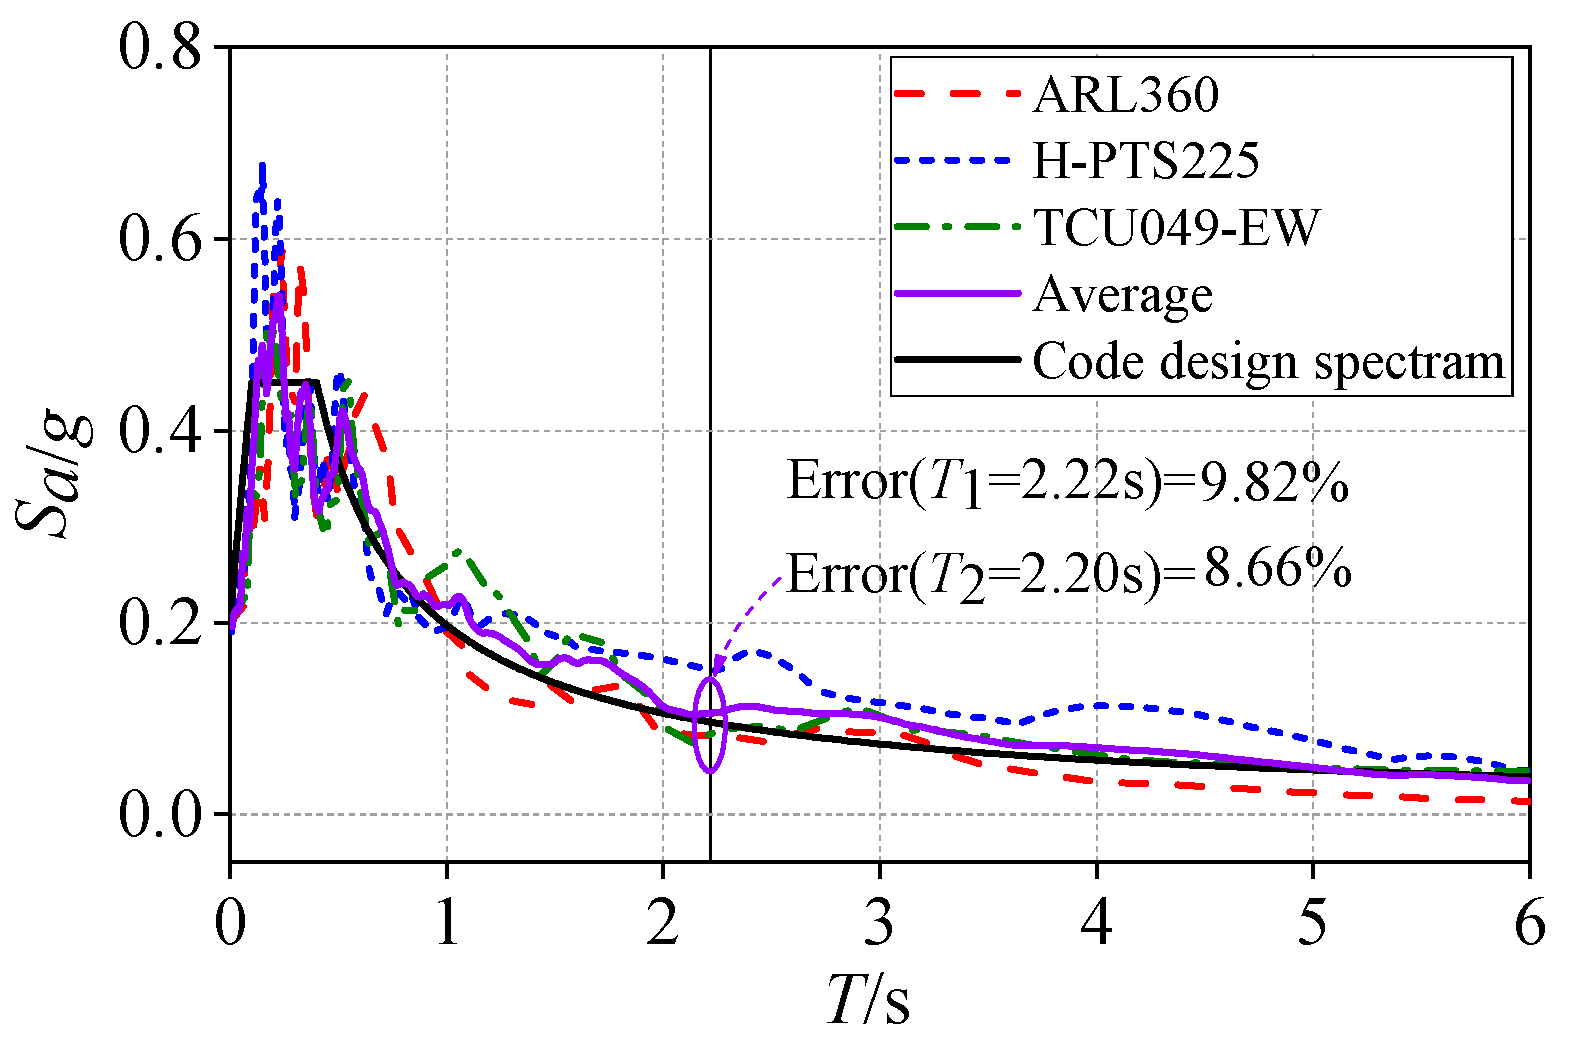
Three natural earthquake records were selected as input excitations. The acceleration response spectra of these ground motions are presented in Figure 4. Compared with the design spectrum (0.20 g, damping ratio 5%), the mean spectral accelerations of the selected records at the first two natural periods show deviations of less than 9.82%, confirming their suitability. During the shake table tests, the records were applied sequentially, and the selected ground motions were applied sequentially. Considering the time similitude ratio, the duration of each motion was compressed to 0.224 of the original record. The peak input acceleration remained unchanged, as the acceleration similitude ratio was set to 1.

3. Mechanical Properties of Small-Diameter Bearings

3.1. Analysis of Quasi-Static Test Results

The compression–shear hysteresis curves of the bearings at different displacement amplitudes and loading frequencies are presented in Figure 5. The results show that: (1) All hysteresis loops exhibited a distinct enclosed area, indicating that the bearings provided substantial energy dissipation. (2) As the loading frequency increased, the hysteresis loop area noticeably decreased, suggesting reduced energy dissipation capacity under high-frequency loading. (3) The equivalent stiffness increased with loading frequency, which can be attributed to the material stiffening effect under dynamic loading.
The mechanical performance indicators of the bearings were calculated from the experimentally measured hysteresis curves using the following equations:
F y = 1 2 ( Q d 1 Q d 2 )
K d = 1 2 ( Q 1 Q d 1 X 1 + Q 2 Q d 2 X 2 )
K h = Q 1 Q 2 X 1 X 2
h eq = 2 Δ W π K h ( X 1 X 2 ) 2
where Q1 and Q2 denote the maximum and minimum shear forces of the hysteresis loop; X1 and X2 represent the corresponding maximum and minimum shear displacements of the bearing; Qd1 and Qd2 are the positive and negative shear forces at the intersections of the hysteresis loop with the vertical axis; and ΔW denotes the area enclosed by the hysteresis loop.
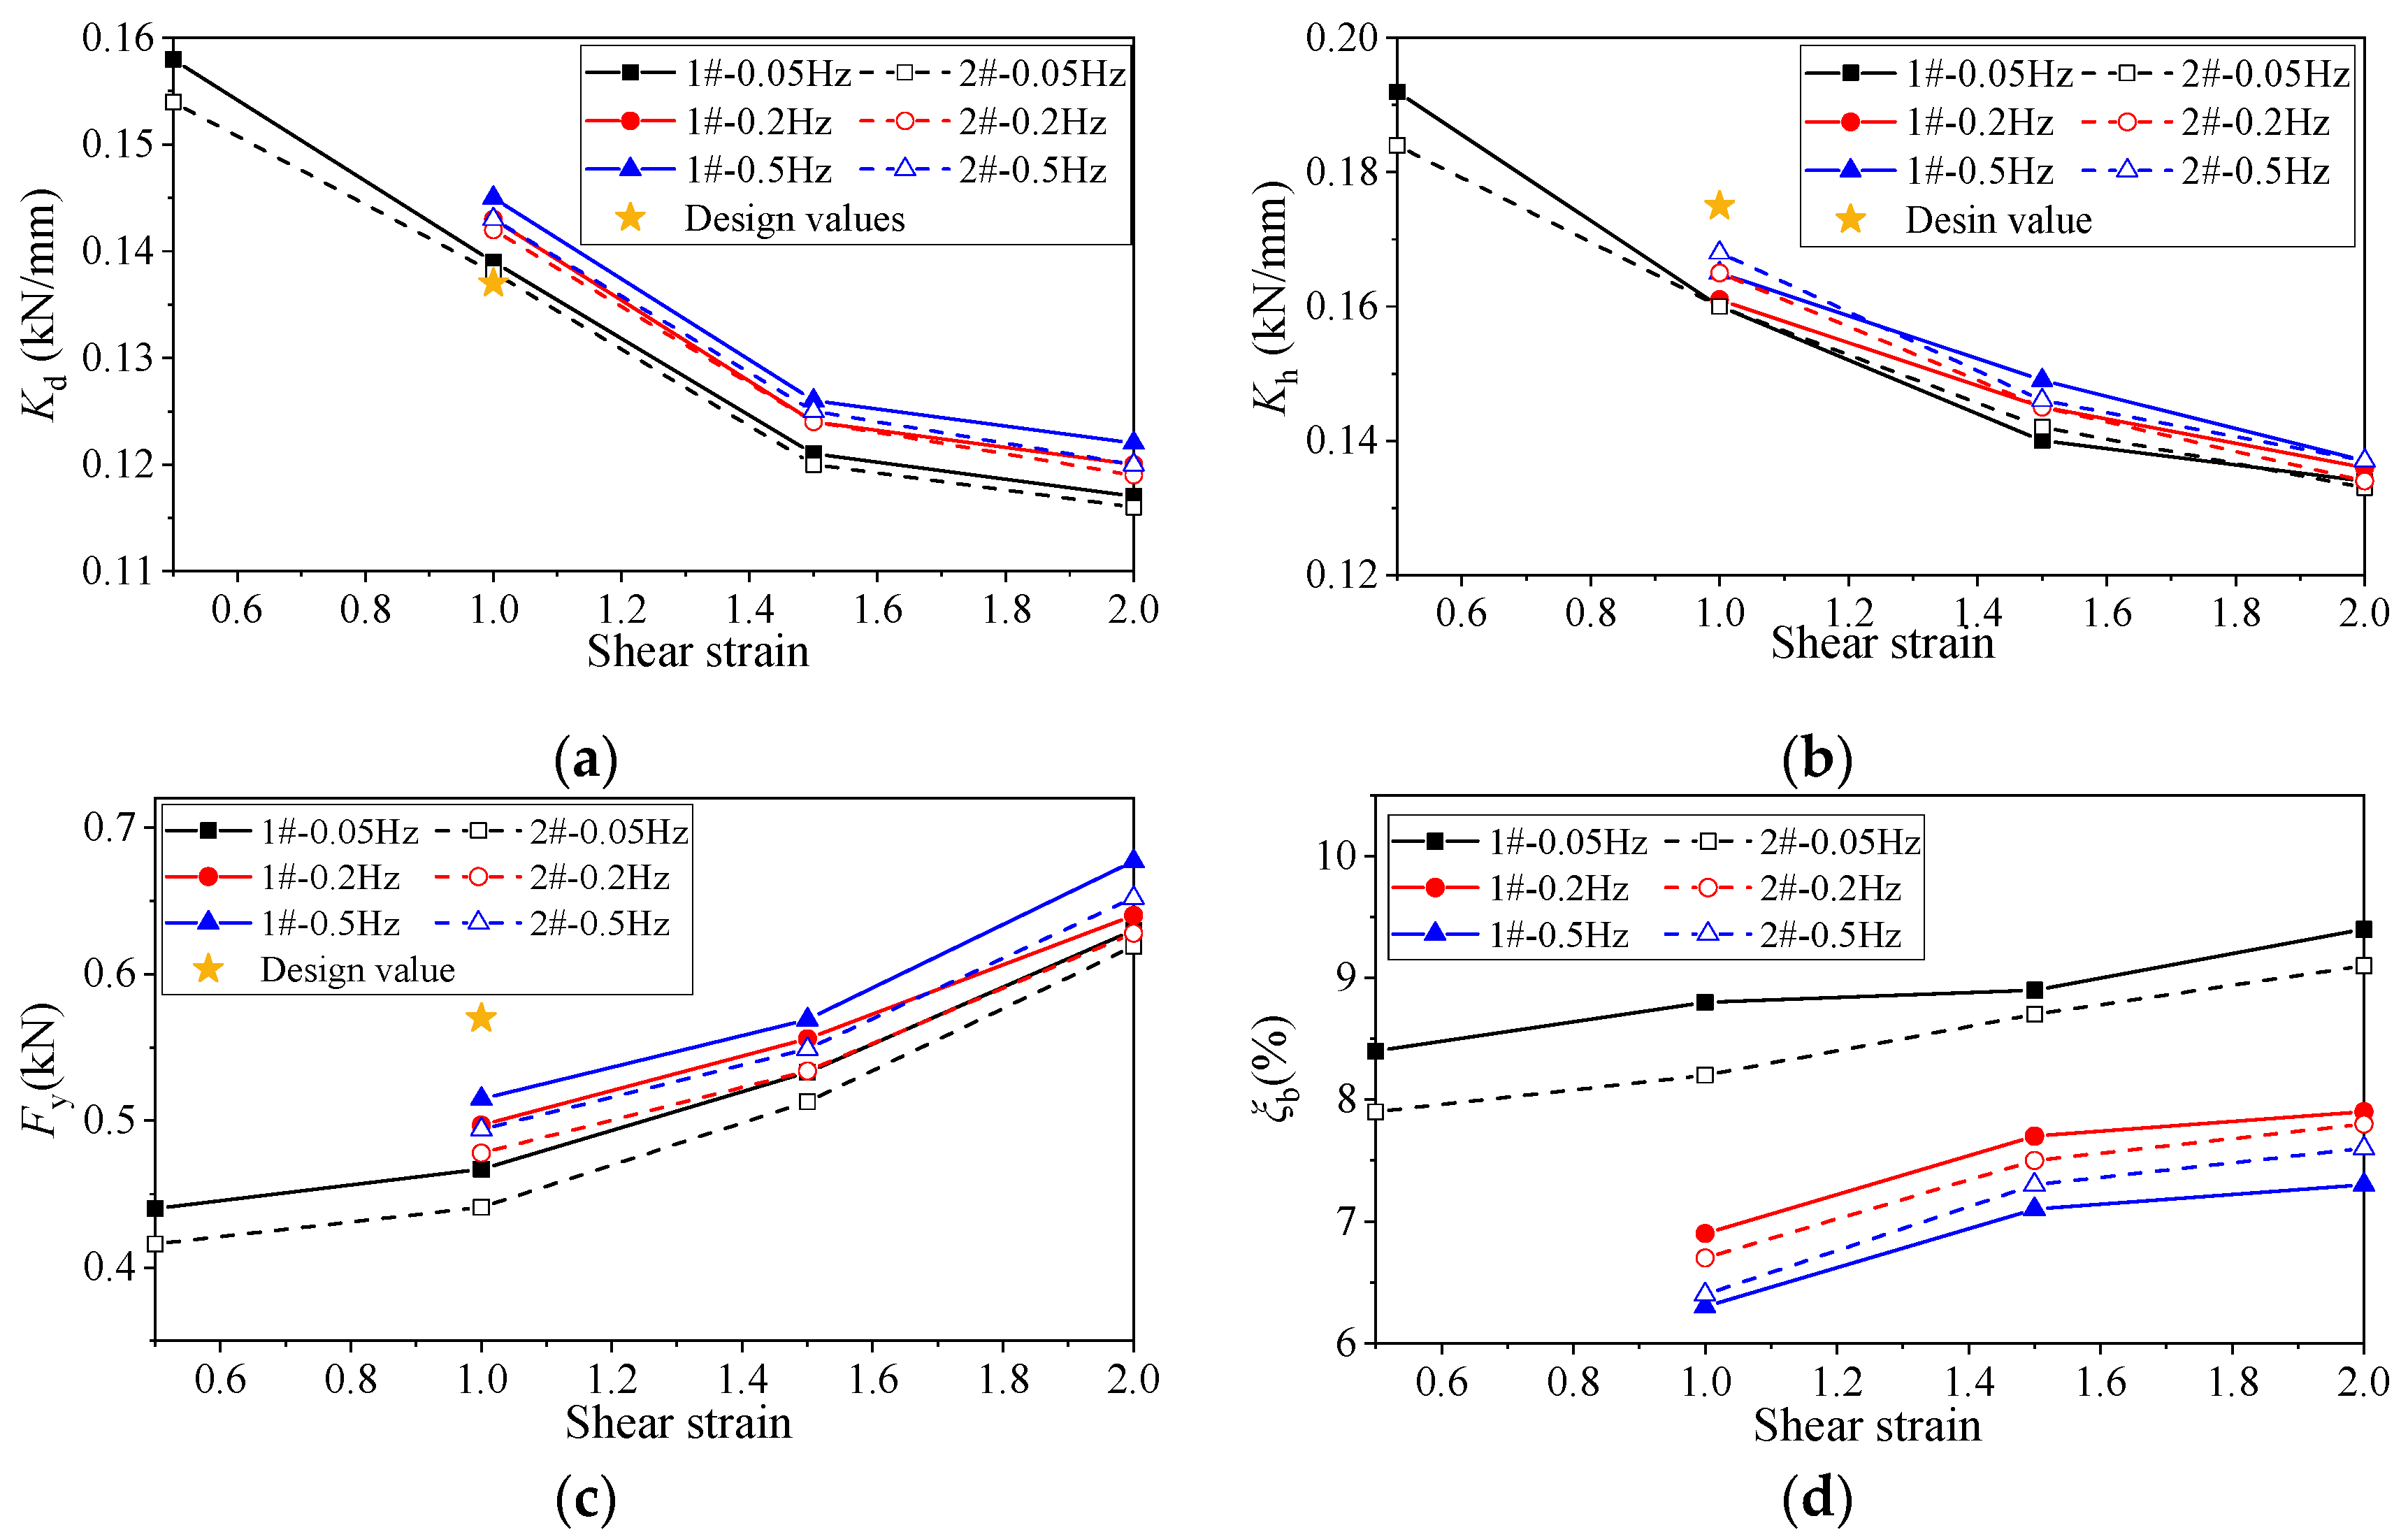
Based on Equations (7)–(10), the mechanical performance parameters of the LRB100 bearing were calculated, as Table 4 summarizes. The variations of these parameters under different displacement amplitudes and loading frequencies are illustrated in Figure 6. From Table 4 and Figure 6a–d, the following observations are noted: (1) Both the post-yield stiffness Kd and the horizontal equivalent stiffness Kh decrease with increasing shear strain, showing similar rates of reduction. At a loading frequency of 0.05 Hz, when the shear strain increases from 50% to 200%, Kd decreases by 35% and Kh by 40%. Most of the reduction occurs in the shear strain range of 50–150%, beyond which the stiffness stabilizes. When the frequency increases from 0.05 Hz to 0.5 Hz, Kd and Kh increase by less than 5%, indicating that the influence of loading frequency on stiffness is negligible. (2) The yield force Fy increases with both shear strain and loading frequency. When the shear strain increases from 50% to 200%, the maximum change in Fy is 0.20 kN; when the frequency increases from 0.05 Hz to 0.5 Hz, the maximum change is 0.075 kN. Thus, the effect of loading frequency is approximately one-third that of shear strain. (3) The equivalent damping ratio heq increases with shear strain, rising from 8% to 9% as shear strain increases from 50% to 200%, indicating enhanced energy dissipation capacity. However, heq decreases with increasing loading frequency, dropping from 8% to about 6% as the frequency increases from 0.05 Hz to 0.5 Hz, indicating reduced energy dissipation capacity at higher frequencies.

3.2. Analysis of Dynamic Test Results

Based on the acceleration measurements obtained from the accelerometers installed in the scaled model, together with the mass and story height of each floor, the story shear forces at each level were calculated. The shear force in the isolation layer was obtained by summing the story shear forces of the isolation layer and all superstructure stories above it. The calculation is given as
F b = m l a l + i = 1 12 m i a i
where Fb denotes the story shear force at the isolation layer; ml and al represent the mass and absolute acceleration of the transfer beam, respectively; and mi and ai denote the mass and absolute acceleration of the ith story of the superstructure, respectively.
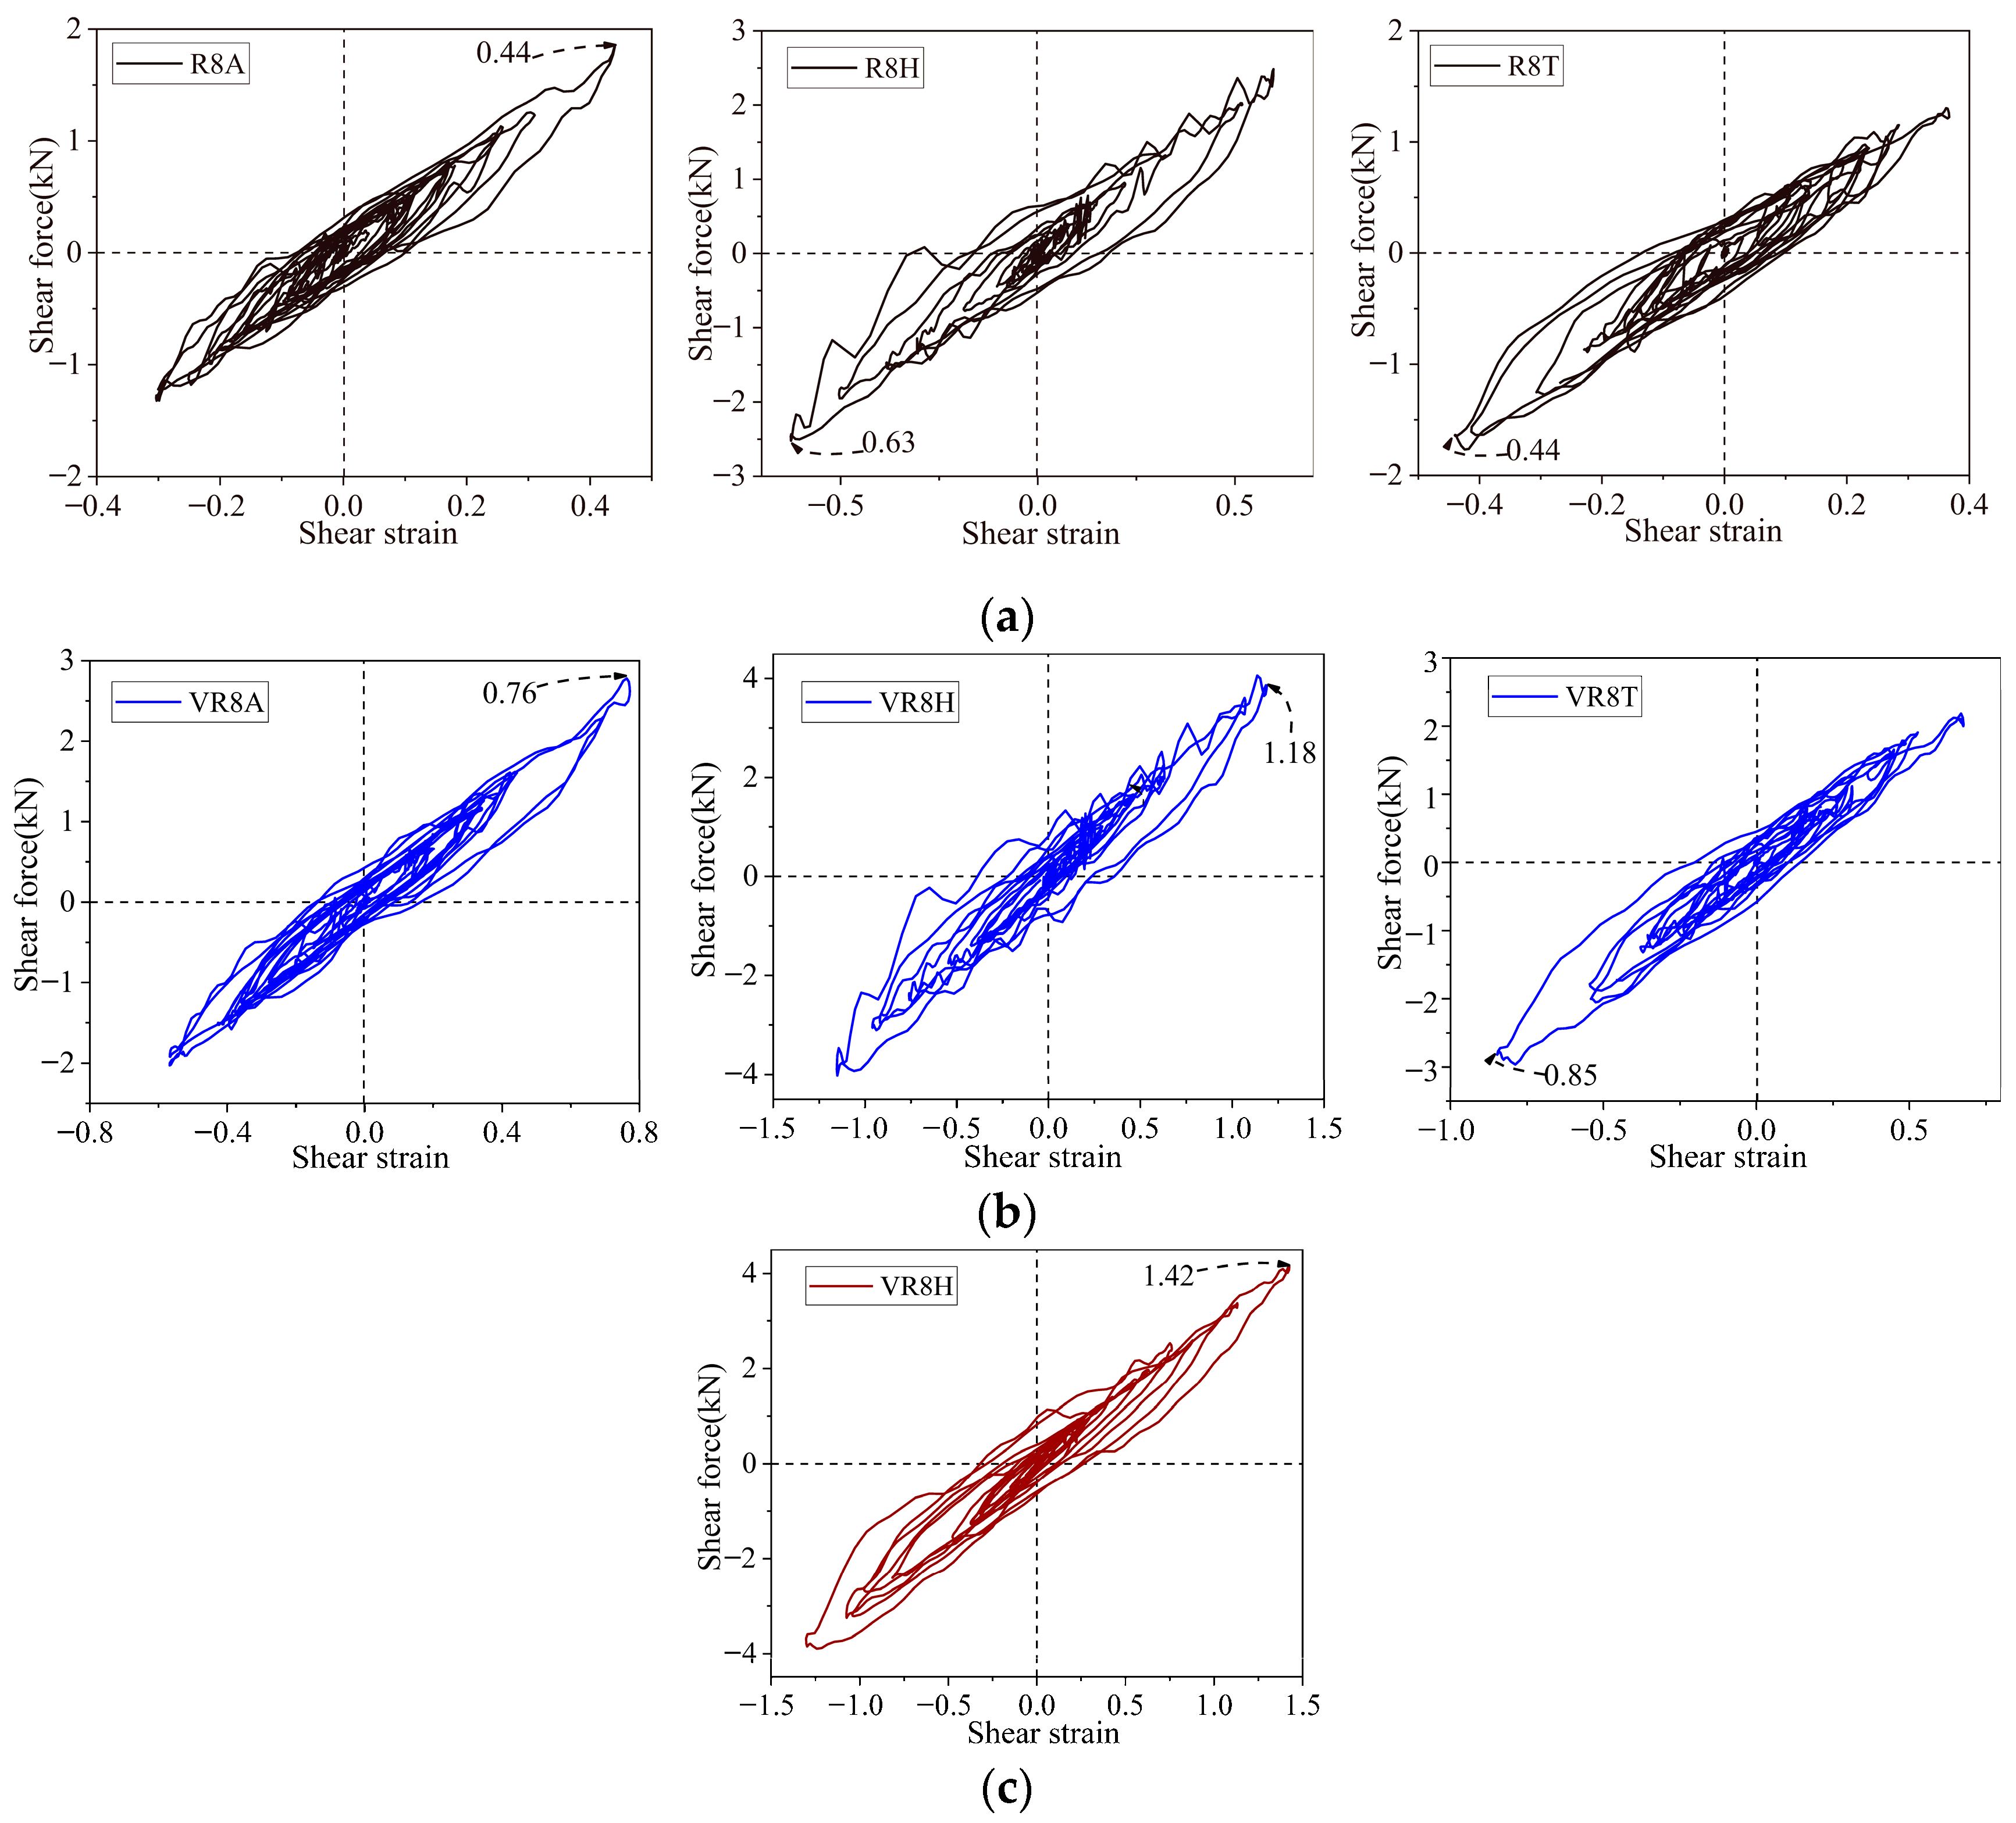
Under different earthquake ground motion inputs, the hysteresis curves at bearing displacement amplitudes of 50%, 100%, and 150% shear strain were extracted, as shown in Figure 7. In Figure 7, “R8A” denotes the hysteresis curve of the bearing under the ground motion record ARL360, with R corresponding to a rare earthquake scenario of intensity 8 degrees.
The mechanical performance parameters of the bearings under seismic excitation, along with their comparison to the compression–shear test results, are presented in Table 5. The following findings were observed: (1) when the shear strain increases from 50% to 150%, the post-yield stiffness Kd decreases by 33% and the horizontal equivalent stiffness Kh decreases by 40%, while the equivalent damping ratio heq increases from 9% to 10%. This trend is consistent with the quasi-static test results, indicating that increased deformation leads to stiffness degradation and a higher damping ratio. (2) Under different seismic inputs, the maximum relative errors of Kd and Kh are within 5%, and the variation in heq is small. This indicates that the horizontal mechanical properties of the bearings are not highly sensitive to input earthquakes and remain stable.
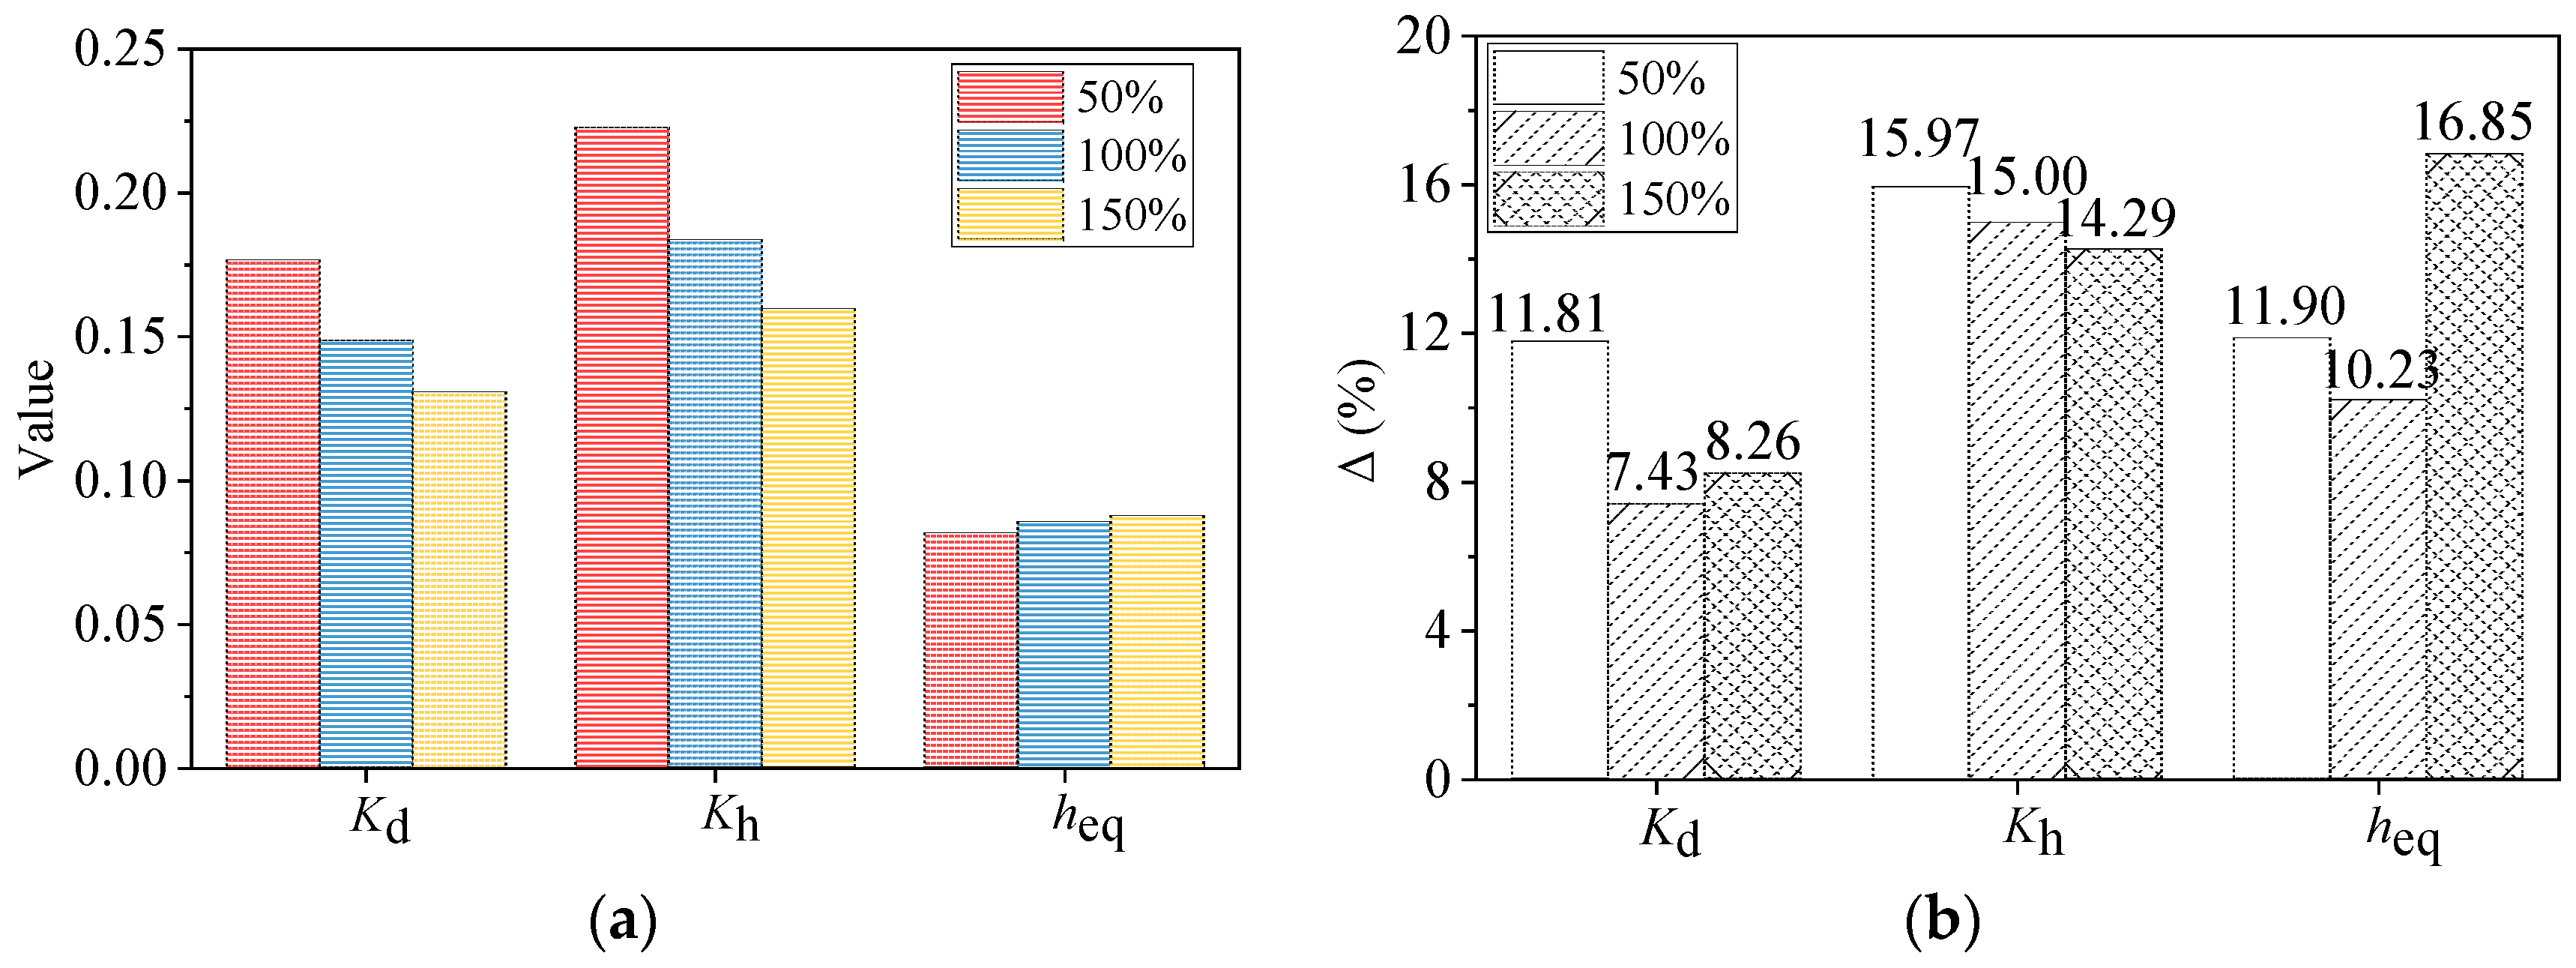
A comparison of the mechanical parameters obtained from the dynamic and quasi-static tests is shown in Figure 8. As illustrated, all three performance indices are generally higher under dynamic loading than under quasi-static loading, demonstrating that both the stiffness and the energy dissipation capacity of the bearings can be significantly enhanced by seismic excitation. The largest increase is observed in Kh (14.29–15.97%), indicating that the horizontal equivalent stiffness is the most sensitive to dynamic loading; the increase in Kd is relatively smaller (7.43–11.81%), with the smallest enhancement observed at 100% shear strain. The equivalent damping ratio heq increases by 10.23–16.85%, with the enhancement becoming more pronounced as shear strain increases, and the most significant improvement observed at 150% shear strain. It can therefore be concluded that the enhancement of mechanical performance under seismic excitation is most pronounced in Kh and relatively limited in Kd. Direct application of quasi-static test results in seismic response analysis may lead to an overestimation of the displacement demand in the isolation layer.

4. Restoring Force Model of Small-Diameter Bearing

4.1. Identification of Restoring Force Model Parameters

The Bouc–Wen model, owing to its explicit differential equation form, has been widely employed in the nonlinear analysis of base-isolated structures [30,31]. The restoring force of the isolation bearing can be computed from Equations (12)–(13):
F ( x ) = α k 0 x + ( 1 α ) k 0 z
z ˙ = β x ˙ z z n 1 γ x ˙ z n + A x ˙
where F denotes the restoring force of the isolation bearing; α represents the ratio of post-yield stiffness to pre-yield stiffness (typically taken as 0.1); k denotes the pre-yield stiffness; z denotes the hysteretic displacement; A, β, and γ govern the initial stiffness and the fundamental shape of the hysteretic curve; and n defines the smoothness of the curve.
For full-scale bearings, the default values of A, β, γ, and n are typically taken as 1, 0.5, 0.5, and 1, respectively. However, significant differences exist between the structural parameters of small-diameter bearings and those of full-scale bearings; therefore, the direct adoption of the full-scale parameter values may lead to considerable errors. In this study, the Bouc–Wen model parameters A, β, γ, and n and the pre-yield stiffness k were identified for the LRB100 bearing based on its compression–shear hysteresis curves using a genetic algorithm. The optimization objective was to minimize the sum of squared errors (SSE) between the theoretical restoring force F(x) and the experimentally measured restoring force, as given in Equation (14):
min i = 1 N F i theory F i test 2
where F i theory and F i test represent the theoretical and experimentally measured restoring forces, respectively, at the ith time step.
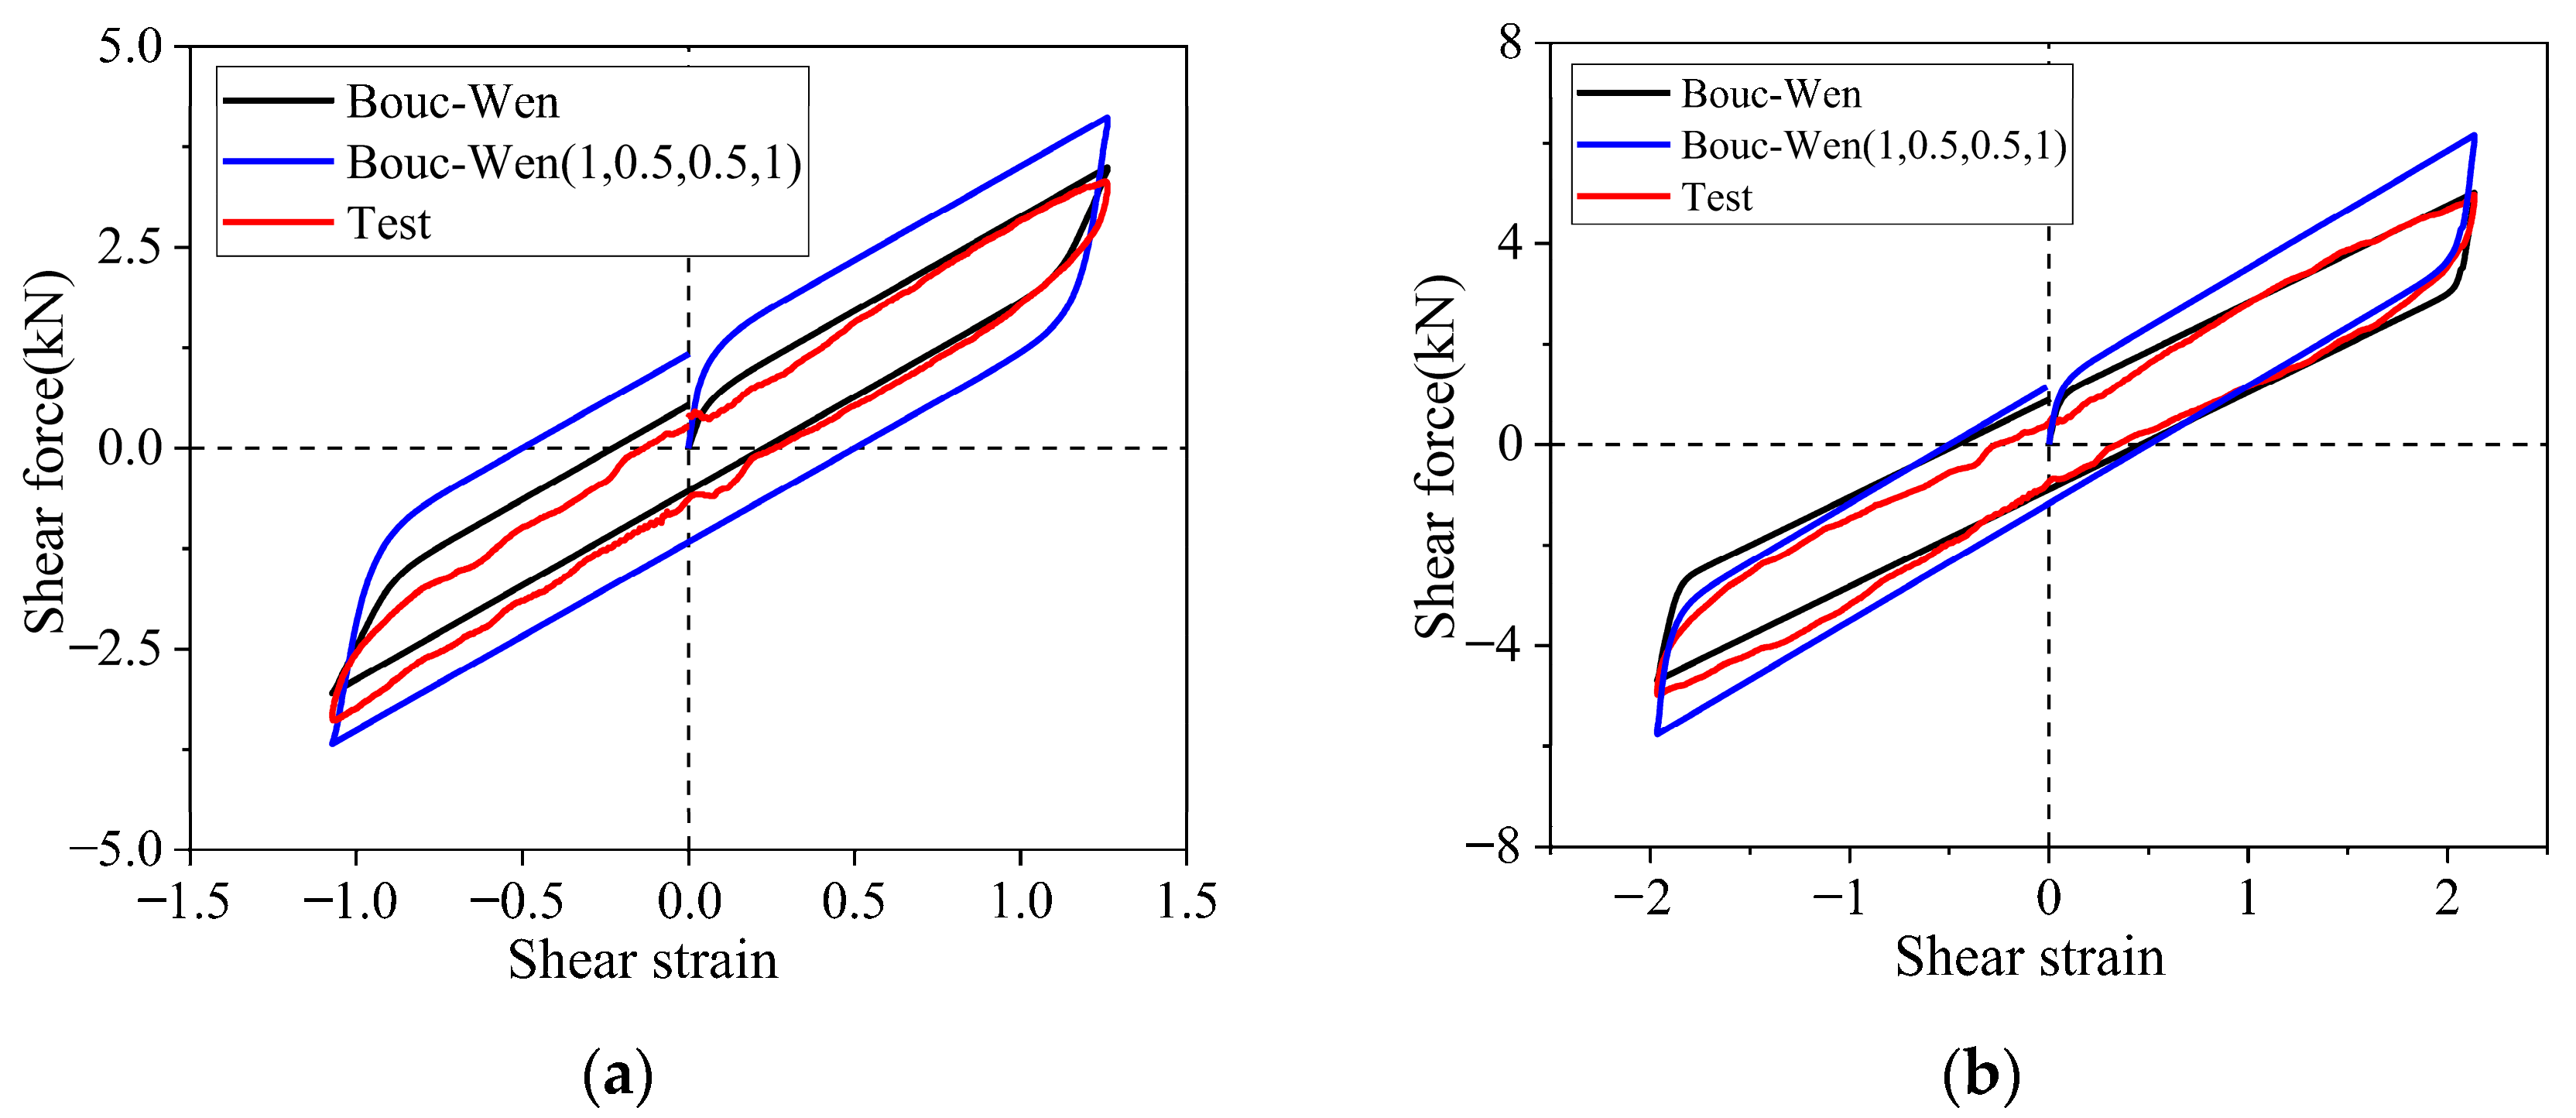
In the parameter identification of the LRB100 bearing, the genetic algorithm was configured with a population size of 500 and a maximum of 300 generations, and the parameters were identified as A = 0.3, β = 0.75, γ = 0.7, and n = 2, all of which are significantly smaller than the corresponding values for full-scale bearings. Therefore, the direct adoption of the full-scale parameter values is not appropriate for scaled bearing analysis. The pre-yield stiffness k0 of the bearing was identified as 1.3 kN /mm. Under a loading frequency of 0.05 Hz, a comparison between the hysteresis curves obtained from the compression–shear test and those computed theoretically for the LRB100 is presented in Figure 9. A comparison of the experimentally measured and theoretically predicted mechanical performance parameters is provided in Table 6.
Figure 9 and Table 6 show that the relative discrepancies (Error 1) between the theoretical predictions and the experimental measurements from the quasi-static tests of the bearing are less than 10%. This indicates that the Bouc–Wen model parameters identified through the genetic algorithm can be used to accurately capture the mechanical behavior of the LRB100 bearing. Compared with those of full-scale bearings, the smaller values of A, β, γ, and n for the small-diameter bearing are found to reflect differences in initial stiffness, hysteresis loop shape, and asymmetry, indicating that the parameters of full-scale bearings should not be directly applied to scaled bearings. The hysteresis curves calculated using the full-scale parameters showed significant deviations from the experimental curves, particularly in terms of peak stiffness and energy dissipation capacity.
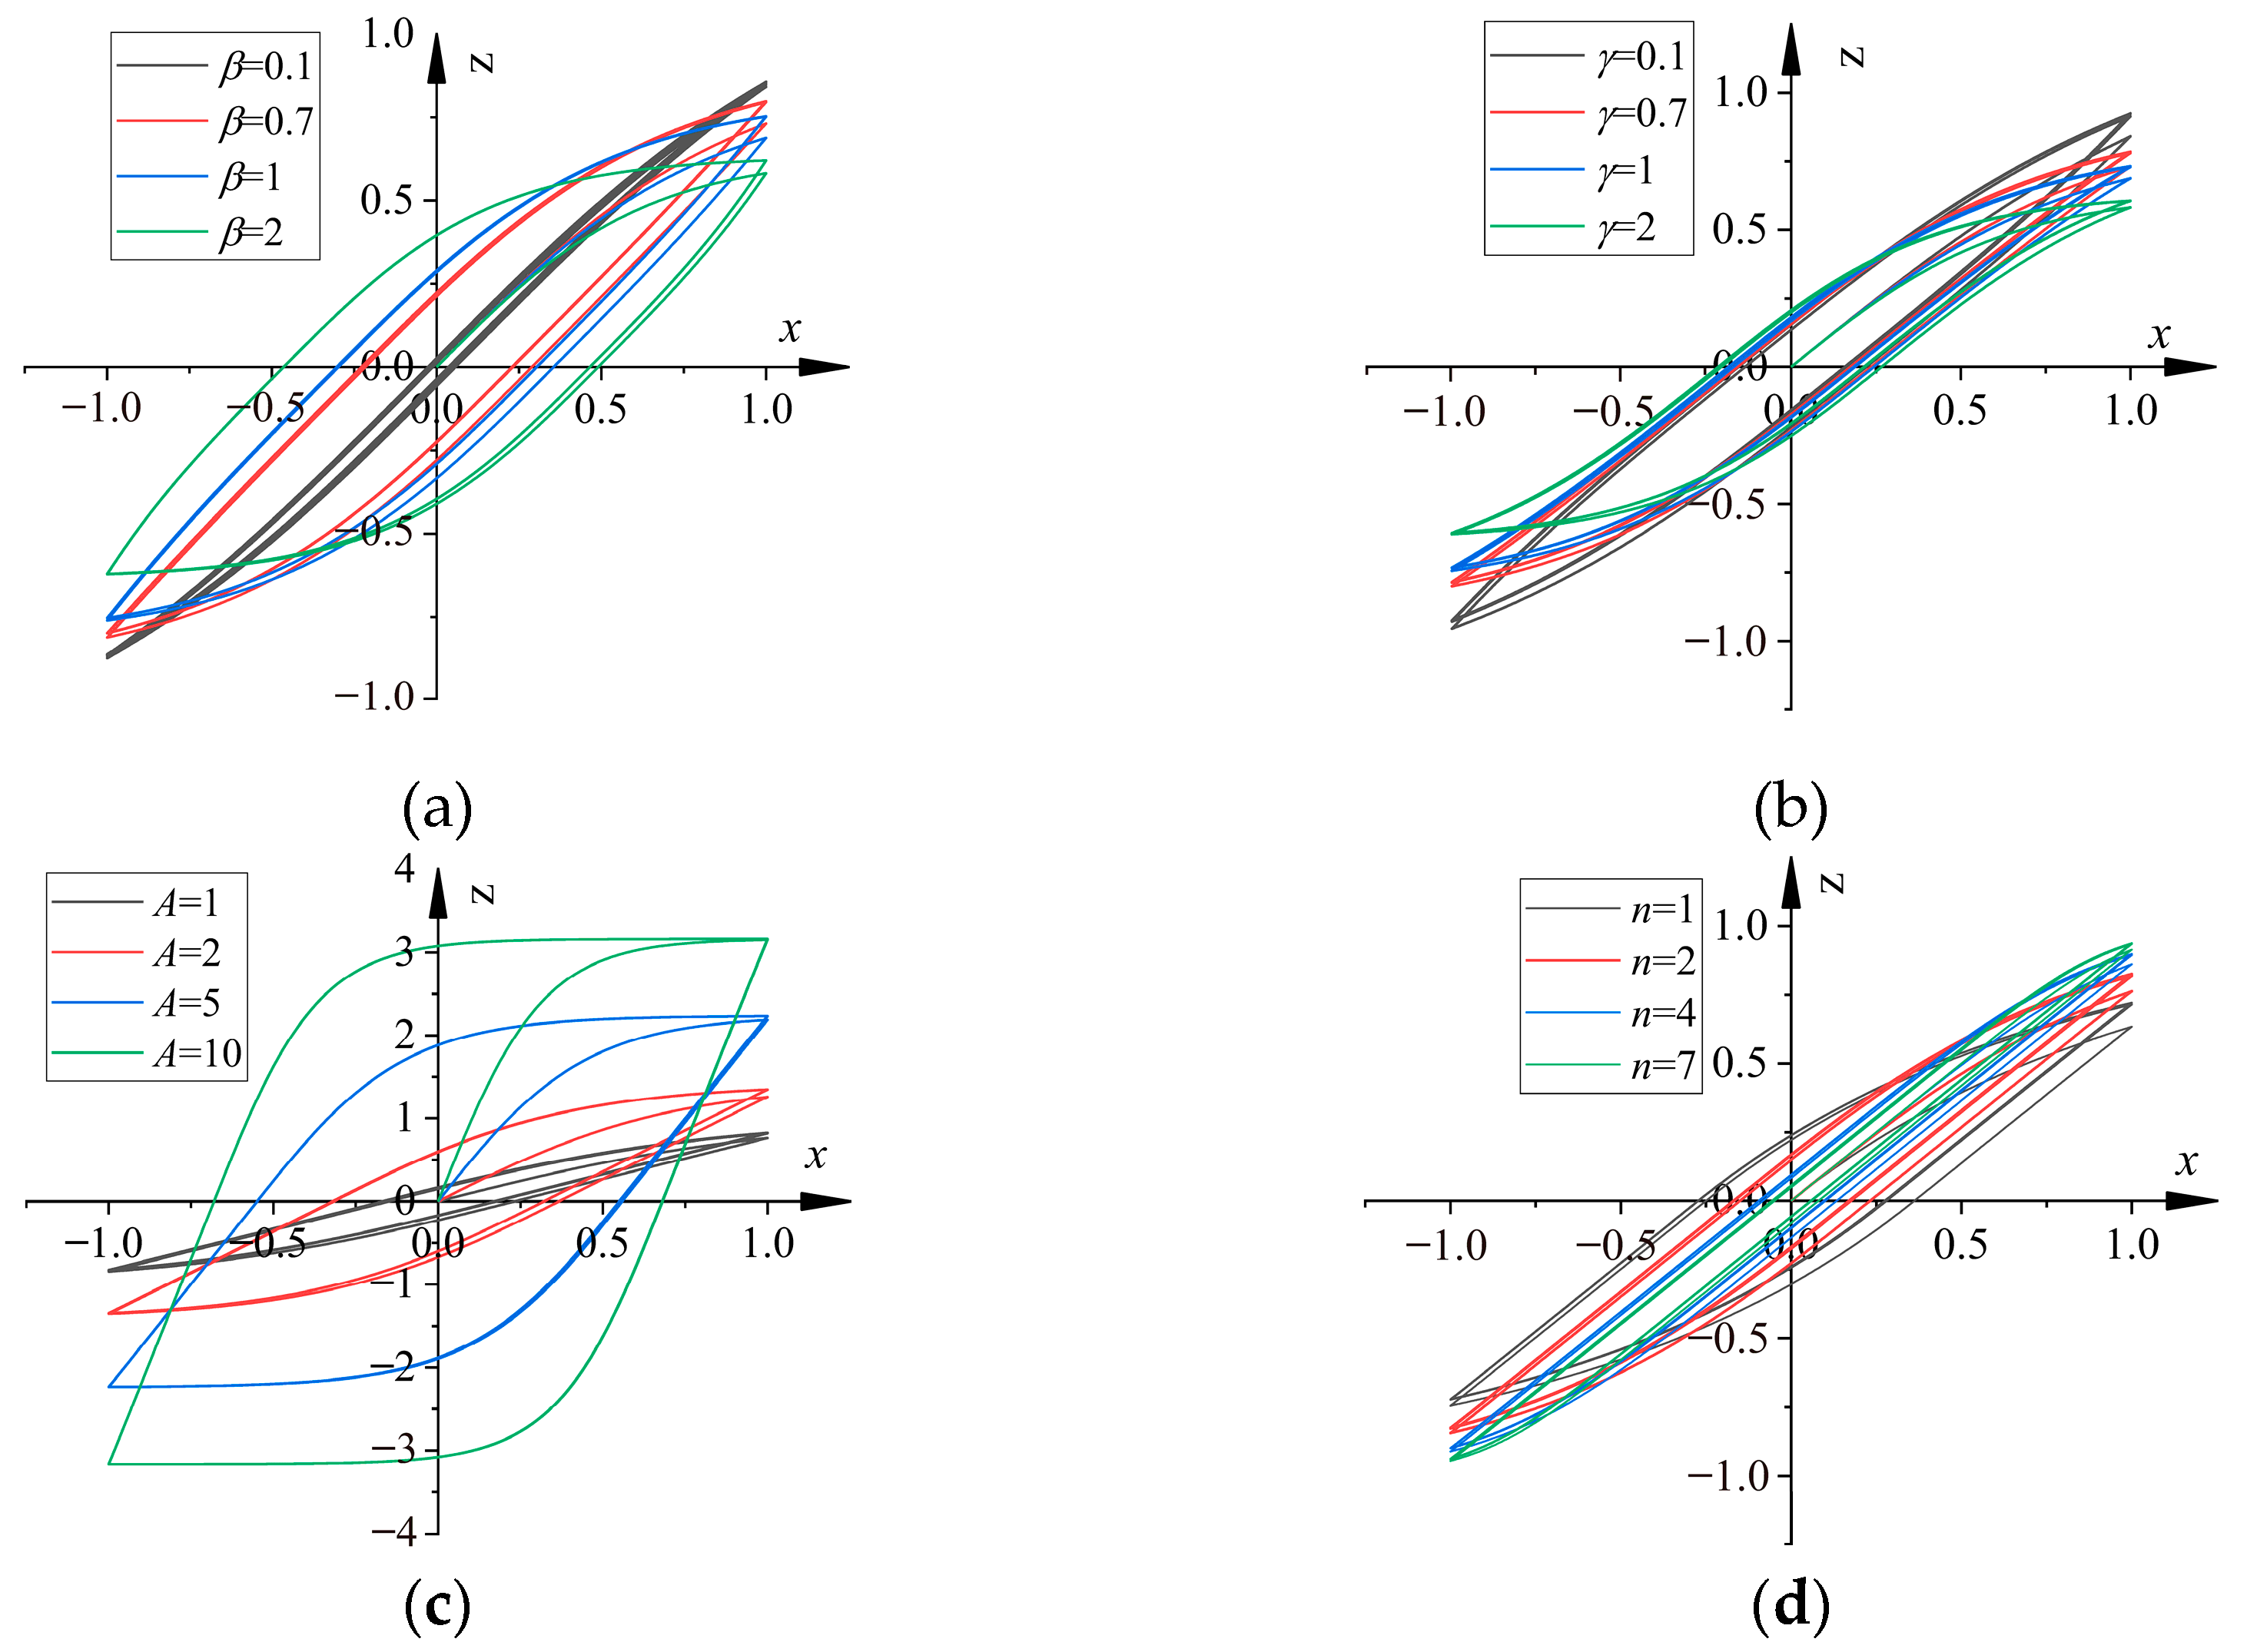
The hysteresis curves of the Bouc–Wen elastic–plastic restoring force model with different parameters are presented in Figure 10, and the hysteresis curves of the bearings with different pre-yield stiffness values are presented in Figure 11.
As shown in Figure 10 and Figure 11, the parameters β, γ, A, and n significantly influence the shape of the hysteresis curve, whereas the pre-yield stiffness k0 has only a minor effect, which mainly results in a counterclockwise rotation of the curve and directly increasing the initial and equivalent stiffness of the bearing. Therefore, in the analysis, the values of β, γ, A, and n were kept constant, while the pre-yield stiffness was increased to account for the experimentally observed phenomenon that the post-yield stiffness and equivalent stiffness of the bearing under dynamic loading were greater than those obtained from quasi-static tests. A comparison of the experimentally measured and theoretically predicted mechanical performance parameters is presented in Table 6.
Analytical results indicate that increasing the pre-yield stiffness by a factor of 1.15 results in mechanical indices of the bearing with a maximum relative error (Error 2) of only 2.17% compared with the measured stiffness obtained from shaking table tests. Therefore, in subsequent analyses, the pre-yield stiffness parameter identified via the genetic algorithm in the Bouc–Wen hysteretic model can reasonably be amplified by a factor of 1.15. It should be emphasized, however, that the applicability of these results is primarily limited to scaled models that are geometrically similar to the bearings investigated in this study.

4.2. Sensitivity Analysis of Restoring Force Model Parameters

The restoring force model of the LRB100 bearing is influenced not only by the Bouc–Wen model parameters but also by the pre-yield stiffness k0 and the yield force Fy. Typically, these two parameters are determined from the hysteresis curve of the bearing; however, their values may be affected by uncertainties due to the precision limitations of the test apparatus and inaccuracies in the loading process. Therefore, it is necessary to investigate the sensitivity of k0 and Fy- to the seismic response of the structure.
For this purpose, an equivalent two-degree-of-freedom (2DOF) model was established for a high-rise over-track structure with an inter-story isolation system. The lower two-story frame structure was modeled as a single-degree-of-freedom (SDOF) system, while the isolation layer together with the upper shear wall structure (due to its high stiffness) was modeled as another SDOF system. The isolation layer was assumed to exhibit elastoplastic behavior, and the lower structure was assumed to be elastic. The dynamic equations of the model are given by:
( m 1 + m b ) x ¨ 1 t + m b x ¨ 2 t + c 1 x ˙ 1 t + k 1 x 1 t = ( m 1 + m b ) x ¨ g t
m b x ¨ 2 t + m b x ¨ 1 t + c b x ˙ 2 t + f s x 2 , z = m b x ¨ g t
f s x , z = α k 0 x t + 1 α F y z t
z ˙ t = 1 d y x ˙ t A β sign x ˙ t × z t + γ z t n
Equations (15)–(18) were reorganized into the following matrix form:
M x ¨ + C x ˙ + K e x + K h z = M g u ¨ g
z ˜ = x ˙ A β sign x ˙ × z + γ z n
where M = m 1 + m b m b m b m b ; K e = k 1 0 0 α k 2 ; C = c 1 0 0 c b ; K h = 0 0 0 ( 1 α ) k 2 ; M g = m 1 + m b m b ; k 1 = m sub ω sub 2 ; c 1 = 2 ξ m sub ω sub ; k2 denotes the pre-yield stiffness of the isolation layer; cb is the inherent damping of the isolation layer (taken as 0 in this study), and the fundamental frequency ωsub of the equivalent SDOF model for the lower structure was identified based on the white-noise test condition.
The equations of motion were solved by means of the Newmark-β integration method. At the ith time step, the equivalent stiffness of the isolation layer was calculated as:
k e f f , i = α k 0 + 1 α k 0 A β sign y ˙ × z + γ z n
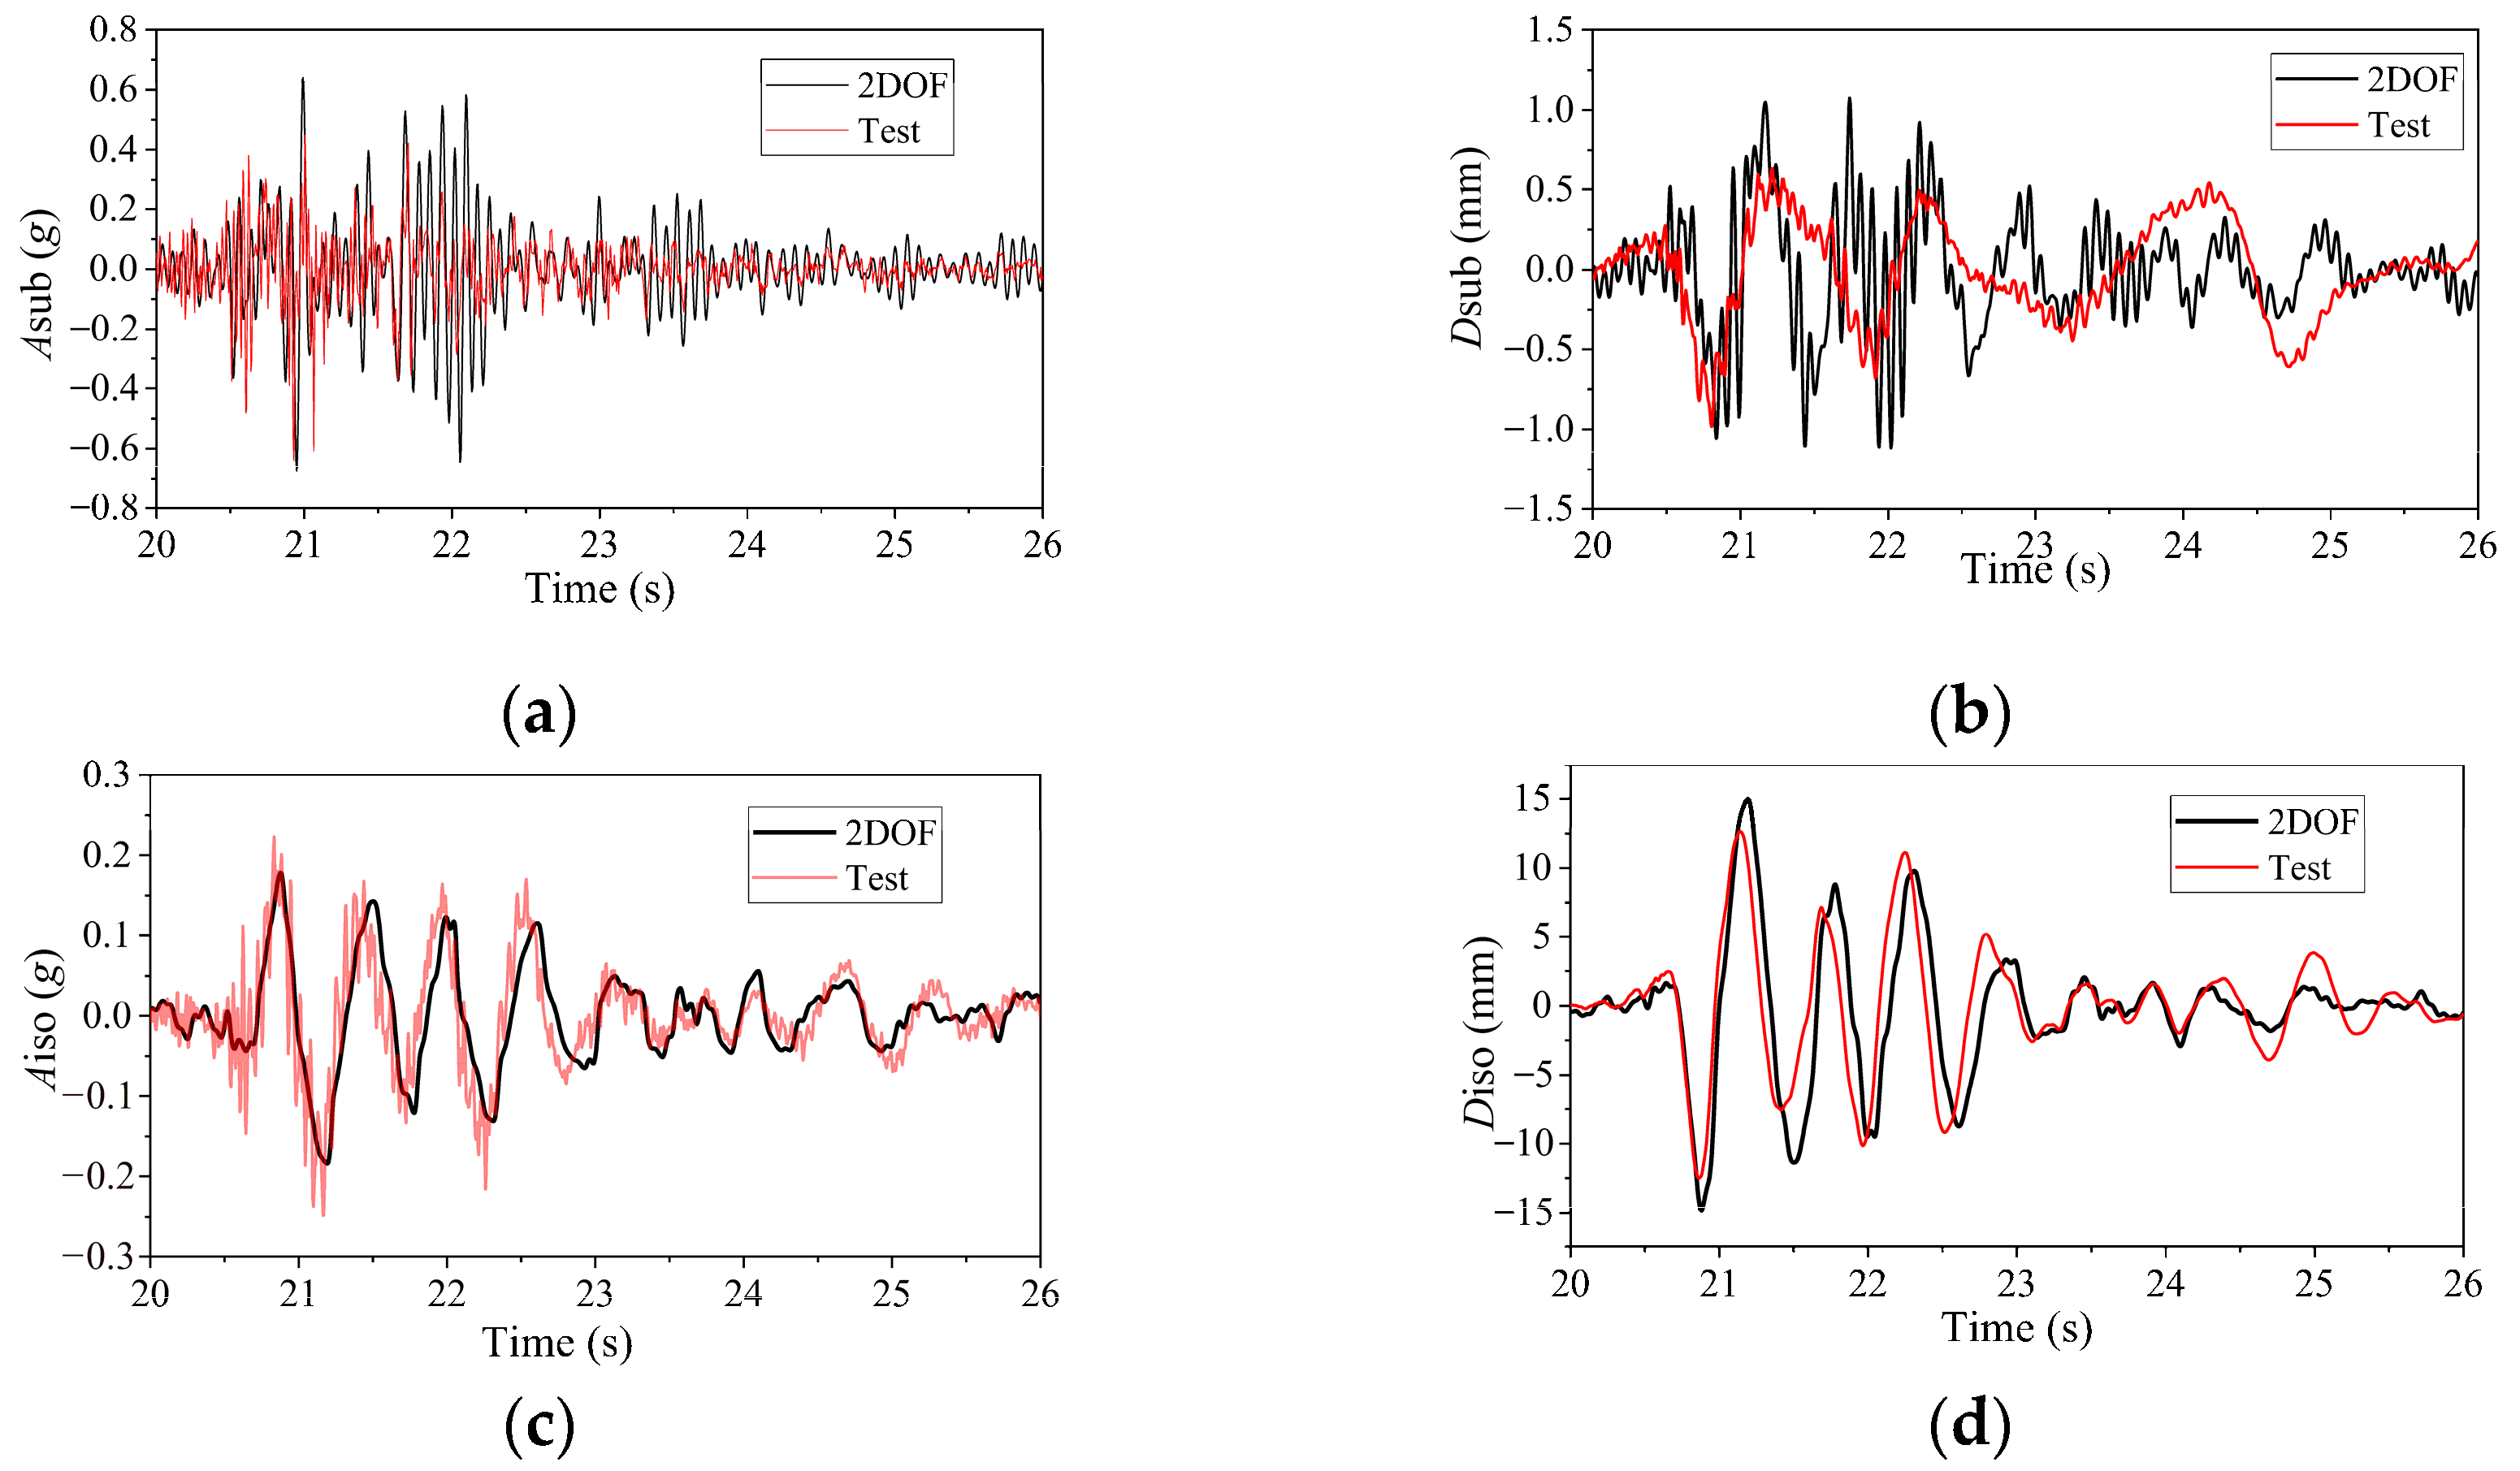
The same ground motion records used in the shaking table tests were used as inputs for the equivalent 2DOF model. The acceleration and displacement responses of both the second story and the isolation layer were computed and compared with the experimental results, as shown in Figure 12. It is observed that the response time histories obtained from the equivalent 2DOF model were in good agreement with the test results. The relative errors for the lower structure were 6.85% in acceleration amplitude and 15.38% in displacement amplitude, while those for the isolation layer were 18.46% and −25.96%, respectively. Overall, the experimental responses were reasonably well reproduced by the equivalent 2DOF model, particularly for the lower structure. Therefore, the equivalent 2DOF model can be regarded as a reliable model for conducting sensitivity analyses of the restoring force model parameters for the bearings.
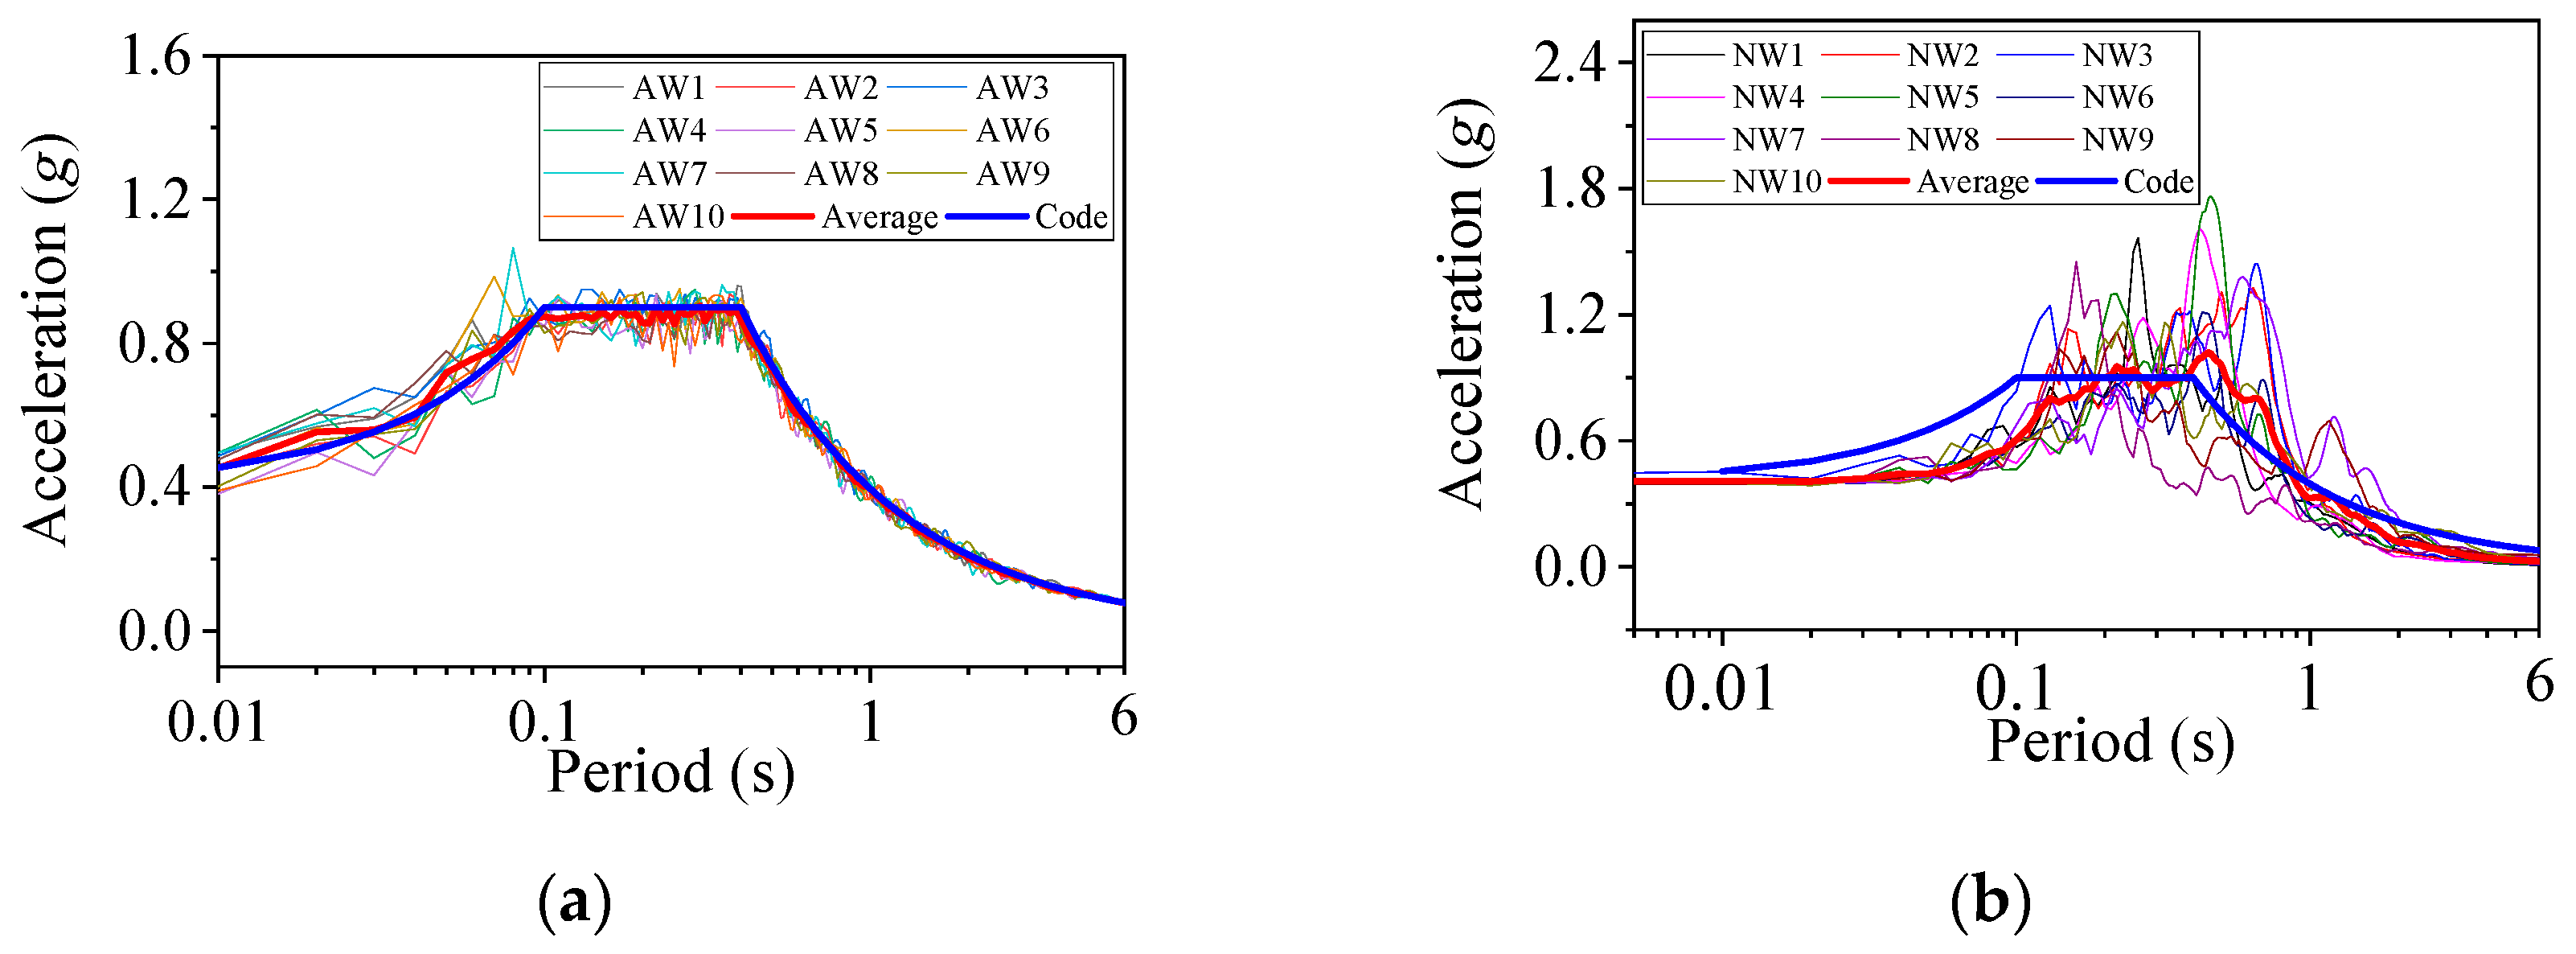
Ten recorded natural ground motions were selected, and ten artificial ground motions were synthesized based on the code-specified response spectrum. Detailed information on the natural earthquake records is provided in Table 7. The acceleration response spectra of these records are shown in Figure 13. These ground motions were applied to the equivalent 2DOF model, in which the pre-yield stiffness of the isolation layer k0 and the yield force Fy were considered as variables. The displacement and absolute acceleration responses of each mass were computed, and the effects of k0 and Fy on the structural seismic responses were analyzed.
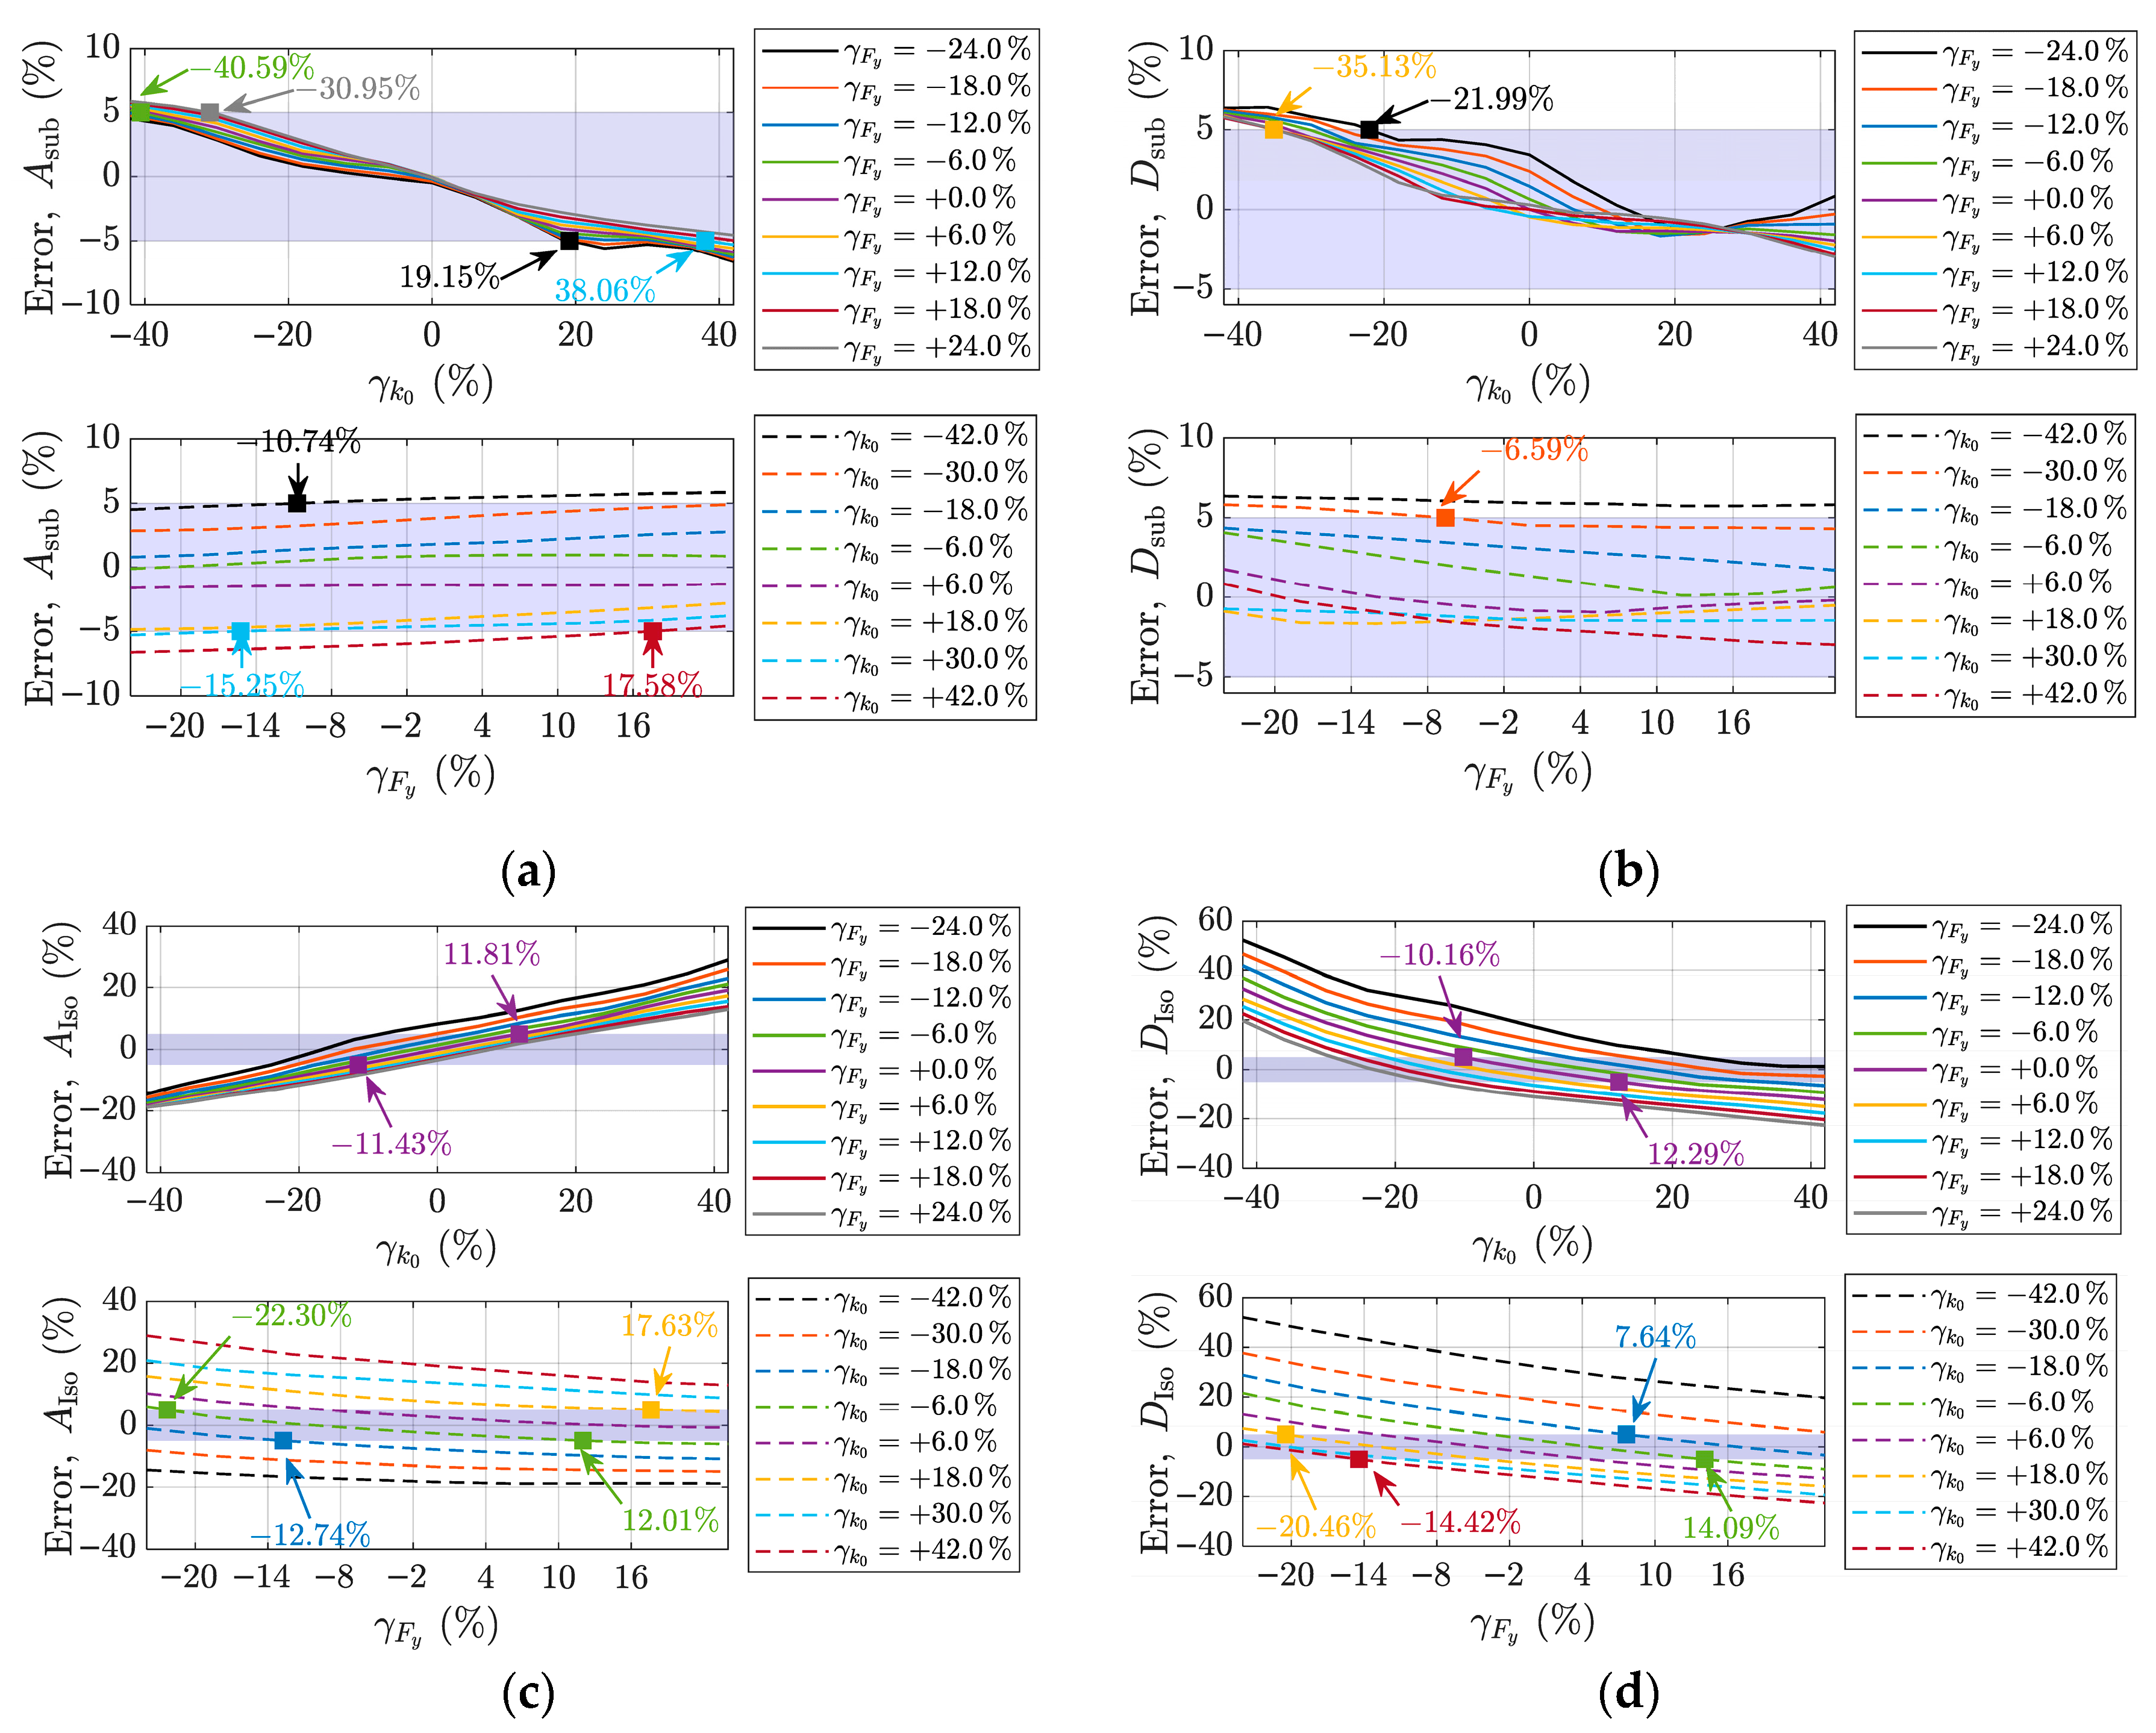
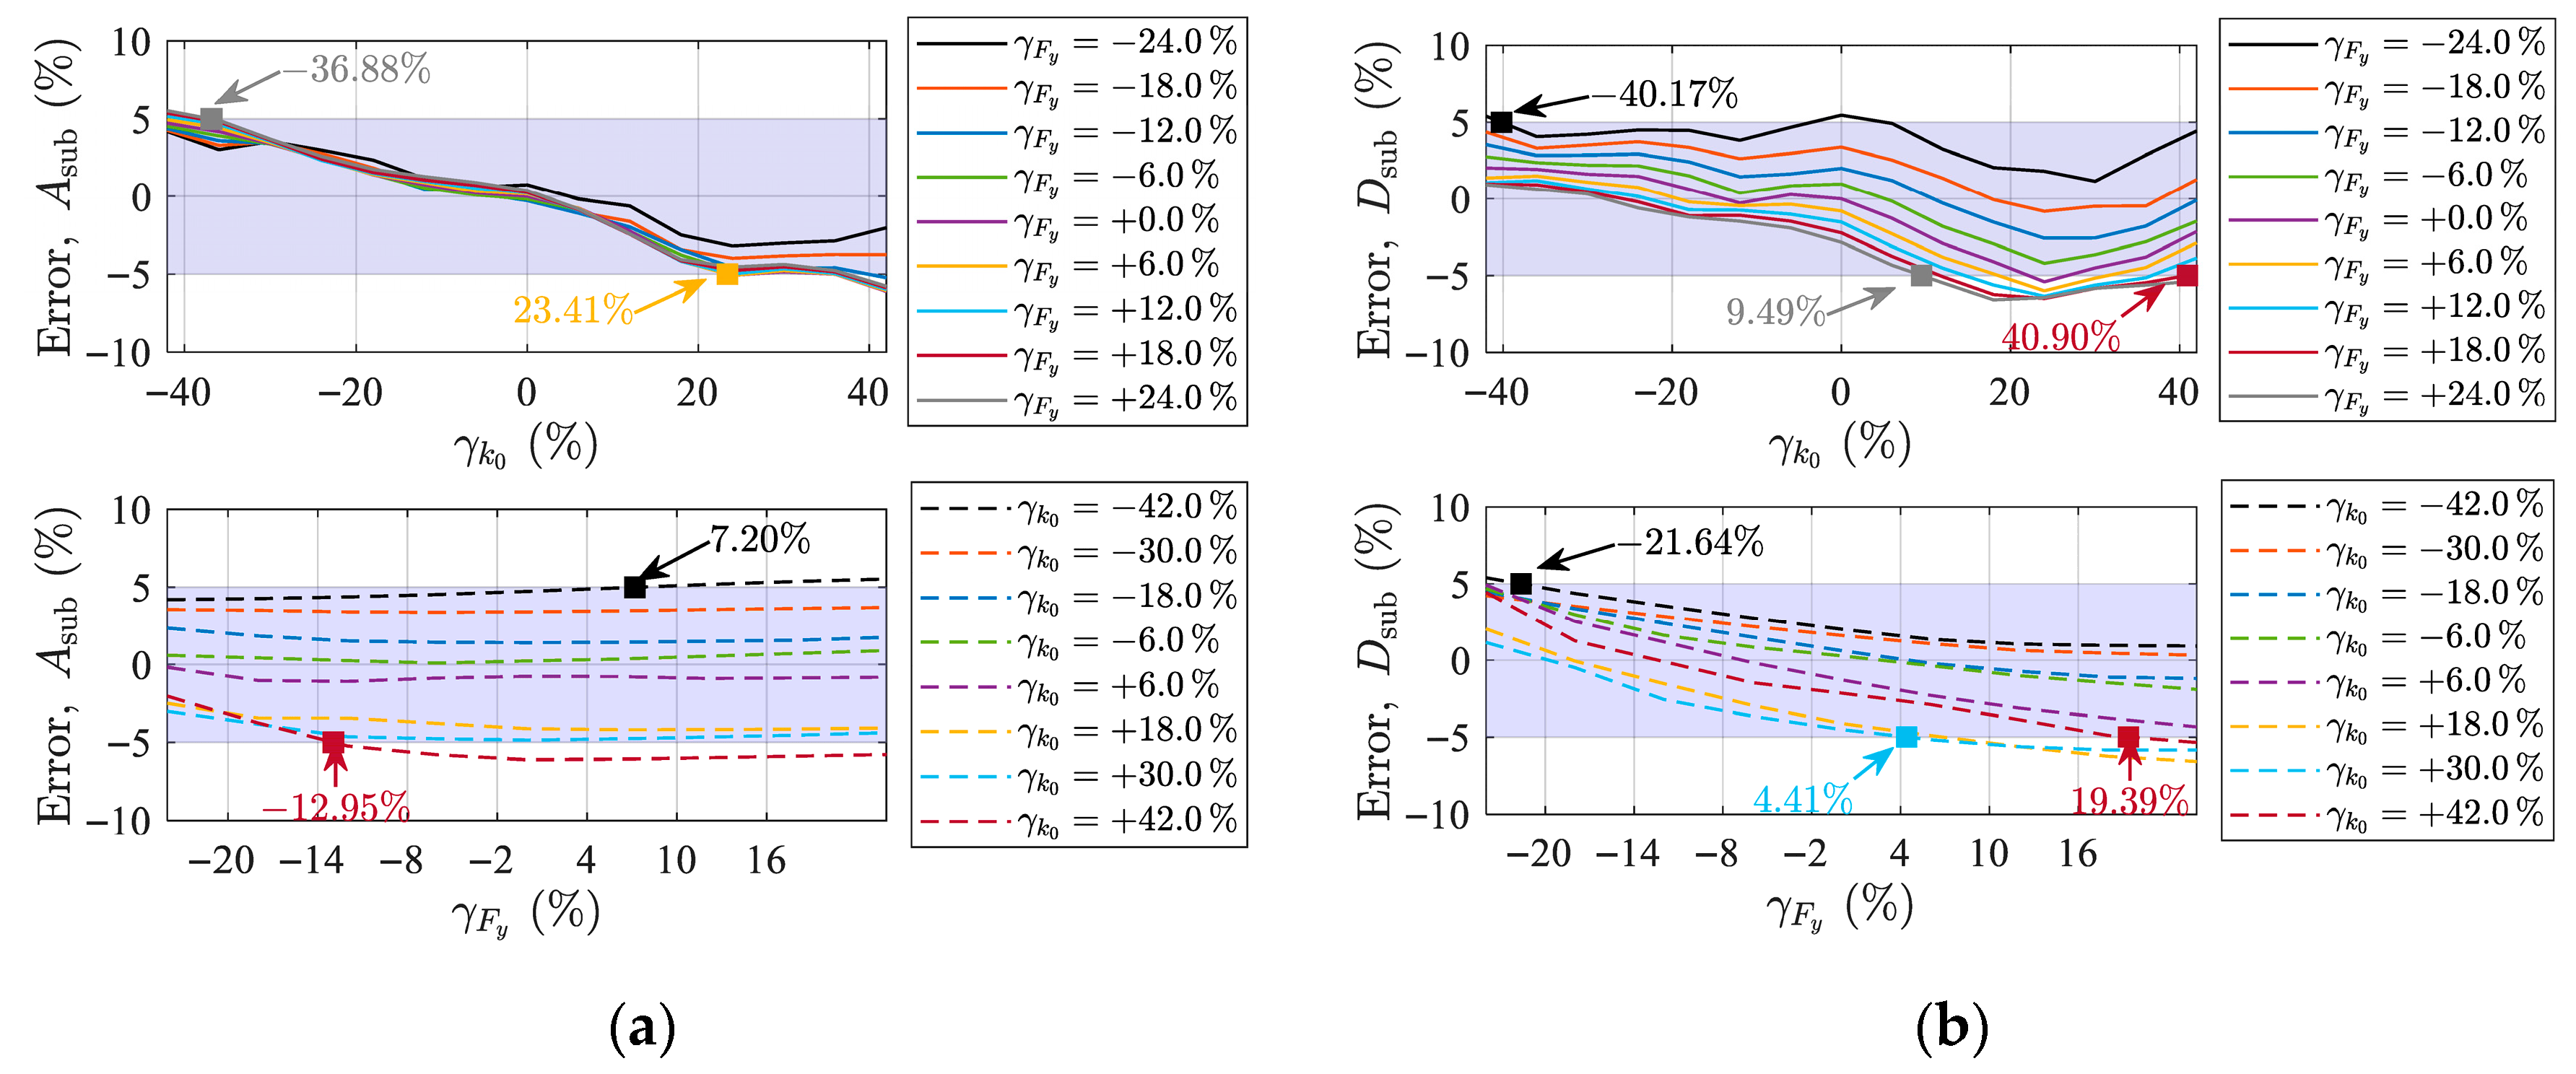
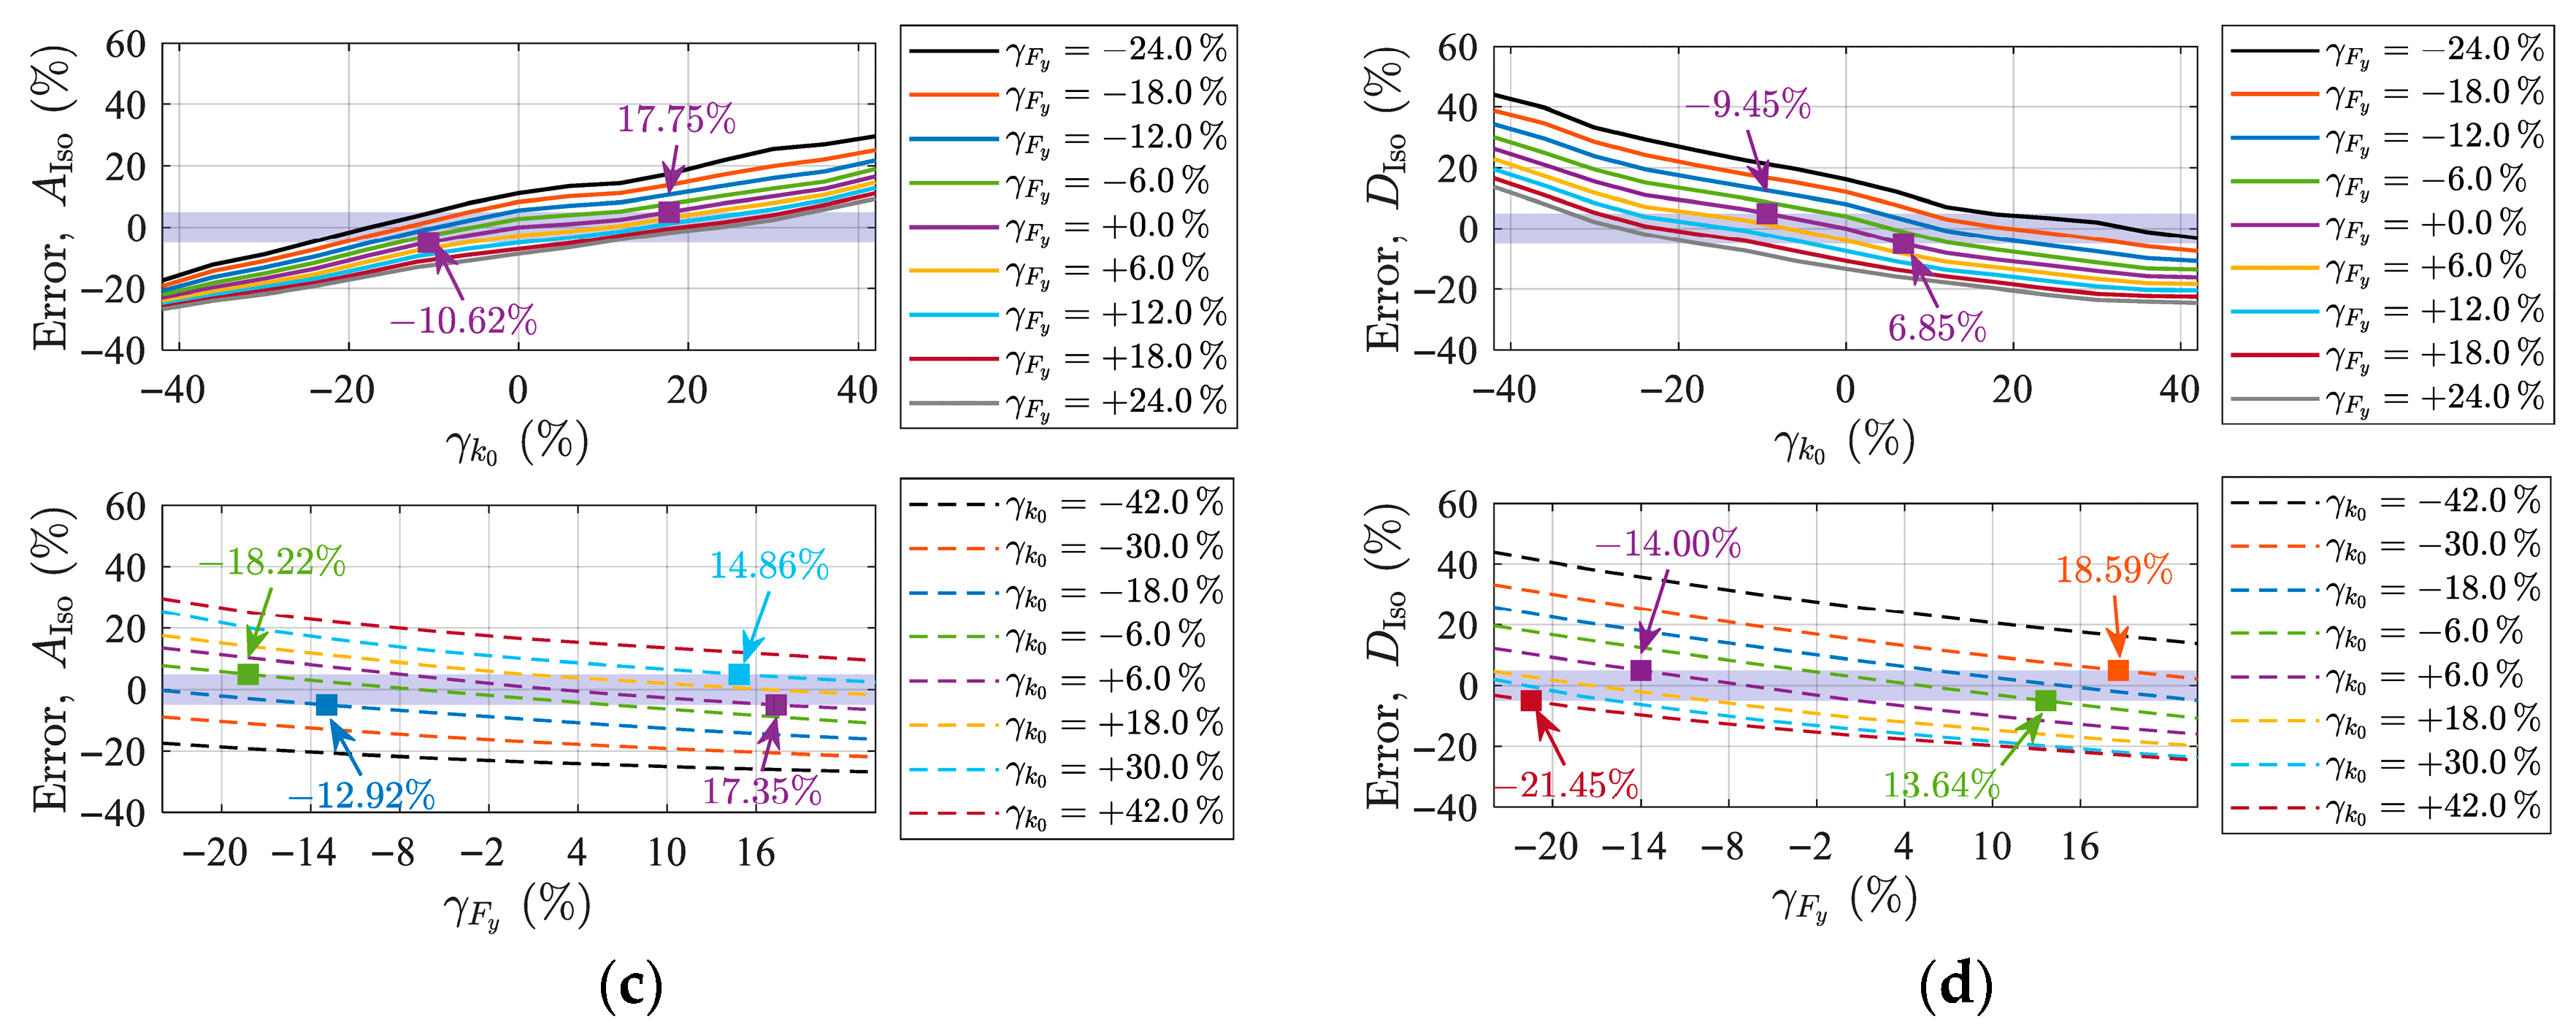
Under the excitation of artificial ground motions corresponding to rare earthquake (RE) and very rare earthquake (VRE) excitation, the seismic response results corresponding to different values of k0 and Fy are shown in Figure 14 and Figure 15, respectively.
Figure 14 shows that, under RE excitation, ASub exhibits an approximately linear decreasing trend with increasing γk0. When γk0 falls within the range of [−30.95%, 19.15%], the variation in ASub remains within the ±5% tolerance band. Except for the case of γk0 = ±42%, the variation in ASub across different Fy values is minimal. When γk0 lies between [−21.99%, 44.00%], the variation in DSub remains within ±5%.
For different γk0 values, both AIso and DIso were found to decrease with increasing γFy, indicating low sensitivity to variations in yield force. AIso increases significantly with increasing γk0. When γFy = 0, and γk0 lies between [−11.43%, 11.81%], the response variation remains within the ±5% tolerance band. As γFy decreases, the width of this tolerance band narrows, indicating increased sensitivity of AIso to k0. Conversely, with increasing γFy, the tolerance band widens, and sensitivity decreases. DIso decreases significantly with increasing k0. When γFy = 0, and γk0 is in the range [−10.16%, 12.29%], the variation in DIso remains within ±5%, and the width of this range remains approximately constant. However, as γFy decreases, the intersection point between the structural response and the tolerance limit shifts toward larger γk0 values. When γk0 is set to 15% under RE excitation, the acceleration response variation rate and displacement response variation rate of the isolation layer are 6.24% and 5.97%, respectively.
From Figure 15, it is evident that, under VRE excitation, the ±5% tolerance band for ASub corresponds to a γk0 range of [−36.88%, 23.41%]. For DSub, the ±5% tolerance band corresponds to [−40.17%, 9.49%], showing a narrower range compared with the rare earthquake case. The ±5% tolerance band for AIso corresponds to a γk0 range of [−10.62%, 17.75%], and for DIso, it corresponds to [−9.45%, 6.85%]. The sensitivity ranking under extremely rare earthquake excitation remains consistent with that for rare earthquakes, i.e., DIso > AIso > ASub > DSub. When γk0 is set to 15% under VRE excitation, the acceleration response variation rate and displacement response variation rate of the isolation layer are 3.76% and 9.23%, respectively.
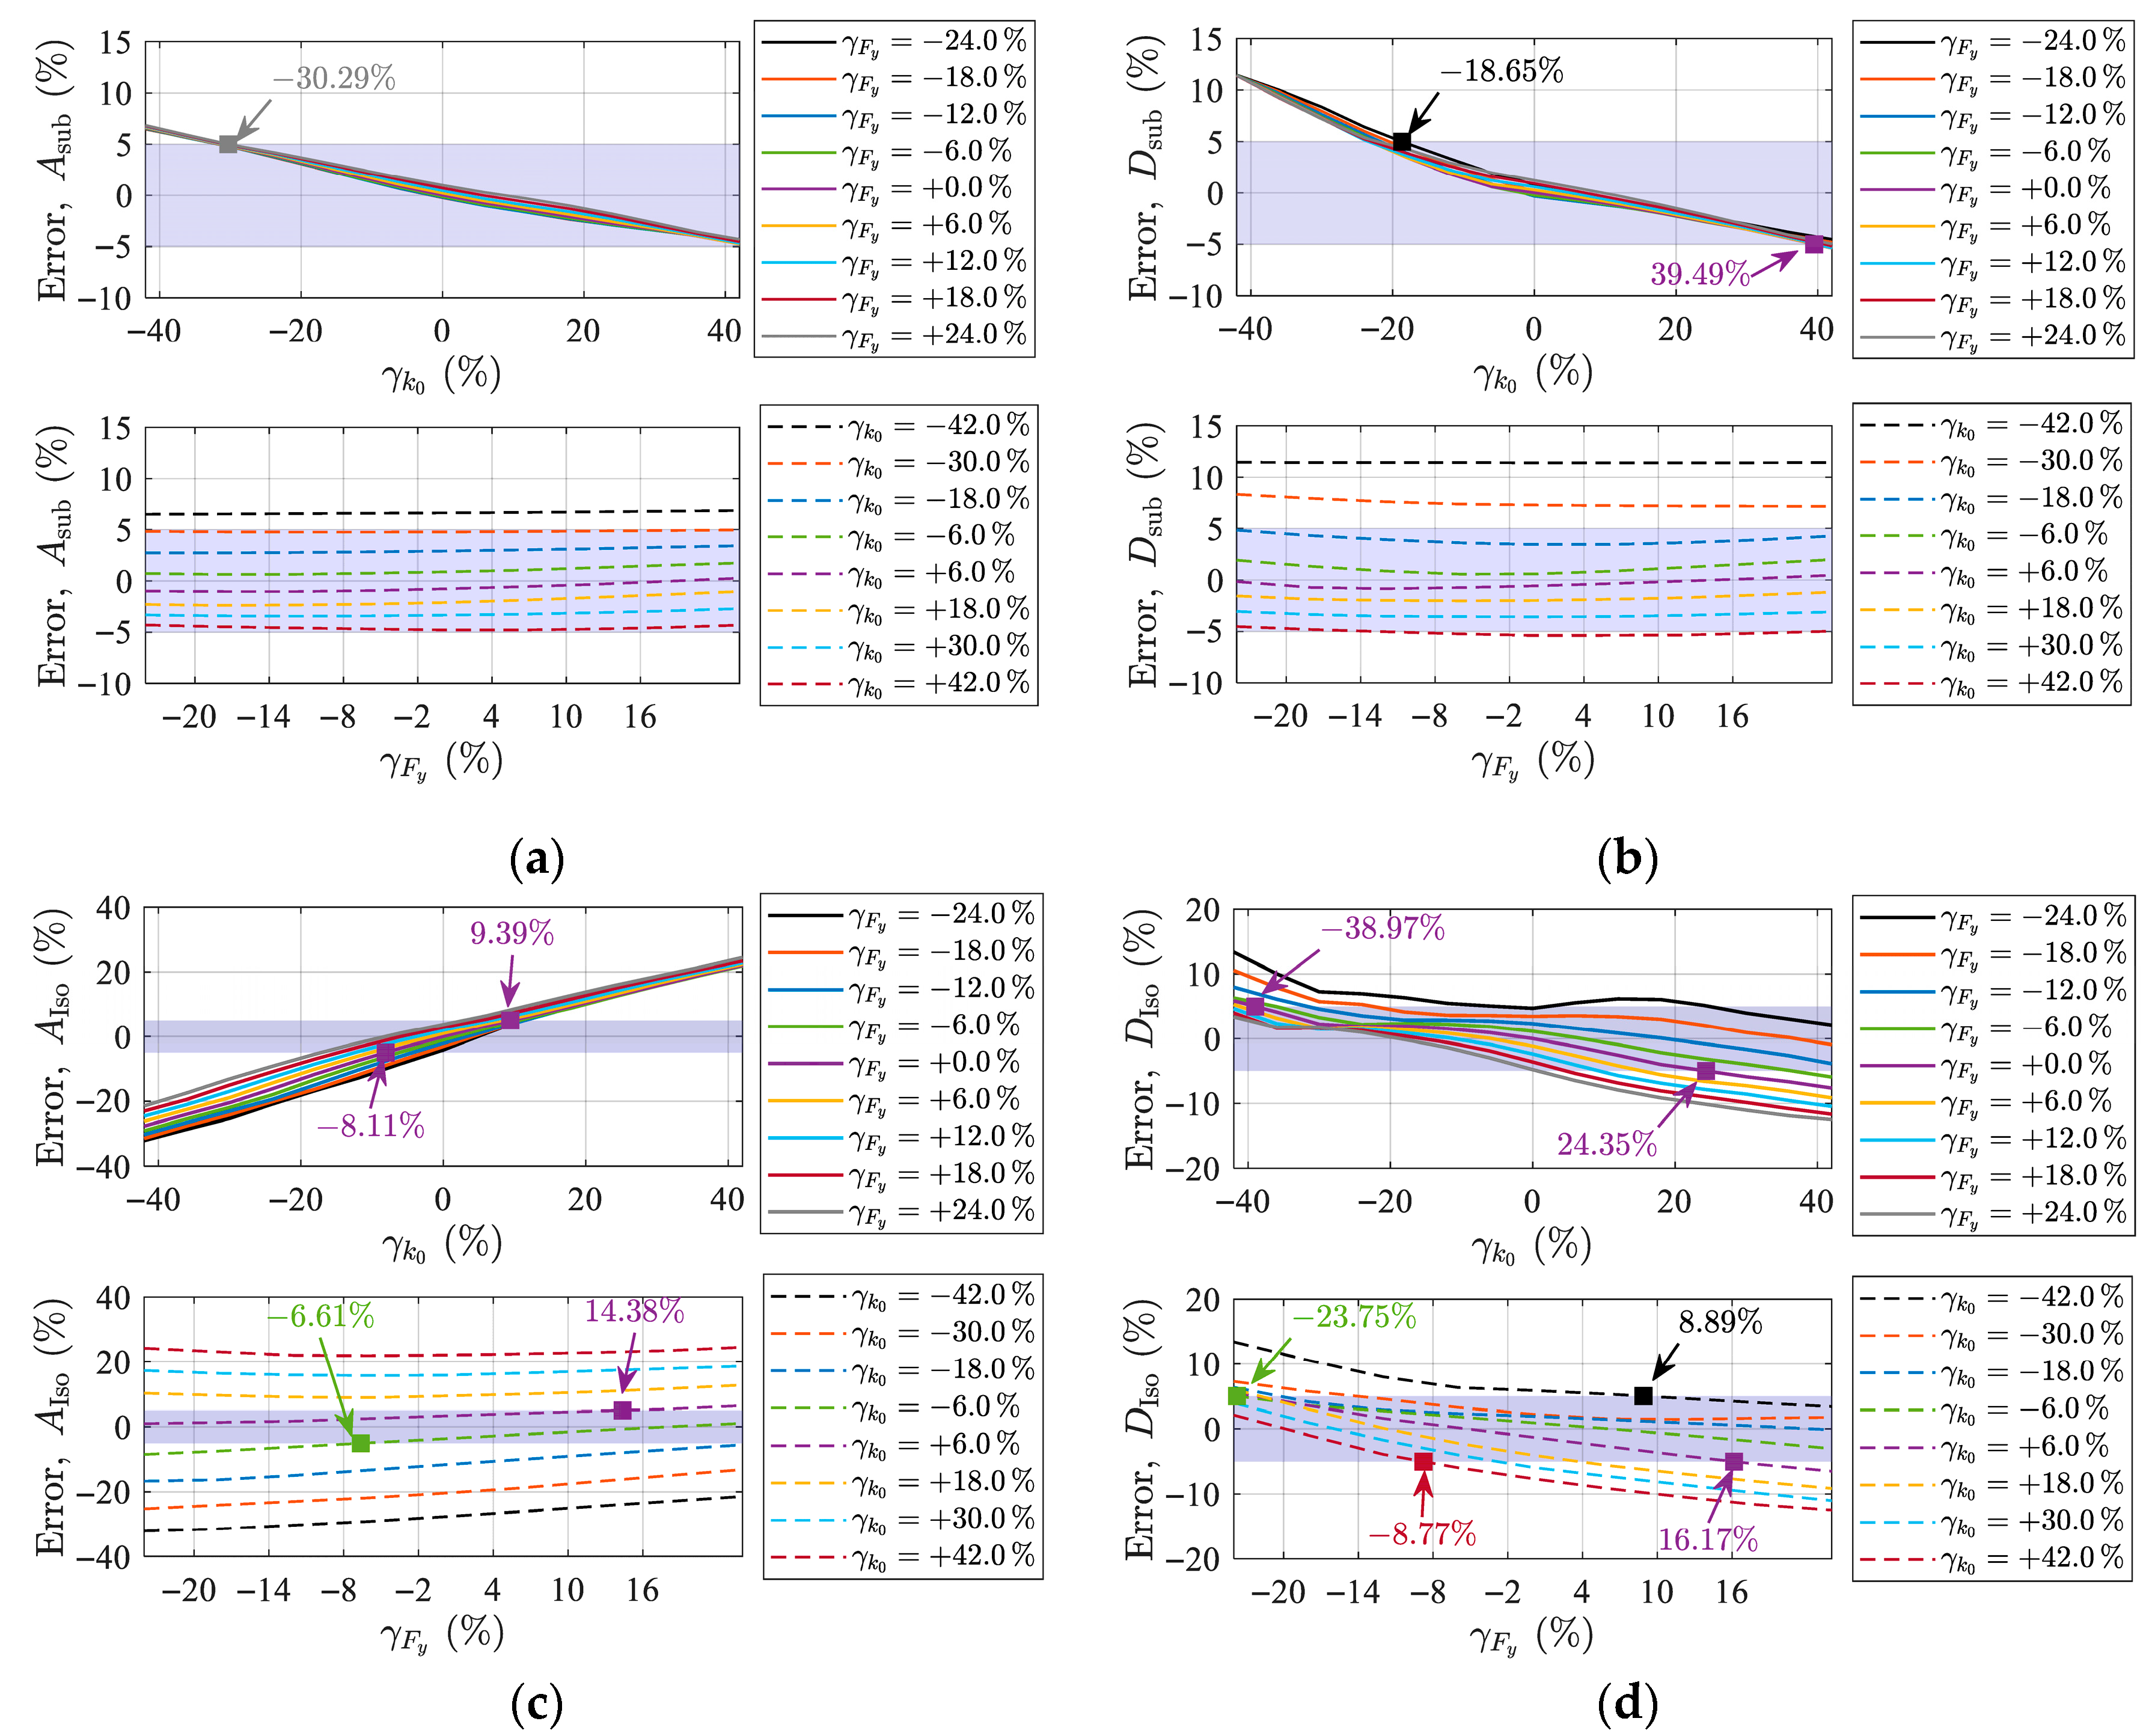
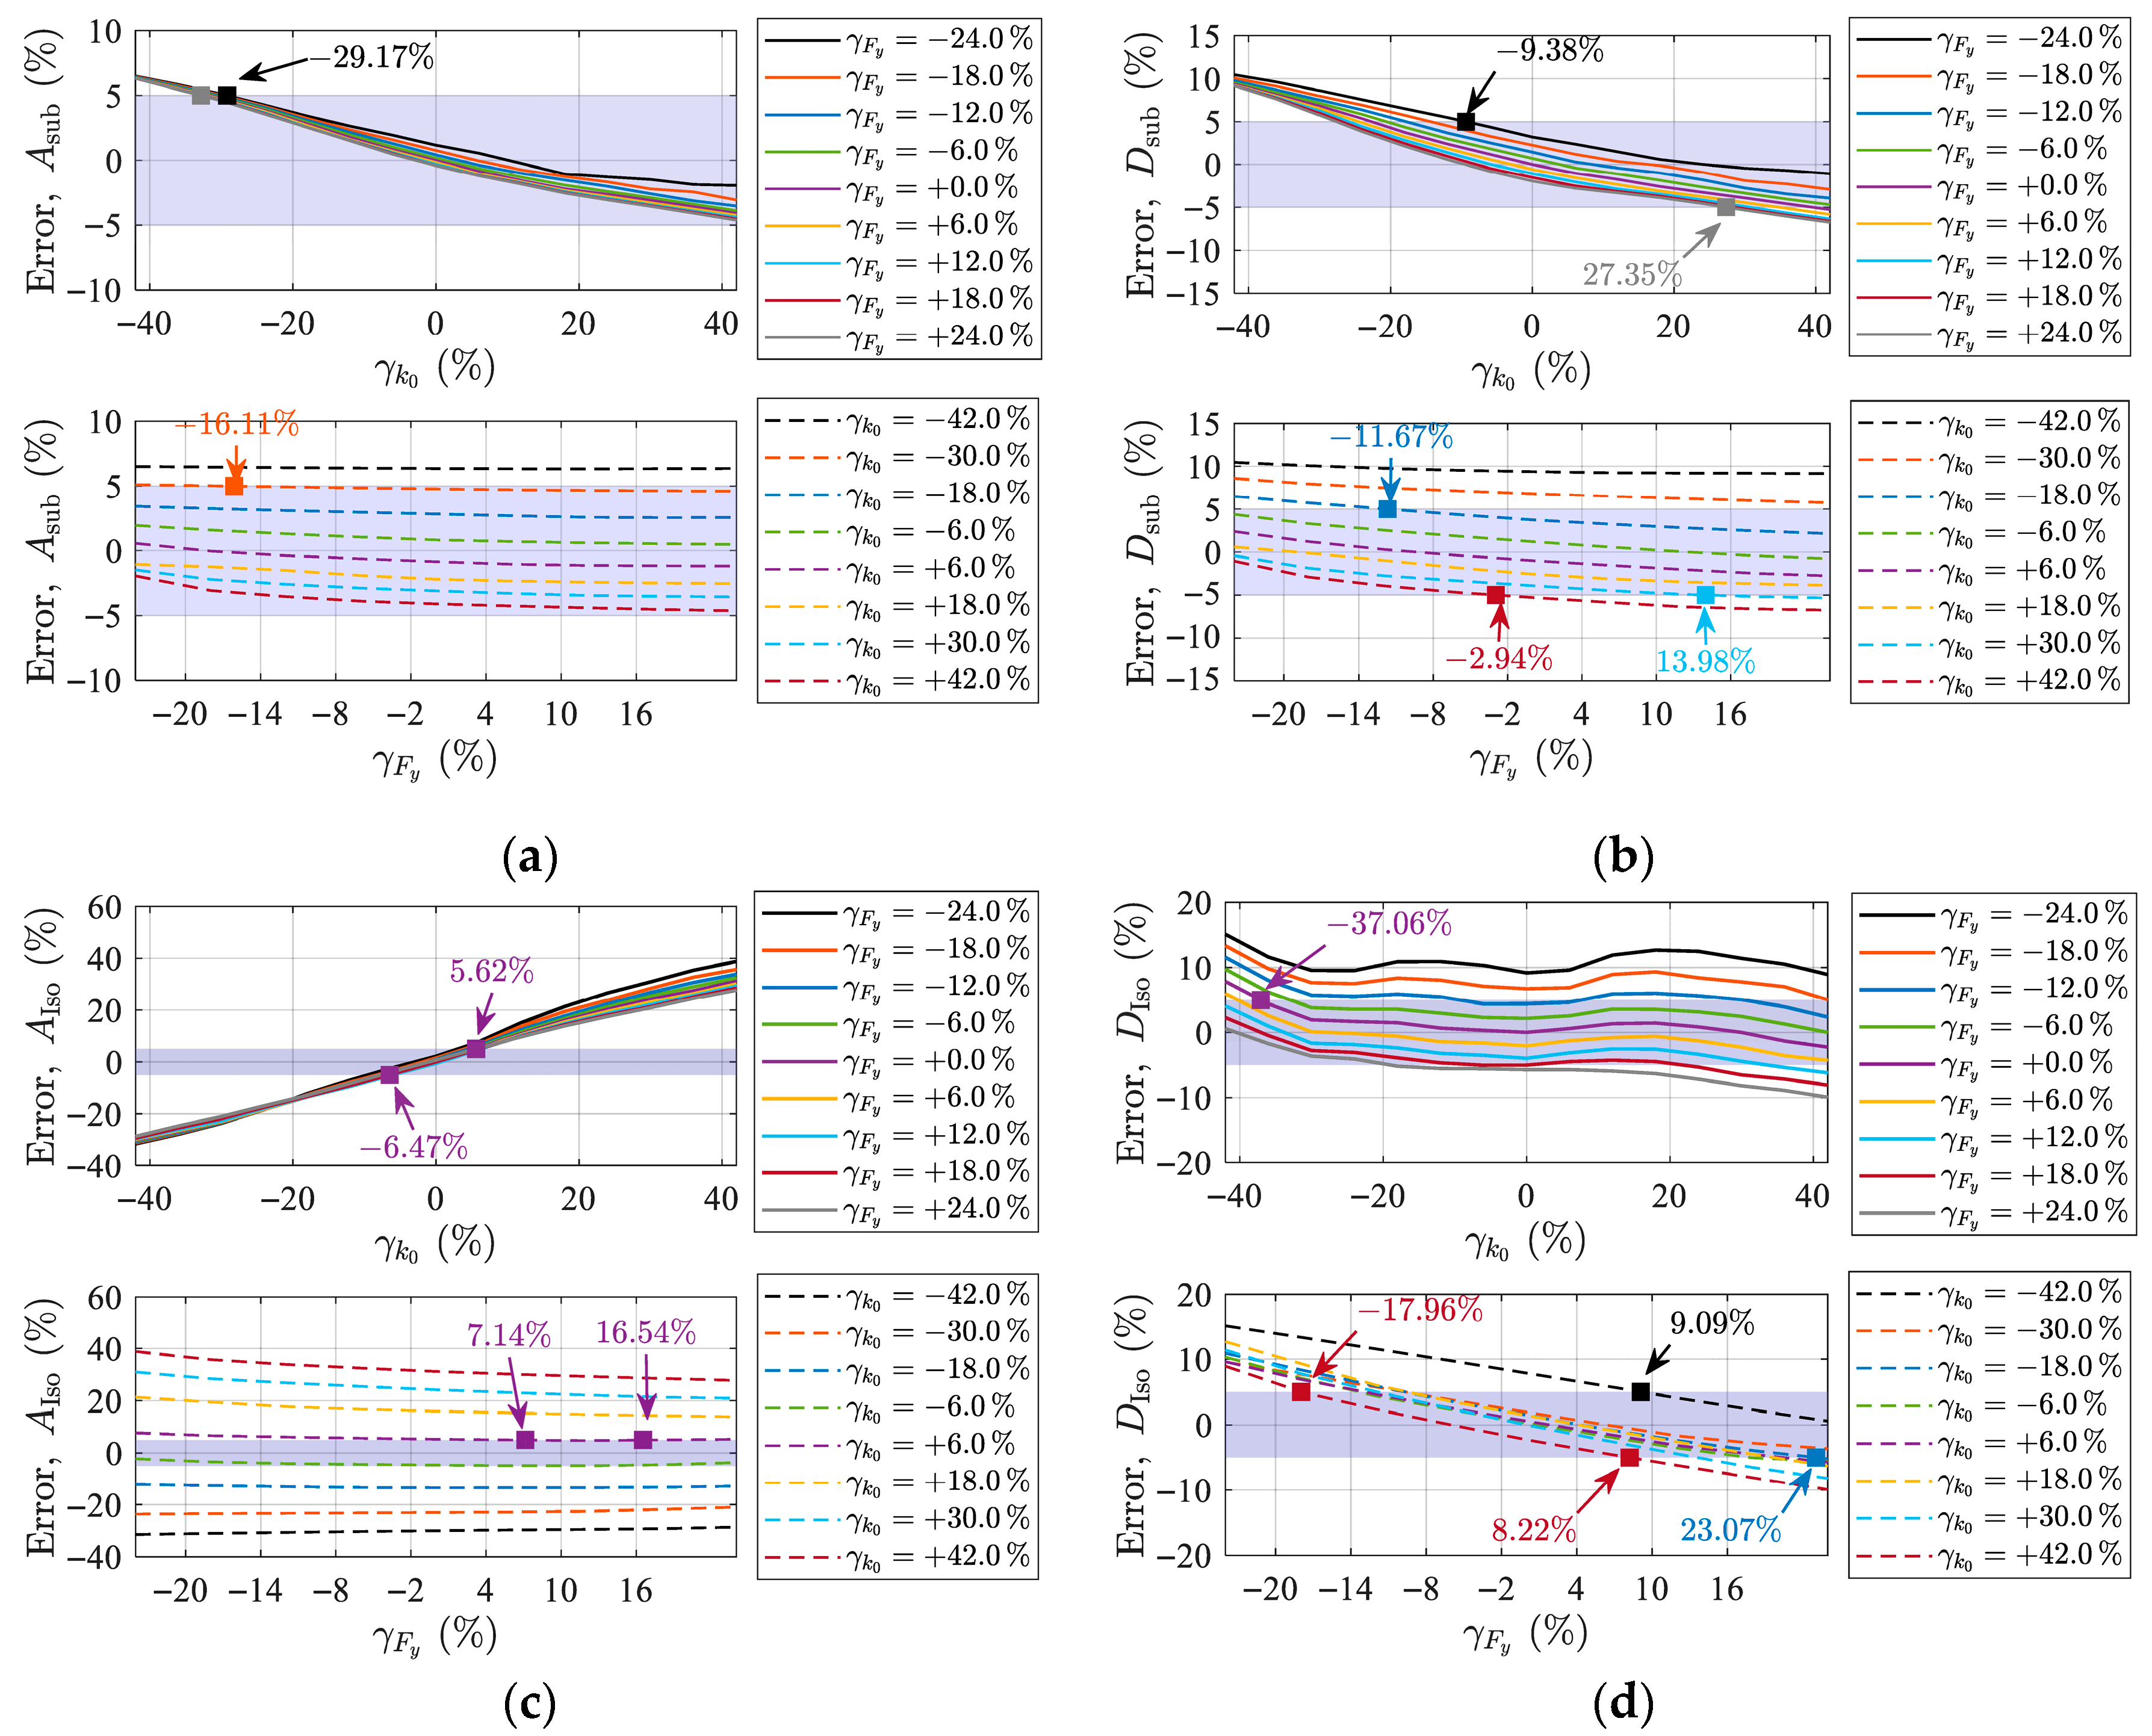
Under the excitation of natural ground motions, analyses were conducted for both RE and VRE inputs. The seismic response results of the 2DOF model, obtained under varying k0 and Fy values, are presented in Figure 16 and Figure 17.
As shown in Figure 16, under the excitation of rare earthquakes, ASub decreases approximately linearly with increasing γk0. The ±5% tolerance band for ASub corresponds to a γk0 range of [−30.95%, 42%]. The ±5% tolerance band for DSub corresponds to a γk0 range of [−18.65%, 39.49%]. Overall, the seismic response of the substructure exhibits low sensitivity to both γk0 and γFy.
Under different values of γk0, AIso remains unchanged with respect to γFy, indicating that AIso exhibits low sensitivity to γFy. The ±5% tolerance band for AIso corresponds to a γk0 range of [−8.11%, 9.39%]. The ±5% tolerance band for DSub corresponds to a γk0 range of [−38.97%, 24.35%].
As shown in Figure 17, under extremely rare earthquakes with natural ground motions, the ±5% tolerance band for ASub corresponds to a γk0 range of [−29.17%, 42%]. For DSub, the ±5% tolerance band corresponds to [−9.38%, 27.35%], with a reduced bandwidth compared with the rare earthquake case. The ±5% tolerance band for AIso corresponds to a γk0 range of [−6.47%, 5.62%], and for DIso, it corresponds to [−37.06%, 42%]. The sensitivity ranking under VRE excitation remains consistent with that for RE excitations, i.e., AIso> DSub > DIso >ASub. When the pre-yield stiffness of the bearing is amplified by a factor of 1.15 and γk0 is set to 15%, the displacement and acceleration responses of the substructure were only slightly affected, whereas the acceleration response of the isolation layer was found to be considerably more sensitive.

4.3. Structural Seismic Response Analysis Based on the Finite Element Model

4.3.1. Numerical Modeling

The earthquake engineering simulation platform OpenSees has been widely employed for the nonlinear analysis of structural systems [32,33,34]. To investigate the dynamic response characteristics of the entire structure under seismic loading, an elastic-plastic finite element (FE) model of the complete reinforced concrete structure was developed in OpenSees. Structural columns and beams, as part of the reinforced concrete frame system, were modeled with displacement-based beam-column elements, with cross-sections discretized into fiber sections. The concrete and reinforcing steel fibers were represented by the uniaxial material models Concrete01 and Steel02, respectively; for the core concrete, an improved Kent–Park constitutive model was adopted for the core concrete to simulate the confinement effects provided by stirrups. In the superstructure, reinforced concrete shear walls were modeled with ShellMITC4 elements, ensuring accurate representation of in-plane and out-of-plane coupled deformations. For the isolation layer, LRB devices were modeled with zero-length elements. In the horizontal direction, the nonlinear mechanical behavior of the bearings was represented by the Bouc–Wen hysteretic model, while the inherent damping of the bearings was represented by viscous damping materials. In the vertical direction, an elastic material model was adopted to reflect the axial stiffness characteristics of the bearings. The parameters of the Bouc–Wen model were determined based on the identification results presented in Section 3.1. The vertical compressive and tensile stiffness of the LRB100 bearings were set to 1.3 × 10³ kN/mm and 1.3 × 10² kN/mm, respectively.
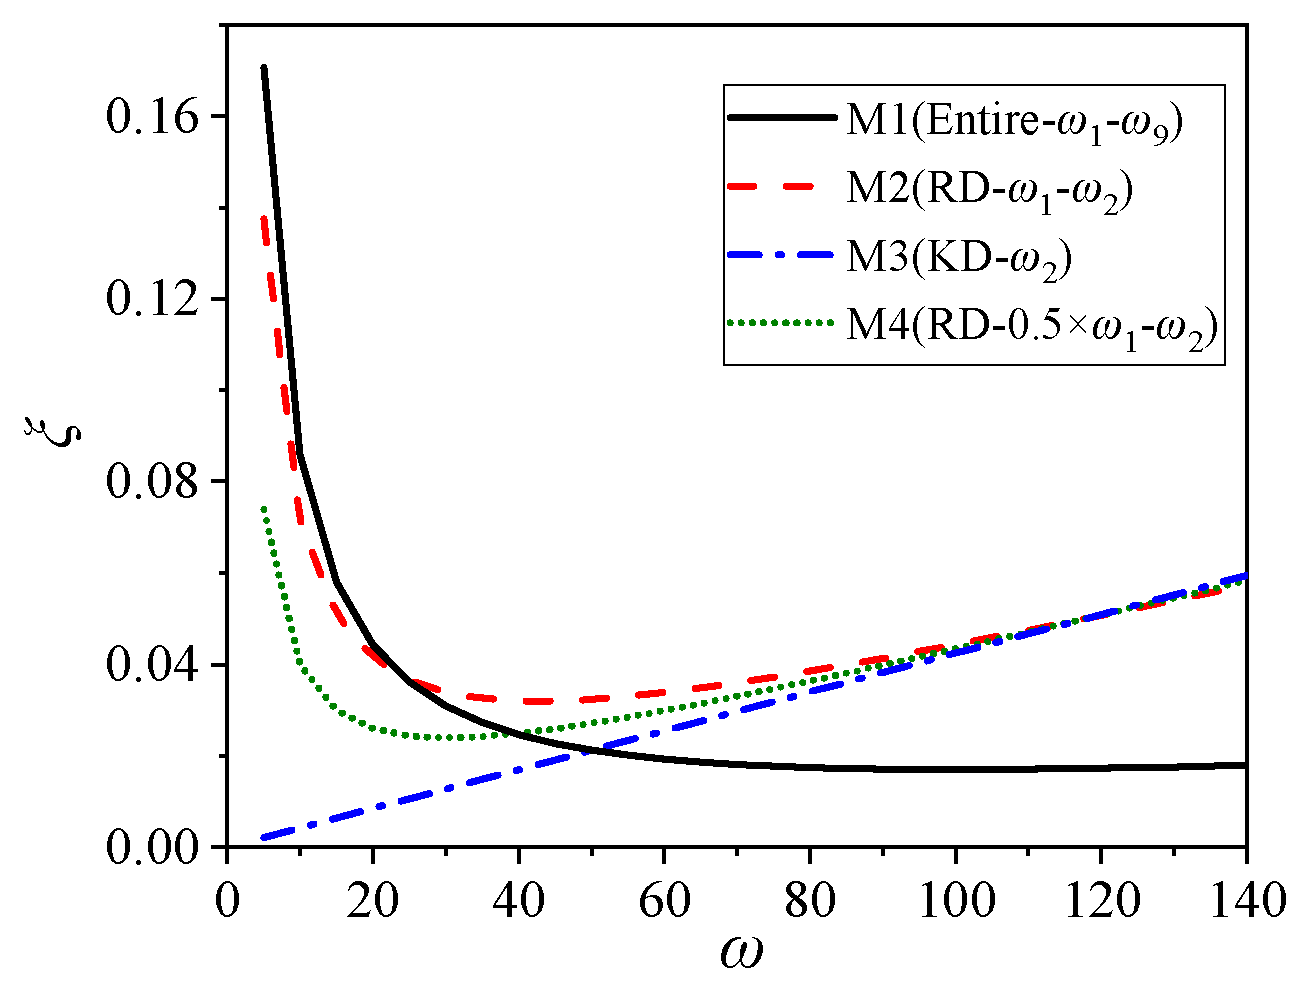
In the finite element analysis of the entire structure, the construction of the damping matrix plays a key role in ensuring computational accuracy and in simulating dynamic characteristics. This section presents and compares four damping modeling methods based on the damping characteristics of the upper shear wall structure and lower structure: (1) Global Rayleigh damping method: A Rayleigh damping matrix is applied to the entire structure, with damping coefficients determined from the first mode (with the large modal mass participation) and one higher mode, according to Equation (22). This method is simple but may lead to excessive damping in the isolation layer. (2) Partitioned Rayleigh damping: Separate Rayleigh damping matrices are applied to the upper and lower structures, with the same damping coefficients and mode selection as Method (1). Partitioning is implemented with the “Region” command in OpenSees, preventing improper amplification of local damping. (3) Partitioned stiffness proportional damping [35]: Stiffness proportional damping is applied to both the upper and lower structures, with coefficients calculated by Equation (23). The selected modes correspond to upper and lower structure deformation. Partitioning is implemented with the “Region” command in OpenSees. (4) Partitioned reduced frequency Rayleigh damping [36]: Rayleigh damping is applied to both structures, with coefficients determined from a combination of 0.5 times the first mode frequency and a higher mode frequency.
The modal damping ratio- frequency curves obtained from these methods are shown in Figure 18. As seen in Figure 18, Method (1) (M1) yields the highest modal damping ratio in the low-frequency range. As frequency increases, Method (2) (M2) exhibits the highest modal damping ratio, and converges to the results of Methods (3) (M3) and (4) (M4) at higher frequencies.
C RD S = α m M S + β k K S
α m β k = 2 ξ S ω 1 + ω 2 ω 1 ω 2 1
C KD S = β k K S ,   β k = 2 ξ S ω
Building on the four aforementioned damping modeling methods mentioned above, the stiffness amplification effect of the isolation layer under dynamic excitation was further incorporated. Based on the experimental results and parameter identification, it was found that the pre-yield stiffness of the isolation layer was approximately 1.15 times that obtained from quasi-static tests. Accordingly, two finite element models were developed for each damping modeling strategy: one with the unamplified pre-yield stiffness and one with the amplified pre-yield stiffness. In total, eight simulation models were constructed.

4.3.2. Seismic Response Analysis

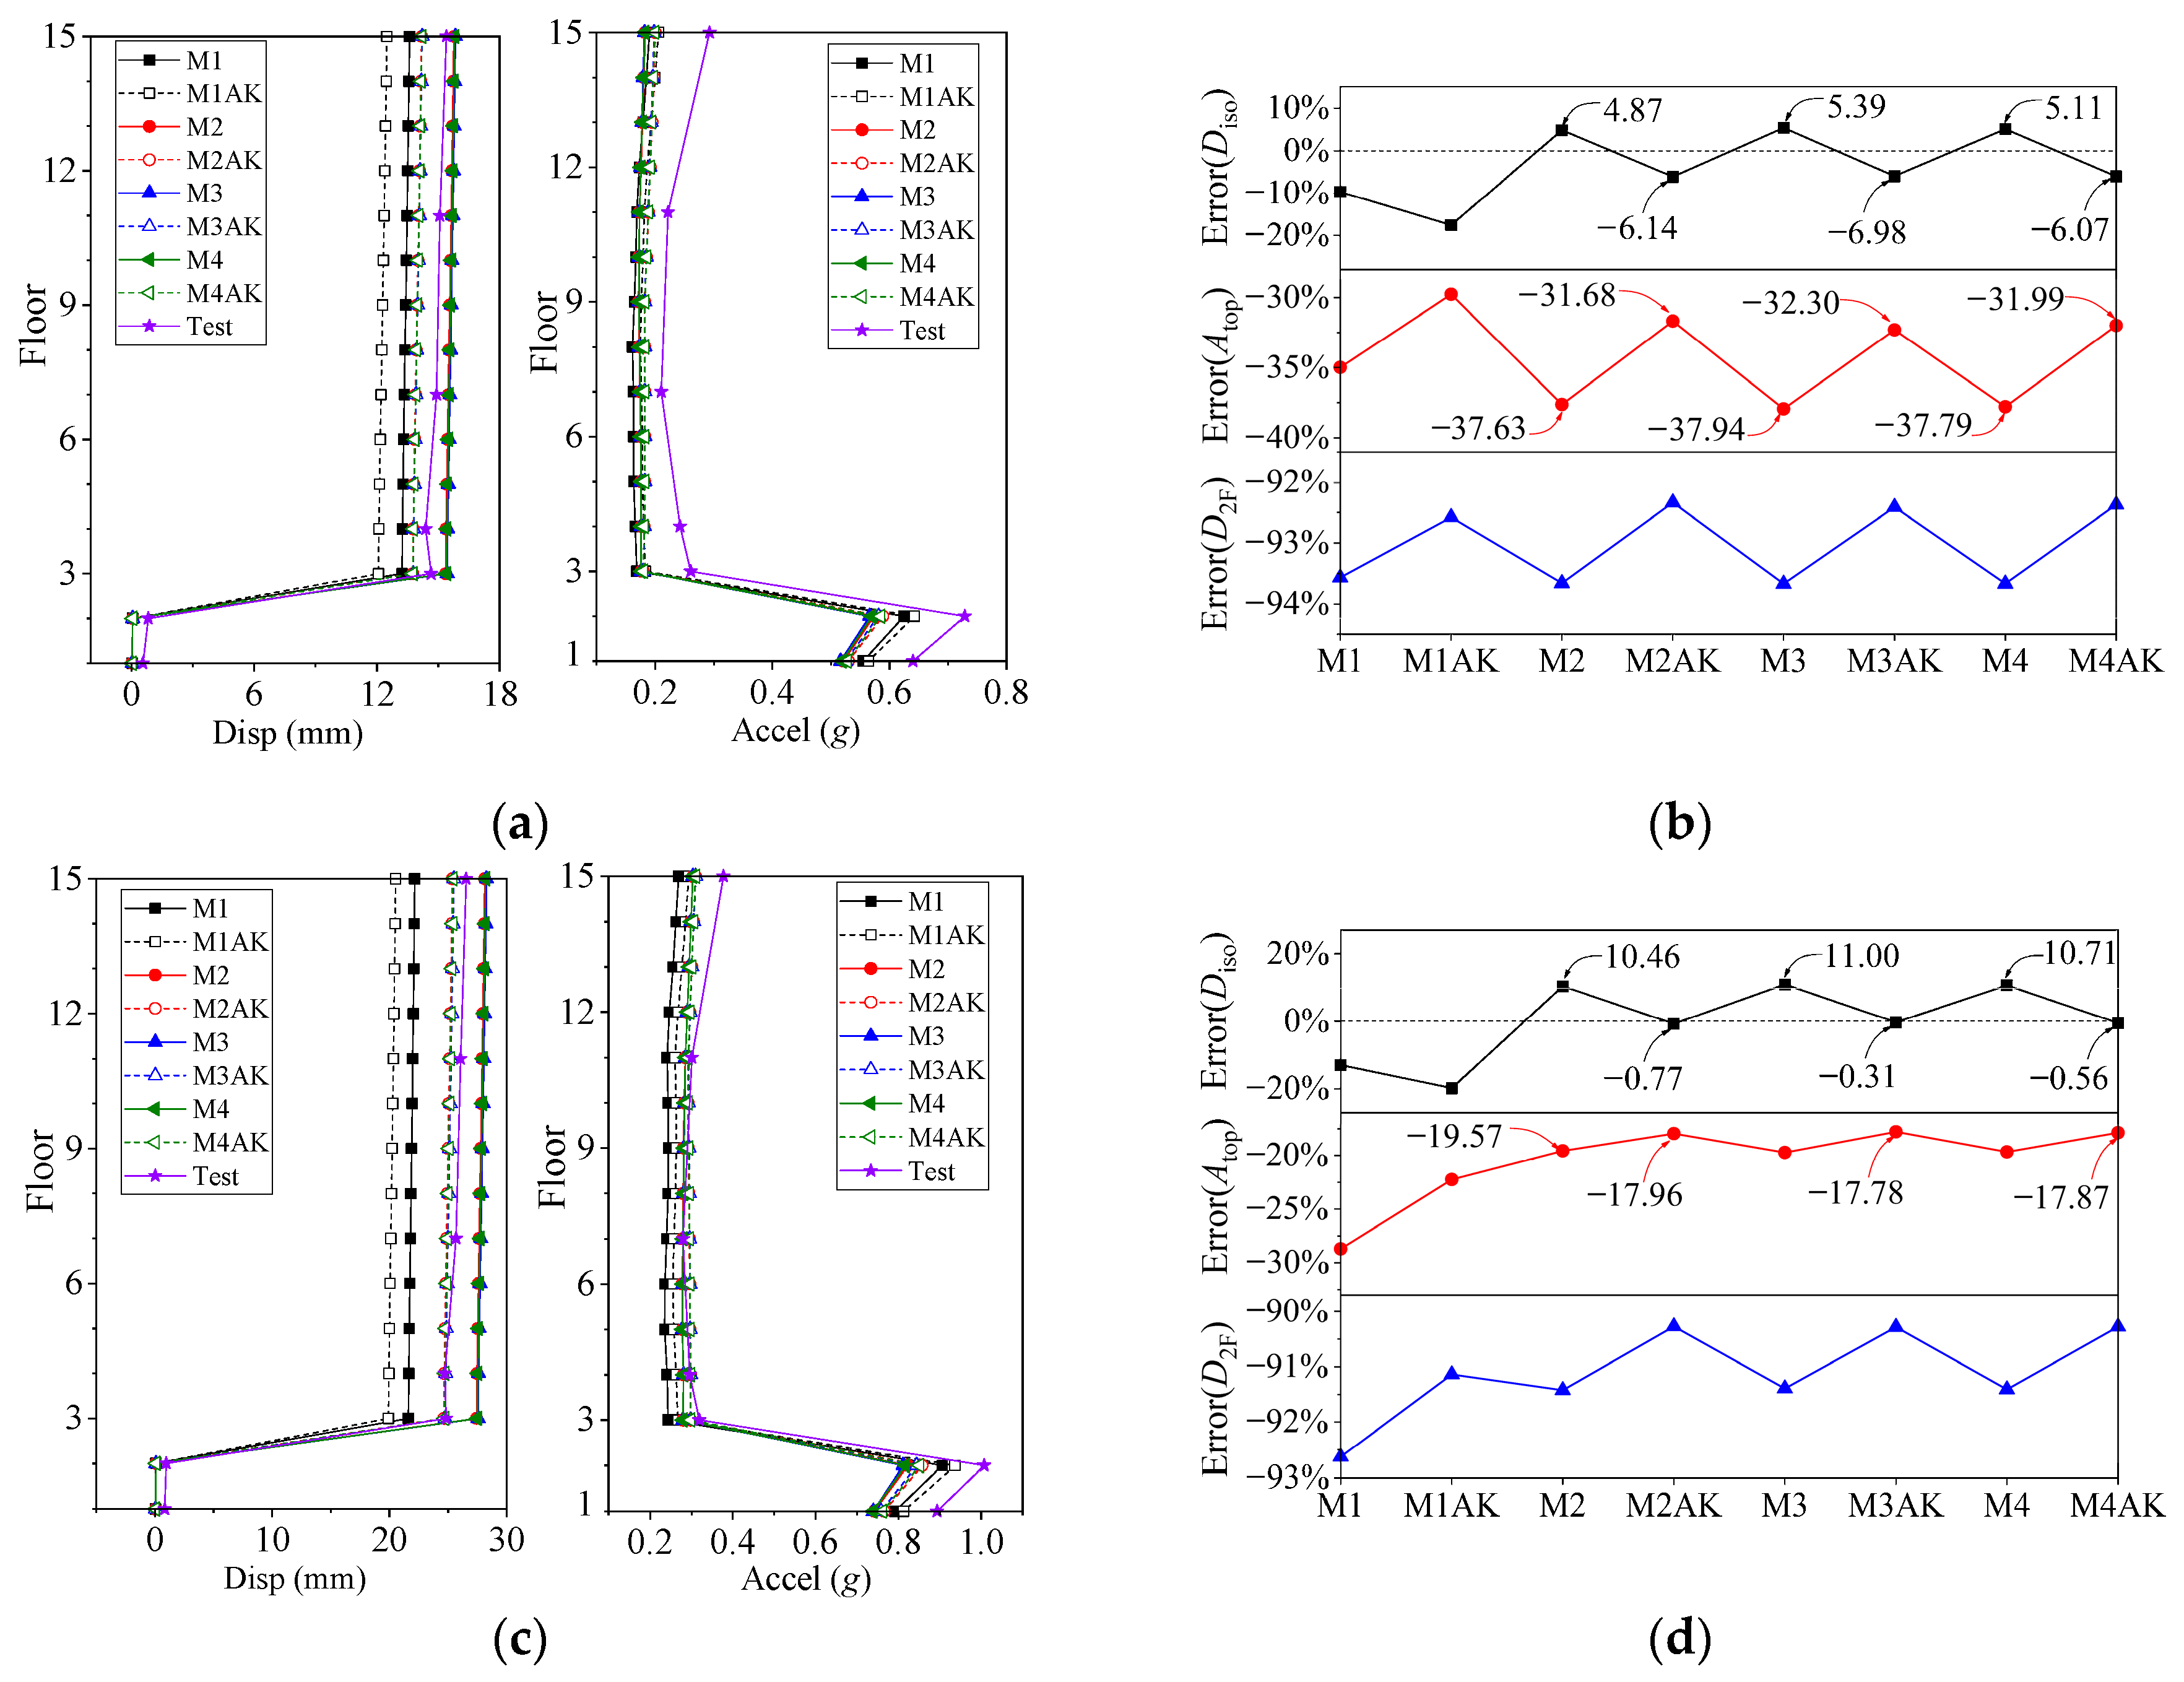
In the finite element analysis, the measured shaking table data were used as input ground motions. The dynamic responses of the eight models were calculated under the rare earthquake (8-degree) and extremely rare earthquake excitations. The resulting distribution of peak floor accelerations and displacements along the building height are shown in Figure 19. In Figure 19, M1 and M1AK represent the models using Method (1) with and without amplified pre-yield stiffness, respectively, while the remaining model numbers follow the same pattern.
As shown in Figure 19, the displacement and absolute acceleration responses of the upper structure are minimized when the damping matrix is constructed using M1. The global Rayleigh damping matrix increases the damping ratio of the low-frequency modes, resulting in an underestimation of the structural response. In contrast, under both RE and VRE excitations, the seismic responses obtained from M2–M4 are consistent, indicating that, when the damping is specified separately for the upper and lower structures through the “Region” command, the specific type of damping model has minimal impact on the overall seismic response.
Furthermore, a comparison of the relative errors between M1–M4 and M1AK–M4AK shows that the deviation between the simulated and experimental displacement responses of the isolation layer is minimized when the pre-yield stiffness of the bearing identified via the genetic algorithm is adopted. Compared with the original pre-yield stiffness parameters, when the pre-yield stiffness is increased by 15%, the relative error between the simulation and shaking table test results is further reduced, thereby improving the accuracy of dynamic response simulations for the isolation system.
In addition, under rare earthquake excitation, the displacement variation of the isolation layer is smaller than that of the acceleration. Under extremely rare earthquake excitation, however, the displacement variation exceeds that of the acceleration. This observation is consistent with the conclusions drawn from Figure 14 and Figure 15, because the acceleration response spectra of the selected seismic waves deviate only slightly from the design spectrum at the fundamental period of the structure. Therefore, the relationship between the seismic response and the variation rate of the pre-yield stiffness of the isolation layer can be directly derived from the analyses based on artificial waves.
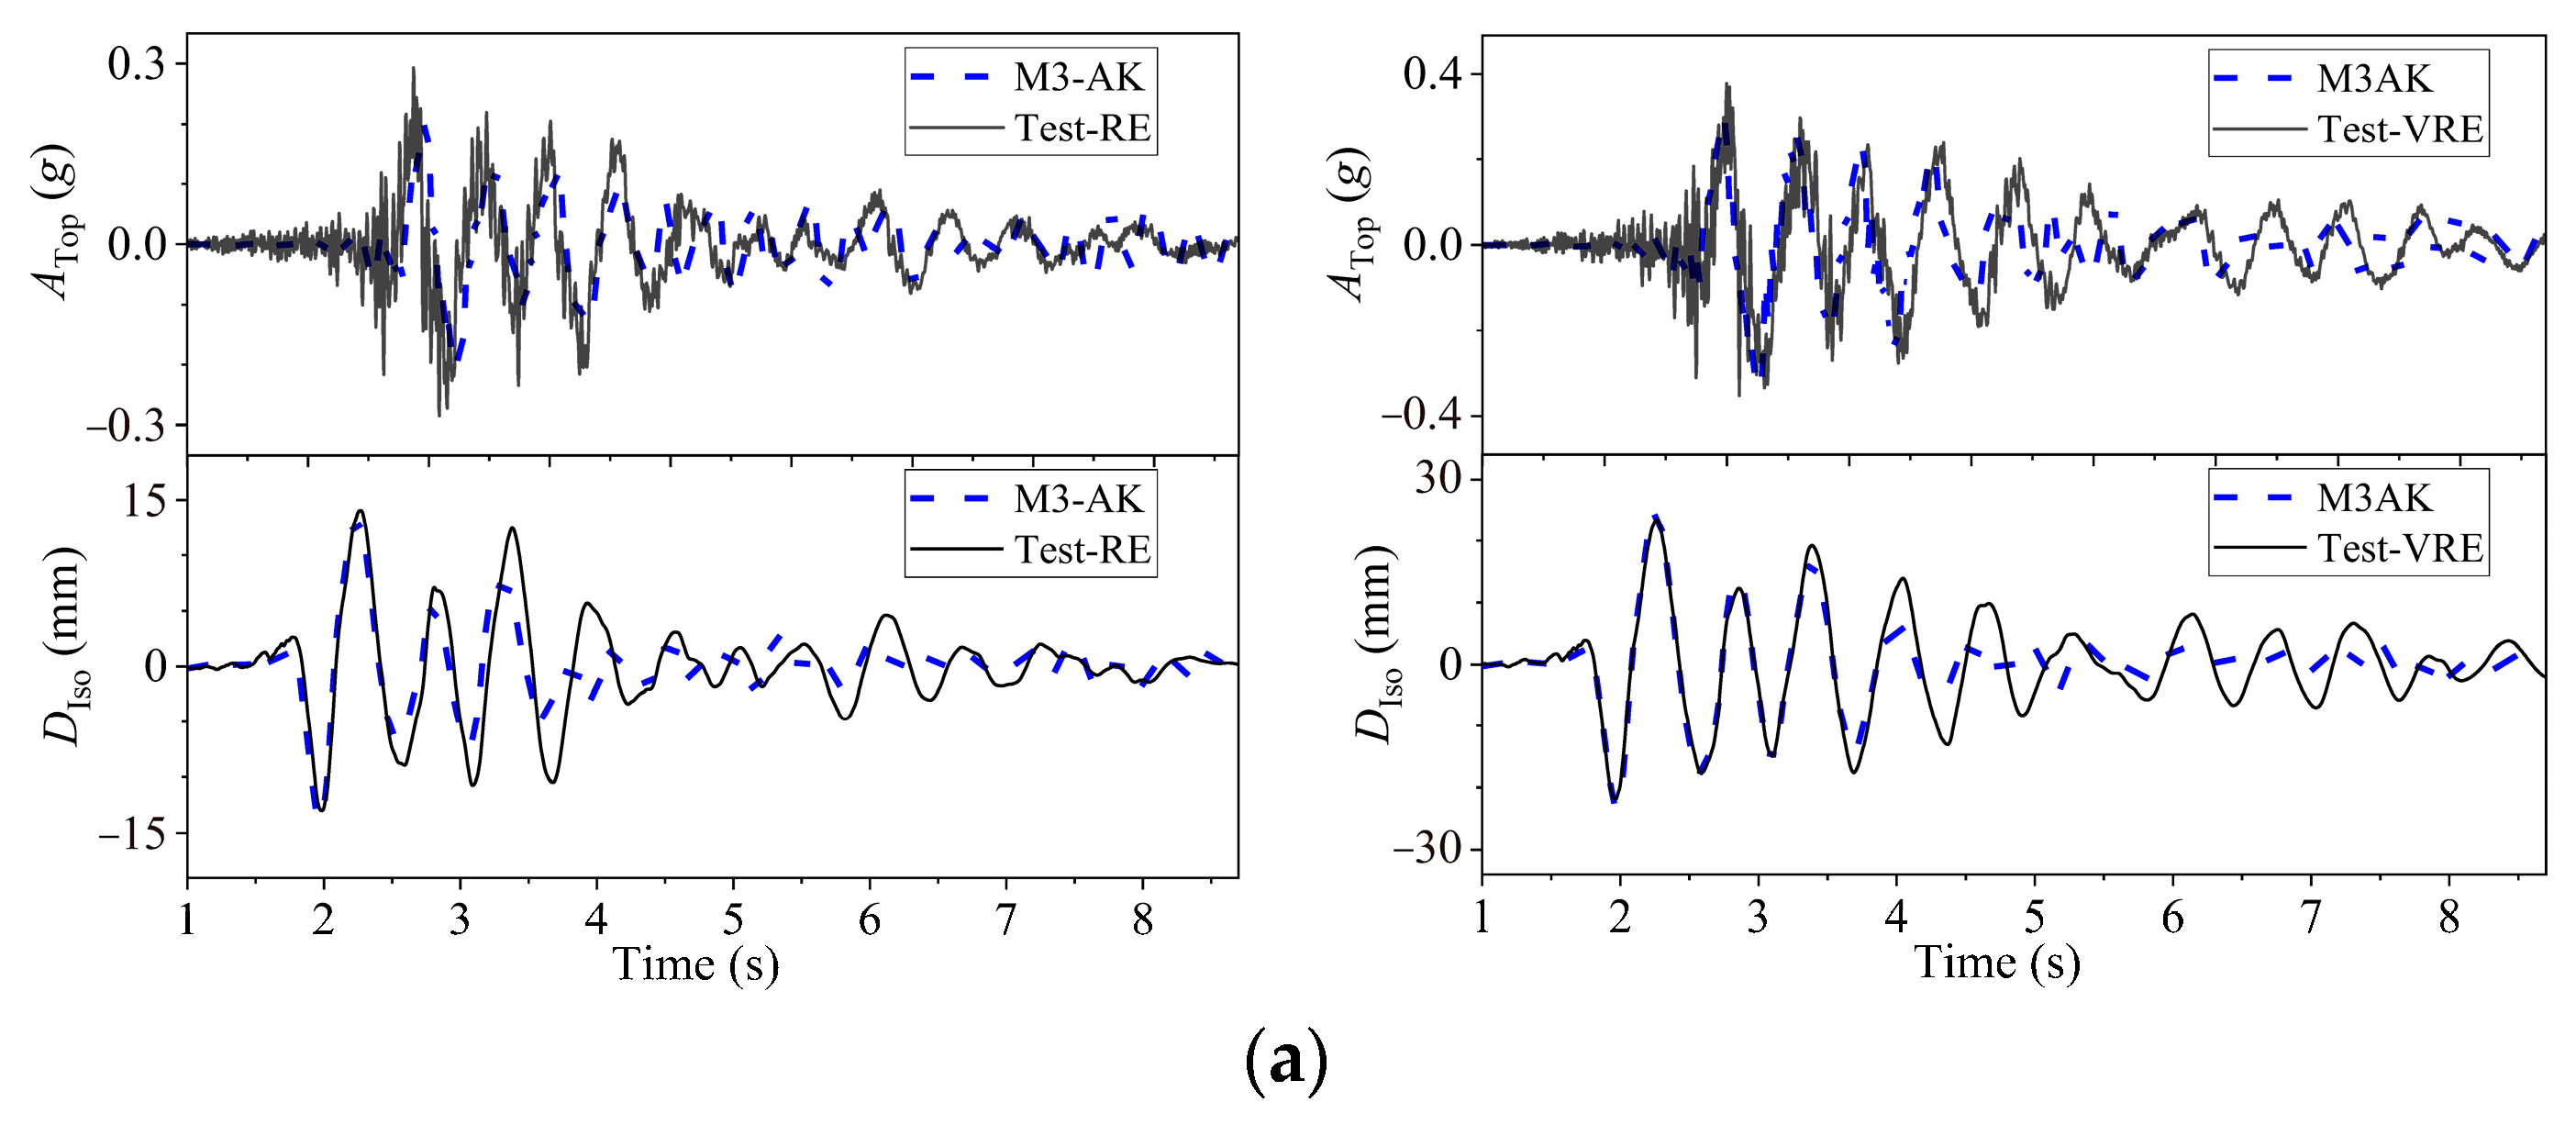
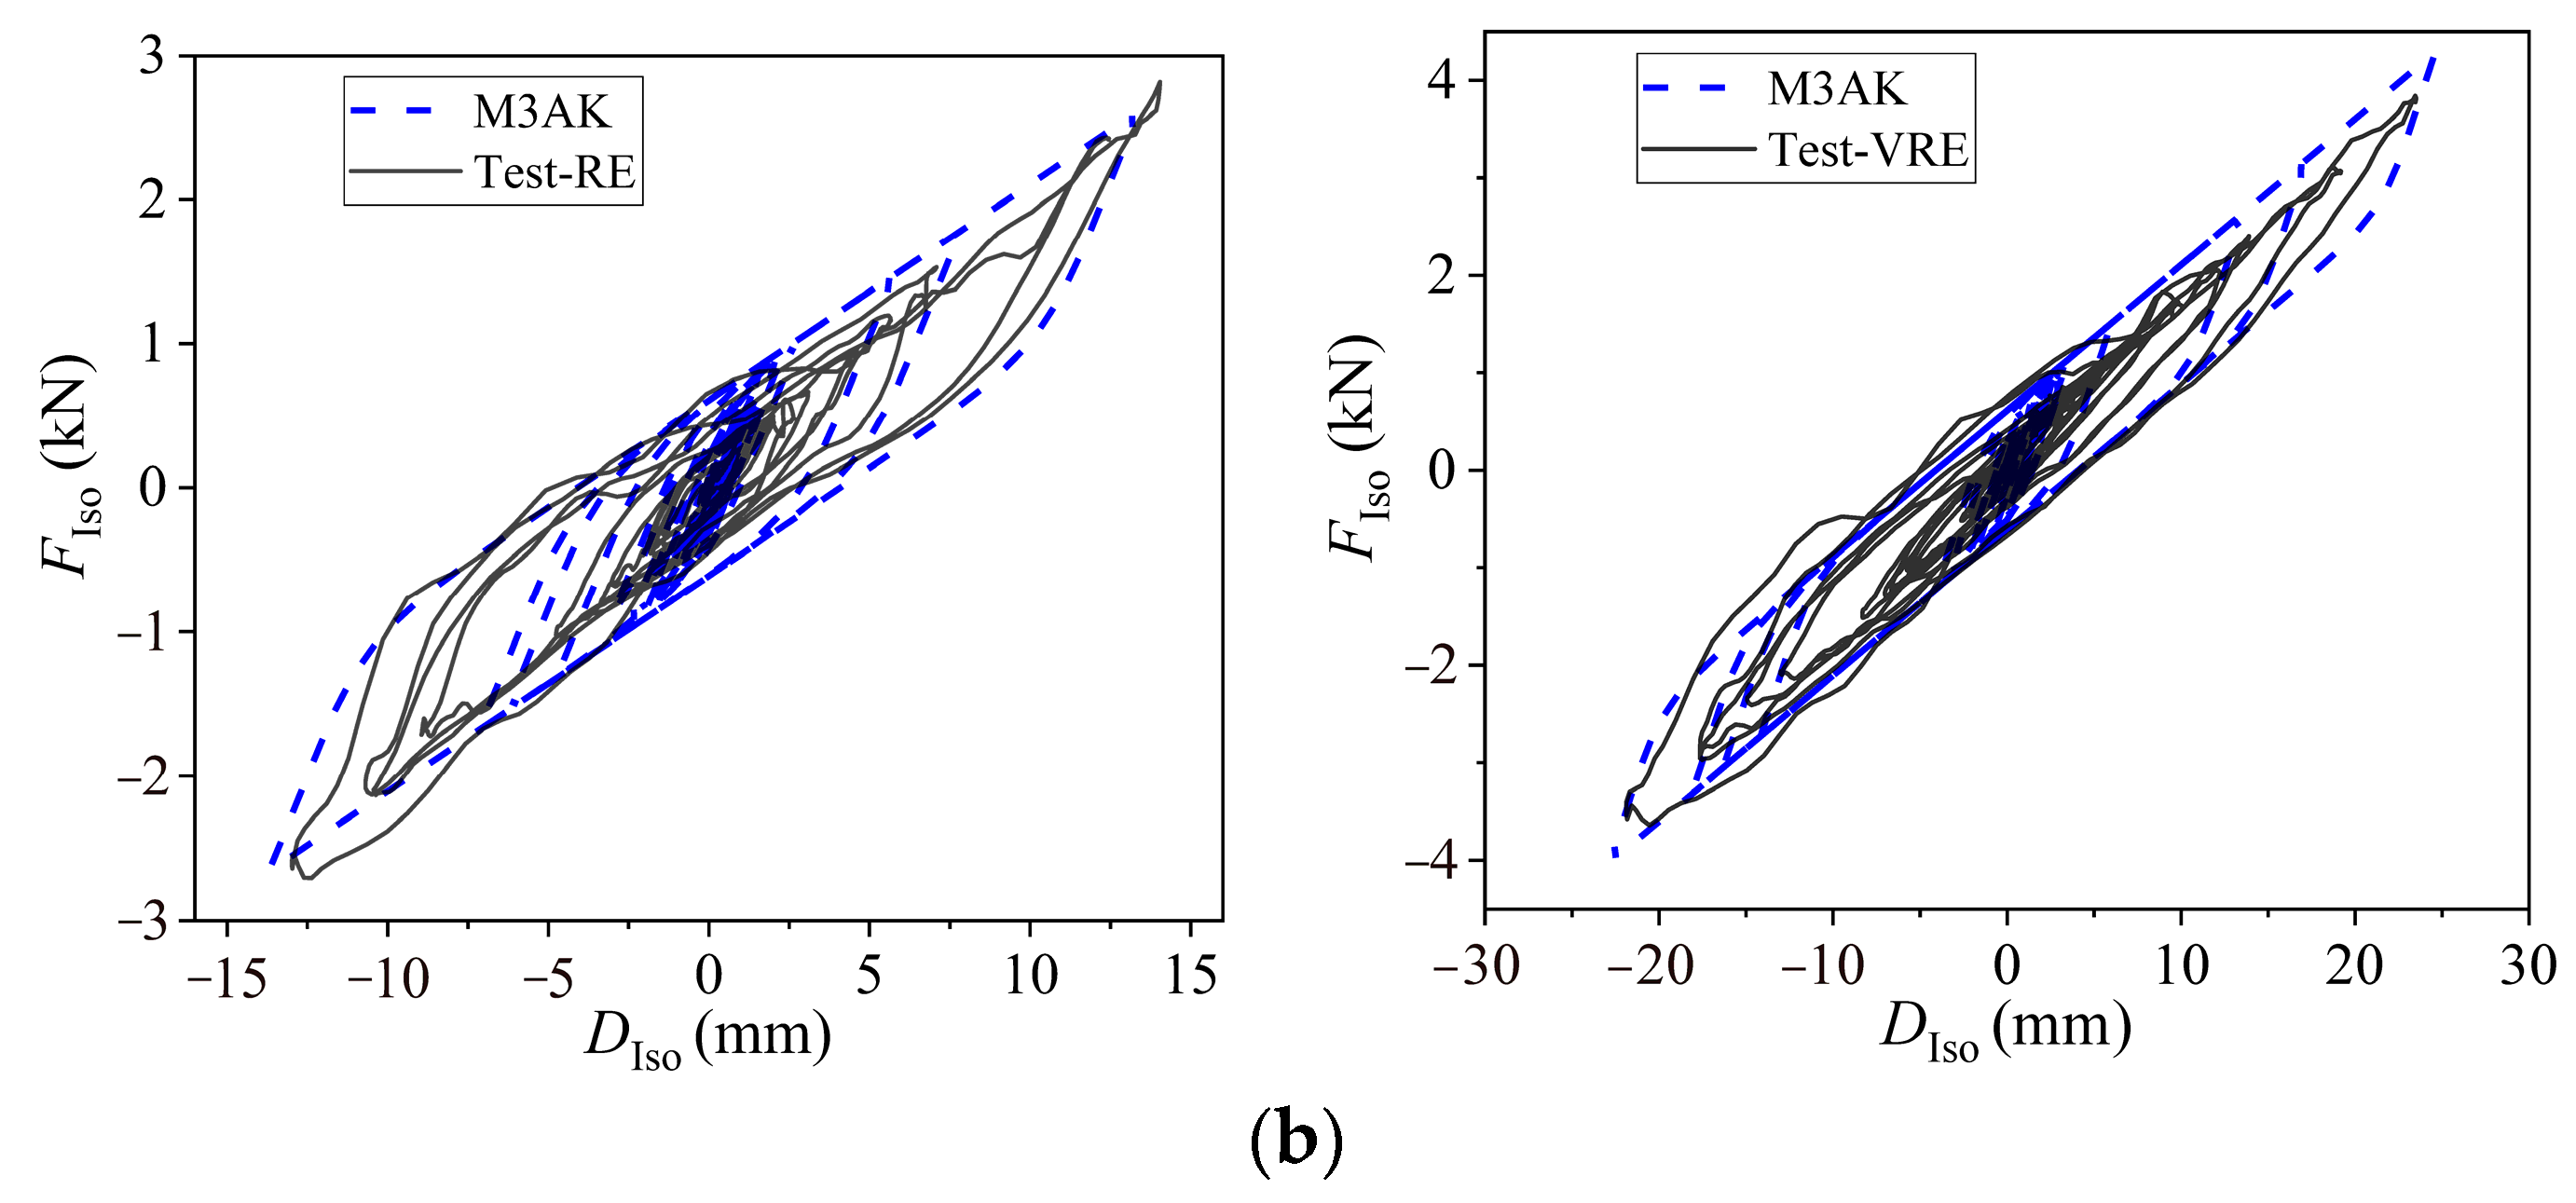
Numerical results of the structural time history response and bearing hysteresis curve obtained from the finite element model established with the M3AK method under different seismic intensities are compared with the experimental results in Figure 20. It is observed from Figure 20 that, for the scaled model, the stiffness-proportional damping model with an amplified initial bearing stiffness can accurately reproduce the dynamic response characteristics of the structure under seismic excitation. In particular, when the pre-yield stiffness of the LRB100 bearing is amplified by a factor of 1.15, the displacement response and hysteretic behavior of the scaled bearing under seismic loading are accurately captured.

5. Conclusions

This study focused on the application of small-diameter lead-rubber bearings in seismic isolation structures based on quasi-static and shaking table tests. Both compression–shear and seismic hysteresis curves of small-diameter bearings were obtained and systematically analyzed to investigate the effects of loading amplitude and frequency on mechanical properties. A parameter identification method for the restoring force model of small-diameter lead-rubber bearings was developed, and the sensitivity of the isolation layer’s pre-yield stiffness and yield force to the structural seismic response was examined using an equivalent two-degree-of-freedom model. Based on a comparison between finite element analysis results obtained from different damping matrix modeling methods and experimental data, damping modeling approaches for the isolation layer and the superstructure of high-rise over-track structures with an inter-story isolation system were recommended. The main conclusions are as follows:
(1) When the maximum deformation of the bearing is 50% shear strain, under seismic excitation, the post-yield stiffness and horizontal equivalent stiffness increased by 13.25% and 18.44%, respectively, compared to the compression–shear test results, while the equivalent damping ratio increased by 14.63%. When the maximum deformation reaches 150%, Kd and Kh increased by 11.97% and 19.40%, respectively, and the equivalent damping ratio increased by 18.18%. The mechanical parameters derived from the quasi-static tests overestimate the displacement response of the isolation layer.
(2) Based on the compression–shear hysteresis curve of the bearings and using a genetic algorithm, the Bouc–Wen model parameters A, β, γ, and n were identified as 0.3, 0.75, 0.7, and 2, respectively. The corresponding mechanical performance indicators showed errors of less than 10% compared with measured values. The pre-yield stiffness obtained from static tests should be amplified by a factor of 1.15 to accurately reflect the mechanical behavior of the bearing under dynamic loading.
(3) The structural seismic response was found to be more sensitive to the pre-yield stiffness of the isolation layer than to the yield force. Under rare earthquake excitation with natural ground motions, the ±5% tolerance band for AIso corresponded to a γk0 range of [−6.47%, 5.62%], while that for DIso corresponded to [−37.06%, 42%]. The sensitivity of the structural response to γk0 and γFy decreased in the following order: AIso > DSub > DIso > ASub.
(4) When stiffness proportional or Rayleigh damping is applied separately to the upper reinforced concrete shear wall structure and the lower reinforced concrete frame structure to establish finite element models for the scaled and prototype structures, the differences between the computed results and the experimental values are minimized. In this approach, the simulated top-floor relative displacement and isolation layer displacement were slightly larger than the experimental values, thereby providing a conservative estimate suitable for seismic performance evaluation of reinforced concrete isolated structure.

Author Contributions

G.C.: Methodology, Validation, Investigation, Data curation, Writing—original draft. Z.C.: Conceptualization, Methodology, Validation, Writing—review & editing. G.D.: Data curation, Software. W.M.: Validation, Data curation; B.L.: Conceptualization, Supervision, Funding acquisition. All authors have read and agreed to the published version of the manuscript.

Funding

This research was funded by the Scientific Research and Development Projects of China Railway First Survey and Design Institute Group Co., Ltd., [Grant Numbers: 20-26], and the Opening Foundation of the State Key Laboratory of Disaster Reduction in Civil Engineering of TONGJI University [Grant Numbers: SLDRCE24-04].

Data Availability Statement

The data used to support the findings of this study are available from the corresponding author upon request.

Conflicts of Interest

The authors declare that they have no conflict of interest that could have appeared to influence the work reported in this paper.

References

  1. Xiao, J.; Huang, L.; Weng, R.; Murong, Y.; Liu, L.; Zeng, H.; Jiang, H. Mechanism of chloride ion transport and associated damage in ultra-high-performance concrete subjected to hydrostatic pressure. J. Build. Eng. 2025, 112, 113700. [Google Scholar] [CrossRef]
  2. Weng, R.; He, Z.; Liu, J.; Lei, B.; Huang, L.; Xu, J.; Liu, L.; Xiao, J. Shear Performance of UHPC-NC Composite Structure Interface Treated with Retarder: Quantification by Fractal Dimension and Optimization of Process Parameters. Buildings 2025, 15, 2591. [Google Scholar] [CrossRef]
  3. Xiao, J.; Shuai, J.; Deng, W.; Liu, L.; Wang, P.; Li, L. Low-Carbon and Green Materials in Construction: Latest Advances and Prospects. Buildings 2025, 15, 1508. [Google Scholar] [CrossRef]
  4. Zucca, M.; Longarini, N.; Simoncelli, M.; Aly, A.M. Tuned Mass Damper Design for Slender Masonry Structures: A Framework for Linear and Nonlinear Analysis. Appl. Sci. 2021, 11, 3425. [Google Scholar] [CrossRef]
  5. Wang, S.J.; Chang, K.C.; Hwang, J.S.; Lee, B.H. Simplified analysis of mid-story seismically isolated buildings. Earthq. Eng. Struct. Dyn. 2011, 40, 119–133. [Google Scholar] [CrossRef]
  6. Li, Z.H.; Huang, G.Q.; Chen, X.Z.; Zhou, X.H. Seismic Response and Parametric Analysis of Inter-Story Isolated Tall Buildings Based on Enhanced Simplified Dynamic Model. Int. J. Struct. Stab. Dyn. 2022, 22, 2240008. [Google Scholar] [CrossRef]
  7. Faiella, D.; Mele, E. Vibration characteristics and higher mode coupling in intermediate isolation systems (IIS): A parametric analysis. Bull. Earthq. Eng. 2019, 17, 4347–4387. [Google Scholar] [CrossRef]
  8. Bhandari, M.; Bharti, S.D.; Shrimali, M.K.; Datta, T.K. Seismic Fragility Analysis of Base-Isolated Building Frames Excited by Near- and Far-Field Earthquakes. J. Perform. Constr. Facil. 2019, 33, 04019029. [Google Scholar] [CrossRef]
  9. Saha, A.; Mishra, S.K. Implications of inter-storey-isolation (ISI) on seismic fragility, loss and resilience of buildings subjected to near fault ground motions. Bull. Earthq. Eng. 2022, 20, 899–939. [Google Scholar] [CrossRef]
  10. Tamari, M.; Yoshihara, T.; Miyashita, M.; Ariyama, N.; Nonoyama, M. Structural Design and Performance Evaluation of a Mid-story Seismic Isolated High-Rise Building. Int. J. High-Rise Build. 2017, 6, 227–235. [Google Scholar] [CrossRef]
  11. Li, J.R.; Luo, W.L.; Liang, Q.H.; Wang, D.Y.; Zhou, Y.; He, Z.M. Shaking table test of seismic performance of high-rise over-track building with base isolation. J. Build. Eng. 2023, 75, 106749. [Google Scholar] [CrossRef]
  12. Liang, Q.H.; Zhou, Y.; Wang, D.Y.; Luo, W.L.; Li, J.R.; He, Z.M. Shaking table test of vertical isolation performances of super high-rise structure under metro train-induced vibration. J. Build. Eng. 2024, 82, 108323. [Google Scholar] [CrossRef]
  13. Liu, X.T.; Wang, W.; Li, J.L. Full-scale shaking table tests and numerical studies of structural frames with a hybrid isolation system. Eng. Struct. 2023, 292, 116545. [Google Scholar] [CrossRef]
  14. JG/T 118-2018; Rubber Isolation Bearings for Buildings. Ministry of Housing and Urban-Rural Development of the People’s Republic of China: Beijing, China, 2018.
  15. Haringx, J.A. On highly compressible helical springs and rubber rods and their application for vibration-free mountings. II. Philips Res. Rep. 1949, 4, 49–80. [Google Scholar]
  16. Haringx, J.A. On highly compressible helical springs and rubber rods and their application for vibration-free mountings. III. Philips Res. Rep. 1949, 4, 206–220. [Google Scholar]
  17. Gent, A.N. Elastic stability of rubber compression springs. J. Mech. Eng. Sci. 1964, 6, 318–326. [Google Scholar] [CrossRef]
  18. Nishi, T.; Suzuki, S.; Aoki, M.; Sawada, T.; Fukuda, s. International investigation of shear displacement capacity of various elastomeric seismic-protection isolators for buildings. J. Rubber Res. 2019, 22, 33–41. [Google Scholar] [CrossRef]
  19. Cardone, D.; Perrone, G. Critical load of slender elastomeric seismic isolators: An experimental perspective. Eng. Struct. 2012, 40, 198–204. [Google Scholar] [CrossRef]
  20. Montuori, G.M.; Mele, E.; Marrazzo, G.; Brandonisio, G.; De Luca, A. Stability issues and pressure–shear interaction in elastomeric bearings: The primary role of the secondary shape factor. Bull. Earthq. Eng. 2015, 14, 569–597. [Google Scholar] [CrossRef]
  21. Yabana, S.; Matsuda, A. Mechanical properties of laminated rubber bearings for three-dimensional seismic isolation. In Proceedings of the 12th World Conference on Earthquake Engineering, Auckland, New Zealand, 30 January–4 February 2000. [Google Scholar]
  22. Vemuru, V.S.M.; Nagarajaiah, S.; Mosqueda, G. Coupled horizontal–vertical stability of bearings under dynamic loading. Earthq. Eng. Struct. Dyn. 2016, 45, 913–934. [Google Scholar] [CrossRef]
  23. Orfeo, A.; Tubaldi, E.; Muhr, A.H.; Losanno, D. Dynamic behaviour and seismic response of structures isolated with low shape factor bearings. Earthq. Eng. Struct. Dyn. 2023, 52, 3765–3787. [Google Scholar] [CrossRef]
  24. Sanchez, J.; Masroor, A.; Mosqueda, G.; Ryan, K. Static and Dynamic Stability of Elastomeric Bearings for Seismic Protection of Structures. J. Struct. Eng. 2013, 139, 1149–1159. [Google Scholar] [CrossRef]
  25. Rahnavarda, R.; Craveiroa, H.D.; Napolitano, R. Static and dynamic stability analysis of a steel-rubber isolator with rubber cores. Structures 2020, 26, 441–455. [Google Scholar] [CrossRef]
  26. Akazawa, M.; Kurata, M.; Yamazaki, S.; Kawamata, Y.; Matsuo, S. Test and sensitivity analysis of base-isolated steel frame with low-friction spherical sliding bearings. Earthq. Eng. Struct. Dyn. 2024, 54, 100–118. [Google Scholar] [CrossRef]
  27. Wu, Y.X.; Lu, J.F.; Qi, A. Shaking table test and numerical analysis of mid-story isolation eccentric structure with tower-podium. Adv. Mech. Eng. 2019, 11, 1687814018819562. [Google Scholar] [CrossRef]
  28. GB 50011-2010; Code for Seismic Design of Buildings. Ministry of Housing and Urban-Rural Development of the People’s Republic of China: Beijing, China, 2016.
  29. Xing, G.H.; Cao, G.R.; Chang, Z.Q.; Huang, Y.A.; Lu, Z.; Li, Y.Y.; Ma, X.F. Shaking Table Test and Dynamic Analysis on the Metro depot Over-Track Isolated Structure in High Seismic Intensity Regions; Chang’an University: Xi’an, China, 2025. [Google Scholar]
  30. Ismail, M.; Ikhouane, F.; Rodellar, J. The hysteresis Bouc-Wen model, a survey. Arch. Comput. Methods Eng. 2009, 16, 161–188. [Google Scholar] [CrossRef]
  31. Chen, P.; Wang, B.; Zhang, A.H.; Li, T.; Dai, K.S. A generalized model of lead rubber bearing considering large strain stiffening and degradation. Eng. Struct. 2023, 275, 115264. [Google Scholar] [CrossRef]
  32. Mansouri, I.; Ghodrati Amiri, G.; Hu, J.W.; Khoshkalam, M.; Soori, S.; Shahbazi, S. Seismic Fragility Estimates of LRB Base Isolated Frames Using Performance-Based Design. Shock Vib. 2017, 3, 5184790. [Google Scholar] [CrossRef]
  33. Zheng, W.Z.; Chen, J.L.; Wang, H.; Tan, P.; Li, J.; Wang, S.Q. A novel damping adaptive pendulum isolation system for seismic resilience enhancement of continuous bridges. Eng. Struct. 2025, 339, 120465. [Google Scholar] [CrossRef]
  34. PEER Ground Motion Database Pacific Earthquake Engineering Research Center. University of California, Berkeley. Available online: https://ngawest2.berkeley.edu/ (accessed on 3 March 2018).[Green Version]
  35. Skandalos, K.; Chakraborty, S.; Tesfamariam, S. Seismic reliability analysis using a multi-fidelity surrogate model: Example of base-isolated buildings. Struct. Saf. 2022, 97, 102222. [Google Scholar] [CrossRef]
  36. Anajafi, H.; Medina, R.A.; Santini-Bell, E. Effects of the improper modeling of viscous damping on the first-mode and higher-mode dominated responses of base-isolated buildings. Earthq. Eng. Struct. Dyn. 2020, 49, 51–73. [Google Scholar] [CrossRef]
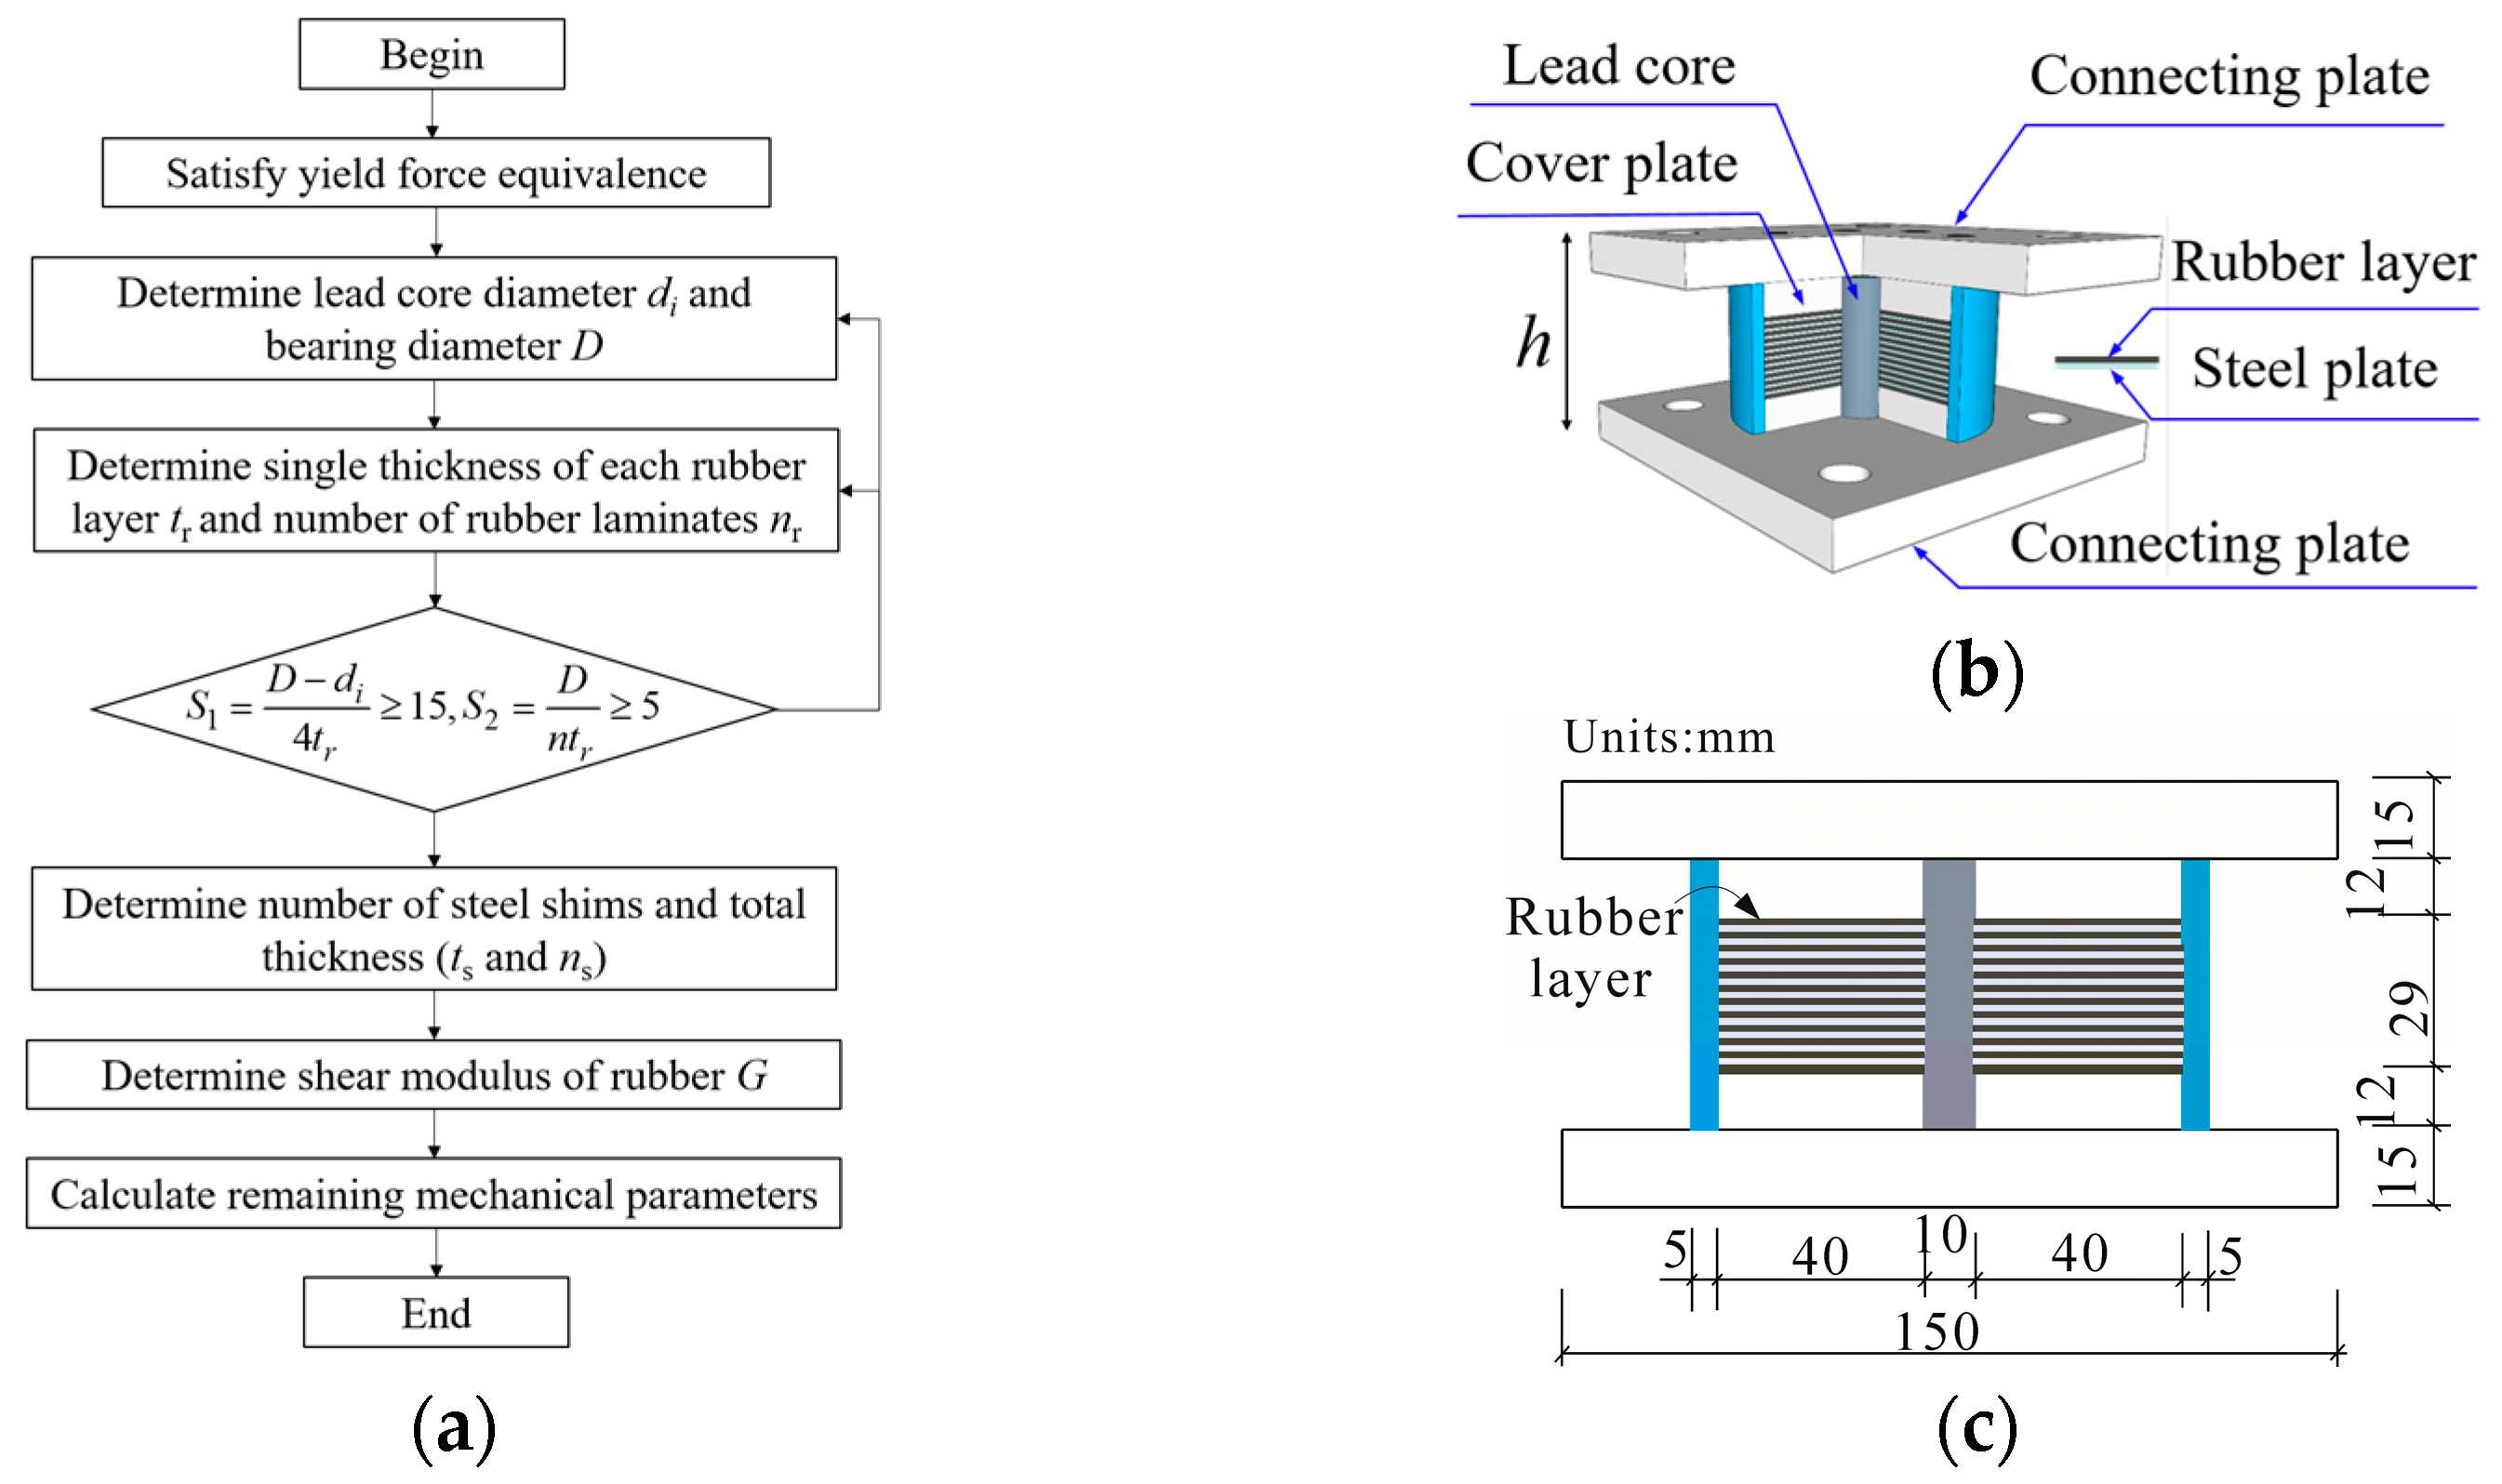
Figure 1. Design process of LRB: (a) dimensional design flowchart; (b) schematic diagram of the bearing components; (c) schematic illustration of the LRB100 design.
Buildings 15 03284 g001
Figure 2. Compression–shear test apparatus for the LRB100.
Buildings 15 03284 g002
Figure 3. Schematic of the scaled model: (a) overall view; (b) plan layout of the isolation layer in the scaled model; (c) cross-sectional reinforcement details.
Buildings 15 03284 g003
Figure 4. Acceleration response spectra of the input ground motions used in the test.
Buildings 15 03284 g004
Figure 5. Compression–shear hysteresis curves under different displacement amplitudes and loading frequencies: (a) 9 mm; (b) 18 mm; (c) 27 mm; (d) 36 mm.
Buildings 15 03284 g005
Figure 6. Variation curves of the mechanical performance indicators of the bearing under different loading conditions: (a) Kd; (b) Kh; (c) Fy; (d) heq.
Buildings 15 03284 g006
Figure 7. Hysteresis curves of the bearings under different displacement amplitudes: (a) 50% shear strain; (b) 100% shear strain; and (c) 150% shear strain.
Buildings 15 03284 g007
Figure 8. Mechanical properties of the bearing: (a) under seismic excitation and (b) with relative increases between dynamic and quasi-static tests.
Buildings 15 03284 g008
Figure 9. Experimental and theoretical hysteresis curves of LRB100 at displacement amplitudes of: (a) 18 mm; (b) 36 mm.
Buildings 15 03284 g009
Figure 10. Effect of parameter variation on the Bouc–Wen restoring force model: (a) A = 1, n = 2, γ = 0.5; (b) A = 1, n = 2, β = 0.5; (c) n = 2, γ = 0.5, β = 0.5; (d) A = 1, γ = 0.5, β = 0.5.
Buildings 15 03284 g010
Figure 11. Hysteresis curve corresponding to 0.05 Hz—100% shear strain.
Buildings 15 03284 g011
Figure 12. Comparison between the 2DOF model and experimental results: (a) acceleration of the lower structure (ASub); (b) displacement of the lower structure (DSub); (c) acceleration of the upper structure (AIso); and (d) displacement of the upper structure (DIso).
Buildings 15 03284 g012
Figure 13. Acceleration response spectra: (a) artificial ground motions and (b) natural ground motions.
Buildings 15 03284 g013
Figure 14. Analysis of structural responses under RE excitation using artificial ground motions in relation to k0 and Fy: (a) ASub; (b) DSub; (c) AIso; (d) DIso.
Buildings 15 03284 g014
Figure 15. Analysis of structural responses under VRE excitation using artificial ground motions in relation to k0 and Fy: (a) ASub; (b) DSub; (c) AIso; (d) DIso.
Buildings 15 03284 g015aBuildings 15 03284 g015b
Figure 16. Analysis of structural responses under RE excitation using natural ground motions in relation to k0 and Fy: (a) ASub; (b) DSub; (c) AIso; (d) DIso.
Buildings 15 03284 g016
Figure 17. Analysis of structural responses under VRE excitation using natural ground motions in relation to k0 and Fy: (a) ASub; (b) DSub; (c) AIso; (d) DIso.
Buildings 15 03284 g017
Figure 18. Comparison of modal damping ratios for different damping matrix formulations.
Buildings 15 03284 g018
Figure 19. Distribution of seismic response amplitudes and relative errors for the scaled model under RE and VRE excitations: (a) amplitudes under RE input; (b) relative errors under RE input; (c) amplitudes under VRE input; and (d) relative errors under VRE input.
Buildings 15 03284 g019
Figure 20. Comparison of numerical and experimental results for the scaled model: (a) structural time history responses; (b) the bearing hysteresis curves.
Buildings 15 03284 g020aBuildings 15 03284 g020b
Table 1. Dimensions and mechanical properties of LRB100.
Geometrical ParametersLRB100Mechanical PropertiesValue
Outer diameter D (mm)100Shear modulus of rubber, G (MPa)0.392
Height (mm)53Yield strength of lead, τp (MPa)8.5
Effective diameter, d0 (mm)90First shape factor, S115
Core diameter, di (mm)10Second shape factor, S25
Thickness of single rubber layer, tr (mm)1.5Vertical stiffness, Kv (kN/mm)163
Number of rubber layers, nr 12Yield force, Fy (kN)0.57
Total rubber thickness, Tr (mm)18Post-yield stiffness (100%), Kd (kN/mm)0.137
Lead core area, Ap (mm2)78.5Equivalent horizontal stiffness (100%), Kh (kN/mm)0.175
Thickness of thin steel plate, ts (mm)1Equivalent damping ratio (100%), heq (%)13.5
Number of steel plates, ns 11--
End plate thickness (mm)12--
Table 2. Test conditions for quasi-static compression–shear loading.
CaseVertical
Load P (kN)
Displacement Amplitude u1 (mm)Shear Strain γ (%)Loading Frequency f (Hz)Number of Cycles
116±9±50%0.055
216±18±100%0.055
316±27±150%0.055
416±36±200%0.055
516±18±100%0.25
616±27±150%0.25
716±36±200%0.25
816±18±100%0.55
916±27±150%0.55
1016±36±200%0.55
Table 3. Similarity ratios of the scaled model.
Physical QuantityValuePhysical QuantityValue
Length1/20Period0.224
Elastic modulus1/4Frequency4.47
Stress0.25Time0.224
Mass6.25 × 10−4Gravity1
Stiffness0.0125Velocity0.224
Table 4. Mechanical performance parameters of the LRB100.
Caseγf1Kd (kN/mm)Fy (kN)Kh (kN/mm)heq (%)
150%0.05 Hz0.1580.4400.1928.4
2100%0.05 Hz0.1390.4670.1608.8
3150%0.05 Hz0.1210.5330.1408.9
4200%0.05 Hz0.1170.6300.1349.4
5100%0.2 Hz0.1430.4970.1616.9
6150%0.2 Hz0.1240.5560.1457.7
7200%0.2 Hz0.1200.6400.1367.9
8100%0.5 Hz0.1450.5150.1656.3
9150%0.5 Hz0.1260.5690.1497.1
10200%0.5 Hz0.1220.6770.1377.3
Table 5. Horizontal mechanical properties of bearings under seismic excitation.
γPropertyARL H-PTSTCU0489Mean ValueCompression–Shear Test ValueIncrease Ratio
(%)
50%Kd (kN/mm)0.1820.1750.1730.1770.15811.81
50%Kh (kN/mm)0.2280.2240.2160.2230.19215.97
50%heq (%)9.19.79.49.4008.411.90
100%Kd (kN/mm)0.1550.1480.1450.1490.1397.43
100%Kh (kN/mm)0.1860.1820.1840.1840.16015.00
100%heq (%)9.410.19.69.7008.810.23
150%Kd (kN/mm)-0.131-0.1310.1218.26
150%Kh (kN/mm)-0.160-0.1600.14014.29
150%heq (%)-10.4-10.4008.916.85
Table 6. Comparison between experimentally measured and theoretically predicted mechanical parameters of the LRB100.
ParameterInitial ParametersModify Parameters
γ = 100%Error 1 (%)γ = 100%Error 2 (%)
Kd (kN/mm)0.131−5.760.1511.12
Fy (kN)0.5109.21--
Kh (kN/mm)0.155−3.130.1802.17
heq (%)9.35.689.34.12
Table 7. Details of selected natural earthquake records.
No.NameYearRecorder StationComponentPGA
(g)
PGV
(cm/s)
Duration
(s)
1Friuli1976TolmezzoA-TMZ0000.353136.34
2Friuli1976TolmezzoA-TMZ 2700.313136.34
3Loma prieta1989CapitolaCAP 0900.533539.95
4Cape Mendocino1992Rio Dell OverpassRIO 3600.554435.98
5Kobe, Japan1995Nishi-AkashiNIS0000.513740.95
6Kobe, Japan1995Nishi-AkashiNIS9000.503840.95
7Kobe, Japan1995Shin-OsakaSHI 0900.243840.95
8Kocaeli, Turkey1999ArcelikARC 0000.224030.00
9Hector Mine1999HectorHEC 0000.344245.3
10Northridge-011944Arleta -Nordhoff
Fire Sta
NGA_no_949
_ARL360
0.312339.94
Disclaimer/Publisher’s Note: The statements, opinions and data contained in all publications are solely those of the individual author(s) and contributor(s) and not of MDPI and/or the editor(s). MDPI and/or the editor(s) disclaim responsibility for any injury to people or property resulting from any ideas, methods, instructions or products referred to in the content.