Abstract
Long-span prestressed structures present distinct challenges during tensioning. Their considerable length inherently induces significant tendon friction, resulting in substantial prestress loss. Additionally, prestressing operations within buildings will induce initial stresses that affect adjacent structural members. However, research on the design and construction of ultra-long-span prestressed systems with composite materials in building structures remains limited. To investigate prestress effects in long-span building structures, this study examines prestress loss and tension timing for the 94.34 m arch tie girder in Shenzhen Museum. This project marks the first application of the bonded post-tensioning method to an ultra-long composite structural member. The analysis of the prestress loss is conducted by considering the friction, relaxation of steel tendon, creep, and shrinkage. An innovative finite element method, integrating creep and shrinkage effects for composite members, is developed in ANSYS. Four tensioning schemes are compared using nonlinear staged-construction simulation in NIDA software. The results demonstrate that the presented analytical method can effectively quantify the prestress loss. Early-stage prestressing effects can be minimized by optimizing the force transmission paths through construction joints. These findings provide practical and theoretical guidance for designing and constructing similar long-span structures.
1. Introduction
Prestressing technology effectively leverages the high compressive strength of concrete to compensate for its lack of tensile strength, making it particularly useful in large-scale, long-span, and heavily loaded structures [1,2,3]. The first use of prestressed concrete can be traced back to 1937 [4]. Other applications, such as the Millau Viaduct, the tallest viaduct in Europe, utilizes extracorporeal prestressing technology to reduce the number of piers and optimize the self-weight [5]. The CN Tower in Toronto, Canada uses prestressed concrete technology to improve the stability and wind resistance of the structure [6]. The Zeiss Planetarium in Jena, Germany features a thin-shell prestressed concrete roof, which is an innovative application of early prestressed concrete technology [7]. Sydney Opera House adopts the pre-stressed concrete shell roof, which controls the cracks of the shell through post-tensioning prestressing tendons, ensures the bending performance of the thin-shell structure, and makes the complex curved shells possible [8]. Shanghai Lupu Bridge, the world’s largest span steel arch bridge, adopts arch ribs with high-strength prestressing tendons, balancing the horizontal thrust of the arch footing and reducing the size of the piers to avoid the high requirements of a traditional arch bridge on the foundation [9]. The prestressing approach includes pre-tensioning and post-tensioning methods. Compared to the pre-tensioning method, the post-tensioning method provides advantages such as a wide range of application and greater effectiveness, making it more popular for large cast-in-place concrete structures [10,11,12]. In post-tensioning, based on the bonding action between tendons and concrete, prestressing tendons can be classified into bonded and unbonded tendons [13,14]. Bonded tendons allow for more uniform transmission of internal forces and offer excellent crack resistance, high stiffness, and a high load-bearing capacity. Consequently, they are widely used in large-span structures. In addition, some other scholars have applied prestressing for structural reinforcement [15,16]. At present, this technology has formed a complete set of design calculation methods and structural construction technology.
The primary challenge in the design and construction of prestressed members is managing prestress losses [17,18]. Overestimating or underestimating the losses can impact the structural performance and capacity [19,20]. Based on the mechanisms of prestress loss, the losses can be categorized as instantaneous losses and long-term losses [21,22]. Long-term losses mainly include concrete shrinkage, creep, and reinforcement relaxation [23,24,25], while instantaneous losses mainly include elastic compression, friction, anchorage deformation, and clip retraction [26,27,28]. Additionally, the construction process is also a significant factor influencing prestress losses. Tensioning new tendons can cause a loss of prestress in the ones that were already tensioned [29]. To compensate for prestress losses, the intentional overstressing of tendons is commonly employed. The critical technical challenge for determining the initial overstressing magnitude involves developing a comprehensive assessment framework that quantitatively evaluates the coupled effects of time-dependent and instantaneous prestress losses. In practice, the losing values caused by different factors are typically calculated individually and then superimposed as the factors can be regarded as linearly independent [30,31]. Cao et al. [32] modified the formula for concrete relaxation loss specified in the Chinese code. Meng et al. [33] developed a finite element modeling method to numerically evaluate the influences of prestress loss. Yang et al. [34] revised the long-term prestress loss calculation method considering concrete shrinkage, creep, and stress relaxation. Xiao et al. [35] proposed a new long-term prestress loss assessment method for post-tensioned concrete under chloride environments. Mohebbi and Graybeal [36] presented a prestress loss model for ultra-high-performance concrete. However, the investigation of the prestress loss of composite members is seldomly reported. Therefore, it is necessary to establish an accurate analysis method for the ultra-long composite girder to capture time-dependent effects and the sequence of loading stages, thus reducing discrepancies between design assumptions and the actual structural response.
This paper presents the Shenzhen Museum project, featuring a 94.34 m ultra-long composite girder constructed using bonded post-tensioning. The analysis method for calculating prestress losses is presented, and a numerical approach for the integrated analysis of creep and shrinkage using ANSYS (https://www.ansys.com/academic, accessed on 25 August 2025) is introduced. To address schedule constraints, four construction schemes are evaluated. Their effects on structural internal forces and prestress efficiency are evaluated through nonlinear staged-construction analysis in NIDA, a finite element analysis program technically for steel structure analysis and design [37,38]. Furthermore, optimal prestressing timing is proposed to minimize impacts on both prestress-tensioning operations and the project schedule. The findings provide practical guidance for this project and serve as a valuable technical reference for similar long-span prestressed structures.
2. Project Overview
Shenzhen Museum project is located in Shenzhen, China. The building’s basic structural system consists of an inverted trapezoidal outer steel frame integrated with eight concrete core tubes. The structure features a distinctive inverted pyramidal façade, with steel columns inclined up to 23.07°. Floor systems transfer loads exclusively to perimeter steel frames and internal concrete core walls, creating column-free spaces between the outer frame and core walls. In addition, to achieve the signature architectural effect of layered soaring eaves, each floor incorporates cantilevered eaves with maximum overhangs of 24 m. The architectural and structural overview is shown in Figure 1.
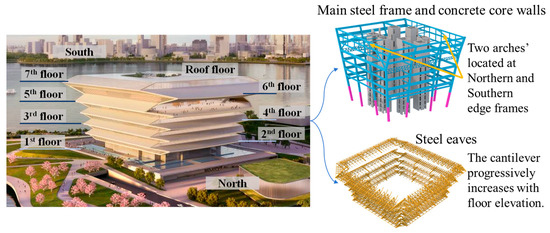
Figure 1.
Shenzhen Museum architectural and structural overview.
As shown in Figure 1, the north and south elevations incorporate a column-free large-span sightseeing platform on the fifth floor, spanning 94.34 m. To achieve the column-free space, two arch structures are adopted at the southern and northern edge frames to transfer the loads of the topside structures to the substructure, as illustrated in Figure 2.
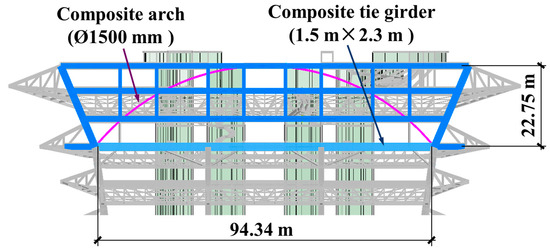
Figure 2.
Basic dimensions of arch.
The arches are only located at the northern and southern edge frames. The structure utilizes concrete-filled steel tubes with a cross-section of ø1500 × 60 mm, constructed from Q420 steel and C40 concrete. The nominal yield strength of Q420 steel is 420 MPa, and the nominal axial compressive strength of C40 concrete is 26.8 MPa. To counteract the horizontal thrust at the arch foot, a 1.5 m × 2.3 m prestressed composite girder is designed. The girder utilizes bonded post-tensioning technology with six straight prestressing tendons, each composed of 37 parallel 15.2 mm diameter strands, as shown in Figure 3.
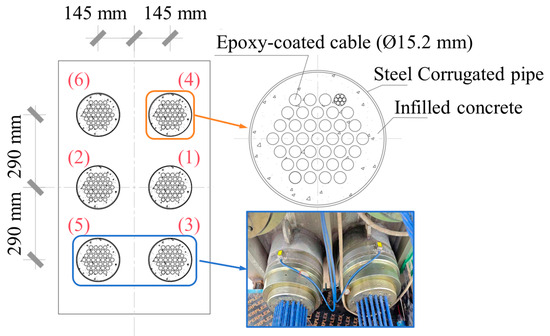
Figure 3.
The prestressing arrangement.
The long-span composite girders introduce distinctive engineering challenges: (1) site constraints complicate installing 100 m tendons; (2) tensioning 37 strands within a single corrugated duct increases friction losses and installation complexity; (3) design methods for prestress loss in composite girders lack documentation; and (4) the tensioning sequence can cause asymmetric deformation and prestress loss in previously tensioned tendons. To mitigate potential eccentric loading effects, the tendon tensioning sequence following the numbering shown in Figure 3 is proposed to reduce the eccentric moment about the major principal axis.
3. Numerical Determination of Prestress Forces
3.1. Design Value of Prestress Force
The prestressing force required is calculated based on the finite element analysis results. The finite element model of the museum is shown in Figure 4. The analysis is carried out in NIDA. Since the tie girder is designed to counteract the thrust generated by the arch due to vertical loading, only dead load and live load are considered in the analysis to determine the required prestressing force. The load combination follows the regulations in GB50009-2012 [39]. The analysis results of the arch elevation frame without the prestress force are shown in Figure 5, where the positive and negative values correspond to tension and compression, respectively.
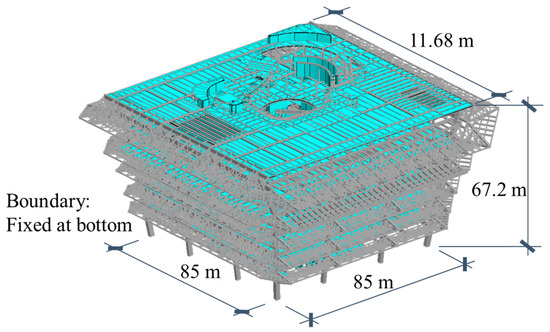
Figure 4.
Finite element analysis model of Shenzhen Museum.
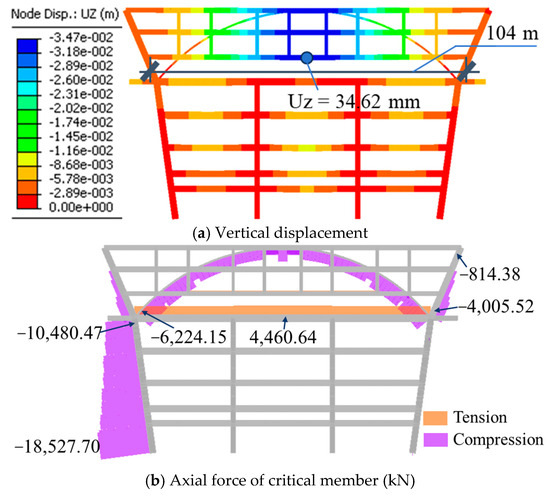
Figure 5.
Analysis results of arch elevation frame without prestress.
As shown in Figure 5, the vertical deflection of the beam on sixth floor above the sightseeing platform is 34.62 mm, which exceeds the allowable deflection limit of L/400 = 26 mm [40]. Therefore, optimal prestressing is essential to mitigate horizontal thrust at arch footings and reduce arch deformation. Through trial calculation, the required prestress value should be 20,640 kN. According to JTG 3362-2018 [41], the friction loss in a 94.34 m member is approximately 13.20%. The loss due to elastic shortening, shrinkage, and creep can be 12.4% to 22.5% [36]. Therefore, to account for prestress loss, the prestress can be empirically and conservatively enlarged by 35% and rounded up to 28,000 kN. The arch elevation frame performance with prestress is shown in Figure 6.
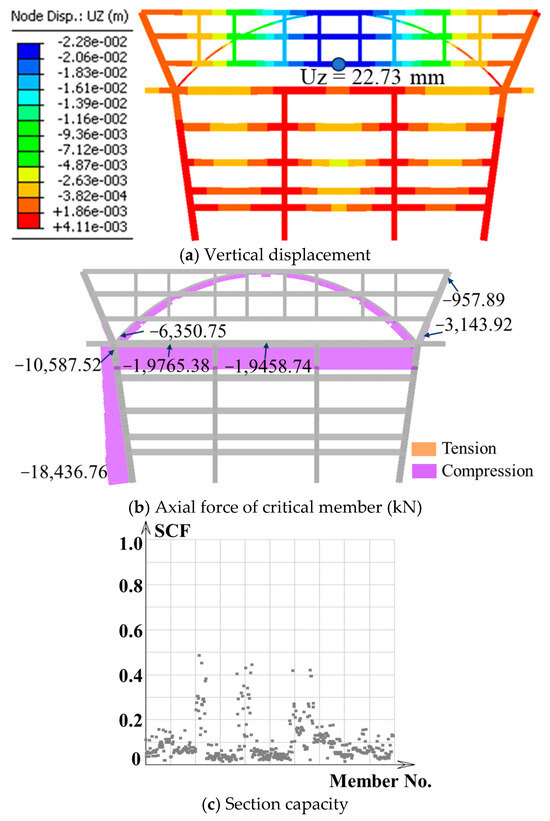
Figure 6.
Analysis results of arch elevation frame with prestress.
As shown in Figure 6, the structural vertical displacement can satisfy the deflection limitation. The tie girder’s axial force changes from tension to compression, while other member forces remain essentially unchanged. The member section capacity factors (SCFs), the ratio of member cross-sectional stress to design strength, are below 1.0, indicating that the members are stable. Therefore, to balance the force and reduce the deformation, the required prestressing force for this project is determined to be 28,000 kN.
3.2. Prestressing Force Efficiency in Mitigating Stress Losses
To compensate for prestress losses during both construction and service, the calculated loss values must be explicitly included in the initial tendon tensioning force. This section will verify the adequacy of the designed prestressing force in addressing the stressing loss. The total prestress loss is determined based on the regulation of JTG 3362-2018 [41], as shown below.
- (1)
- Frictional loss
Frictional loss can be calculated according to Equation (1).
where is the tensile control force; μ is the friction coefficient; and θ is the cumulative angle between the tangents of the curved tendon along the pipe path from the stressing end to the calculation section. For this project θ = 0; k is the influence coefficient of local deviation per meter of pipeline. For steel corrugate pipe k = 0.0015; x is the pipe length.
Therefore, the friction loss is
- (2)
- Anchorage seating
The anchorage seating encompasses deformations in the anchor wedge, bearing plate, and the cement mortar joint. According to JTG 3362-2018 [41], the seating deformation can be determined as 8 mm for this project. The cross-area of each tendon is . As the straight prestress tendons are utilized in this project, the loss due to anchorage seating can be calculated as
- (3)
- Relaxation of steel tendon
In this project, the low-relaxation tendons and overstressing method are adopted. The loss due to tendon relaxation can be conservatively calculated as
- (4)
- Concrete shortening and tensioning sequence
Concrete shortening consists of concrete elastic shortening, creep, and shrinkage. The elastic shortening loss refers to the reduction in prestress of previously tensioned tendons due to concrete compression caused by the subsequent stressing of other tendons. Additionally, concrete creep and shrinkage contribute to further shortening, leading to additional prestress loss. Directly calculating this loss is difficult due to the nonlinear interaction between prestressing force and the shortenings. In addition, the girder is a concrete-filled steel tube. A standardized method for evaluating the shortening loss in composite beams has not yet been established. Therefore, in this section, finite element analysis is carried out in ANSYS to quantify the shortening, creep, and shrinkage effects.
In this analysis, the ANSYS modified time hardening creep model is adopted, which is given in Equation (5).
where εcr, σ, t, T, and e are the creep strain, stress, time, temperature, and natural logarithm base. C1 to C4 are constant coefficients. This formula offers a straightforward and intuitive approach to capturing the time-dependent behavior of strain.
Given the museum’s location in Shenzhen, the effects of temperature variation can be considered negligible. Consequently, the temperature influences on creep and shrinkage will be disregarded. Therefore, Equation (5) can be simplified as
To facilitate a comprehensive and practical consideration of concrete creep and shrinkage effects using Equation (6), this paper aimed to determine the coefficients C1 to C3 through back-calculation based on the calculated shortening strain resulting from shrinkage and creep. The coefficients are calculated below.
- (a)
- The shrinkage of C40
Assuming the concrete starts to shrink after 3 days, the equation to represent the shrinkage strain of C40 can be written as follows [41]:
- (b) The creep of C40
The creep strain can be evaluated using the equation below.
where E is the concrete Yong’s modulus and is the creep coefficient. Prestress is applied at a concrete age of 15 days. The corresponding creep coefficient, , is provided below [41].
- (c) The coefficients of the modified time hardening creep model
The total shortening strain due to shrinkage and creep can be obtained by combining Equations (7)–(9) as
According to Equation (10), C2 can be set to 1. The concrete stress under the prestress load is approximately 15 MPa. The Yong’s modulus is 3.25 × 10⁴ N/mm2. Through the curve fitting method, the coefficients C1 and C3 can be obtained as 2.663 × 10⁻⁶ and −0.884. Therefore, Equation (6) changes to
The curves generated from Equations (10) and (11) are shown in Figure 7.
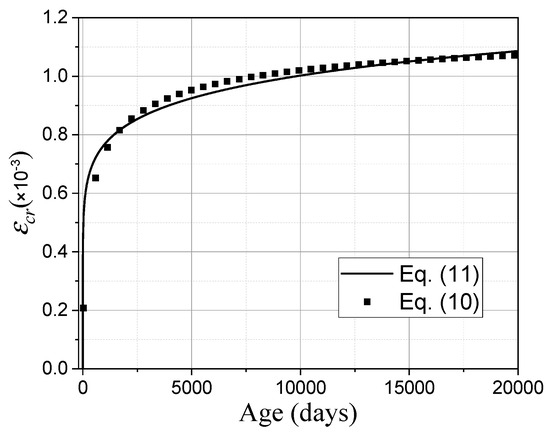
Figure 7.
The shortening strain of C40 due to shrinkage and creep.
As shown in Figure 7, creep and shrinkage strains develop rapidly within the first 2000 days, after which the rate of shortening progressively decreases. The close agreement between the predicted and measured strains proves that the derived coefficients for Equation (11) accurately model the creep and shrinkage shortening of the C40 concrete beam. This validated equation will be used in the subsequent finite element analysis.
As the prestress force is applied at the tie girder, the effects of concrete shrinkage and creep in the upper arch on prestress loss are negligible. Therefore, in ANSYS, only the composite tie girder is modeled. The finite element model is shown in Figure 8. The tendons and infilled concrete are modeled using SOLID185, while the corrugated pipes and steel tube are modeled using SHELL181. Contact interactions are modeled using CONTA174 elements for contact surfaces and TARGE170 elements for target surfaces. The friction coefficients can be set as 0.1 [42] for the steel tube–inner concrete interface and 0.7 [43] for the corrugated pipe–concrete interface. Tensioning stress is applied through the initial stress file. The birth-and-death element method is used to model the tensioning sequence. The analysis results are provided in Figure 9 and Figure 10.
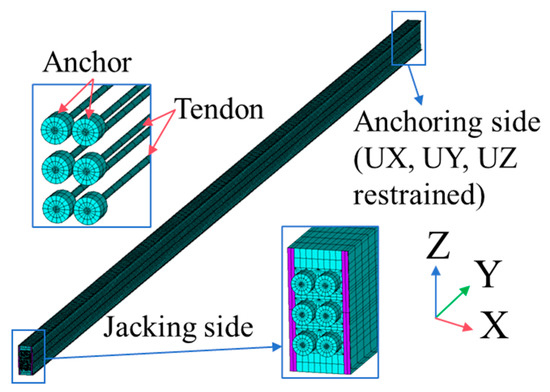
Figure 8.
Finite element model.
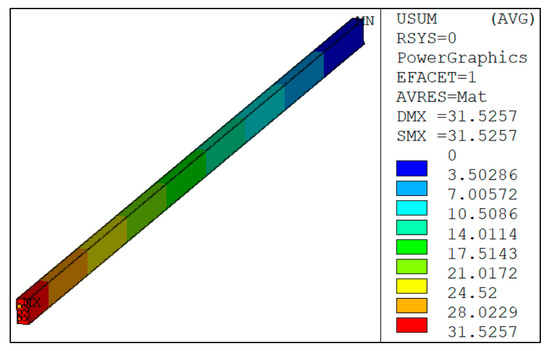
Figure 9.
Global displacements of prestressed beam (mm).
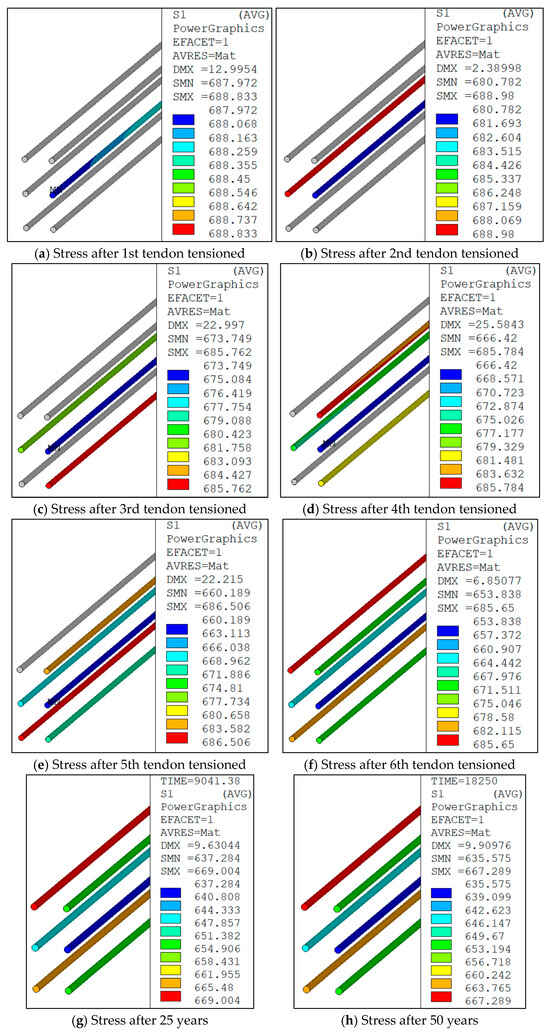
Figure 10.
Prestress variations due to tensioning sequence, creep, and shrinkage (MPa).
According to the analysis results, the overall deformation of the beam is below 71 mm, where the UX, UY, and UZ displacements are 14.88 mm, 57.52 mm, and 9.67 mm, respectively. The tensioning sequence has little effect on the beam deformation, indicating that the eccentric effect of tensioning can be neglected. Figure 10 illustrates the changes in tendon stress induced by construction and concrete shrinkage and creep.
The stress of each tendon should be 698.07 MPa under design prestress. However, according to Figure 10, after all tensioning operations are completed, due to the tensioning sequence and prestress-induced girder deformation, the stress in the first tensioned tendon decreases from 688 MPa to 654 MPa. The stress in the second, third, fourth, and fifth tensioned tendons decreased to 663 MPa, 669 MPa, 671 MPa, and 680 MPa, respectively. The maximum prestress loss due to the tensioning sequence is 34 MPa, which corresponds to approximately 5% of the initial stress, while the concrete shrinkage and creep result in an approximate prestress loss of 20 MPa. The remaining tension force of the tendons after 50 years is 636 MPa to 667 MPa. The maximum loss of the prestress is 7.56%. The remaining pre-tension at 50 years is 26,336.85 kN. Considering the other losses calculated in Equations (2)–(4), the remaining pre-tension is 219,380.195 kN. The total prestress loss is 21.65%, leaving a remaining force greater than the required 20,640 kN. Therefore, the designed prestressing force of 28,000 kN adequately satisfies the structural requirements.
4. Construction Stage Analysis
4.1. Post-Tensioning Construction Scheme
The basic post-tensioning stages are shown in Figure 11. During construction, corrugated metal pipes are first installed to form channels. A single 101.3 m steel strand and a traction rope are then mechanically pushed through these pipes. The remaining strands are then threaded through using the traction rope, as shown in Figure 12. Anchorages are installed on both ends of the composite beam. Once the concrete reaches 80% of its design strength, tendon tensioning begins progressively. Throughout this process, both tension force and tendon elongation are strictly monitored to ensure compliance with design specifications. After tensioning is completed, vacuum grouting injects cement grout into the corrugated pipes. This creates a bonded system, ensuring effective prestress transfer and long-term structural stability.
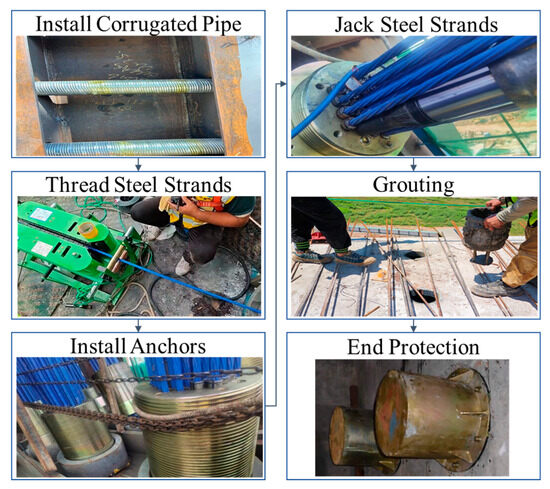
Figure 11.
Prestressed construction steps.
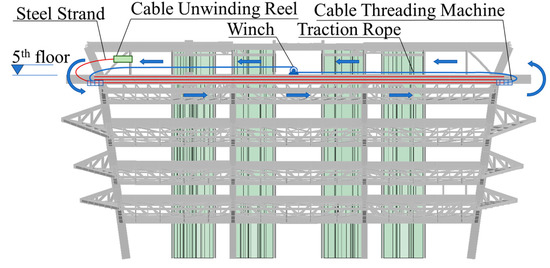
Figure 12.
Schematic diagram of prestressed construction location.
4.2. Construction Stage Analysis with Different Construction Schemes
4.2.1. Timing for Prestressing Tendon Tensioning
The structural configuration and load-bearing behavior of this project are highly complex, involving the integrated actions of the arch, columns, and floor beams. The application of prestressing forces can significantly alter the load transfer mechanism within the superstructure, potentially resulting in deviations from the intended design assumptions. Consequently, the timing of prestressing tendon tensioning is of critical importance to ensure structural performance aligns with the design.
The optimal tensioning time is after girder completion and before arch construction to prevent transferring construction loads to the upper structure. However, due to time-intensive cable threading equipment setup and limited workspace, the installation of the upper structure will proceed to keep the construction on schedule. Therefore, to evaluate the tensioning timing effects on initial structural stress distributions, a construction stage analysis will be performed in this section using NIDA. In the construction stage analysis, four construction schemes, tensioning after the 5F, 6F, and 7F beams are complete, are considered. To minimize the prestress influences on the upper inclined corner columns, the construction joints are assigned between the corner columns and beams as shown in Figure 13. The construction joints will be closed following tensioning completion. This analysis focuses on the changes in the tie girder’s internal forces and the horizontal displacement of various construction schemes. The structural self-wight and the construction load is considered. The construction load is 1.5 kN/m2, and the partial load factors for all loads are taken as 1.0. The analysis results are illustrated and compared in Section 4.2.2. The force variations in the critical members, N5 and NZ, are discussed.
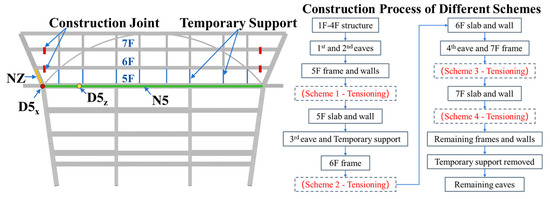
Figure 13.
Location of measuring point and construction schemes.
4.2.2. Construction Analysis Results of Different Construction Schemes
The structural global vertical deformation when the construction is finished is given in Figure 14. According to the results, the different tensioning sequences have limited influence on global structure deformation. However, localized differences can be found at the marked area with black circles in the figure, which can be found in the region adjacent to the arch elevation frame. At these locations, Schemes 2–4 exhibit greater vertical displacements than Scheme 1. A detailed analysis of these variations focused on the arch elevation frames is provided in the subsequent paragraphs. Maximum deformation occurs in the slabs farthest from the concrete core walls, reaching L/545 of the span length, which complies with serviceability requirements.
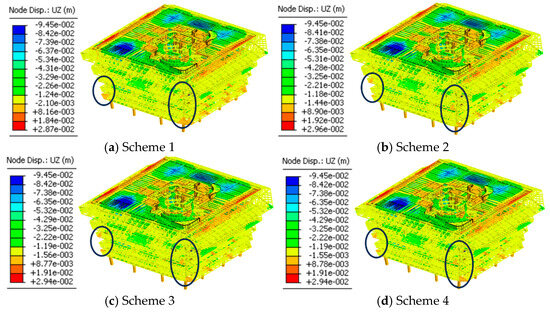
Figure 14.
Global deformation of structure with localized differences marked.
The SCFs of all members including the temporary supports calculated with the direct analysis method are plotted in Figure 15. As shown in the figure, the SCFs are below 0.9, which indicates that the structure is safe during construction.
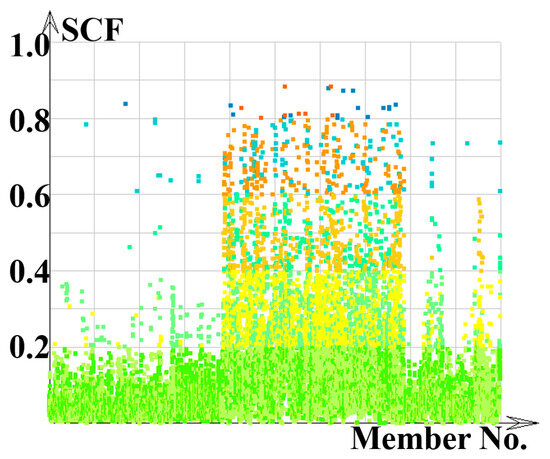
Figure 15.
Section capacity factors.
Figure 16, Figure 17, Figure 18 and Figure 19 illustrate the horizontal displacement, vertical displacement, axial force, and bending moment of the arch elevation frame. The internal force variations in the critical member are shown in Figure 20.
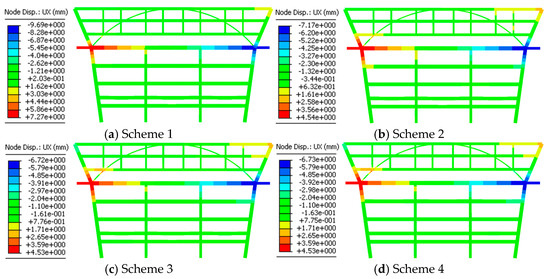
Figure 16.
Horizontal deformation after construction.
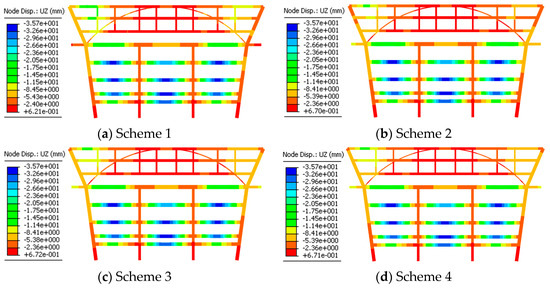
Figure 17.
Vertical deformation after construction.
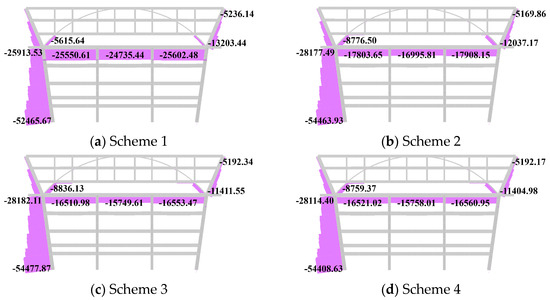
Figure 18.
Axial force after construction (kN).
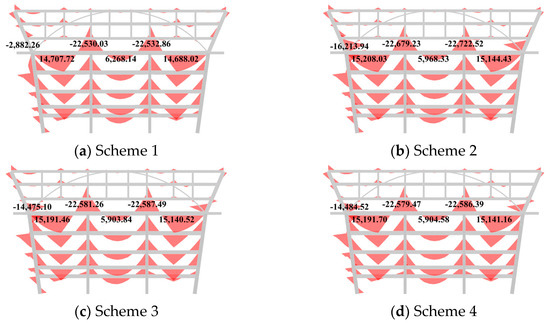
Figure 19.
Bending moment after construction (kN·m).
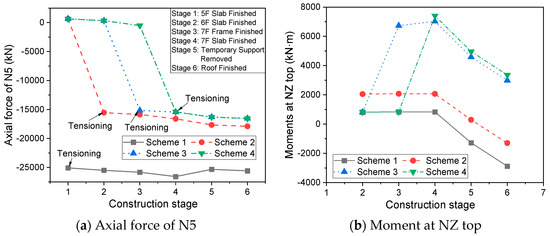
Figure 20.
Internal force variation in critical members.
According to Figure 16 and Figure 17, the prestress has a limited effect on the horizontal and vertical displacements of the arch elevation frame. The horizontal displacements at point D5x of the four schemes after the construction finished are 7.23 mm, 4.54 mm, 4.12 mm, and 4.12 mm. The vertical displacements at point D5z are 16.83 mm, 17.86 mm, 17.90 mm, and 17.90 mm. The impact of the sequences in Schemes 2–4 is similar, while Scheme 1 demonstrates improved vertical displacement performance. The axial forces of the girder for Schemes 1–4 are compression, with values of 25,602.48 kN, 17,908.15 kN, 16,553.47 kN, and 16,562.16 kN, respectively, as shown in Figure 18. The axial force of Scheme 1 most closely matches the design prestress force, indicating that Scheme 1 experiences the lowest overall prestress loss. In addition, the bending moment at the corner column NZ bottom in Scheme 1 is smallest. This suggests that in Schemes 2–4, part of the prestress is carried by the corner column and transferred to the sixth and seventh floors after tensioning, which deviates from the intended load transfer path in the design and results in prestress loss. According to Figure 19 and Figure 20b, Schemes 3 and 4 alter the moment distribution of NZ from single-curvature bending to double-curvature bending due to the early participation of the floor beam, which can help to reduce the bending moment at NZ bottom compared to Scheme 2. According to Figure 19a, the differences in N5 axial force between Schemes 2–4 are not obvious, indicating that the pre-tension effects of Schemes 2–4 are similar. Therefore, while Scheme 1 is technically optimal and recommended for construction, Scheme 4 is suggested to avoid construction delays.
5. Conclusions
This paper addresses challenges in ultra-long bonded prestressed structures by examining the prestress design and construction techniques of composite tie girders, using the Shenzhen Museum project with its 94.34 m tendons as a case study. A novel method for evaluating prestress loss incorporating concrete shrinkage and creep effects is proposed. The influence of tensioning timing on structural response is analyzed, and an optimized construction scheme balancing structural performance with schedule efficiency is developed. The findings will provide practical references for the design and construction of ultra-long-span prestressed composite members. Key findings include the following:
- The Shenzhen Museum project represents a pioneering application of a long-span arch with prestress tie girders in building structures. The application of the arch structure optimizes the load transmission path, reduces bending moments, and avoids local stress concentrations. This enables the design of a column-free, large-span exhibition space, meeting the museum’s functional requirement for an open layout.
- The use of 101.3 m steel strands imposes exceptionally demanding requirements on prestress design. To ensure the effectiveness of prestressing, a novel numerical method to quantify long-term prestress loss in composite girders is developed. For this 94.34 m girder, the total stress loss can be 21.65% after 50 years, where the fiction loss accounts for half.
- Prestressing operations typically require substantial working space. Due to the restricted site on the museum’s fifth floor, the traction rope method was proposed to overcome spatial constraints. The project implementation demonstrates that this method not only facilitates strand installation by guiding tendons through corrugated pipes but also minimizes frictional resistance and positional deviations in long-tendon prestressing.
- The construction sequence critically influences prestress performance. Among the four schemes evaluated, Scheme 1 demonstrates the smallest reduction in girder pre-tension force, indicating minimal construction-induced prestress losses. It is recommended to tension tendons at the earliest feasible stage to minimize prestress losses from complex force transfer paths. Nevertheless, to meet schedule requirements, the strategic placement of construction joints as demonstrated for the other schemes can achieve acceptable prestress and internal force distributions.
Author Contributions
Data curation, L.H., X.S. and W.D.; resource, L.H.; project administration, X.S.; investigation, W.D. and H.W.; formal analysis, W.D. and R.B.; validation, H.W.; writing—original draft, D.L.; writing—review & editing, R.B. and H.W.; supervision, R.B. All authors have read and agreed to the published version of the manuscript.
Funding
This research received no external funding.
Data Availability Statement
The original contributions presented in this study are included in the article. Further inquiries can be directed to the corresponding author.
Conflicts of Interest
Authors Le-Hua Huang, Wei Dai and Huan Wang were employed by the company China Construction Steel Structure Corporation Ltd. Author Xiang-Gang Su was employed by the company China Construction Science and Industry Corporation Ltd. The remaining authors declare that the research was conducted in the absence of any commercial or financial relationships that could be construed as a potential conflict of interest.
References
- Hurst, M.K. Prestressed Concrete Design; CRC Press: London, UK, 2017. [Google Scholar]
- Kraľovanec, J.; Moravčík, M.; Jošt, J. Analysis of prestressing in precast prestressed concrete beams. Civ. Environ. Eng. 2021, 17, 184–191. [Google Scholar] [CrossRef]
- Angélica, A.C.; Gonzalez-Libreros, J.; Wang, C.; Capacci, L.; Biondini, F.; Elfgren, L.; Sas, G. Assessment of residual prestress in existing concrete bridges: The Kalix bridge. Eng. Struct. 2024, 311, 118194. [Google Scholar] [CrossRef]
- Sanabra-Loewe, M.; Capellà-Llovera, J. The four ages of early prestressed concrete structures. PCI J. 2014, 59, 93–121. [Google Scholar] [CrossRef][Green Version]
- Buonomo, M.; Servant, C.; Virlogeux, M.; Cremer, J.-M.; de Ville De Goyet, V.; Forno, J. The design and the construction of the Millau Viaduct. Steelbridge 2004, 2004, 165–182. [Google Scholar][Green Version]
- Knoll, F.; Prosser, M.J.; Otter, J. Prestressing the CN Tower. Prestress. Concr. Inst. J. 1976, 21, 84–111. [Google Scholar][Green Version]
- Bauersfeld, W. Projection planetarium and shell construction. Proc. Inst. Mech. Eng. 1957, 171, 75–80. [Google Scholar] [CrossRef]
- Stracchi, P.; Cardellicchio, L.; Tombesi, P. Not really an aftermath. The role of actual construction in the design process of the Sydney Opera House roof. Front. Archit. Res. 2023, 12, 242–265. [Google Scholar] [CrossRef]
- Lin, Y.; Zhang, Z.; Biao, M.; Zhou, L. Lupu arch bridge, Shanghai. Struct. Eng. Int. 2004, 14, 24–26. [Google Scholar] [CrossRef]
- Cross, E. Post-tensioning in building structures. Concr. Aust. 2007, 33, 48–54. [Google Scholar]
- He, Z.-Q.; Zhuo, W.; Jiang, Y.; Zhang, S.; Liu, Z.; Ma, Z.J. Transverse post-tensioning in long-span concrete box-girder bridges: Refined modeling and alternative system. J. Bridge Eng. 2020, 25, 4020005. [Google Scholar] [CrossRef]
- Srilaxmi, V.; Manju, K.; Vijaya, M. A case study on pre-tensioning & post tensioning systems of a pre-stressed concrete. Int. J. Eng. Technol. Manag. Res. 2020, 5, 249–254. [Google Scholar]
- Au, F.; Du, J. Prediction of ultimate stress in unbonded prestressed tendons. Mag. Concr. Res. 2004, 56, 1–11. [Google Scholar] [CrossRef][Green Version]
- Abdelhalim, J. Prestressed Concrete Slabs with Bonded and Unbonded Tendons. Master’s Thesis, The American University in Cairo, Cairo, Egypt, 2021. [Google Scholar]
- Bobek, L.; Klusáček, L.; Svoboda, A. Effective strengthening of reinforced concrete corbels using post-tensioning. Eng. Struct. 2024, 305, 117716. [Google Scholar] [CrossRef]
- Klusáček, L.; Nečas, R.; Požár, M.; Pěkník, R.; Svoboda, A. Transverse prestressing and reinforced concrete as the key to restoration of masonry arch bridges. Eng. Struct. 2021, 245, 112898. [Google Scholar] [CrossRef]
- El Menoufy, A.; Soudki, K. Effects of various environmental exposures and sustained load levels on the service life of postinstalled adhesive anchors. J. Mater. Civ. Eng. 2014, 26, 863–871. [Google Scholar] [CrossRef]
- Breccolotti, M.; Materazzi, A. Prestress losses and camber growth in wing-shaped structural members. PCI J. 2015, 60, 98–117. [Google Scholar] [CrossRef]
- Bujňáková, P.; Strieška, M. Development of precast concrete bridges during the last 50 years in Slovakia. Procedia Eng. 2017, 192, 75–79. [Google Scholar] [CrossRef]
- Bonopera, M.; Chang, K.C.; Lee, Z.K. State-of-the-art review on determining prestress losses in prestressed concrete girders. Appl. Sci. 2020, 10, 7257. [Google Scholar] [CrossRef]
- Wang, W.; Gong, J.; Wu, X.; Wang, X. A general equation for estimation of time-dependent prestress losses in prestressed concrete members. Structures 2023, 55, 278–293. [Google Scholar] [CrossRef]
- Garber, D.B.; Gallardo, J.M.; Deschenes, D.J.; Bayrak, O. Prestress loss calculations: Another perspective. PCI J. 2016, 61, 68–85. [Google Scholar] [CrossRef]
- Sun, B.; Feng, W.; Yang, Y.; Wang, R.; Yang, C. Comparative study on dynamic and static relaxation of steel strands in PC girder bridges. Structures 2025, 71, 108119. [Google Scholar] [CrossRef]
- Han, W.; Tian, P.; Lv, Y.; Zou, C.; Liu, T. Long-term prestress loss calculation considering the interaction of concrete shrinkage, concrete creep, and stress relaxation. Materials 2023, 16, 2452. [Google Scholar] [CrossRef] [PubMed]
- Kim, S.-T.; Park, Y.-S.; Yoo, C.-H.; Shin, S.; Park, Y.-H. Analysis of Long-Term Prestress Loss in Prestressed Concrete (PC) Structures Using Fiber Bragg Grating (FBG) Sensor-Embedded PC Strands. Appl. Sci. 2021, 11, 12153. [Google Scholar] [CrossRef]
- Fraga, I.F.; Sartorti, A.L.; Mascarenhas, F.J.R.; Almeida, J.P.B.; de Moraes, M.H.M.; Christoforo, A.L. Computational implementation of alternative method for determining the loss of prestressing by deformation of the anchorage in post-tensioning. Acta Sci. Technol. 2024, 46, 62978. [Google Scholar] [CrossRef]
- Yu, Q.; Sun, Q.; Liu, J. Friction test and parameter analysis of prestressed concrete continuous beam bridge. Stavební Obz.-Civ. Eng. J. 2023, 32, 54–69. [Google Scholar] [CrossRef]
- Caro, L.A.; Martí-Vargas, J.R.; Serna, P. Prestress losses evaluation in prestressed concrete prismatic specimens. Eng. Struct. 2013, 48, 704–715. [Google Scholar] [CrossRef]
- Ke, W.; Huang, X.; Ma, L.; Yu, Y.; Kang, J. The Influence of Tension Sequence of Prestressing Steel beam on Prestress Loss. In Proceedings of the 2017 5th International Conference on Machinery, Materials and Computing Technology (ICMMCT 2017), Beijing, China, 25–26 March 2017; pp. 449–453. [Google Scholar]
- Abdel-Jaber, H.; Glisic, B. Monitoring of prestressing forces in prestressed concrete structures—An overview. Struct. Control Health Monit. 2019, 26, e2374. [Google Scholar] [CrossRef]
- Zanini, M.A.; Faleschini, F.; Pellegrino, C. New trends in assessing the prestress loss in post-tensioned concrete bridges. Front. Built Environ. 2022, 8, 956066. [Google Scholar] [CrossRef]
- Cao, G.H.; Hu, J.X.; Zhang, K. Coupling model for calculating prestress loss caused by relaxation loss, shrinkage, and creep of concrete. J. Cent. South Univ. 2016, 23, 470–478. [Google Scholar] [CrossRef]
- Meng, Q.; Zhu, J.; Wang, T. Numerical prediction of long-term deformation for prestressed concrete bridges under random heavy traffic loads. J. Bridge Eng. 2019, 24, 4019107. [Google Scholar] [CrossRef]
- Yang, M.; Gong, J.; Yang, X. Refined calculation of time-dependent prestress losses in prestressed concrete girders. Struct. Infrastruct. Eng. 2020, 16, 1430–1446. [Google Scholar] [CrossRef]
- Xiao, J.; Peng, J.; Yang, Y.; Dong, Y.; Cheng, X.; Zhang, J. Comprehensive assessment of prestress loss in post-tensioned prestressed concrete structures exposed to wet-dry cycles in chloride environments. Eng. Struct. 2025, 328, 119691. [Google Scholar] [CrossRef]
- Mohebbi, A.; Graybeal, B. Prestress loss model for ultra-high performance concrete. Eng. Struct. 2022, 252, 113645. [Google Scholar] [CrossRef]
- Liu, Y.; Du, Z.; He, J.; Ding, Z.; Chan, S.; Chen, W. Recent development and implementation of direct analysis in NIDA. In Proceedings of the 9th International Conference on Advances in Steel Structures (ICASS 2018), Hong Kong, China, 5–7 December 2018. [Google Scholar]
- Zhang, Z.J.; Chen, B.S.; Bai, R.; Liu, Y.P. Non-linear behavior and design of steel structures: Review and outlook. Buildings 2023, 13, 2111. [Google Scholar] [CrossRef]
- GB50009-2012; Load Code for the Design of Building Structures. China Building Industry Press: Beijing, China, 2012.
- GB50017-2017; Standard for Design of Steel Structures. China Building Industry Press: Beijing, China, 2017.
- JTG3362-2018; Specifications for Design of Highway Reinforced Concrete and Prestressed Concrete Bridges and Culverts. People’s Communications Press Co., Ltd.: Beijing, China, 2018.
- BS5975-2:2024; Temporary Works—Falsework: Design and Implementation. Code of Practice. BSI Standards Limited: London, UK, 2024.
- ACI-318-19; Building Code Requirements for Structural Concrete and Commentary. American Concrete Institute: Farmington Hills, MI, USA, 2022.
Disclaimer/Publisher’s Note: The statements, opinions and data contained in all publications are solely those of the individual author(s) and contributor(s) and not of MDPI and/or the editor(s). MDPI and/or the editor(s) disclaim responsibility for any injury to people or property resulting from any ideas, methods, instructions or products referred to in the content. |
© 2025 by the authors. Licensee MDPI, Basel, Switzerland. This article is an open access article distributed under the terms and conditions of the Creative Commons Attribution (CC BY) license (https://creativecommons.org/licenses/by/4.0/).