Article

Acoustic Emission Assisted Inspection of Punching Shear Failure in Reinforced Concrete Slab–Column Structures

1
College of Civil Engineering, Nanjing Tech University, Nanjing 211816, China
2
School of Civil & Environmental Engineering, Nanyang Technological University, Singapore 639798, Singapore
3
School of Civil Engineering, Zhejiang University, Hangzhou 310058, China
4
Ningbo Langda Technology Co., Ltd., Ningbo 315000, China
*
Author to whom correspondence should be addressed.
Buildings 2025, 15(17), 3226; https://doi.org/10.3390/buildings15173226
Submission received: 16 August 2025 / Revised: 1 September 2025 / Accepted: 5 September 2025 / Published: 7 September 2025
(This article belongs to the Special Issue The Application of Intelligence Techniques in Construction Materials)

Abstract

Slab–column structures are susceptible to sudden punching shear failure at connections due to the absence of traditional beam support, prompting the need for effective damage monitoring. This study employs an acoustic emission (AE) technique to investigate the failure process of reinforced concrete slab–column specimens, analyzing basic AE parameters (hits, amplitude, energy), improved b-value (Ib-value), and RA–AF correlation, while introducing a Gaussian Mixture Model (GMM) to establish a unified index integrating crack type identification and energy information. Experimental results show that AE parameters can effectively track different stages of crack development, with Ib-value reflecting the transition from micro-crack to macro-crack growth. The correlation between AE energy and structural strain energy enables quantitative damage assessment, while RA–AF analysis and GMM clustering reveal the shift from bending-dominated to shear-dominated failure modes. This study provides a comprehensive framework for real-time damage evaluation and failure mode prediction in slab–column structures, demonstrating that AE-based multi-parameter analysis and data-driven clustering methods can characterize damage evolution and improve the reliability of structural health monitoring.

1. Introduction

Slab–column structures are widely employed in high-rise buildings and large-span venues due to their advantages of convenient construction and flexible spatial layout. However, the absence of traditional beam shear support renders critical load-bearing zones, particularly the slab–column connections, vulnerable to sudden brittle punching shear failure. This failure mode is characterized by abrupt concrete spalling and reinforcement slippage, exhibiting insufficient ductility and minimal pre-failure warning signs. Substantial experimental and theoretical research has been conducted on the punching shear behavior of slab–column systems [1,2,3]. For instance, Elstner and Hognestad [4] conducted the first punching tests on conventional slab–column specimens. These foundational tests investigated parameters like concrete strength and reinforcement ratio, establishing a basis for punching shear research. Based on the punching shear tests by scholars, Muttoni [5] proposed a punching shear failure criterion based on the critical shear crack theory and established a load–rotation relationship model for slabs. Most structural design codes employ distinct empirical/semi-empirical methods for punching shear resistance, primarily focusing on shear stress around a critical perimeter near the column. Eurocode 2 [6] considers key parameters including concrete strength, reinforcement ratio, slab effective depth, and column size/perimeter. Its critical perimeter is set at 2 d from the column face with rounded corners. In the ACI 318 [7] method, the basic shear perimeter is taken at a distance of 0.5 d from the column face. In recent years, researchers have gradually turned their attention to the load-carrying capacity degradation of slab–column structures and the performance reinforcement based on high-performance materials. Yang et al. [8] experimentally and numerically investigated the impact of corrosion on the behavior and failure modes of an RC slab-column. It was found that the corrosion level of reinforcement significantly affects the failure mode of the slab. Advanced concrete materials such as high strength concrete (HSC) [9,10], fiber reinforced concrete (FRC) [11,12], and ultra-high performance fiber reinforced concrete (UHPFRC) [13,14] have gradually attracted the attention of researchers, who have carried out theoretical and experimental studies to verify their effectiveness. Due to the suddenness of punching shear failure, it is of great significance to detect damage in slab–column structures in advance based on monitoring methods, especially to establish the correlation between monitoring data and indicators such as damage degree and damage type. The acoustic emission (AE) technique is a widely used monitoring method in mechanical engineering, rock excavation, and civil engineering. It operates based on elastic waves generated from damage sites within materials, enabling researchers to assess the damage state without frequent visual inspections. For different types of RC components, researchers have carried out monitoring studies based on AE and demonstrated its effectiveness in the field of RC structures [15,16,17,18,19]. In terms of RC slab, Yuyama et al. [20] evaluated the fatigue damage under cyclic loading based on the AE technique and found that AE energy can be an effective parameter in the evaluation process. Shan et al. [21] conducted an acoustic emission study on the precast pre-stressed concrete composite slab under static loading and proposed a damage fracture classification method based on fuzzy C-means clustering. However, existing studies mainly focus on the bending stress of structures and cannot well reflect the punching damage process and the changes in acoustic emission indicators during this process. Therefore, it is necessary to carry out relevant research.
In the damage assessment of concrete structures using AE technology, multiple parameters are involved. Among them, the basic parameters include hit, amplitude, rise time, duration, energy, etc. Prasad and Sagar [22] proposed the relationship between AE and fracture energy based on various sizes of concrete specimens. Ma and Du [23] found that high-amplitude AE waves generally correspond to high loads, and their amplitude is also influenced by concrete strength. Comprehensive AE parameters achieve evaluation of the damage state by statistically analyzing basic parameters or extending their physical meanings, and the most famous one among them is the analysis of the b-value. The b-value is based on the Gutenberg–Richter law, reflecting the logarithmic relationship between amplitude and event count. A high b-value indicates micro-crack dominance (less damage), while a low b-value corresponds to macro-cracks (severe damage) [24,25]. In addition, indicators such as the relaxation ratio [26] and peak cumulative signal strength [27] can be used to determine the damage degree of concrete structures. Prem et al. [28] proposed the AE ductility index and found that it is negatively correlated with structural ductility, which can be used to predict failure modes. With the development of data-driven technologies, artificial neural network (ANN) [29], principal component analysis (PCA) [30], and other techniques have been applied to pattern recognition of AE parameters. Although research has been conducted on relevant AE parameters, the development of comprehensive indicators that can fully integrate multiple basic parameters and their application to the punching shear failure of slab–column structures still warrants in-depth investigation.
In this paper, the punching shear failure process of slab–column structures is studied based on the acoustic emission technique. A reinforced concrete slab–column specimen was experimentally monitored. Key AE parameters (hits, amplitude, energy), Ib-value (improved b-value), and RA–AF correlation were analyzed to characterize damage development. The Gaussian Mixture Model clustering method was employed to establish the Membership Degree of Crack Type index, integrating crack type identification with energy information. This study primarily focuses on addressing the aforementioned limitations; it aims to establish a damage assessment method based on fundamental acoustic emission parameters specifically for the punching shear failure of slab–column structures, and innovatively integrates the improved b-value, RA–AF analysis, and Gaussian Mixture Model to construct the unified Membership Degree of Crack Type index. This index combines crack type and energy information, enabling dynamic tracking of crack evolution from micro to macro scales. The study reveals the correlation between AE parameters and crack development stages, quantifies damage degree through AE energy-strain energy synchronization, and confirms the transition from bending to punching shear failure via MDCT-AE energy analysis. The findings provide a comprehensive framework for real-time damage assessment and failure mode prediction in slab–column structures.

2. Experimental Test

2.1. Specimen Specification

One RC slab specimen is prepared and tested in the current study. The prototype design of the specimen is based on the ACI 318 code, with a span of 5 m. The actual tested reinforced concrete slab specimen has a length and width of 2200 mm each and a thickness of 150 mm. The reinforced concrete column is located at the center of the lower part of the slab, with a length and width of 200 mm each. Regarding reinforcement, the upper layer of the slab is reinforced with 18 T14 bars spaced ranging from 80 mm to 128 mm, with a reinforcement ratio of 1.0%. The reinforcement is arranged the same in two directions. The lower layer is reinforced with T10 bars spaced at 260 mm, complying with the code requirements, as shown in Figure 1. This scale was chosen primarily to match the laboratory loading capacity while preserving key mechanical characteristics of the prototype structure. Based on the concrete cylinder tests, the compressive strength of the concrete for this specimen is 48 MPa. The yield strength, ultimate strength, and other mechanical properties of the reinforcement steel were obtained through experimental testing, with specific values detailed in Table 1.

2.2. Loading Setup

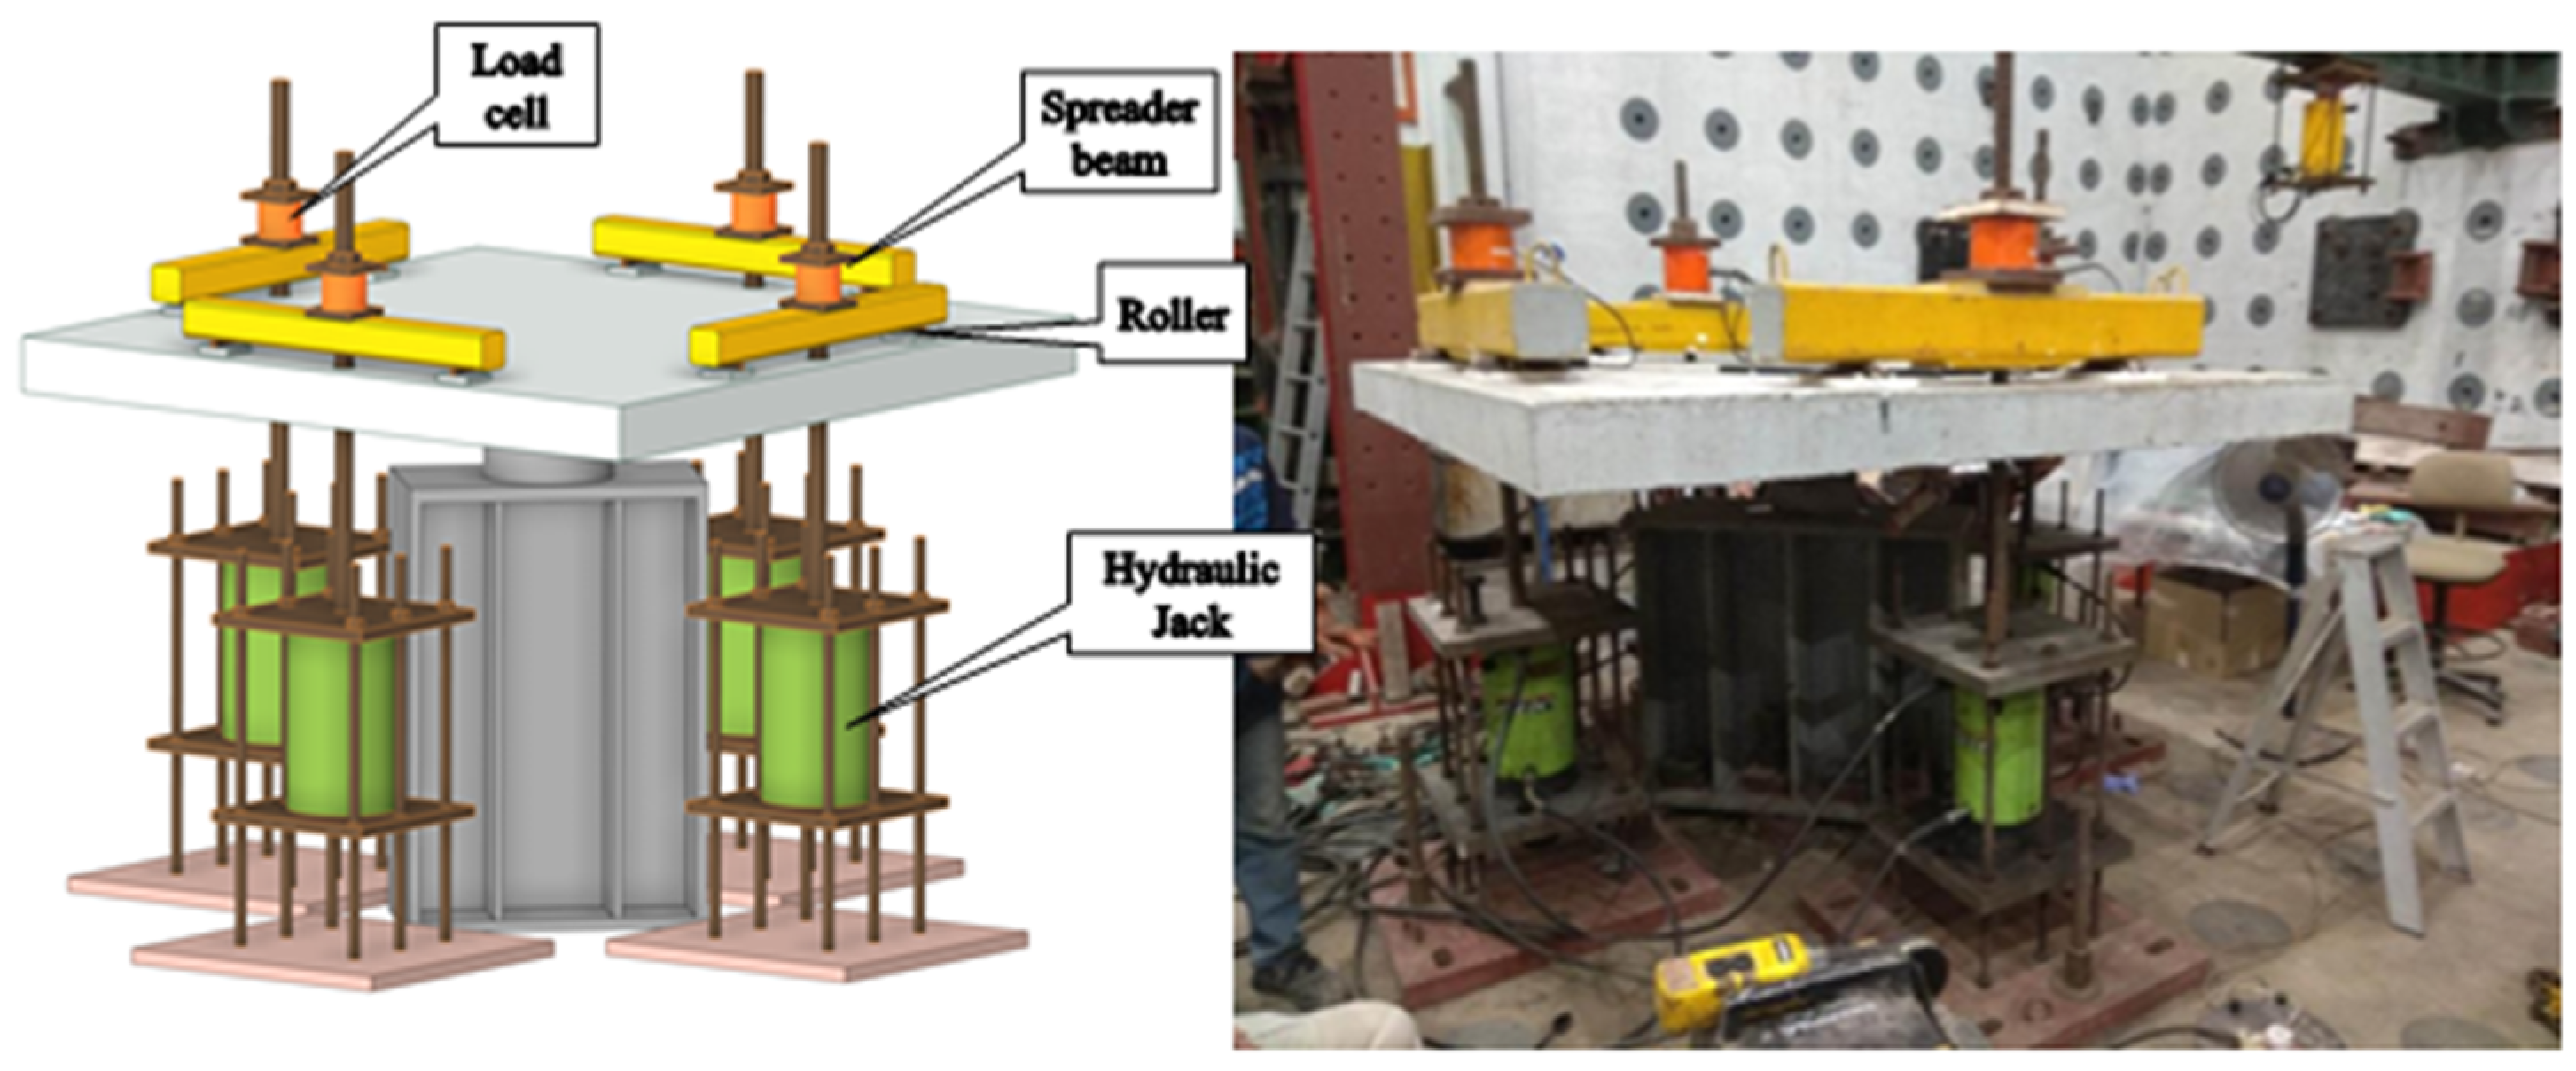
In this experiment, the column at the bottom of the specimen is fixed to the bottom steel support to ensure the overall stability of the structure. Around the reinforced concrete slab, hydraulic jacks apply loads, which are then evenly distributed onto the slab through distribution beams, as shown in Figure 2. The upper end of the distribution beam is equipped with load cells to record the magnitude of the load, with the final load magnitude being the sum of the loads recorded by the four load cells. The jacks on all four sides are connected to the same pump to maintain the same load magnitude, ensuring the balance of the overall structure. The entire specimen is painted white, and the positions of the reinforcing bars are marked for subsequent analysis of the test results.
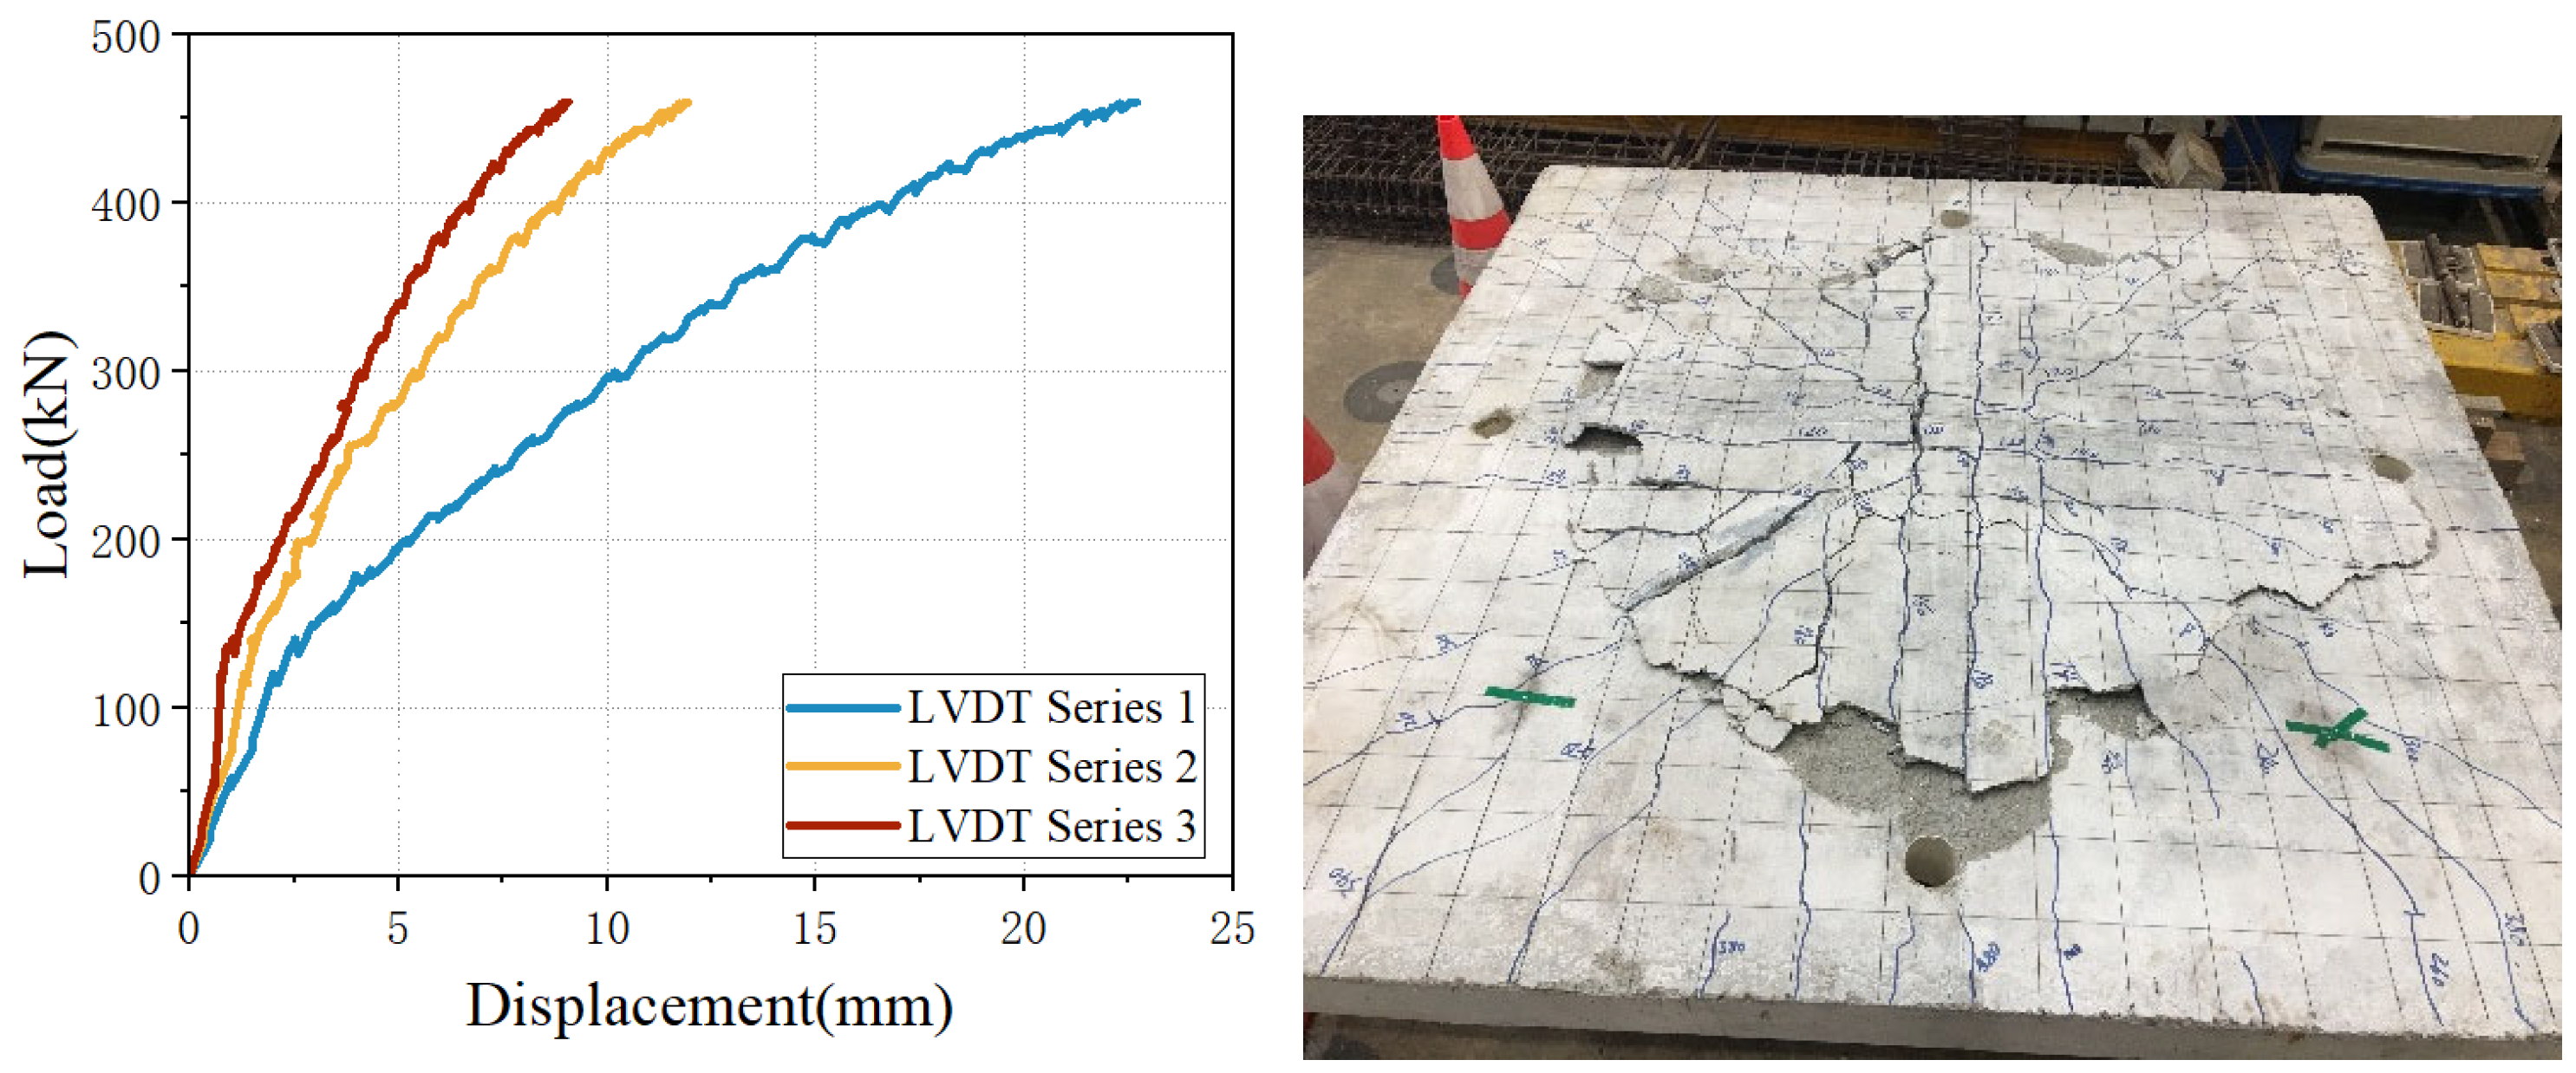
During the experiment, the load was applied in increments of 20 kilonewtons, with each hydraulic jack applying 5 kilonewtons, and the loading was carried out step by step. Linear Variable Differential Transformers (LVDTs) were used to record the vertical displacements. They were placed at the middle position on the edge of the slab, which is the loading point (LVDT series 1), near the column in the middle of the slab (LVDT series 3), and at the position between the two (LVDT series 2). Strain gauges were employed to record the strain data of the reinforcement in the upper layer of the slab. The development of cracks during the experiment was documented using blue lines.

2.3. AE System

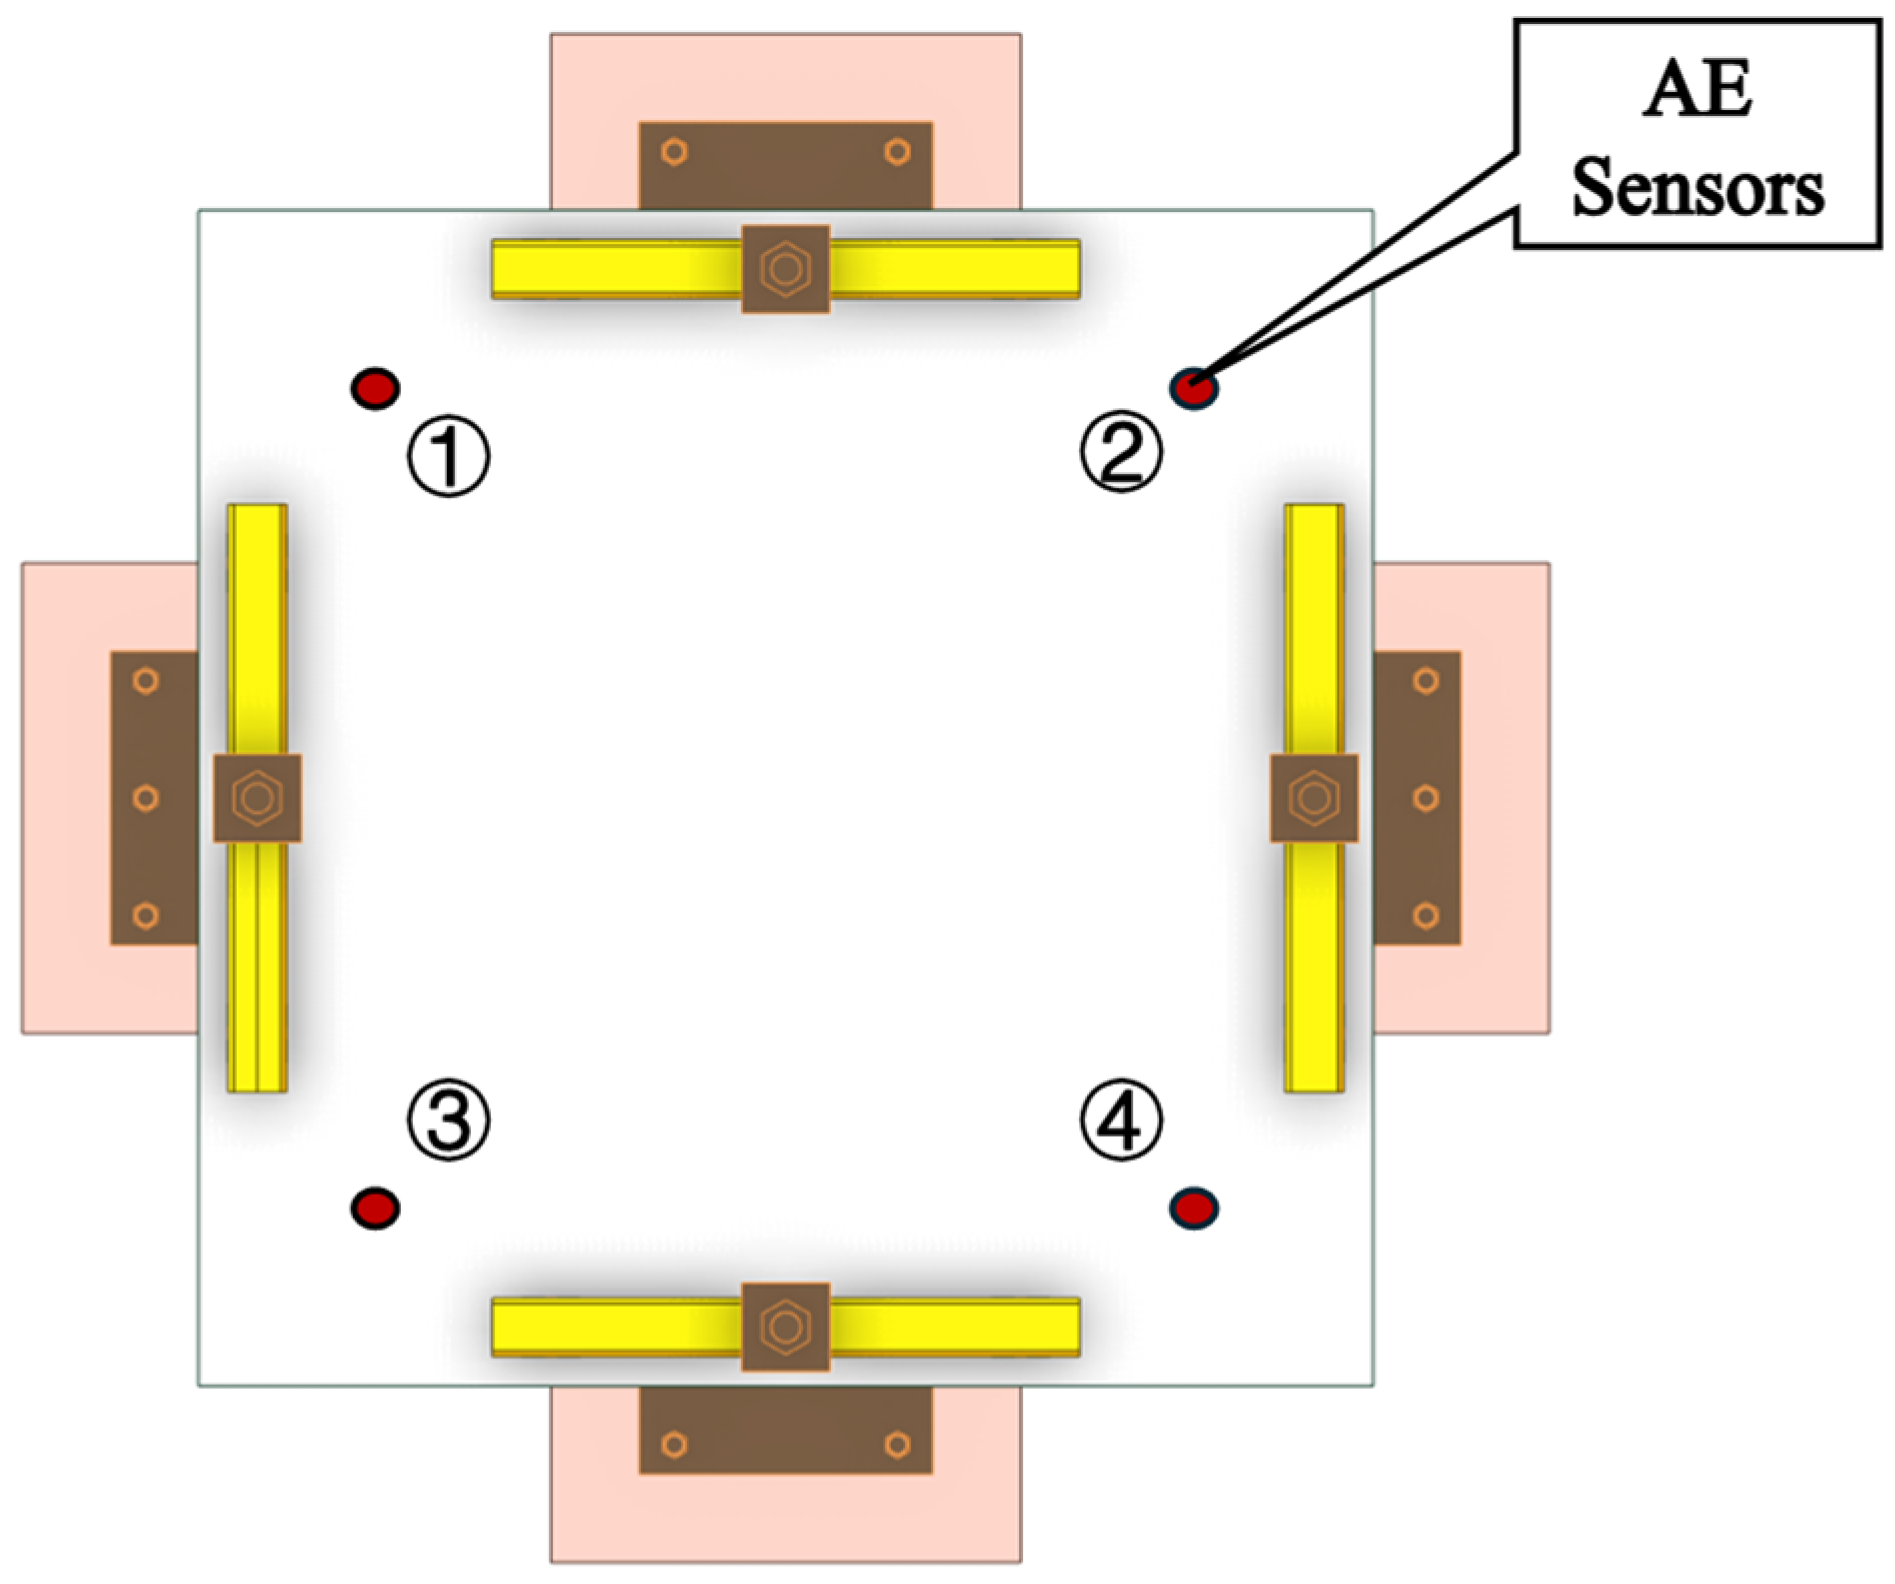
In this experimental setup, a 16-channel Micro-II Digital AE System, manufactured by Physical Acoustics Corporation (Princeton Junction, NJ 08550, United States), was utilized to capture acoustic emission (AE) signals generated during the crack propagation process. The AEwin software suite was employed for data storage and real-time signal monitoring. The system’s reliability, along with the software’s performance, has been extensively verified and validated in numerous prior studies [14,17]. Four AE sensors were mounted on the corners of the specimens using silicon sealant and secured with elastic tape. Each sensor was positioned approximately 470 mm from the edges, as depicted in Figure 3. This symmetric layout minimizes directional bias in signal reception and enables capturing spatial variations in damage. The sensors were interfaced with a preamplifier, set at a gain of 40 dB, which was directly connected to the main acquisition board. Prior to initiating the cyclic loading tests, a series of pencil lead break tests were performed on each sensor to ensure their operational integrity and the quality of their attachment to the specimen. The acquisition threshold was established at 40 dB, a level determined by assessing both ambient noise conditions and the results from the lead break tests. Configuration of the filtering system included setting low-pass and high-pass filters across all channels to 20 kHz and 400 kHz, respectively. Tailoring to the characteristics of the concrete material, the timing parameters were adjusted with the peak definition time at 50 μs, hit definition time at 150 μs, and hit lockout time at 300 μs. Throughout the testing phase, critical acoustic emission parameters such as energy release, amplitude, event counts, duration of emissions, and risetime were meticulously documented, alongside the strain measurements of the embedded reinforcement within the specimen. It should be noted that this experiment still has some limitations. For example, low-level background noise from equipment operation and loading adjustments might still have slightly affected signal capture, especially in the early loading stage when AE signals were weak. Minor inherent differences in their response characteristics could have led to slight discrepancies in signal detection efficiency.

3. Experiment Results and Analysis

3.1. Load–Displacement Curve and Observed Cracks

Based on the data recorded by LVDTs and load cells, the load–displacement relationship curve of the test specimen can be plotted, as shown in Figure 4. In the figure, the displacement represents the average value recorded by symmetrically arranged LVDTs, while the load value is the sum of the readings from four load cells. It can be observed that the test specimen achieved a maximum load of 442 kN, and the failure mode was characterized as punching shear failure.
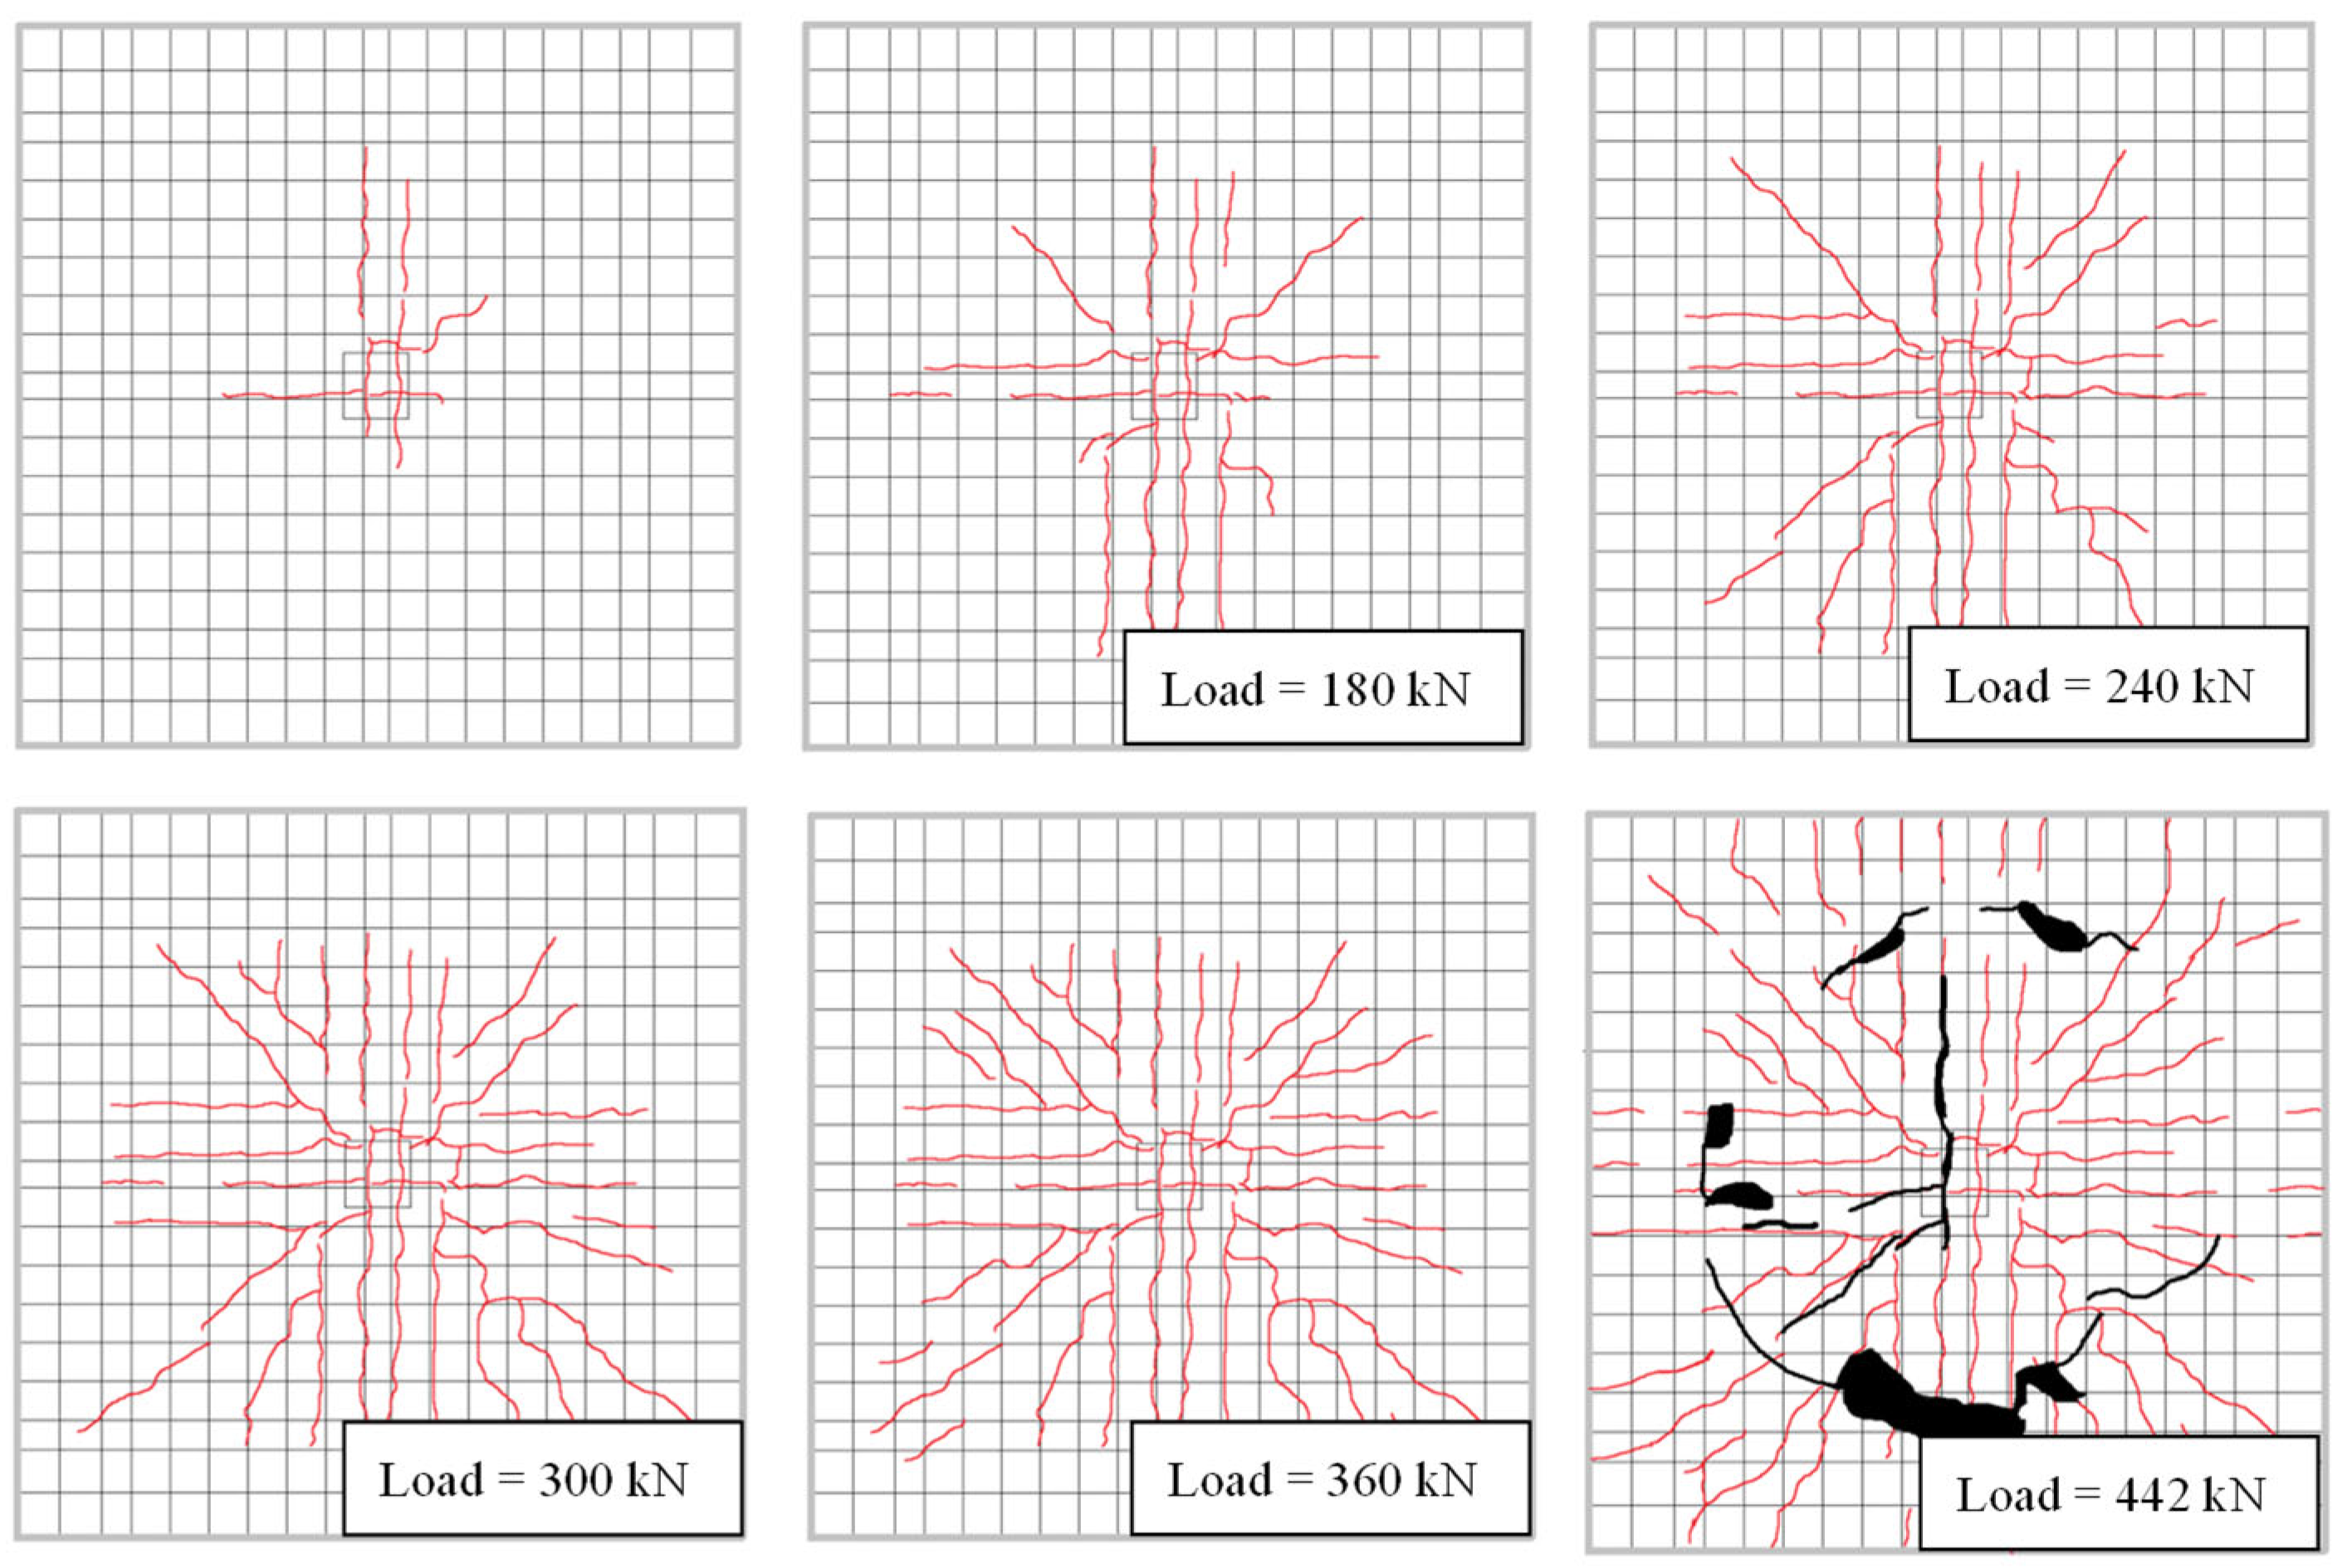
The cracks in the specimen at different loading stages are illustrated in Figure 5. The first noticeable cracks emerged when the load increased to 120 kN, radiating from the center towards the periphery. As the load continued to rise, both the number and width of the cracks correspondingly increased. When the load increased to 180 kN, circumferential cracks began to form around the center of the specimen. As the load further increased, the radius of these circumferential cracks expanded accordingly. When the load reached the ultimate bearing capacity, the width of the circumferential cracks increased, accompanied by concrete spalling, exhibiting distinct characteristics of punching shear failure.

3.2. AE Parameters Analysis and Damage Assessment

3.2.1. AE Hits Analysis

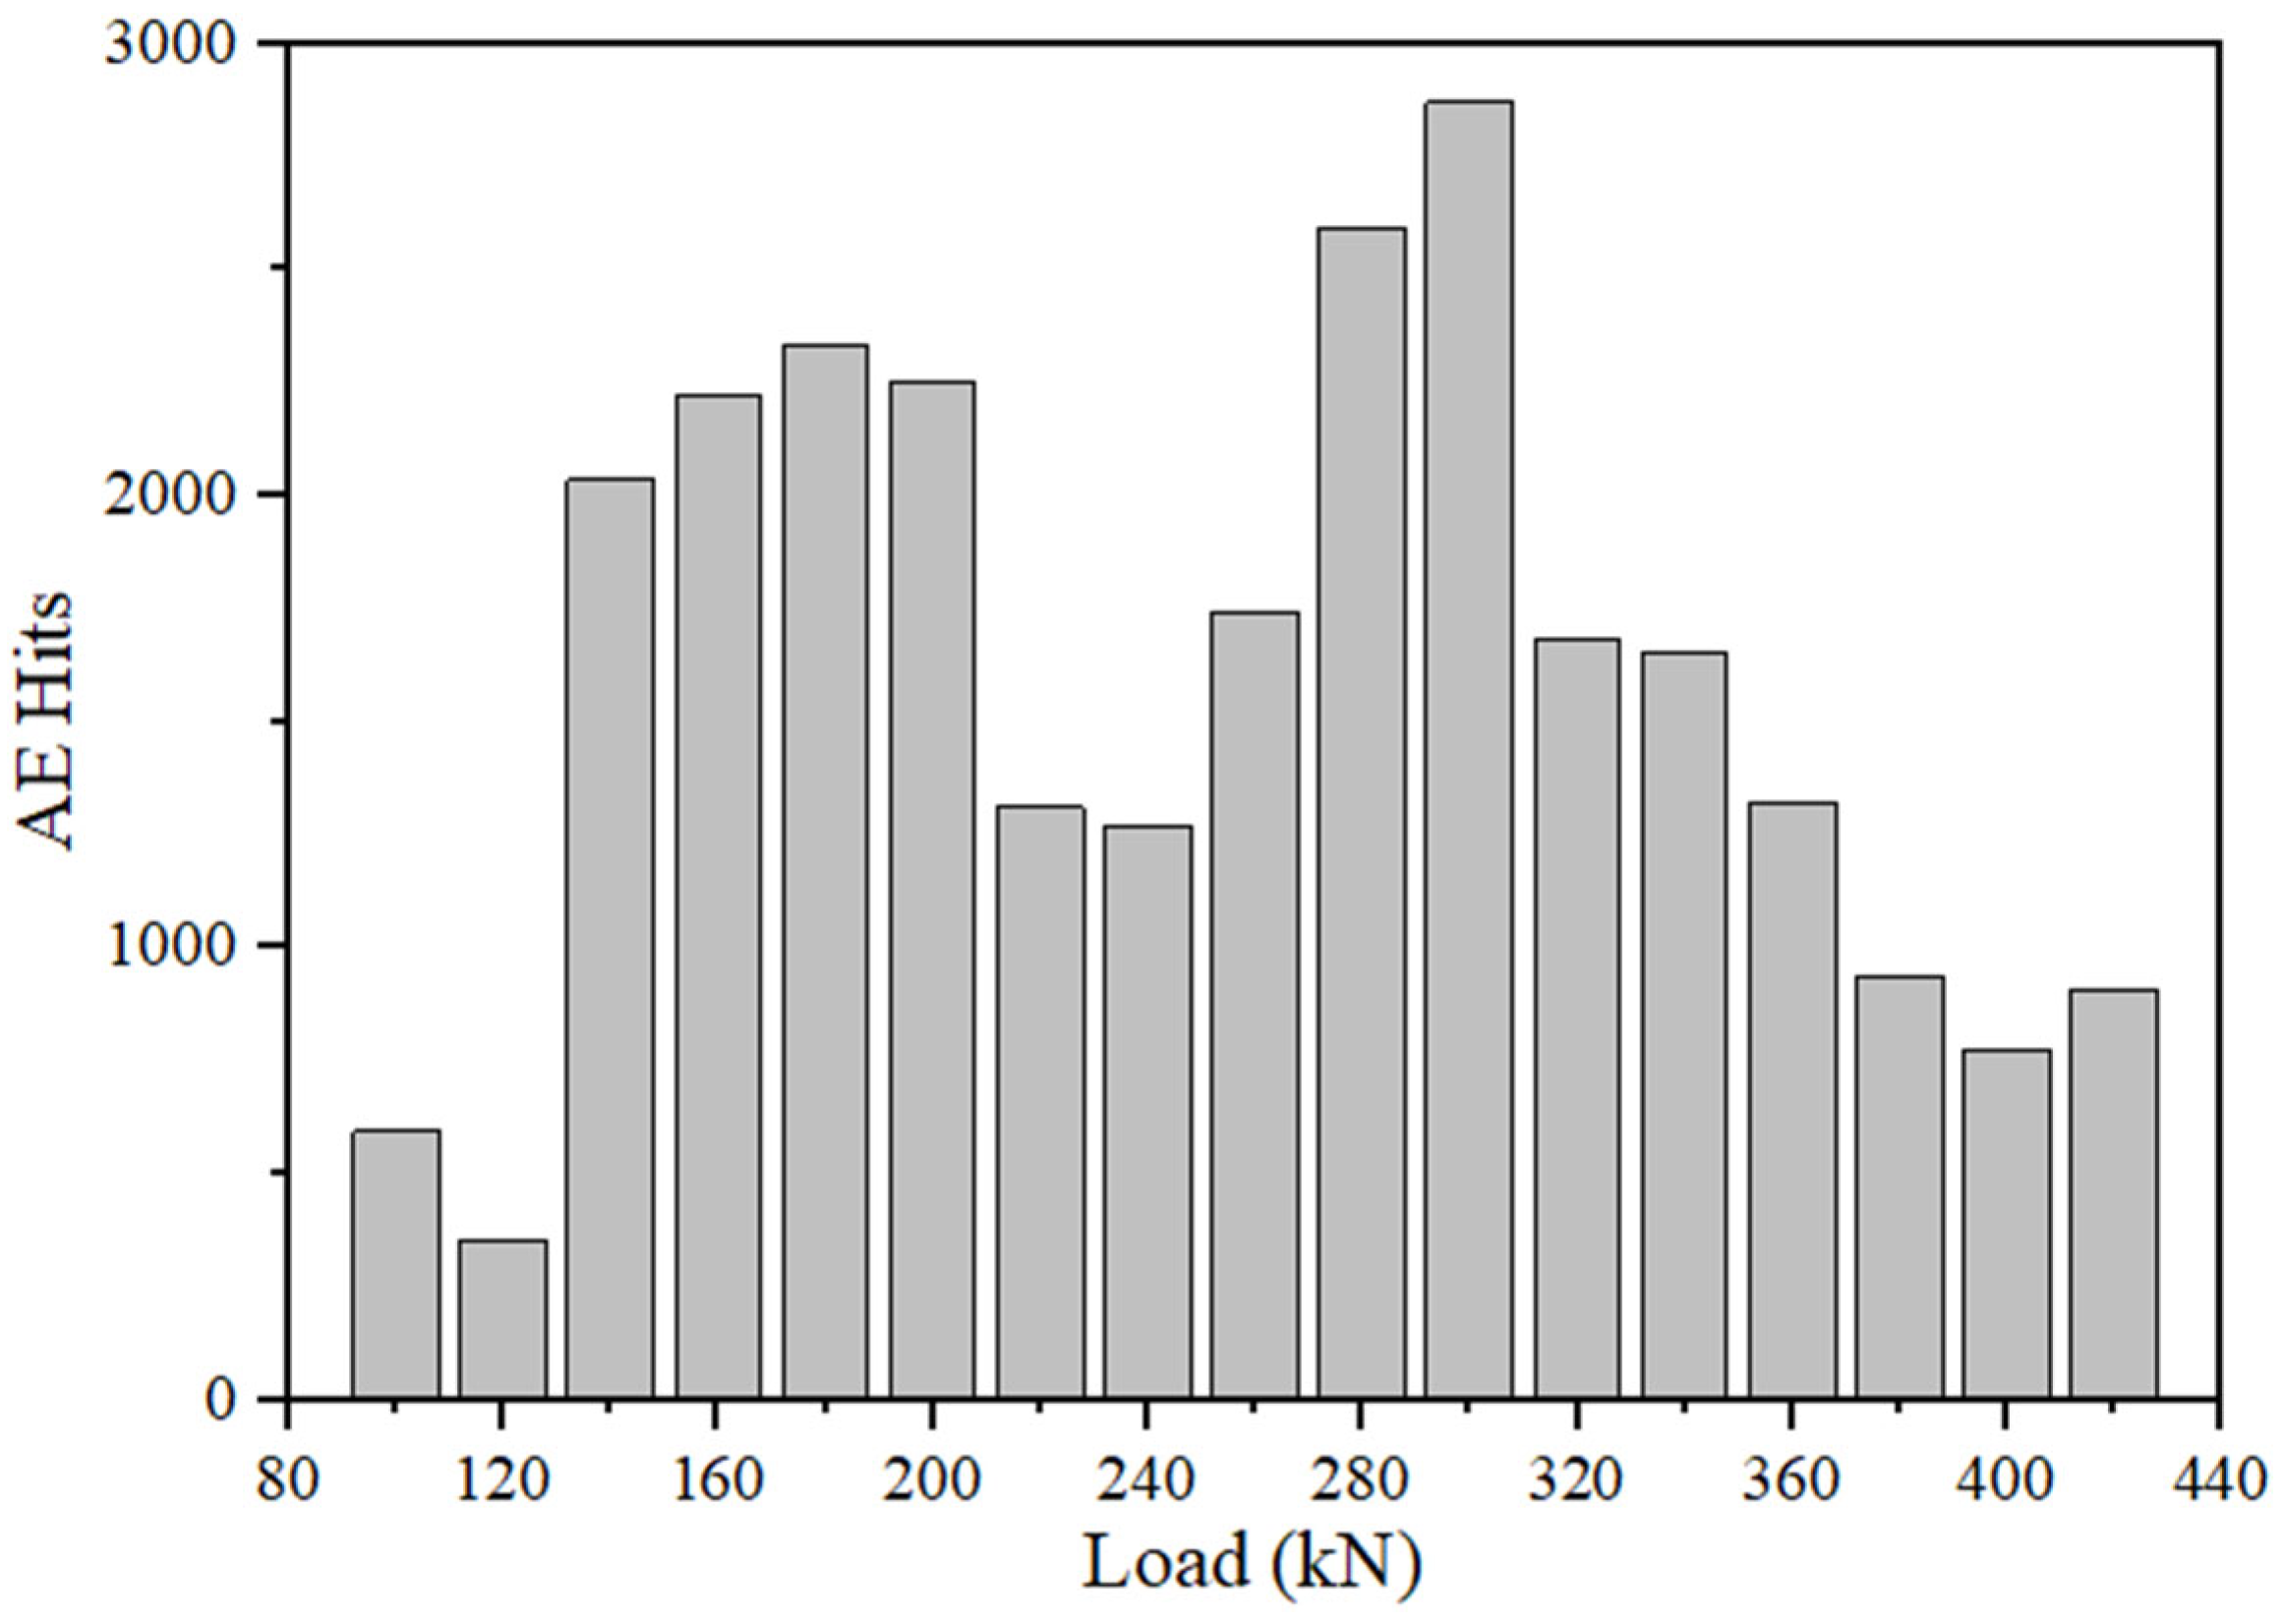
This section primarily analyzes the hits of AE signals. Generally, a higher value indicates more intense crack propagation. In this experiment, before the load was increased to 100 kN, the number of AE signals recorded by the sensors was relatively low, consistent with the absence of visible cracks observed during the test. This suggests that the test specimen was likely in the elastic stage. After the load exceeded 100 kN, the number of AE signals increased significantly. Taking Sensor 3 as an example, the AE signal counts at different loading stages are shown in Figure 6. Additionally, it is worth mentioning that the number of AE signals recorded by Sensor 1 or 2 was approximately 3–4 times lower than that of Sensor 3 or 4. As shown in Figure 3, Sensor 3 and 4 are located on the lower side of the specimen’s plane, while Sensor 1 and 2 are positioned on the upper side. This observation aligns with the experimental findings that more cracks were observed on the lower side of the specimen’s plane.
As can be seen from Figure 6, the number of AE signals remained at a relatively high level when the load increased from 120 kN to 200 kN. During this phase, experimental observations revealed that it coincided with the peak period of radial crack propagation, demonstrating good consistency. Subsequently, there was a brief decline in the number of signals, which can be attributed to the reduced formation of new radial cracks and the widening of existing ones. As the load approached approximately 300 kN, the number of AE signals continued to rise, aligning with the experimental observation of the initiation of more pronounced circumferential cracks. After this point, the number of AE signals began to decline, indicating a reduction in the formation of new cracks. The number of AE signals recorded by other sensors also followed a similar trend. Overall, the collected AE hits demonstrated good consistency with the crack development patterns observed during the loading process.

3.2.2. AE Amplitude Analysis

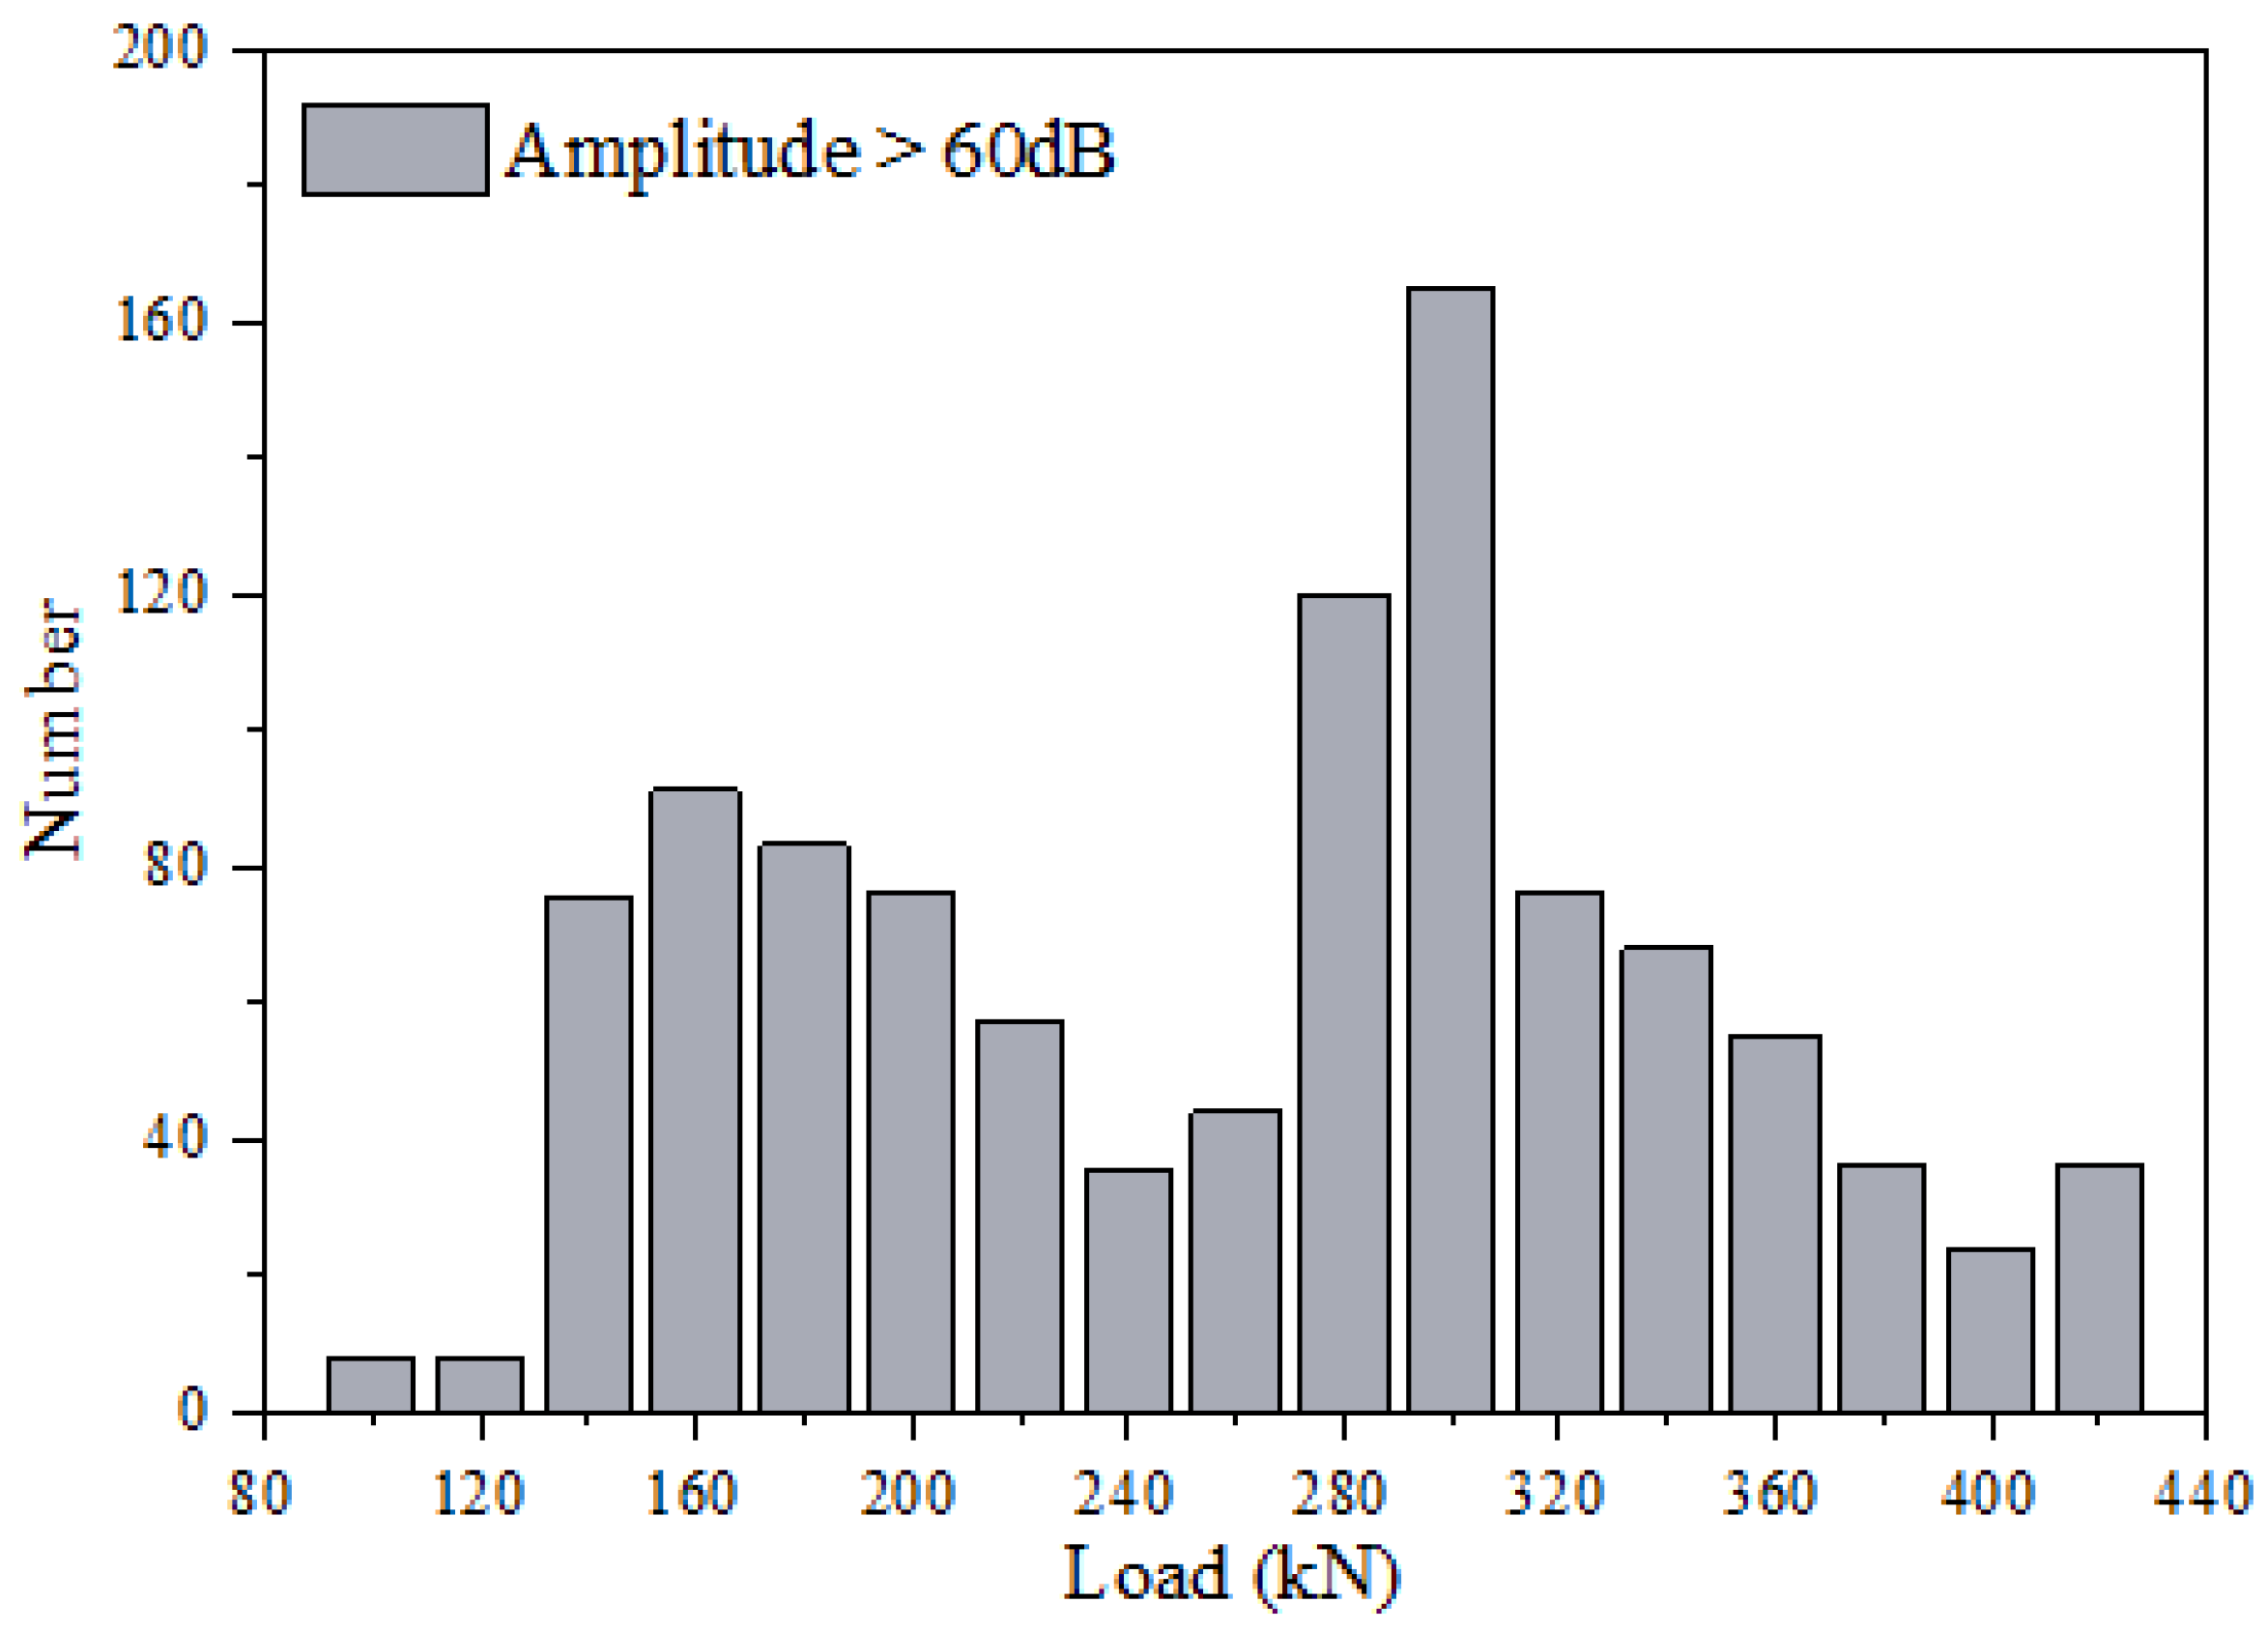
The amplitude of acoustic emission is directly related to the elastic wave energy released during the crack propagation in the concrete structure. The greater the energy release, the larger the amplitude. Therefore, the analysis of amplitude can be used to reflect violent crack propagation events, such as sudden cracking or rapid extension of the main crack. Figure 7 shows the number of acoustic emission signals with an amplitude greater than 60 dB recorded by Sensor 3 under different load levels during the loading process. It can be found that when the load reaches around 300 kN, the number of AE signals with a large amplitude is the highest, indicating that the crack development is relatively intense at this stage, which is consistent with the experimental phenomena. It is worth mentioning that the crack development at this stage mainly involves the increase in the width of the existing cracks. When the load is in the range of 120 kN to 240 kN, the number of AE signals with a high amplitude is also relatively high. However, at this time, the generation of new cracks is predominant, which is consistent with the experimental phenomena.
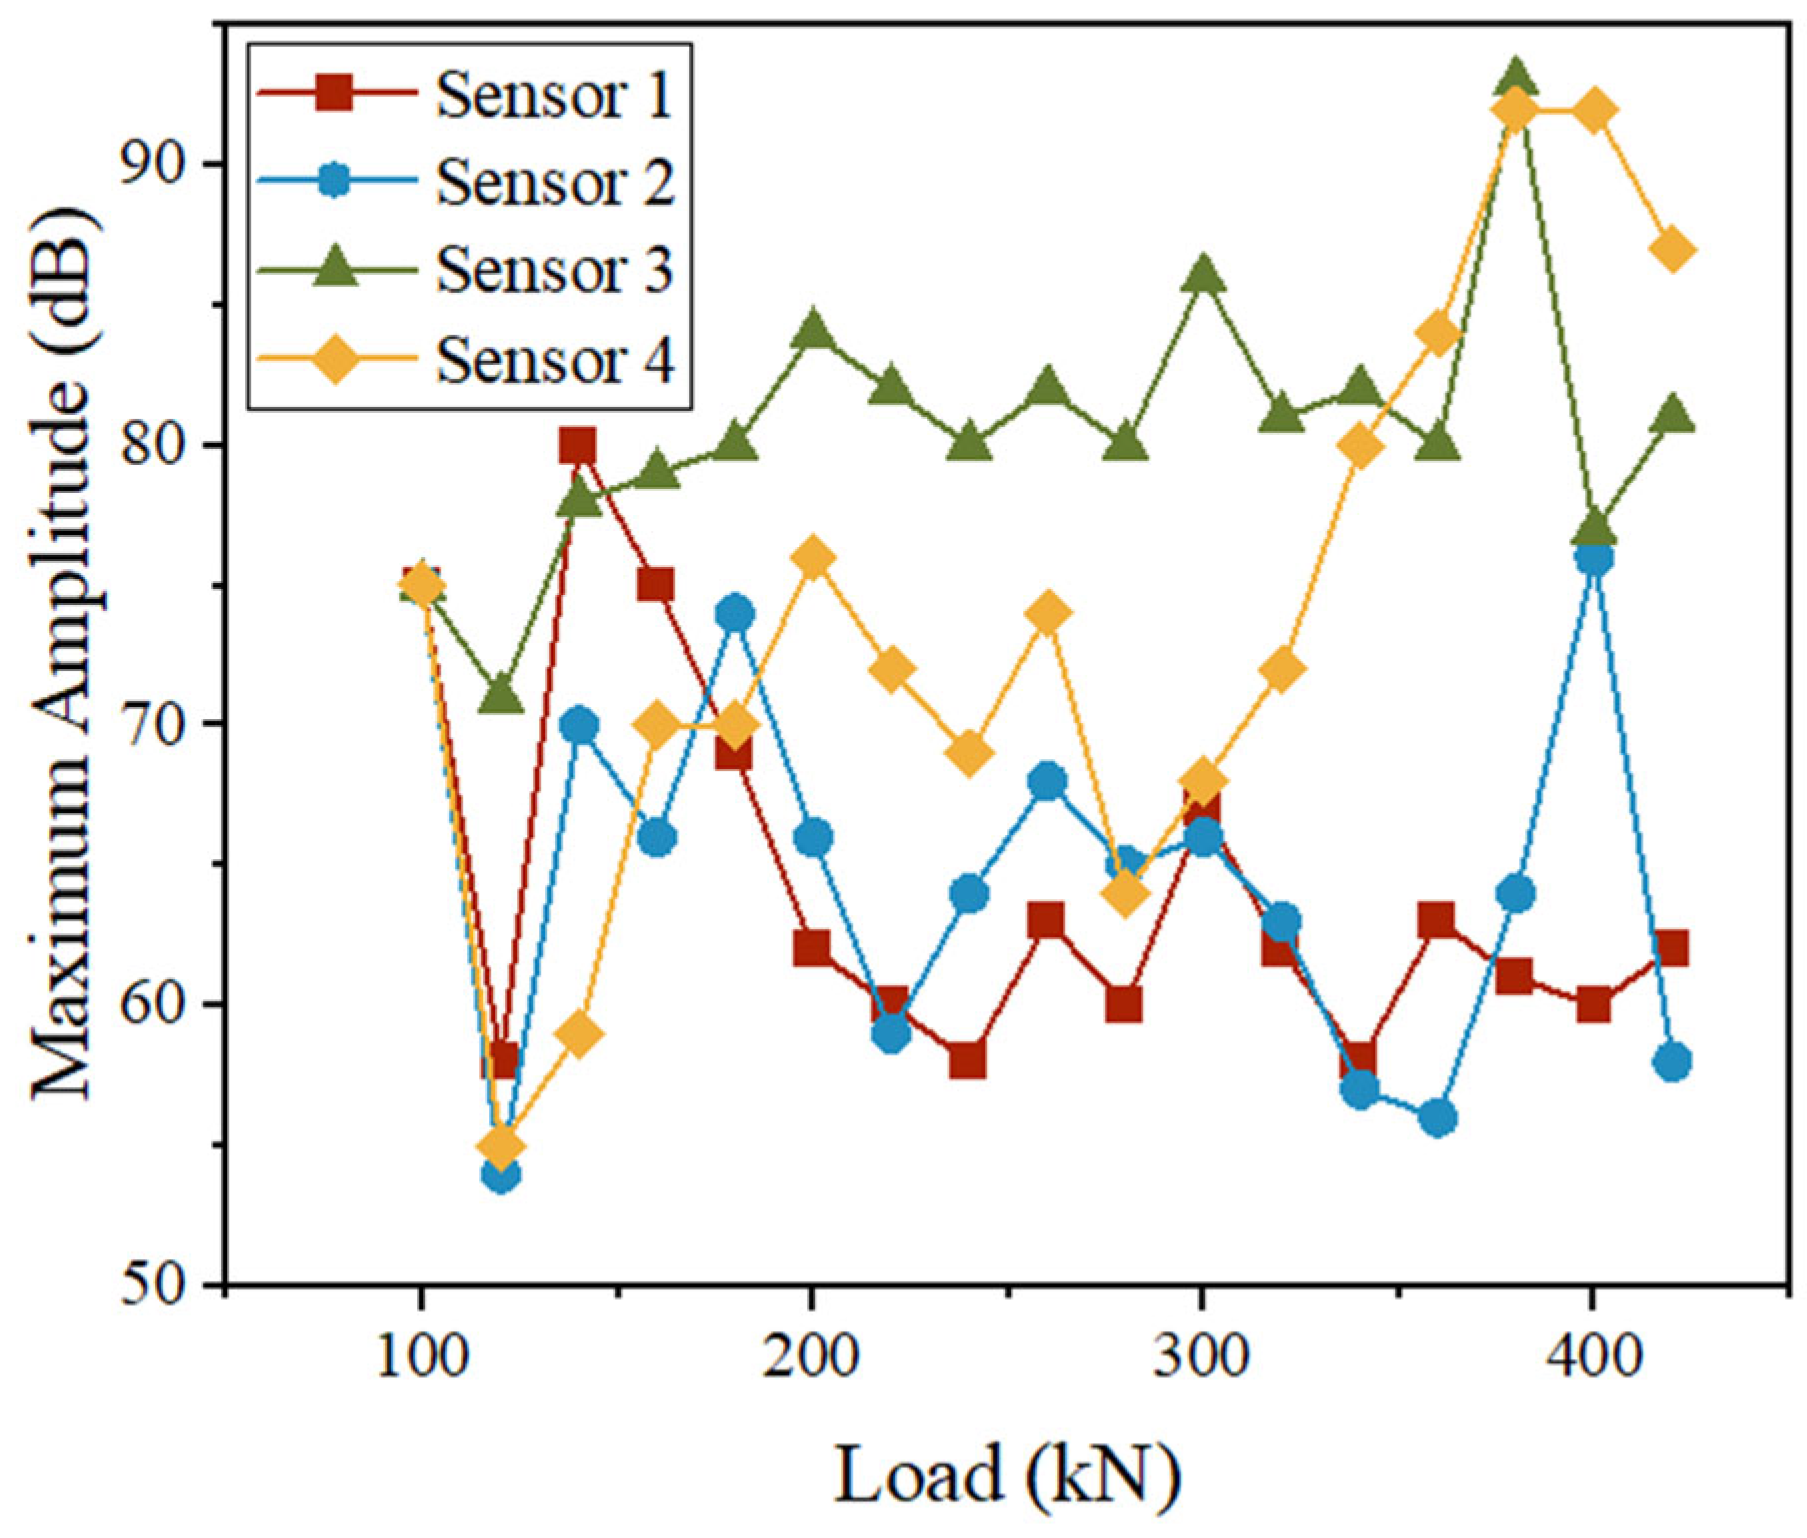
Figure 8 shows the maximum amplitude values of the AE signals recorded by different AE sensors at different loading stages. Overall, the amplitude of the AE signals recorded by Sensor 3 and Sensor 4 is greater than that recorded by Sensor 1 and Sensor 2. Since the sensors are symmetrically arranged, it can be concluded that the damage on the side close to Sensor 3 and Sensor 4 is more severe, and the crack development is more intense. This conclusion is also consistent with the test results, as shown in Figure 4 and Figure 5. The occurrence of this phenomenon may be due to the difficulty of achieving completely equal load application on the four sides of the slab during the loading process, and it may also be caused by the incomplete consistency of the load-bearing capacity on the two sides of the component itself. In addition, it can also be observed that during the process of the load level increasing from 280 kN to 380 kN, the maximum AE amplitude value keeps growing. It can be inferred that the development of large cracks is very active during this process. The maximum amplitude that appears during the entire loading process is greater than 90 dB. When it occurs, the load is also close to the maximum bearing capacity value of the entire component, which is similar to the phenomena found by other researchers for other RC components such as walls [17] and columns [31].

4. Dagame Development Process and Assessment

4.1. Ib-Value Analysis

Acoustic emission (AE) activity shares certain similarities with earthquakes. In seismology, the Gutenberg–Richter law [32] describes the relationship between earthquake magnitude and frequency, expressed by the following formula:
log 10 N = a b M l ,
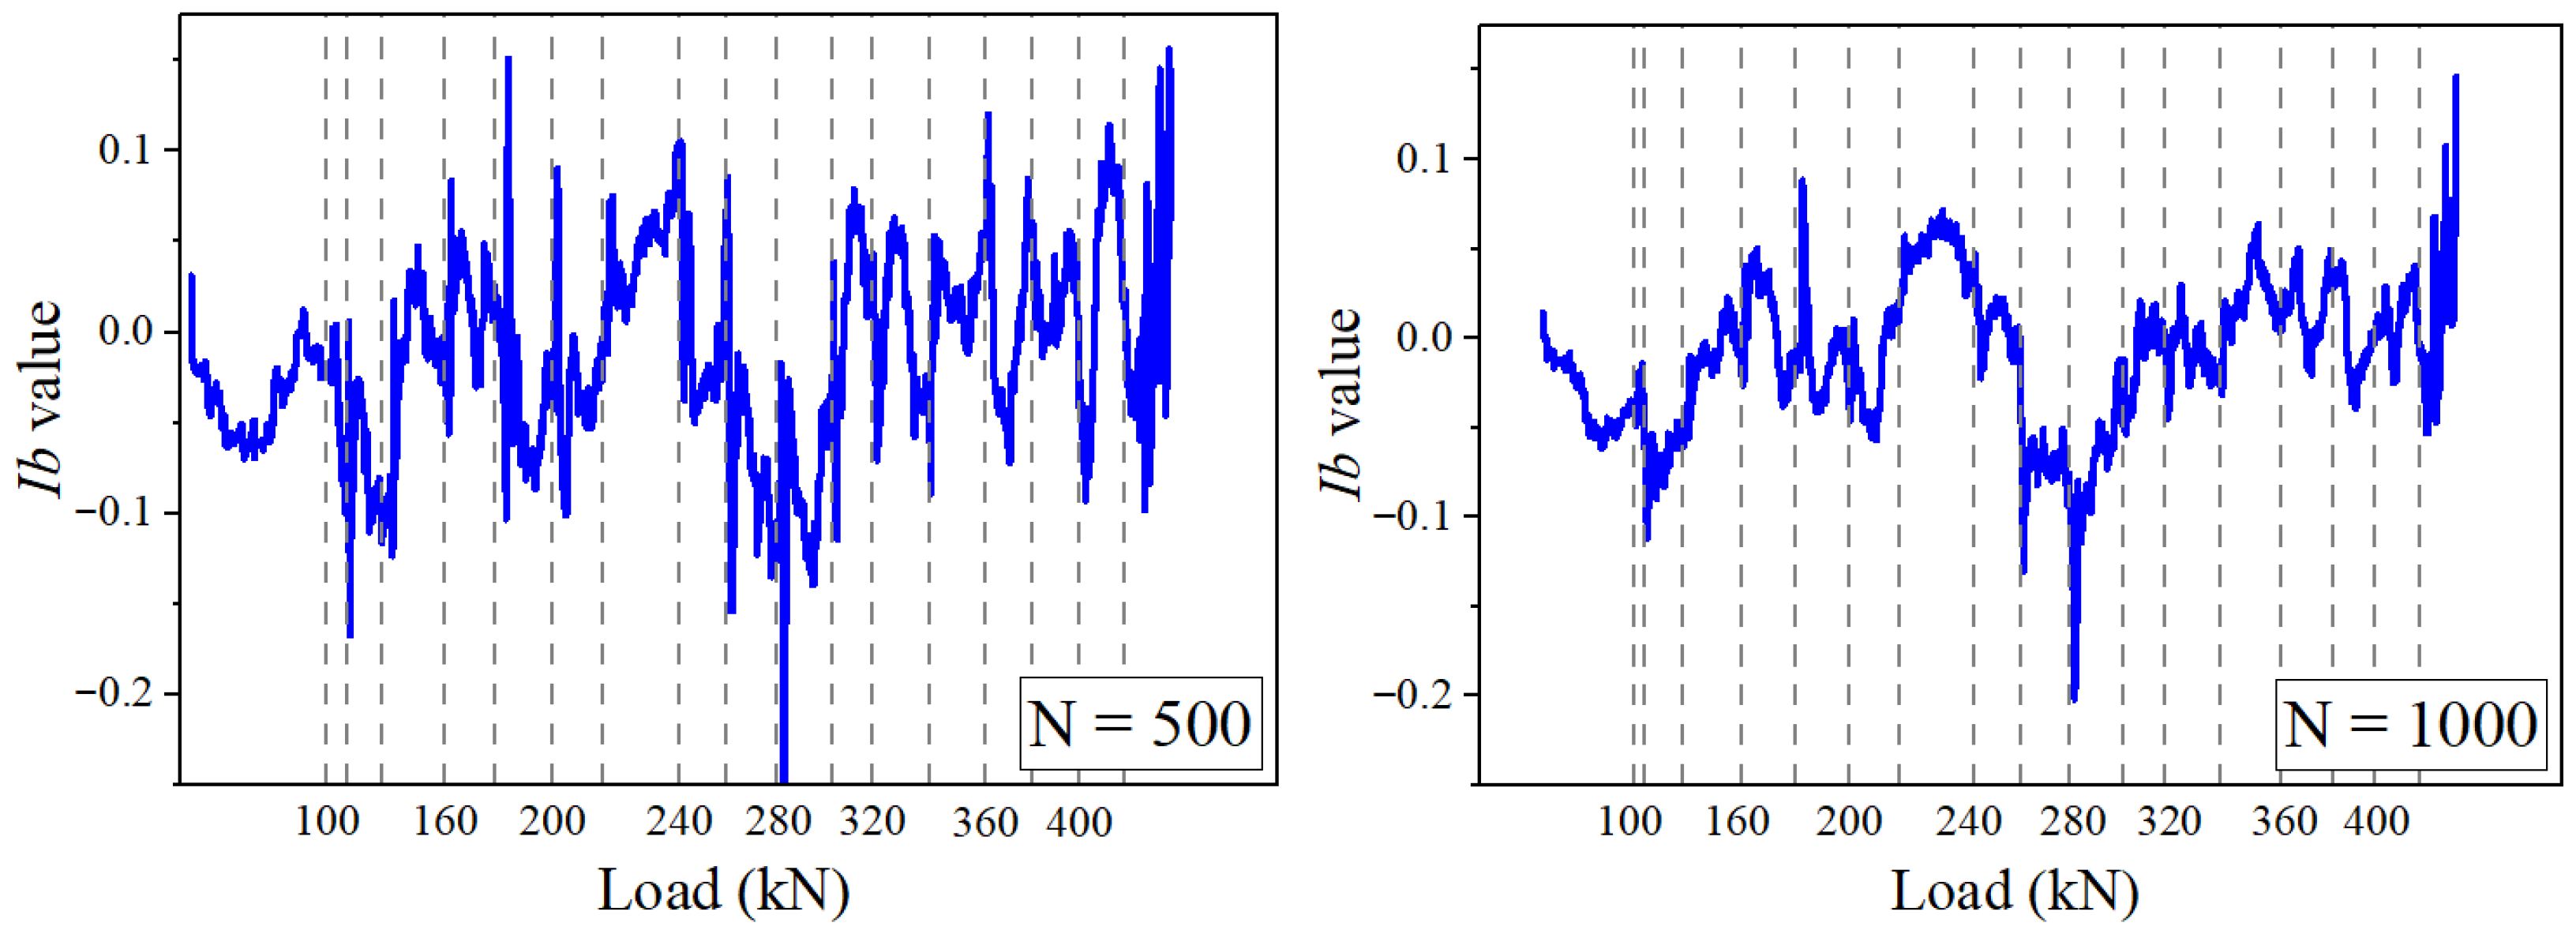
where Ml is the earthquake magnitude, N is the number of earthquakes with magnitude greater than Ml, and a and b are constants. The b-value reflects the relative proportion of small to large earthquakes (i.e., the frequency ratio of small-to-large events). In acoustic emission studies, the amplitude distribution often exhibits a similar scaling pattern, allowing the b-value to be calculated analogously. The improved b-value (Ib-value), first proposed by Shiotani [33], which is based on changes in the standard deviation of logarithmic amplitudes, has been suggested to characterize the damage accumulation process. It is worth noting that the Ib-value was derived from the acoustic emission signals of Sensor 3, where every 500 signals (N = 500) or every 1000 signals (N = 1000) were grouped into one set to calculate and display the variation pattern of the Ib-value. Figure 9 shows the changes in the Ib-value. The dashed lines in the figure represent different load levels. The inconsistent spacing between these dashed lines is due to the fact that the number of AE signals generated at each level is different, which consequently leads to an inconsistent number of Ib-value
As can be seen from Figure 9, the overall Ib-value fluctuates at different load stages, reflecting the collaborative development of micro-cracks and main cracks. The most significant fluctuation occurs during the loading stage from 280 kN to 300 kN, indicating that the development of concrete cracks transitions from micro-crack propagation to macro-crack development at this stage. This is specifically manifested in the relatively insignificant growth in the number of cracks, while the crack width increases significantly, which is consistent with the experimental phenomena. Additionally, in the final loading stage, the continuous abnormal increase in the Ib-value signals that the structure has entered an irreversible accelerated failure process.

4.2. Energy Analysis

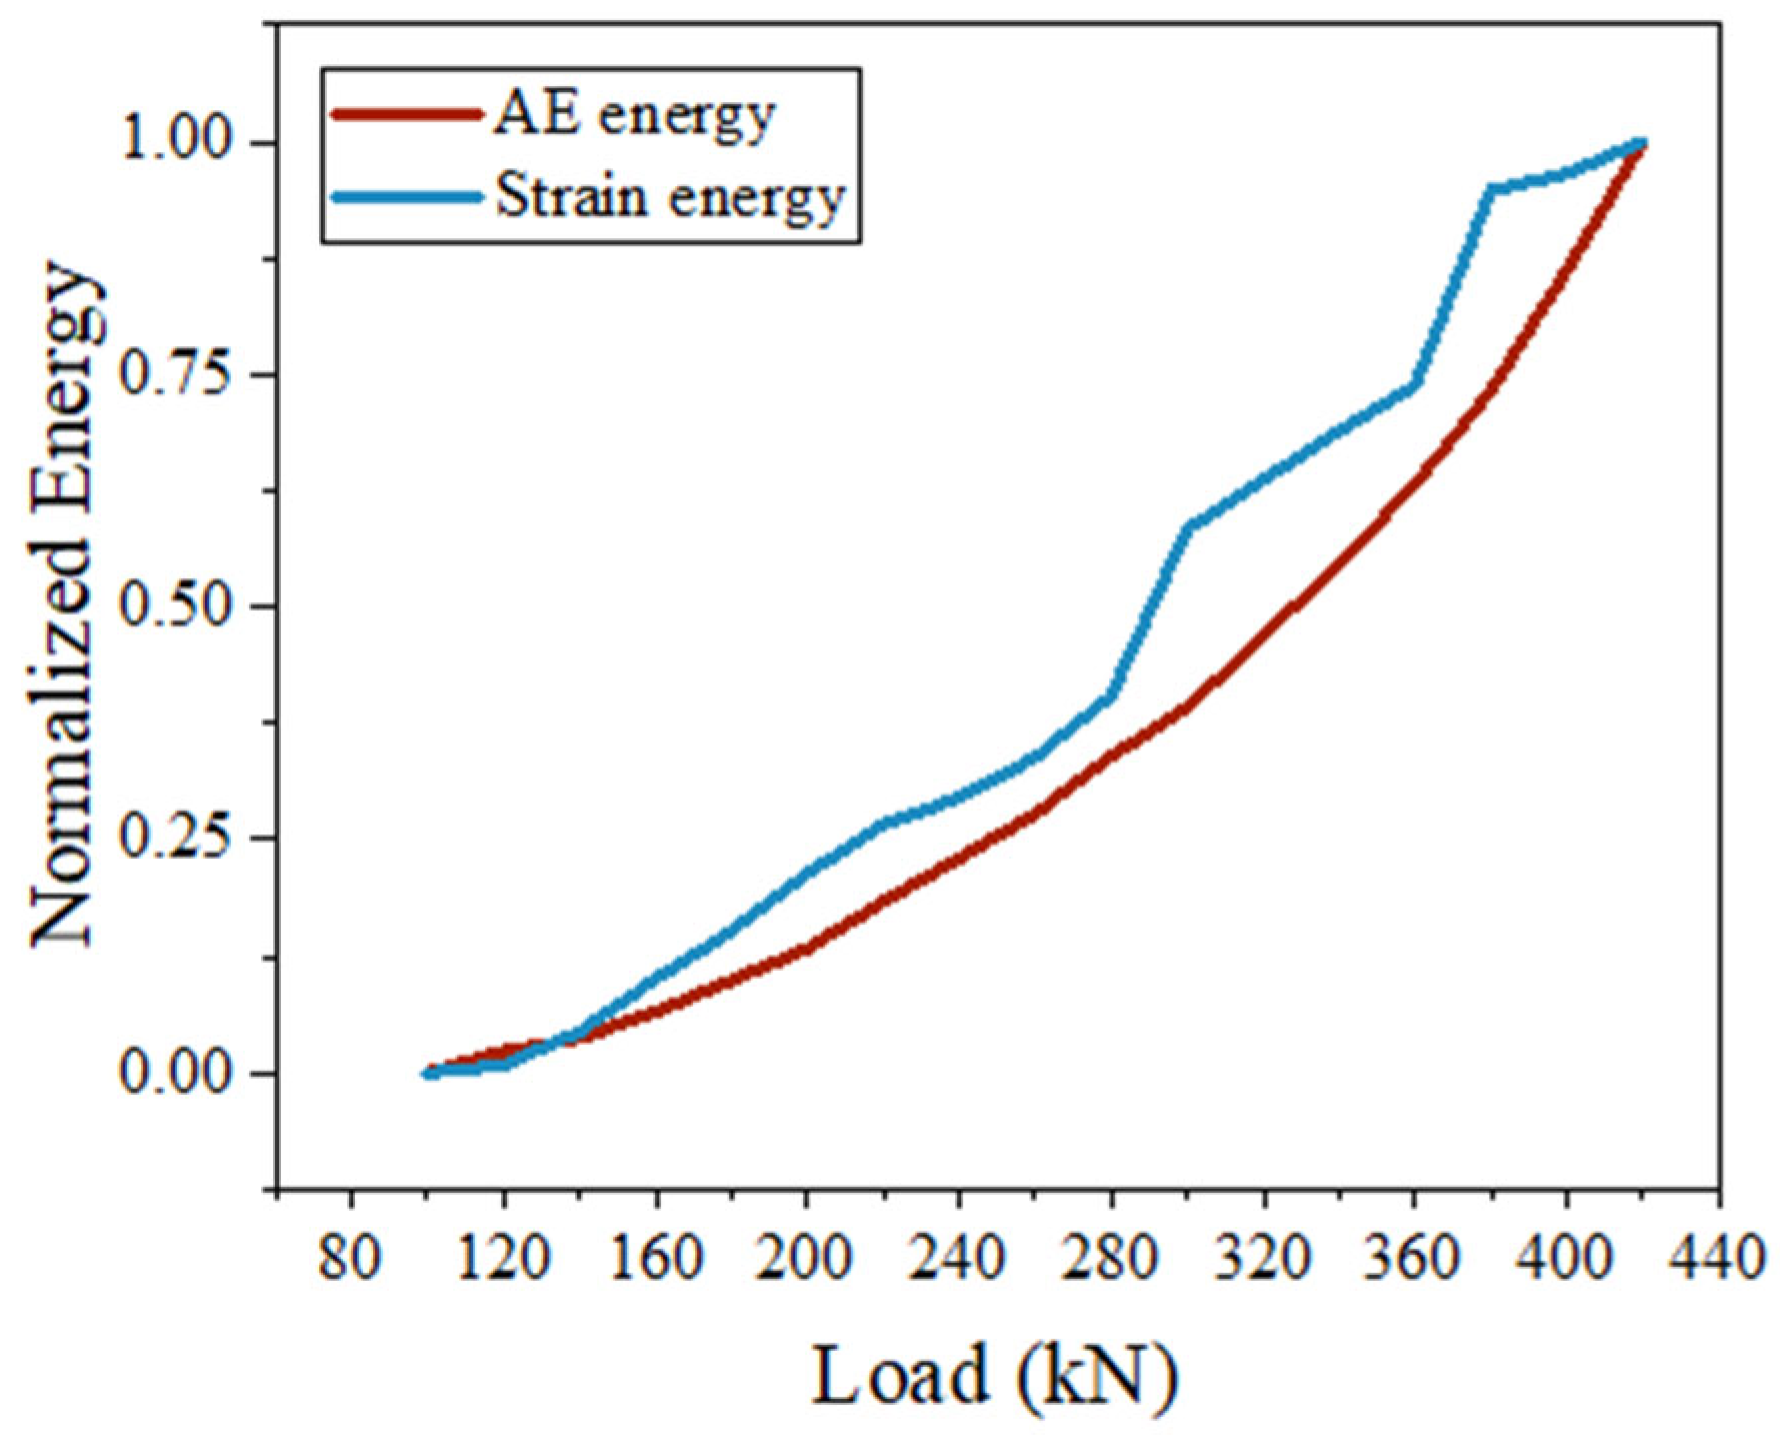
The energy of AE signals is one of the important parameters in AE signals processing, which reflects the total elastic wave energy released during the internal damage process of materials or structures. The total AE energy value can be obtained by accumulating the energy values of the AE signals collected in the test. At the same time, the strain energy of the component during the test is calculated by the area of the load–displacement curve. The above AE energy and strain energy are normalized, as shown in Figure 10.
The normalized strain/AE energy represents the ratio of the strain/AE energy at a certain moment to the total strain/AE energy ( E s t r / E e n d s t r , or E A E / E e n d A E ). As can be seen from the figure, the AE energy and strain energy show a relatively consistent development trend during the loading process, which is also consistent with the conclusions in some other concrete structure tests. An approximate relationship can be considered as follows:
E s t r E e n d s t r = E A E E e n d A E
For the damage of reinforced concrete structures, an index based on strain energy can be adopted. Therefore, the punching damage of the reinforced concrete slabs in this study can also be equivalently evaluated by an index based on acoustic emission energy based on Equation (2). It can be observed that when the load is increased from 0 to approximately 220 kN, the damage level of the structure can be controlled within 0.25. When the load exceeds 340 kN, the structural damage level exceeds 0.6. This result is reasonable because the reinforced concrete slab did not reach its maximum capacity when the load was low. After the load exceeded 340 kN, the specimen failed rapidly due to shear action, which was reflected in the damage level.

4.3. Failure Mode Evaluation

During the loading process, both bending effect and shear effect exist, so it is important to determine the failure mode of the loading (bending failure or shear failure). The RA–AF analysis can identify tensile cracks and shear cracks by comparing the relative magnitudes of RA and AF, thereby analyzing possible damage patterns. This method has been recommended by relevant specifications and scholars [34,35,36]. The RA value is the ratio of rise time to peak amplitude in acoustic emission signals, while the AF value is the ratio of signal counts to duration time. As shown in the Figure 11, the results of RA–AF analysis at different stages of the test loading process indicate that larger AF and smaller RA are more likely to be flexural cracks, while the opposite suggests shear cracks.
As can be seen from the figure above, both tensile cracks and shear cracks occur at arbitrary stages during loading. In the initial stage of loading, there are relatively more tensile cracks, indicating that bending is the dominant action. When the load increases to more than 200 kN, it suggests that shear cracks increase, but at this time, tensile cracks still develop significantly, entering a synchronous development stage. When the load reaches more than 400 kN, the number of shear cracks can be clearly seen to surge, indicating shear punching shear failure has occurred. This is consistent with the test phenomenon that the bending deformation is large in the early stage, followed by a relatively sudden shear failure in the later stage. Therefore, a close relationship can be observed between the RA–AF analysis results and the actual crack development in the experiment.
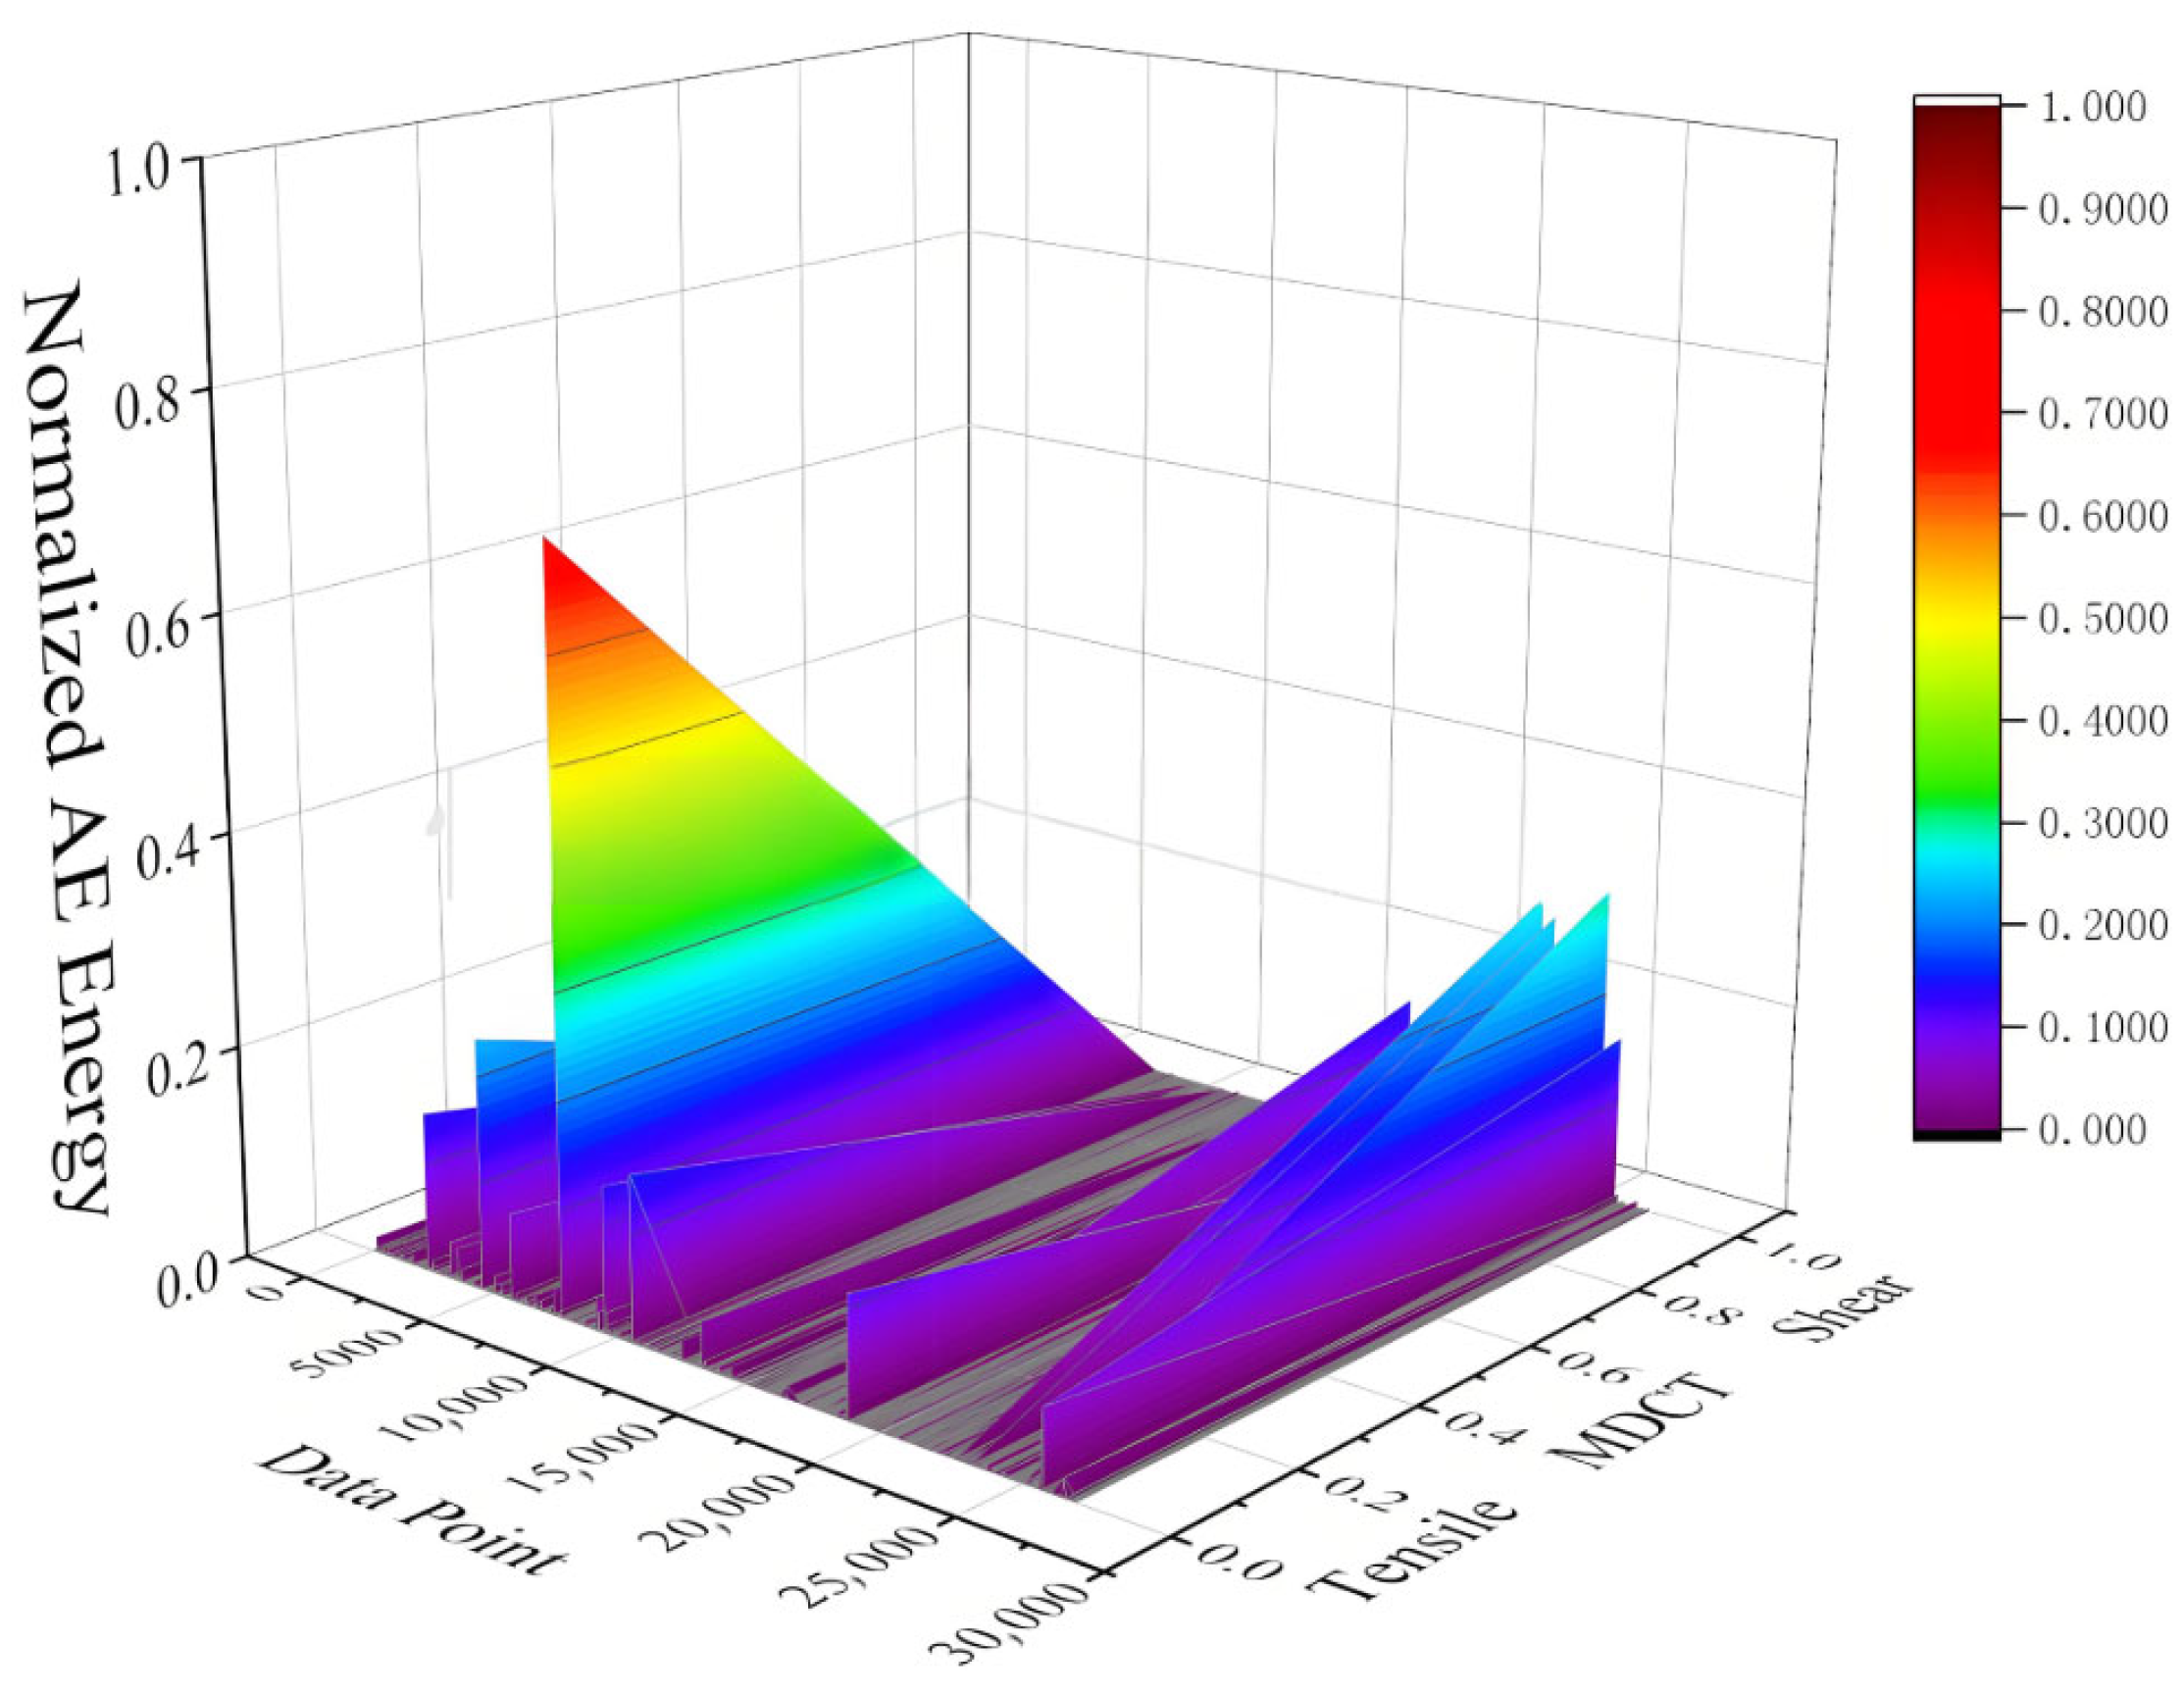
Although RA and AF values exhibit a certain capability in identifying crack types, their calculation methodologies indicate that these two parameters incorporate rise time, amplitude, counts, and duration, while excluding energy information. Therefore, to comprehensively characterize all information related to damage development, integration of energy information is necessary. To visually display both crack types and corresponding energy information simultaneously, it is necessary to transform the RA–AF parameter pair into a single indicator capable of reflecting crack categories. A clustering analysis method can be adopted to use the clustering membership degree of each signal as a single variable. By quantifying the association degree between signals and various crack types, this approach maps the two-dimensional RA–AF feature space into one-dimensional membership values, thereby achieving intuitive characterization of crack types while preserving energy information. In the current study, a Gaussian Mixture Model (GMM) clustering method was employed to construct the Membership Degree of Crack Type (MDCT) index. First, Z-score normalization is performed on RA and AF values to eliminate the influence of dimension. Subsequently, GMM clustering is conducted under the assumption that the data are composed of two mixed Gaussian distributions, representing bending cracks and shear cracks, respectively. The expectation-maximization algorithm is employed to estimate the model parameters, including the mean, covariance, and mixing weights of each Gaussian component. After model establishment, the posterior probabilities of each sample belonging to the two Gaussian components are calculated. Based on prior knowledge that shear cracks typically exhibit higher RA values, the Gaussian component with a larger RA mean at the cluster center is selected as the shear crack cluster. The posterior probability of the sample belonging to the shear crack cluster is defined as the MDCT value. Thus, a reasonable assumption can be made that when MDCT < 0.5, the cracks are dominated by bending cracks, while those with MDCT > 0.5 are categorized as being governed by shear cracks. Figure 12 shows the MDCT distribution of the acoustic emission signals, from which it can be seen that the overall crack types have good distinguishability.
After converting RA and AF into a single parameter MDCT, they can be visually represented on the same graph as the energy data, as shown in Figure 13. As can be seen from the figure, in the early stage of load application (i.e., when the number of data points is small), MDCT tends to the 0 direction while accompanied by a large energy value, indicating the occurrence of flexural damage. In the late stage of loading, dense crack signals with the MDCT index close to 1 appear, accompanied by relatively high energy, so it can be inferred that shear cracks dominate the late-stage development. This result can well reflect the type and intensity of component damage development in the experiment and achieve a good estimation of key damage moments.

5. Conclusions

In this paper, the punching shear failure process of slab–column structures is studied from the perspective of acoustic emission, including basic AE parameter analysis and energy-based damage assessment, and a comprehensive damage analysis method integrating damage modes and energy indices is proposed. The results are in good agreement with the tests. It should be noted that this scaled-down test may lead to differences in crack propagation rate and energy release patterns compared to full-scale structures, which is a limitation of this study. Some specific conclusions are as follows:
  • Obvious punching shear failure was revealed in the specimens by the mechanical experiment results. Through analysis of basic acoustic emission parameters, namely AE hits and amplitude, significant crack development was identified during the loading stage from 120 kN to 200 kN and around 300 kN. This observation was found to be in good agreement with the experimental phenomena.
  • Analysis of the Ib-value indicates that at 280–300 kN, the transition from micro-crack propagation to macro-crack widening occurs, which aligns with the accelerated development of crack width. The synchronization between AE energy and structural strain energy demonstrates their capability to reflect structural damage. When the load is less than or equal to 220 kN, the damage level remains below 0.25; conversely, when the load reaches or exceeds 340 kN, the damage level surpasses 0.6. This indicates that the structure enters an accelerated failure stage, providing a quantitative basis for safety early-warning systems.
  • RA–AF analysis confirms tensile cracks dominate below 200 kN, while shear cracks surge beyond 400 kN, validating the bending-to-punching shear failure transition. A GMM clustering method was employed to convert RA–AF features into a unified Crack-Type membership index. Synchronized MDCT-AE energy analysis was proposed to comprehensively reflect the damage process and intensity, demonstrating exceptional consistency with the experimental damage progression and highlighting substantial potential for real-time structural health monitoring.

Author Contributions

Conceptualization, X.Z.; Methodology, X.Z. and Z.Y.; Software, Z.Y.; Formal analysis, X.Z.; Writing—original draft preparation, X.Z.; Resources, G.Y.; Funding acquisition, G.Y. All authors have read and agreed to the published version of the manuscript.

Funding

This research was funded by the National Natural Science Foundation of China, grant number 52408184, and Nanjing Municipal Commission of Housing and Urban–Rural Development, gran number Ks2405.

Conflicts of Interest

Author Guogang Ying was employed by the company Ningbo Langda Technology Co., Ltd. The remaining authors declare that the research was conducted in the absence of any commercial or financial relationships that could be construed as a potential conflict of interest.

References

  1. Ramana, N.V. Review on punching shear strength of slabs. Int. Eng. J. Res. Dev. 2017, 13, 1–25. [Google Scholar]
  2. Rankin, G.; Long, A. Punching strength of conventional slab-column specimens. Eng. Struct. 2019, 178, 37–54. [Google Scholar] [CrossRef]
  3. Hamoda, A.; Abadel, A.A.; Ahmed, M.; Wang, V.; Vrcelj, Z.; Liang, Q.Q. Punching shear performance of reinforced concrete slab-to-steel column connections incorporating ECC and UHPECC. Eng. Struct. 2025, 322, 119145. [Google Scholar] [CrossRef]
  4. Elstner, R.C.; Hognestad, E. Shearing strength of reinforced concrete slabs. J. Proc. 1956, 53, 29–58. [Google Scholar]
  5. Muttoni, A. Punching shear strength of reinforced concrete slabs without transverse reinforcement. ACI Struct. J. 2008, 105, 440. [Google Scholar]
  6. EN 1992-1-1; Eurocode 2: Design of Concrete Structures–Part 1-1: General Rules and Rules for Buildings. European Committee for Standardization (CEN): Brussels, Belgium, 2004.
  7. ACI Committee 318; Building Code Requirements for Structural Concrete (ACI 318-14) and Commentary. American Concrete Institute: Farmington Hills, MI, USA, 2014.
  8. Yang, Z.; Ma, J.; Li, B. Investigating the impact of corrosion on behavior and failure modes of reinforced concrete slabs: An experimental and analytical study. Eng. Struct. 2024, 321, 118983. [Google Scholar] [CrossRef]
  9. Inácio, M.; Isufi, B.; Lapi, M.; Ramos, A.P. Rational use of high-strength concrete in flat slab-column connections under seismic loading. ACI Struct. J. 2020, 117, 297–310. [Google Scholar]
  10. Ozden, S.; Ersoy, U.; Ozturan, T. Punching shear tests of normal-and high-strength concrete flat plates. Can. J. Civ. Eng. 2006, 33, 1389–1400. [Google Scholar] [CrossRef]
  11. Gouveia, N.D.; Lapi, M.; Orlando, M.; Faria, D.M.V.; Ramos, A.M.P. Experimental and theoretical evaluation of punching strength of steel fiber reinforced concrete slabs. Struct. Concr. 2018, 19, 217–229. [Google Scholar] [CrossRef]
  12. Michels, J.; Waldmann, D.; Maas, S.; Zürbes, A. Steel fibers as only reinforcement for flat slab construction–Experimental investigation and design. Constr. Build. Mater. 2012, 26, 145–155. [Google Scholar] [CrossRef]
  13. Bastien-Masse, M.; Brühwiler, E. Experimental investigation on punching resistance of R-UHPFRC–RC composite slabs. Mater. Struct. 2016, 49, 1573–1590. [Google Scholar] [CrossRef]
  14. Afefy, H.M.; El-Tony, E.-T.M. Punching shear resistance of strengthened reinforced concrete interior slab–column connections using ultra-high-performance strain-hardening cementitious composite material. Adv. Struct. Eng. 2019, 22, 1799–1816. [Google Scholar] [CrossRef]
  15. Zhang, X.; Li, B. Damage characteristics and assessment of corroded RC beam-column joint under cyclic loading based on acoustic emission monitoring. Eng. Struct. 2020, 205, 110090. [Google Scholar] [CrossRef]
  16. Benavent-Climent, A.; Castro, E.; Gallego, A. AE monitoring for damage assessment of RC exterior beam-column subassemblages subjected to cyclic loading. Struct. Health Monit. 2009, 8, 175–189. [Google Scholar] [CrossRef]
  17. Farhidzadeh, A.; Salamone, S.; Luna, B.; Whittaker, A. Acoustic emission monitoring of a reinforced concrete shear wall by b-value–based outlier analysis. Struct. Health Monit. 2013, 12, 3–13. [Google Scholar] [CrossRef]
  18. Zhang, X.; Shan, W.; Zhang, Z.; Li, B. AE monitoring of reinforced concrete squat wall subjected to cyclic loading with information entropy-based analysis. Eng. Struct. 2018, 165, 359–367. [Google Scholar] [CrossRef]
  19. Jiang, Z.; Zhu, Z.; Accornero, F. Tensile-to-shear crack transition in the compression failure of steel-fibre-reinforced concrete: Insights from acoustic emission monitoring. Buildings 2024, 14, 2039. [Google Scholar] [CrossRef]
  20. Yuyama, S.; Li, Z.-W.; Yoshizawa, M.; Tomokiyo, T.; Uomoto, T. Evaluation of fatigue damage in reinforced concrete slab by acoustic emission. NDT E Int. 2001, 34, 381–387. [Google Scholar] [CrossRef]
  21. Shan, W.; Liu, J.; Li, J.; Hu, H.; Chen, Y.F. Characterization of damage on precast pre-stressed concrete composite slabs under static loading based on acoustic emission parameters. Struct. Health Monit. 2020, 19, 2091–2106. [Google Scholar] [CrossRef]
  22. Raghu Prasad, B.K.; Vidya Sagar, R. Relationship between AE energy and fracture energy of plain concrete beams: Experimental study. J. Mater. Civ. Eng. 2008, 20, 212–220. [Google Scholar] [CrossRef]
  23. Ma, G.; Du, Q. Structural health evaluation of the prestressed concrete using advanced acoustic emission (AE) parameters. Constr. Build. Mater. 2020, 250, 118860. [Google Scholar] [CrossRef]
  24. Colombo, I.S.; Main, I.G.; Forde, M.C. Assessing damage of reinforced concrete beam using “b-value” analysis of acoustic emission signals. J. Mater. Civ. Eng. 2003, 15, 280–286. [Google Scholar] [CrossRef]
  25. Zeng, H.; Hartell, J.A.; Soliman, M. Damage evaluation of prestressed beams under cyclic loading based on acoustic emission monitoring. Constr. Build. Mater. 2020, 255, 119235. [Google Scholar] [CrossRef]
  26. Colombo, S.; Forde, M.; Main, I.G.; Shigeishi, M. Predicting the ultimate bending capacity of concrete beams from the “relaxation ratio” analysis of AE signals. Constr. Build. Mater. 2005, 19, 746–754. [Google Scholar] [CrossRef]
  27. Ziehl, P.; Ridge, A. Evaluation of strengthened reinforced concrete beams: Cyclic load test and acoustic emission methods. ACI Struct. J. 2006, 103, 832. [Google Scholar]
  28. Prem, P.R.; Verma, M.; Ambily, P.S. Damage characterization of reinforced concrete beams under different failure modes using acoustic emission. Structures 2021, 30, 174–187. [Google Scholar] [CrossRef]
  29. Muir, C.; Swaminathan, B.; Fields, K.; Almansour, A.S.; Sevener, K.; Smith, C.; Presby, M.; Kiser, J.D.; Pollock, T.M.; Daly, S. A machine learning framework for damage mechanism identification from acoustic emissions in unidirectional SiC/SiC composites. NPJ Comput. Mater. 2021, 7, 146. [Google Scholar] [CrossRef]
  30. Calabrese, L.; Campanella, G.; Proverbio, E. Use of cluster analysis of acoustic emission signals in evaluating damage severity in concrete structures. J. Acoust. Emiss. 2010, 1, 28. [Google Scholar]
  31. Ma, G.; Li, H. Acoustic emission monitoring and damage assessment of FRP-strengthened reinforced concrete columns under cyclic loading. Constr. Build. Mater. 2017, 144, 86–98. [Google Scholar] [CrossRef]
  32. Gutenberg, B.; Richter, C.F. Earthquake magnitude, intensity, energy, and acceleration. Bull. Seismol. Soc. Am. 1942, 32, 163–191. [Google Scholar] [CrossRef]
  33. Shiotani, T.; Fujii, K.; Aoki, T.; Amou, K. Evaluation of progressive failure using AE sources and improved b-value on slope model tests. Prog. Acoust. Emiss. 1994, 7, 529–534. [Google Scholar]
  34. JCMS–III B5706; Monitoring Method for Active Cracks in Concrete by Acoustic Emission. Federation of Construction Materials Industries: Tokyo, Japan, 2003.
  35. Prem, R.; Murthy, A.R. Acoustic emission monitoring of reinforced concrete beams subjected to four-point-bending. Appl. Acoust. 2017, 117, 28–38. [Google Scholar] [CrossRef]
  36. Bi, J.; Zhao, Y.; Wu, Z.; Li, J.; Wang, C. Research on crack classification method and failure precursor index based on RA-AF value of brittle rock. Theor. Appl. Fract. Mech. 2024, 129, 104179. [Google Scholar] [CrossRef]
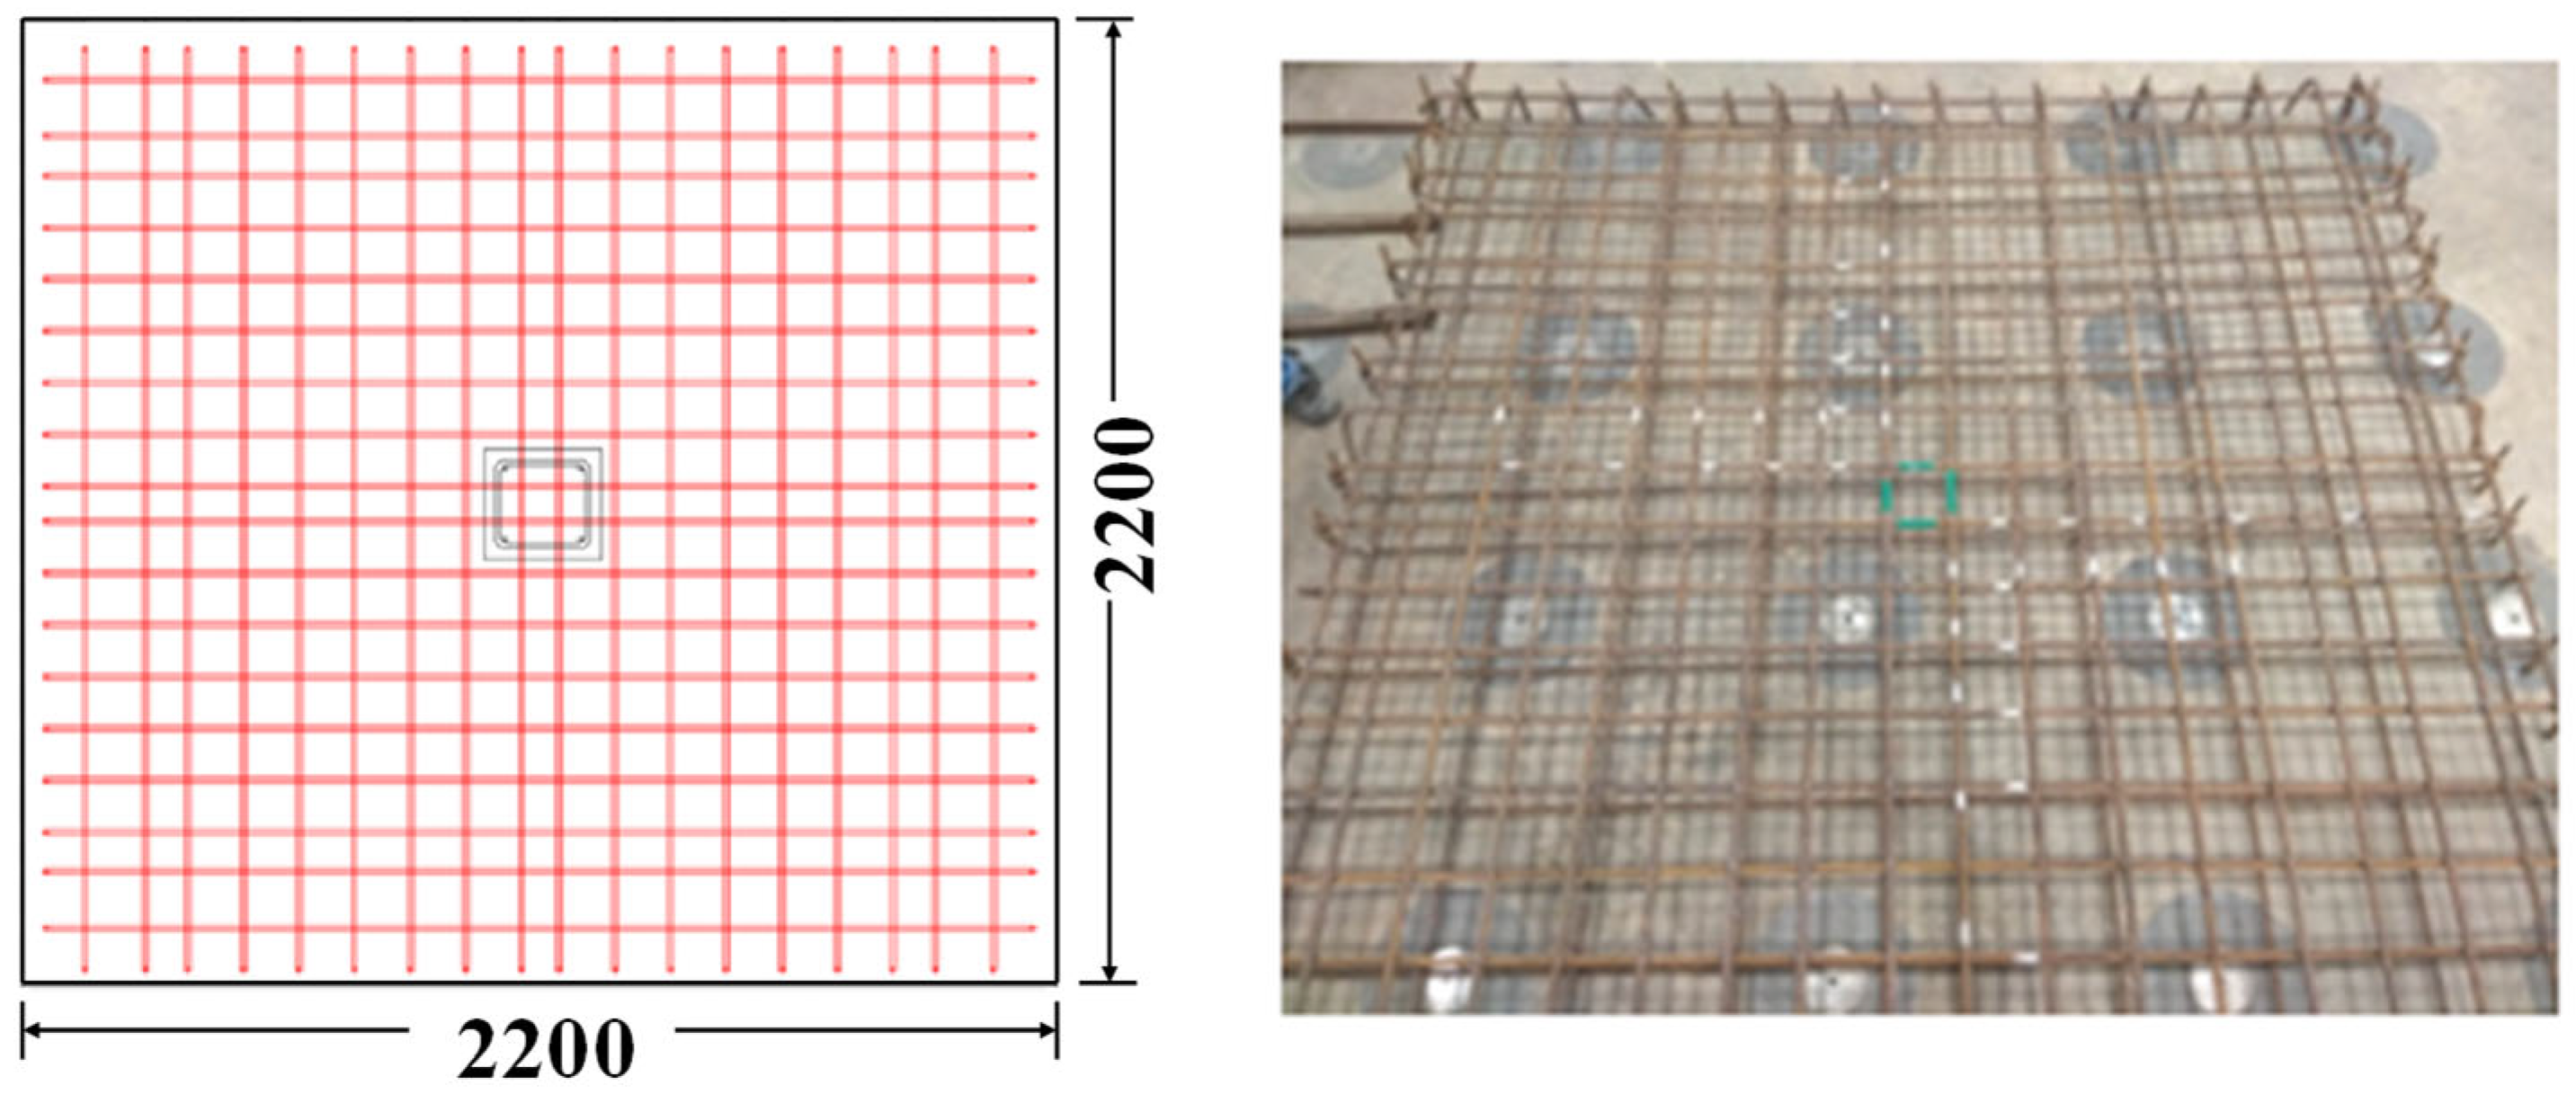
Figure 1. Reinforcing details of specimen.
Buildings 15 03226 g001
Figure 2. Loading setup.
Buildings 15 03226 g002
Figure 3. Locations of AE sensors.
Buildings 15 03226 g003
Figure 4. Load–displacement relationship curve and failure mode.
Buildings 15 03226 g004
Figure 5. Crack pattern of specimen.
Buildings 15 03226 g005
Figure 6. Distribution of AE hits.
Buildings 15 03226 g006
Figure 7. Distribution of AE amplitude by Sensor 3.
Buildings 15 03226 g007
Figure 8. Maximum amplitude of AE signals.
Buildings 15 03226 g008
Figure 9. Distribution of Ib-value.
Buildings 15 03226 g009
Figure 10. Cumulative AE energy and strain energy.
Buildings 15 03226 g010
Figure 11. RA–AF correlation distribution for RC slab–column specimen with various loading.
Buildings 15 03226 g011
Figure 12. Distribution of MDCT.
Buildings 15 03226 g012
Figure 13. The AE signal sequence with MDCT and normalized AE energy.
Buildings 15 03226 g013
Table 1. Material properties of reinforcement.
RebarYield Strength (MPa)Ultimate Strength (MPa)
T10564708
T14571721
Disclaimer/Publisher’s Note: The statements, opinions and data contained in all publications are solely those of the individual author(s) and contributor(s) and not of MDPI and/or the editor(s). MDPI and/or the editor(s) disclaim responsibility for any injury to people or property resulting from any ideas, methods, instructions or products referred to in the content.