Article

Youth Visual Engagement and Cultural Perception of Historic District Interfaces: The Case of Kuanzhai Alley, Chengdu

College of Geography and Planning, Chengdu University of Technology, Chengdu 610059, China
*
Author to whom correspondence should be addressed.
Buildings 2025, 15(17), 3224; https://doi.org/10.3390/buildings15173224 (registering DOI)
Submission received: 24 July 2025 / Revised: 22 August 2025 / Accepted: 28 August 2025 / Published: 7 September 2025
(This article belongs to the Special Issue Built Heritage Conservation in the Twenty-First Century: 2nd Edition)

Abstract

Historic districts are key urban spaces that convey cultural heritage and support tourism and social interaction. As the spatial interface shapes form and perception, this study explores youth-oriented visual behaviour and cognitive preferences regarding historic street interfaces. Using Kuan-Narrow Alley in Chengdu as a case study, we analysed eye-tracking data to assess visual engagement with interface elements. Architectural components received the highest attention for Total Fixation Duration, Fixation Count, and Visit Count, while commercial elements yielded a longer Average Fixation Duration. A multiple linear regression model identified Historical Linguistic Landscape (β = 1.088), Street Permeability (β = 0.401), and Street Width-to-Height Ratio (β = 0.178) as significant predictors of perceived usability, with Historical Linguistic Landscape proving most influential. These findings underscore the value of preserving cultural significance in streetscape morphology and provide theoretical and practical insights from a youth-centric perspective. By integrating eye-tracking with morphological analysis, the study offers a novel approach to understanding visual perceptions in historic districts. Despite limitations in sample size and scope, the study provides solid insights, with future research needed to broaden contexts for greater generalisability.

1. Introduction

Segmental planning in urban development results in significant variations in urban spatial structure [1,2]. Streets are both key markers of urban development and vital spaces for public interaction. However, under incremental development, indiscriminate construction is often misaligned with market needs, while homogenised interfaces erode the distinctiveness of historic districts. Historic districts are culturally sensitive urban areas distinguished by a dense presence of heritage architecture, coherent traditional spatial patterns, and an integration of natural and cultural landscapes [3,4]. They embody the city’s historical continuity and cultural identity through the interplay of cultural elements and physical space [5]. As early as 1933, the International Institute of Modern Architecture (IIMA) advocated preserving historically and culturally significant buildings and districts through appropriate planning strategies [6]. With the shift in urban production and consumption structures, public demand for cultural experiences and symbolic engagement has surged [7]. However, traditional street forms often struggle to adapt to the dynamic and ever-changing nature of contemporary urban development [8]. It is therefore crucial to examine which forms of street interfaces resonate with present-day users and how urban culture can be sustained and expressed through the everyday streetscape.
As the interwoven carrier of material space and cultural representation in historic districts, the street interface functions not only as the visual boundary that defines regional characteristics but also as the organizational medium for social activities and spatial functions. Its form and function directly influence cultural legibility and spatial sustainability. In architectural theory, the interface is commonly defined as the transitional boundary between a building’s interior and its external environment, constituting a fundamental element of spatial configuration [9]. Among these, the ground-floor interface plays a pivotal role in shaping pedestrian-level spatial perception and the experiential quality of the street environment [10]. The street interface not only reflects the architectural style, lifestyle, and aesthetic concepts of a specific historical period but also embodies the distinctive street texture shaped through urban development [4]. As research on urban street spaces continues to advance, scholars have come to recognise that streets function not only as channels for urban mobility, but also as spatial environments whose physical characteristics—such as scale, texture, permeability, and colour—play vital roles in shaping spatial perception [11], guiding visual cognition [12], enhancing affective experiences [13], and facilitating social interaction [14]. However, current research lacks a thorough analysis of historic district interfaces from the perspective of specific user groups. Given the crucial role of historic districts in cultural communication, there is an urgent need to analyse them through the lens of users’ perceptual preferences. Such an approach would help identify the key driving elements of cultural communication and provide essential theoretical and empirical support for future research and practice.
Environmental preference is defined as the positive emotional response elicited in individuals upon receiving environmental stimuli, processing environmental information, and accumulating environmental experiences [15]. It is a critical factor in spatial planning and design. Perception refers to the cognitive process of attaining awareness or interpreting sensory input [13], with visual behaviour serving as the primary and most direct means by which humans acquire information about the spatial environment [16,17]. Advances in physiological research have enabled eye-tracking technology to offer new methods for evaluating street interfaces by quantitatively analysing users’ visual preferences through eye movement data [18,19,20]. Compared to surveys and interviews, eye-tracking reduces bias from users’ expertise and expression, while enabling the visualisation of landscape attractiveness through heat and trajectory maps generated from transient data [21]. Numerous scholars have applied eye-tracking technology to the evaluation of spatial perception [16]. Hongguo Ren conducted an eye-tracking experiment on rural public spaces and proposed an emotion-driven design strategy for their enhancement [22]. Noland et al. integrated subjective qualitative analysis with quantitative eye-tracking data, providing a comprehensive assessment of urban public environments [23]. In summary, eye tracking is a feasible tool for spatial perception assessment, but research on youth visual cognition remains limited. As key urban space users, young people’s preferences are vital for guiding historic district renewal and adaptive design.
As key drivers of urban development, youth contribute fresh momentum to cultural continuity through their unique cognition and innovation. However, most studies on urban space have focused on groups like the elderly and children, overlooking the perspectives of youth [24,25]. Overlooking young people’s spatial preferences risks disconnecting urban development from cultural transmission, undermining their identity needs and hindering heritage continuity and sustainable urban growth. As emphasised by Shtebunaev et al. (2023) [26] and Kamani Fard and Paydar (2024) [27], young people possess distinct urban perceptions shaped by evolving cultural values, digital mediation, and unique place attachment mechanisms, making them a critical demographic for understanding and shaping historic district regeneration [26,27]. These factors encourage youth to seek visually engaging, shareable, and experientially rich urban spaces, while influencing how they interpret and emotionally connect with cultural symbols in historic environments. As emerging agents of cultural inheritance, youth warrant a deeper exploration of their engagement with and valuation of urban space [28]. Davison, in his community heritage study, emphasised the need for young people to reflect on the regenerative potential of heritage buildings and the need to reconceptualise architectural spaces from a youth-oriented perspective [29]. Amiruddin et al. further observed that Generation Z (Gen-Z) youth reshape the spatial narrative of historic districts through distinctive urban travel patterns [30]. However, this group exhibits a preference for cultural experiences that prioritise instant gratification [31]. Social media-driven digital culture fosters fragmented, feedback-oriented consumption among youth, potentially weakening their engagement with the deeper values of historic environments. Guiding them to balance rapid experiences with deeper appreciation is key to sustaining historic district development. However, existing studies are largely conceptual and lack empirical evidence on youth visual cognition, particularly regarding spatial interfaces and cultural symbols. To bridge this gap, this study integrates eye tracking, subjective evaluations, and a spatial analysis to examine youth preferences in historic district streetscapes.
In conclusion, this study examines Kuanzhai Alley in Chengdu as a representative Chinese historic district and establishes the relationship between street interface elements (e.g., D/H value, Street Permeability, and Visual Complexity of Colour) and visual perception preferences from a youth-friendly perspective. By integrating quantitative street indicators with eye-tracking technology, this research employs both subjective and objective approaches to explore optimization strategies for the interface morphology of historic districts. The findings aim to provide a theoretical foundation and practical reference for the inheritance and renewal of historic districts, address existing research gaps, and expand the cognitive framework within this field.
To achieve these aims, this study sets out to examine the visual behaviour and cognitive preference mechanisms of youth towards streetscape interfaces in historic districts, using Kuanzhai Alley in Chengdu as a case study. By constructing a multidimensional analytical framework grounded in the “culture-form-ecology” model, and integrating eye-tracking data with subjective evaluations, the study seeks to identify how key areas of interest (e.g., architectural, commercial, and linguistic elements) and spatial interface features (e.g., D/H Ratio, Street Permeability, and Historical Linguistic Landscape) influence youth satisfaction. This research also addresses the current gap regarding intergenerational perspectives in historic district studies, offering empirical insights to support youth-friendly and culturally sustainable renewal strategies.
To operationalise these aims and build on prior studies of spatial perception, cultural identity, and interface morphology, this study proposes the following hypotheses:
H1. 
Spatial interface features—such as D/H Ratio, Street Permeability, and Visual Continuity—significantly influence youths’ perceived satisfaction with historic district streetscapes.
H2. 
Visually salient architectural and commercial elements attract greater visual attention among youth, serving as key cognitive anchors in spatial perception.
H3. 
Cultural/symbolic features embedded in the street interface—particularly those reflecting historical identity (e.g., signage and linguistic landscapes)—positively shape youth spatial cognition and strengthen affective engagement.

2. Materials and Methods

2.1. Study Area

This study focuses on Kuanzhai Alley, one of Chengdu’s three major historic conservation districts and an officially designated “Characteristic Chinese Commercial Pedestrian Street.” As illustrated in Figure 1, covering approximately 3.2 hectares and consisting of three parallel lanes (broad, narrow, and well alley), it is widely regarded as a national example of historic preservation and adaptive reuse. As the only remaining spatial imprint of Chengdu’s ancient “Millennium Shaocheng,” the site integrates Qing-era courtyard dwellings, Western Sichuan vernacular architecture, and hybrid Sino-Western elements. Since its inclusion in Chengdu’s Historic and Cultural City Conservation Plan in the 1980s, Kuanzhai Alley has undergone functional transformation and spatial revitalization, showcasing the integration of heritage conservation with contemporary urban life.
Today, Kuanzhai Alley also functions as a key site for cultural continuity and youth engagement. Its hybrid streetscape blends traditional architectural forms with modern commercial programming, attracting a large youth demographic through creative events and festivals. With its distinctive spatial form, cultural symbolism, and youth relevance, it serves as an ideal case for examining the relationship between historic district interfaces and youth visual perception and spatial behaviour.

2.2. Eye-Tracking Experiments

Eye-tracking technology enables the quantitative analysis of visual behaviour by recording eye movement trajectories and gaze distributions when observing a scene. Based on the pupil–corneal reflection (PCR) method, it accurately captures gaze coordinates and fixation durations [32]. This technique supports the real-time tracking of visual attention, gaze patterns, and cognitive processes, providing objective data for studies on spatial perception and behavioural preferences. In this study, eye-tracking metrics are used to examine youth visual engagement with cultural symbols in historic districts (e.g., traditional motifs and inscribed plaques), offering empirical insights into the sustainable transmission of cultural heritage. The experimental procedure is detailed in the following sections.

2.2.1. Experimental Image Collection

Empirical studies in visual perception research have confirmed that images and videos can reliably simulate real-world environments, with virtual stimuli eliciting physiological and psychological responses comparable to those of actual settings [33]. Accordingly, standardised image acquisition was conducted in Kuanzhai Alley to ensure consistent visual stimuli. To reduce external variability (e.g., weather, pedestrian flow, and lighting), photographs were taken on a clear weekday morning (8:00–10:00 AM) with the camera positioned at a height of 1.6 m. Sampling began at the main entrance with 20 m intervals, supplemented by intersection points to capture diverse streetscape views. A total of 67 high-resolution images (3600 × 2400 px) were collected; after excluding visually ambiguous or overly complex scenes, 40 valid samples were retained for the satisfaction survey. From these, 18 visually salient images were selected for eye-tracking experiments.

2.2.2. Recruitment of Experimental Subjects

Studies indicate that eye-tracking experiments with over 30 participants yield highly consistent results [34]. Accordingly, 40 young participants (20 per gender) were recruited to control for gender effects. After data screening, 36 valid samples with eye-tracking accuracy above 70% were retained, including 19 with relevant professional backgrounds and 17 non-professionals, to limit bias from domain expertise. To assess sample adequacy, a post hoc power analysis (α = 0.05) was performed, showing that with N = 36, the study achieved statistical power > 0.95 for detecting medium effects in paired-sample tests (Cohen’s d = 0.50) and approximately 0.85–0.90 in one-way ANOVA with a medium effect size (Cohen’s f = 0.25), both exceeding the conventional 0.80 threshold. Participants were familiarised with the eye-tracking system prior to the experiment but were not informed of the study’s purpose to avoid perceptual bias. All had normal or corrected vision (≥1.0) and no ocular impairments; professional lenses were used to ensure optimal visual clarity.

2.2.3. Experimental Preparation

The experiment employed the aSeeGlasses wearable eye-tracking system (60 Hz, 7invensun Technology Co., Ltd., Beijing, China) with image stimuli presented on a 14-inch MacBook Pro (3024 × 1964 px, Apple Inc., Cupertino, CA, USA). Data were processed via the aSeeStudio platform to generate gaze reports and heat maps. All participants provided written informed consent. Experimental conditions were standardised: ambient lighting was maintained at ~400 lux using a digital illuminance meter (Extech Instruments, Nashua, NH, USA), and noise levels were kept below 40 dB with an HS5671B spectrum analyser (RIGOL Technologies, Beijing, China) to minimise environmental interference.

2.2.4. Conducting the Eye-Tracking Experiment

Participants first completed a three-point calibration while wearing the head-mounted eye-tracking device. To reduce environmental stress, instrumental music was played during stimulus presentation. Two unannounced warm-up images were shown prior to the experiment to facilitate acclimation. The 18 experimental images were then displayed in randomised order for 20 s each, with 2 s blank intervals to minimise visual adaptation effects.

2.2.5. Filling in the Satisfaction Scale

After the eye-tracking session, participants completed a five-point Likert scale rating of 40 valid images based on overall visual preference. This subjective assessment captured individual perceptions of historic district interface features and provided multi-dimensional data for subsequent analysis, linking visual behaviour with cognitive preference. The approach supports a systematic investigation of preference patterns relative to interface characteristics.

2.3. Methodology

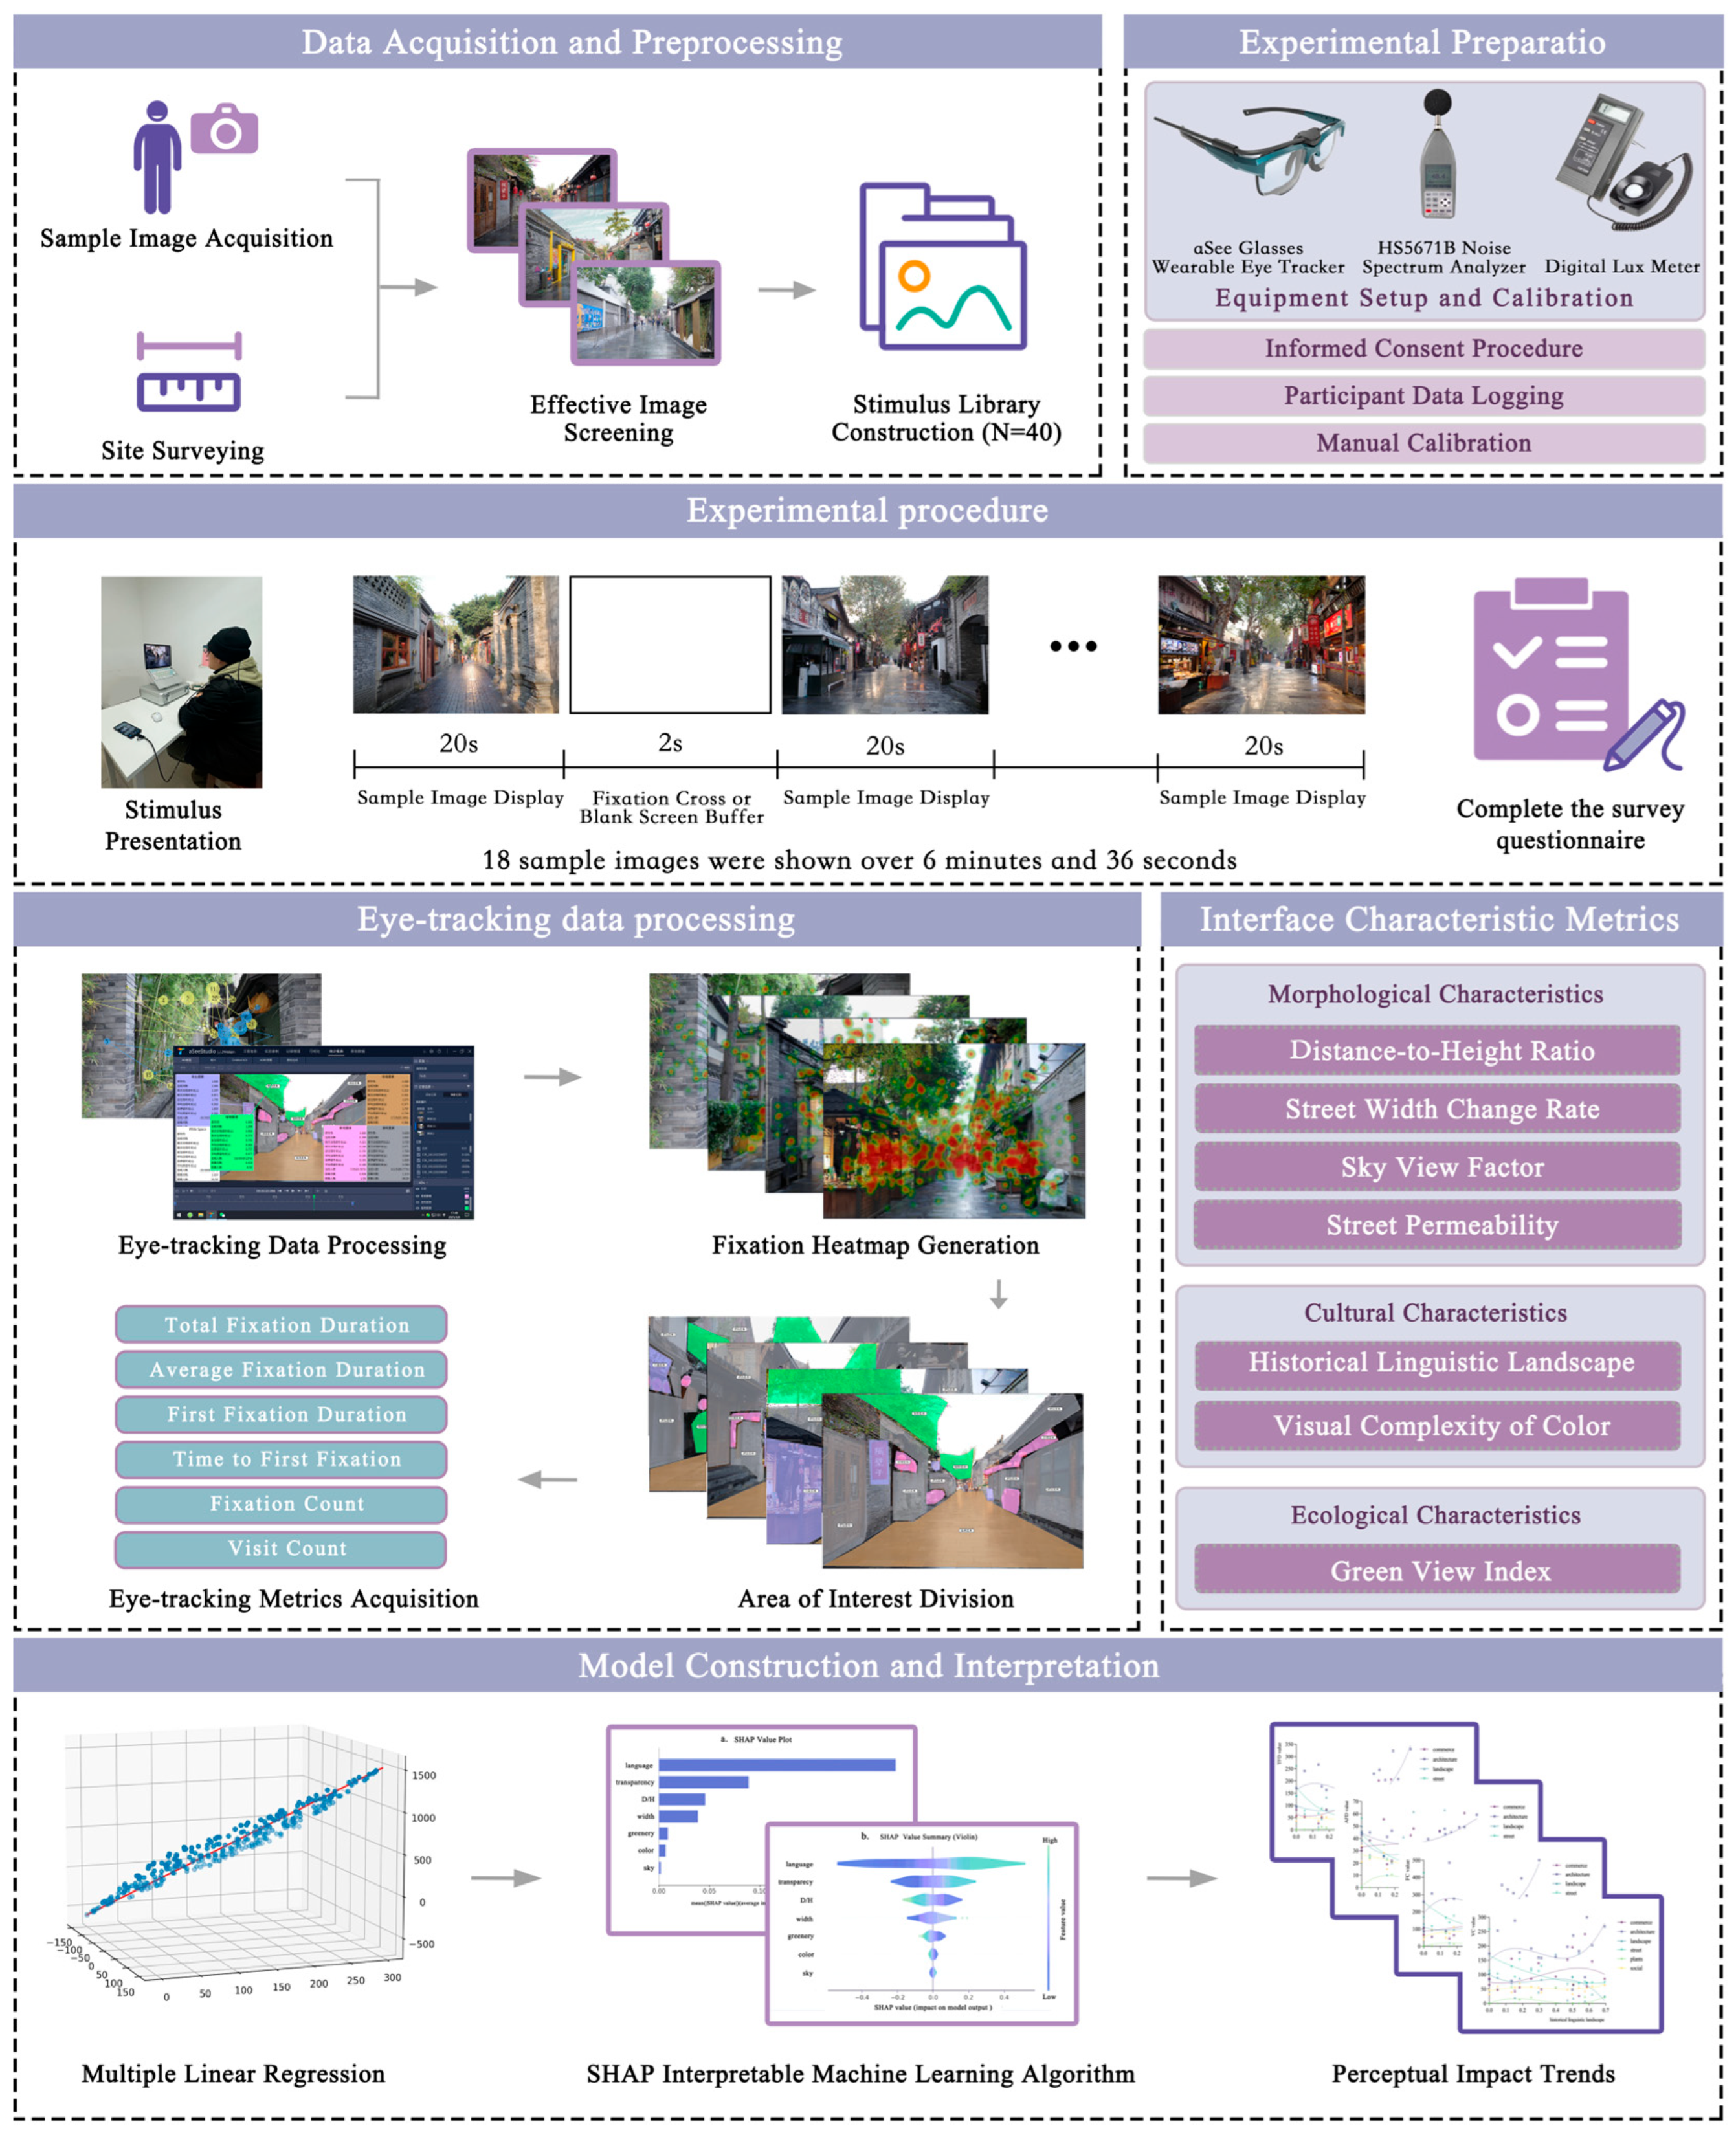
This study employed a structured workflow of data collection, experimental analysis, and modelling (Figure 2). Valid samples were derived from site mapping, eye tracking, and perceptual evaluation. Using aSeeStudio, images were segmented into AOIs, and six visual metrics were extracted to capture youth visual behaviour. Street interface characteristics were analysed across 40 images, forming a “culture–form–ecology” framework based on seven indicators. Python 3.12 (Python Software Foundation, Wilmington, DE, USA)-based modelling involved data preprocessing, multiple linear regression, and SHAP analysis to interpret feature influence, providing insights for the adaptive reuse of historic district interfaces.

2.3.1. Eye-Tracking Technology

  • Visual Areas of Interest Mapping
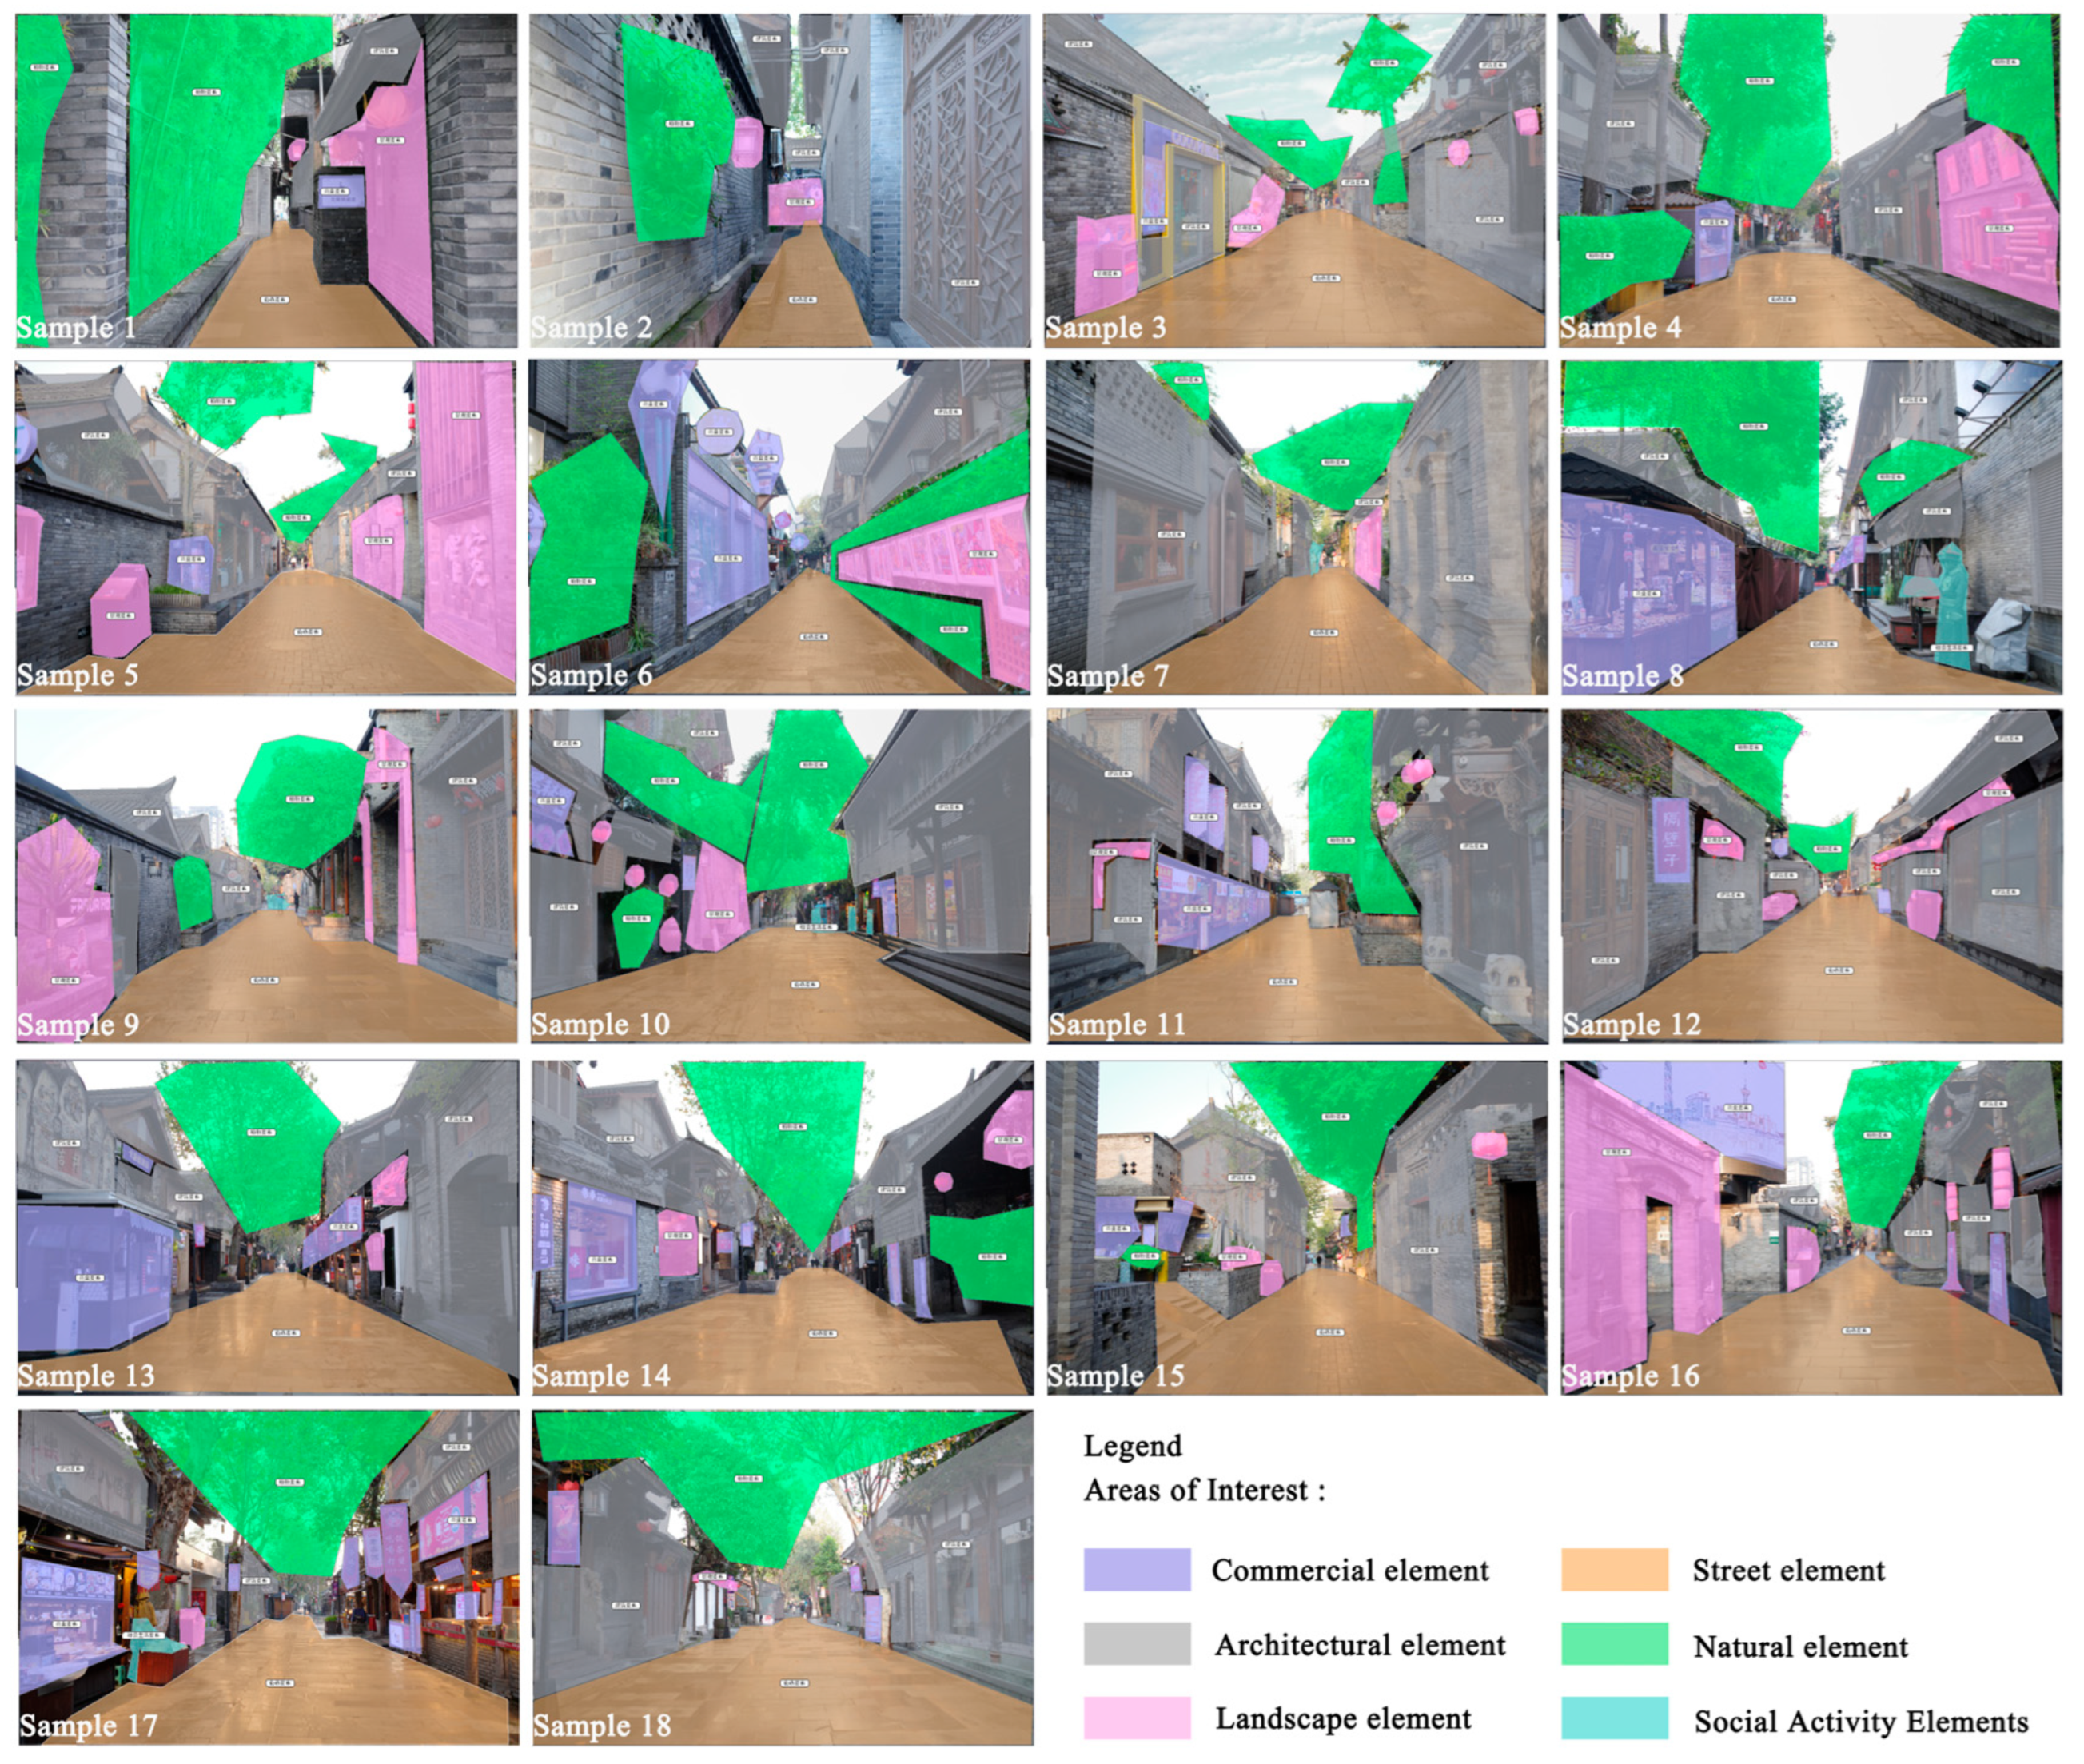
In eye-tracking analysis, areas of interest (AOIs) structure image content for systematic comparison of youth attention across spatial interfaces [18]. This study categorises areas of interest into three domains—built environment, natural elements, and socio-behavioural elements—with the built environment further classified into four specific types (Table 1). Modern buildings without historical or cultural value were excluded due to commercial redevelopment. AOI segmentation (Figure 3, Table 1) supports detailed analysis of youth visual engagement, guiding street-level spatial optimization strategies.
2.
Eye-Tracking Metric Selection
Visual behaviour is a key indicator for identifying attentional focus and emotional bias, offering an objective reflection of pedestrians’ emotional responses to architectural heritage [35]. Within the eye-tracking framework, gaze metrics effectively capture physiological responses, with fixation duration widely recognised as a reliable proxy for visual attractiveness [36,37]. As summarised in Table 2, this study employs six eye-tracking indicators—Total Fixation Duration (TFD), Average Fixation Duration (AFD), First Fixation Duration (FFD), Time to First Fixation (TFF), Fixation Count (FC), and Visit Count (VC)—with definitions and interpretations provided in the table.

2.3.2. Historic District Interface Characterisation and Indicator Construction

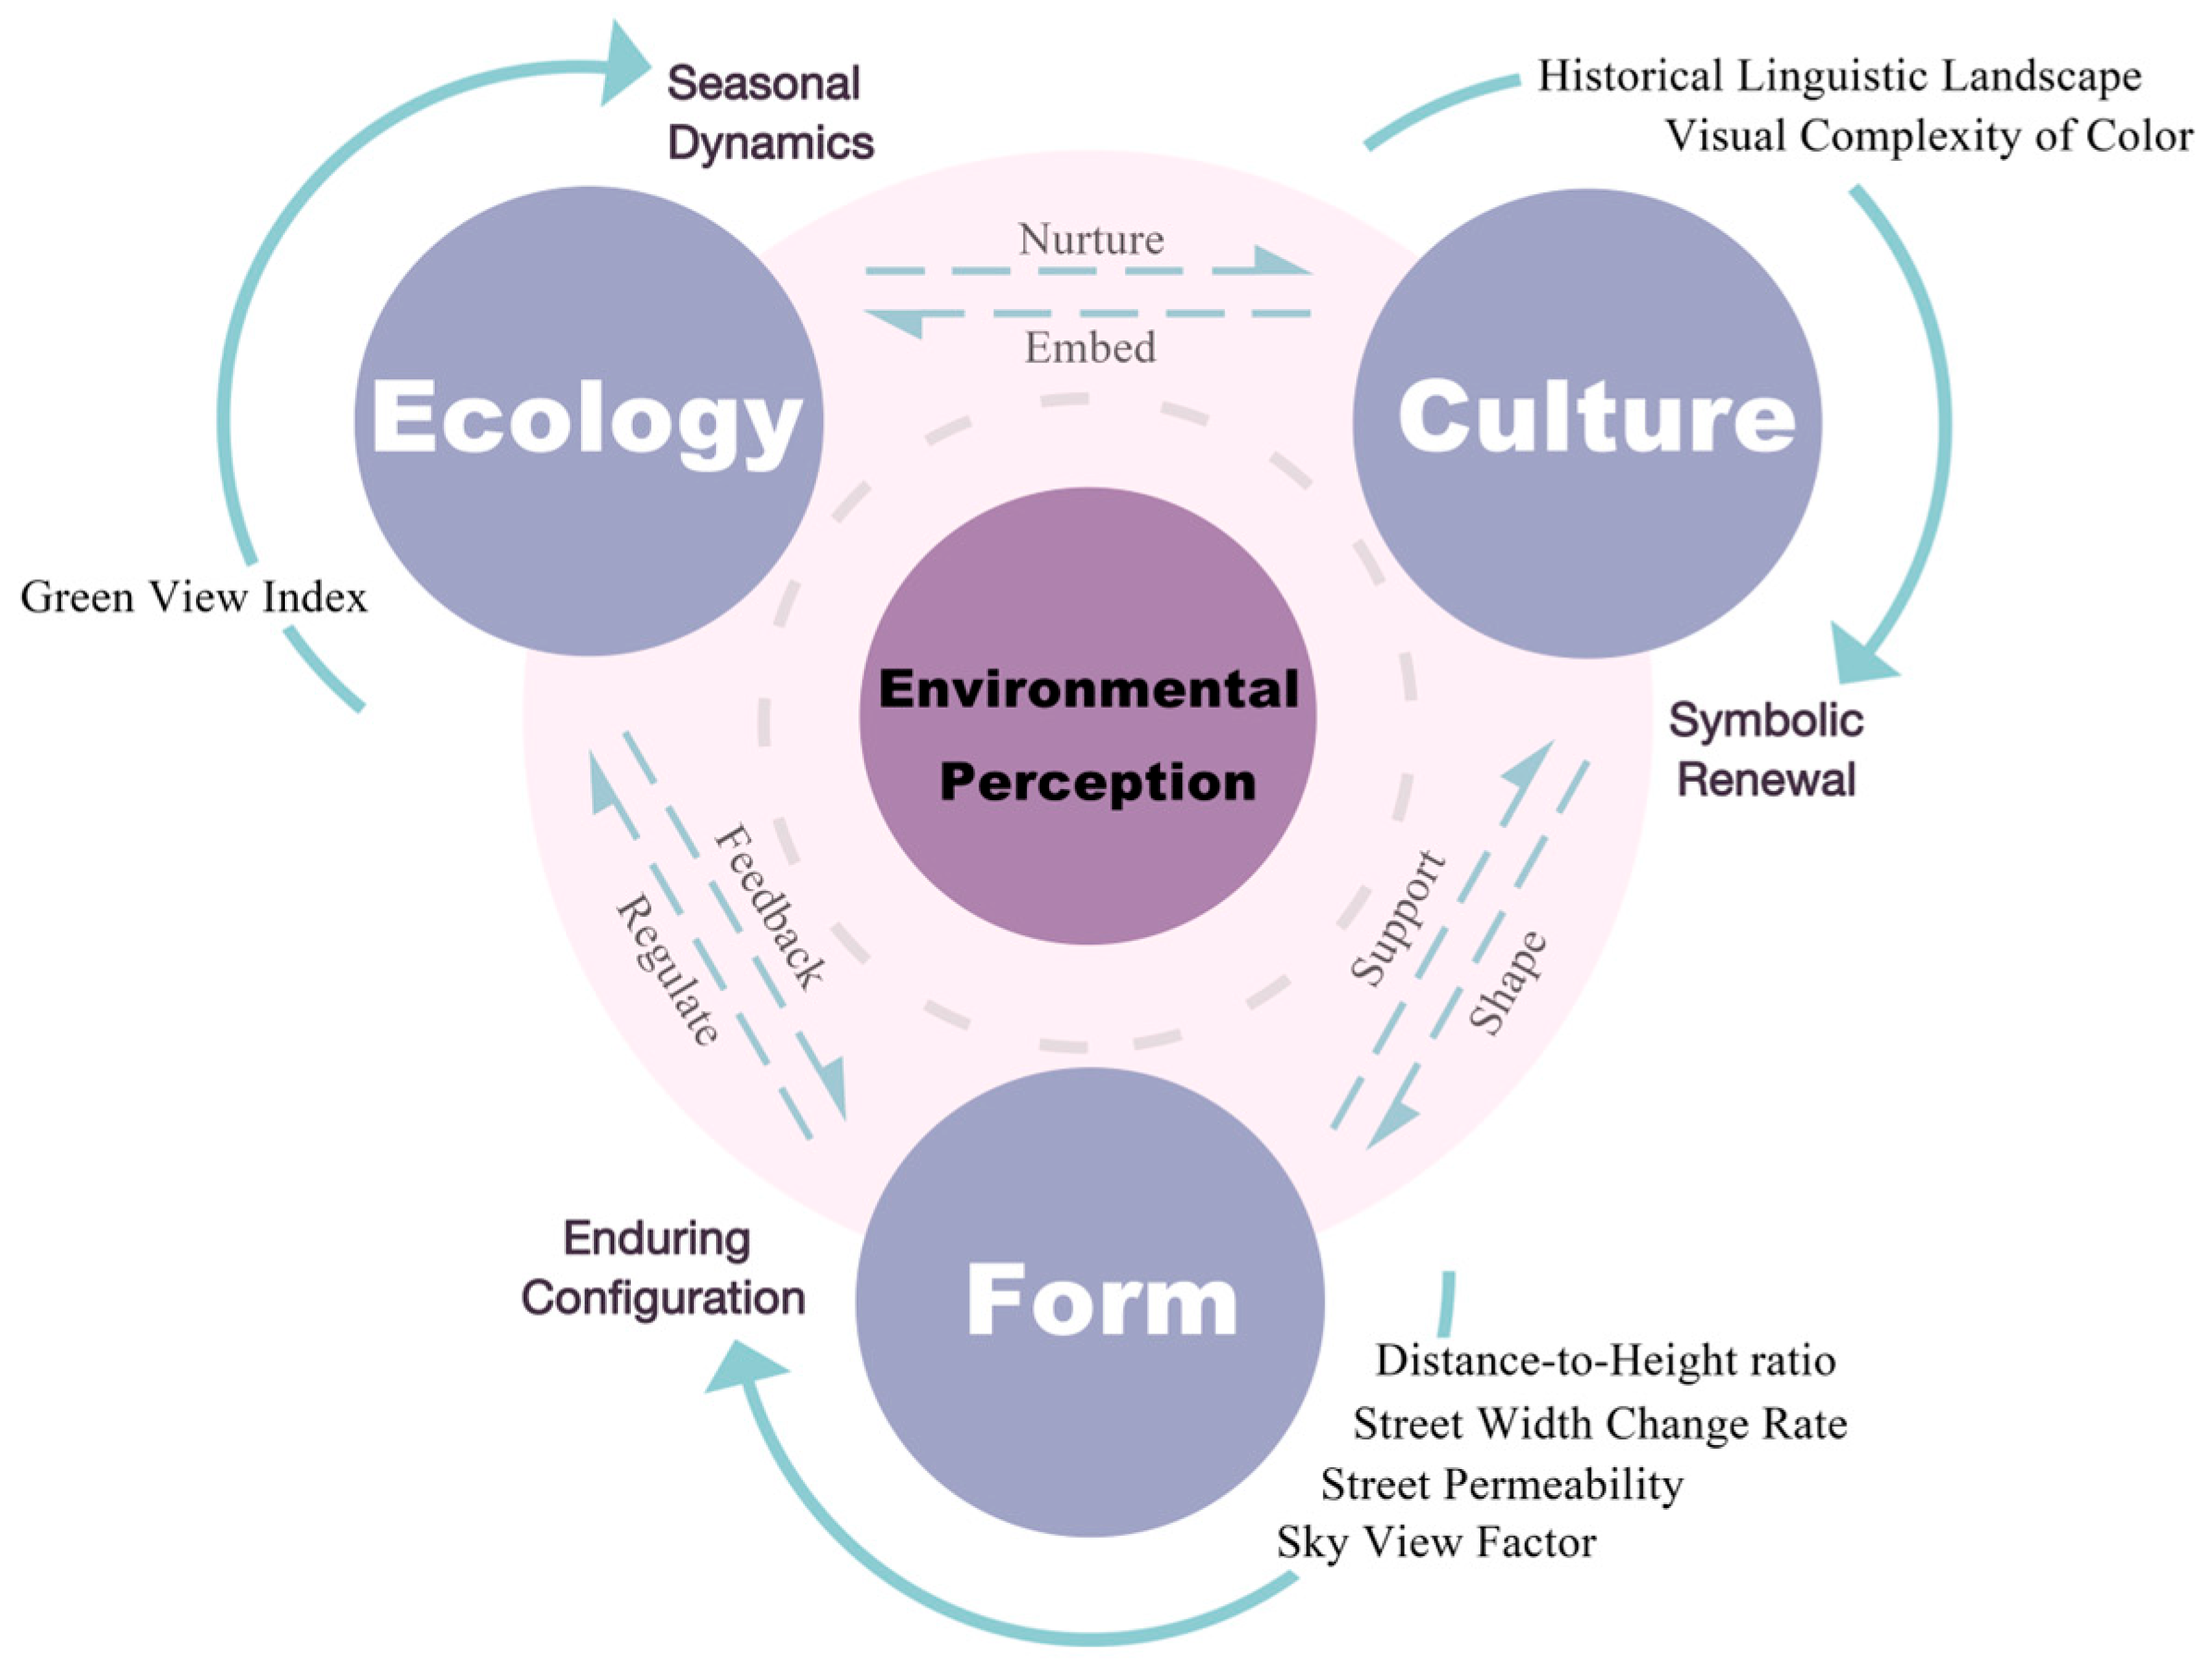
This section categorises street interface indicators, recognising interface morphology as a key factor in shaping pedestrian spatial perception [11,12,13]. Building on prior studies and its dual measurability, this study develops a spatial evaluation framework based on the integrated dimensions of form, culture, and ecology, as illustrated in Figure 4. The framework is theoretically underpinned by environmental preference theory [15] and legibility theory [38]. Environmental preference theory, which identifies coherence, complexity, legibility, and mystery as key factors shaping environmental appeal, supports the form dimension by explaining how spatial morphology and visual structure influence preference and informs the ecology dimension through the perceptual response to natural and physical environmental cues. Legibility theory, which emphasises the clarity of spatial organisation in aiding orientation and engagement, reinforces the form dimension by linking spatial configuration to navigability and underpins the culture dimension by explaining how symbolic and historical elements contribute to mental maps and place identity. By quantifying interface characteristics, the framework clarifies the relationship between street design and youth perceptual preferences, providing a theoretical basis for exploring design–behaviour interactions.
Based on historic district morphology, the Distance-to-Height Ratio (D/H) is a key metric for evaluating spatial scale, defined as the ratio between the street width (distance between buildings, D) and building height (H) on both sides of the street [4]. An optimal street scale is typically achieved when D/H ranges between 1 and 2 [12,13] and when street widths fall within 20–25 m [39,40,41]. In this study, D/H is calculated using average building height and street width within 20 m of each image point. To quantify horizontal spatial variation, the Street Width Change Rate (SWCR) is used, calculated as the ratio of the width range (max–min) to the average width [42,43,44]. The Sky View Factor (SVF) captures vertical openness, defined here as the proportion of visible sky in an image. Using Python, images are converted to grayscale and threshold-segmented; the ratio of white pixels represents sky visibility [45,46]. Street Permeability (SP) reflects the visual accessibility of ground-floor interfaces through transparent elements like doors and windows [47]. High SP can promote prolonged pedestrian engagement, especially among youth [44]. This study calculates SP by measuring the area of door and window openings within 20 m on both the ground and second floors of street-facing buildings.
Cultural character is a defining attribute of historic districts, often expressed through architectural details, paving materials, colour schemes, and other visual cues. In the present study, where architectural style and materials are largely consistent across samples, analysis focuses on two key distinguishing features: the Historical Linguistic Landscape and Visual Complexity of Colour. Historical Linguistic Landscape (HLL) represents the proportion of signage (e.g., shop signs and billboards [48]) containing culturally relevant elements, indicating the street’s cultural atmosphere [49,50,51]. Visual Complexity of Colour (VCC) is assessed using the Herfindahl–Hirschman Index (HHI) based on Python-extracted colour data, capturing multidimensional variation in colour richness and distribution [14,52,53]. HHI was employed to quantify multi-dimensional colour distribution, which indirectly incorporates regional palette characteristics and thus reflects the cultural context of Sichuan’s architectural heritage.
Ecological features, particularly greenery, play a vital role in activating urban spaces. The Green View Index (GVI) is a widely adopted metric for quantifying vegetation’s impact on visual perception and psychological well-being [54,55]. We quantified the visible proportion of greenery using HSV colour space conversion in Python. Green pixel ratios were computed from defined hue thresholds to assess ecological visibility [56], and the specific calculation method is summarised in Table 3.

2.3.3. Data Analysis Methods

  • Analysis of Variance
Analysis of Variance (ANOVA) is a statistical method that partitions total variance to assess the effects of multiple factors on an outcome variable. Unlike pairwise tests, it evaluates all groups simultaneously, reducing Type I error and enhancing robustness.
  • Data Testing and Conversion
The Shapiro–Wilk test, known for its high statistical power especially with small samples, is used to assess the normality of street characteristic data. It is more effective than tests like the Kolmogorov–Smirnov test in detecting deviations from normality. The formula is as follows:
W = i = 1 n / 2 a i X n + 1 i X i 2 i = 1 n x i x ¯ 2
where n is the sample size, X i denotes the ith observation, and x ¯ is the sample mean.
The Box–Cox transformation is employed to stabilise variance and normalise highly dispersed street-level data, ensuring key assumptions for parametric analysis. It effectively enhances normality, satisfies chi-square test conditions, and improves linearity. The transformation formula is as follows:
y λ = y λ 1 y , λ 0 ln y , λ = 0
where y: original data and λ : transformation parameters.
The Durbin–Watson statistic is used in multiple linear regression to detect autocorrelation in residuals, which are assumed to be independent under classical regression assumptions. It quantifies serial correlation and helps assess model validity. The calculation formula is as follows:
D - W   =   t 2 n e t e t 1 2 t = 1 n e t 2
where n: sample size and e t : period t residual of e ( e t = y t y ¯ t ; y t : actual observed value of the dependent variable; y ¯ t : predicted value).
  • Multiple Linear Regression
This study employs multiple linear regression (MLR) to examine how historic district interface features affect young people’s perceived space use. As a key method in statistical learning, MLR captures the influence of multiple spatial variables on user satisfaction, quantifying both the strength and direction of each factor’s impact. The resulting model provides empirical support for spatial design and planning. The corresponding regression equation is as follows:
Y   =   β 0 + β 1 X 1 + β 2 X 2 + + β k X k + ϵ ο
where Y represents the dependent variable; β 0 is the intercept, representing its expected value when all predictors are zero; β 1 , β 2 ,…, β k are regression coefficients indicating the influence of each independent variable on Y. ϵ ο denotes the error term.
  • SHapley Additive exPlanations
The SHAP (SHapley Additive exPlanations) method decomposes model predictions into the contributions of individual features, visually conveying both the magnitude and direction of each feature’s impact. In this study, SHAP analysis is used to identify which interface characteristics of historic districts significantly influence perceived picture satisfaction. A multiple linear regression (MLR) model was constructed to quantify these relationships, with SHAP further applied to interpret the model outputs. This approach offers empirical insight into the role of interface features in shaping visual perception and supports evidence-based design strategies for enhancing user satisfaction.

3. Results

3.1. Youth Visual Perception Preferences

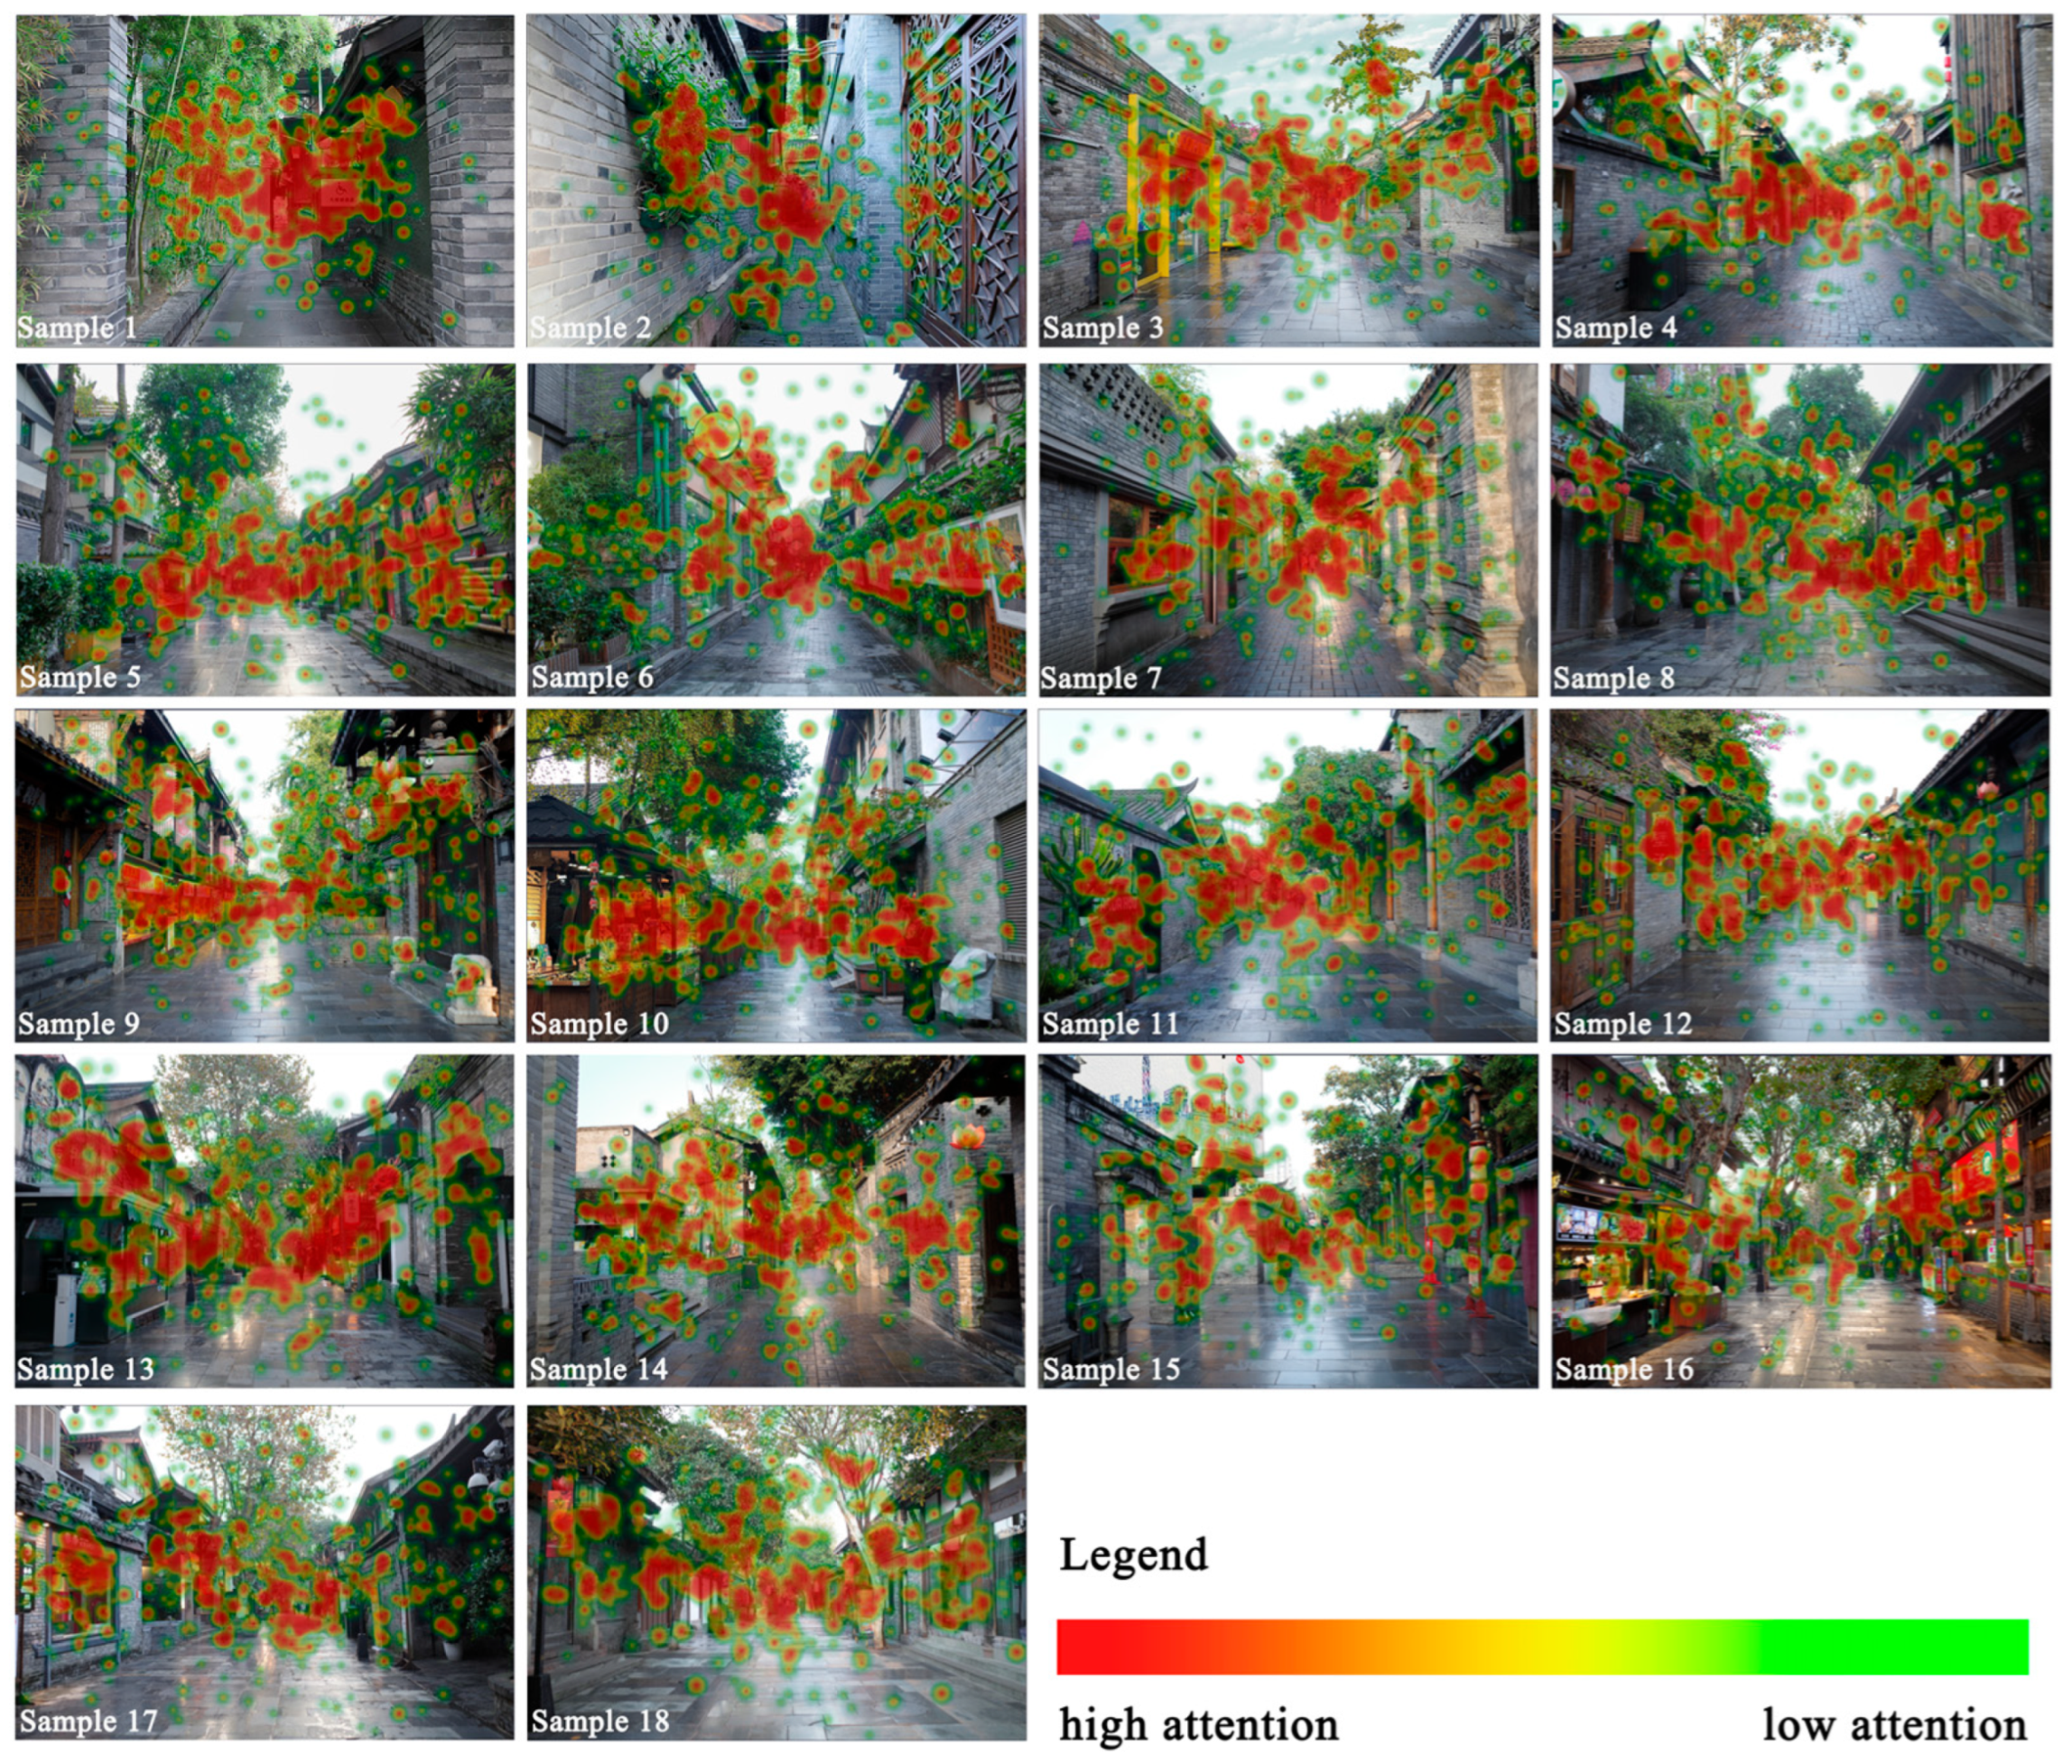
By overlaying valid eye-tracking data from 36 young participants, a heat map was generated to visualise the distribution of their visual attention. Red areas indicate high levels of attention, while yellow and green reflect moderate to low levels of attention [17]. As shown in Figure 5, narrower street environments (e.g., Samples 1 and 2) drew concentrated visual attention to plant elements, with gaze points primarily clustered along the central street axis. In contrast, larger and more complex spaces elicited more dispersed attention. The heat maps for Samples 7, 9, 10, and 17 show consistent attention was paid to display windows, highlighting the strong salience of commercial elements. However, in Sample 16, in which commercial windows dominated the view, their visual attention became more dispersed. In Samples 8, 9, 12, and 13, architectural elements such as gateways, plaques, and couplets garnered greater visual attention, largely due to the Historical Linguistic Landscape (HLL), which conveys explicit semantic content and enhances cognitive engagement. In contrast, other culturally significant components—such as eaves, doorframes, and ornamental door carvings—elicited comparatively limited visual interest. Overall, commercial stimuli dominate their visual perception, while historical and cultural elements receive comparatively limited attention.
Figure 6a illustrates gaze duration across areas of interest (AOIs), revealing distinct attention patterns among the young participants. Architectural elements showed the highest Total Fixation Duration (TFD = 3259.79) and First Fixation Duration (FFD = 1554.4), indicating strong and immediate engagement due to their informational richness. In contrast, street elements—despite reflecting the cultural context—received limited attention and recorded the highest Time to First Fixation (TFF = 2659.51), suggesting low visual salience. Among the four eye-tracking metrics, architectural and commercial elements stood out: architecture led in terms of the TFD and TFF, while commercial features showed the highest Average Fixation Duration (AFD = 618.31) and faster initial engagement.
Figure 6b illustrates the frequency of return visits to visual elements by the young participants. Fixation Count measures the total number and duration of their gazes, while Visit Count reflects distinct gaze returns. Across all elements, FC values consistently exceed VC values, indicating a tendency toward prolonged and focused attention on individual features. Architectural elements (FC = 4458 and VC = 3042), botanical elements (FC = 2096 and VC = 1589), and commercial elements (FC = 1618 and VC = 1282) ranked highest in both metrics, highlighting their strong visual appeal. Despite shorter fixation durations, plant elements were frequently revisited. Architectural features attracted the most sustained attention, outperforming commercial elements in consistently engaging viewers. These patterns reflect the influence of spatial structure and informational density on visual behaviour in historic districts.
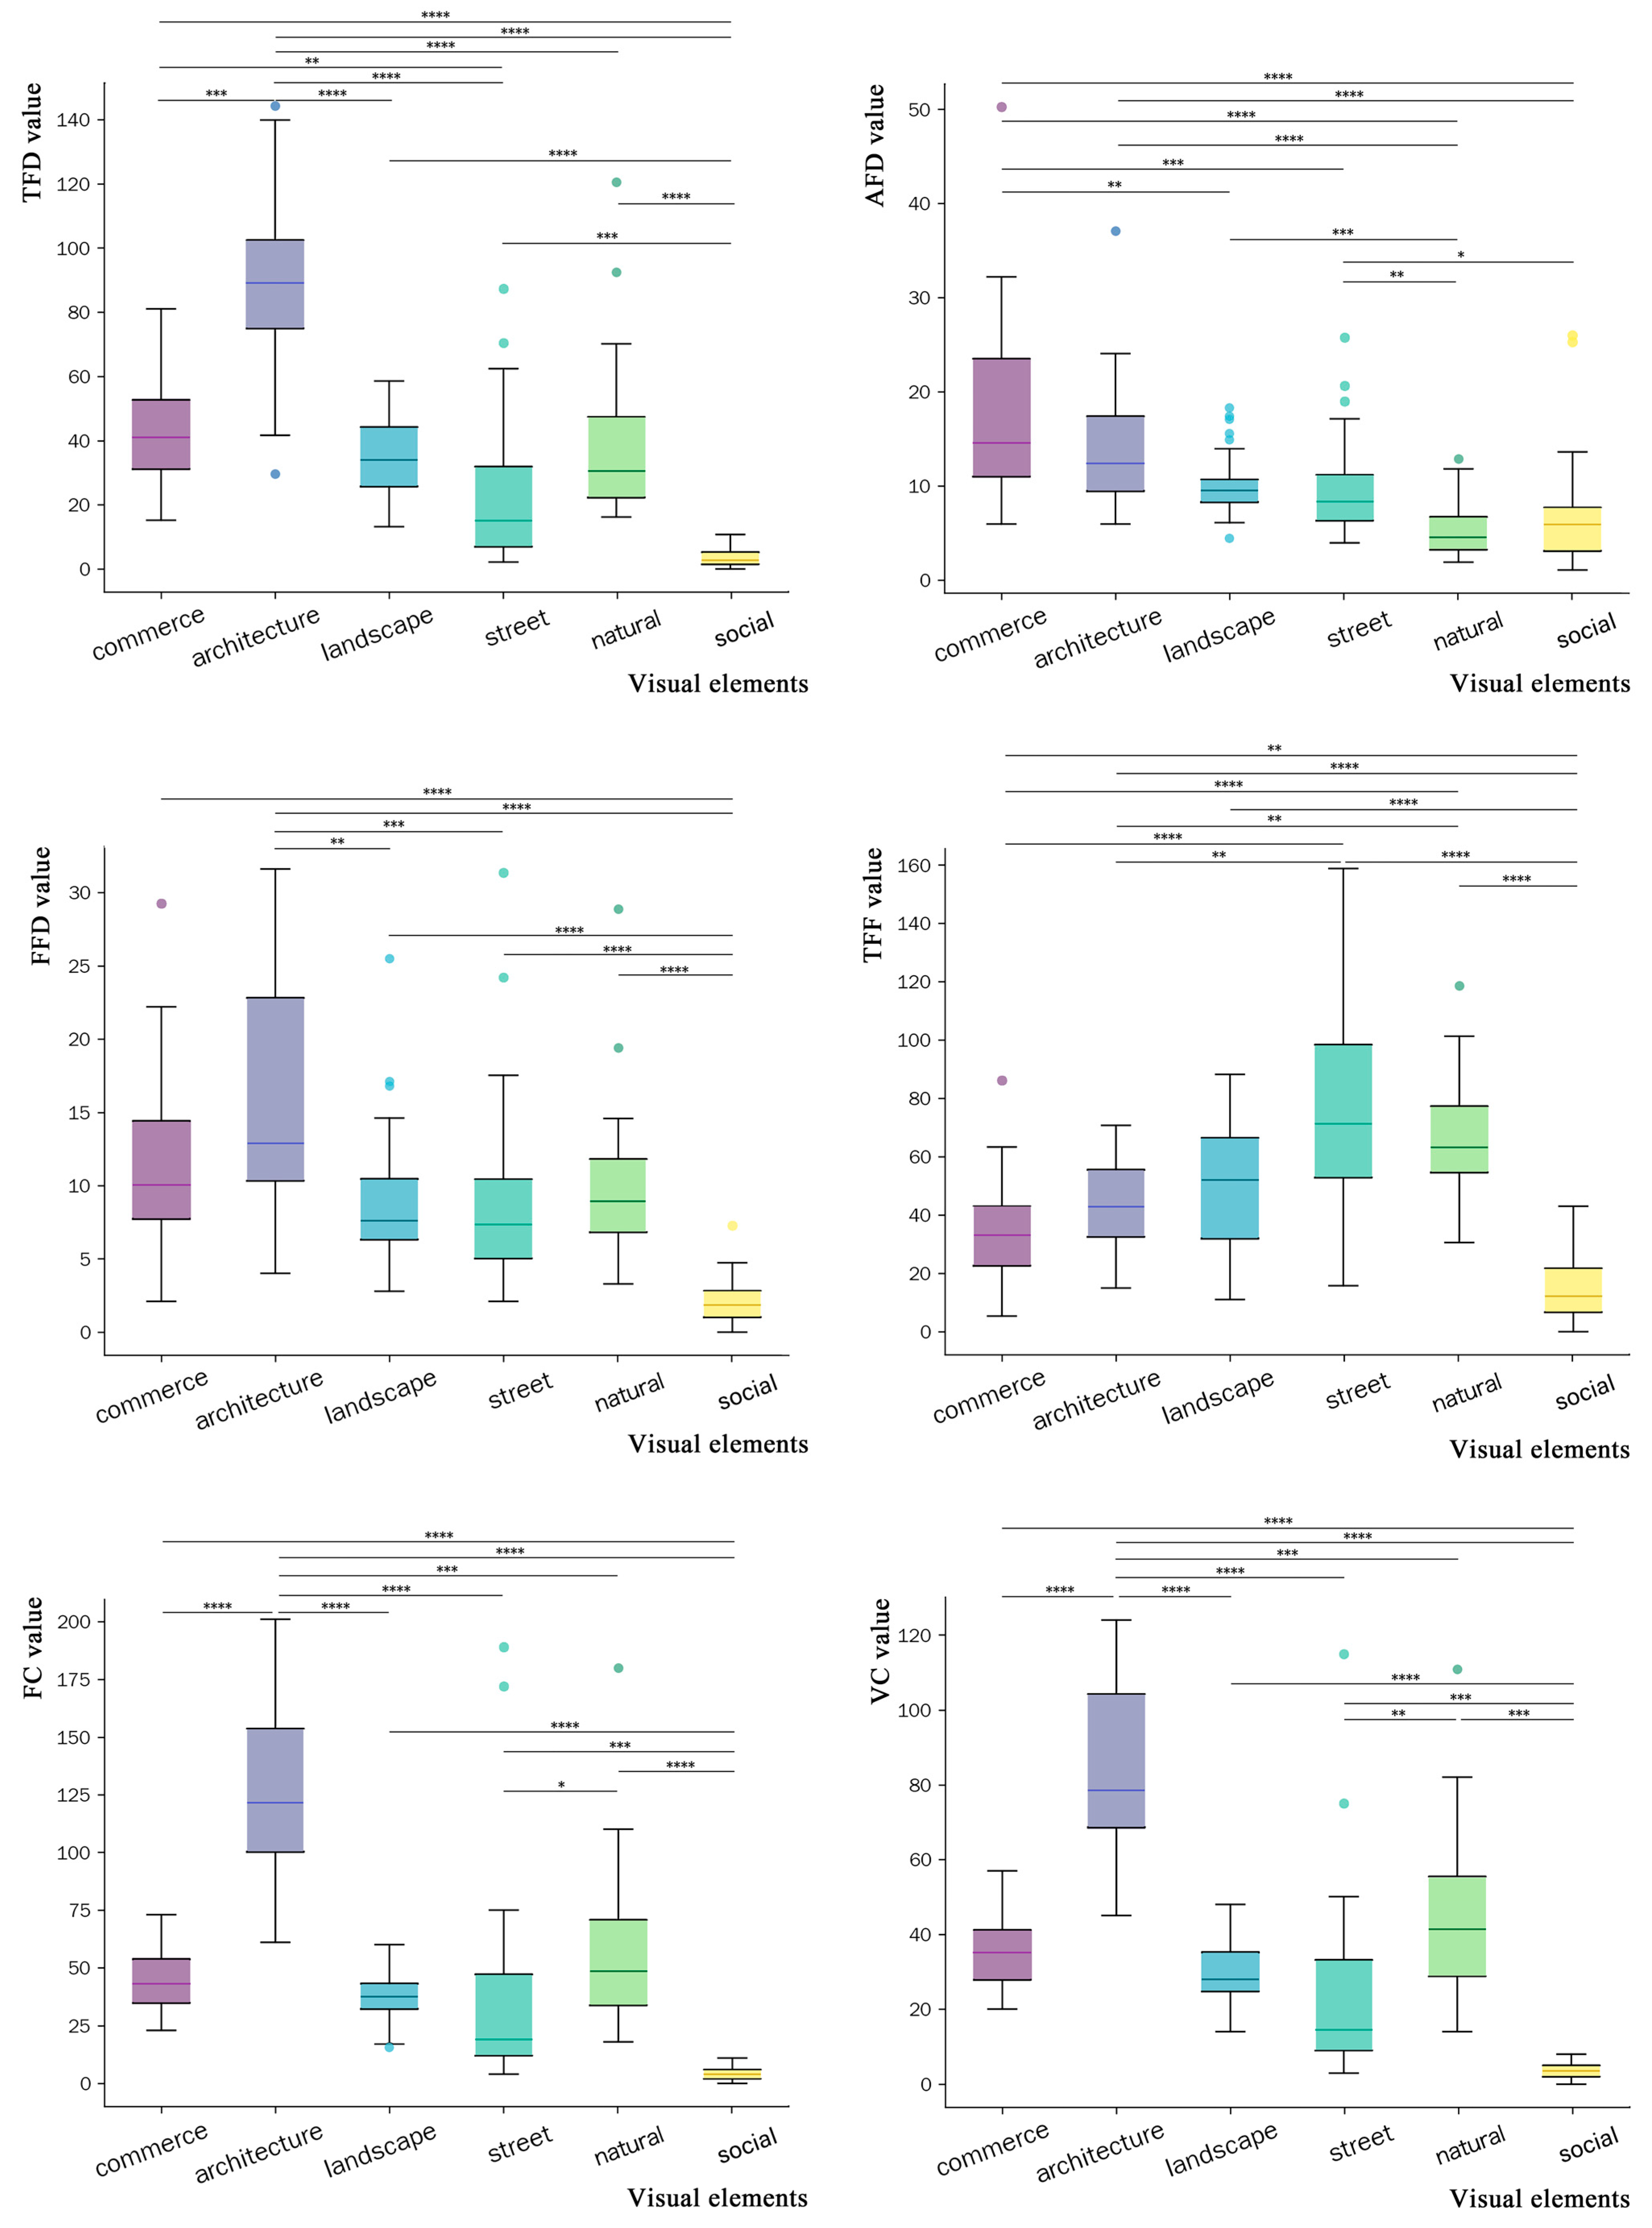
As shown in Table 4, the ANOVA results (p < 0.01) indicate significant differences across spatial elements, with the box plots in Figure 7 visualising this variation. Architectural elements showed the highest central values for TFD (41.363), FFD (15.480), FC (123.833), and VC (84.472). However, their interquartile ranges exceeded 50, indicating high variability in visual engagement. Commercial elements, second in overall attention, showed greater clustering than architectural features. They also recorded the highest AFD (18.038), underscoring their visual appeal. Natural elements, though less fixated on initially (TFF = 73.875), had high revisit rates, indicating delayed yet repeated engagement. Social life elements had the lowest dispersion across metrics due to their controlled exclusion in image sampling, resulting in a limited data concentration.
Figure 7 uses horizontal lines and asterisks to indicate the ANOVA results, highlighting statistically significant differences among visual elements. The analysis reveals marked variation across eye-tracking metrics, with architectural elements consistently showing higher values, likely due to their distinctive visual features that draw sustained attention. In contrast, street elements exhibit lower values, reflecting limited visual appeal within the historic district interface. These findings provide critical insight into how young users allocate attention and process spatial information in response to urban visual stimuli.

3.2. Interface Characteristics and Subjective Preference Analysis Results

3.2.1. Satisfaction Preference Results

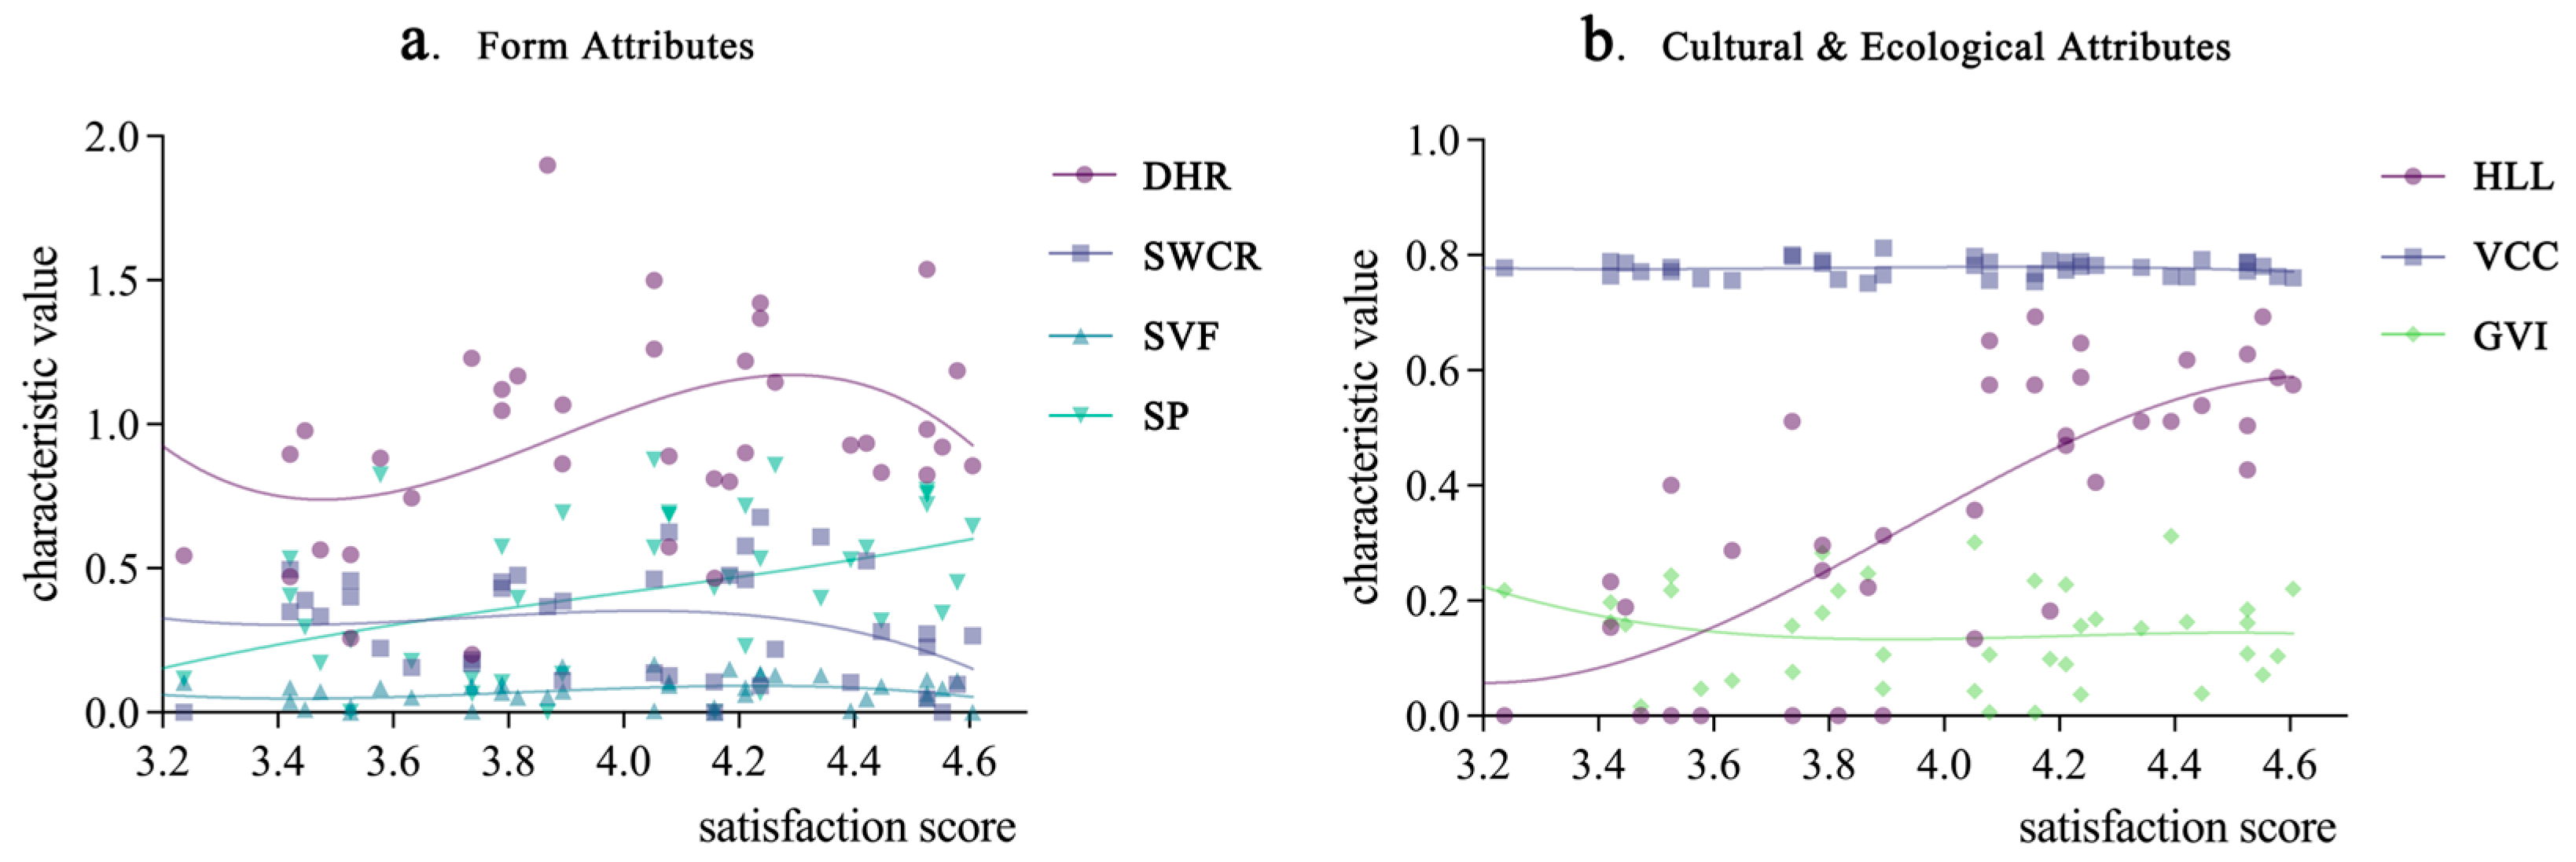
Figure 8 illustrates the relationship between historic district interface characteristics and youth satisfaction preferences. Figure 8a depicts the variations in four morphological interface characteristics—D/H Ratio (DHR), Street Width Change Rate (SWCR), SkyView Factor (SVF), and Street Permeability (SP)—as satisfaction levels increase. The DHR shows a non-linear trend, with peak satisfaction at 0.9–1.2. A lower SWCR is linked to higher satisfaction, indicating a preference for a consistent street width. In contrast, SVF exhibits minor fluctuations with an overall stable trend, whereas SP demonstrates a clear upward trajectory, emphasizing its critical role in shaping young people’s spatial perceptions. Figure 8b shows that among cultural and ecological features, the Historical Linguistic Landscape (HLL) rises sharply with satisfaction level, while the Visual Complexity of Colour remains stable. The Green View Index plateaus above a satisfaction score of 3.6, suggesting the limited impact of greenery. Overall, morphological features vary more significantly than cultural or ecological ones, underscoring the dominant role of spatial configuration in shaping youth preferences.

3.2.2. Data Pre-Processing

Before applying machine learning algorithms, data preprocessing is essential to ensure data integrity and reliability. First, the acquired spatial feature dataset is examined for missing values, and outliers are identified and corrected. Next, the Shapiro–Wilk test is conducted to assess the distribution of coefficient values, generating the results presented in Table 5. The p-value (<0.05) for the Historical Linguistic Landscape indicator indicates a deviation from a normal distribution. Given that non-normally distributed independent or dependent variables may affect the accuracy of regression models, the Box–Cox transformation method [57] in Python is applied to normalise the non-conforming data, ensuring that the dataset meets the assumptions required for multiple regression analysis.
Finally, the Pearson correlation coefficient was computed for the independent variables to assess the presence of multicollinearity within the dataset. The Pearson correlation heat map was subsequently generated to visualise the relationships among variables. It is generally accepted that when the absolute value of the correlation coefficient approaches one (typically > 0.8), a strong linear relationship between variables is likely. Figure 9 illustrates that the absolute values of the correlation coefficients for most variables remain below 0.8, indicating that multicollinearity is not a significant concern. Furthermore, to complement the Pearson correlation analysis, the variance inflation factor (VIF) was calculated for all predictors, as shown in Table 6, yielding values ranging from 1.09 to 2.36, well below the commonly accepted threshold of 5 (or the stricter criterion of 10). These results further confirm the absence of problematic multicollinearity, ensuring that the dataset is suitable for reliable regression modelling.

3.2.3. Multiple Linear Regression Modelling

Table 7 presents the multiple linear regression results based on interface characteristics and youth satisfaction. The model shows a strong fit (R2 = 0.756, p < 0.001), explaining 75.6% of the satisfaction variance. A low mean square error (MSE = 0.08) indicates a high prediction accuracy. The Durbin–Watson value (DW = 1.90) suggests no significant autocorrelation, confirming the model’s statistical robustness.
The regression results reveal varied impacts of spatial characteristics on youth satisfaction. Among the spatial form variables, Street Permeability (β = 0.401, p < 0.01), D/H Ratio (β = 0.178, p < 0.01), and Sky View Factor (β = 0.169, p < 0.05) had significant positive effects, with Permeability showing the strongest influence, indicating a preference for open interfaces. In contrast, Street Width Change Rate (β = −0.393, p < 0.001) negatively impacted satisfaction, suggesting a dislike for irregular cross-sectional shifts and a preference for linear spaces with moderate aspect ratios (1:1.2–1:1.5) and continuity. Culturally, the Historical Linguistic Landscape (β = 1.088, p < 0.001) had the highest positive effect, highlighting the value of integrating tangible and intangible heritage. Conversely, high Visual Colour Complexity (β = −1.181, p < 0.001) reduced satisfaction, likely due to cognitive overload from excessive modern stimuli. At the ecological level, the Green View Index (β = −0.138, p < 0.1) showed a weak negative effect, possibly reflecting poor visual integration between the vegetation and the historic architecture.
The residual analysis shows that the Q–Q plot confirms no significant deviation from normality (Shapiro–Wilk W = 0.966, p = 0.271), as shown in Figure 10. The Breusch–Pagan results (pLM = 0.260, pF = 0.278) and the residual-fitted value plot reveal no signs of heteroscedasticity. Overall, the residuals satisfy normality and homoscedasticity, supporting the reliability of the model for interpretation and prediction.

3.3. SHAP Analysis Reveals the Spatial Perception of Historic Districts

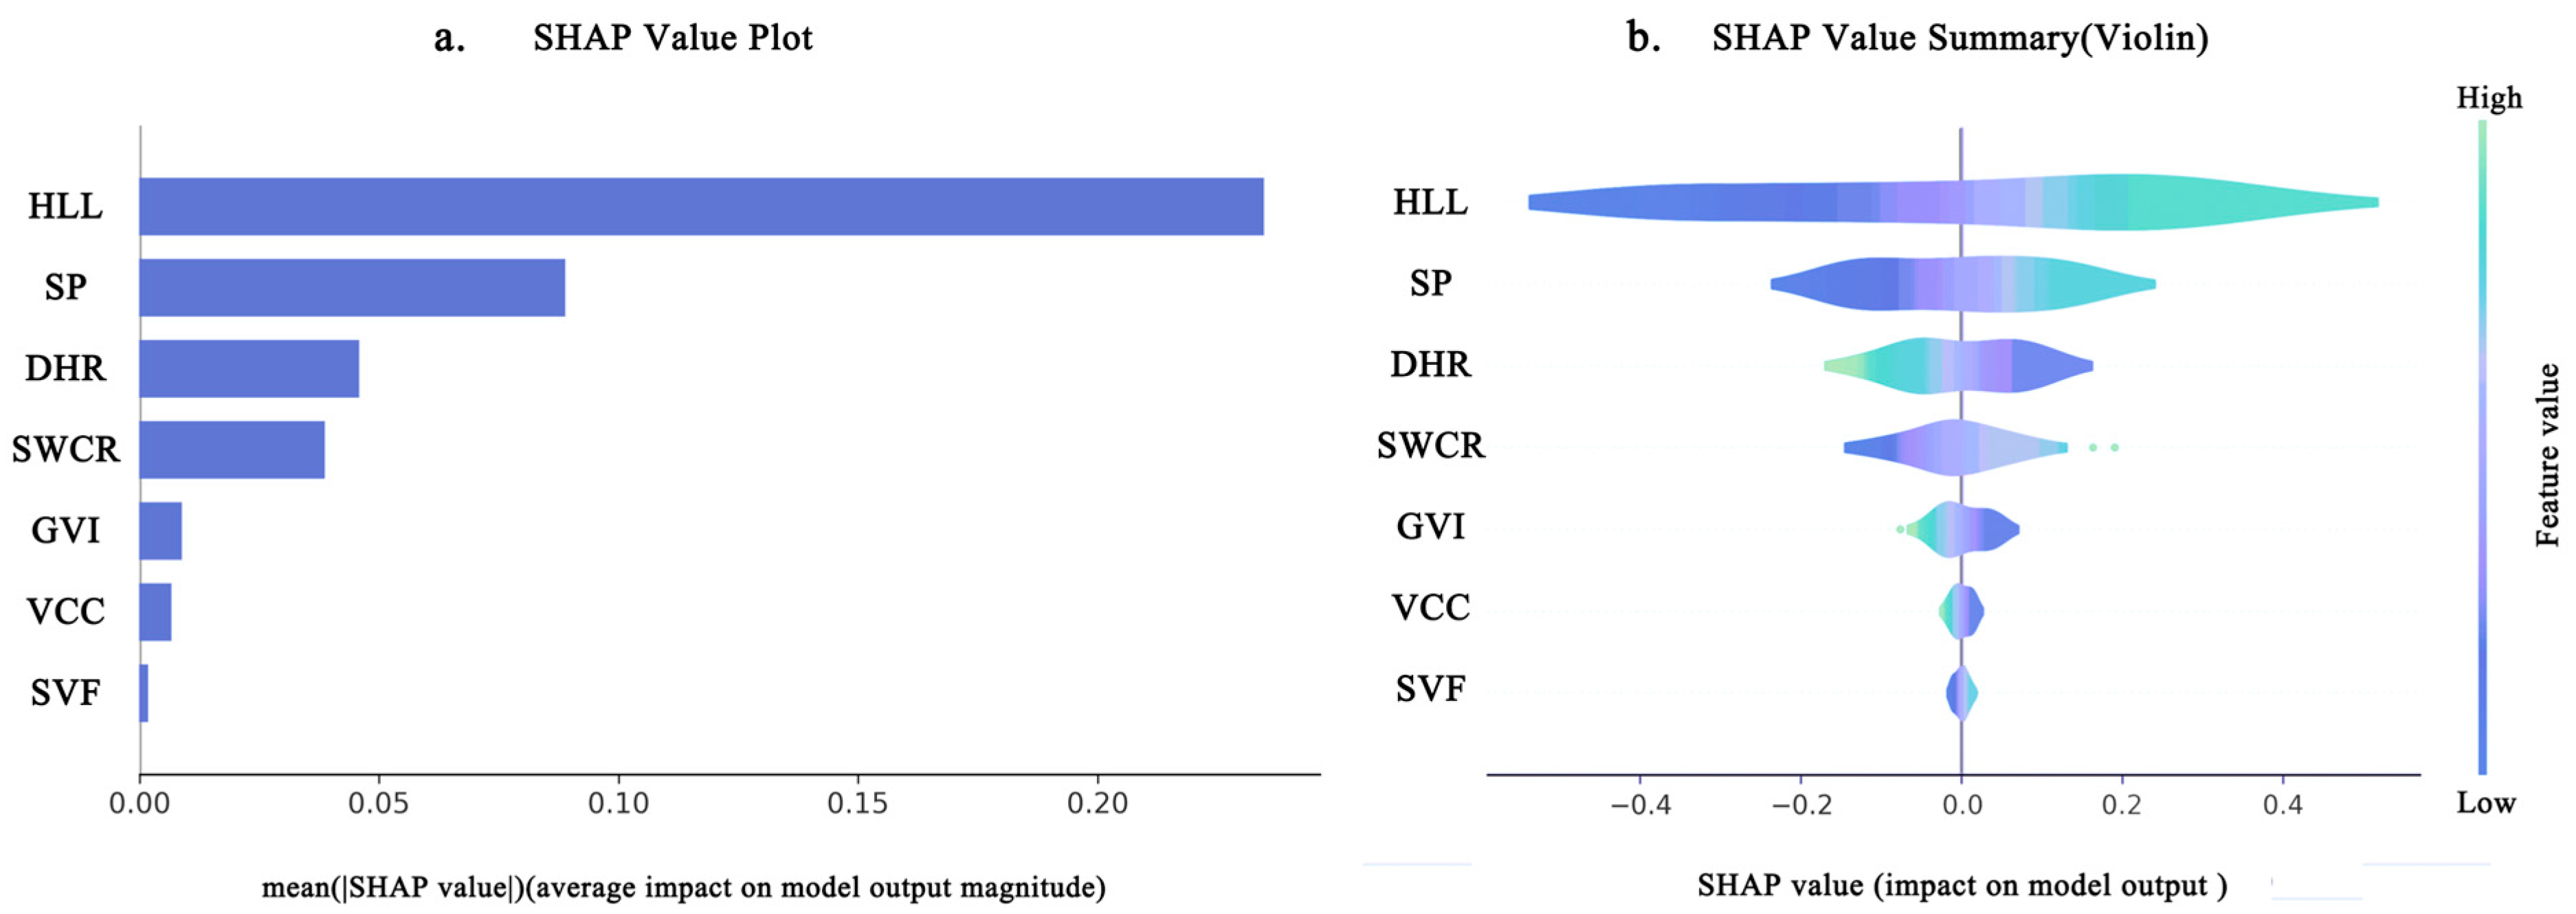
The SHAP (SHapley Additive exPlanations) analysis (Figure 11) reveals notable heterogeneity in the generation of youth satisfaction within historic districts. Globally, the Historical Linguistic Landscape (HLL) emerged as the most influential variable (mean SHAP = 0.28 ± 0.05), with a right-skewed distribution and a concentration of attention near SHAP = 0.3, highlighting its role in eliciting positive spatial perceptions. In contrast, Visual Colour Complexity contributed minimally and displayed limited variation. Among morphological features, Street Interface Permeability (0.09 ± 0.03) and Sky Visibility (0.01 ± 0.03) had positive impacts, though the latter’s effect was marginal. Moderate permeability elicited mixed responses, while high permeability was associated with consistently positive perceptions. Conversely, an increased D/H Ratio (0.048 ± 0.005) correlated negatively with satisfaction levels, suggesting a preference for narrower street proportions. Low street width variation corresponded with negative SHAP values, and higher variation (SHAP ≈ −0.046) showed limited benefit, indicating that excessive fluctuation may diminish spatial coherence. Lastly, as shown in Figure 11b, the Green View Index was inversely associated with satisfaction levels, suggesting that youth in historic districts prefer moderate to low levels of greenery, contrary to trends in other urban settings.
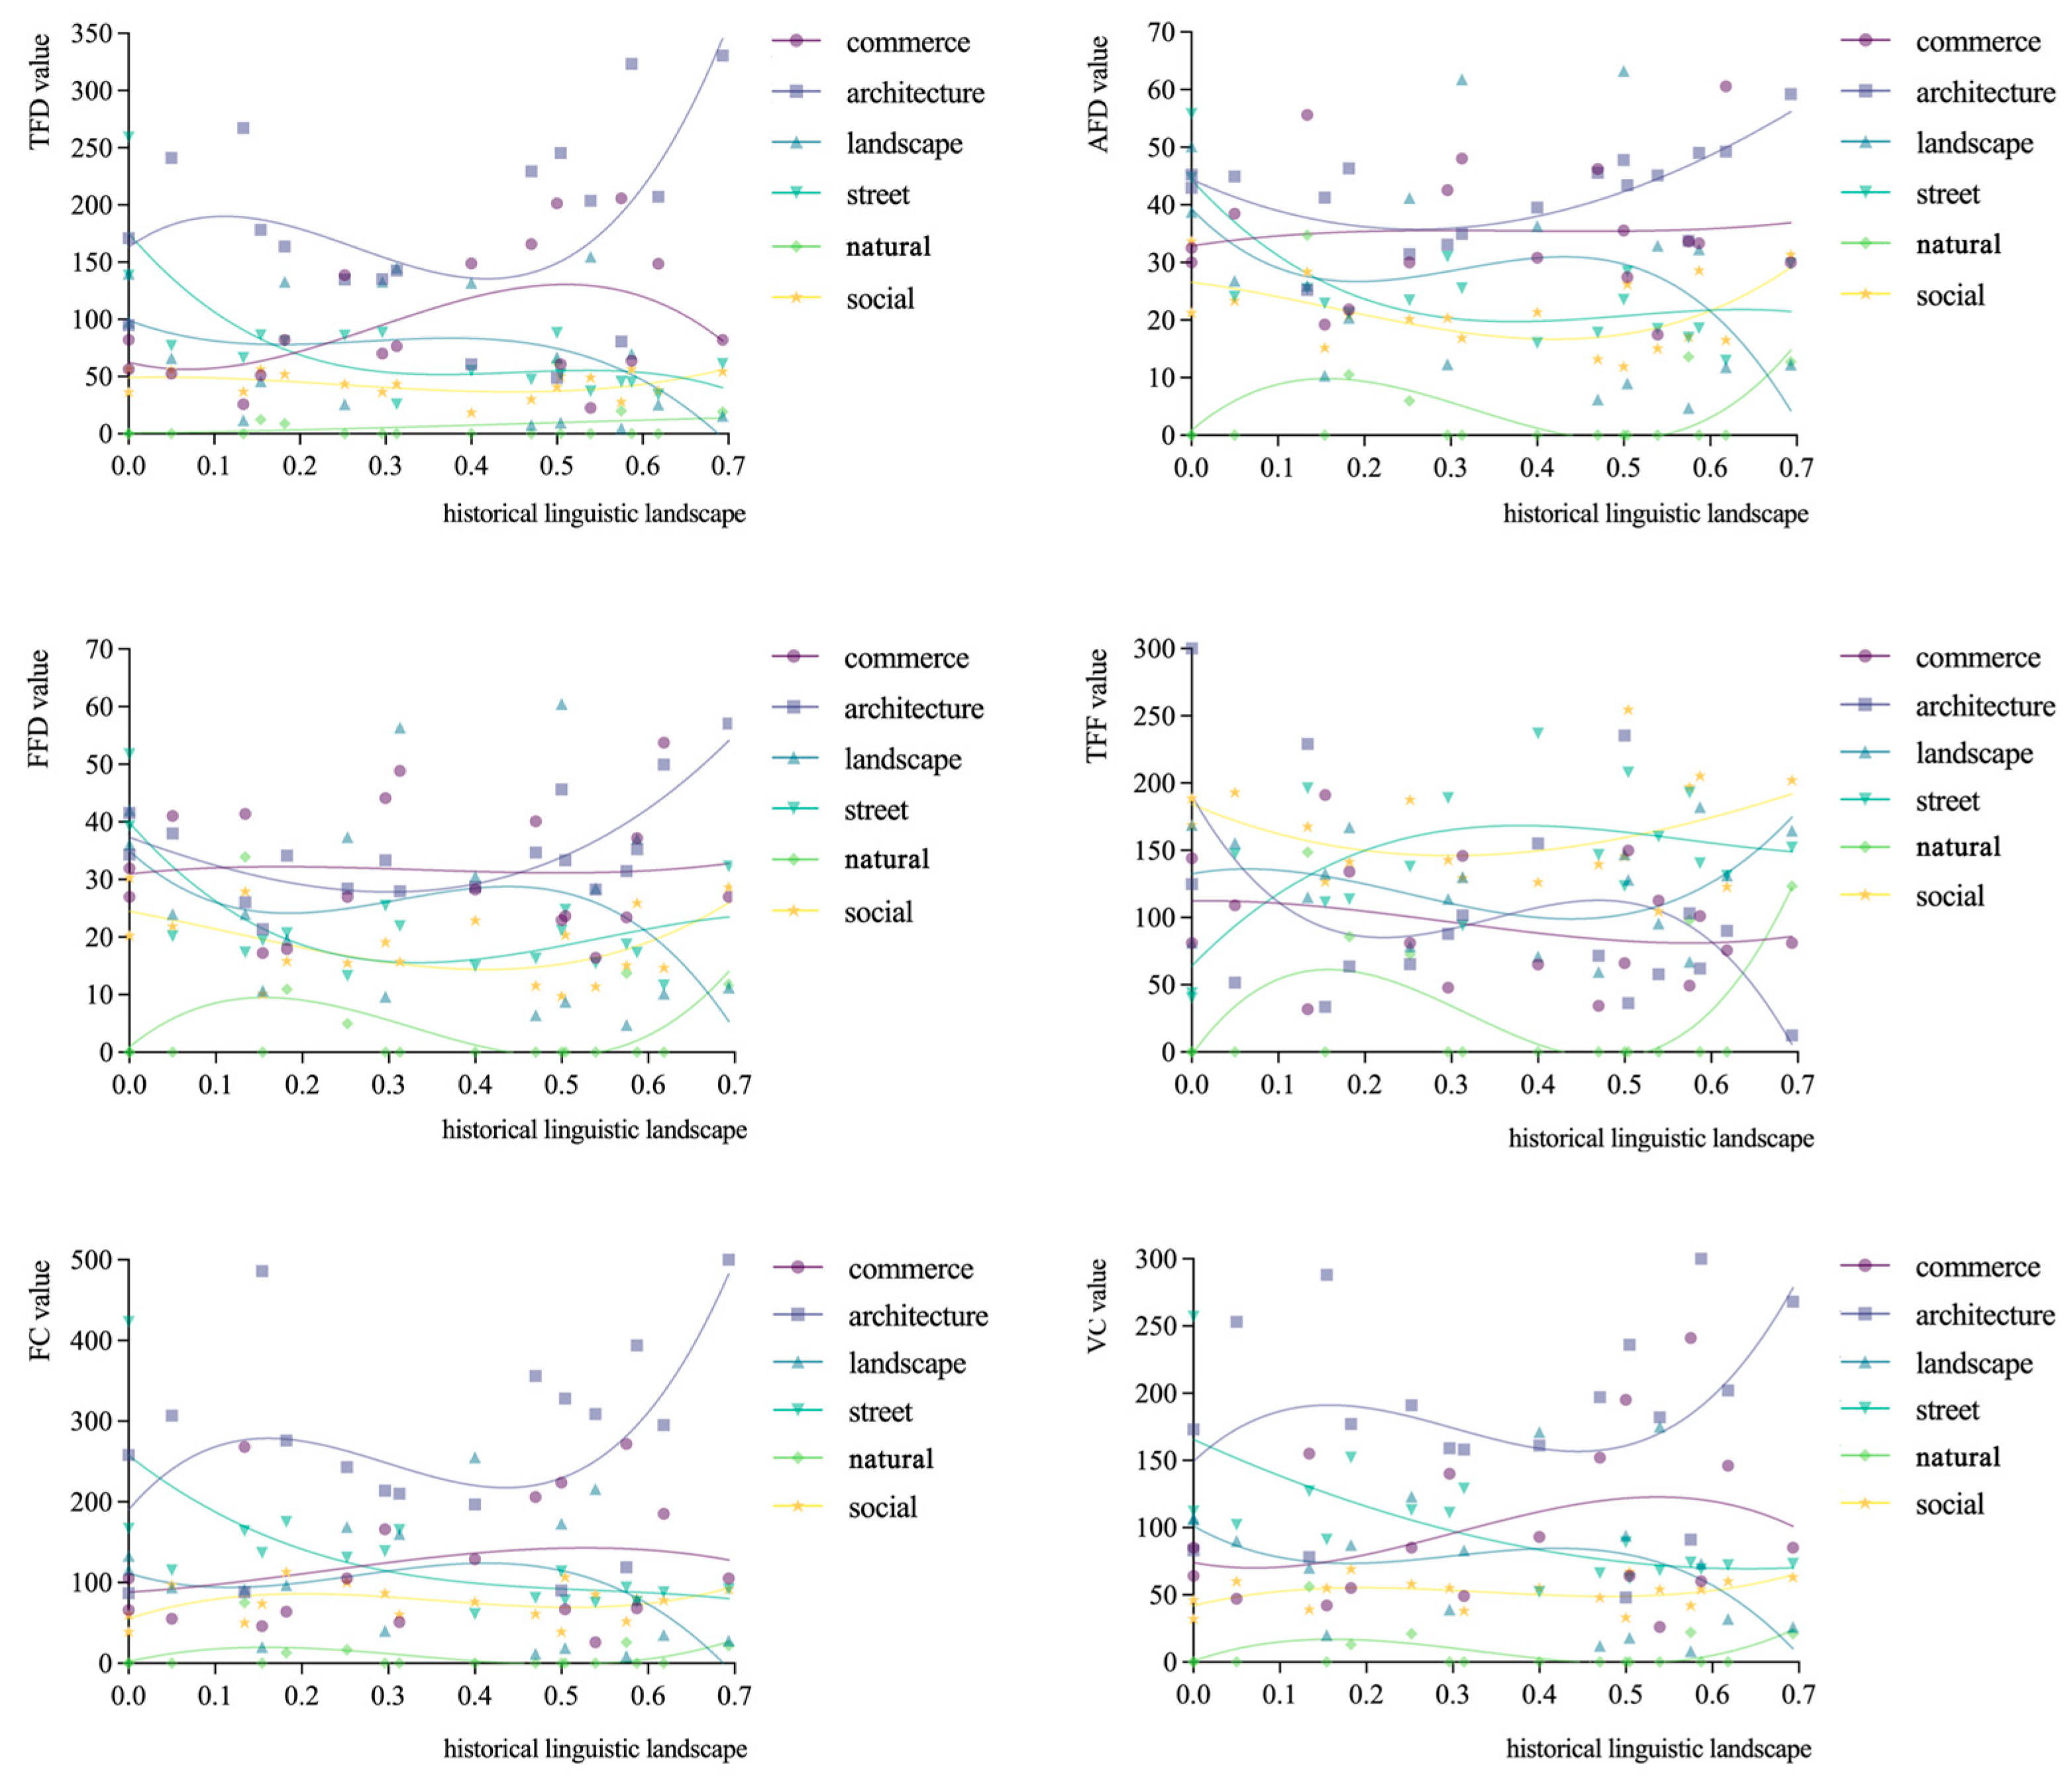
Figure 12 ranks the eye-tracking samples in terms of the proportion of the Historical Linguistic Landscape (HLL) based on their SHAP values to reassess its impact on youth visual perception. Missing values were imputed with the means, and a third-order polynomial was applied to fit the non-linear trend. The results show that architectural attention (TFD, AFD, and FFD) declined as HLL increased, reaching the bottom around 30%, then rising after 50%. FC and VC followed a similar pattern, peaking around 15% HLL (TFD ≈ 190 s; FC ≈ 290). TFF decreased with higher HLL, indicating stronger visual salience. In contrast, commercial elements showed stable AFD and FFD, with peaks in TFD, FC, and VC at ~55% HLL, followed by sharp declines. The amount of attention given to landscape, street, natural, and social life elements generally declined. The decrease was most pronounced for street elements, likely due to vertical HLL features overshadowing horizontal cues. Changes in responses to natural elements were minor, possibly influenced by other spatial characteristics beyond linguistic features.

4. Discussion

The inadequate consideration of young people’s perceptions in historic district planning has resulted in diminished market appeal, hindered cultural dissemination, and challenges in integrating youthful vitality into these spaces. As key contributors to urban vibrancy and future heritage stewards, young people’s spatial preferences are vital for effective revitalization. This study bridges spatial attributes and perceptual responses by combining subjective data (eye tracking and satisfaction surveys) with objective spatial metrics. A relationship model is developed to elucidate the connection between interface morphology and perceptual preferences, followed by SHAP visualization analysis to systematically explore young people’s perception patterns in historic districts. The findings clarify how interface design shapes youth spatial experience, offering guidance for youth-oriented historic district renewal.
The relationship between architectural heritage and commercial tourism is complex [58]. The heat map of visual fixation points reveals that young people’s attention is predominantly concentrated in the central region of images, a pattern consistent with findings from previous studies [59,60], with architectural facades—especially those featuring cultural elements—drawing the most attention [11,13,61]. Architectural elements recorded the highest TFD (90.55), FFD (557.28), FC (4458), and VC (3041), particularly plaques and permeable openings. In contrast, street elements received less attention despite cultural significance. In terms of AFD, the commercial element (AFD = 618.31) emerged as the most visually competitive area. Young people showed prolonged engagement with commercial features, likely attributable to their higher interactivity and stronger alignment with youth preferences, consistent with Davison’s findings [29]. Although architectural elements scored well in most metrics, they induced a lower cognitive load per fixation, limiting engagement depth. To enhance cultural transmission among youth, a segmented strategy is proposed: reduce commercial intensity in culturally significant zones to preserve authenticity, while leveraging commercial interfaces in less historic areas to boost vitality and local economy. To operationalise the segmented strategy in historic districts, we propose a context-sensitive approach to spatial zoning along the street interface. In culturally significant segments—characterised by high architectural integrity, distinctive plaques, and permeable openings—the commercial intensity should be deliberately reduced to preserve visual authenticity and minimise cognitive distraction from heritage elements. Interventions may include limiting modern signage, regulating shopfront renovations, and prioritizing cultural display spaces or interpretive installations. Conversely, in less historically intact segments, commercial interfaces can be actively leveraged to stimulate pedestrian flow and local economic vitality. This could involve clustering youth-oriented retail, food, and cultural/creative businesses, supported by street furniture and façade transparency enhancements to extend their dwell time. Such targeted spatial differentiation ensures that both heritage preservation and economic activation are optimised according to the morphological and cultural profile of each segment, offering a practical framework for historic street management.
Establishing a clear link between street interface features and pedestrian perception is essential for effective urban design. This study explores the multidimensional heterogeneity of youth perceptual preferences in historic districts and confirms the applicability of the “morphology-culture-ecology” framework. Morphologically, youth prefer D/H Ratios of 1.5–2.0, consistent with prior findings [11,12,13]. Variations in street width negatively affect young people’s satisfaction, reinforcing the “principle of moderate stability” in historic district forms, wherein disruptions in interface continuity reduce spatial legibility [38]. Street permeability also shapes perception: high-permeability interfaces expose interior activity and attract attention (especially commercial elements), while low-permeability designs enhance focus on historical features and cultural transmission. Similarly, in the Shapowei historical block, alternating spatial expansions and contractions, coupled with highly open and distinctive façades, were found to draw pedestrian attention, encourage lingering, and enhance street vitality, underscoring the shared role of morphological variation and façade openness in shaping behaviour [62]. Culturally, the Historical Linguistic Landscape (HLL) has the strongest impact (SHAP = 0.28 ± 0.05), contributing 42.7% to satisfaction. This finding resonates with Nasar’s “Environmental Symbolism Theory” [63], reinforcing the idea that symbolic cultural markers embedded in historic districts play a pivotal role in shaping spatial identity and user experience. One possible explanation is that such preference patterns may be influenced by a social media-driven visual symbol dependency, which encourages selective attention to visually distinctive elements. However, this interpretation remains speculative in the present study and warrants empirical validation in future research. Moreover, the observed nonlinear pattern may reflect a psychological attention threshold: when cultural markers are too sparse, they fail to capture attention, and when they are overly dense, they may induce visual overload before symbolic richness becomes salient [64]. Urban design factors such as contrast and layout may modulate these effects [65]. Unique colours and visual images serve as a reflection of the city’s history [66]. However, due to the limited colour variation in the study area, the observed impact of colour was not significant, indicating that further research on young people’s perceived preferences regarding regional colour landscapes is needed. Ecologically, green visibility (SHAP ≈ 0.01) had minimal effect, suggesting that greening should prioritise harmony over volume. This finding, which differs from normative greenery research, may reflect the specificity of heritage districts where vegetation sometimes obscures cultural elements rather than enhancing satisfaction.
These contradictions underscore the core challenges of historic district regeneration: optimizing cultural identity must be balanced with incremental improvements, and street interface forms (e.g., Interface Permeability and D/H Ratios) must reconcile street preservation with regeneration and perceived comfort. Extreme modification of any single element (e.g., excessive variation in street widths or overly dense greenery) can lead to systemic imbalance, so the preservation and utilisation of historic districts require a multi-objective synergistic design to achieve a symbiosis between heritage value and quality of experience. This study overcomes the limitations of traditional questionnaire-based assessments of cultural impacts by quantifying the match between historic district interface features and young people’s perceptions through the acquisition of visual data via eye-tracking technology, coupled with SHAP value analyses of site features.
This study has several limitations requiring further exploration. Methodologically, while a basic machine learning model establishes a linear link between young people’s perception and street features, the limited sample size—particularly in eye-tracking data—undermines the robustness of the findings. Future research should therefore collect larger and more diverse datasets, ideally through multi-site data collection, to enhance model stability. Moreover, the present study only examined the significant positive effect of HLL, without exploring potential non-significant or negative associations. Future work should incorporate non-linear modelling and interaction terms (e.g., HLL Street Permeability) to capture a broader spectrum of potential effects. Additionally, although SHAP values quantify the impact of the Historical Linguistic Landscape, the current index system mainly emphasizes physical attributes (e.g., scale, function, and structure). Future work should extend the framework to include intangible cultural heritage, enabling a dynamic cultural vitality index that captures interactions between static symbols (e.g., plaques) and dynamic practices (e.g., workshops). Furthermore, our interpretation of fixation metrics is inferential rather than directly validated; future studies should complement eye tracking with interviews or psychological assessments to empirically verify these links. While Western Sichuan’s architectural style offers key insights, the study’s geographic scope limits the study’s generalisability. Broader cross-regional analyses are needed to assess youth preferences for diverse regional symbols. Future comparative studies can adopt the same culture–form–ecology framework as their structured analytical lens, enabling the systematic cross-regional validation of young people’s perceptual patterns. Finally, the process of translating visual experiences into cultural identity formation from the perspective of young people remains an open research question.

5. Conclusions

This study examines young people’s perceived preferences for historic districts, providing a scientific basis for youth engagement in the preservation, utilisation, and dissemination of historical streets. Through a multi-dimensional analysis that integrates subjective evaluation scales, eye-tracking indicators, and spatial characteristics, this research offers a novel perspective on cultural conservation and adaptive reuse. Eye-tracking data reveal the dual nature of young people’s visual perceptions of historic districts: architectural elements attract high-frequency attention, while commercial elements maintain sustained visual appeal. The symbolic decorative features of the architectural interface serve as primary visual anchors, reflecting a cognitive decoding mechanism that underscores the dialectical relationship between “symbolic engagement” and “in-depth cognition” among youth in the digital era. This finding provides a cognitive science foundation for balancing the authenticity of heritage conservation with the efficacy of contemporary communication strategies.
The systematic integration of objective street interface analysis and subjective perception scales reveals the underlying mechanisms shaping young people’s preferences for historic district features. Empirical evidence derived from a multi-dimensional ‘culture-form-ecology’ framework indicates that young people favour street environments characterised by a high degree of historical authenticity, appropriately scaled spatial configurations, minimal variation in interface patterns, and strong visual permeability. Moreover, material cultural symbols play a crucial role in enhancing young people’s recognition of architectural heritage elements. Historic streets and alleys function not only as physical spaces but also as cognitive media that sustain and revitalise collective memory. This study provides a cognitive scientific foundation for informed decision making in the sustainable revitalization of historic districts. Additionally, it offers new perspectives and theoretical insights into the interactive influence of cultural, morphological, and ecological factors on young people’s perception.
The perception system of youth groups in historic districts holds significant value, and this study explores an innovative approach to heritage preservation by integrating generational perspectives. A cognitive science-based heritage value assessment reveals a coupling effect between young people’s spatial perception mechanisms and cultural heritage interpretation strategies. The incorporation of young people’s perspectives challenges the traditional dominance of professional elites in heritage discourse, enabling conservation practitioners to refine their preservation priorities. This aligns with cultural identity theory, which posits that individuals construct and negotiate their sense of belonging through engagement with cultural symbols and place-based narratives. The study demonstrates how youth interactions with historic streetscapes can strengthen cultural identity, thereby reinforcing the theoretical foundation for heritage-led regeneration strategies. Emphasizing youth engagement also contributes to the long-term sustainability of heritage transmission. Through technological empowerment, intergenerational collaboration, and global dialogue, cultural heritage can evolve from a static “monument to the past” into a dynamic “living laboratory for the future.” This transformation not only facilitates the continuation of cultural legacies but also harnesses the insights of younger generations to reconcile the tensions between preservation and development, offering a more resilient pathway for the survival of human civilization.
Building on these findings, future research could extend the proposed methodology to a wider range of geographical and cultural contexts, enabling cross-comparative studies that capture regional variations in young people’s perception. To enhance its applicability, the integration of eye tracking with advanced spatial analytics may further improve the precision and adaptability of the framework. Such refinements would also facilitate the identification of potential thresholds—for instance, in cultural signage density or other spatial attributes—that define optimal conditions for fostering youth engagement and offer more fine-grained design guidance. In practical terms, this approach holds promise for supporting urban renewal, designing pedestrian-friendly historic environments, and enriching cultural tourism experiences. Looking ahead, a potential “cultural credit system” could also be explored to promote the intergenerational transmission of heritage, in which digital content created by young people in historic districts may be translated into tangible opportunities for engagement within physical urban spaces. At this stage, this concept should be regarded as a forward-looking and exploratory idea rather than a ready-to-implement model, serving primarily as inspiration for future interdisciplinary research.

6. Ethics Statement

This study involved human participants in the form of eye-tracking experiments. All participants were informed about the purpose, procedures, and voluntary nature of the study, and informed consent was obtained prior to participation. No sensitive personal information was collected, and all data were anonymised to ensure privacy and confidentiality. According to the relevant institutional guidelines, this study met the criteria for low-risk research and therefore qualified for ethics approval exemption.

Author Contributions

Conceptualization, Y.Z., N.M. and J.L.; Methodology, Y.Z.; Software, Y.Z.; Validation, Y.Z. and J.L.; Formal analysis, Y.Z. and J.L.; Investigation, Y.Z. and J.L.; Resources, Y.Z. and N.M.; Data curation, Y.Z.; Writing—original draft, Y.Z.; Writing—review & editing, Y.Z.; Visualization, Y.Z.; Supervision, Y.Z. and N.M.; Project administration, Y.Z. and N.M.; Funding acquisition, N.M. All authors have read and agreed to the published version of the manuscript.

Funding

This research was supported by the Soft Science Project of the Sichuan Provincial Science and Technology Program (2021JDR0198), the General Program of the National Natural Science Foundation of China (42071232), and the Key R&D Project of the Sichuan Provincial Science and Technology Program (2020YFS0060). The APC was funded by Chengdu University of Technology College of Geography and Planning/Nina Mo/the research group.

Institutional Review Board Statement

The study did not require full ethics committee approval because it did not involve any psychological or physiological interventions, risks, or sensitive data. The exemption was granted on the grounds that (1) all data were anonymised and stripped of personally identifiable information, (2) the experiment was limited to non-invasive visual perception tasks, and (3) informed consent was obtained from all participants.

Informed Consent Statement

Informed consent was obtained from all participants prior to the experiment.

Data Availability Statement

The raw data supporting the conclusions of this article will be made available by the authors on request.

Conflicts of Interest

The authors declare no conflict of interest.

References

  1. Swensen, G. Integration of historic fabric in new urban development—A Norwegian case-study. Landsc. Urban Plan. 2012, 107, 380–388. [Google Scholar] [CrossRef]
  2. Wang, Y.; Yamaguchi, K. Neighborhood scale emerging from the clustering of residential redevelopment applications in the historic district of Macao. Cities 2024, 145, 104670. [Google Scholar] [CrossRef]
  3. Wen, Z.; Zhao, J.; Li, M. A study on the influencing factors of the vitality of street corner spaces in historic districts: The case of Shanghai bund historic district. Buildings 2024, 14, 2947. [Google Scholar] [CrossRef]
  4. Mah, O.B.P.; Yan, Y.; Tan, J.S.Y.; Tan, Y.-X.; Tay, G.Q.Y.; Chiam, D.J.; Wang, Y.-C.; Dean, K.; Feng, C.C. Generating a virtual tour for the preservation of the (in) tangible cultural heritage of Tampines Chinese Temple in Singapore. J. Cult. Herit. 2019, 39, 202–211. [Google Scholar] [CrossRef]
  5. Huang, K.; Kang, P.; Zhao, Y. Quantitative research of street interface morphology in urban historic districts: A case study of west street historic district, Quanzhou. Heritage Science 2024, 12, 226. [Google Scholar] [CrossRef]
  6. Corbusier, L.; Eardley, A. The Athens Charter; Grossman Publishers: New York, NY, USA, 1973; p. 88. [Google Scholar]
  7. Evans, G. From Cultural Quarters to Creative Clusters–Creative Spaces in the New City Economy; Institute of Urban History: Stockholm, Sweden, 2009. [Google Scholar]
  8. Cucchiella, F.; De Berardinis, P.; Koh, S.L.; Rotilio, M. Planning restoration of a historical landscape: A case study for integrating a sustainable street lighting system with conservation of historical values. J. Clean. Prod. 2017, 165, 579–588. [Google Scholar] [CrossRef]
  9. Alexander, C. A Pattern Language: Towns, Buildings, Construction; Oxford University Press: Oxford, UK, 1977. [Google Scholar]
  10. Glaser, M. (Ed.) The City at Eye Level: Lessons for Street Plinths; Eburon Academic Publishers: Utrecht, The Netherlands, 2012. [Google Scholar]
  11. Gehl, J.; Kaefer, L.J.; Reigstad, S. Close encounters with buildings. Urban Des. Int. 2006, 11, 29–47. [Google Scholar] [CrossRef]
  12. Tang, J.; Long, Y. Measuring visual quality of street space and its temporal variation: Methodology and its application in the Hutong area in Beijing. Landsc. Urban Plan. 2019, 191, 103436. [Google Scholar] [CrossRef]
  13. Ma, L.; Guo, Z.; Lu, M.; He, S.; Wang, M. Developing an urban streetscape indexing based on visual complexity and self-organizing map. Build. Environ. 2023, 242, 110549. [Google Scholar] [CrossRef]
  14. Ewing, R.; Handy, S. Measuring the unmeasurable: Urban design qualities related to walkability. J. Urban Des. 2009, 14, 65–84. [Google Scholar] [CrossRef]
  15. White, E.V.; Gatersleben, B. Greenery on residential buildings: Does it affect preferences and perceptions of beauty? J. Environ. Psychol. 2011, 31, 89–98. [Google Scholar] [CrossRef]
  16. Guo, X.; Cui, W.; Lo, T.; Hou, S. Research on dynamic visual attraction evaluation method of commercial street based on eye movement perception. J. Asian Archit. Build. Eng. 2022, 21, 1779–1791. [Google Scholar]
  17. Kiefer, P.; Giannopoulos, I.; Raubal, M.; Duchowski, A. Eye tracking for spatial research: Cognition, computation, challenges. Spat. Cogn. Comput. 2017, 17, 1–19. [Google Scholar] [CrossRef]
  18. Zhu, C.; Feng, X.; Luo, J.; Fu, S.; Li, T.; Wang, W.; Li, X. Effects of different audiovisual landscapes in bamboo forest space on physical and mental restorative potential of university students: Based on eye-tracking experiments. Front. For. Glob. Change 2024, 7, 1415514. [Google Scholar] [CrossRef]
  19. Liu, L.; Qu, H.; Ma, Y.; Wang, K.; Qu, H. Restorative benefits of urban green space: Physiological, psychological restoration and eye movement analysis. J. Environ. Manag. 2022, 301, 113930. [Google Scholar] [CrossRef]
  20. Prasse, P.; Reich, D.R.; Makowski, S.; Scheffer, T.; Jäger, L.A. Improving cognitive-state analysis from eye gaze with synthetic eye-movement data. Comput. Graph. 2024, 119, 103901. [Google Scholar] [CrossRef]
  21. Martínez-Soto, J.; De la Fuente Suárez, L.A.; Gonzáles-Santos, L.; Barrios, F.A. Observation of environments with different restorative potential results in differences in eye patron movements and pupillary size. IBRO Rep. 2019, 7, 52–58. [Google Scholar] [CrossRef]
  22. Ren, H.; Yang, F.; Zhang, J.; Wang, Q. Evaluation of Cognition of Rural Public Space Based on Eye Tracking Analysis. Buildings 2024, 14, 1525. [Google Scholar] [CrossRef]
  23. Noland, R.B.; Weiner, M.D.; Gao, D.; Cook, M.P.; Nelessen, A. Eye-tracking technology, visual preference surveys, and urban design: Preliminary evidence of an effective methodology. J. Urban. Int. Res. Placemaking Urban Sustain. 2017, 10, 98–110. [Google Scholar] [CrossRef]
  24. Wen, C.; Albert, C.; Von Haaren, C. The elderly in green spaces: Exploring requirements and preferences concerning nature-based recreation. Sustain. Cities Soc. 2018, 38, 582–593. [Google Scholar] [CrossRef]
  25. Li, L.; Li, D.; Zhou, S.; Huang, H.; Huang, G.; Yu, L. Unveiling age-friendliness in smart cities: A heterogeneity analysis perspective based on the IAHP-CRITIC-IFCE approach. Habitat Int. 2024, 151, 103153. [Google Scholar] [CrossRef]
  26. Shtebunaev, S.; Gullino, S.; Larkham, P.J. Planning the smart city with young people: Teenagers’ perceptions, values and visions of smartness. Urban Plan. 2023, 8, 57–69. [Google Scholar] [CrossRef]
  27. Kamani Fard, A.; Paydar, M. Place attachment and related aspects in the urban setting. Urban Sci. 2024, 8, 135. [Google Scholar] [CrossRef]
  28. Passon, C.; Levi, D.; Del Rio, V. Implications of adolescents’ perceptions and values for planning and design. J. Plan. Educ. Res. 2008, 28, 73–85. [Google Scholar] [CrossRef]
  29. Davison, K.; Russell, J. Disused religious space: Youth participation in built heritage regeneration. Religions 2017, 8, 107. [Google Scholar] [CrossRef]
  30. Fisu, A.A.; Syabri, I.; Andani, I.G.A. How do young people move around in urban spaces?: Exploring trip patterns of generation-Z in urban areas by examining travel histories on Google Maps Timeline. Travel Behav. Soc. 2024, 34, 100686. [Google Scholar] [CrossRef]
  31. Kaplan, E.B. The millennial/gen Z leftists are emerging: Are sociologists ready for them? Sociol. Perspect. 2020, 63, 408–427. [Google Scholar] [CrossRef]
  32. Carter, B.T.; Luke, S.G. Best practices in eye tracking research. Int. J. Psychophysiol. 2020, 155, 49–62. [Google Scholar] [CrossRef]
  33. Li, K.; Zhai, Y.; Dou, L.; Liu, J. A preliminary exploration of landscape preferences based on naturalness and visual openness for college students with different moods. Front. Psychol. 2021, 12, 629650. [Google Scholar] [CrossRef]
  34. Rusnak, M.; Szmigiel, M.; Geniusz, M.; Koszewicz, Z.; Magdziak-Tokłowicz, M. Exploring the impact of cultural context on eye-tracking studies of architectural monuments in selected European cities: Sustainable heritage management. J. Cult. Herit. 2024, 66, 326–342. [Google Scholar] [CrossRef]
  35. Motevalian, N.; Yeganeh, M. Visually meaningful sustainability in national monuments as an international heritage. Sustain. Cities Soc. 2020, 60, 102207. [Google Scholar] [CrossRef]
  36. Pierdicca, R.; Paolanti, M.; Quattrini, R.; Mameli, M.; Frontoni, E. A visual attentive model for discovering patterns in eye-tracking data-a proposal in cultural heritage. Sensors 2020, 20, 2101. [Google Scholar] [CrossRef]
  37. Katahenggam, N. Tourist perceptions and preferences of authenticity in heritage tourism: Visual comparative study of George Town and Singapore. J. Tour. Cult. Change 2020, 18, 371–385. [Google Scholar] [CrossRef]
  38. Lynch, K. The Image of The City (1960). In Anthologie zum Städtebau. Band III: Vom Wiederaufbau nach dem Zweiten Weltkrieg bis zur zeitgenössischen Stadt; Gebr. Mann Verlag: Berlin, Germany, 2023; pp. 481–488. [Google Scholar]
  39. Ashihara, Y.; Gómez-Salvo, S.C. El Diseño de Espacios Exteriors; G. Gili: Barcelona, Spain, 1982. [Google Scholar]
  40. Madani-Pour, A.; Madani, A. Design of Urban Space; Academy: Hoboken, NJ, USA, 1996. [Google Scholar]
  41. Jacobs, A.B. Great Streets; No. qt3t62h1fv; University of California Transportation Center: Berkeley, CA, USA, 1993. [Google Scholar]
  42. Abdeldayem, W.S.; Morgan, S.; Bakr, S.; Abdelhamid, A. Parameterize walkable urban forms considering perceptual qualities. J. Eng. Appl. Sci. 2023, 70, 52. [Google Scholar] [CrossRef]
  43. Zeka, E.; Yuzer, M.A. A methodology for measuring the form of organic settlements. MethodsX 2019, 6, 368–376. [Google Scholar] [CrossRef]
  44. Gehl, J. Life Between Buildings; Island Press: Washington DC, USA, 2011. [Google Scholar]
  45. Xia, Y.; Yabuki, N.; Fukuda, T. Sky view factor estimation from street view images based on semantic segmentation. Urban Clim. 2021, 40, 100999. [Google Scholar] [CrossRef]
  46. Al-Amri, S.S.; Kalyankar, N.V. Image segmentation by using threshold techniques. arXiv 2010, arXiv:1005.4020. [Google Scholar] [CrossRef]
  47. Ewing, R.; Handy, S.; Brownson, R.C.; Clemente, O.; Winston, E. Identifying and measuring urban design qualities related to walkability. J. Phys. Act. Health 2006, 3 (Suppl. S1), S223–S240. [Google Scholar] [CrossRef] [PubMed]
  48. Landry, R.; Bourhis, R.Y. Linguistic landscape and ethnolinguistic vitality: An empirical study. J. Lang. Soc. Psychol. 1997, 16, 23–49. [Google Scholar] [CrossRef]
  49. Dai, J.; Chen, H.; Zhang, Z. How does a historical linguistic landscape influence tourists’ behavioral intention? A mixed-method study. Tour. Manag. Perspect. 2024, 53, 101294. [Google Scholar] [CrossRef]
  50. Farrelly, F.; Kock, F.; Josiassen, A. Cultural heritage authenticity: A producer view. Ann. Tour. Res. 2019, 79, 102770. [Google Scholar] [CrossRef]
  51. Dael, N.; Perseguers, M.N.; Marchand, C.; Antonietti, J.P.; Mohr, C. Put on that colour, it fits your emotion: Colour appropriateness as a function of expressed emotion. Q. J. Exp. Psychol. 2016, 69, 1619–1630. [Google Scholar] [CrossRef]
  52. Guo, X.; Qian, Y.; Li, L.; Asano, A. Assessment model for perceived visual complexity of painting images. Knowl.-Based Syst. 2018, 159, 110–119. [Google Scholar] [CrossRef]
  53. Qi, Z.Y.; Li, J.Y.; He, Z.; Yang, X.P. The influence of urban streetscape color on tourists’ emotional perception based on streetscape images. J. Geo-Inf. Sci. 2024, 26, 514–529. [Google Scholar]
  54. Han, S.; Song, D.; Shi, F.; Du, H.; Zhang, Y.; Yang, M. Assessing Neighbourhood Preference: An Evaluation of Environmental Features within Small-Scale Open Spaces. Land 2024, 13, 531. [Google Scholar] [CrossRef]
  55. He, H.; Lin, X.; Yang, Y.; Lu, Y. Association of street greenery and physical activity in older adults: A novel study using pedestrian-centered photographs. Urban For. Urban Green. 2020, 55, 126789. [Google Scholar] [CrossRef]
  56. Li, H.; Yang, J.; Jiang, H. Study on the Influence of Rural Highway Landscape Green Vision Rate on Driving Load Based on Factor Analysis. Sensors 2025, 25, 335. [Google Scholar] [CrossRef]
  57. Box, G.E.; Cox, D.R. An analysis of transformations. J. R. Stat. Soc. Ser. B Stat. Methodol. 1964, 26, 211–243. [Google Scholar] [CrossRef]
  58. Moscardo, G. Mindful visitors: Heritage and tourism. Ann. Tour. Res. 1996, 23, 376–397. [Google Scholar] [CrossRef]
  59. Tatler, B.W. The central fixation bias in scene viewing: Selecting an optimal viewing position independently of motor biases and image feature distributions. J. Vis. 2007, 7, 4. [Google Scholar] [CrossRef] [PubMed]
  60. Tseng, P.H.; Carmi, R.; Cameron, I.G.; Munoz, D.P.; Itti, L. Quantifying center bias of observers in free viewing of dynamic natural scenes. J. Vis. 2009, 9, 4. [Google Scholar] [CrossRef] [PubMed]
  61. Wu, H.C.; Li, T. An empirical study of the effects of service quality, visitor satisfaction, and emotions on behavioral intentions of visitors to the museums of Macau. J. Qual. Assur. Hosp. Tour. 2015, 16, 80–102. [Google Scholar] [CrossRef]
  62. Zhang, L.; Zhang, R.; Yin, B. The impact of the built-up environment of streets on pedestrian activities in the historical area. Alex. Eng. J. 2021, 60, 285–300. [Google Scholar] [CrossRef]
  63. Nasar, J.L. (Ed.) Environmental Aesthetics: Theory, Research, and Application; Cambridge University Press: Cambridge, UK, 1992. [Google Scholar]
  64. Du, J.; Ren, G.; Liu, W.; Li, H. How is the visual working memory load of driver influenced by information density of traffic signs? Transp. Res. Part F Traffic Psychol. Behav. 2022, 86, 65–83. [Google Scholar] [CrossRef]
  65. Zhang, F.; Zhou, B.; Liu, L.; Liu, Y.; Fung, H.H.; Lin, H.; Ratti, C. Measuring human perceptions of a large-scale urban region using machine learning. Landsc. Urban Plan. 2018, 180, 148–160. [Google Scholar] [CrossRef]
  66. Llopis, J.; Torres, A.; Serra, J.; García, Á. The preservation of the chromatic image of historical cities as a cultural value. The old city of Valencia (Spain). J. Cult. Herit. 2015, 16, 611–622. [Google Scholar] [CrossRef]
Figure 1. Case study area.
Buildings 15 03224 g001
Figure 2. The flow diagram of the study.
Buildings 15 03224 g002
Figure 3. Classification of AOI Elements.
Buildings 15 03224 g003
Figure 4. Form–culture–ecology interaction framework.
Buildings 15 03224 g004
Figure 5. Heat map of viewpoints. This figure aggregates the fixation data from all participants, with red areas indicating regions with higher levels of attention and longer fixation duration, and green areas showing lower levels of attention.
Buildings 15 03224 g005
Figure 6. Distribution of interest across eye-tracking elements. This figure presents Fixation Duration characteristics (TFD, AFD, FFD, and TFF) and Fixation Counts (VC and FC) across six categories of interface elements: commerce, architecture, landscape, street, natural, and social.
Buildings 15 03224 g006
Figure 7. Box plot of eye-tracking element metrics. Note: Asterisks indicate levels of statistical significance (* p < 0.05, ** p < 0.01, *** p < 0.001, **** p < 0.0001).
Buildings 15 03224 g007
Figure 8. Map of satisfaction-driven variations in street interface characteristics. This figure illustrates the relationship between street-interface features and satisfaction under the form–culture–ecology framework. (Panel a) displays form indicators (DHR, SWCR, SVF, and SP), while (Panel b) groups culture and ecology indicators (HLL, VCC, and GVI), enabling comparison between feature values and satisfaction.
Buildings 15 03224 g008
Figure 9. Pearson correlation heat map of key variables.
Buildings 15 03224 g009
Figure 10. Validation of model assumptions through residual diagnostics. Panel (a) shows the Q–Q plot of residuals confirming no significant deviation from normality, while panel (b) presents the residuals versus fitted values indicating no heteroscedasticity.
Buildings 15 03224 g010
Figure 11. SHAP value distribution for predictor contributions.
Buildings 15 03224 g011
Figure 12. Influence map between Historical Linguistic Landscape and visual elements.
Buildings 15 03224 g012
Table 1. AOI element classification.
Primary ElementsSecondary Elements
Built EnvironmentArchitectural ElementsDoor and Window Openings, Eaves, Entrance Portals, Plaques and Couplets, Architectural Decorative Components (Permanent)
Street ElementsPaved Roads
Commercial ElementsStorefront Signage, Display Windows, Promotional Stalls
Landscape ElementsStreet Furniture, Decorative Walls, Temporary Installations (e.g., Lanterns)
Natural ElementsTree Canopies, Flower Beds, Lawns
Socio-Behavioural ElementsPedestrians, Motor Vehicles
Table 2. Definitions of eye-tracking metrics and corresponding emotional responses.
Eye-Tracking MetricIndicator DefinitionEmotional Performance
Total Fixation DurationIndicates the Total Fixation Duration on a specific street element within the observation period, reflecting its overall attentional engagement from a temporal perspective.Higher TFD values indicate that the element of interest is more visually attractive.
Average Fixation DurationCalculated as Total Fixation Duration divided by Fixation Count, this metric reflects the average fixation time and indicates the level of cognitive engagement with a given element.Higher AFD values indicate greater information complexity and cognitive processing demand.
First Fixation DurationCaptures the duration of the initial fixation on a street element, reflecting the participant’s first visual interaction.A higher FFD indicates a greater visual impact or uniqueness of the element.
Time to First FixationMeasures the time from stimulus onset to the first fixation on the target element, indicating its visibility and recognizability.Lower TFF values indicate that an element is more easily recognizable.
Fixation CountCounts the number of fixations on a street element, indicating the frequency of visual attention during the observation period.Higher FC values signify richer detail or increased visual complexity.
Visit CountIndicates the number of returns to a street element, reflecting the frequency of repeated visual engagement during the observation period.Higher VC values reflect greater visual prominence and salience within the environment.
Table 3. Selected indicators for street interface characterisation.
CategoryIndicatorCalculation/Formula
Form AttributesDistance-to-Height Ratio D / H = D a v g H a v g   × 100%
(Where Davg represents the average street width, and Havg denotes the average building height.)
Street Width Change Rate W r = W m a x W m i n W a v g
(Where Wr, Wmax, Wmin, and Wavg denote the width variation rate, maximum, minimum, and average street widths, respectively.)
Sky View Factor P = N s N t × 100 %
(Where P represents sky visibility, Ns denotes the sky pixel volume area, and Nt represents the total screen pixel area.)
Street Permeability P = A d A w A t × 100 %
(Where P denotes interface permeability, Ad is the total area of ground-floor doorways, Aw the area of windows, and At the total ground-floor façade area.)
Cultural AttributesHistorical Linguistic Landscape R = N c N t × 100 %
(Where Nc denotes the number of historical linguistic landscape elements, and Nt the total number of linguistic landscape elements.)
Visual Complexity of Colour C c = i = 0 n S 2 1
(Where Cc represents Visual Complexity of Colour, n is the number of extracted primary colours, and S is the area occupied by each colour.)
Ecological AttributesGreen View Index G V I = A g A t × 100 %
(Where GVI represents the Green View Index, Ag denotes the polygonal area of green vegetation, and At represents the total image coverage area.)
Table 4. ANOVA results and means for each eye-tracking indicator.
TFDATDFFDTFFFCVC
p-value<0.01<0.01<0.01<0.01<0.01<0.01
F-value92.76123.71925.30537.83681.73896.159
Mean value of factors
Commerce41.36318.03811.55934.61044.94435.611
Architecture90.55013.92715.48043.178123.83384.472
Landscape33.84410.1068.79449.82736.72230.083
Street21.7559.6388.63873.87534.75023.778
Natural38.1725.3379.99765.18958.22244.139
Social3.3936.9332.09214.6904.2503.694
Table 5. Results of the Shapiro–Wilk normality test.
DHRSWCRSVFSPHLLVCCGVISatisfaction
Statistic0.970.960.960.940.910.960.960.95
p value0.360.150.190.05<0.010.350.230.1
Table 6. Variance inflation factor (VIF) results for the independent variables.
VariableDHRSWCRSVFSPHLLVCCGVI
VIF1.6041.221.871.201.301.221.72
Table 7. Results of multivariate regression analysis.
R20.756MSE0.08Model Intercept3.931
Satisfaction regression coefficientDHRSWCRSVFSPHLLVCCGVI
0.178−0.3930.1690.4011.088−1.181−0.138
Durbin–Watson value 1.90
Disclaimer/Publisher’s Note: The statements, opinions and data contained in all publications are solely those of the individual author(s) and contributor(s) and not of MDPI and/or the editor(s). MDPI and/or the editor(s) disclaim responsibility for any injury to people or property resulting from any ideas, methods, instructions or products referred to in the content.