Abstract
To investigate the strain patterns and shear failure mechanisms of concrete-filled steel tube (CFT) column-end-plate joints during construction, this study designed and fabricated a scaled model of a standard subway station section based on similarity theory. Model tests were conducted under static earth pressure loads, and a finite element model was constructed for comparative analysis. The study focused on the ultimate bearing capacity, failure modes, and force transmission mechanisms of the joint, and optimized the analysis using reinforcement parameters. The results showed significant stress concentrations at the joint corners and core, with shear forces gradually forming annular cracks in the top slab concrete. The bearing system formed by the steel tube column and flange was the primary force transmission mechanism, and even after damage, the steel tube could still effectively restrain the core concrete. Increasing the steel bar diameter and increasing the number of slab reinforcements parallel to the beam significantly improved the joint’s mechanical properties. Improving the material properties of the reinforcement increased the joint’s stress and displacement capacity. This research provides a reference for optimizing the design and construction of slab-column joints in subway stations.
1. Introduction
In order to solve the problem of traffic congestion, subways are used as an important means of transportation in cities. However, the available land resources for building subway stations in urban areas are becoming increasingly scarce. In order to alleviate the contradiction between the two, foundation pit engineering has been developing in the direction of “deep, wide and wide” in recent years. The construction of subway stations leads to complex node structure stress. During the construction phase, there is a temporary and permanent structure integrated design, and the load effect continues throughout the construction and use process [1,2,3,4,5]. Because the steel column and the top plate are the first components to be constructed, the stress of the column end plate node composed of them is complex, which can easily cause serious plastic damage [6,7,8,9,10].
Due to the limited requirements of building space and the requirements for material ductility and bearing effect, underground structures often use steel tube concrete columns. However, the shear resistance of the connection node between the steel tube concrete column and the slab affects the safety of the structure. Li Yichen et al. [11] studied the performance test of the slab-column node with hidden beam stirrups after shear failure. The results showed that after shear failure, the presence of shear stirrups can effectively protect the slab reinforcement and improve the ductility of the slab-column node. Carbon fiber bars and carbon fiber cloth can be used to form fiber-reinforced composite materials for strengthening slab-column nodes. Zhao Yingkai et al. [12] used CFRP grid bars to replace the longitudinal steel bars and shear bars of the floor slab at the slab-column node. The CFRP bars effectively suppressed the development of cracks. With the increase of the CFRP bar reinforcement ratio, the shear bearing capacity and deformation capacity of the node increased. Toshiyuki Fukumoto et al. [13] conducted an experimental study on the factors affecting the shear bearing capacity of steel tube concrete column-steel beam nodes and proposed a calculation model for the connection between steel beam and steel tube concrete column. This calculation model covers factors such as concrete strength grade, steel tube size, steel bar strength grade, axial compression ratio, and verifies that the calculated values of this model are consistent with the experimental values.
Lu Xilin [14,15] conducted experimental research on the load-bearing pin node, external ring beam node, through-reinforced ring beam node, and steel node of rectangular CFT, and analyzed the influence of different reinforcement forms and different structural forms on node performance. The study shows that the CFT ring beam node can be applied to actual engineering and proposes a design method for connecting rectangular CFT and concrete beams using the ring beam node. Fan Shuailong [16] investigates the axial compressive performance of a novel prefabricated square semi-continuous concrete-filled steel tubular column. This column utilizes flanged sleeves and high-strength bolts for simplified on-site assembly. Through experiments (16 specimens) and techniques such as acoustic emission and digital image correlation, the study analyzed the effects of various parameters (such as tube thickness, sleeve thickness, and slenderness ratio) on the mechanical properties, failure modes, and bearing capacity. Comparisons with cast-in-place continuous columns were conducted, ultimately validating the effectiveness of the bearing capacity calculation method. Zezhong Zheng [17] investigates the performance of a T-shaped concrete-filled steel tubular (CFST) column with an internal T-shaped steel skeleton under axial compression. Conventional special-shaped columns suffer from space-consuming corners, heavy reinforced concrete (RC) columns, and susceptibility to cracking. This proposed new column type combines the advantages of special-section CFST columns and section steel reinforced concrete (SRC) columns. Through experiments and finite element analysis, the effects of three key parameters—the steel tube constraint index, the internal steel skeleton ratio, and the slenderness ratio—on its failure mode, bearing capacity, and mechanical properties were investigated. Finally, a simplified formula for calculating the ultimate bearing capacity of medium-length columns was proposed.
In summary, a large number of references and research materials show that node research is feasible and of great value. However, there is still much to be studied regarding large-scale model test analysis, underground complex soil pressure fitting, and the exploration of the load effect law of slab-column nodes. This study systematically analyzed the mechanical performance of subway station slab-column components under different operating conditions, combining model testing with numerical simulation. Loading tests characterized the mechanical response of the components during construction and service. Combined with finite element simulation results, the study revealed the load transfer paths and internal force distribution patterns of the slab-column joint. The study further summarized the stress mechanisms and failure modes, identifying key influencing factors. The findings provide a theoretical basis and engineering reference for the structural design, mechanical safety assessment, and optimized construction plans of similar slab-column joints in subway stations.
2. Test Overview
2.1. Specimen Design
According to the principle of similarity, the test model was scaled down by 1/10, with a length of 5.1 m, a width of 2.45 m, and a height of 2.77 m. As it belongs to the complete standard section of the station, it has a larger size compared with the other test specimens in China, which mostly consist of a single component.
The overall specimen is shown in Figure 1. Once fully assembled, the specimen needs to be transferred to the loading site. To facilitate lifting and transferring, the base plate is extended outward by 0.5 m on both sides, and lifting hooks are installed at the four corners using 18 mm steel bars. Achieving precise detailing is challenging, especially at the joints of the middle floor, where a special template is used to encase the concrete, the inner wall reinforcement is welded layer by layer to match the construction process, and screws are used instead of rods to strengthen the anchoring. To ensure the safe installation of construction positioning devices, a steel casing is installed outside the steel pipe columns, extending 3000 mm below the base plate and 700 mm above the steel pipe columns. During the fabrication of the laboratory model, a level and wooden brackets were used to control the positioning and installation of the columns.
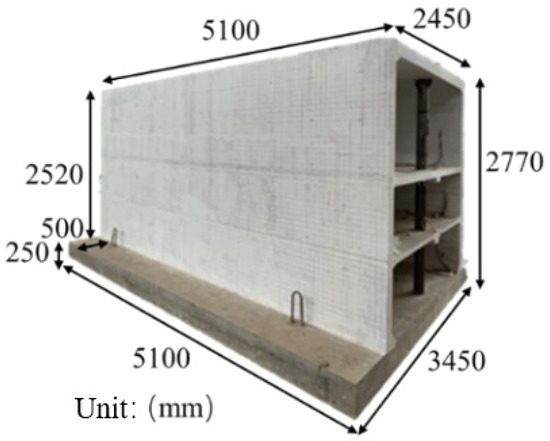
Figure 1.
Overall Specimen.
The components of the subway station node are complex, including concrete-filled steel tube columns, concealed beams, top plates, and other structural elements. Inside the steel pipe columns, anchoring bars and ring stirrups are made according to the design. To ensure the quality of the welds, grade 8.8 shear studs are used at the beam-column joints, as shown in Figure 2.
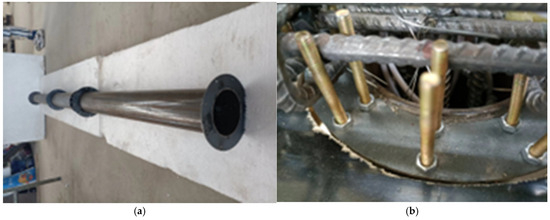
Figure 2.
Components of the Slab-Column Joint. (a) Shear Studs; (b) Reinforcement Details.
2.2. Material Properties of Specimen
The test materials are the same as those used in the actual project. The design grades for the concrete in the test specimens are C35 and C60. During the casting of the joint specimens, three sets of standard cubic concrete specimens (measuring 150 mm × 150 mm × 150 mm) and three sets of prismatic specimens (measuring 150 mm × 150 mm × 300 mm) were reserved. These specimens were cured under the same conditions and at the same time as the test specimens. The standard compression specimens were also cured under the same conditions [18]. Compression strength and elastic modulus tests were performed using an electro-hydraulic servo pressure testing machine. The standard compression test results for the concrete cubic material properties are shown in Table 1.

Table 1.
Concrete Material Properties.
The steel plates and sections use Q235 grade, and the longitudinal bars and 8 tie bars use HRB400 grade. The specific reinforcing bars used are shown in Table 2. The shear studs are made of ML15. According to GB/T288.1—2010 ⟪Metallic Materials—Tensile Testing—Part 1: Method of Test at Room Temperature⟫ [19], standard tensile tests were conducted using a 100-ton MTS universal testing machine. The mechanical properties of the steel plates, rebar studs, and rebar couplers were determined, as shown in Table 3.
Table 2.
Test model reinforcement table.
Table 3.
Steel mechanical property index.
2.3. Loading Devices and Systems
The traditional common node study is only a model study of the node part of the scaled specimen, and after the preliminary simulation of the software, the loading method used is also mostly for the end of the column, in the column, or the beam end loading, and so on. Due to the complexity of the actual component force transmission, the node of the column end plate is a critical part of the force. In order to more closely fit the actual state of stress and reasonably determine the loading level for bearing capacity analysis, combined with the laboratory site conditions, the upper load is simulated using a counterweight block overburden pressure and directly applied to the roof, and the horizontal earth pressure is loaded by hydraulic jacks layer by layer. The gantry column is fixed in the ground track groove by ground anchor bolts, and the hydraulic jack is used to act on the distribution beam, and sand is placed in the two steel plate interlayers to uniformly load again, and finally transferred to the main structure of the two sides of the wall. The schematic and detailed drawings of the test loading device are shown in Figure 3, respectively.
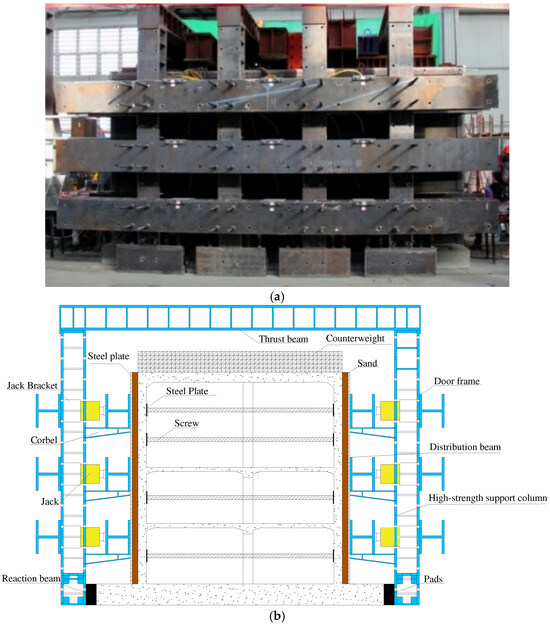
Figure 3.
Schematic diagram of the test loading device. (a) Photograph of the loading device; (b) CAD drawing of the loading device.
This test mainly simulates the static load of soil pressure, whose general pattern is presented as small up and large down, and has a stepped pattern due to the change of groundwater and soil quality. In order to meet the various ranges of pressure simulation, the required jacks are arranged in three layers, and the jack amplitude at each height is different. Combined with the distribution of the volume and sand bedding multi-stage distribution, so that the concentrated force of the jacks forms a uniform force, combined with the hydraulic jacks and customized hydraulic control system to ensure the loading synchronicity.
Before loading, a preload is performed, and the depth of the jack heads is adjusted to ensure simultaneous loading on the same horizontal surface. The formal loading phase is divided into a construction phase and a normal operation phase. During the construction phase, loading is performed according to the working load, as shown in Table 4. Afterward, the screws are tightened to maintain force balance, and then equivalent earth pressure is applied while the screws are gradually unloaded to simulate excavation. During the normal operation phase, the screws are completely released and loaded step by step. A loading diagram is shown in Figure 4.
Table 4.
Working condition load table.
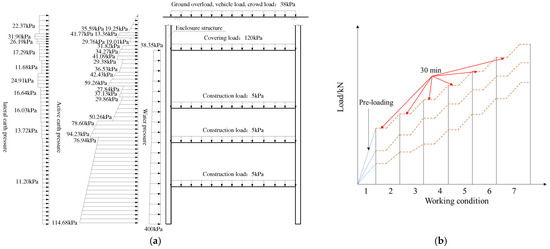
Figure 4.
Loading diagram. (a) Force map of subway station; (b) Loading load schematic diagram.
2.4. Measurement Programme
The reinforcement strain gauges are mainly arranged at the ends and middle of the reinforcement, the concrete slab strain gauges are correspondingly distributed at the mid-span and edges, and near the column nodes along the circumferential and radial directions, respectively, as shown in Figure 5.
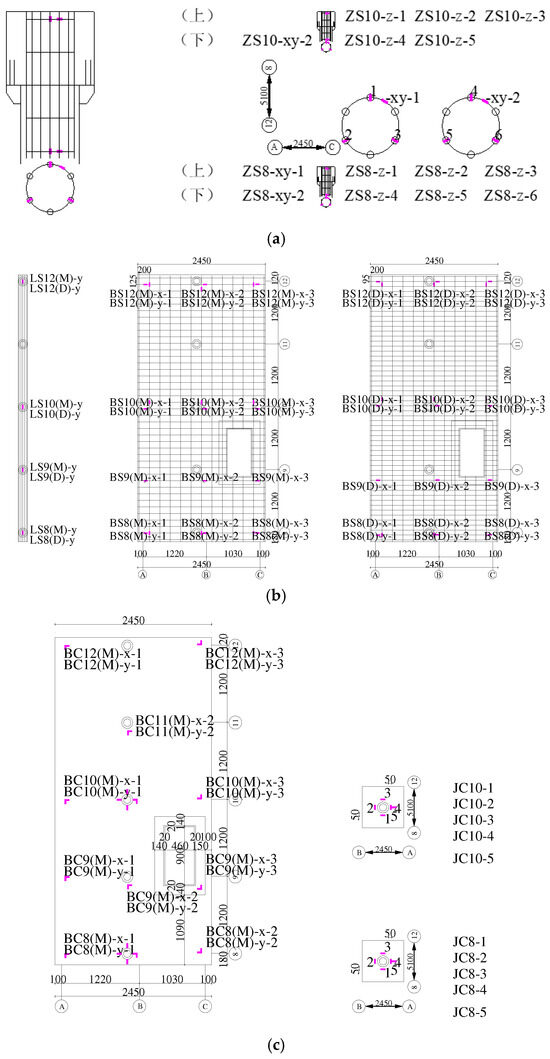
Figure 5.
Strain Gauge Arrangement. (a) Nodal reinforcement strain gauge layout; (b) Strain gauge arrangement for beam and plate reinforcement; (c) Arrangement of strain gauges in slab concrete.
In order to study the change rule of nodal displacement with loading, displacement gauges are installed at the nodes of the column end plates of the model structure to measure the deformation of the specimen, as shown in Figure 6, and the displacement gauges are arranged in the middle and the side of the model of the standard section, i.e., near the top plate of the column end of 8-axis and 10-axis, respectively. Considering that the deformation of the center column would be relatively large, horizontal displacement gauges were arranged at the top of the center column, horizontal displacement gauges at the end of the column, and vertical displacement gauges at the top plate were used to monitor the change of positional shape near the node of the end plate of the column in space.
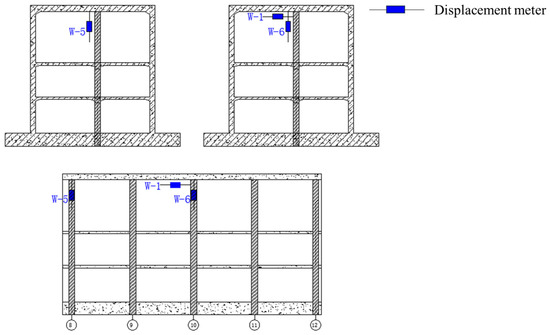
Figure 6.
Displacement meter arrangement.
3. Test Phenomena and Damage Characteristics
3.1. Test Phenomena
The specific morphology of the nodes during the test is shown in Figure 7, with Working condition 1 retaining the screw and Working condition 2 removing the screw to simulate completed soil excavation, with no significant change in the nodes; At loading condition 3, cracks appeared near the 10-axis node, as shown in Figure 7a; Continuing with loading condition 4, the 10-axis is the intermediate axial column of the standard section, and the initial cracking of the node is carried out with the expansion to the 9-axis and 11-axis as the main Figure 7b; In loading condition 5, after the formation of scattered small cracks in the end plate of the column, the circular crack along the width of the dark beam is carried out as shown in Figure 7c and widens rapidly, the displacement of the top plate as a force transmitting member varies considerably, and the displacement of the top plate during the loading process is shown in Figure 8; Continuing to load condition 6, the structure of each member of the obvious deformation, cracks form a ring-shaped through the joints, there is a significant phenomenon of mis-layering Figure 7d, for the entire structure of the first location of the obvious fracture; At loading condition 7, the expansion of the node cracks intensified, emitted abnormal noise, formed through joints, and began to develop laterally in both directions of the wall, and spalling phenomenon appeared.
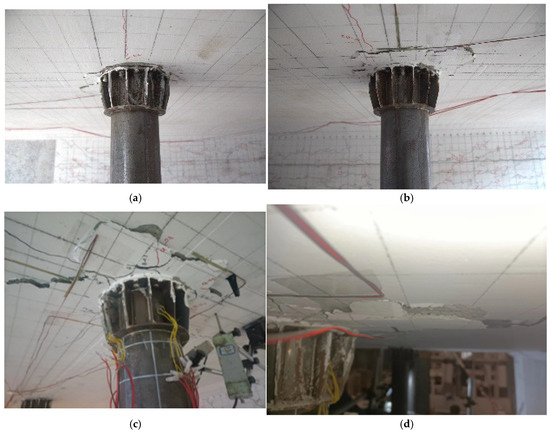
Figure 7.
Node destruction process. (a) Nodal concrete cracking pattern; (b) Nodal cracks expand further; (c) Nodal concrete cracking pattern; (d) Nodal cracking and mislaying phenomenon.
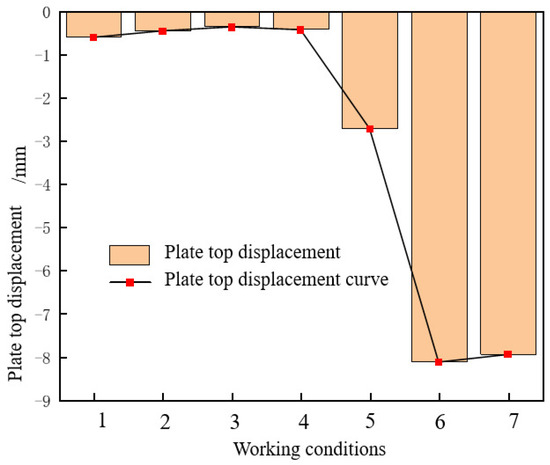
Figure 8.
Displacement diagram of column 8-axis node.
Side column end plate node is mainly for plate force transfer, deformation process plate is always in the downward concave, the loading node of each working condition is step-like increase, but due to the lack of constraints on the interface of the edge of the standard section, the deformation is relatively free, and the final cracks are carried out less, Figure 8 shows the column 8-axis node displacement diagram.
According to Figure 8, the thickness of the top slab is the largest compared to other layers, reaching 120 mm, and the stepped load distribution on both sides makes the applied load value of the top layer relatively small, and the displacement changes from Working condition 1 to Working condition 4 are not obvious. When the load value of 4 times the basic earth pressure is applied to Working condition 5, the displacement is about 5 times that of the previous 4 Working conditions. In Working condition 6, when 7.5 times the load is applied, the displacement of the slab at the node increases significantly, and then the displacement is basically locked at about 8 mm.
3.2. Damage Characteristics
Cracks appeared at the nodes when Working condition 3 loading was applied to the specimens, and spalling occurred at the nodes when Working condition 7 loading was applied and the crack development pattern at the nodes of the top plate is shown in Figure 9.
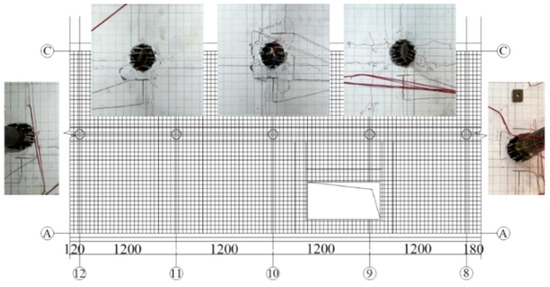
Figure 9.
Distribution of cracks in the top plate.
According to Figure 9, it can be seen that the cracks around the nodes of the five column end plates in this standard section are developed in both radial and tangential directions, while the middle three groups of cracks are more fully developed.
Based on Figure 10, it can be observed that the displacement of the 8-axis is mostly negative, while the displacement of the 10-axis is mostly positive. This indicates that the roof generally shows an upward arching in the middle and a downward deflection at the edges, with more noticeable deformation in the middle. Analyzing each condition, Condition 2 exhibits the first displacement mutation due to the simulation of soil unloading by step-by-step unloading of the screw rods, causing the displacement direction of the two vertically placed displacement meters to increase consistently. However, the displacement direction of the horizontally placed displacement meter W-6 at the top of the column changes due to the constraint of the flange and steel pipe. In Condition 4, the vertical and horizontal displacement changes at the central node are equal, indicating that the width of the crack expansion in both vertical and horizontal directions is the same. In Condition 7, there was already significant local cracking and relative failure before the final displacement mutation occurred.
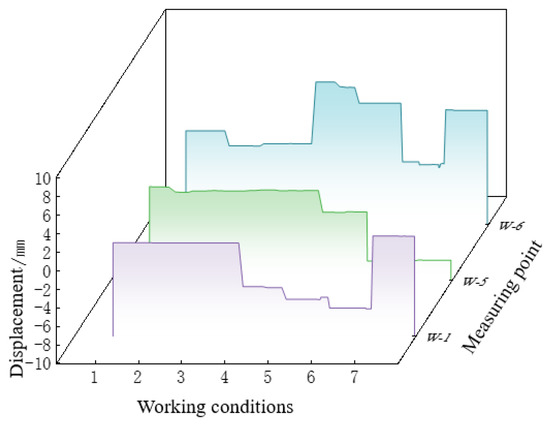
Figure 10.
Displacement-Load Curve.
4. Strain and Load Bearing Capacity Analysis
4.1. Node
The circumferential strain gauges and radial strain gauges on the concrete slab surrounding the column are all circumferential strain gauges except JC8-5 and JC10-5, which are radial strain gauges. The strain trend of nodes is shown in Figure 11.
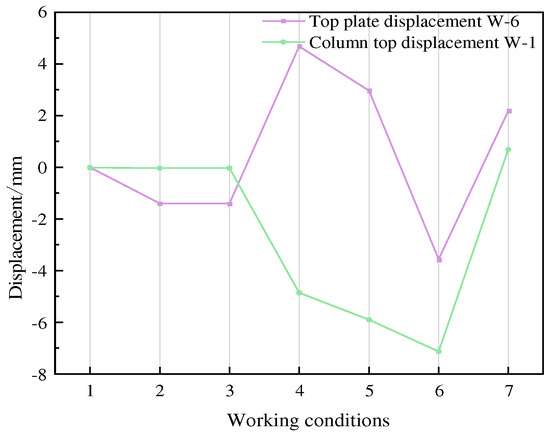
Figure 11.
Concrete strain diagrams for nodes of axes 8 and 10.
It is known from the analysis in Figure 11 that JC8-2 is a toroidal strain gauge at the edge of the standard segment plate, which has completely different deformation conditions from other positions and reaches yield early. The circumferential strain values of the 10-axis nodes are all positive, but the radial strain values are negative. When the 10-fold load is applied, the strain values begin to change significantly.
4.2. Concrete Slab
The test specimen was subjected to working conditions 1 to 7. According to the test measurement results, the strain trend of the roof concrete is shown in the figure, and the concrete slab near the node is shown in Figure 12.
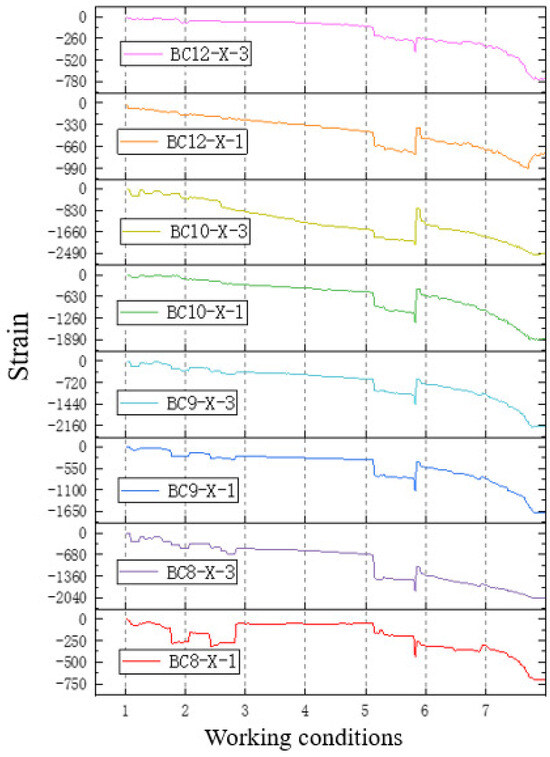
Figure 12.
Strain trend diagram of the roof concrete.
According to Figure 11, the strain of No. 10 around the top plate of the column is the largest, and its maximum variation range is about 2200. Due to the gap near the top plate of No. 10 around the column, the roof can bear a large load. The trend of strain in the figure is roughly the same and tends to moderate before the action of working condition 5. After the action of working condition 5, the strain changes greatly, indicating that the specimen has obvious cracks and the component has been destroyed.
As shown in Figure 13, by comparing the strain conditions of the concrete slab at the node and 1 m away from the node, it can be concluded that the strain deformation of the roof mainly occurs at the plate-column node, and the deformation of the slab wall node and the position in the plate is much smaller than that at the plate-column node, or even fails to yield.
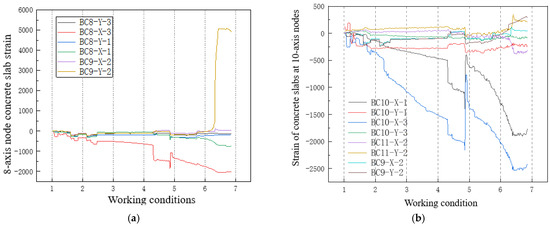
Figure 13.
Strain trend diagram of concrete slab near the node; (a) Nodes of axis 8; (b) Nodes of axis 10.
4.3. Beam Reinforcement
The test specimen was subjected to working conditions 1 to 7. According to the test results, the strain trend of the beam reinforcement is shown in Figure 14.
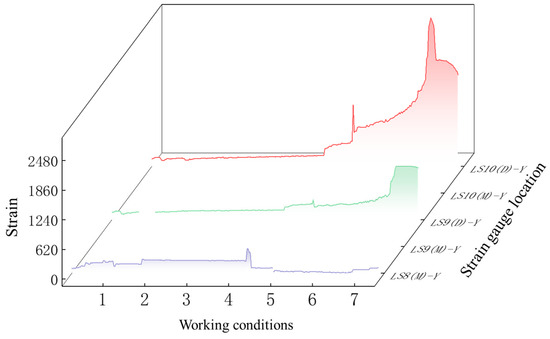
Figure 14.
Strain trend diagram of beam reinforcement.
As can be seen from Figure 14, the LS10(D)-Y of column No. 10 at the steel reinforcement measurement point under the action of working condition 7 is up to 2900, and its strain variation is up to about 3000, indicating that the beam reinforcement is greatly affected by external loads near the opening. According to the strain condition of the roof dark beam through the joint, the beam is bent and damaged, so the deformation in the middle of the beam is larger than that at the end of the beam, and the obvious deformation begins to occur when 10 times the load is applied. The strain value of the bottom bar of the main beam is greater than that of the upper bar, regardless of the middle or the end of the beam, due to the direct effect of the equivalent covering load on the roof and the gradual failure of the joint bond. According to the measurement results of column 9 and column 10, the strain value of the bottom bar of the main beam is about twice that of the upper bar.
5. Finite Element Comparative Analysis
5.1. Finite Element Analysis Model
Using Abaqus finite element software, a 3D numerical model was constructed based on the laboratory test model. The concrete beams and slabs were modeled using 3D solid elements, the reinforcement was modeled using truss elements, and the steel pipes and flanges were modeled using shell elements. The dimensions were consistent with those of the construction and laboratory model specimens, and the component types are shown in Figure 15.
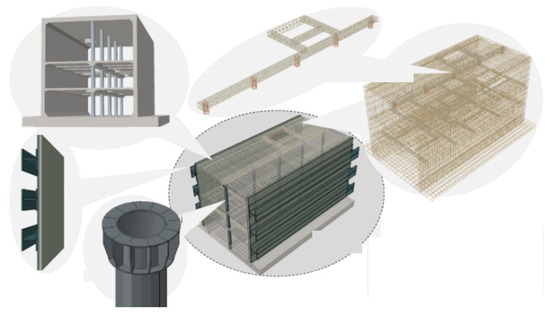
Figure 15.
Component diagram of a finite element model.
The main purposes of FEM are as follows:
- (1)
- Ensure consistency between numerical simulation and experimental conditions: By aligning the geometry, component types, and boundary conditions with the laboratory model, we ensure that simulation results accurately reflect the stress and deformation behavior of the components during the test. Simplify the processing of minor components such as reaction beams and reaction frames to reduce modeling complexity while maintaining the overall stress characteristics.
- (2)
- Verify the bearing mechanism of the joint under earth pressure and subsequent loading: By applying equivalent earth pressure on both sides of the distributed beam in the model, we simulated actual construction conditions and analyzed the bearing capacity and failure modes of the column-end-plate joint. This also provided data support for structural redundancy research and explored the ultimate bearing capacity and failure mechanisms of the joint under different load levels.
The concrete damage plasticity model is a continuous medium damage model based on plasticity. It assumes that concrete materials have two mechanisms: tensile cracking and compression failure. It can take into account the difference in tensile and compressive strength of concrete, simulate the working performance of concrete under uniaxial stress, and the failure mechanism of concrete modulus reduction under dynamic load. As the plastic stage deepens, the tensile and compressive stiffness of concrete gradually decreases. According to the calculation provided in the concrete code [19], the following uniaxial stress-strain relationship is obtained:
Uniaxial compressive stress-strain curve equation
is the parameter value of the rising and falling sections of the uniaxial compressive stress-strain curve; is the uniaxial compressive strength of concrete; is the peak compressive strain of concrete corresponding to .
The stress-strain curve equation for uniaxial tension is the following:
is the parameter value of the rising and falling sections of the uniaxial tensile stress-strain curve; a is the uniaxial tensile strength of concrete; is the peak compressive strain of concrete corresponding to b.
Reinforced concrete structures are structures where both steel and concrete are subjected to combined forces. Therefore, in finite element analysis, in addition to accurately modeling the concrete material, the impact of the steel on the mechanical properties of the concrete material, as well as the interplay between the steel and concrete, is equally crucial. In Abaqus, the steel in steel-concrete structures is modeled using steel bar elements. The mechanical behavior of the steel is described using metal plasticity theory. Because the steel bars in reinforced concrete structures are very slender and primarily subjected to forces along their longitudinal direction, the steel bar elements are typically treated as one-dimensional strain elements. The steel and concrete are calculated independently, and their mechanical behavior does not affect each other. The interrelationship between them (bond slip and locking behavior) is modeled through “tensile hardening” in the concrete element, allowing for the role of the steel bar to be considered. In this paper, HRB400 steel is used for the steel bars, while Q235 steel is used for the columns, flanges, and other components. A typical stress-strain curve for low-carbon mild steel is shown in Figure 16.
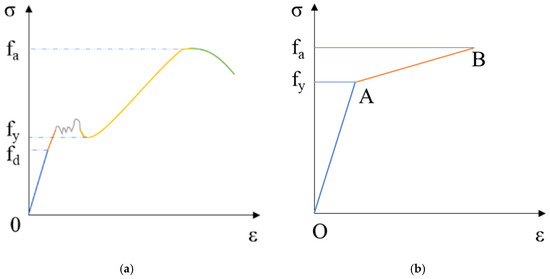
Figure 16.
Stress-strain diagram of steel. (a) Stress-strain curve of steel; (b) Double-line model.
The simulated boundary conditions are consistent with those of the laboratory tests. The freedom of U1, U2, U3, UR1, UR2, and UR3 on the lower surface of the bottom is restricted by applying constraints according to the self-weight of the structure of the indoor loading test, and the relative movement of the base does not occur. The distribution beam and reaction beam used for loading are, respectively, fixed on the reaction frame by ox leg bolts, and the reaction frame is anchored in the floor by anchor bolts. However, in finite element simulation, it is necessary to simplify properly, omit the reaction beam and the reaction frame, and connect the distribution beam with the steel plate through contact. In order to avoid excessive constraints, no additional boundary constraints are set.
According to the laboratory loading method, the beam side load is applied on both sides of the model. The design of the test load is based on the soil pressure of the soil on both sides of the prototype in the construction stage of the project case. Meanwhile, in order to carry out the follow-up redundancy test of the structure, the calculation line load of earth pressure is converted after the indoor test is completed, compared, and weighed. First, the concentrated load is applied locally, and the specific operation is to obtain the load through the control of the hydraulic oil pump on both sides of the distribution beam. During software simulation, referring to the source of load data, the corresponding equivalent pressure is directly added to the sides of the flange of both steel plates for layered loading. The equivalent method is as follows, and the layout distribution is shown in Figure 17.
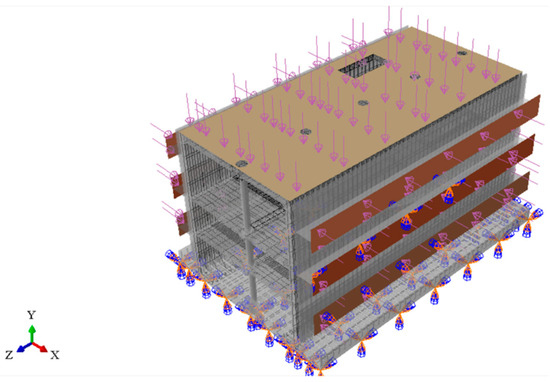
Figure 17.
Layout of boundary conditions and applied loads.
5.2. Failure Modes of Column End Plate Nodes
SDEG represents the value of the damage variable; a value of 0 indicates that no damage has occurred; a value of 1 indicates that the cohesive unit fails completely. The contour map of damage degree and damage development of column end plate nodes is shown in Figure 18.
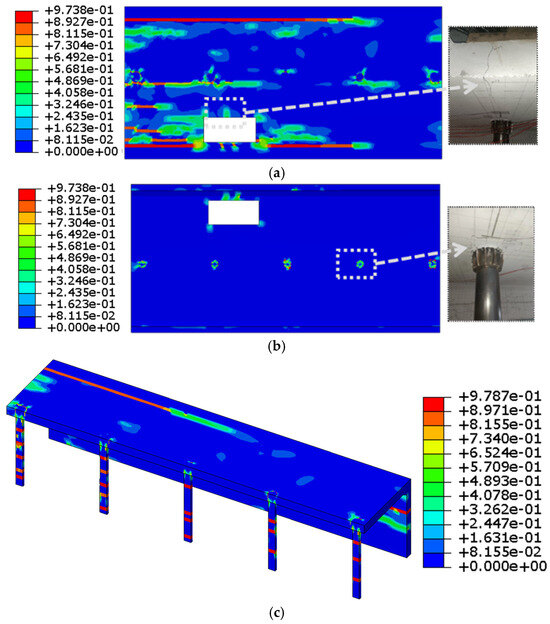
Figure 18.
Contour map of concrete damage. (a) Roof surface damage contour map; (b) Roof damage contour map; (c) Damage contour map of plate-column nodes under 10 times load.
Combined with Figure 18, it can be seen that the simulated damage location is very similar to the actual crack development in the test. For example, the crack propagation and penetration between the test roof opening and the column are similar to the simulated results. The damage on the lower surface of the concrete is mainly concentrated at the joint of the slab column and the entrance of the cave. The damage range of the upper surface is widely distributed because the upper surface directly bears the load of the upper soil. In addition to the corresponding parts of the lower part and the joints between them, the damage range includes the joint of the slab wall.
The fracture distribution and crack width of concrete structures can be approximately reflected by the damage cloud image, combined with the comparison results of the damage cloud image and experimental failure phenomena. Therefore, the cracking extension process of joint cracks can be obtained by combining the damage cloud image of each analysis step. At the joint of the plate-column, plasticity appears first, and the shape is distributed in a ring shape around the outside diameter of the column, and then it extends lengthwise to the thickness of the roof. Meanwhile, the layered damage of the concrete column also appears and becomes more and more serious. In the second analysis step, when the load is applied 10 times, the damage mutation is obvious, and then with the increase of the load, the original damage site is mostly aggravated.
5.3. Stress-Strain Analysis
The stress cloud diagram of the concrete end plate is shown in Figure 19. During the software simulation, the maximum value of the roof stress is 9.301 MPa, but the distribution range is limited to a few areas, such as the corner of the entrance, and the stress value in most areas is distributed in the range of 1.593~6.969 MPa.
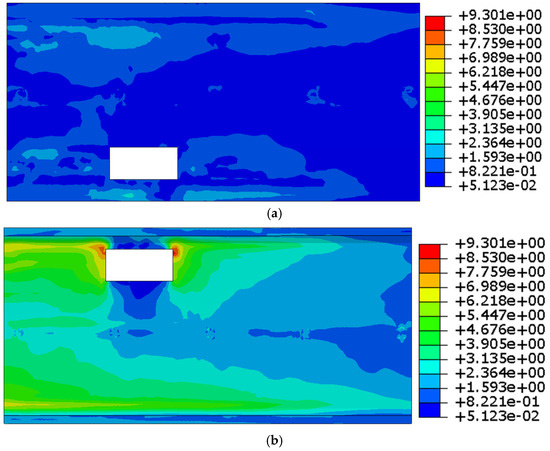
Figure 19.
Stress cloud map of the lower surface of the concrete slab (unit: MPa). (a) Surface stress cloud map of concrete slab; (b) Stress nephogram of the lower surface of the concrete slab.
With the increase of load, except for the local stress of the flange ring plate and other parts, which is about 11 MPa, the stress value at the top of other steel components, such as the steel pipe column, is only 8 MPa, which indicates that the outer steel pipe of the concrete column plays an effective lateral restraint role. Under the joint action of steel pipe and concrete, the steel pipe can still better constrain the concrete in the tube after the specimen is damaged.
The load strain curve is shown in Figure 20, where the load is represented by the load applied by the negative layer close to the roof.
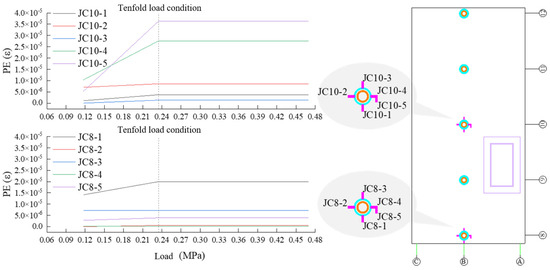
Figure 20.
Load strain image of end plate nodes.
According to the analysis of Figure 20, before applying 10 times the load, the corresponding strain variable of concrete slabs in each part of the node increases linearly due to the increase of the applied load; after applying 10 times the load, the corresponding strain of concrete slabs in each part of the node is relatively stable, indicating that the damage at the node is relatively serious. JC8-1 in axis 8 near the edge of the plate has larger strain values than JC10-4 and JC10-5 in axis 10 near the side of the hole, and the strain value of the column in axis 10 is twice that of the column on the side of axis 8, and the maximum strain value of the column in axis 10 is 3.8 × 10⁵. In the process of laboratory testing, the first fracture split-layer failure node is the middle column node, so the reliability of the model parameters is confirmed again. This result is consistent with the conclusion of Reference [20].
5.4. Parameter Optimization Analysis
According to the test and finite element analysis of the joint, it can be seen that the steel bar has a great influence on the mechanical properties of the joint. Combined with the actual project, the architectural space size design is often limited, so the parameter analysis and optimization are mainly considered from the following aspects: reinforcement, reinforcement diameter, reinforcement material properties, etc.
The variable parameters of the rebar are analyzed from three aspects: the diameter of the rebar, the spacing of the rebar, and the material of the rebar, and the specific changes are shown in Table 5.
Table 5.
Optimization analysis table of steel bar parameter change.
A finite element simulation of the structure was carried out according to the table, and its plastic strain cloud image is shown as follows.
As shown in Figure 21, compared with the relationship between the plastic strain cloud map of each model and the blank group, the maximum plastic strain does not increase significantly when the diameter of the steel bar is reduced, but the influence range of the plastic strain zone at the node slightly shrinks, more is transferred to the column, and the plastic influence area of the column is significantly lowered. Although the increase in steel bar diameter has no significant effect on the plastic influence range, the maximum plastic strain increases from 0.08151 to 0.1051, which is a significant increase. The plastic strain value can be effectively improved by changing the bar spacing to encrypt parallel beam direction, similar to the size of the dark beam, but the change is not significant for the vertical beam direction. The ring plastic strain area at the joint of the concrete slab shrinks, but the plastic strain grade increases approximately 10 times. The plastic strain grade is also increased when the grade of the steel bar is increased, but the influence range does not change much.
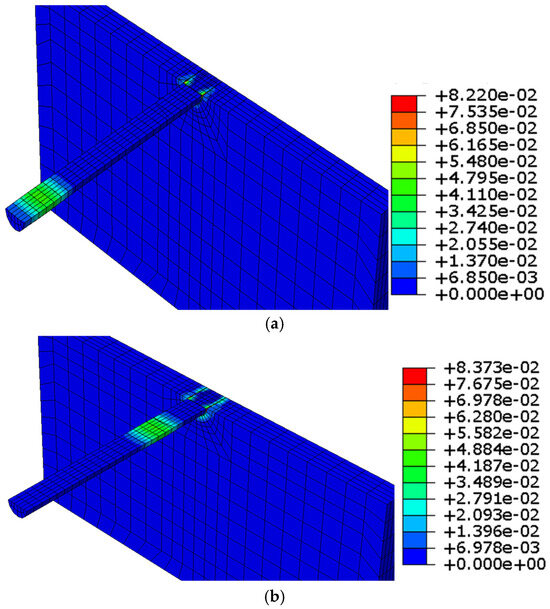
Figure 21.
Plastic strain cloud diagram of the concrete model with modified steel bar parameters. (a) Model1-1 plastic strain cloud image; (b) Model2-2 plastic strain cloud image.
The stress distribution and displacement distribution of each model are shown in Figure 22. The maximum stress of the steel cage increases with the reduction of the diameter of the steel bar, while the maximum displacement has a downward trend, but the change is not obvious. With the increase of steel bar diameter, the maximum stress value decreases, and the change of maximum displacement has an upward trend, but it is not obvious. Meanwhile, the influence range of both increases, especially with the increase of steel bar diameter, and the displacement of the vertical joint case increases as a whole. Reinforcing bars in parallel or vertical beam direction have no significant effect on the stress and displacement of the cage. Finally, the maximum stress and displacement of the steel cage increase with the improvement of material properties, but the overall increase is small.
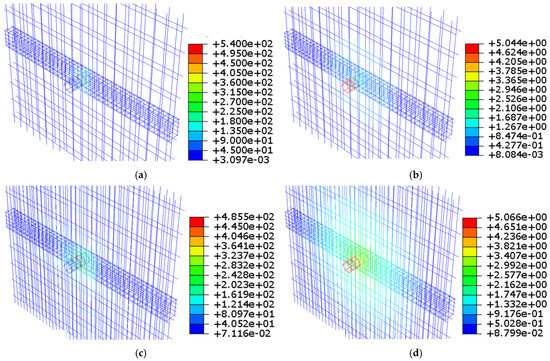
Figure 22.
Stress-strain cloud diagram of the rebar parameter change model. (a) Model1-1 stress distribution; (b) Model1-1 displacement distribution; (c) Model2-2 stress distribution; (d) Model2-2 displacement distribution.
6. Conclusions
Combining similarity theory, we designed and fabricated a 1:10 scale model, conducted static earth pressure loading tests, used finite element software to analyze the node failure mechanism, and carried out parameter analysis, resulting in the following conclusions:
- (1)
- The test shows that the cracks in the column end plate nodes first appear at the central axis node and gradually expand, eventually forming an annular crack in the top plate, accompanied by staggered failure; the side column nodes are mainly characterized by significant displacement and limited crack development due to insufficient edge constraints. The overall top plate has deformation characteristics of arching in the middle and warping at the edges.
- (2)
- The node strain analysis found that the stress concentration in the local area of the plate edge is significant, and the central axis node is subjected to both circumferential tension and radial compression, showing a significant stress gradient. The strain of the bottom reinforcement of the beam is generally greater than that of the surface reinforcement, and the stress is most concentrated near the opening, which verifies that the node is a weak point under load.
- (3)
- The finite element simulation results are highly consistent with the experimental observations and can better reflect the crack expansion path and damage distribution law. The results show that the steel pipe and flange work together to form a stable force transmission system. Even after local concrete failure, the steel pipe can still provide effective constraints to the core concrete.
- (4)
- The parameter optimization analysis shows that increasing the steel bar diameter and using high-strength steel bars can significantly improve the plastic strain and displacement bearing capacity of the node; the effect of increasing the steel bar arrangement parallel to the beam direction is particularly obvious. The research results provide a reliable reference for the design and construction optimization of slab-column joints in subway stations.
This paper analyzes the influence of key parameters such as the annular corbel and ring plate on the ultimate bearing capacity of the node through numerical simulation, but the conclusions still need to be further verified through individual component loading tests; at the same time, in-depth research is still needed on complex working conditions, new node design optimization, and the mechanical response under dynamic loads.
Author Contributions
Conceptualization, W.M. and H.L.; methodology, Y.R.; software, Y.L.; validation, R.L., C.X. and Y.M.; formal analysis, W.M.; investigation, Y.L.; resources, W.M.; data curation, Y.R.; writing—original draft preparation, H.L.; writing—review and editing, H.L.; visualization, R.L.; supervision, C.X.; funding acquisition, Y.M. All authors have read and agreed to the published version of the manuscript.
Funding
This research was funded by the National Natural Science Foundation of China (Grant No. 52178302) and the APC was funded by Key R&D Projects in Shaanxi Province (No. 2020SF-373).
Data Availability Statement
Data is contained within the article: The original contributions presented in this study are included in the article. Further inquiries can be directed to the corresponding author.
Conflicts of Interest
Author Wufeng Mao, Yanmei Ruan and Yuhui Li was employed by the company Guangzhou Metro Design and& Research Institute Co., Ltd. Author Rui Liang and Chenyang Xiao was employed by the company China Railway Seventh Bureau Group Co., Ltd. The remaining authors declare that the research was conducted in the absence of any commercial or financial relationships that could be construed as a potential conflict of interest.
Correction Statement
This article has been republished with a minor correction to the Data Availability Statement. This change does not affect the scientific content of the article.
References
- Wang, Y. Application of cover excavation method in shallow buried subway station construction. World Tunn. 1995, 5, 2–11. [Google Scholar]
- Wang, X.; Wang, B.; Yuan, Y.; Yang, T.; Dong, G.; Shi, C. Study on the Effect of EICP Combined with Nano-SiO2 and Soil Stabilizer on Improving Loess Surface Strength. Buildings 2025, 15, 1998. [Google Scholar] [CrossRef]
- Zhou, D.; Mei, Y.; Ke, X.; Liu, Z.; Xu, W. Study on the Structural Behavior and Reinforcement Design of Openings in Subway Station Floor Slabs. J. Build. Eng. 2024, 98, 110994. [Google Scholar] [CrossRef]
- Wang, X.; Chen, C. Vibration Table Test of Prefabricated L-Shaped Column Concrete Structure. Buildings 2025, 15, 2329. [Google Scholar] [CrossRef]
- Wang, J. Key Technology of Subway Steel Structure construction with reverse excavation method. Equip. Maint. Technol. 2024, 2, 91–93. [Google Scholar]
- Guo, H.; Zhang, J.; Shi, X. Analysis of key technologies in construction of Shenzhen Metro Dayun Junction Station. Tunn. Constr. (In Chinese & English). 2023, 43 (Suppl. S1), 451–456. [Google Scholar]
- Zhang, Y.; Zhang, S.; Jia, J. Study on deformation mechanism of deep foundation pit wall in subway station cover excavation. Build. Struct. 2022, 52 (Suppl. S2), 2401–2405. [Google Scholar]
- Xia, Y. Research on high-precision sag adjustment Technology of concrete filled steel tube column with reverse cutting method. Constr. Technol. 2022, 51, 128–131, (In Chinese & English). [Google Scholar]
- Shi, X. Research on Displacement Law of Vertical Support System of Subway Station with Cover Excavation and Reverse Construction. Master’s. Thesis, Jilin University, Changchun, China, 2021. [Google Scholar]
- Ma, Y.; Ling, T. Research on attitude control technology of steel pipe column in subway station. Eng. Constr. 2021, 53, 56–61. [Google Scholar]
- Li, Y.; Li, Y.; Zhou, D. Experimental study on mechanical behavior of plate-column joints with support plates and dark beams after punching. Earthq. Eng. Eng. Vib. 2020, 40, 178–186. [Google Scholar]
- Zhao, Y.; Li, X.; Zhang, J. Research on punching resistance of concrete slab with carbon fiber reinforced composite mesh bars. Ind. Build. 2019, 49, 90–94. [Google Scholar]
- Fukumoto, T.; Morita, K. Elastoplastic Behavior of Panel Zone inSteel Beam to Concrete Filled Steel Tube Column Moment Connections. J. Struct. Eng. 2005, 131, 1841–1853. [Google Scholar] [CrossRef]
- Lu, X.-L.; Li, X.-P.; Yu, Y. Design method of joint joints between rectangular concrete-filled steel tube column and steel beam. Build. Struct. 2005, 1, 7–9+12. [Google Scholar]
- Lu, X.; Li, X. Test and design method of external ring beam joint for concrete-filled square steel tube column. J. Build. Struct. 2003, 1, 7–13. [Google Scholar]
- Shuailong, F.; Huashan, Q.; Gaoxing, H.; Lei, Z.; Bing, C.; Yuan, F. Axial Compression Performance of Prefabricated Square Semi-Continuous CFST Columns with High-Strength Bolts. J. Constr. Steel Res. 2025, 234, 109719. [Google Scholar] [CrossRef]
- Zheng, Z.; Zhang, J.; Miao, Y.; Zhou, B.; Huang, W.; He, Y.; Lu, Q.; Wang, Y. Performance of T-Shaped CFST Columns with Embedded T-Shaped Steel Skeleton under Axial Compression. J. Constr. Steel Res. 2024, 215, 108554. [Google Scholar] [CrossRef]
- GB 50010-2010: 440P. B5; Code for Design of Concrete Structures. China Academy of Building Science: Beijing, China; Tsinghua University: Beijing, China; Tongji University: Shanghai, China, 2010.
- GB/T 228.1-2010; Metal Materials Tensile Test Part 1: Room Temperature Test Method. Standards Press of China: Beijing, China, 2010.
- Yankelevsky, D.Z.; Karinski, Y.S.; Feldgun, V.R. Dynamic Punching Shear Failure of a RC Flat Slab-Column Connection Under a Collapsing Slab Impact. Int. J. Impact Eng. 2020, 135, 103401. [Google Scholar] [CrossRef]


Disclaimer/Publisher’s Note: The statements, opinions and data contained in all publications are solely those of the individual author(s) and contributor(s) and not of MDPI and/or the editor(s). MDPI and/or the editor(s) disclaim responsibility for any injury to people or property resulting from any ideas, methods, instructions or products referred to in the content. |
© 2025 by the authors. Licensee MDPI, Basel, Switzerland. This article is an open access article distributed under the terms and conditions of the Creative Commons Attribution (CC BY) license (https://creativecommons.org/licenses/by/4.0/).