Article

Chloride Diffusion and Corrosion Assessment in Cracked Marine Concrete Bridges Using Extracted Crack Morphologies

1
School of Highway, Chang’an University, Xi’an 710064, China
2
School of Civil Engineering, Xi’an University of Architecture and Technology, Xi’an 710055, China
*
Author to whom correspondence should be addressed.
Buildings 2025, 15(17), 3214; https://doi.org/10.3390/buildings15173214
Submission received: 9 August 2025 / Revised: 28 August 2025 / Accepted: 4 September 2025 / Published: 5 September 2025
(This article belongs to the Section Building Structures)

Abstract

Chloride-induced reinforcement corrosion primarily contributes to the deterioration of concrete structures. Cracks provide natural pathways for chloride ions, which accelerate the corrosion process and shorten the service life of structures. In this study, the morphologies of flexural cracks in the pure bending section are extracted through destructive testing, and a crack database containing 51 samples is established. These samples are defined as four crack morphologies as follows: equal-width, wedge-shaped, two-step, and three-step cracks. Subsequently, cracked concrete models were constructed, followed by a full factorial design containing 144 operating conditions to investigate the effects of crack morphology, width, depth, and their interactions on chloride diffusion. The results show that crack morphology significantly affects chloride diffusion behavior. The equal-width crack model exhibits the highest chloride diffusion rate, whereas the wedge-shaped crack model exhibits the lowest. At a crack width of 0.15 mm and a depth of 35 mm, the maximum relative error in chloride concentration between the two models is 94.5%. As the crack depth increases, the effect of crack morphology on chloride diffusion becomes increasingly significant, whereas increasing crack width tends to diminish this effect. Additionally, a rebar corrosion initiation assessment method based on the guarantee rate is proposed, and the effect of crack morphology on the corrosion initiation time is analyzed via a case study.

1. Introduction

Bridges encounter various durability issues during their service life. The resulting degradation significantly reduces their lifespan, compromises the safety of vehicles and pedestrians, and causes substantial economic losses [1,2]. Among these issues, chloride-induced corrosion of steel reinforcement contributes primarily to the deterioration of concrete durability [3,4,5]. During service, bridges are inevitably subjected to combined loads and environmental factors that can result in cracking. Cracks shorten the path of aggressive media to the reinforcement surface and accelerate the corrosion process [6]. Disregarding the effect of cracks on chloride diffusion may result in an overestimated durability for structures [7]. Therefore, the chloride diffusion behavior in cracked concrete warrants detailed investigation.
In recent years, researchers have investigated chloride diffusion behavior in cracked concrete. Two methods are primarily used in experimental studies to create cracks: non-destructive and destructive methods. Marsavina et al. [8] prefabricated cracks by inserting copper sheets and found that chloride penetration depth increased with crack depth. Wang et al. [9] used steel plates of varying thicknesses to investigate the effects of crack width, depth, and spacing on chloride diffusion. The results showed that crack width and spacing were key factors affecting the diffusion rate. However, cracks generated by non-destructive methods differ significantly from the actual morphologies. To mimic the actual crack morphology, researchers have adopted destructive methods, such as splitting [10,11,12,13], bending loading [14] and expansive core methods [15]. The crack morphology obtained using these methods is more realistic than those yielded by non-destructive methods. However, the crack parameters cannot be controlled precisely, and internal damage to concrete during crack formation is inevitable. Therefore, accurately characterizing realistic crack morphology and examining its effect on chloride diffusion remain critical challenges for durability assessment of cracked concrete structures.
In cracked concrete, the crack parameters interact with each other, and the experimental research methods present some limitations. Thus, numerical simulations have been performed to address this issue, which not only reduce the time cost but also facilitate the independent analysis of crack parameters [16,17,18,19]. Some studies treat crack surfaces as concentration boundaries in simulations. However, this simplification disregards the initial diffusion and accumulation of chloride ions within cracks, making it fail to capture early-stage diffusion behavior and more suitable for later stages of chloride ingress. To address this limitation, cracks can be modeled as a diffusion medium with diffusion coefficients assigned based on the transport characteristics within cracks, enabling more realistic simulation of chloride transport. The relationship between the diffusion coefficient within the crack and its width has been investigated extensively. Jang et al. [7], Djerbi et al. [20], and Park et al. [21] discovered a critical crack width; below this value, the crack minimally affected chloride diffusion, whereas above it, the diffusion coefficient within the crack increased with its width. The approach of defining a crack as a diffusion medium has been widely applied in numerical studies of chloride diffusion.
Investigating chloride diffusion in cracked concrete from a mesoscopic perspective improves the accuracy of durability assessment. Sun et al. [22] considered concrete as a four-phase composite material and predicted its chloride diffusion coefficient. Peng et al. [23] treated cracked concrete as a five-phase material and investigated the effects of the chloride diffusion zone as well as the width and length of cracks on chloride permeability. Modeling at the mesoscopic scale is crucial, since aggregate geometry and heterogeneity affect chloride transport. Yang et al. [24] revealed that circular aggregates provide more direct and permeable pathways, whereas convex polygonal aggregates lead to more tortuous paths with reduced diffusion. The development of Computed Tomography (CT) scanning technology enables the actual distribution of aggregates to be obtained through scanning and then applied to numerical simulations, thus improving simulation accuracy.
This study focuses on flexural cracks in bridge superstructures exposed to marine environments and induced by loading, aiming to clarify their effects on chloride diffusion for durability assessment. A crack database is established by extracting dimensional information of flexural cracks in the pure bending section of destructive tests, and four typical crack morphologies are categorized based on the variation in the crack width with depth. Subsequently, a chloride diffusion model is constructed and validated against long-term exposure test data, providing a reliable foundation for further simulations. On this basis, the four crack morphologies are incorporated into the validated model, and a full factorial analysis is performed to investigate the effects of crack morphology, width, depth, and their interactions on chloride ingress. Finally, a corrosion initiation assessment method based on the guarantee rate is proposed and applied in a case study. This work establishes a systematic framework to quantify the influence of crack geometry on chloride transport, offering new insights for durability evaluation and service-life prediction of reinforced concrete structures in marine environments.

2. Extraction of Typical Flexural Crack Morphologies

2.1. Specimen Design

P·I 52·5 cement was used during the casting of the test beam due to its high early strength and stable long-term performance, and its composition is shown in Table 1 [25]. Class I fly ash generated by a power plant was selected, with a 45 µm sieve residue of 9.7%, with its composition listed in Table 2 [26]. The specific surface area of the slag powder used was 368 m2/kg. The fine aggregate comprised river sand with an apparent density of 2600 kg/m3, a fineness modulus of 2.9, and a mud content of 1.0%. The coarse aggregate used was continuously graded limestone crushed stone with a particle size of 5–20 mm, an apparent density of 2700 kg/m3, and a bulk density of 1480 kg/m3. A RHEOPLUS326 water-reducing agent and a MICRO AIR202 air-entraining agent were used. The concrete mix proportion is presented in Table 3.
In total, two beam specimens were fabricated and tested in this study. The length, width, and height of the test beam were 2000 mm, 180 mm, and 200 mm, respectively, with the dimensions determined based on the cross-sectional data collected in a previously established database of 630 destructive tests on concrete beams [27]. The lower section of the girder contained a bundle comprising 7ϕs15.2 high-strength prestressed steel strands [28]. The main reinforcements were HRB400 ribbed steel bars, whereas the frame and hoop reinforcements were HPB300 round steel bars [29]. The bottom of the beam was reinforced with three longitudinal tensile bars with a diameter of 16 mm, whereas the top was equipped with two frame bars with a diameter of 8 mm. The hoop bars, which were distributed along the beam span, had a diameter of 6 mm and a spacing of 100 mm. The concrete strength grade was C50, and the protective layer thickness was 30 mm. The specific dimensions and reinforcement details of the specimen are shown in Figure 1. Prestressing was applied to the test beam via the post-tensioning method. The specimen preparation process, including casting and curing, was carried out in accordance with the Chinese standards [30,31,32]. After casting, all beams were cured for 28 days at a temperature of 20 ± 2   ° C and relative humidity above 95%.

2.2. Testing Procedure

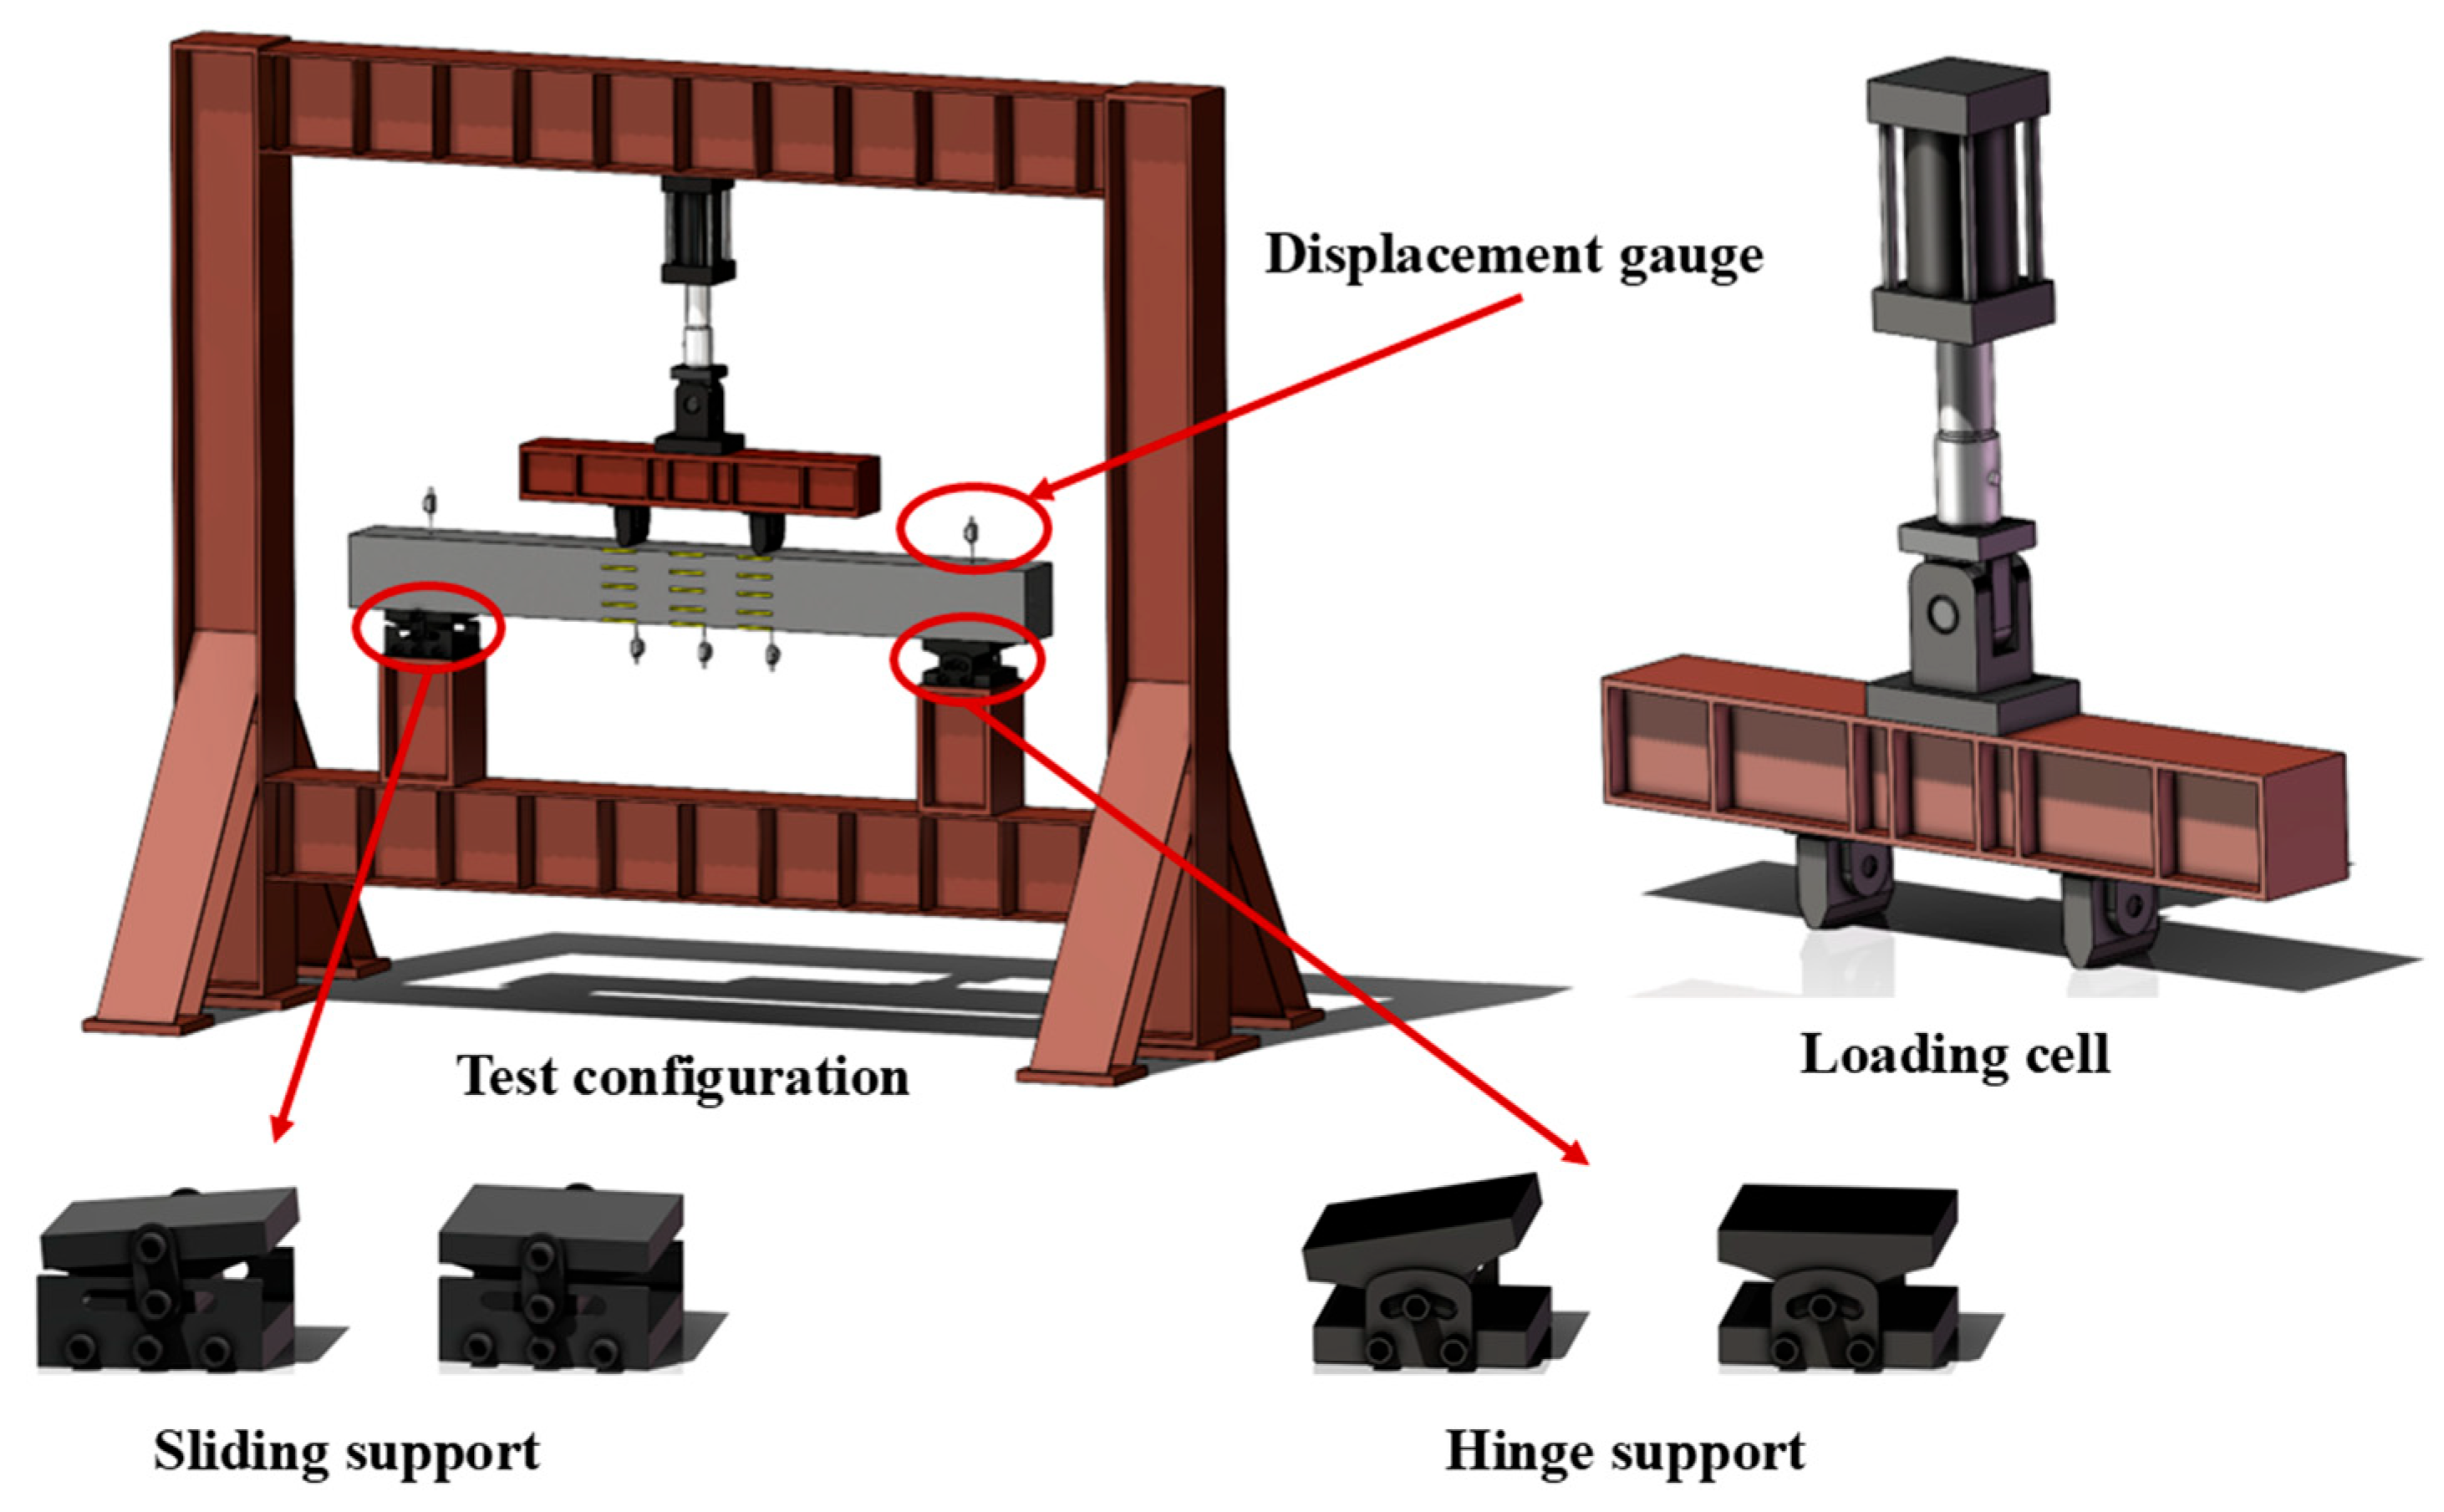
The calculated span of the test beam was 1600 mm, and the length of the midspan pure bending section was 500 mm to ensure bending failure of the test beam. The test was conducted using a microcomputer-controlled electro-hydraulic servo universal testing machine (Shandong Bangce Testing Machine Co., Ltd., Jinan, China) according to GB/T 50152-2012 [31]. A loading frame and a distribution beam were employed to distribute the applied load evenly into two loading points, while two supports were installed at the bottom, thereby forming a standard four-point bending configuration. Specifically, one end was supported by a hinged support and the other end was supported by a sliding support. The schematic illustration of the loading is shown in Figure 2. Strain gauges were attached to the concrete surface to measure strain. Displacement gauges were arranged at the supports on the top of the specimen to measure support displacements, and additional gauges were installed beneath the beam at the loading points and at midspan to record deflection.
Prior to the experiment, the test beam was preloaded by applying a 10 kN load, which was maintained for 2 min and then removed to verify the stability of the beam and the operating conditions of instruments. After confirming normal conditions, monotonic displacement-controlled loading was applied using the built-in servo-hydraulic closed-loop control system, with a displacement increment of 1 mm per step and a control accuracy of ± 0.001 mm. Once the target displacement was achieved, the development of cracks in the test beam was observed. During this process, the load level was recorded, and images of the flexural cracks in the pure bending section were captured for further analysis.
To improve the accuracy of the test and compensate for the disadvantages of conventional observation methods, the digital image correlation (DIC) technology was introduced to comprehensively monitor the full-field deformation and crack propagation of the test beam [33]. Random speckle images were arranged at the back of the test beam, and a 12 million pixels Hikvision industrial camera (model MV-CU120-10UM, Hikvision, Hangzhou, China) with a resolution of 4024 × 3036 was used to continuously capture images of the speckle area. This resolution was maintained consistently throughout the entire testing process, ensuring sufficient pixel accuracy. By comparing the speckle images before and after loading, the full-field deformation distributions of the test beam under different loads and the local crack propagation were accurately extracted [34]. The noncontact nature of the DIC method effectively avoids the interference of the conventional displacement gauge with the surface of the specimen while providing detailed quantitative data pertaining to the crack regions and overall deformation. Combining DIC with the conventional crack observation method enables the comprehensive monitoring of crack locations and their propagation.
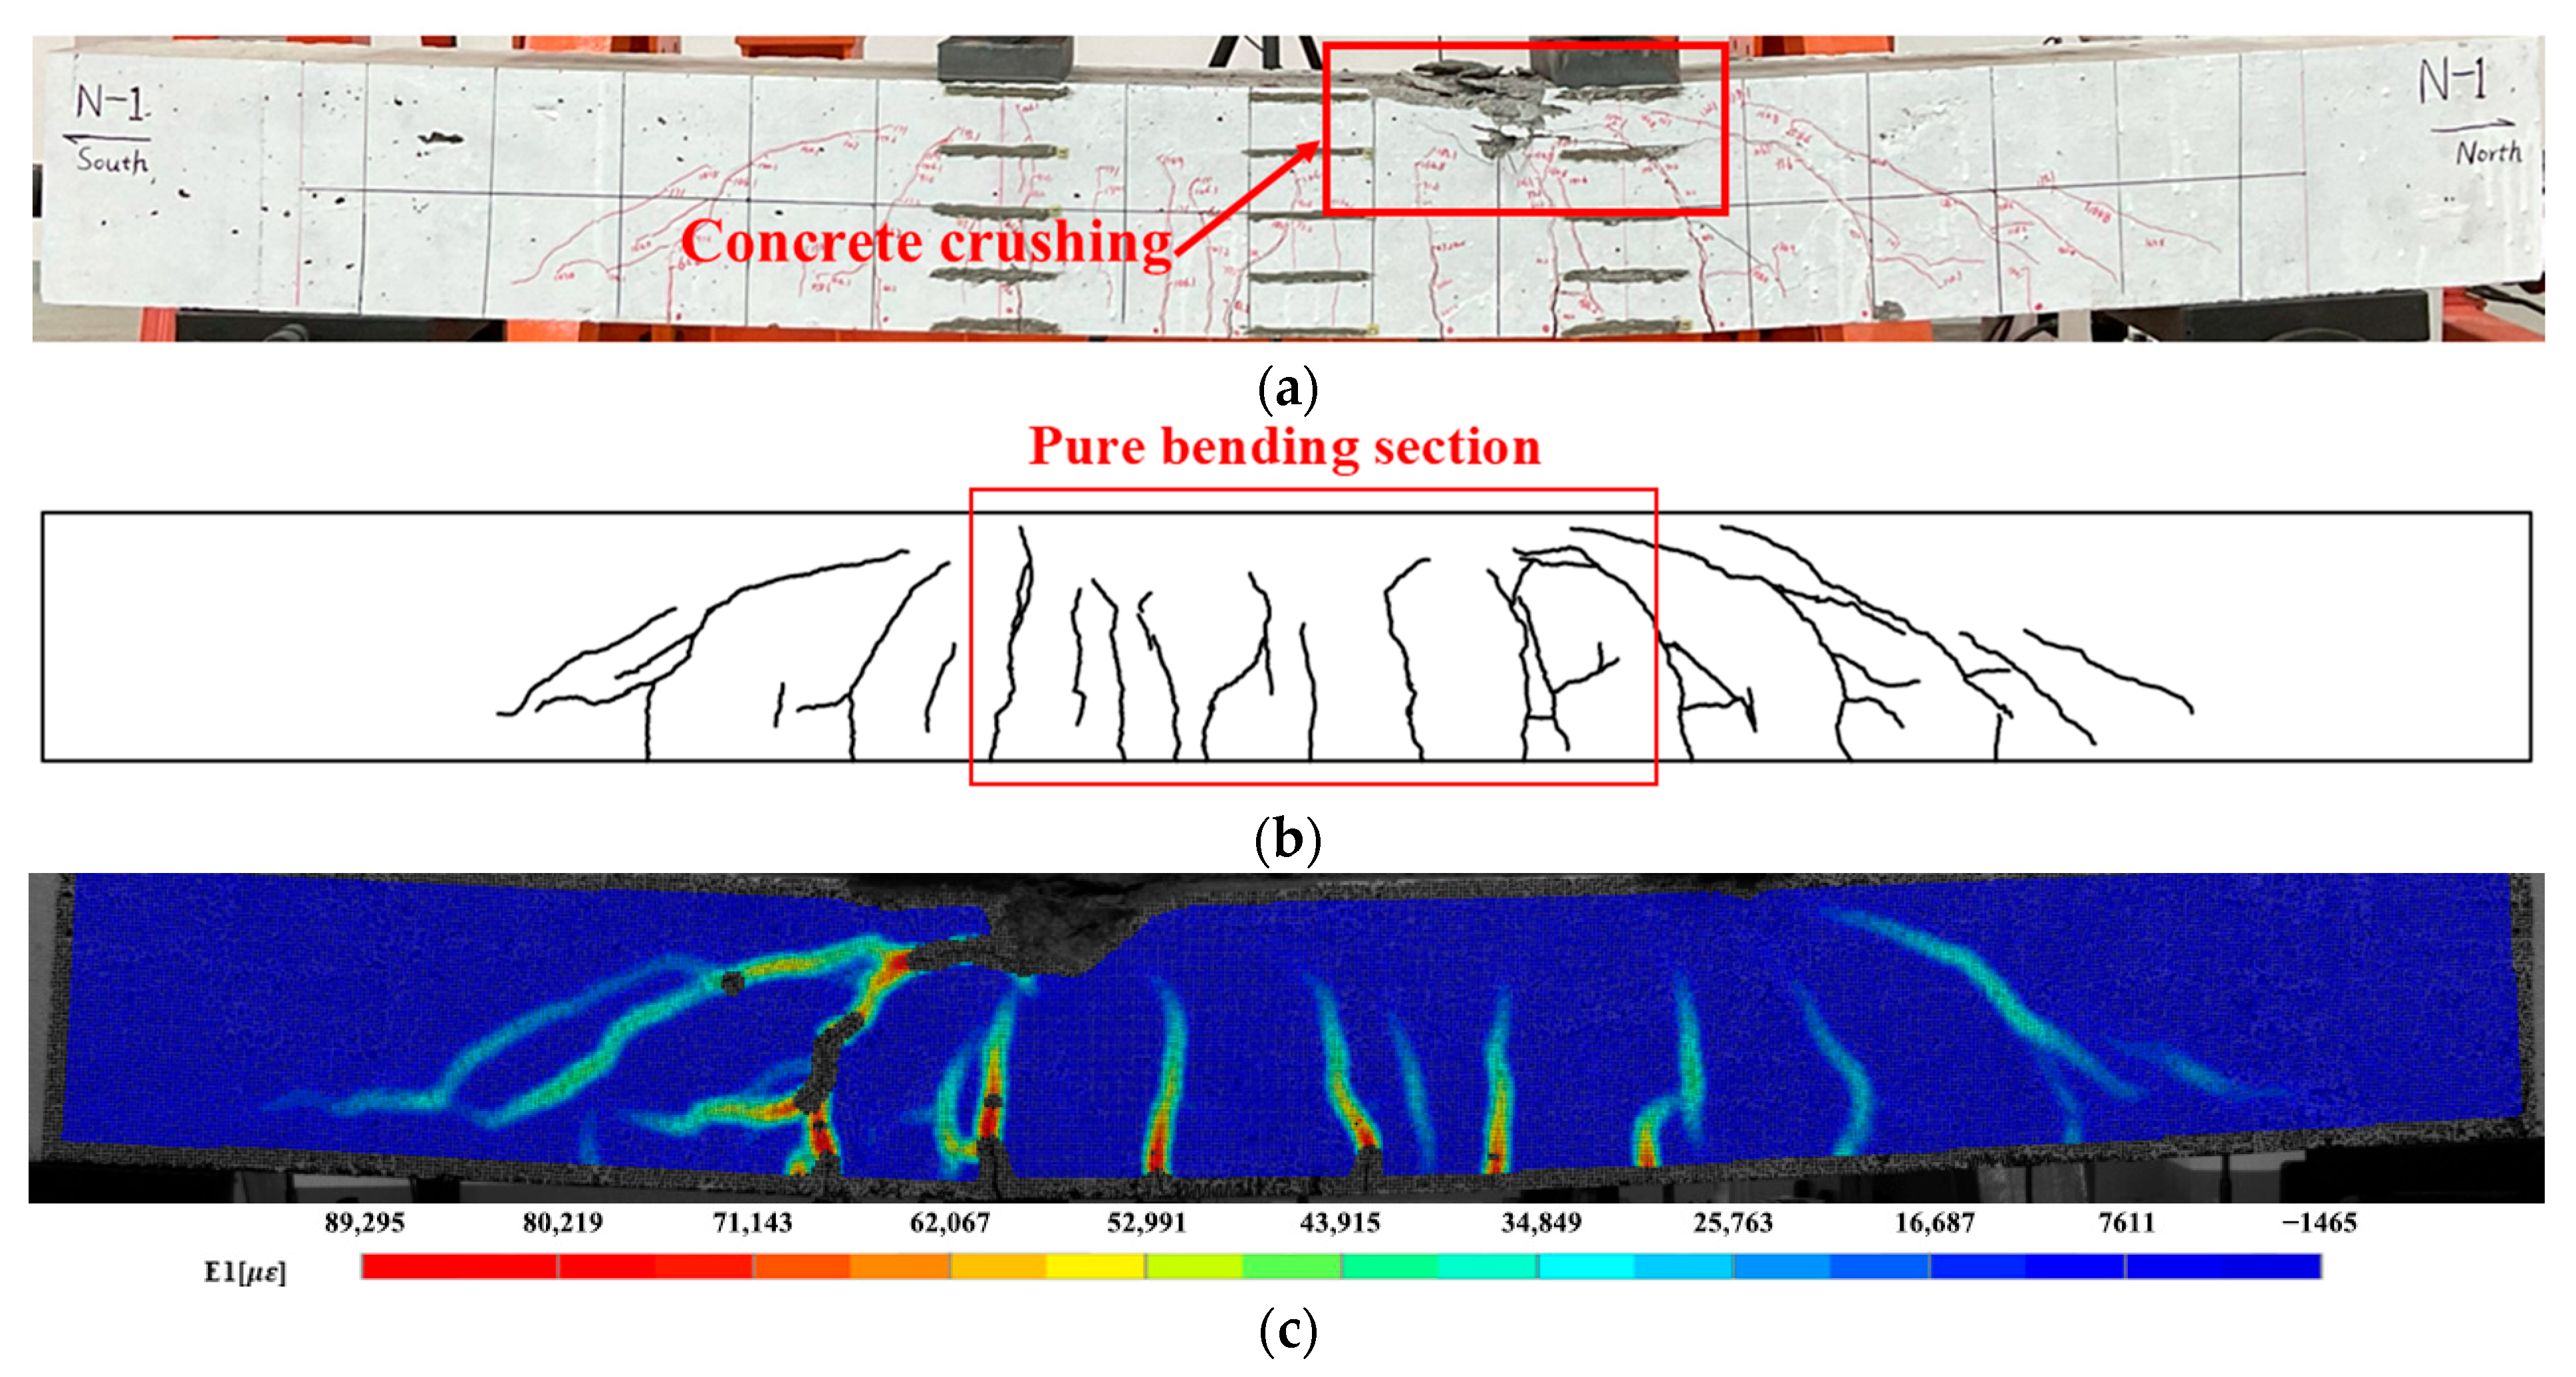
At the initial loading stage, the surface of the test beam had no visible cracks and remained elastic. When the displacement of the beam reached 2 mm, which corresponded to a load of 30 kN, a small crack appeared in the pure bending section. As the load increased, the initial crack propagated, and several new cracks developed at a relatively high crack-propagation rate. When the load reached 160 kN, the beam experienced a significant loss in stiffness, and crack propagation decelerated as the neutral-axis position changed. After the reinforcement yielded, some of the stress originally borne by the reinforcement was transferred to the concrete, thus causing the crack width to increase rapidly. During the subsequent loading, the compressed concrete zone diminished gradually and the compressive stress continued to increase. As the displacement increased, the load–displacement curve started to descend, indicating that the beam had failed, and the loading was stopped. The failure was characterized by crushing of the concrete in the compression zone, observed as blocky spalling, as shown in Figure 3a. The crack distribution during the failure stage of the test beam is shown in Figure 3b. Simultaneously, the principal strain cloud diagram generated from the DIC data at the critical failure stage of the test beam, as shown in Figure 3c, aligned closely with the actual crack distribution.

2.3. Method for Extracting Crack Morphology

To establish a crack database, images of flexural cracks in the pure bending section at each load stage were obtained. First, the captured crack image was imported into image-processing software for initial processing to remove interference, as shown in Figure 4b. Next, the gray-level thresholding method, which has been widely applied in digital image processing to separate crack regions from the background, was employed to binarize the image [35]. In this step, crack and background pixels were represented as 0 and 1, respectively, as shown in Equation (1). After binarization, Gaussian filtering was applied to remove noise and residual interference. The refined image is shown in Figure 4c.
I ( x , y ) = 1 , F ( x , y ) T 0 , F ( x , y ) < T
where F ( x , y ) is the gray value of any pixel in the original image, I ( x , y ) is the gray value of the pixel after gray threshold segmentation, and T is the gray threshold, which was set to 128.
To obtain complete crack information and analyze the variation in the crack width with depth, a ruler was used in the images for calibration. Since the structural measurement plane was kept parallel to the imaging plane, the scaling factor method could be applied, as shown in Equation (2). MATLAB 2023 was used to extract information from the processed images. To improve computational efficiency without compromising accuracy, a 2-pixel interval sampling method was adopted based on its high consistency with the original image, as shown in Figure 4d. The crack width at any depth was calculated using Equation (3). To account for the 2-pixel interval sampling, the width was corrected by a factor of 2 to obtain the actual crack width. The final extracted crack dimensions are presented in Figure 4e.
a = l r l p
w i = ( j = 1 m δ ( i m g i j , 0 ) ) a 2
where l r is the actual crack length, l p is the pixel length, and a is the scale factor. m is the number of columns in the image, w i is the crack width at row i, and i m g i j is the pixel value at row i and column j. The indicator function δ ( i m g i j , 0 ) = 1 when i m g i j = 0 , indicating a cracked region; otherwise δ ( i m g i j , 0 ) = 0 .
Key geometric parameters of each crack were obtained by piecewise fitting the extracted crack data, and a database with 51 crack samples was established. The fitting results showed significant differences in the variation patterns of crack width with depth. Based on these variation patterns, the cracks can be defined as the following categories: (1) cracks with minimal fluctuations in width with depth, such as Figure 5a, which are relatively constant and defined as equal-width cracks; (2) cracks with larger fluctuations in width with depth that decrease approximately linearly, such as Figure 5b, which are defined as wedge-shaped cracks; and (3) cracks with stepwise variation in width with depth, which exhibit distinct geometric segmentation characteristics, as shown in Figure 5c,d. These cracks can be further classified into two-step and three-step cracks. Since the width was extracted at the pixel level, errors may occur for fine cracks. The piecewise-fitting method reduced such errors and showed good agreement, as indicated by the high R2 values for each crack morphology.

2.4. Crack Morphology Models

Based on the fitting results of each sample, the key parameters were extracted to develop parametric models of the four typical crack morphologies. Figure 6 presents both the parametric models and their corresponding geometric schematics. The detailed parameters are summarized in Table 4, where w 0 and d 0 denote the initial crack width and the crack depth. Owing to the limited representation of wedge-shaped crack, the geometric model was based on the traditional wedge-shaped crack characteristics to ensure applicability and validity.

3. Chloride Diffusion Model Based on Long-Term Exposure Testing

3.1. Long-Term Exposure Test Results

An exposure test station located in northern China experiences harsh environmental conditions characterized by (1) significant temperature fluctuations ranging from −16.9 °C to 38.9 °C; (2) a long ice period lasting approximately 60 days annually, with 47 to 52 freeze–thaw cycles; and (3) high seawater salinity between 29.4‰ and 32.9‰. Thus, it is suitable for long-term exposure testing.
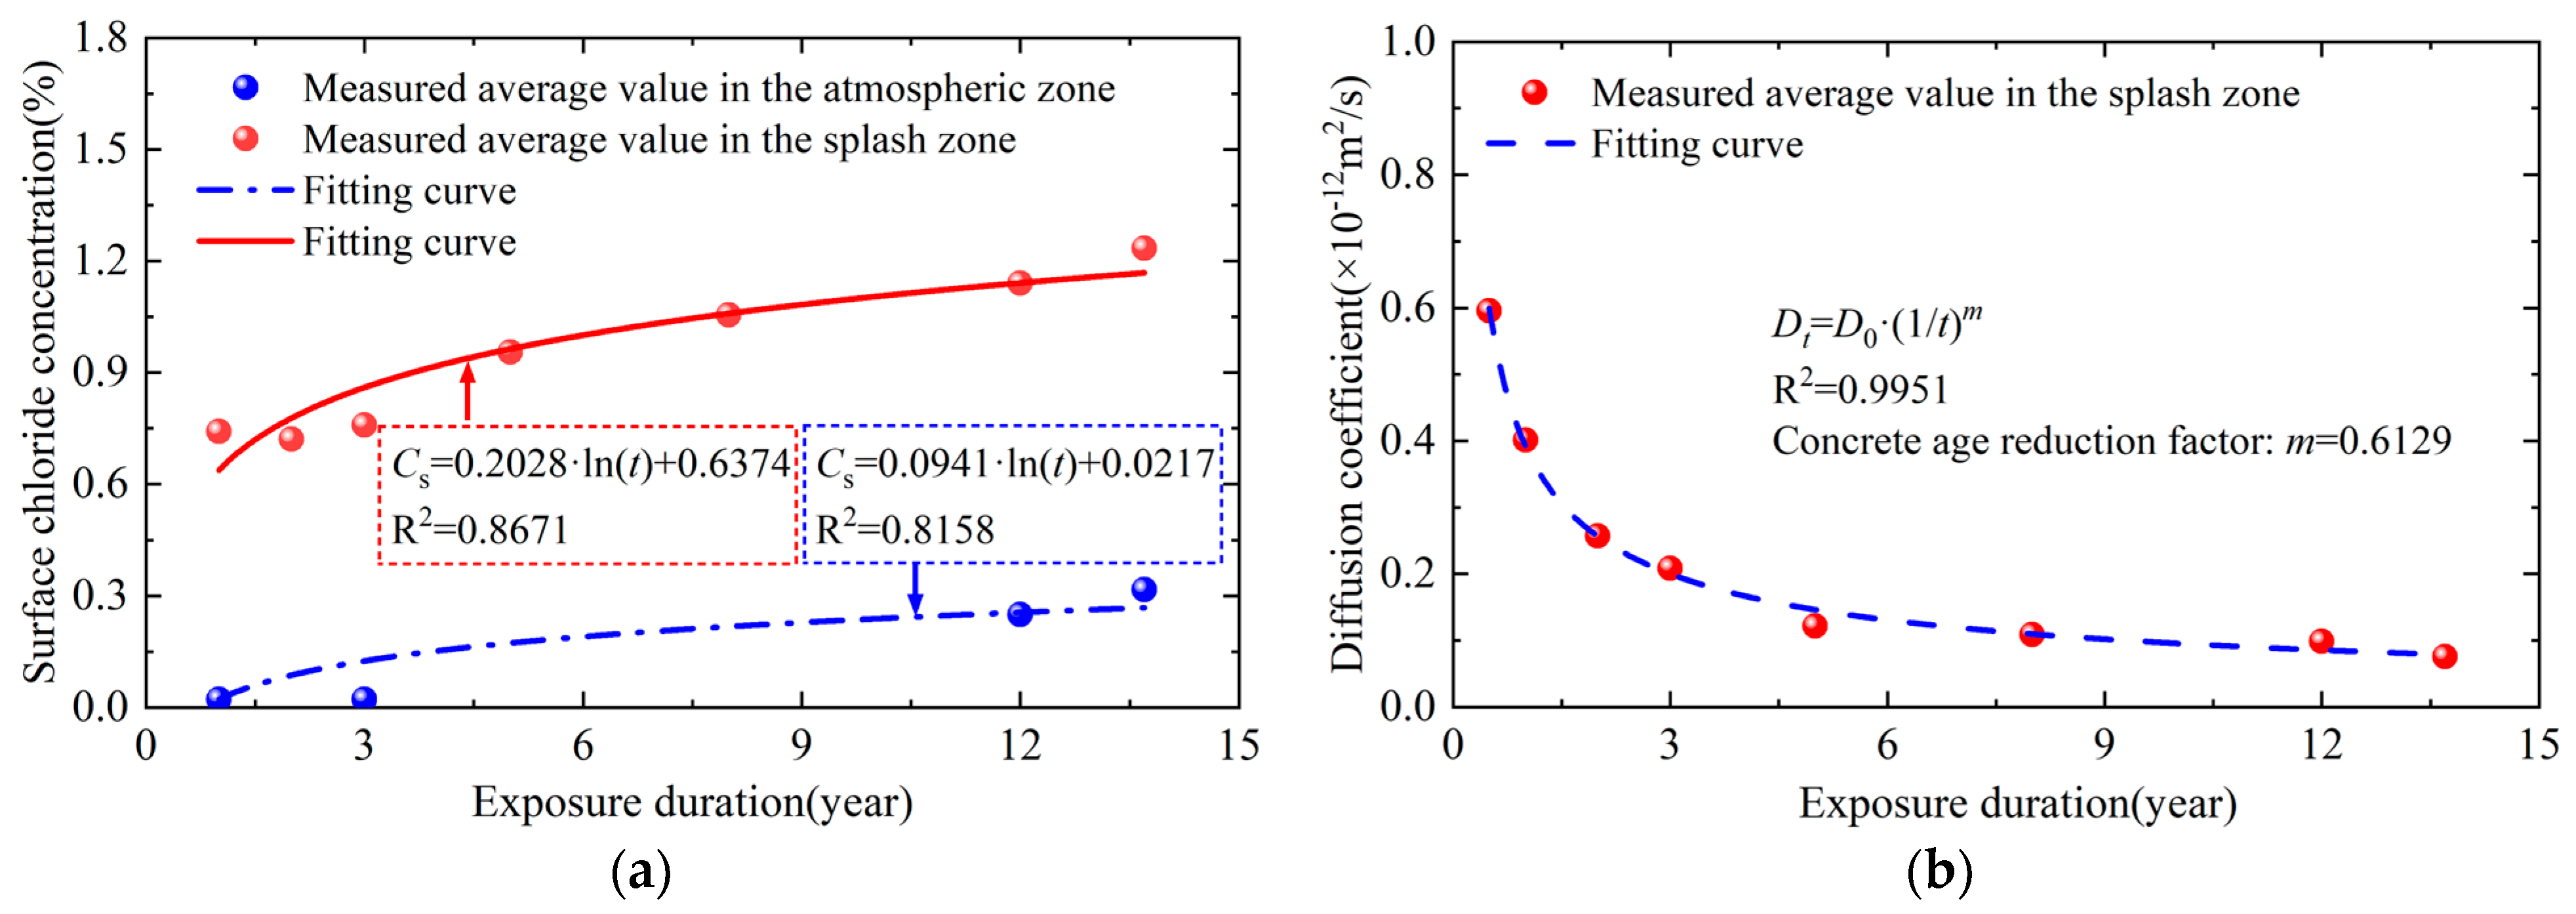
Cubic specimens with 100 mm sides were prepared and placed at the exposure test station in October 2009. Each specimen was coated with epoxy resin on four sides, leaving two opposite faces exposed, and was oriented vertically at the test station. The station consists of four zones corresponding to different marine environments: the atmospheric zone (+6.0 m), the splash zone (+2.0 m), the tidal zone (+0.1 m), and the submerged zone. The details of the exposure test station can be found in the previous study [19]. This study focuses on chloride diffusion in bridge superstructures, with emphasis on specimens from the splash and atmospheric zones. Chloride concentration tests were conducted on splash zone specimens after 1, 2, 3, 5, 8, 12, and 13.7 years of exposure, and on atmospheric zone specimens after 1, 3, 12, and 13.7 years. The testing method was as follows: First, the specimen was ground in layers within a depth range of 0–30 mm. Then, the chloride concentration at different depths was measured using the silver nitrate titration method. Finally, fitting analysis based on Fick’s second law was performed to calculate the surface chloride concentration and the chloride diffusion coefficient. Their time-dependent variations are shown in Figure 7. The concrete age reduction factor was obtained by fitting the diffusion coefficients of the splash zone specimens. Because the same materials were used for the splash zone and atmospheric zone specimens and the age-reduction factor depends on the concrete composition, the result is applicable to the atmospheric zone specimens [36]. After 1-year exposure, the diffusion coefficients in the atmospheric and splash zones were 0.2119 × 10 12   m 2 / s and 0.4013 × 10 12   m 2 / s , respectively. Therefore, the function of the diffusion coefficients was shown in Equation (4).
D t = D t , s = 0.4013 ( 1 / t ) 0.6129 ,   for   splash   zone D t , a = 0.2119 ( 1 / t ) 0.6129 ,   for   atmospheric   zone
where D t , s and D t , a represent the diffusion coefficients for the splash zone and the atmospheric zone, respectively. t is the diffusion time.

3.2. Corrected Chloride Diffusion Model

In recent years, researchers have introduced multiple correction factors into the conventional diffusion model to adjust the diffusion coefficient, thereby establishing a modified model that accounts for environmental temperature, humidity, and chloride binding capacity. This model enables a more accurate description of chloride diffusion in concrete. When test data are insufficient, it can be used to model the chloride diffusion in uncracked concrete. The model is expressed as follows:
C ( x , t ) = C 0 + ( C s C 0 ) 1 e r f x 2 D t 0 m 1 m t 1 m D = D 0 k T k h k f
where C ( x , t ) is the chloride concentration at depth x at time t, C 0 is the initial chloride concentration within concrete, C s is the surface chloride concentration, x is the depth, and D 0 is the chloride diffusion coefficient at the reference time t 0 . k T , k h , and k f represent the correction factors for temperature, humidity, and chloride binding capacity, respectively. The concrete age reduction factor m is determined to be 0.6129 based on the exposure test results. The error function is expressed as e r f ( u ) = 2 π 0 u e t 2 d t .
The correction factors are given as follows [37,38]:
k T = ( T 2 T 1 ) exp q 1 T 1 1 T 2 k h = 1 + ( 1 h ) 4 ( 1 h c ) 4 1 k f = 1 1 + α ω ( 1 + β C f ) 2
where T 1 is the reference temperature, typically set to 293 K; T 2 is the ambient temperature. q is the water-cement ratio influence coefficient, which can be set as 6000, 5450, and 3850 for water-cement ratios of 0.4, 0.5, and 0.6, respectively. h is the relative humidity, and h c is the critical humidity, typically set to 75%. ω is the water content of the cementitious material, and C f is the free chloride concentration. α and β are Langmuir constants, whose values are 11.8 and 4.0 for ordinary concrete, according to Ishida et al. [39].
As the exposure test data account for environmental factors and material properties, the chloride diffusion model for undamaged concrete in this study can be simplified as:
C ( x , t ) = C 0 + ( C s C 0 ) 1 e r f x 2 D 0 t 0 m 1 m t 1 m

3.3. Chloride Diffusion Model in Cracked Concrete

To describe chloride diffusion in cracked concrete, the transport in undamaged concrete and cracks should be calculated separately. The diffusion in undamaged concrete is expressed in Equation (7). Experimental and numerical studies demonstrated that the effects of cracks on the diffusion coefficient can be classified into three stages. Jin et al. [40] improved the three-stage diffusion coefficient model by transforming it into a smooth curve for more convenient application:
D c r = D c ,   w < w 1 D c l + D c 2 + D c l D c 2 sin π ( w 2 w 1 ) w w 1 + w 2 2 ,   w 1 w w 2 D c l ,   w > w 2
where w is the crack width; w 1 and w 2 are the critical crack widths, with experimental measurements indicating w 1 = 0.03   mm , w 2 = 0.12   mm ; D c denotes the chloride diffusion coefficient in concrete; and D c l is the chloride diffusion coefficient in free solution, which is taken as 1.5 × 10 9   m 2 / s [41].
When the chloride mass fractions at the crack surface and in undamaged concrete at the same depth are equal, the chloride in the crack undergo two-dimensional diffusion. The two-dimensional diffusion equation is expressed as shown in Equation (9):
C t = D c ( 2 C x 2 + 2 C y 2 )
where x and y represent the diffusion depths along the x-direction and y-direction, respectively.

4. Chloride Diffusion Simulation Method in Cracked State

4.1. Simulation Method and Validation of Uncracked State

Chloride diffusion in concrete was simulated using COMSOL Multiphysics 6.1 [42]. Square models with side lengths of 100 mm were established based on the specimen dimensions from the exposure tests. Concrete was assumed to be a homogeneous material. Only chloride diffusion was considered, whereas convection and shear effects were disregarded.
In the model, C s and D c were determined from the exposure test results presented in Section 3.1. The initial chloride concentration was 0.0029%. A concentration boundary was applied to the concrete bottom. Triangular elements were used to mesh the model. The simulation results were compared with experimental data from specimens exposed for 13.7 years, as shown in Figure 8. Quantitative evaluation using mean relative error (MRE) and root mean square error (RMSE) showed that in the splash zone, the MRE and RMSE were 29% and 0.064, respectively, whereas in the atmospheric zone, they were 49% and 0.028. Focusing on the upper 0–15 mm depth in the atmospheric zone, the MRE decreased to 26%, indicating better agreement in shallow layers. The discrepancy at greater depths is mainly due to the relatively low chloride concentration in the atmospheric zone, which reduces the measurement accuracy of powdered samples in deeper regions. Overall, these results confirm the validity of the numerical method. The validated uncracked model serves as a baseline for the cracked state simulations, providing a reliable reference for investigating the influence of flexural cracks on chloride diffusion.

4.2. Simulation Method of Cracked State

This study assumes that chloride initially diffuses separately in undamaged concrete and crack region. When concentrations were equal at the same depth, two-dimensional diffusion commenced on the crack surface. Cracked concrete was simulated following the method in Section 4.1, with crack geometries based on the four morphologies defined in Section 2.4. The diffusion coefficient in crack region was determined according to Equation (7), with values varying along the depth to match the corresponding crack width at each position.
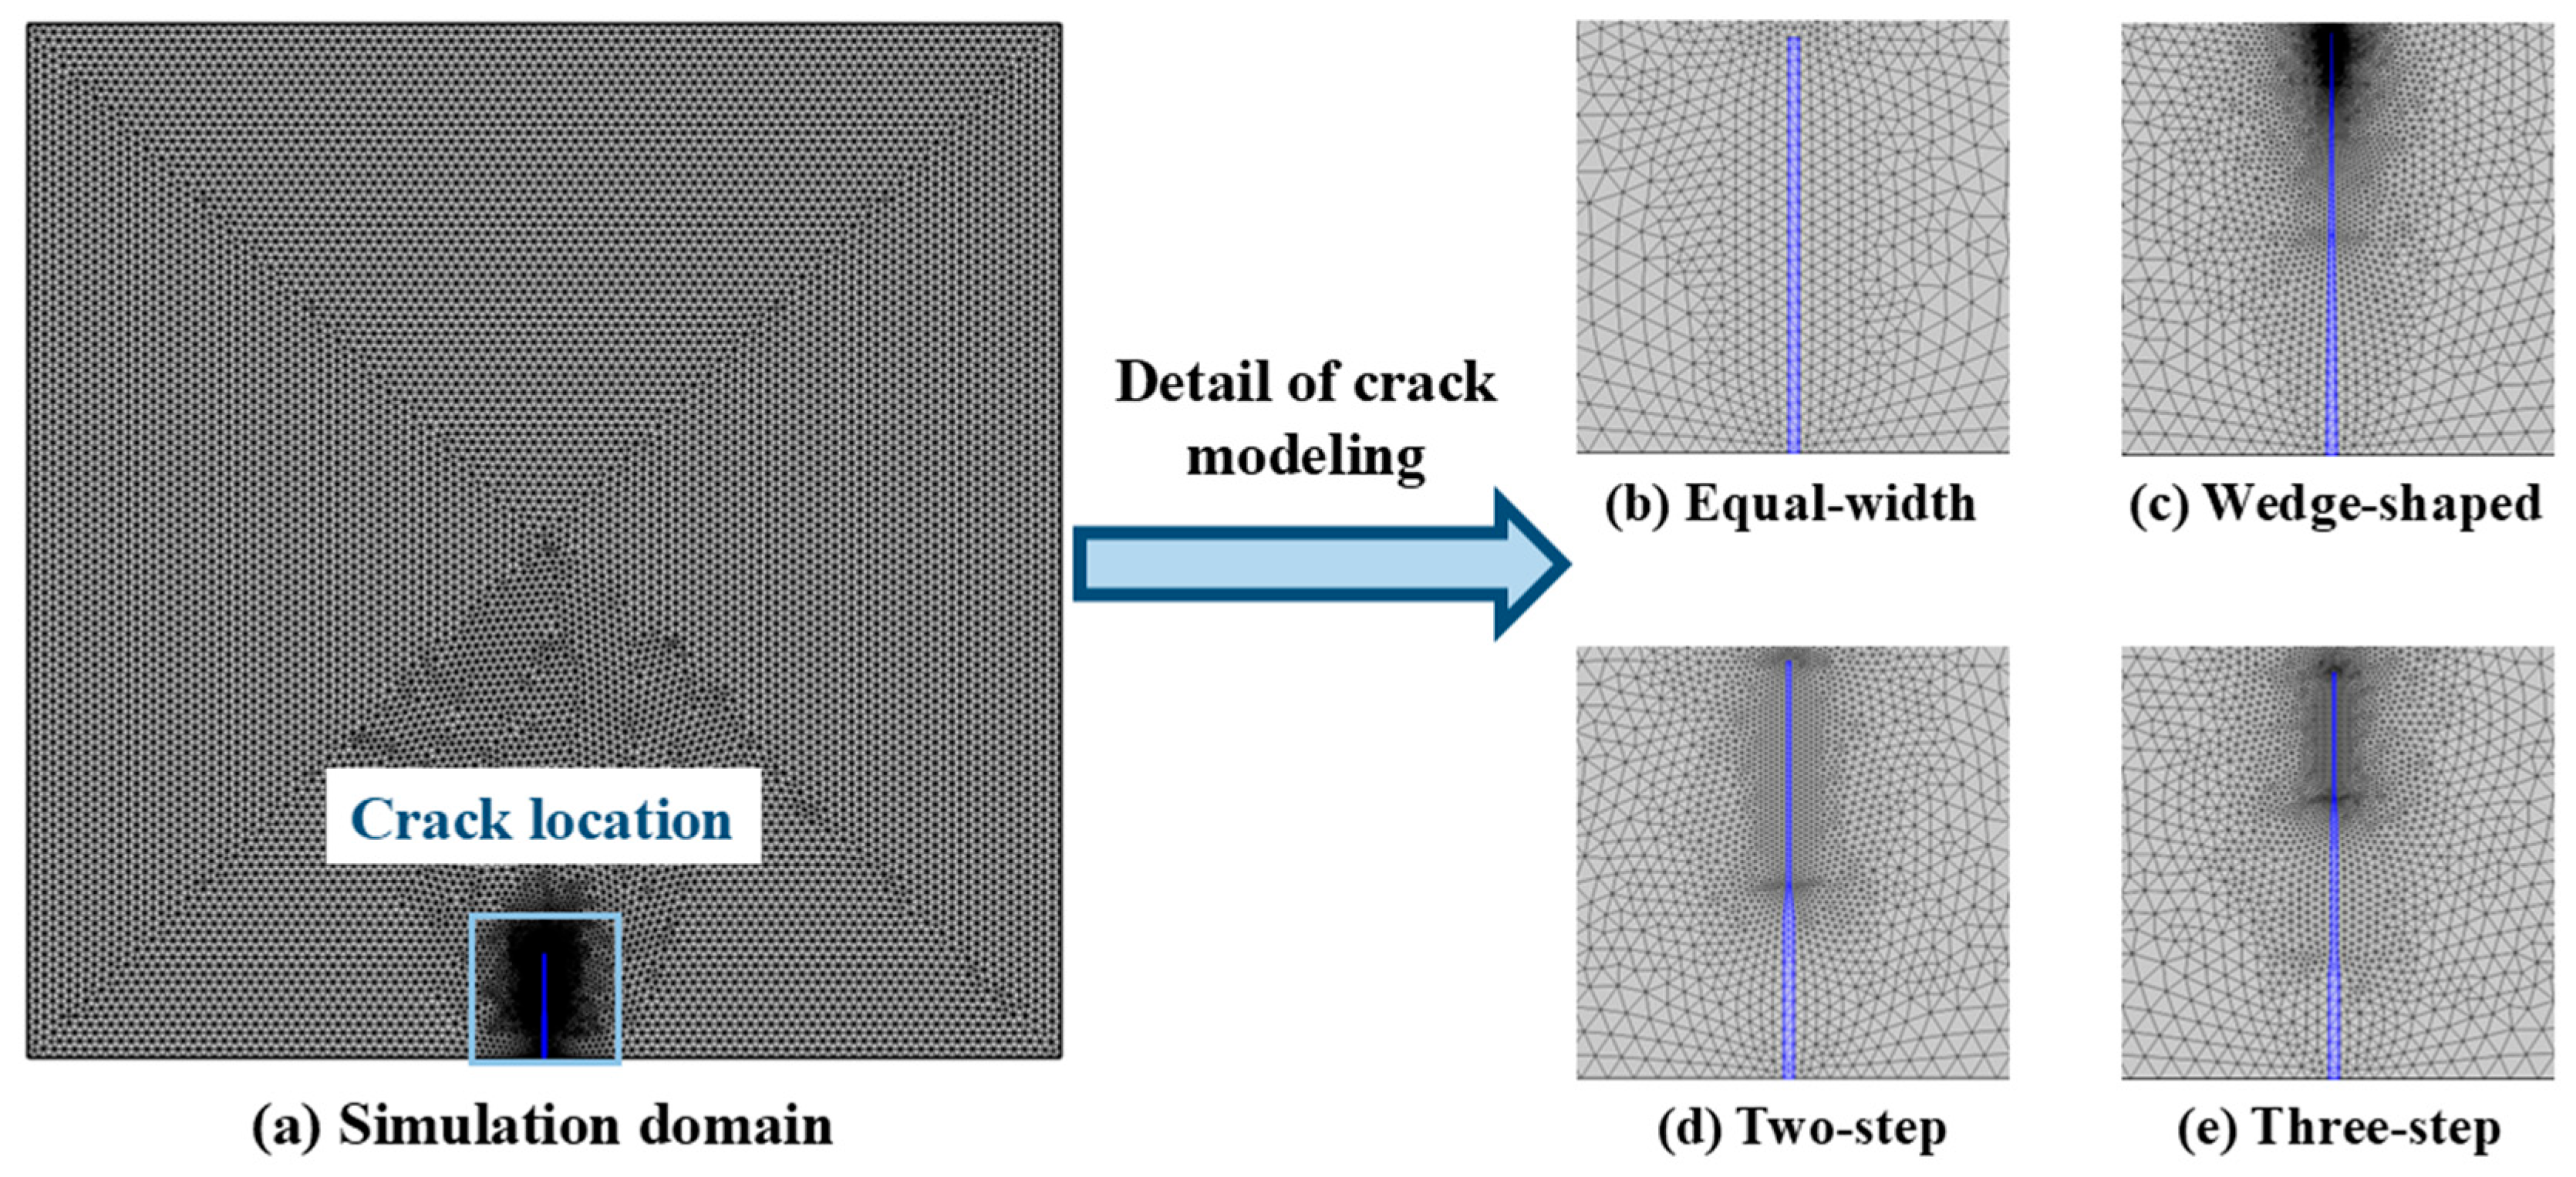
A triangular mesh was employed, with a mesh size of 1 mm in the bulk concrete, whereas a refined mesh with an average size of 0.2 mm was applied near cracks to improve the accuracy of the simulation. Figure 9 illustrates how cracks with different morphologies were modeled in the simulation domain and provides detailed views of the crack regions for each morphology.
To evaluate the effects of crack morphology, width, depth and their interactions on chloride diffusion, a full factorial design with four crack morphologies, six crack widths, and six crack depths was conducted, resulting in 144 simulation conditions. Parameter settings are listed in Table 5.

4.3. Effect of Crack Morphology on Chloride Diffusion Behavior

Considering the splash zone as an example, Figure 10 shows 50-year chloride diffusion results for four crack morphology models under two crack parameters sets: w = 0.15 mm, d = 10 mm and w = 0.40 mm, d = 35 mm. The analysis focused on the maximum chloride concentration at a depth of 40 mm (rebar location) to examine the effect of crack morphology.
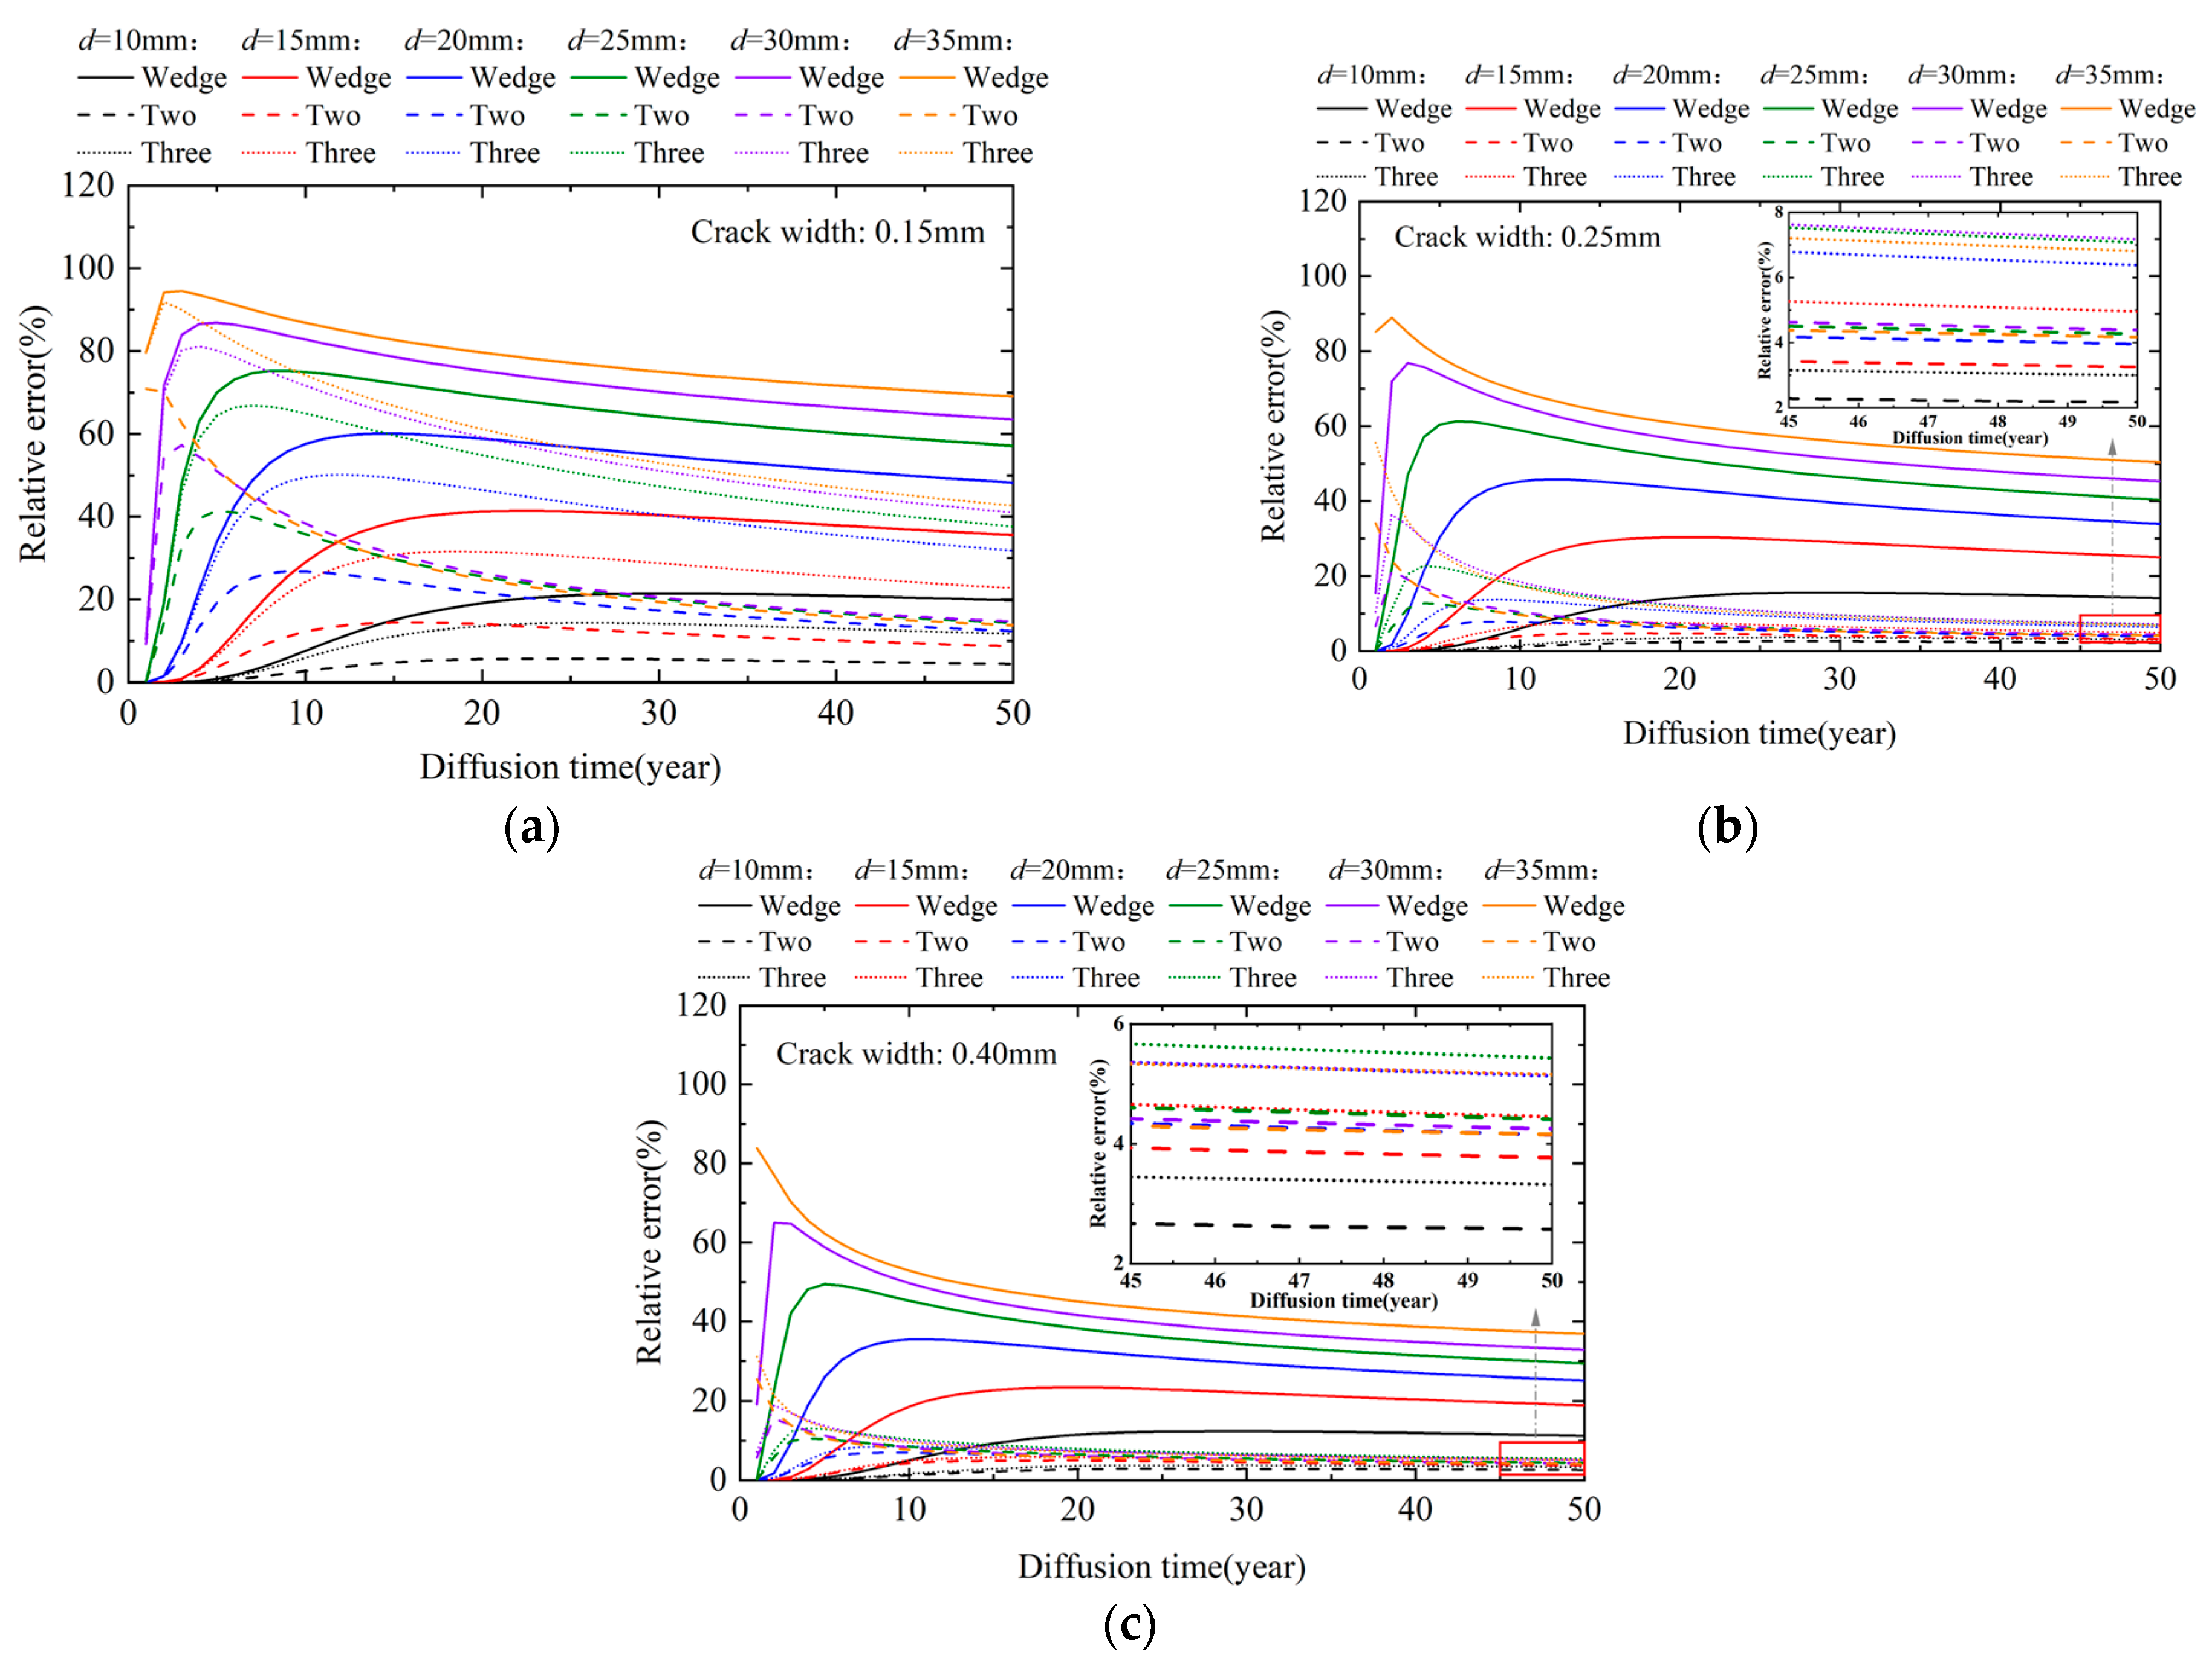
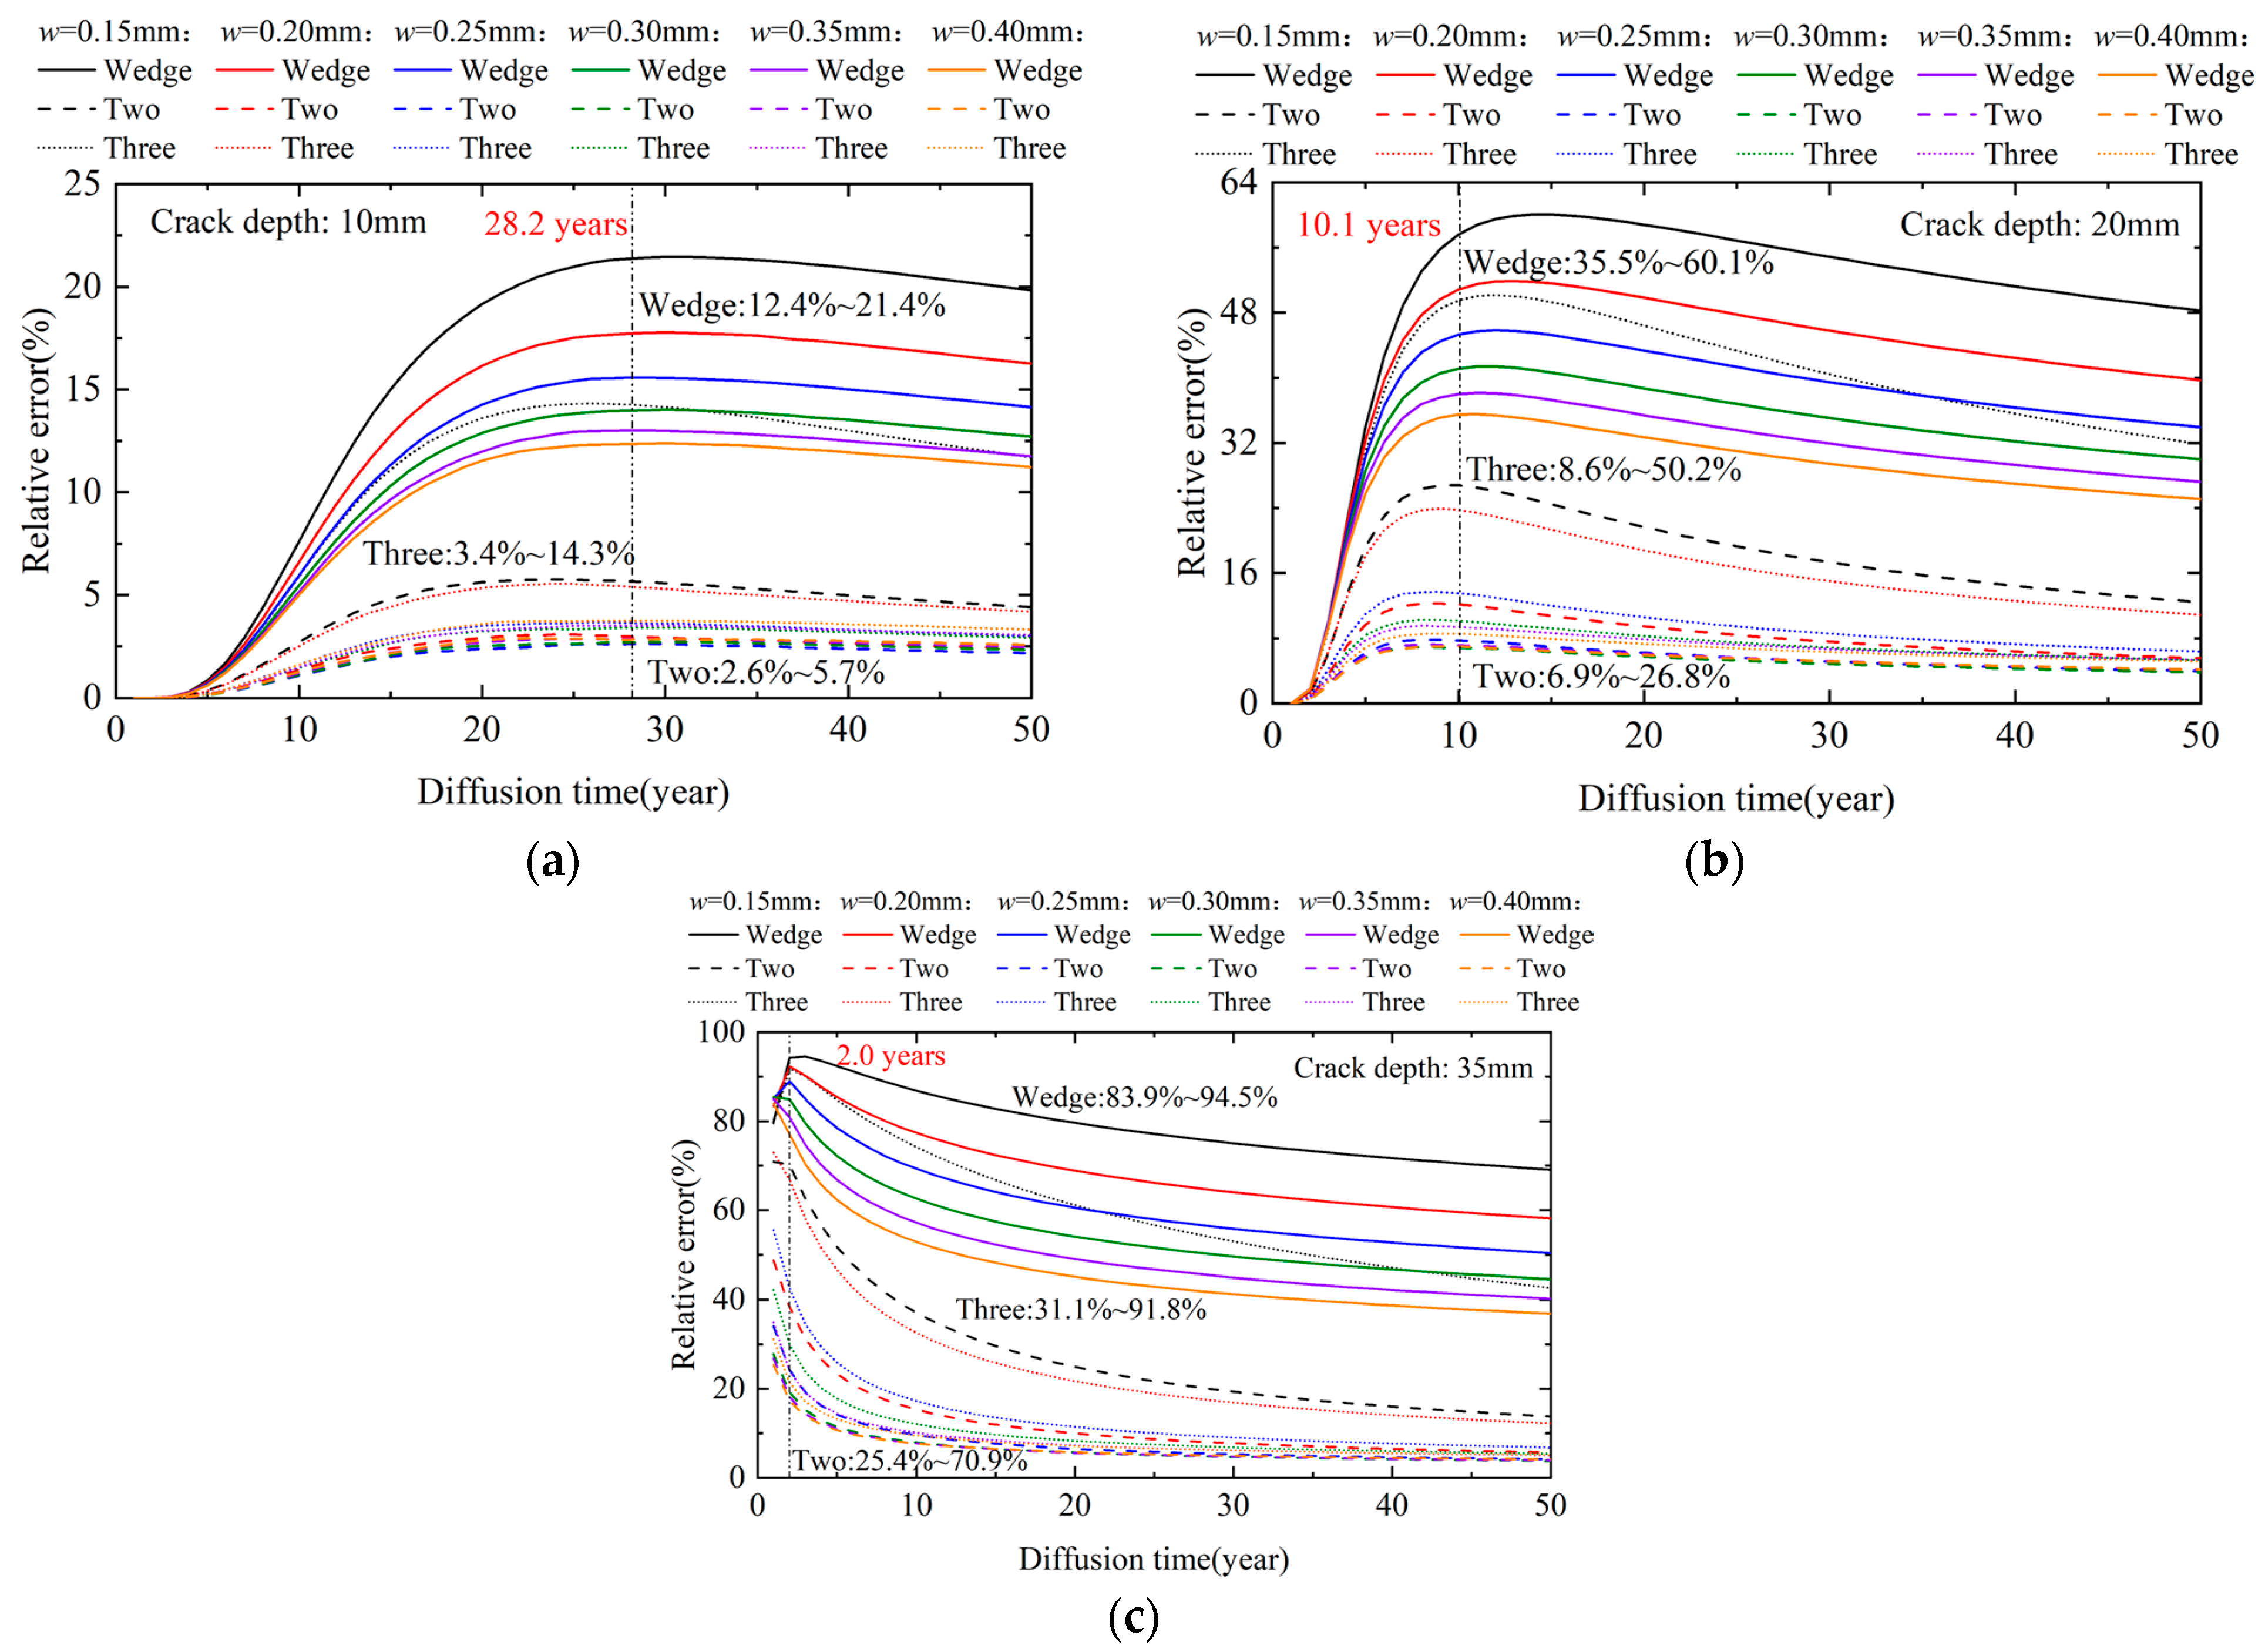
To quantify the effect of crack morphology on chloride diffusion, the equal-width crack model was used as the baseline, and the dynamic errors of the other three crack morphology models relative to it were calculated. The results indicated that crack morphology significantly affects the relative errors. Among the models, the wedge-shaped crack model (Wedge) exhibited the largest errors, followed by the three-step crack model (Three), whereas the two-step crack model (Two) exhibited the smallest. When the crack width was 0.15 mm and the crack depth was 35 mm, the maximum relative error between the equal-width and wedge-shaped models reached 94.5%.
Figure 11 shows the variation in relative errors under a constant crack width. The results revealed that the relative errors increased with the crack depth at a constant crack width. When the depth was less than 35 mm, the relative errors first increased and then decreased. For wide cracks with a depth of 35 mm, the relative errors reached the maximum at the very beginning of diffusion and then gradually decreased over time. The phenomenon can be explained by the fact that cracks act as preferential pathways for chloride. For shallow cracks, different crack morphologies amplify transport differences, resulting in larger relative errors initially, which decrease as the chloride distribution stabilizes. For wide and deep cracks, the larger crack space allows the peak relative errors to occur earlier.
The relative errors between different crack morphologies and equal-width crack decreased with increasing crack width. Meanwhile, the error gaps between the two-step and three-step models reduced gradually. This occurred because, at smaller crack widths, the complexity of the crack morphology affected the diffusion path more significantly, thus amplifying its influence on the diffusion behavior.
Additionally, the effect of the crack morphology on relative errors was analyzed while keeping the crack depth constant. Figure 12 presents the dynamic variation in relative errors for different crack morphologies at three crack depths. The results show that as crack depth increased, the effect of crack morphology intensified, and the peak relative errors exhibited significant dynamic variation. Further analysis indicated that increasing the crack depth significantly affected the timing of peak relative errors. As the depth increased from 10 to 35 mm, the average time for peak relative errors shifted from 28.2 to 2.0 years. Moreover, the crack depth affected the sensitivity of the diffusion behavior to the crack morphology, with peak relative errors exhibiting a wider range of dynamic variations at greater depths.
To further analyze the effect of crack morphology on chloride diffusion, the peak relative errors between the three crack morphology models and the equal-width crack model were compared, as shown in Figure 13. Results showed that peak errors increased with crack depth but decreased with crack width. This is primarily because greater depth extends the diffusion path, amplifying the influence of crack morphology, while greater width expands the diffusion region, reducing its impact.
Among the three crack morphologies, the wedge-shaped model showed the largest peak error, whereas the two-step model showed the smallest. Compared to the equal-width model, the difference in peak relative errors between them increased by 7.9%, 41.9%, and 49.0% as the depth increased from 10 to 35 mm at widths of 0.15, 0.25, and 0.40 mm, respectively. As the width increased from 0.15 mm to 0.40 mm, this difference decreased by 6.2% and 4.7% at depths of 10 mm and 20 mm, but increased by 34.9% at 35 mm.

5. Corrosion Initiation Assessment Method

5.1. Development of Assessment Method

When the chloride concentration on the rebar surface reaches a critical threshold, the rebar loses passivation and begins to corrode. To predict the corrosion initiation time, researchers define a limit state function [43], such as Equation (10). However, the chloride threshold value is set randomly and no consensus exists. Some researchers have proposed probabilistic methods that account for the randomness of chloride diffusion [44,45,46]; however, the implementation process of this method is rather complex. Therefore, a guarantee-rate-based assessment method is proposed that considers the randomness of the chloride threshold to provide guidance for bridge maintenance under different conditions.
g ( t ) = C t h C ( t )
where g ( t ) is the limit state function, when g ( t ) 0 , the rebar is considered corroded; C t h is the chloride threshold concentration; and C ( t ) is the total chloride concentration on the rebar surface.

5.2. Chloride Concentration Threshold

The chloride concentration threshold is typically expressed as the percentage of total chloride content relative to the unhydrated cement mass, due to its ease of measurement procedure [47]. It is occasionally defined based on free chloride content, though this approach has several limitations. Additionally, the chloride concentration threshold can be expressed as [Cl]/[OH] [48].
Based on the data from Zhu et al. [49] and Angst et al. [50], the current data were converted using Equation (11) to convert the chloride concentration threshold to be expressed in terms of the total chloride content as a percentage of concrete mass:
C T c e m C T c o n = W t o t W c e m
where C T c e m and C T c o n are the chloride concentration thresholds defined using the unhydrated cement mass and concrete mass as the denominator, respectively; W t o t is the concrete mass; and W c e m is the cement content.
The conversion results in the distribution pattern of chloride concentration threshold as shown in Figure 14. In engineering applications, different quantiles can be selected based on bridge maintenance conditions. For sufficient maintenance resources, a lower quantile can be selected for a more conservative evaluation, thus ensuring higher reliability.

6. Case Study

6.1. Overview of the Prototype Bridge

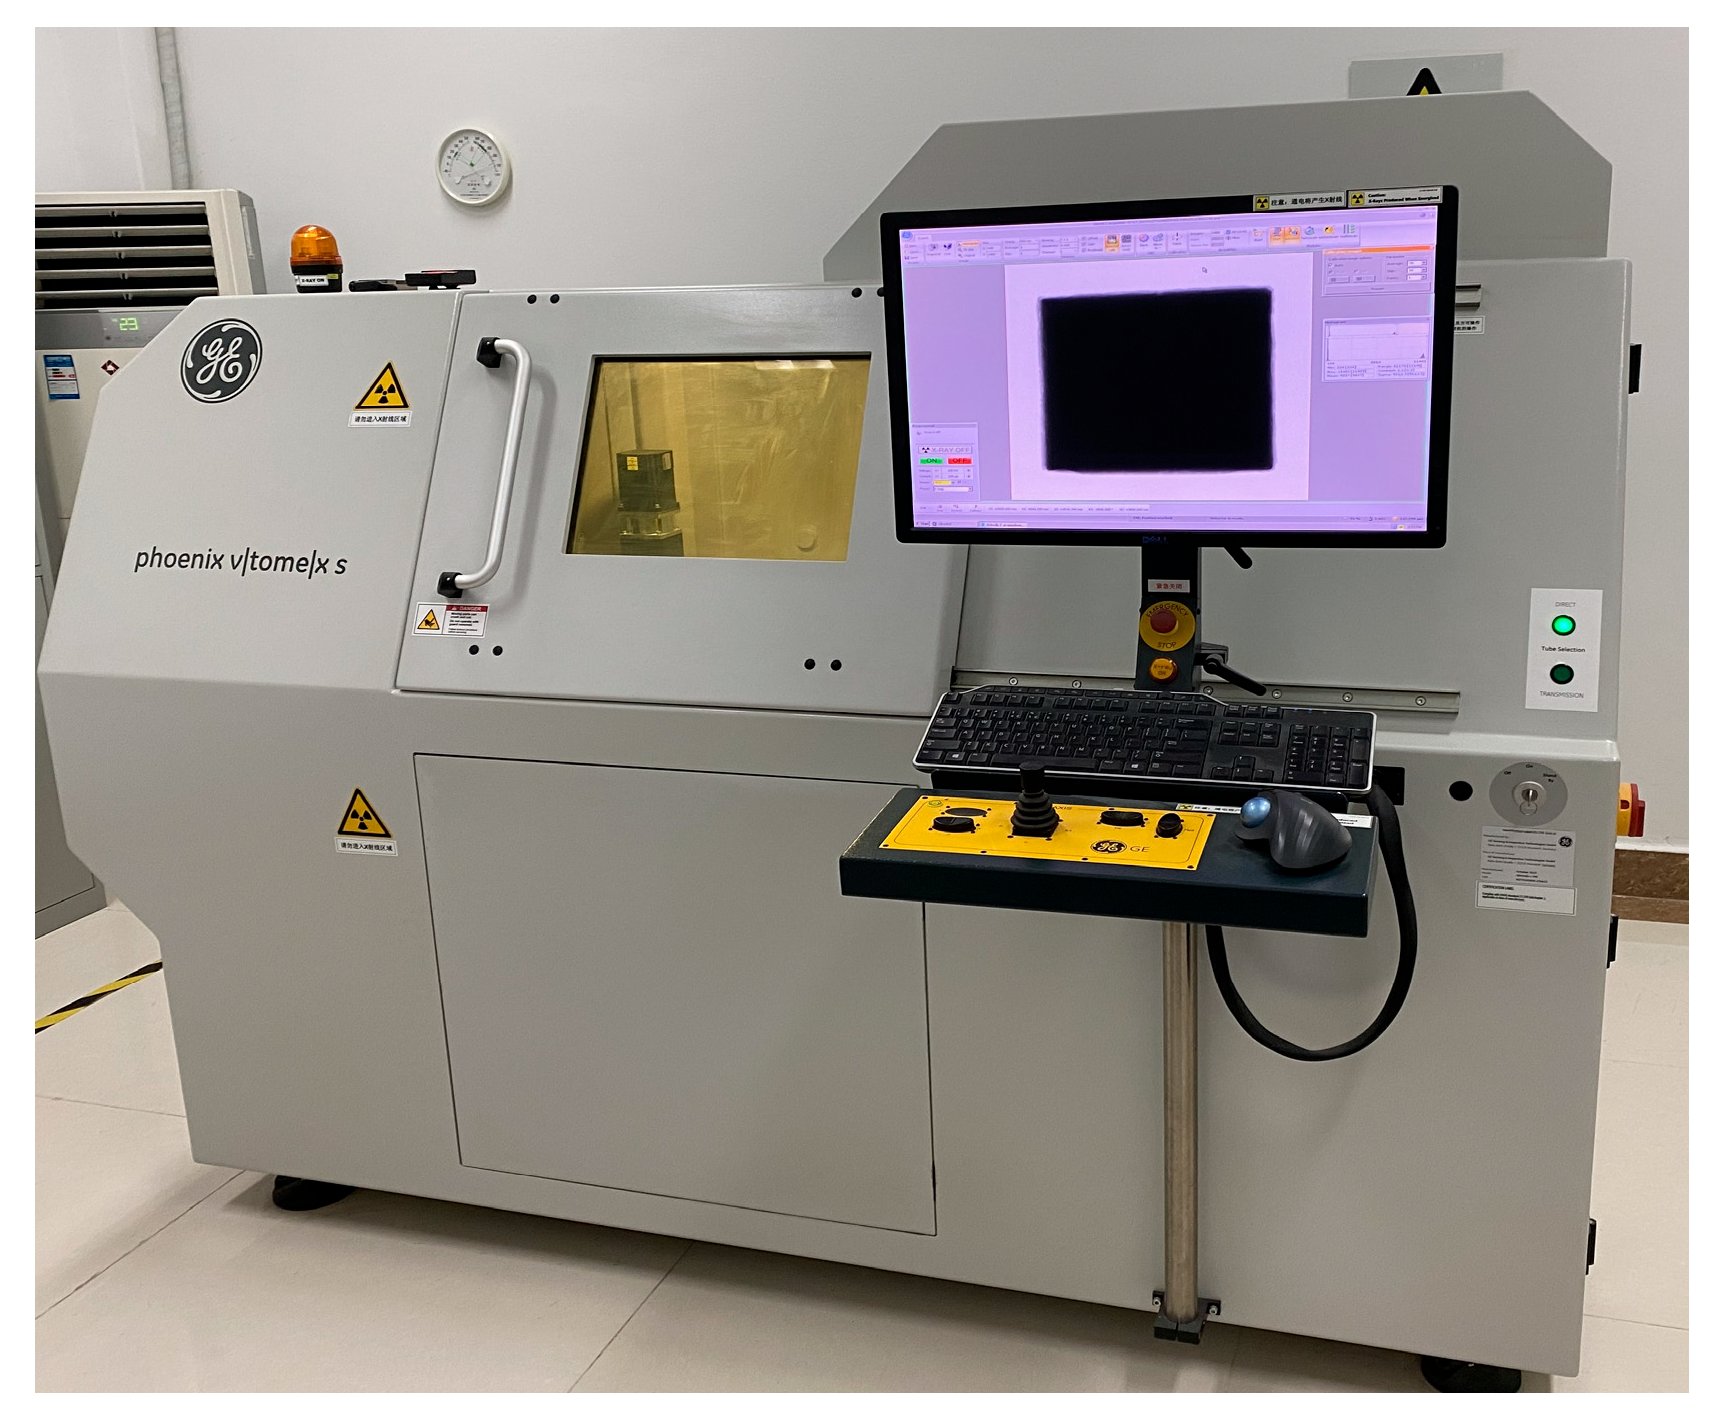
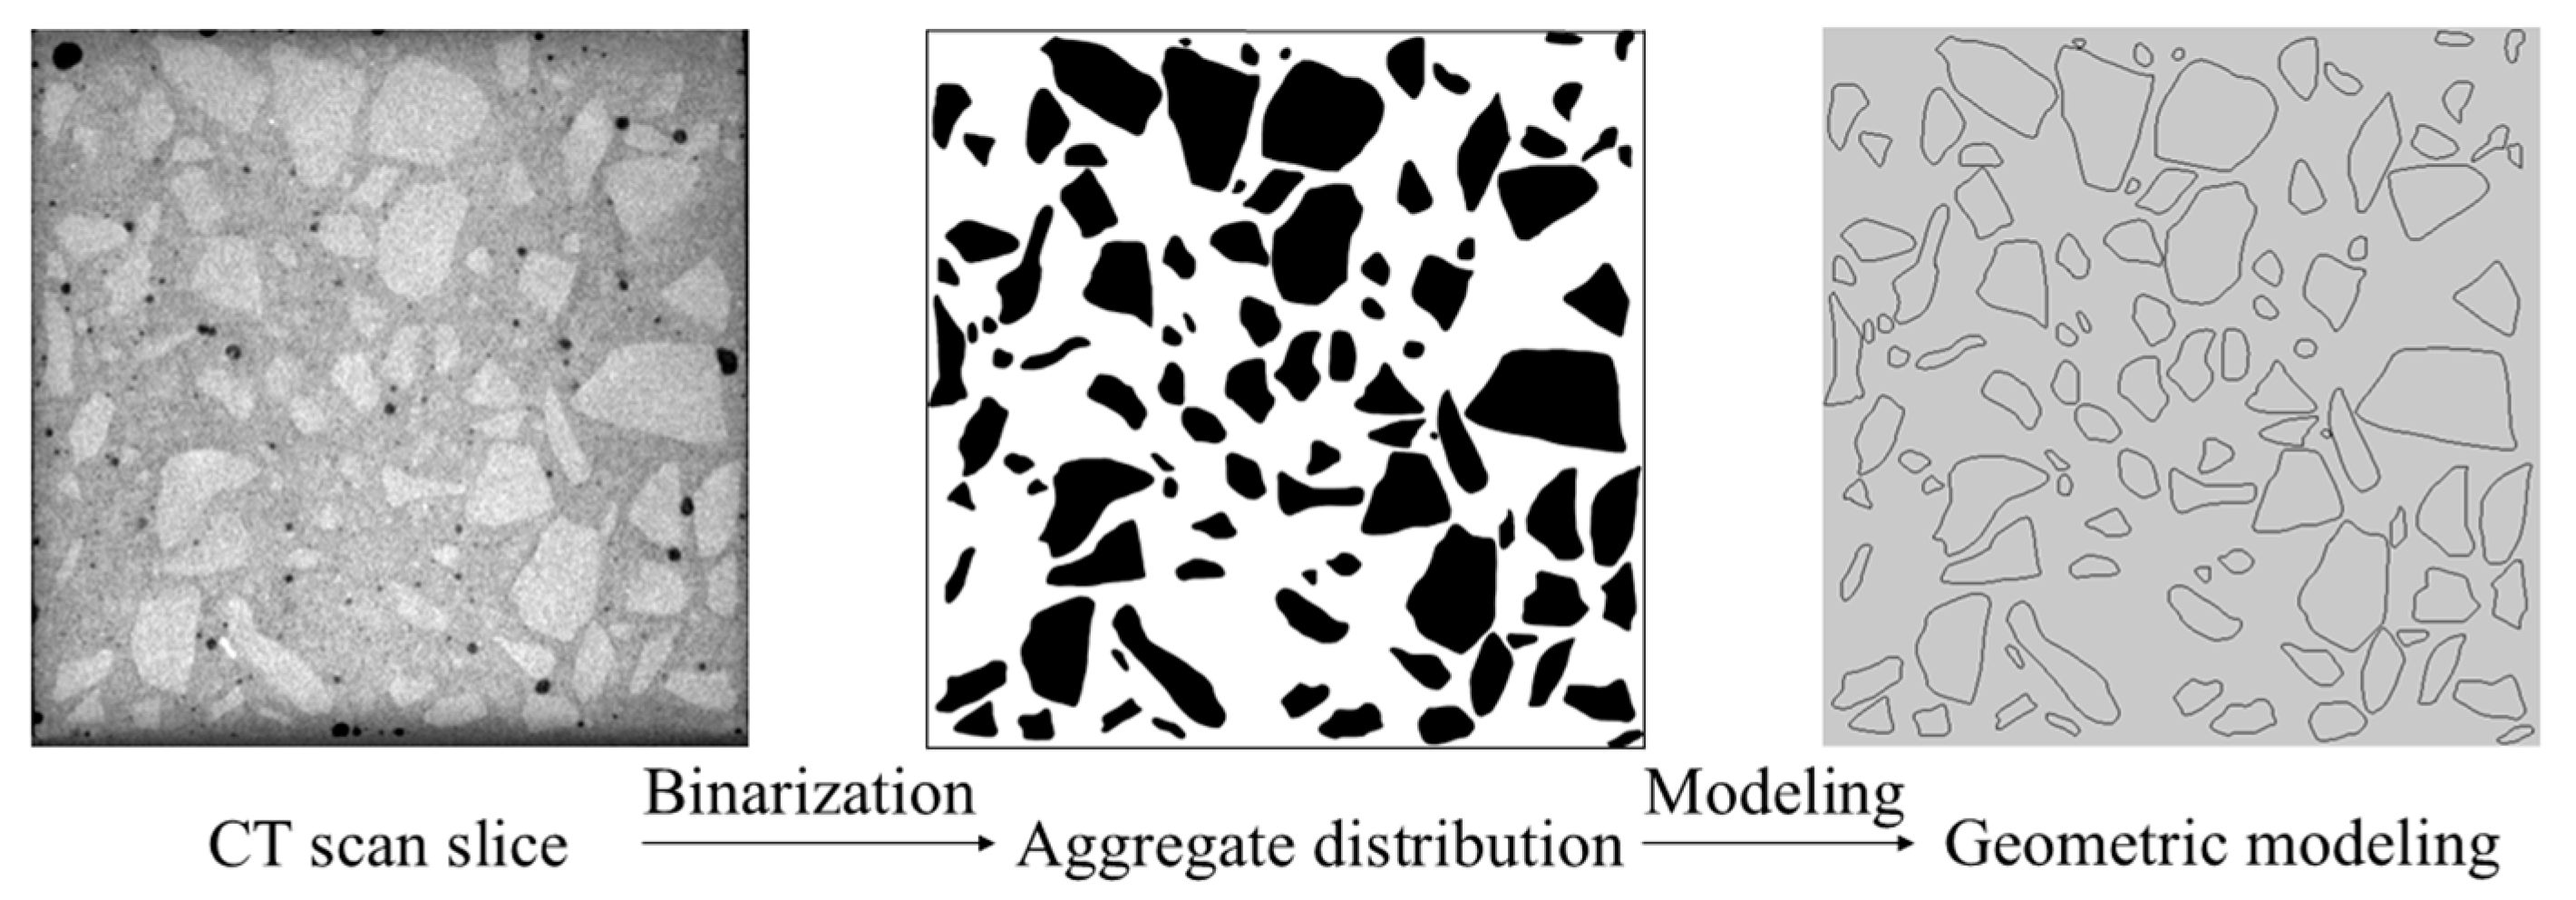
The prototype bridge is a prestressed concrete structure with a 40 mm protective layer, located in a marine environment in northern China; furthermore, this bridge is located close to the exposure test station. To study the effect of crack morphology on rebar corrosion initiation, different crack morphologies obtained from previous studies were applied in numerical simulations. Concrete specimens from the exposure test station were scanned using a GE V|tome|x S micro-CT system (Waygate Technologies, Boston, MA, USA) to capture the actual internal aggregate distribution, owing to the proximity of the bridge to the test station. The scanning device is shown in Figure 15. Scanning was performed with an accelerating voltage of 220 kV, tube current of 200 μ A , and an effective voxel resolution of 71.15 μ m . Prior to scanning, the system was calibrated using the standard geometric and detector calibration procedures provided by the manufacturer to ensure accurate representation of the internal structure. The scan results were binarized, and the aggregate shapes served as the geometric basis for numerical modeling, as shown in Figure 16.

6.2. Numerical Simulation

This section extends the chloride diffusion simulation in cracked concrete (Section 4.2) by incorporating CT-derived aggregates. The numerical model comprises three phases: mortar, aggregates, and crack. Crack propagation is assumed to bypass aggregates without penetration. During the simulation, Boolean operations were used to subtract aggregates from the geometric layers, ensuring chloride could not diffuse through the aggregates.
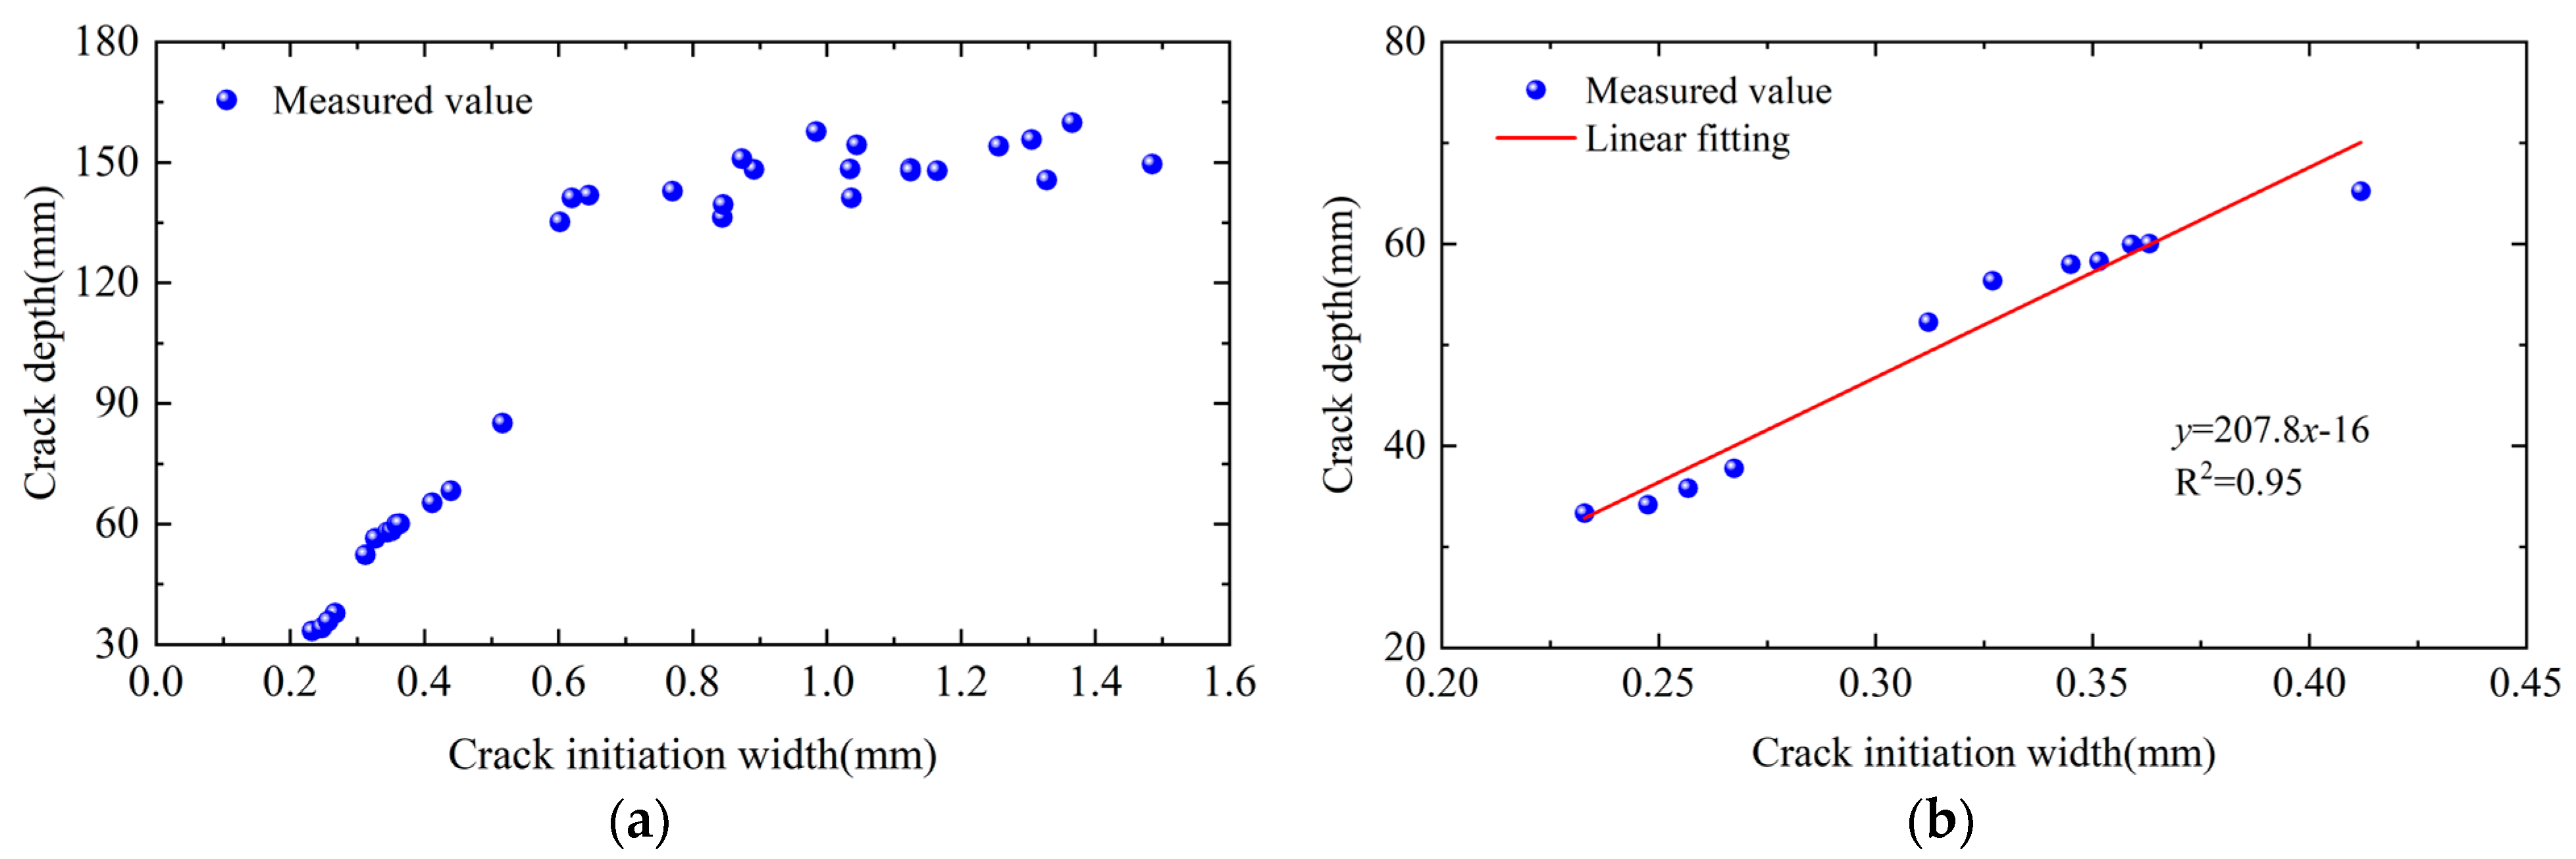
For the simulation conditions, the full-factorial experiment was not applied. The relationship between crack initiation width and depth was analyzed using the crack database. Figure 17a shows that when the crack initiation width w < 0.5   mm , the relationship was approximately linear, whereas for w > 0.5   mm , the increase in crack depth became less significant as the width increased. Since cracks in service bridges are smaller than those in destructive tests, samples with w < 0.5   mm were selected for analysis. The results indicated a significant linear relationship between the crack initiation width and crack depth within this range, as shown in Figure 17b.
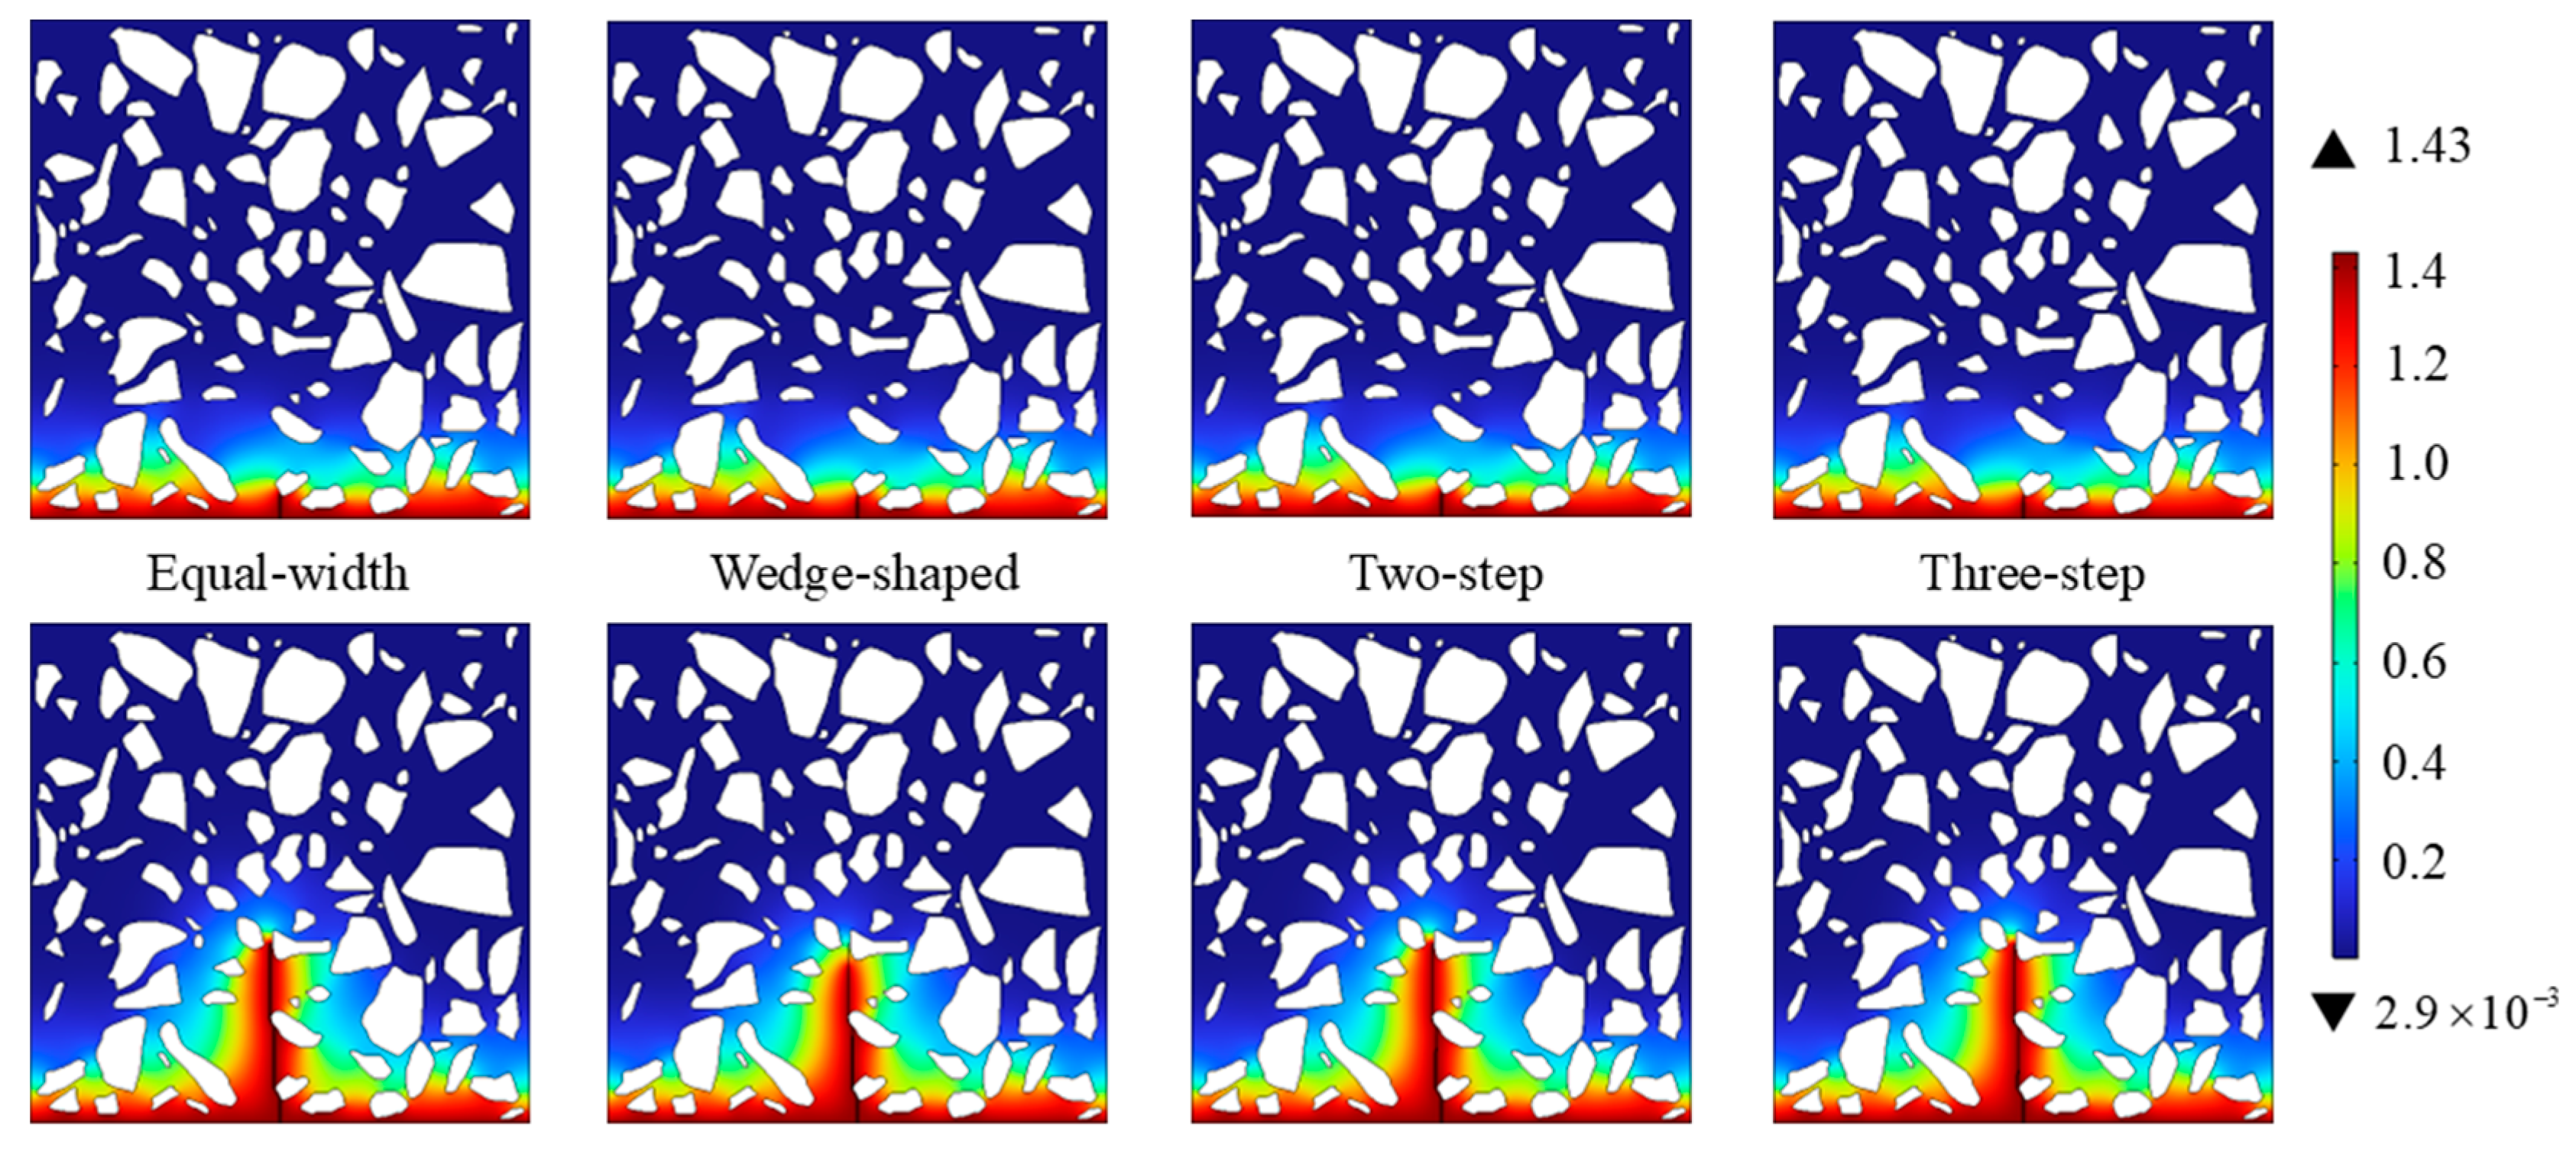
Based on the above analysis, the parameter combinations listed in Table 6 were selected, covering four crack morphologies and a total of 28 conditions. Taking the splash zone as an example, Figure 18 presents the simulation results of chloride diffusion after 50 years under two sets of parameters: w = 0.100 mm, d = 5 mm and w = 0.250 mm, d = 36 mm.

6.3. Results Discussion

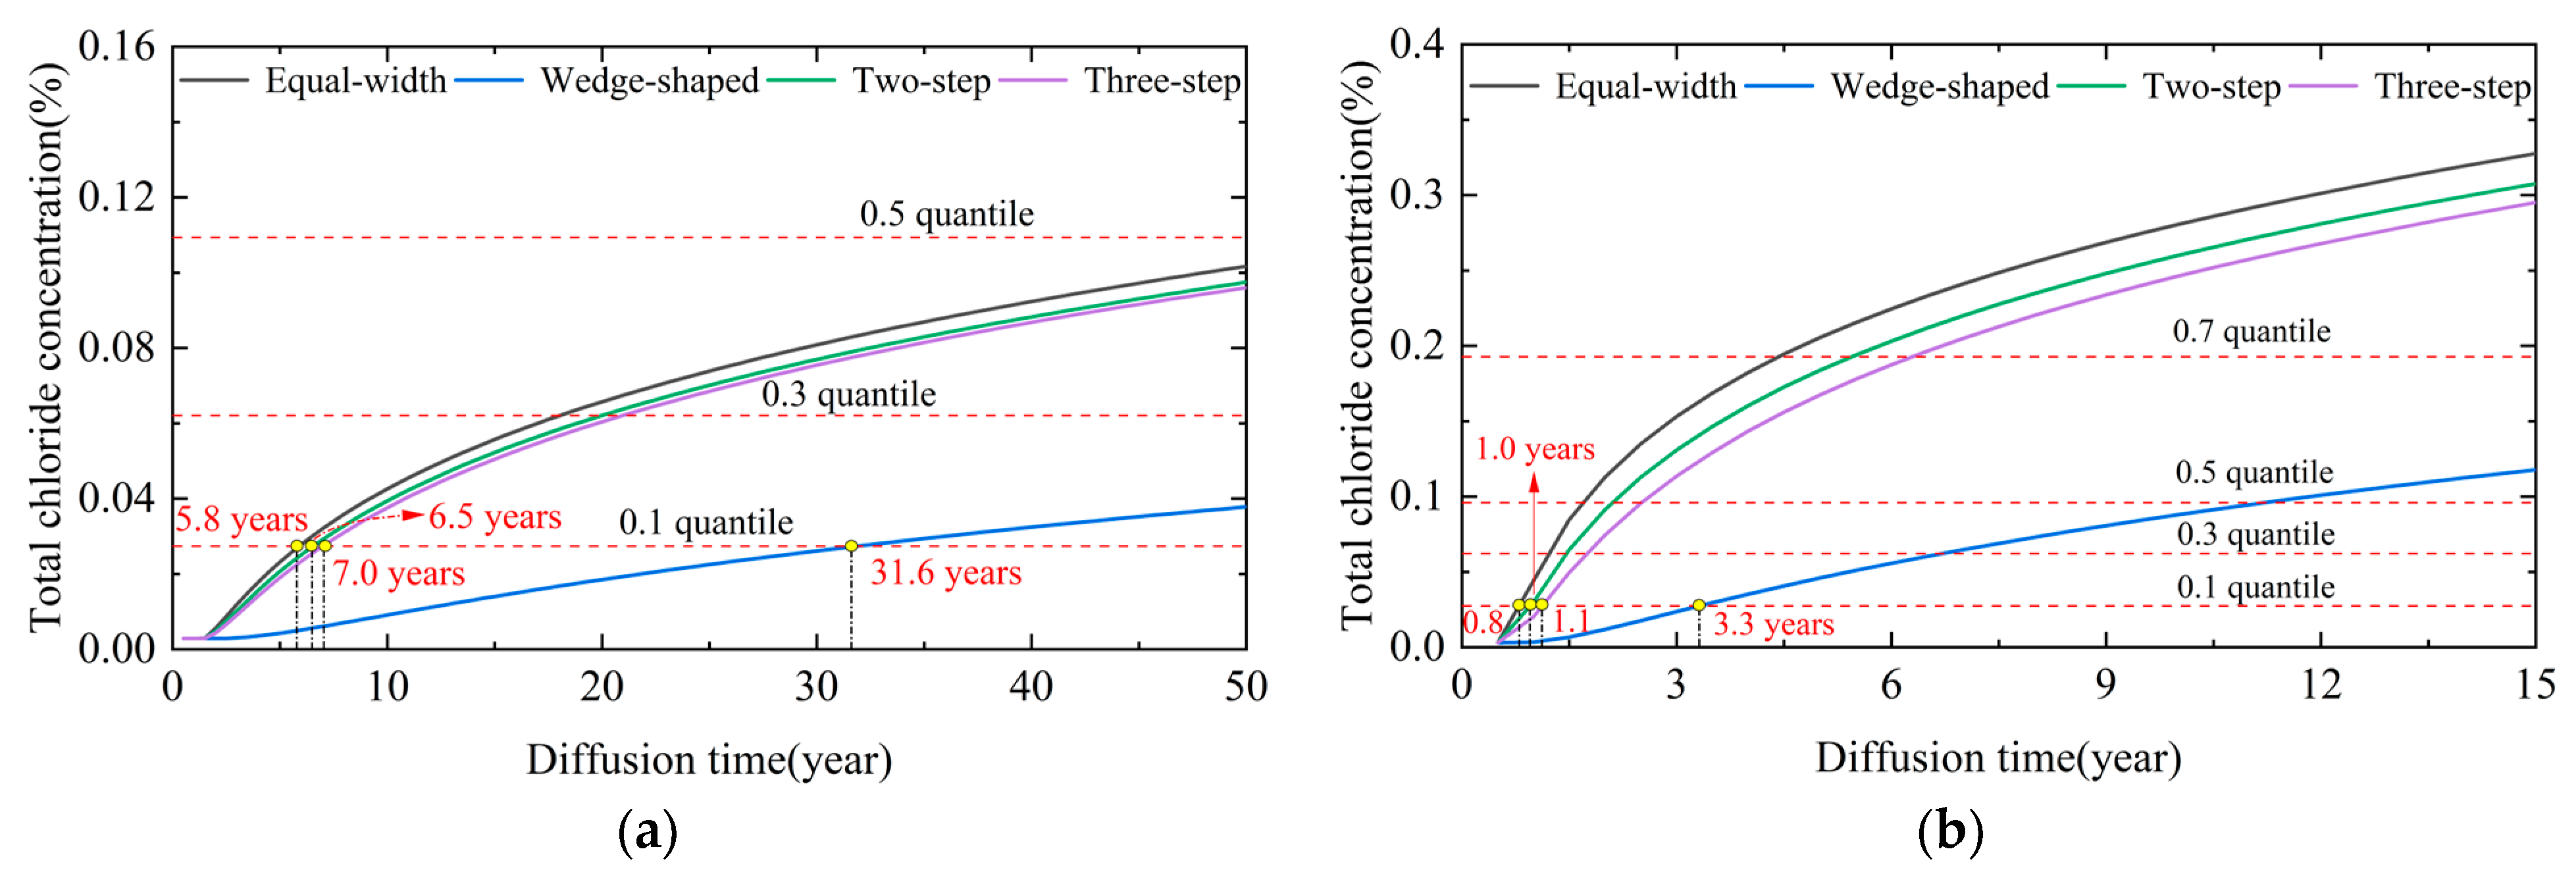
The maximum chloride concentration at a depth of 40 mm was extracted for each condition, and the corrosion initiation time was predicted using the method in Section 5. For the atmospheric zone components, using parameter combination 7 as an example, the corrosion initiation time is shown in Figure 19a. When the chloride concentration threshold was set to the 0.1 quantile value (corresponding to a 90% guarantee rate), the corrosion initiation times for equal-width, two-step, three-step, and wedge-shaped crack models were 5.8, 6.5, 7.0, and 31.6 years, respectively. The difference in initiation time between the wedge-shaped crack and the other three cracks was approximately 29 years. Figure 19b shows the corrosion initiation times for the rebar in the splash zone under parameter combination 7. For equal-width, two-step, three-step, and wedge-shaped crack models, the corrosion initiation times were 0.8, 1.0, 1.1, and 3.3 years, respectively, with a difference of 2.0 years between the wedge-shaped crack and the other three cracks. In both zones, the equal-width model exhibited the highest growth rate, whereas the wedge-shaped model exhibited the slowest. Therefore, as the quantile value increased, the difference between the wedge-shaped crack model and the other models increased. Under identical crack parameters, the corrosion initiation time in the atmospheric zone occurred much later than that in the splash zone.

7. Conclusions

In this study, the chloride diffusion behavior of cracked concrete in marine environments was investigated through exposure tests, destructive test, and finite element simulations. A corrosion initiation assessment method for rebar based on guarantee rate was proposed. The main conclusions are as follows:
(1)
A crack database containing 51 samples was established. The samples were categorized into four typical crack morphologies: equal-width, wedge-shaped, two-step, and three-step cracks.
(2)
A numerical simulation for chloride diffusion in cracked concrete was performed, and a full factorial experiment with varying parameters was conducted. With the equal-width crack model as a reference, the wedge-shaped crack model exhibited the largest relative error, whereas the two-step crack model exhibited the smallest. The maximum relative error between the equal-width and wedge-shaped crack models was 94.5%.
(3)
An increase in the crack width prolongs the diffusion path of chloride ions, thereby enhancing the effect of crack morphology on chloride diffusion behavior. In contrast, an increase in crack depth expands the diffusion region and weakens this effect.
(4)
When the crack initiation width of the flexural crack in the pure bending section extracted from the destructive test was less than 0.5 mm, a clear linear relationship was observed between the crack-initiation width and crack depth.
(5)
A corrosion initiation assessment method for rebars based on the guarantee rate was proposed, and a case analysis was conducted. The equal-width crack model exhibited the earliest corrosion initiation time, whereas the wedge-shaped crack model exhibited the latest. When the chloride threshold concentration was set to 0.1 quantile, the differences in the corrosion initiation time between the equal-width and wedge-shaped crack models in the atmospheric and splash zones were 25.8 and 2.5 years, respectively.
(6)
Equal-width cracks should be prioritized for monitoring and timely repair, while wide or deep cracks also require focused inspection and protective measures to mitigate chloride ingress. Furthermore, the proposed methodology, when combined with monitoring data from in-service bridges, enables a more accurate estimation of reinforcement corrosion initiation time. Future research should focus on coupled deterioration mechanisms and incorporating probabilistic or data-driven approaches to improve corrosion initiation assessment of cracked concrete structures.

Author Contributions

Conceptualization, X.W. and P.H.; methodology, Y.Y. (Yangguang Yuan); software, X.W.; validation, P.H. and D.W.; formal analysis, X.L.; investigation, X.W.; resources, P.H.; data curation, Y.Y. (Yulong Yang); writing—original draft preparation, X.W.; writing—review and editing, Y.Y. (Yangguang Yuan); visualization, D.W.; supervision, P.H.; funding acquisition, Y.Y. (Yangguang Yuan). All authors have read and agreed to the published version of the manuscript.

Funding

This research was funded by the National Natural Science Foundation of China, grant number 52308200.

Data Availability Statement

The data used in the article can be obtained from the author here.

Conflicts of Interest

The authors declare no conflicts of interest.

References

  1. Ye, H.; Jin, X.; Fu, C.; Jin, N.; Xu, Y.; Huang, T. Chloride penetration in concrete exposed to cyclic drying-wetting and carbonation. Constr. Build. Mater. 2016, 112, 457–463. [Google Scholar] [CrossRef]
  2. Gašpárek, J.; Húlek, L.; Paulík, P.; Janotka, I. Theoretical prediction of chloride diffusion into concrete compared to natural chloride contamination of existing bridges. Structures 2023, 57, 105080. [Google Scholar] [CrossRef]
  3. Ma, Y.; Xu, F.; Wang, L.; Zhang, J.; Zhang, X. Influence of corrosion-induced cracking on structural behavior of reinforced concrete arch ribs. Eng. Struct. 2016, 117, 184–194. [Google Scholar] [CrossRef]
  4. Jee, A.A.; Pradhan, B. Long term effect of chloride and sulfates concentration, and cation allied with sulfates on corrosion performance of steel-reinforced in concrete. J. Build. Eng. 2022, 56, 104813. [Google Scholar] [CrossRef]
  5. Fu, C.; Ling, Y.; Wang, K. An innovation study on chloride and oxygen diffusions in simulated interfacial transition zone of cementitious material. Cem. Concr. Compos. 2020, 110, 103585. [Google Scholar] [CrossRef]
  6. Guzmán, S.; Gálvez, J.C.; Sancho, J.M. Modelling of chloride ingress into concrete through a single-ion approach. application to an idealized surface crack pattern. Int. J. Numer. Anal. Methods Geomech. 2014, 38, 1683–1706. [Google Scholar] [CrossRef]
  7. Jang, S.Y.; Kim, B.S.; Oh, B.H. Effect of crack width on chloride diffusion coefficients of concrete by steady-state migration tests. Cem. Concr. Res. 2011, 41, 9–19. [Google Scholar] [CrossRef]
  8. Marsavina, L.; Audenaert, K.; De Schutter, G.; Faur, N.; Marsavina, D. Experimental and numerical determination of the chloride penetration in cracked concrete. Constr. Build. Mater. 2009, 23, 264–274. [Google Scholar] [CrossRef]
  9. Wang, X.; Ba, M.; Yi, B.; Liu, J. Experimental and numerical investigation on the effect of cracks on chloride diffusion and steel corrosion in concrete. J. Build. Eng. 2024, 86, 108521. [Google Scholar] [CrossRef]
  10. Šavija, B.; Schlangen, E.; Pacheco, J.; Millar, S.; Eichler, T.; Wilsch, G. Chloride ingress in cracked concrete: A laser induced breakdown spectroscopy (LIBS) study. J. Adv. Concr. Technol. 2014, 12, 425–442. [Google Scholar] [CrossRef]
  11. Picandet, V.; Khelidj, A.; Bellegou, H. Crack effects on gas and water permeability of concretes. Cem. Concr. Res. 2009, 39, 537–547. [Google Scholar] [CrossRef]
  12. Song, H.-W.; Kwon, S.-J.; Byun, K.-J.; Park, C.-K. Predicting carbonation in early-aged cracked concrete. Cem. Concr. Res. 2006, 36, 979–989. [Google Scholar] [CrossRef]
  13. Audenaert, K.; Schutter, G.D.; Marsavina, L.; Boel, V. Influence of cracks and crack width on penetration depth of chlorides in concrete. Eur. J. Environ. Civ. Eng. 2009, 13, 561–572. [Google Scholar] [CrossRef]
  14. Yan, Y.; Jin, W.; Chen, J. Experiments of chloride ingression in flexural reinforced concrete beams. Adv. Struct. Eng. 2012, 15, 277–286. [Google Scholar] [CrossRef]
  15. Ismail, M.; Toumi, A.; François, R.; Gagné, R. Effect of crack opening on the local diffusion of chloride in cracked mortar samples. Cem. Concr. Res. 2008, 38, 1106–1111. [Google Scholar] [CrossRef]
  16. Jones, S.; Martys, N.; Lu, Y.; Bentz, D. Simulation studies of methods to delay corrosion and increase service life for cracked concrete exposed to chlorides. Cem. Concr. Compos. 2015, 58, 59–69. [Google Scholar] [CrossRef]
  17. Huang, T.; Feng, S.; Wang, M.; Peng, Z. Study on the effect of cracking parameters on the migration characteristics of chloride ions in cracked concrete. Buildings 2024, 14, 1738. [Google Scholar] [CrossRef]
  18. Bentz, D.P.; Garboczi, E.J.; Lu, Y.; Martys, N.; Sakulich, A.R.; Weiss, W.J. Modeling of the influence of transverse cracking on chloride penetration into concrete. Cem. Concr. Compos. 2013, 38, 65–74. [Google Scholar] [CrossRef]
  19. Long, G.; Yuan, Y.; Xin, G.; Wang, F.; Huang, P. Experimental based time-dependent reliability assessment of corrosion initiation for pc girders in frozen marine environment. Constr. Build. Mater. 2023, 408, 133461. [Google Scholar] [CrossRef]
  20. Djerbi, A.; Bonnet, S.; Khelidj, A.; Baroghel-bouny, V. Influence of traversing crack on chloride diffusion into concrete. Cem. Concr. Res. 2008, 38, 877–883. [Google Scholar] [CrossRef]
  21. Park, S.-S.; Kwon, S.-J.; Jung, S.H. Analysis technique for chloride penetration in cracked concrete using equivalent diffusion and permeation. Constr. Build. Mater. 2012, 29, 183–192. [Google Scholar] [CrossRef]
  22. Sun, G.; Zhang, Y.; Sun, W.; Liu, Z.; Wang, C. Multi-scale prediction of the effective chloride diffusion coefficient of concrete. Constr. Build. Mater. 2011, 25, 3820–3831. [Google Scholar] [CrossRef]
  23. Peng, J.; Hu, S.; Zhang, J.; Cai, C.S.; Li, L. Influence of cracks on chloride diffusivity in concrete: A five-phase mesoscale model approach. Constr. Build. Mater. 2019, 197, 587–596. [Google Scholar] [CrossRef]
  24. Yang, C.; Zhang, J.; Guo, W. Effect of aggregate characteristics on chloride diffusion in concrete based on mesoscale numerical simulation. Constr. Build. Mater. 2025, 472, 140839. [Google Scholar] [CrossRef]
  25. GB 175-2023; Common Portland Cement. Standards Press of China: Beijing, China, 2023. (In Chinese)
  26. GB/T 1596-2017; Fly Ash Used for Cement and Concrete. Standards Press of China: Beijing, China, 2017. (In Chinese)
  27. Yuan, Y.; Yi, T.; Xin, G.; Long, G.; Ma, N. Study on real-time safety assessment methods of concrete bridges by deflection monitoring. China Civ. Eng. J. 2025, 58, 68–82. (In Chinese) [Google Scholar] [CrossRef]
  28. GB/T 5224-2023; Steel Strand for Prostressed Concrete. Standards Press of China: Beijing, China, 2023. (In Chinese)
  29. GB 50010-2010; Code for Design of Concrete Structures. China Architecture & Building Press: Beijing, China, 2010. (In Chinese)
  30. GB/T 50081-2019; Standard for Test Methods of Concrete Physical and Mechanical Properties. China Architecture & Building Press: Beijing, China, 2019. (In Chinese)
  31. GB/T 50152-2012; Standard for Test Method of Concrete Structures. China Architecture & Building Press: Beijing, China, 2012. (In Chinese)
  32. JTG 3362-2018; Specifications for Design of Highway Reinforced Concrete and Prestressed Concrete Bridges and Culverts. People’s Communications Publishing House Co., Ltd.: Beijing, China, 2018. (In Chinese)
  33. Gu, Q.; Wu, R.; Ren, J.; Tan, Y.; Tian, S.; Wen, S. Effect of position of non-contact lap splices on in-plane force transmission Performance of Horizontal Joints in Precast Concrete Double-Face Superposed Shear Wall Structures. J. Build. Eng. 2022, 51, 104197. [Google Scholar] [CrossRef]
  34. Gu, L.; Shao, X. Theoretical analysis of crack propagation measurement for brittle materials based on virtual principal strain field. Acta Mech. Solida Sin. 2022, 35, 842–850. [Google Scholar] [CrossRef]
  35. Liu, Y. Research on Dynamic Extended Subpixel Measurement of Structural Cracks Based on Machine Vision. Master’s Thesis, Chongqing Jiaotong University, Chongqing, China, 2025. (In Chinese). [Google Scholar]
  36. Wally, G.B.; Larrossa, M.D.C.; Pinheiro, L.C.D.L.; Real, M.D.V.; Magalhães, F.C. 6-Month evaluation of concrete aging factor using chloride migration test: Effects of binder type and w/b ratio. Materialia 2023, 30, 101841. [Google Scholar] [CrossRef]
  37. Amey, S.L.; Johnson, D.A.; Miltenberger, M.A.; Farzam, H. Predicting the service life of concrete marine structures: An environmental methodology. Struct. J. 1998, 95, 205–214. [Google Scholar] [CrossRef]
  38. Bitaraf, M.; Mohammadi, S. Analysis of chloride diffusion in concrete structures for prediction of initiation time of corrosion using a new meshless approach. Constr. Build. Mater. 2008, 22, 546–556. [Google Scholar] [CrossRef]
  39. Ishida, T.; Iqbal, P.O.; Anh, H.T.L. Modeling of chloride diffusivity coupled with non-linear binding capacity in sound and cracked concrete. Cem. Concr. Res. 2009, 39, 913–923. [Google Scholar] [CrossRef]
  40. Jin, L.; Du, X.; Li, Y. Study on chloride diffusivity coefficient in cracks within saturated concrete. Eng. Mech. 2016, 33, 50–56, 73. (In Chinese) [Google Scholar] [CrossRef]
  41. Chen, S.; Zhuang, H.; Zhou, Y.; Li, S.; Li, C. Numerical simulation of chloride-induced reinforcement corrosion in cracked concrete based on mesoscopic model. Constr. Build. Mater. 2024, 441, 137408. [Google Scholar] [CrossRef]
  42. COMSOL Multiphysics®, v. 6.1; COMSOL AB: Stockholm, Sweden, 2022. Available online: https://www.comsol.com (accessed on 3 May 2025).
  43. Shi, D.; Chen, X.; Shao, W. Corrosion initiation life prediction of rc square piles based on a dual time-dependent bidirectional chloride diffusion model. Constr. Build. Mater. 2021, 275, 122192. [Google Scholar] [CrossRef]
  44. Shao, W.; Shi, D.; Tang, P. Probabilistic lifetime assessment of rc pipe piles subjected to chloride environments. J. Mater. Civ. Eng. 2018, 30, 04018297. [Google Scholar] [CrossRef]
  45. Loreto, G.; Benedetti, M.D.; Luca, A.D.; Nanni, A. Assessment of reinforced concrete structures in marine environment: A case study. Corros. Rev. 2019, 37, 57–69. [Google Scholar] [CrossRef]
  46. Hamidane, H.; Chateauneuf, A.; Messabhia, A.; Ababneh, A. Reliability analysis of corrosion initiation in reinforced concrete structures subjected to chlorides in presence of epistemic uncertainties. Struct. Saf. 2020, 86, 101976. [Google Scholar] [CrossRef]
  47. Meira, G.R.; Andrade, C.; Vilar, E.O.; Nery, K.D. Analysis of chloride threshold from laboratory and field experiments in marine atmosphere zone. Constr. Build. Mater. 2014, 55, 289–298. [Google Scholar] [CrossRef]
  48. Alonso, M.C.; Sanchez, M. Analysis of the variability of chloride threshold values in the literature. Mater. Corros. 2009, 60, 631–637. [Google Scholar] [CrossRef]
  49. Zhu, Y.; Macdonald, D.D.; Yang, J.; Qiu, J.; Engelhardt, G.R. Corrosion of rebar in concrete. Part II: Literature survey and statistical analysis of existing data on chloride threshold. Corros. Sci. 2021, 185, 109439. [Google Scholar] [CrossRef]
  50. Angst, U.; Elsener, B.; Larsen, C.K.; Vennesland, Ø. Critical chloride content in reinforced concrete—A Review. Cem. Concr. Res. 2009, 39, 1122–1138. [Google Scholar] [CrossRef]
Figure 1. Elevation and cross-sectional reinforcement details of the test beam.
Buildings 15 03214 g001
Figure 2. Schematic of loading device.
Buildings 15 03214 g002
Figure 3. Failure of the test beam: (a) failure mode of the test beam; (b) crack distribution; (c) principal strain cloud diagram.
Buildings 15 03214 g003
Figure 4. Crack dimensions extraction: (a) original image; (b) image after preprocessing; (c) binarized image; (d) simplified image; (e) crack dimension data.
Buildings 15 03214 g004
Figure 5. Crack width-depth relationship fitting: (a) equal-width crack; (b) wedge-shaped crack; (c) two-step crack; (d) three-step crack.
Buildings 15 03214 g005
Figure 6. Parametric models and corresponding geometric schematics of typical flexural cracks: (a) equal-width crack; (b) wedge-shaped crack; (c) two-step crack; (d) three-step crack.
Buildings 15 03214 g006
Figure 7. Long-term exposure test results: (a) surface chloride concentration; (b) concrete age reduction factor.
Buildings 15 03214 g007
Figure 8. Simulation results validation: (a) atmospheric zone; (b) splash zone.
Buildings 15 03214 g008
Figure 9. Modeling of crack morphologies and mesh refinement.
Buildings 15 03214 g009
Figure 10. Simulation results of chloride diffusion.
Buildings 15 03214 g010
Figure 11. Dynamic relative errors at constant crack widths: (a) crack width = 0.15 mm; (b) crack width = 0.25 mm; (c) crack width = 0.40 mm.
Buildings 15 03214 g011
Figure 12. Dynamic relative errors at constant crack depths: (a) crack depth = 10 mm; (b) crack depth = 20 mm; (c) crack depth = 35 mm.
Buildings 15 03214 g012
Figure 13. Peak relative errors of different crack morphologies: (a) variation with crack depth at different widths; (b) variation with crack width at different depths.
Buildings 15 03214 g013
Figure 14. Distribution of chloride concentration threshold and its quantiles.
Buildings 15 03214 g014
Figure 15. Micro-CT device for scanning concrete specimens.
Buildings 15 03214 g015
Figure 16. CT scan-based aggregate geometric modeling.
Buildings 15 03214 g016
Figure 17. Correlation analysis of crack dimensions: (a) sample observation data; (b) fitting analysis.
Buildings 15 03214 g017
Figure 18. Simulation results of chloride diffusion for case study.
Buildings 15 03214 g018
Figure 19. Assessment of rebar corrosion initiation based on guarantee rate: (a) atmospheric zone; (b) splash zone.
Buildings 15 03214 g019
Table 1. Composition of cement.
CompositionAlkali ContentFree CaOSiO2MgOSO3Chloride IonsLoss on Ignition
(%)0.772.160.791.922.050.0191.94
Table 2. Composition of fly ash.
CompositionFree CaOCaOAl2O3MgOSO3Fe2O3SiO2Loss on Ignition
(%)0.623.0324.120.550.635.7660.812.59
Table 3. Concrete mix proportion.
Water-to-Binder RatioCement
(kg)
Fly Ash
(kg)
Slag
(kg)
Fine Aggregate
(kg)
Coarse Aggregate
(kg)
Water
(kg)
Water Reducer
(kg)
0.312405018573010151464.98
Table 4. Key geometric parameters of typical flexural cracks.
ParameterSymbolMeanStandard DeviationCoefficient of Variation
Linear slope of crack width along crack depth α s −0.0087300
Ratio   of   the   second   step   width   to   w 0 (two-step) α 1 0.3870.1070.276
Ratio   of   the   second   step   width   to   w 0 (three-step) α 2 0.6130.0600.098
Ratio   of   the   third   step   width   to   w 0 (three-step) α 3 0.2540.0280.110
Ratio   of   the   first   step   depth   to   d 0 (two-step) β 1 0.3850.0820.213
Ratio   of   the   depth   where   the   second   step   begins   to   d 0 (two-step) β 2 0.4620.0990.214
Ratio   of   the   first   step   depth   to   d 0 (three-step) β 3 0.2560.0750.293
Ratio   of   the   depth   where   the   second   step   begins   to   d 0 (three-step) β 4 0.3130.0810.259
Ratio   of   the   second   step   depth   to   d 0 (three-step) β 5 0.6390.0990.155
Ratio   of   the   depth   where   the   third   step   begins   to   d 0 (three-step) β 6 0.6900.0980.142
Table 5. Simulation parameter settings.
Parameter 1:
Crack Morphology
Parameter 2:
Crack Width (mm)
Parameter 3:
Crack Depth (mm)
Equal-width0.1510
Wedge-shaped0.2015
Two-step0.2520
Three-step0.3025
/0.3530
/0.4035
Table 6. Parameter combination setting.
Parameter CombinationCrack Initiation Width (mm)Crack Depth (mm)
10.1005
20.12510
30.15015
40.17020
50.20025
60.22030
70.25036
Disclaimer/Publisher’s Note: The statements, opinions and data contained in all publications are solely those of the individual author(s) and contributor(s) and not of MDPI and/or the editor(s). MDPI and/or the editor(s) disclaim responsibility for any injury to people or property resulting from any ideas, methods, instructions or products referred to in the content.