Article

Seismic Performance Evaluation of 3D-Printed Concrete Walls Through Numerical Methods

by
Alexandros Chortis
,
Charalampos Gkountas
,
Lazaros Melidis
and
Konstantinos Katakalos
*
Laboratory of Experimental Strength of Materials and Structures, Aristotle University of Thessaloniki, 54124 Thessaloniki, Greece
*
Author to whom correspondence should be addressed.
Buildings 2025, 15(17), 3205; https://doi.org/10.3390/buildings15173205
Submission received: 15 July 2025 / Revised: 21 August 2025 / Accepted: 2 September 2025 / Published: 5 September 2025
(This article belongs to the Section Building Materials, and Repair & Renovation)

Abstract

Increasing labor costs, labor shortage, high environmental impact, and low productivity levels are the main reasons that have led the construction industry to search for sustainable alternatives to conventional traditional construction techniques, such as Additive Construction. Large-scale concrete 3D printing has emerged as a viable alternative, which can address these major challenges. Through the high material efficiency, design flexibility, and automation levels provided, 3D printing can revolutionize the way buildings are designed and built. The seismic behavior of 3D-printed load bearing elements remains generally underexplored. To that scope, the structural design of a two-story building is investigated. The proposed methodology involves finite element models and stress analysis of critical structural members. The performance of the studied walls is further investigated using 3D solid element models and nonlinear constitutive laws to validate structural adequacy. Different printing patterns and structural details of unreinforced and reinforced 3D-printed concrete walls are analyzed through parametric analyses. The results indicate the acceptable response of 3D-printed load bearing elements, under certain construction configurations, as required by the existing regulatory framework. The proposed methodology could be applied for the design of such structures and for the optimization of printing patterns and reinforcing details.

1. Introduction

The construction industry has been facing three major problems that hinder its evolution: (a) low productivity growth, making it one of the least technologically advanced sectors; (b) significant environmental footprint; and (c) labor shortage and increasing labor costs [1]. Despite introducing innovative workflows, traditional construction practices remain far from achieving the high levels of efficiency, scalability, and sustainability observed in other industrial sectors [2,3,4,5,6,7,8,9,10,11,12]. Additive manufacturing (AM), commonly referred to as 3D printing, is emerging as a promising alternative to traditional techniques. Large-scale additive manufacturing methods, such as 3D printing using concrete, have emerged as innovative technologies with the potential to tackle several major challenges that the construction industry faces [13]. By reducing construction time, ensuring sustainability, and reducing the sector’s reliance on labor work, AM can revolutionize the way residential and non-residential buildings are designed and constructed [14,15,16]. Concrete 3D printing can address many of the inefficiencies of traditional construction through the elimination of any kind of formwork and the significant reduction of material waste—since the material is deposited only where needed—and the high geometric flexibility [17,18]. Moreover, the digital nature of the process allows for high levels of automation, optimization, and on-demand customization, while offering a faster, more sustainable, and a more cost-effective construction technique [19,20].
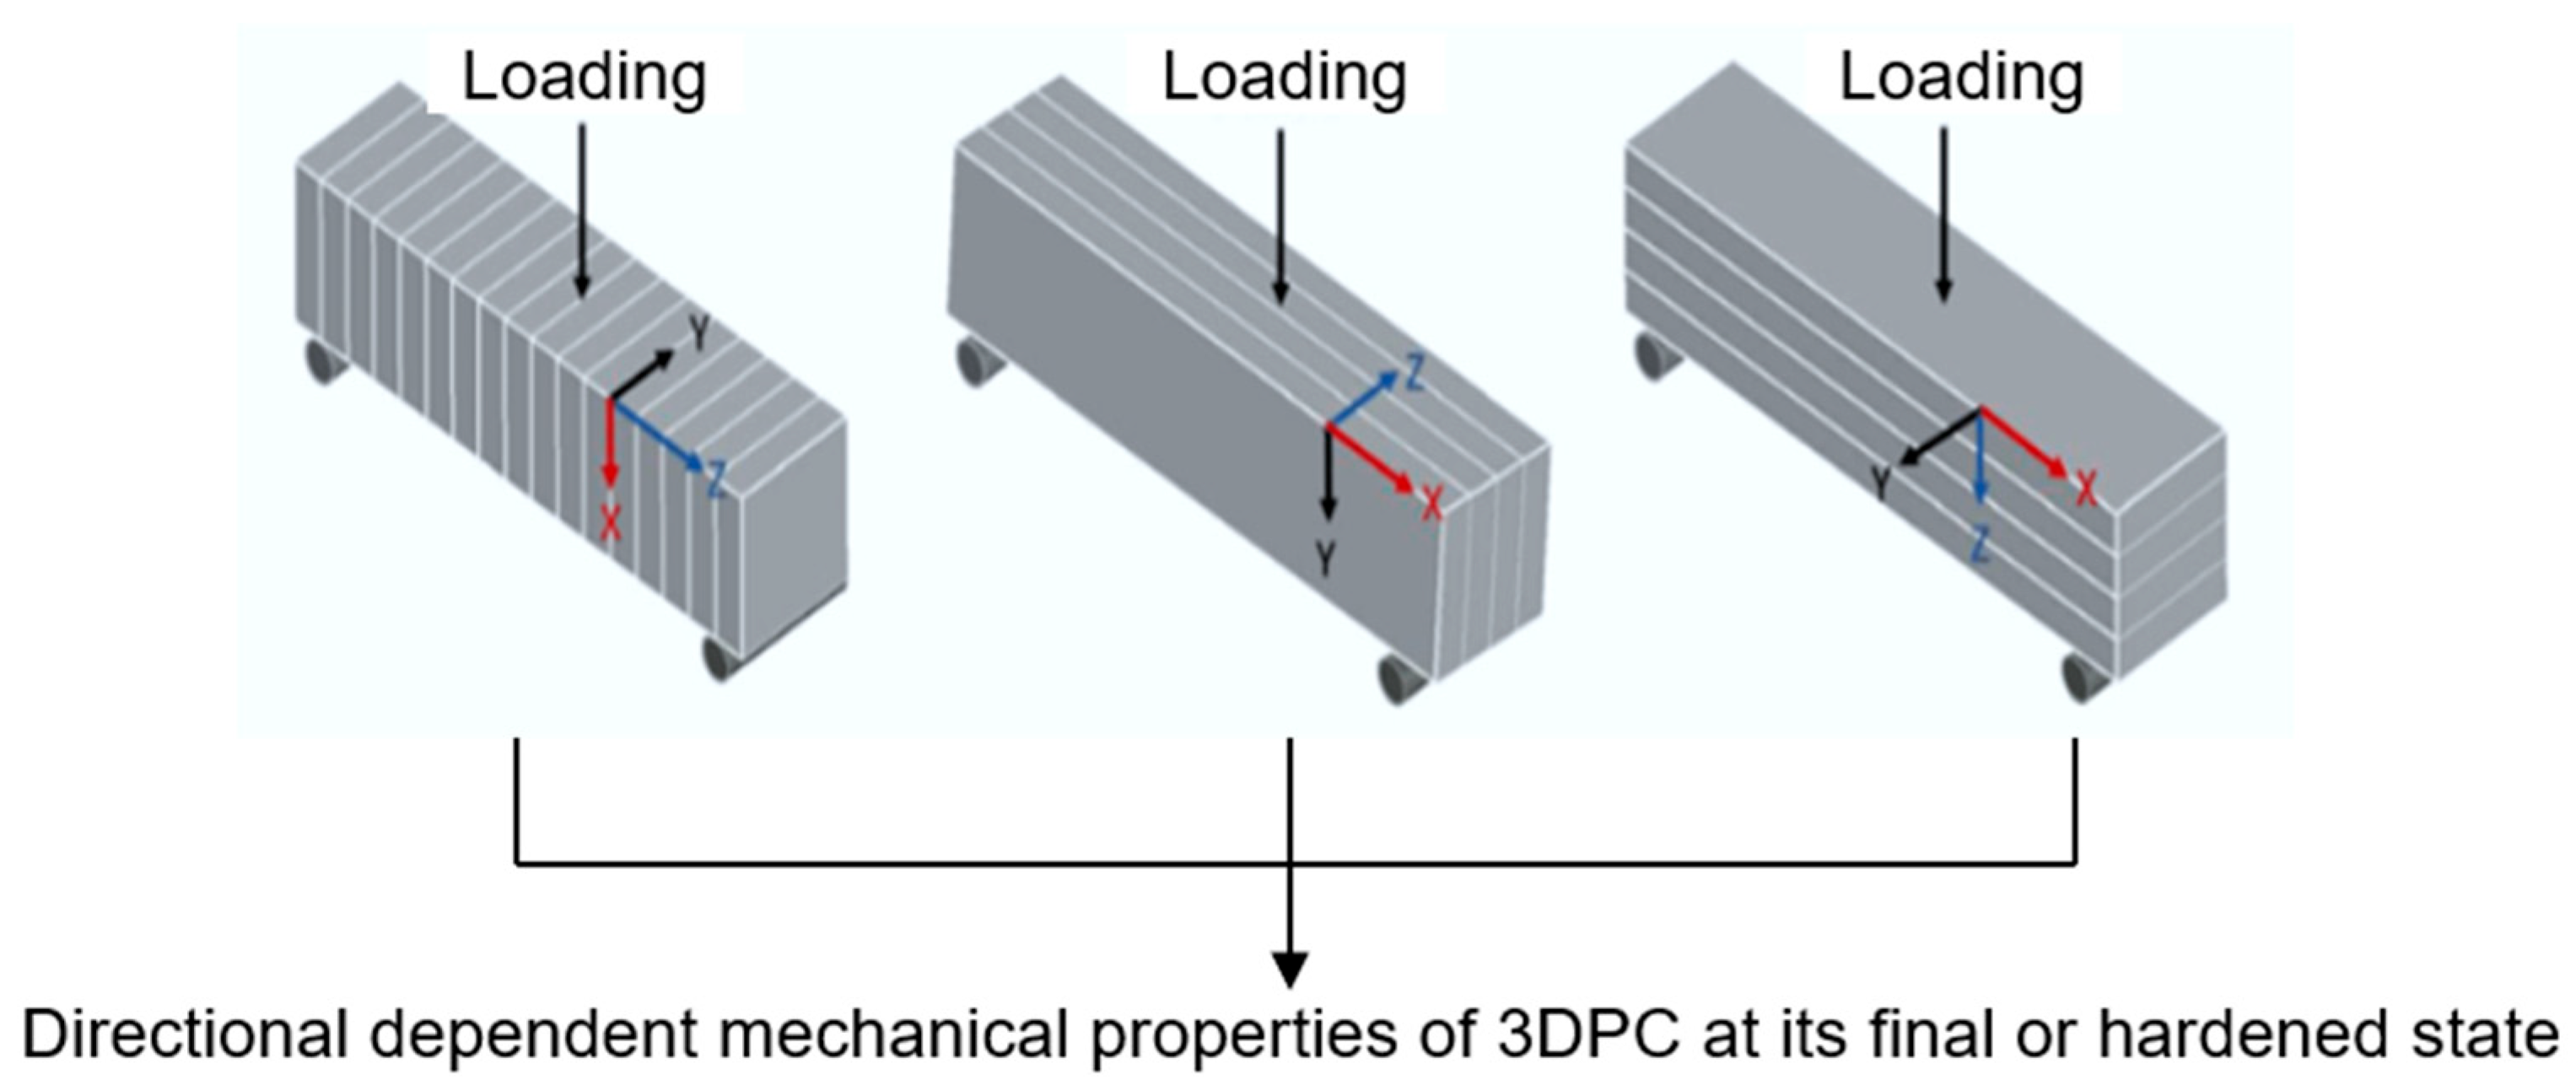
Several experimental studies have focused on the mechanical behavior of 3D-printed concrete (3DPC) at both the material and component levels. Wolfs et al. studied the failure mechanisms of 3D-printed concrete walls during the printing process and found out that walls exhibit two dominant failure modes: elastic buckling and plastic collapse at their base [21]. The governing failure mechanism strongly depends on the wall’s geometrical dimensions, as well as on the rheological properties of the fresh concrete mix, such as the mixture’s plastic viscosity and yield stress. The same researchers also examined the behavior of 3DPC in its hardened (or final) state, emphasizing the effects of layer orientation with respect to the loading direction (Figure 1), interlayer interval time, and surface dehydration [22]. The experimental results show that 3DPC’s compressive strength is not significantly affected by layer orientation, despite varying several of the printing process parameters such as nozzle height, interval time, and surface dehydration. The tensile tests that were conducted revealed that there were no significant differences in strength among the three possible layer orientations. Moreover, it was found that the compressive strength of the same bulk cast concrete material is reduced by approximately 30% when the mixture is deposited in layers through 3D printing. Anisotropy regarding the mechanical properties of 3DPC was also investigated by Panda et al., who used a geo-polymer based concrete mixture and found that the mechanical properties significantly vary with respect to the orientation of the printed layers [23]. Similarly, Le et al. reported that, in high-performance printed concrete, the compressive and tensile strengths exhibit a decrease of around 15% and 40%, respectively, when the loading was perpendicular to the layers [24]. Moreover, BESIX 3D reports that the compressive strength of 3D-printed concrete in the three orthogonal directions can be reduced up to 20–30%, compared to conventional cast-in-place concrete, in agreement with previous experiments [25]. Structural behavior of printed concrete differs from conventionally cast-in-place concrete’s, primarily due to its anisotropic mechanical properties and the limited interlayer bonding. This will be of high significance during the finite element analysis to be conducted during the following phases of this manuscript.
Experimental investigation of 3D-printed structural members is currently limited. As in reinforced concrete elements and structures in general where reinforcing rebars are used to resist tensile stresses, the same philosophy is applied to 3DPC. Wang et al. tested 3D-printed concrete walls under eccentric compressive axial load [26]. The low bond strength between layers adversely affects the wall’s load bearing capacity, while increasing the steel reinforcement improves the element’s ductility, but not its ultimate load bearing capacity. Other studies have attempted to address these limitations by integrating hybrid 3DPC wall configurations, which combine printed concrete with cast-in-place reinforced concrete (RC). Delavar et al. proposed a wall system integrating RC boundary elements and horizontal mesh reinforcement to provide the necessary strength under in-plane seismic loads [27]. It was found that reducing the vertical spacing of bed-joint reinforcement increases the shear strength of the 3DPC walls. The aspect ratio of the wall defines the failure mechanism, since shorter walls exhibited diagonal shear failure, while slender walls were more prone to a flexural type of failure. The same authors also conducted a performance-based design approach and developed analytical strength prediction equations for typical failure mechanisms including flexural, diagonal shear, and shear sliding failures [28]. Liu et al. combined experimental and numerical investigation of 3D-printed reinforced concrete walls subjected to quasi-static cyclic loading [29]. Failure does initiate at the interlayer interfaces with the embedded rebar due to increased stress concentration and poor bond strength. The initial failure was then developed into X-shaped shear cracks (diagonal tension).
Present research efforts are limited to studying individual 3DPC elements, while there is currently no study based on a structure-level model. Even the current structural design codes (Eurocodes 2, 6, and 8) do not apply to these structures. Thus, a methodology to simulate and design a 3D-printed structure is presented in this paper. The demand forces are quantified via a shell element model using SAP2000 Ultimate 26.0.0. The design of the structural elements is conducted in terms of stresses, due to in plane and out of plane loads. The performance of the structural members studied is further assessed by 3D numerical models using ABAQUS/CAE 2022 to validate the design methodology. Moreover, parametric analysis of the seismic response for different printing patterns and structural details is conducted. The results obtained are assessed in order to ensure structural integrity and optimize the structural performance.

2. Methodology

This manuscript describes a methodology for the design of 3D-printed structures. The proposed methodology aims to gap the lack of regulatory frame and serve the need for structural analysis of low- and mid-rise 3D-printed buildings. Modelling and analyzing the structure followed the relative procedure adopted for load bearing masonry systems [30,31]. The structural system was simulated with 2D shell elements using SAP2000. Earthquake actions were introduced using the design spectrum proposed by EN 1998-1 [32]. The demand forces/moments were quantified by Response Analysis Spectrum. The structural adequacy of the examined components was checked in two ways. Firstly, checks were carried out based on the theory of strength of materials, using simplified analytical equations. Subsequently, more complex nonlinear simulations were conducted in order to further validate the evaluation of the load bearing capacity. The study aims to provide invaluable insight into the potential of constructing 3D-printed concrete buildings in regions with high seismic activity. To that scope, both unreinforced and reinforced 3DPC walls were examined with different printing patterns and reinforcing details, and their performance was compared in terms of strength, mode of failure, and ductility.

2.1. Two-Story Prototype Building

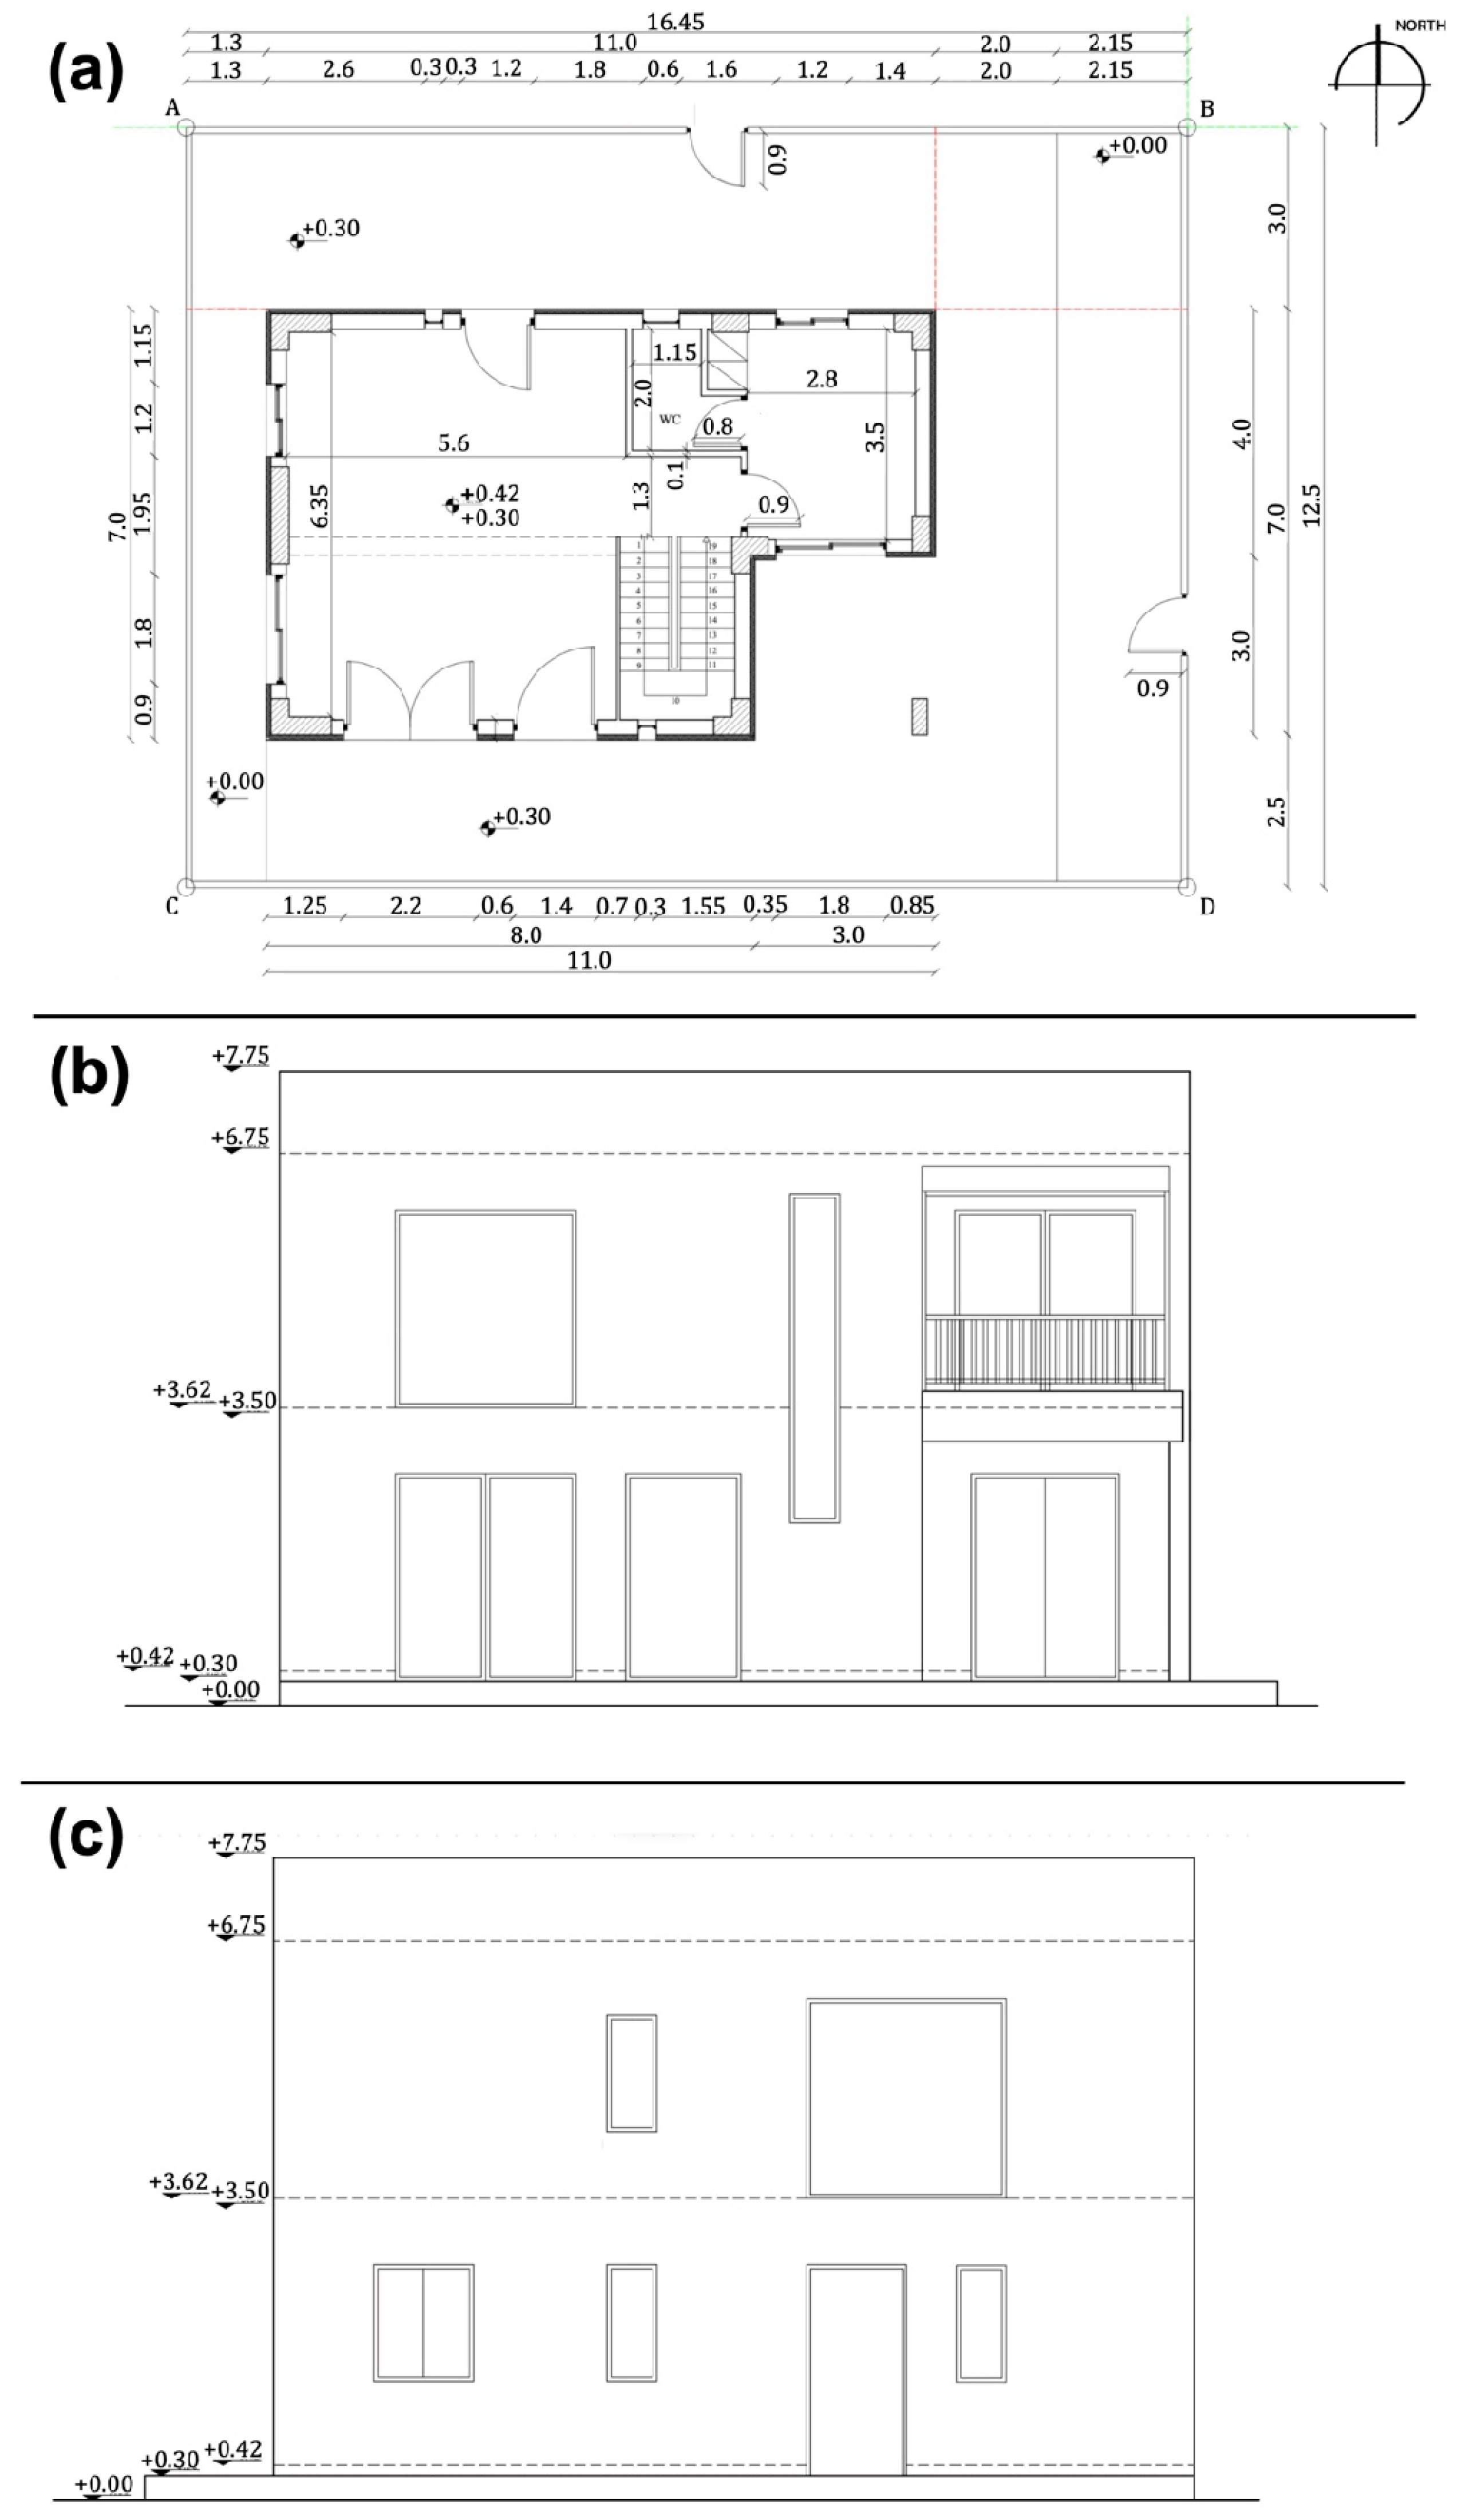
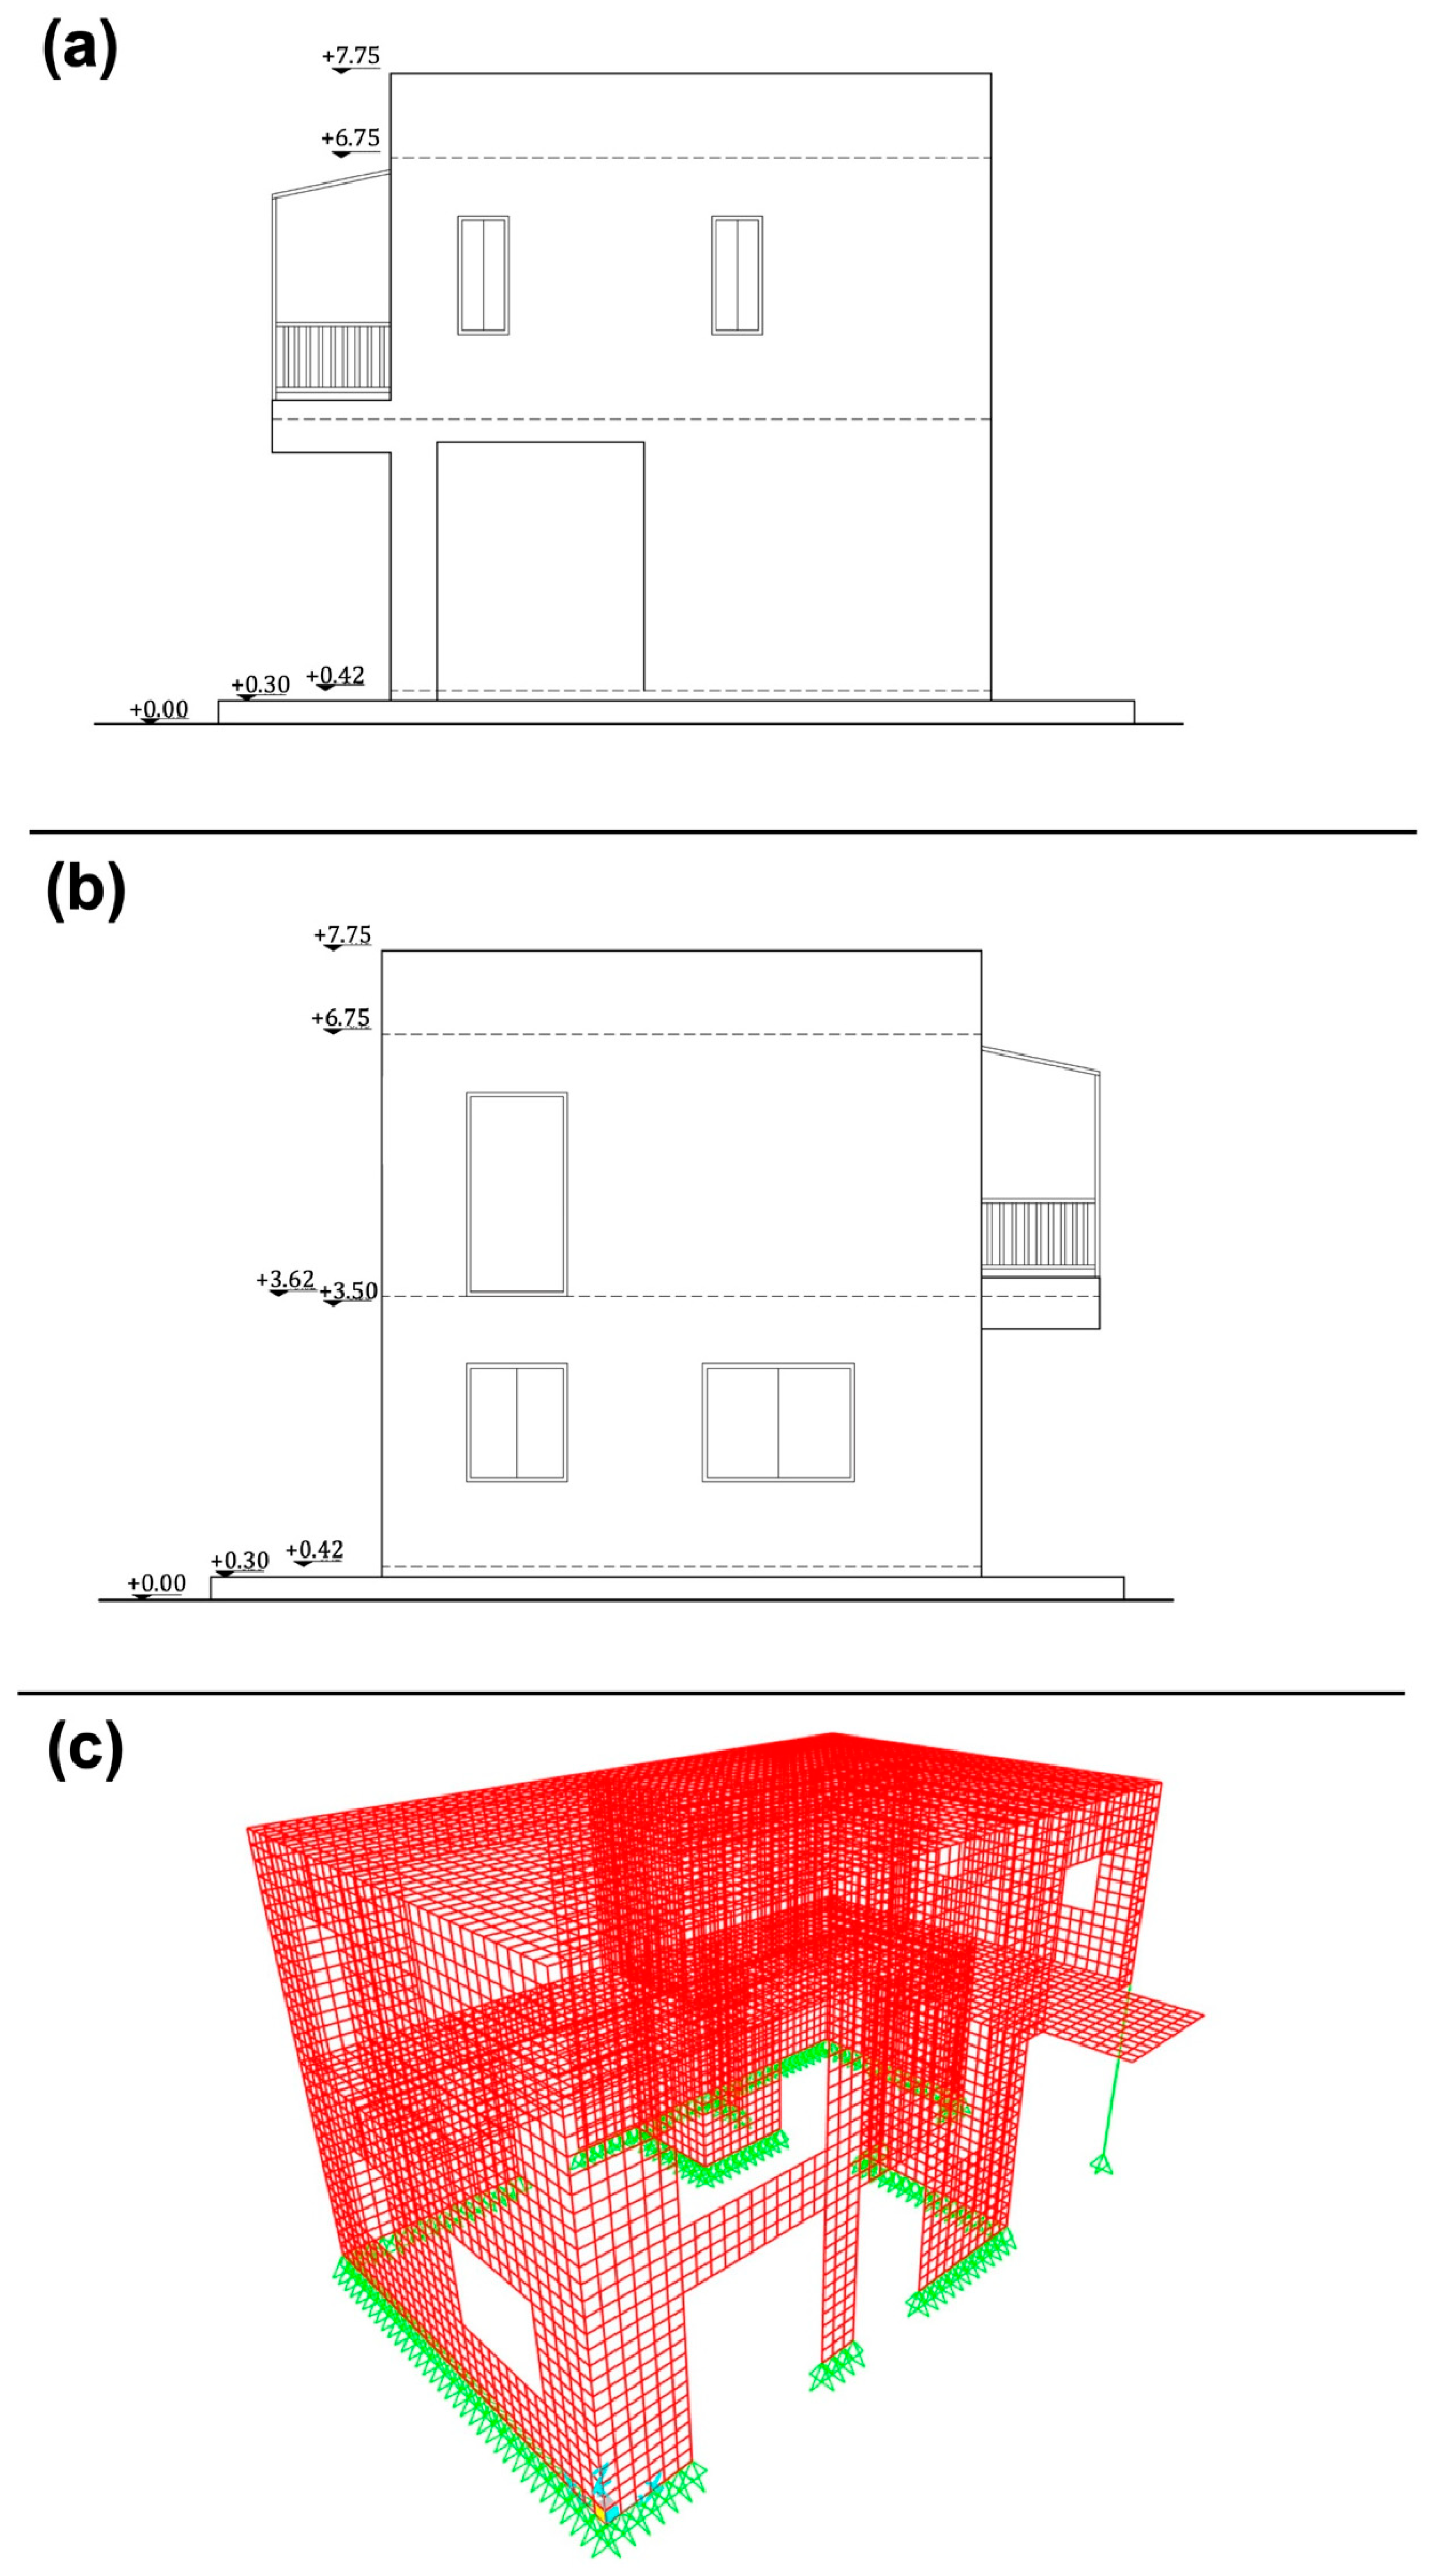
In this section, a full-scale prototype two-story building, where all perimeter walls are composed primarily of 3D-printed concrete, was used as a case study building. The scope includes the modelling and analysis of a full-scale prototype two-story building, where all perimeter walls were composed primarily of 3D-printed concrete. The architectural drawings (plan and elevation views) of the prototype two-story building are presented in Figure 2 and Figure 3a,b. All architectural features such as window openings, floor slabs, etc., were included in the model to ensure a realistic representation. The numerical model of the 3DPC two-story building using shell elements in SAP2000 is presented in Figure 3c.
The modulus of elasticity for the shell elements representing the 3D-printed concrete walls was set to 33 GPa, which is a typical value for C40 class-printed concrete, while effective cross-section properties were used. The thickness of the walls was 250 mm. Translational degrees of freedom were restrained at the bottom of the building’s joints (hinge boundary conditions).
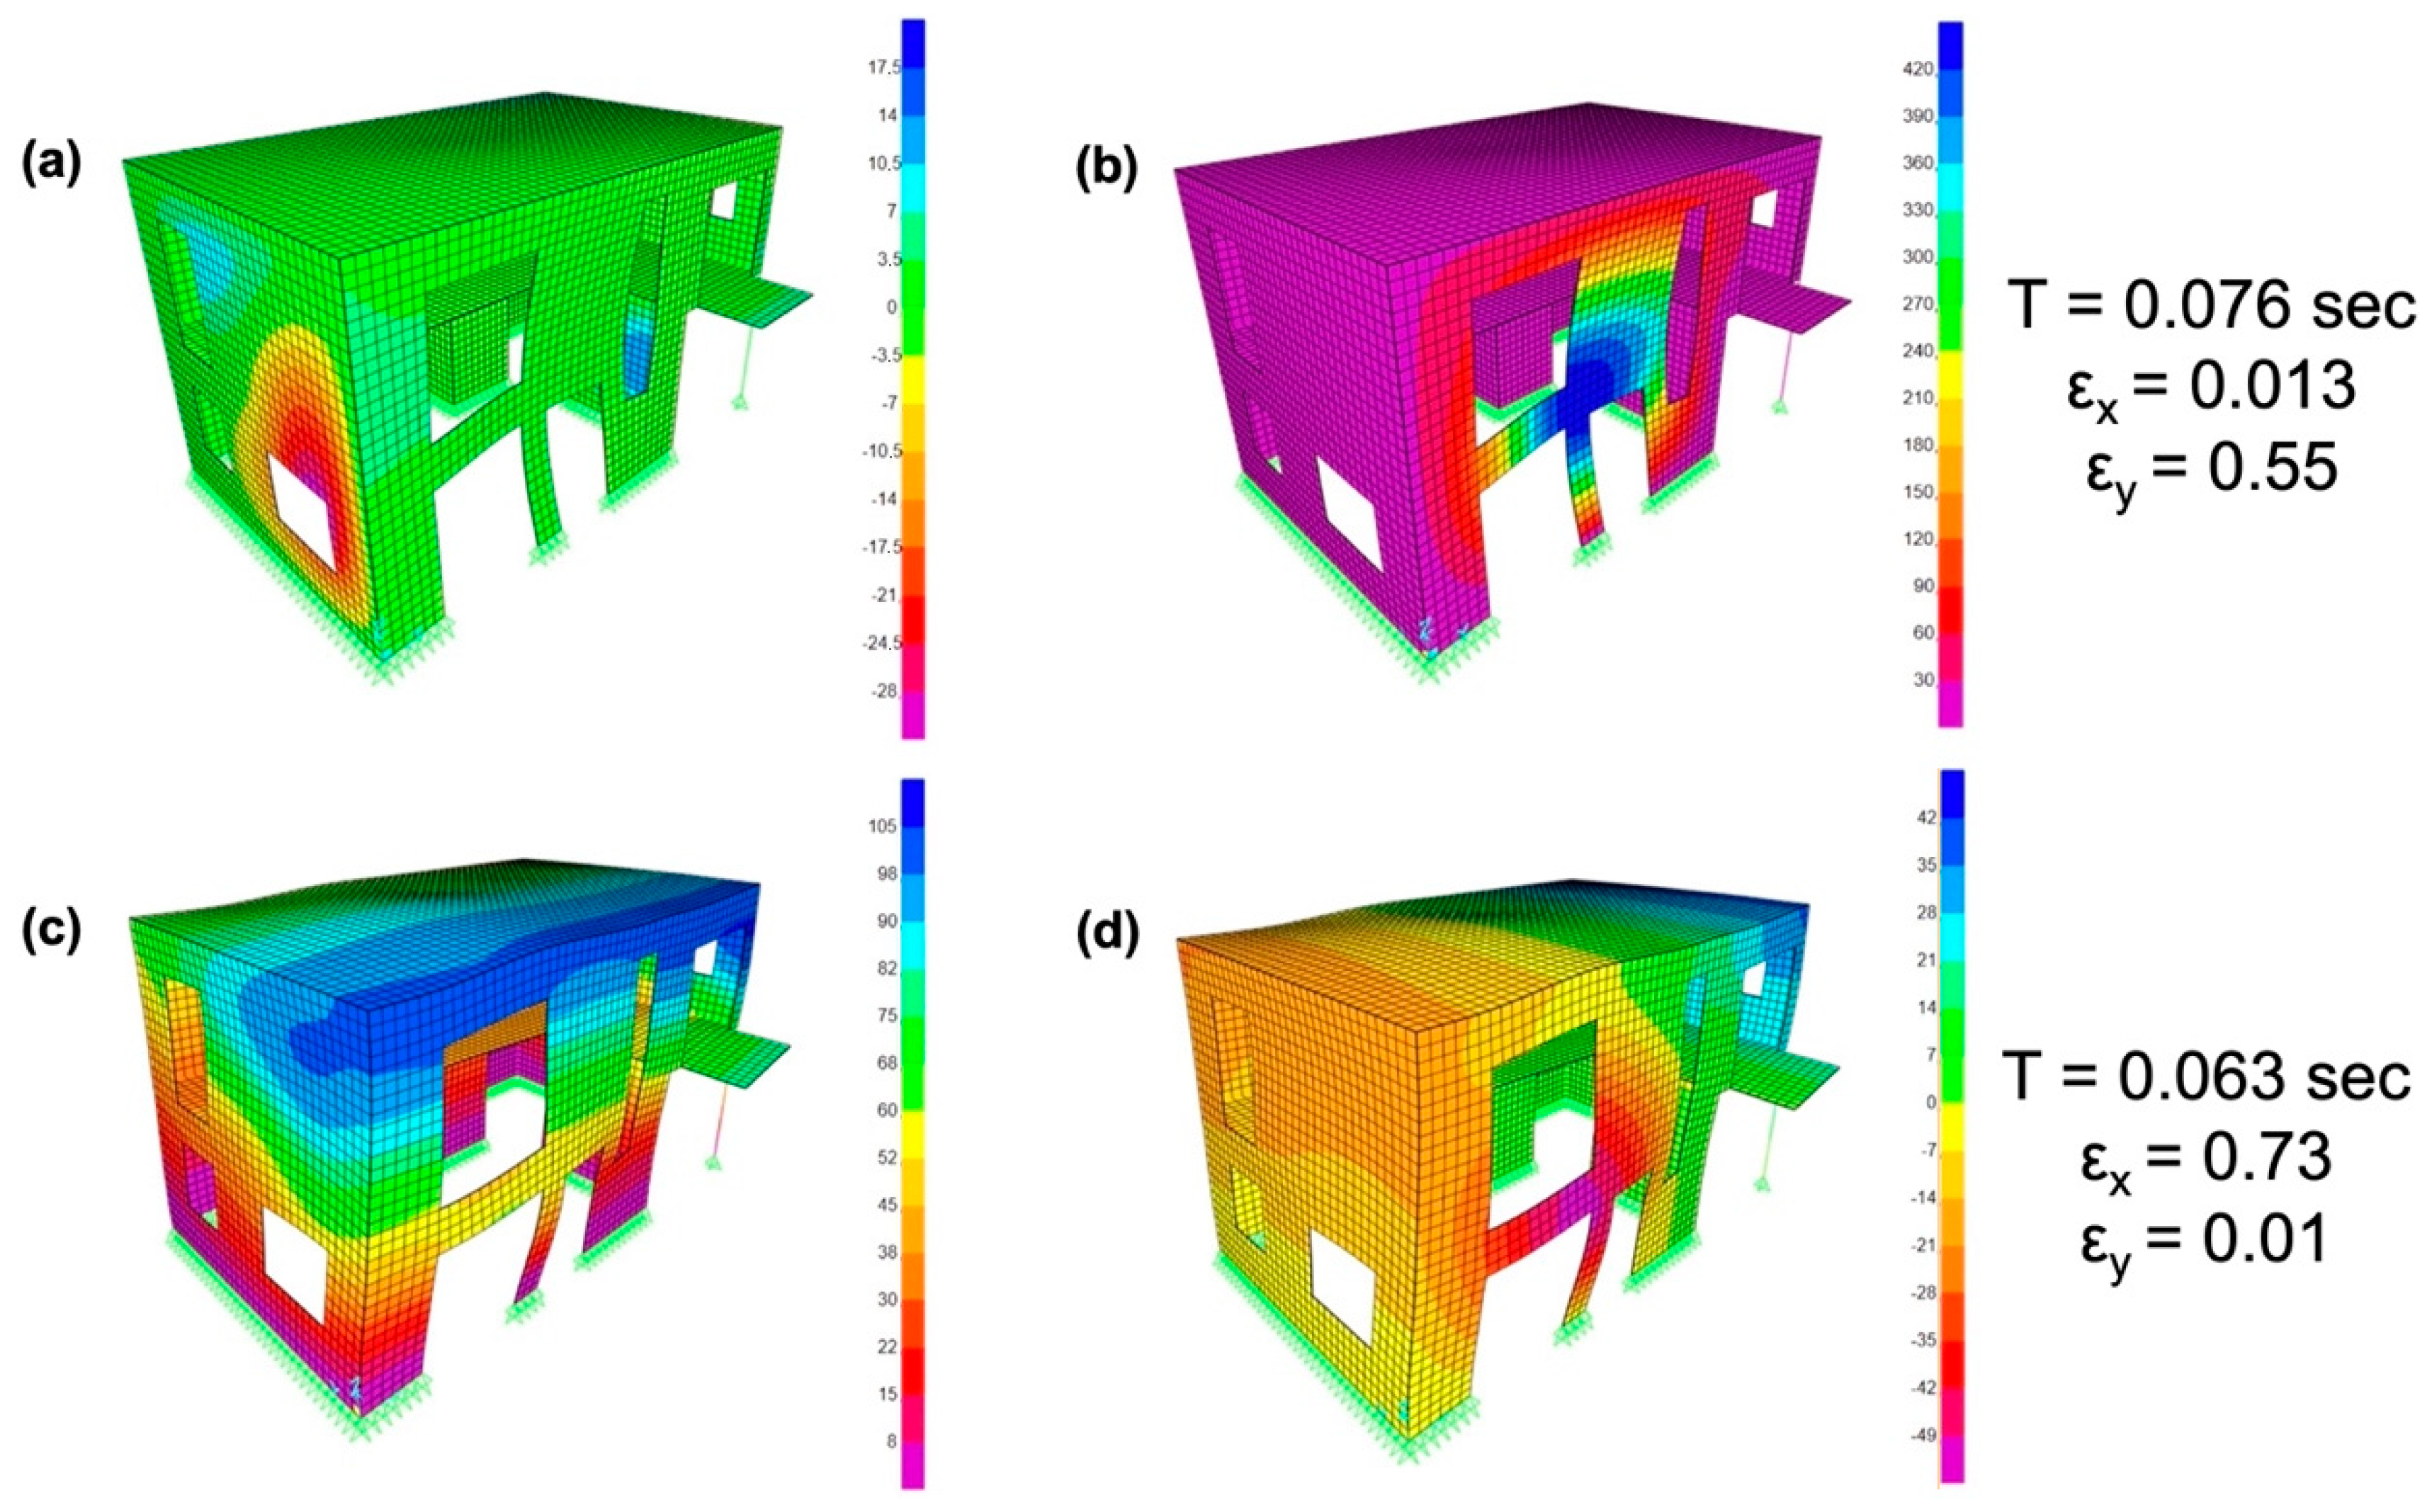
Regarding the applied vertical loads, additionally to the self-weight of the structural components, an additional permanent load g of 1.2 kN/m2 was applied to the interior floor areas, and 2.0 kN/m2 was considered for the roof and cantilever slab. The imposed live load q was set to 2.0 kN/m2 for interior spaces, 5.0 kN/m2 for the cantilever slab, and 0.5 kN/m2 for the roof, in accordance with EN 1991-1-1 [33] for residential buildings. Seismic actions were expected to be the most unfavorable. Leading to a design ground acceleration 0.36 g. To determine the Design Spectrum according to Eurocode 8, type 1 (high seismicity), soil type B, and importance factor 1.0 were chosen, referred to a residential building in Lefkada, one of the most seismically active regions in Greece, to assess the structural performance under severe seismic demands. Regarding the behavior factor q, the value of 1.50 was used, corresponding to the behavior of unreinforced masonry systems. The building’s fundamental periods lie within the plateau or rising portion of the response spectrum; thus, the design accelerations were found to be relatively high (Figure 4). Accidental eccentricity was also accounted for in accordance with EN 1998-1, by applying the shift of ±5.00% of the building’s plan dimensions. In order to capture biaxial earthquake effects, as stated in EN 1998-1, seismic actions were defined in the model using the following load combination format:
G   +   0.3 Q   ±   E E d x   ±   0.3 E E d y
and
G + 0.3 Q   ±   0.3 E E d x   ±   E E d y
where G are the dead loads, Q are the live loads, E E d x is the design seismic loading in the X horizontal direction, and E E d y is the design seismic loading in the Y horizontal direction.
The vertical base reaction is predicted to be equal to 2387.95 kN (seismic combination G + 0.3Q), while the horizontal seismic load values are 697.73 kN and 604.66 kN for the two horizontal perpendicular directions. The predicted development of stresses on the structure was used to locate concentrations and structural elements with high demand forces. Internal forces and moments were calculated using “Section Cuts”. These reference walls were first evaluated assuming unreinforced 3D-printed walls. In case the demands exceed the unreinforced wall’s bearing capacity, under the prescribed seismic loads, an alternative wall design was implemented. The revised design included reinforced boundary elements made from cast-in-place concrete, with longitudinal and transverse reinforcing rebars, implemented to increase flexural and shear strength and ductility. Also bed-joint reinforcement was embedded between the 3D-printed concrete layers to improve in-plane and out-of-plane capacity and to ensure stability during the printing process. The proposed hybrid wall system shares three conceptual and behavioral similarities with concrete block masonry (CBM) walls: (a) steel-reinforced boundary elements, (b) vertical concrete blocks, and (c) weak horizontal interfaces. As such, the design philosophy adopted in this study was based on the existing knowledge of CBM walls, while it was adapted to the unique features of 3D-printed concrete.
The proposed design methodology initiated with analytical equations. Since the suggested wall designs feature complex geometries, the use of conventional strength of materials formulas to analytically calculate normal and shear cross-sectional stresses require the determination of the geometric properties of all complex wall configurations. The complex geometric properties were calculated through the computer-aided design software Autodesk Inventor Professional 2025. Hence, the following strengths of materials as shown in Formulas (3)–(6) were used:
σ N =   F 3 A
σ M 2 = ±   M 2 W 2
σ M 1 = ±   M 1 W 1
τ = F 2 A
where F 3 is the section’s axial force, F 2 is the shear force, M 2 is the in-plane bending moment, M 1 is the out-of-plane bending moment, A is the cross-sectional area, W 2 is the in-plane elastic section modulus, W 1 is the out-of-plane elastic section modulus, σ N is the normal stress due to the axial force, σ M 2 is the normal stress due to the in-plane bending moment, σ M 1 is the normal stress due to the out-of-plane bending moment, and τ is the shear stress.
Considering the simultaneous action of the axial force and in-plane and out-of-plane bending moments, Equations (7) and (8) were derived:
σ N + M 2 =   F 3 A ± M 2 W 2
σ N + M 1 = F 3 A ± M 1 W 1
where σ N + M 2 is the resultant normal stress due to the axial force and in-plane bending moment, and σ N + M 1 is the resultant normal stress due to the axial force and out-of-plane bending moment.
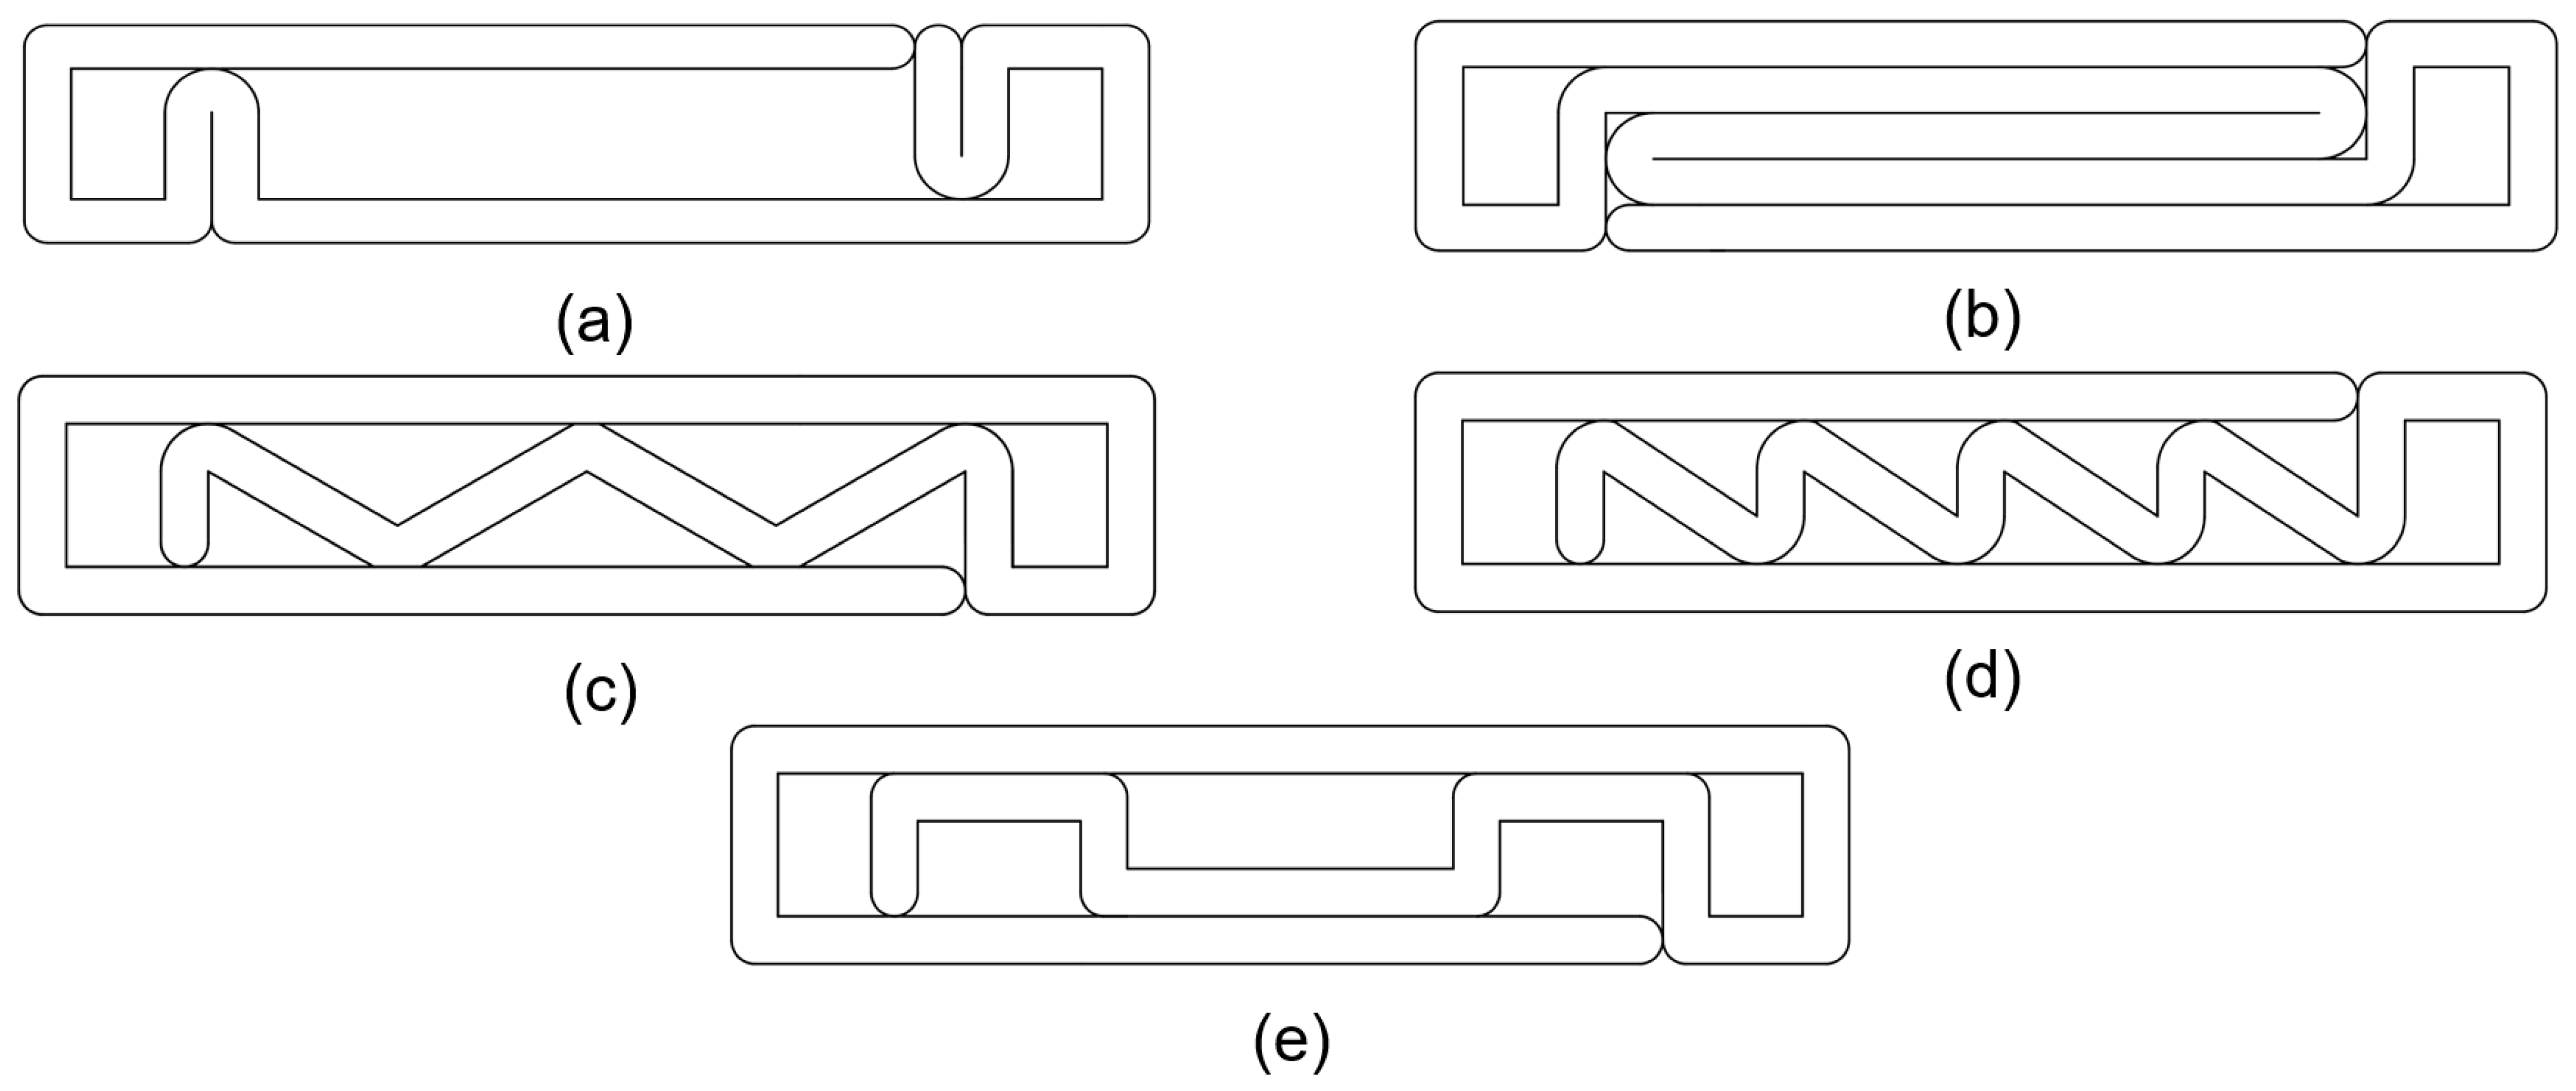
The suggested procedure is considered as a preliminary quick estimation of whether the unreinforced 3DPC wall is likely to fail under the applied loads. The different printing patterns examined are depicted in Figure 5. Although the analytical methodology was applied for all five infill patterns, only patterns IV and V are presented in this paper, as the analytical procedure remains identical across all patterns and presenting the full set of patterns would not offer additional insights and would unnecessarily increase the volume of the work.

2.2. Finite Element Modelling of 3DPC Walls

Considering the lack of analytical design equations for 3DPC elements in design codes, to further examine the structural performance of 3D-printed walls, nonlinear finite element analyses were conducted using the software ABAQUS. The reference wall models were subjected to the internal forces derived by the examined case study (Section 2.1 and Section 3.1). The volume of the printed concrete was represented by solid finite elements. For its nonlinear response, a Concrete Damaged Plasticity (CDP) law was developed by the authors using the parameters presented in Table 1. Two concrete classes considered were C40 and C60. In case the section is adequate using concrete class C40, then the higher class will not be checked against failure. According to EN 1992-1-1 [34], these classes correspond to a mean compressive strength f c m of 48.0 MPa and 68.0 MPa, respectively, and mean tensile strength f c t m of 3.5 MPa and 4.4 MPa, respectively.
Due to the lack of anisotropic concrete models, an equivalent isotropic concrete material was considered. Although 3D-printed concrete exhibits anisotropic mechanical behavior due to weak interlayer bonding, in this study, the material was modeled as isotropic with reduced compressive and tensile strength values, in line with experimental findings [21,22,23,24,25,26,27,28,29]. As such, a mean compressive strength of 3DPC f p c m was considered to be 75% of the same cast-in-place concrete mixture f c m . Similarly, regarding tensile strength, it has been a common practice for several years to assume that, for cast-in-place concrete, f c t m     10 %   f c m . However, due to the presence of weak horizontal interfaces and the reduced cohesion between layers, the authors conservatively considered the mean tensile strength of 3DPC f p c t m as 7.5% of the already reduced compressive strength f p c m . To further validate the reliability of using an isotropic material with reduced strength, several of the presented experimental findings were modelled prior to the simulations presented in this study, and the numerical results were in good agreement with the experimental findings [21,22,23,24,25]. Although this modelling technique neglects direction-dependent behavior, it provides a conservative and efficient approach for structural-level simulations. In fact, the given simplification allows for the evaluation of the structural-scale behavior without explicitly modeling the anisotropy of 3DPC. While cohesive zone models or tie-break elements are sometimes used in recent studies (e.g., [29]), this level of modeling detail would significantly increase the computational cost unnecessarily. Such approaches have been used when aiming to capture delamination and interfacial sliding in 3D-printed elements. Future research could incorporate interface elements for a more detailed representation of interlayer behavior, particularly in cases where the research focuses on material-level fracture mechanics and when experimental calibration data are available.

3. Results

3.1. Two-Story Prototype Building Response Spectrum Analysis

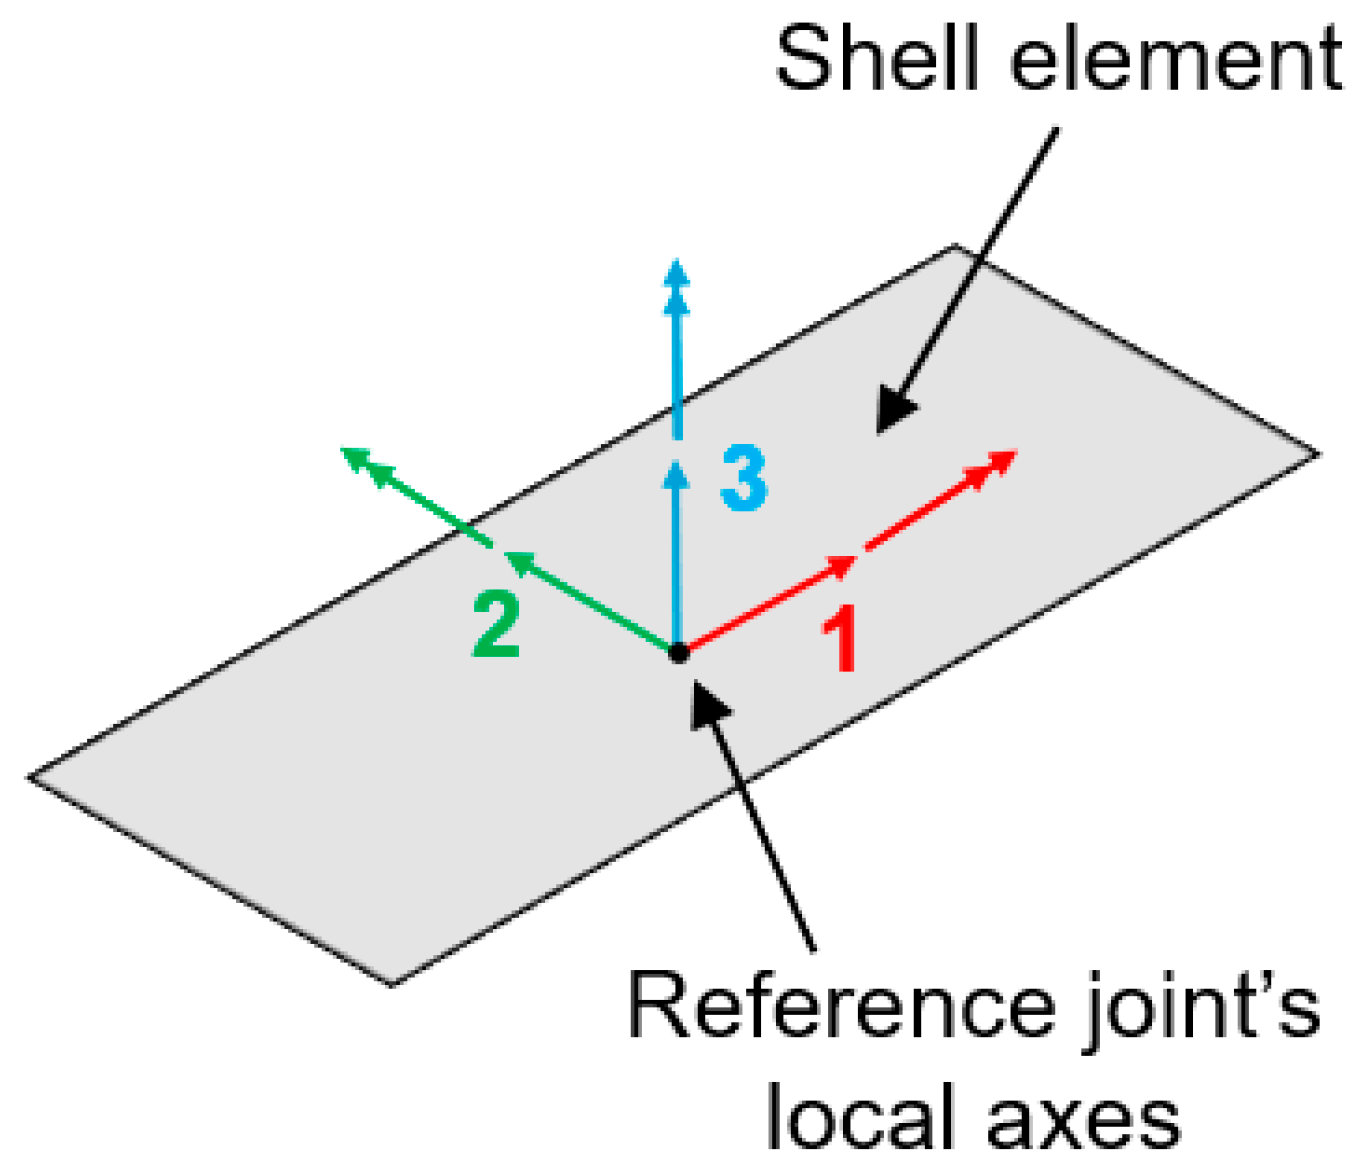
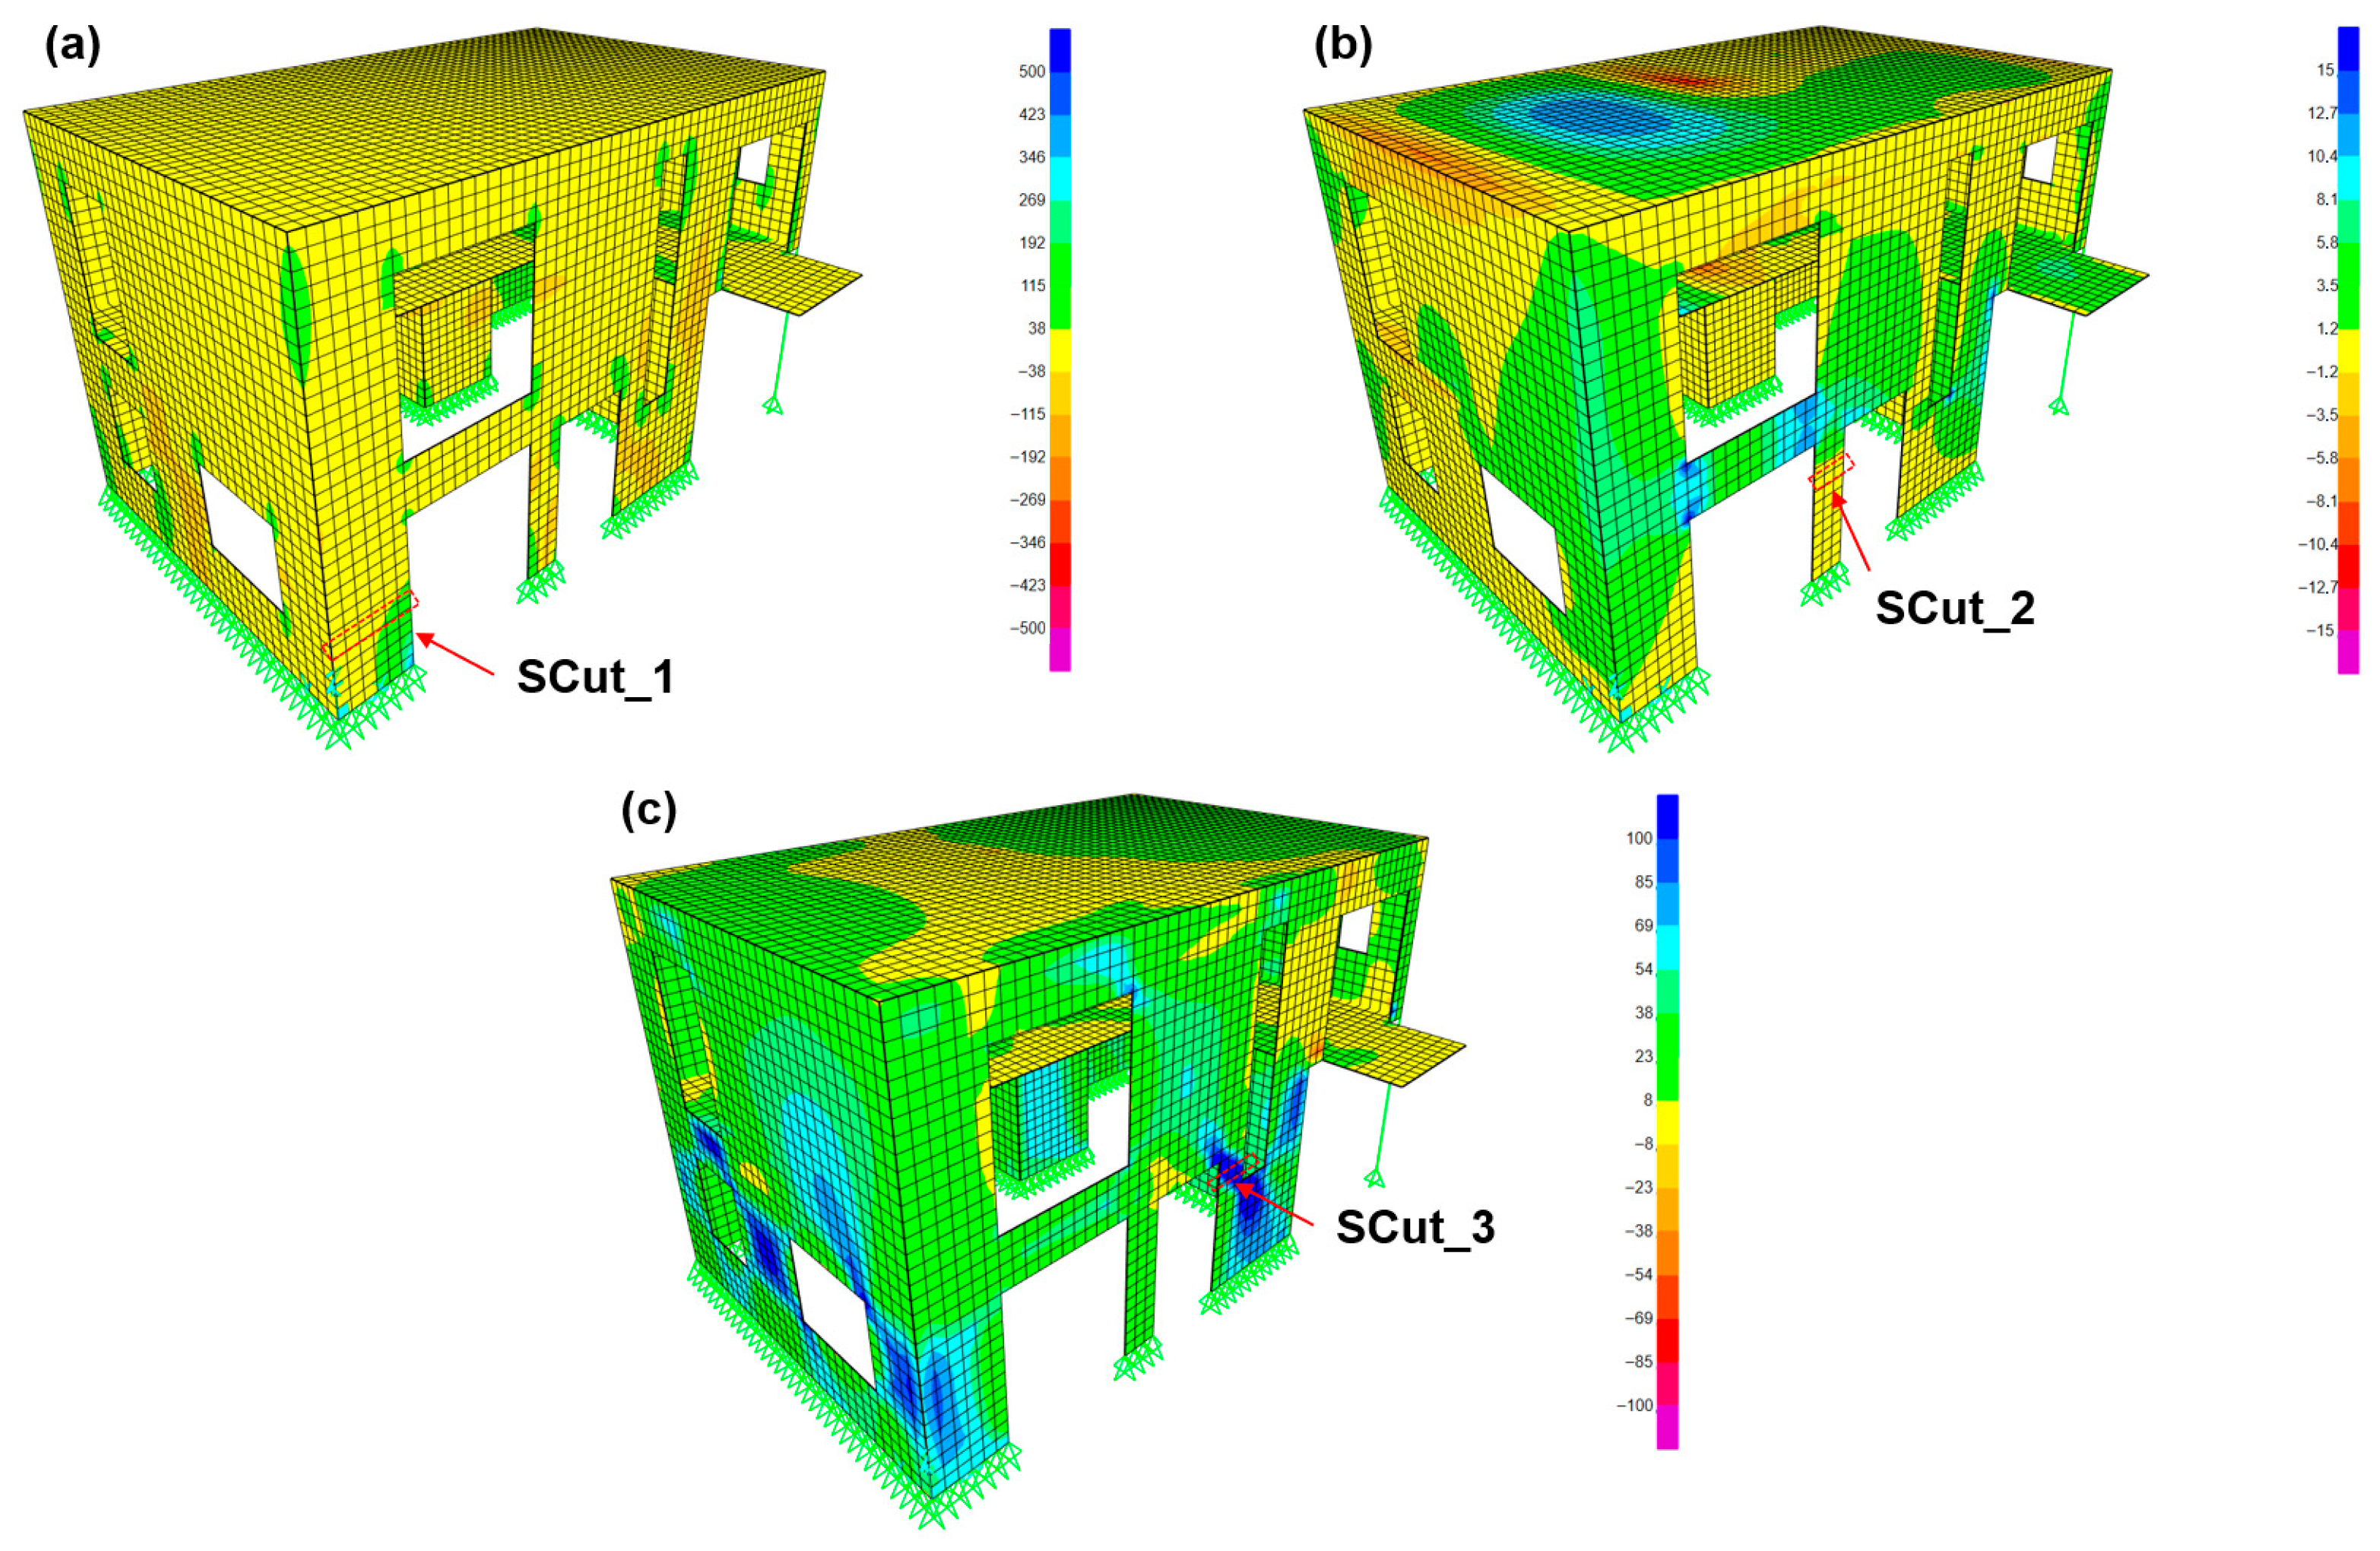
Shells’ local axes used for the representation of the shell section’s internal forces are illustrated in Figure 6. The elastic modal response spectrum analysis of the prototype building within SAP2000 outputs both stress distributions and stress-resultant forces along wall segments, as presented in Figure 7. Several cross-sections were evaluated, and the three most critical of them are presented and further investigated in the following sections of this manuscript. These critical cross-sections are identified mainly in the building’s front side, due to the high number of openings, which result in local stress concentration. Shell-resultant forces are plotted in Figure 7 and the three critical cross-sections (“SCut_1”, “SCut_2”, and “SCut_3”) are highlighted. Notably, these three locations were not selected based solely on high numerical stress, but rather by considering the combined effect of local stress concentration and overall structural response. Specifically, cross-sections were extracted in these areas where the combination of axial, bending, and shear demands is critical, and where the wall’s deformation and internal force demands suggest the most unfavorable behavior under seismic loading. Therefore, the selected cuts aim to represent the most structurally demanding conditions rather than isolated local maxima.
In accordance with Eurocodes, the internal forces οf the critical cross-sections were used as load cases for the analysis of the 3D-printed concrete walls initially utilizing an analytical methodology and eventually the nonlinear finite element analysis software ABAQUS CAE, as presented in the following Section 3.2 and Section 3.3, respectively. The internal force demands of the three reference cross-section cuts are presented in Table 2. For each section, two sets of internal force values were extracted, corresponding to the positive and negative directions of seismic loading.

3.2. Analytical Evaluation of Walls’ Response

The next phase of the study focuses on examining whether unreinforced 3D-printed concrete walls can withstand the internal forces that were identified, following the methodology described in Section 3.2. The applied loads used in the analytical assessment correspond to the internal force demands that were identified in Table 2. A parametric analysis was conducted, as five different cross-sectional geometries were considered, representing the different printing patterns that are commonly used in large-scale concrete 3D printing. Moreover, the printed concrete classes C40 and C60 were used for the design. The different five wall infill patterns for a printed layer width equal to 50 mm are illustrated in Figure 5. The two vertical edges of the walls are seen as hollow, as these regions are intended to be filled with cast-in-place concrete in future phases of this work.
The proposed methodology was applied for walls featuring infill patterns IV and V. The geometric properties of the three section cuts, modelled using the two patterns, are summarized in Table 3. Section cuts “SCut_2” and “SCut_3” shared the same geometrical properties, as both have an outer length of 600 mm, while “SCut_1” was 1200 mm long. All three section cuts had a total width of 250 mm, and the selected printed concrete layer width was set to 50 mm. Normal and shear stress distributions for each cross-section, evaluated at the free end of the wall where the loads were applied, are summarized in Table 4.
Based on Table’s 4 results, since the absolute stress values are lower than the material strengths (for C40 class-printed concrete), failure is not expected at the free end of any reference wall—where the internal forces of Table 2 act—under either of the two applied load sets. The results are summarized in Table 5.
The proposed analytical methodology for evaluating the seismic performance of the unreinforced 3D-printed concrete walls was also applied at the base of the reference wall segments. At the base of each wall, the internal forces are significantly higher due to the presence of additional bending moments induced by the product of shear force and wall height. In this case, the normal and shear stress distributions at the base of each reference wall segment are presented in Table 6.
Based on the results presented in Table 6, tensile stress values are greater than the tensile strength of the C40 class-printed concrete, thus indicating that tensile failure is now expected at the base of all three reference walls for the first set of internal forces and under both the examined printing patterns. The results are summarized in Table 7.

3.3. Numerical Predictions of Unreinforced 3DPC Walls

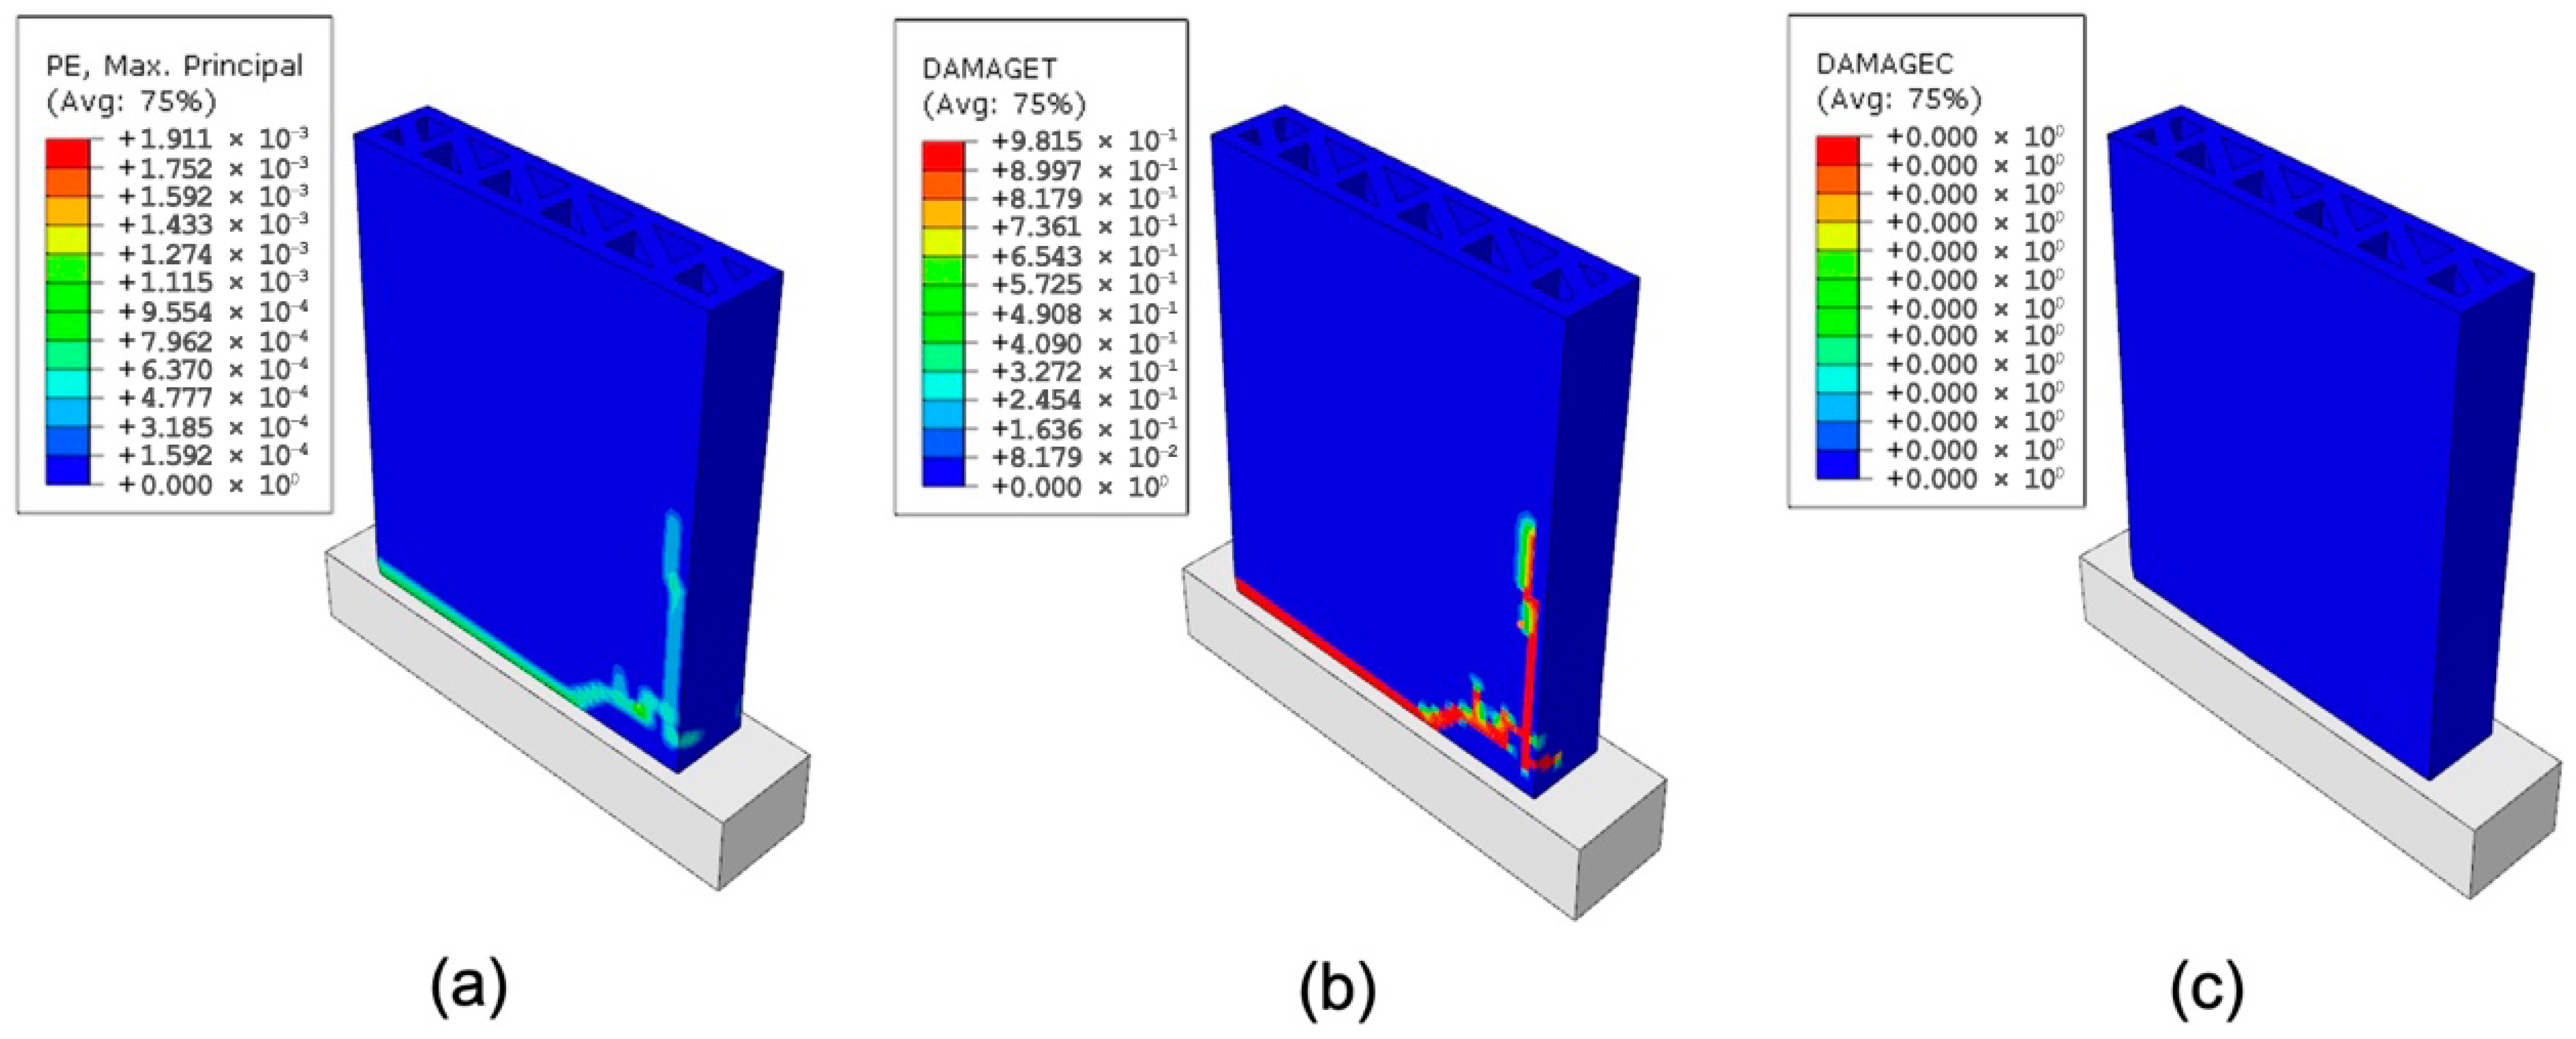
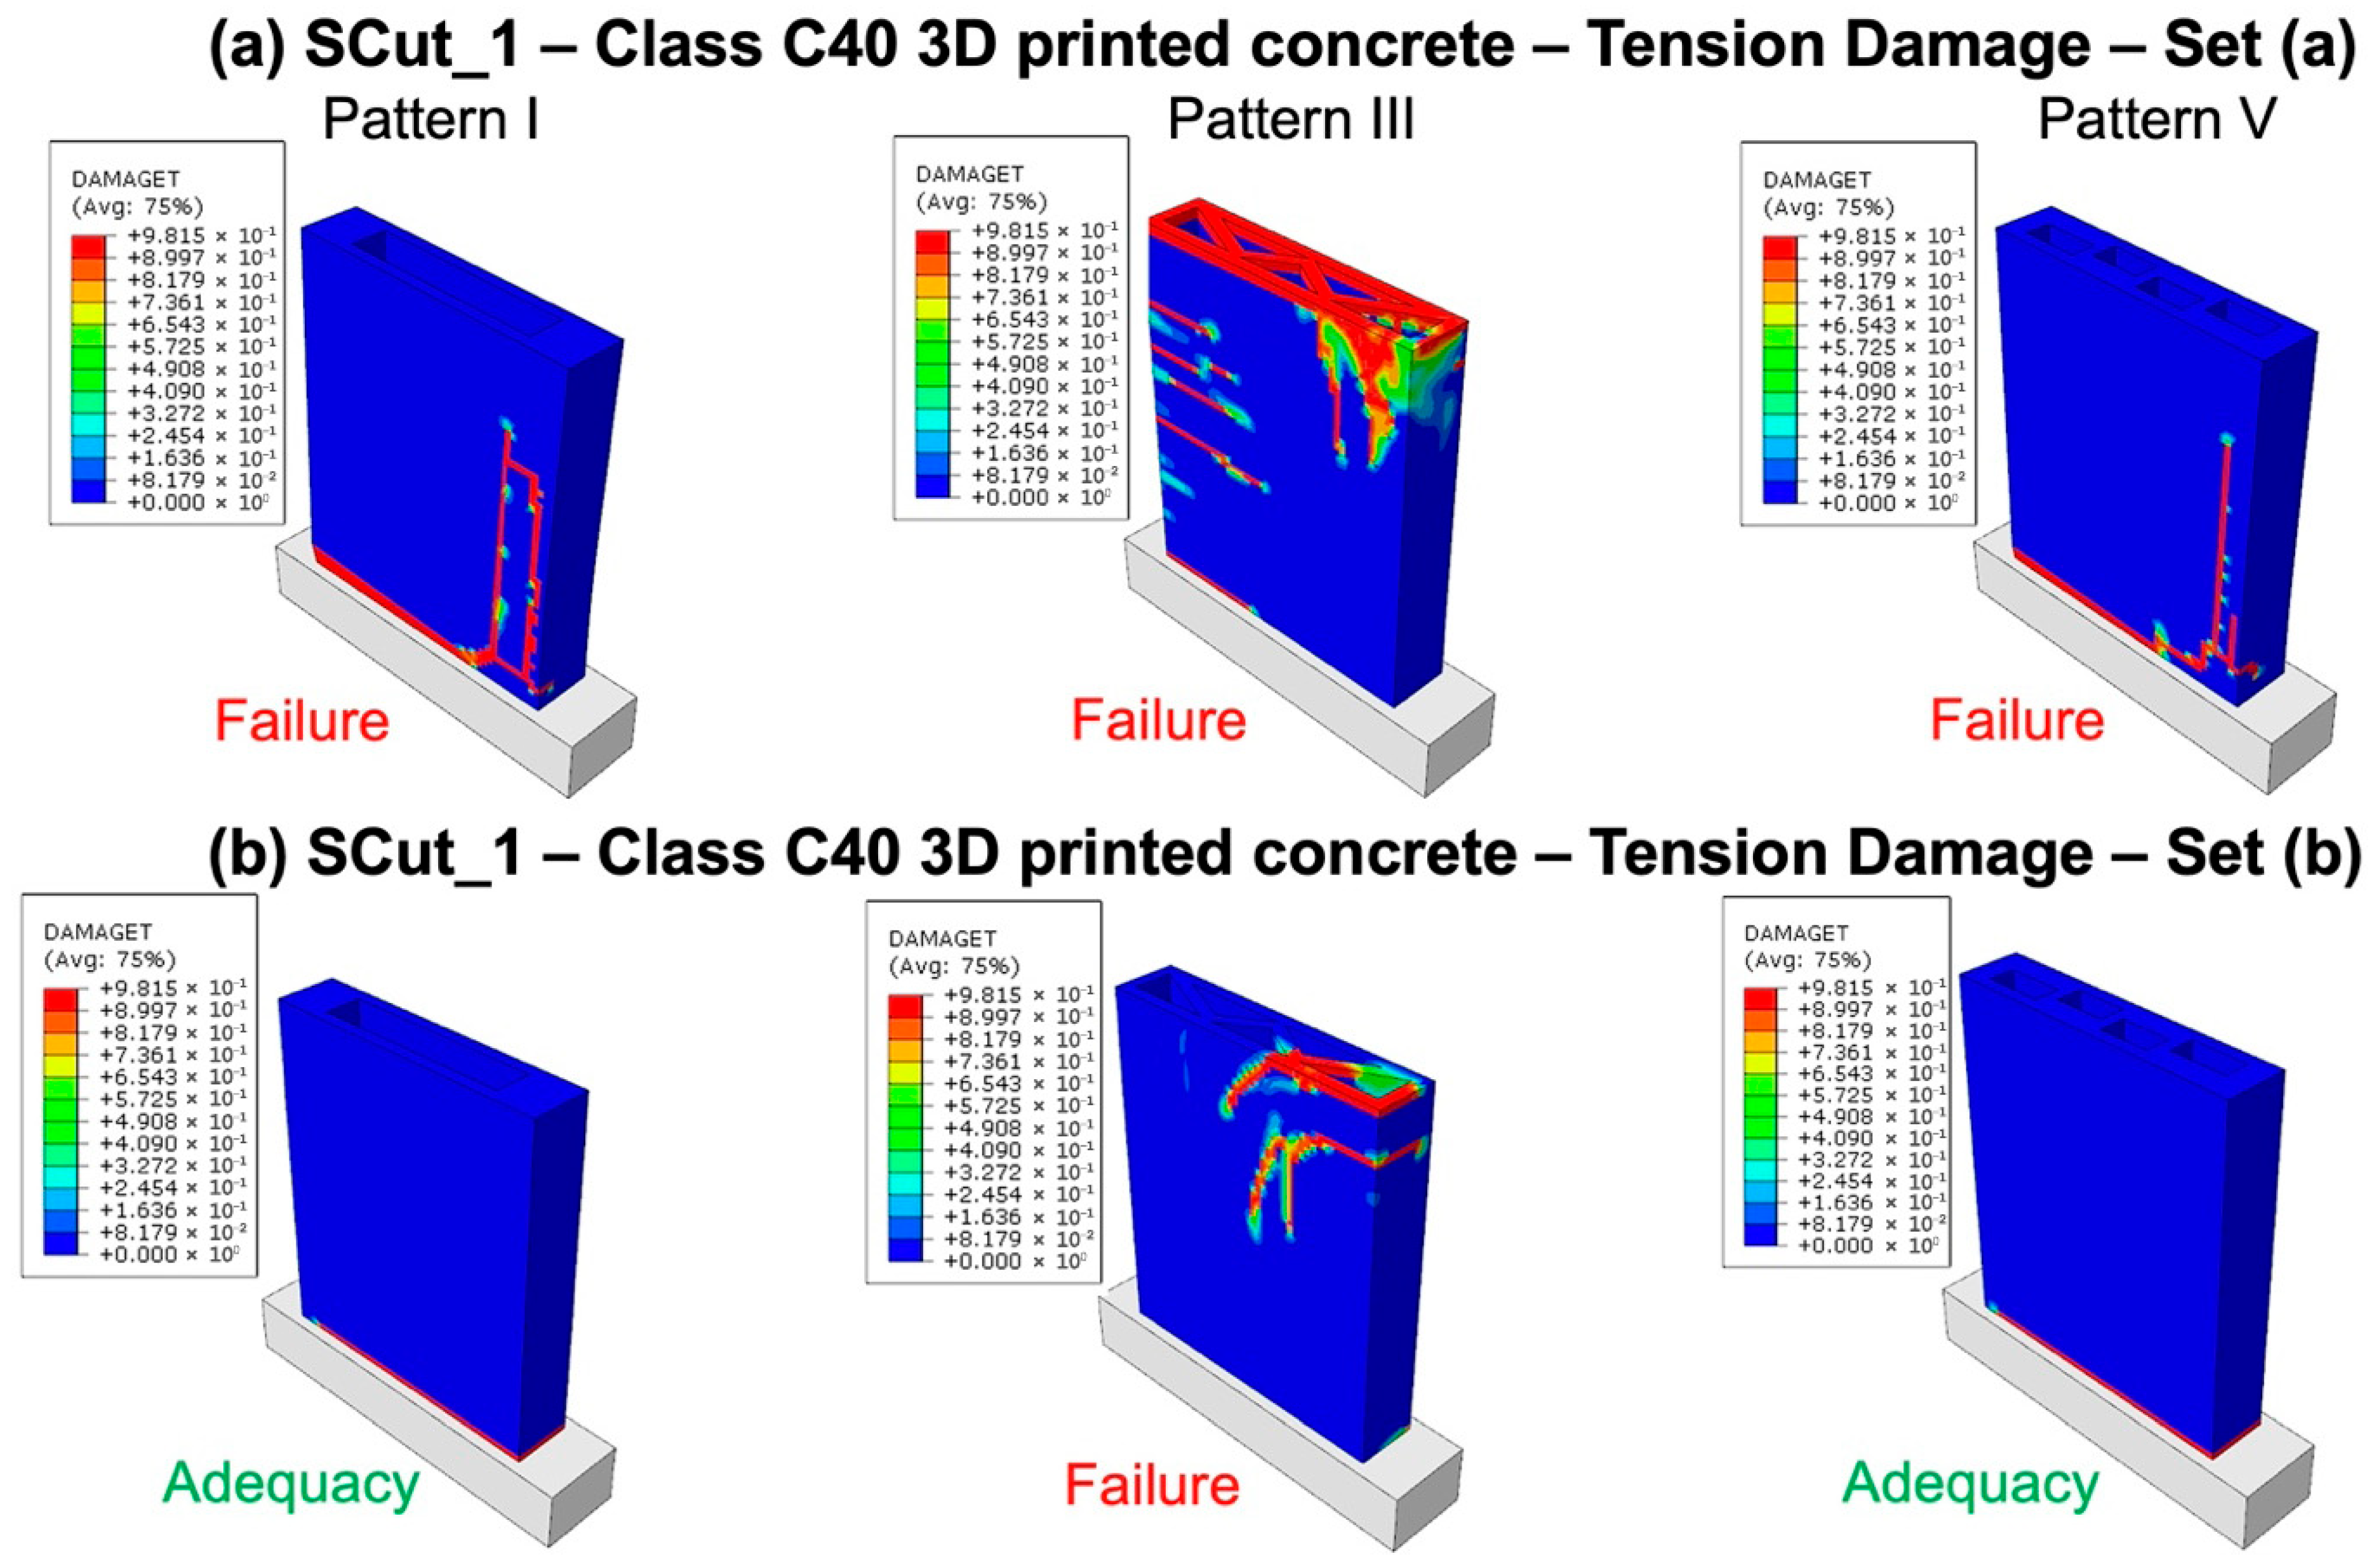
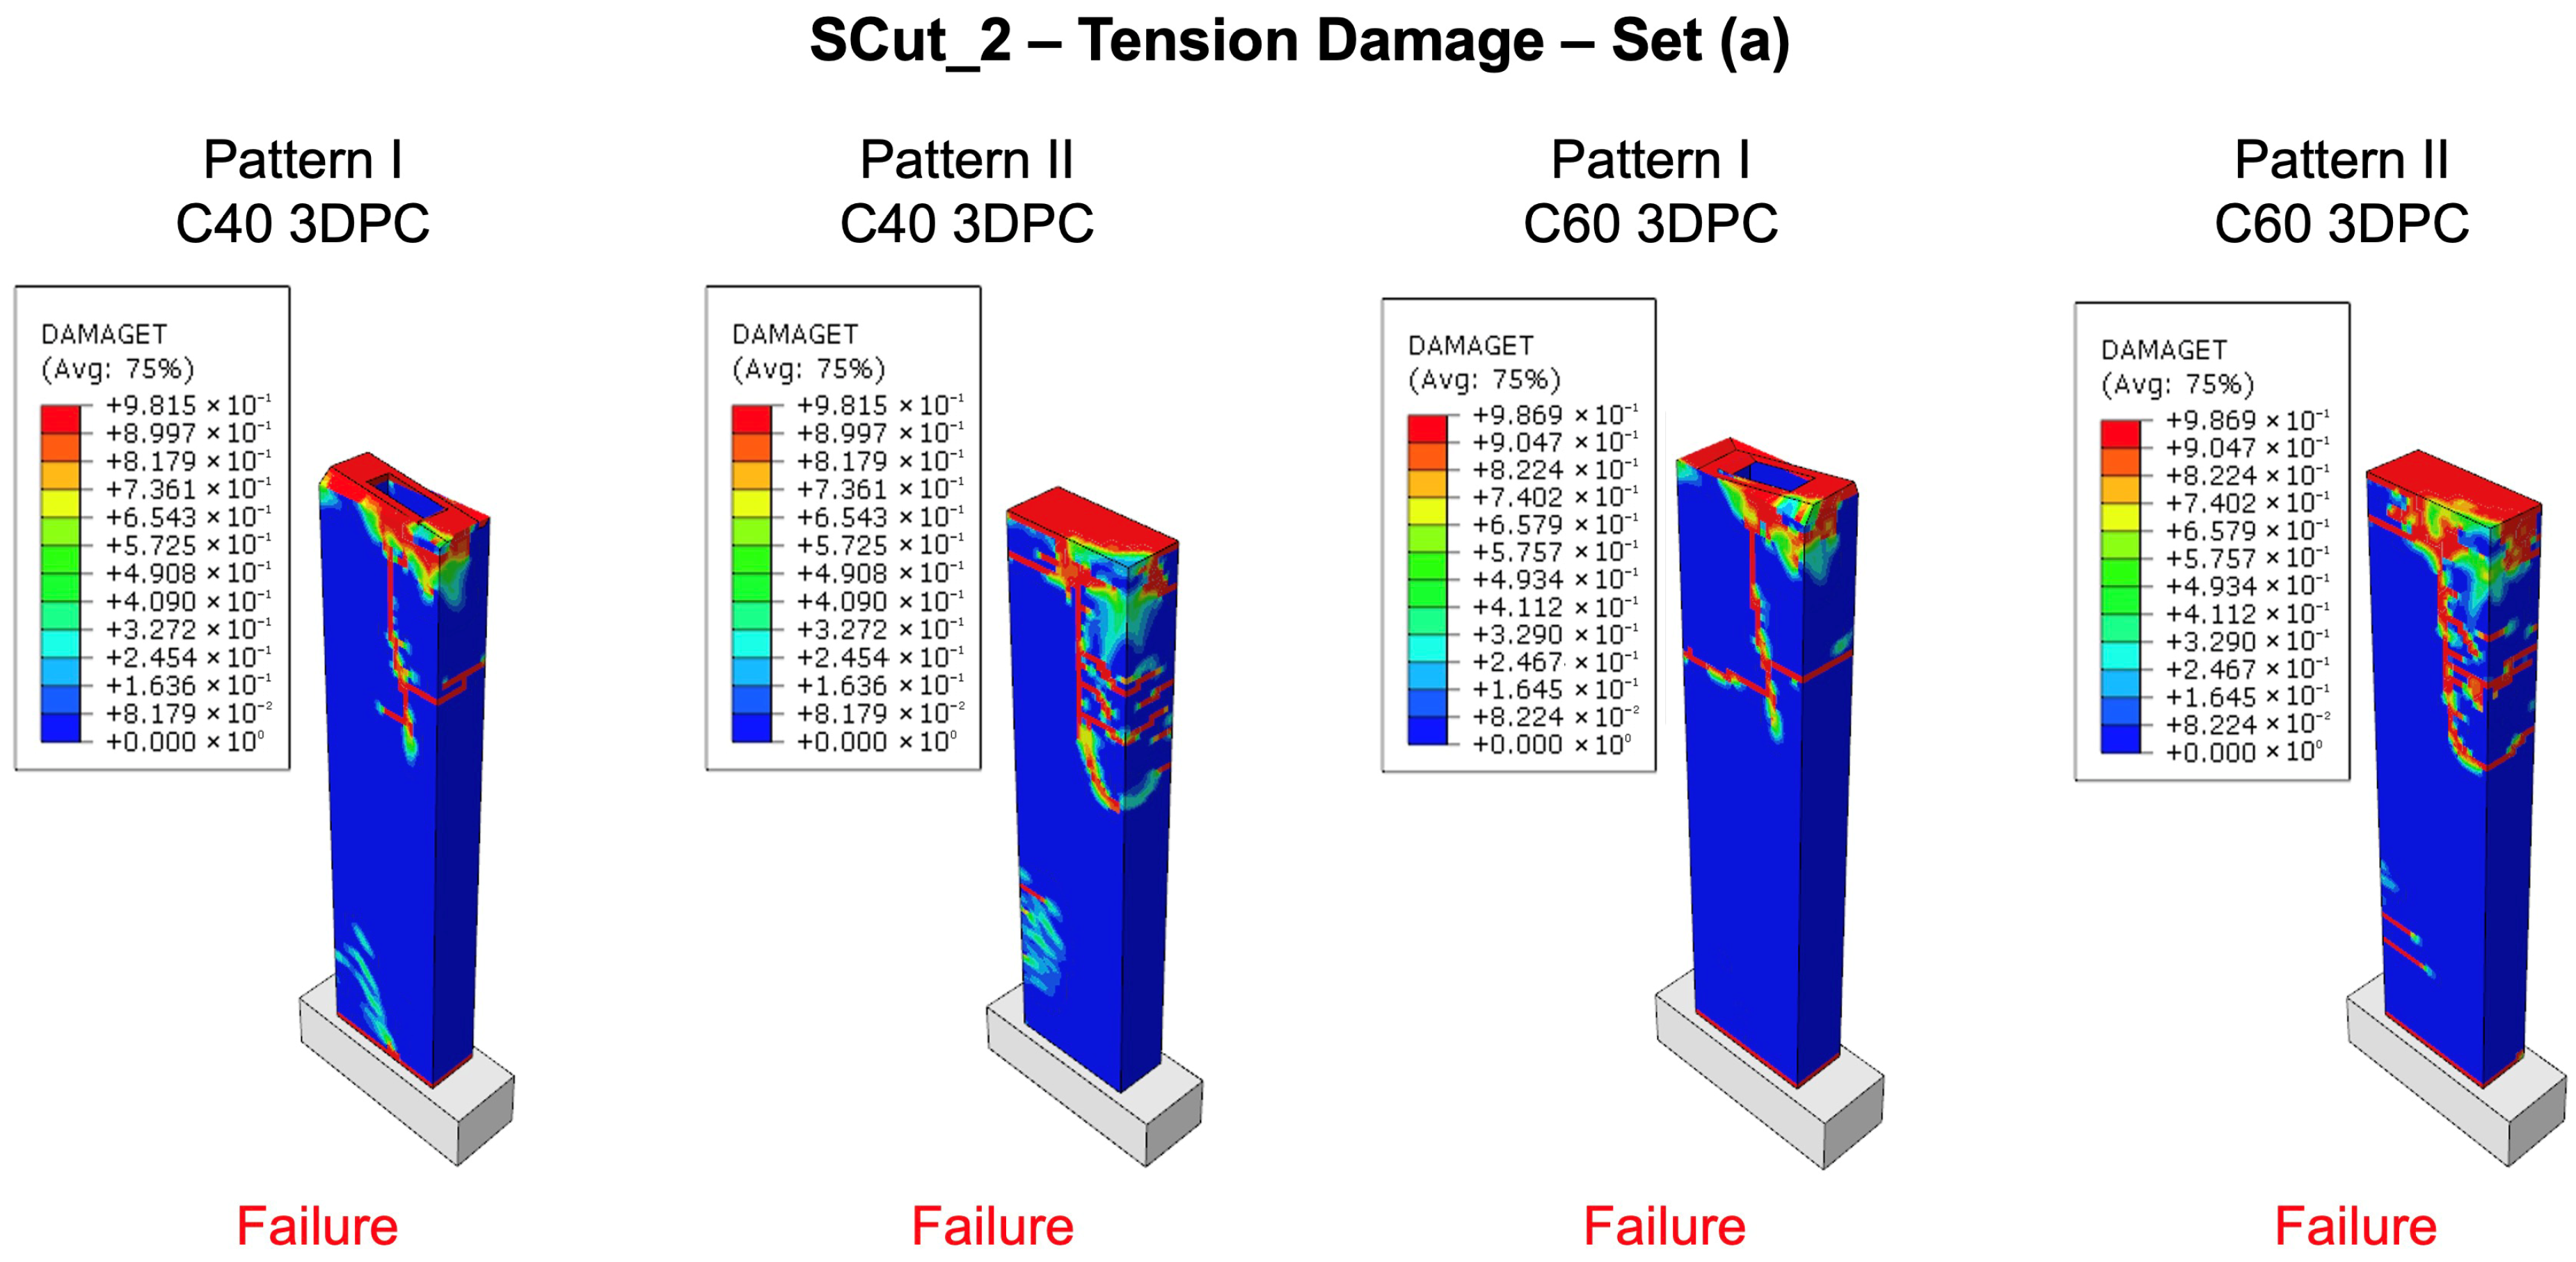
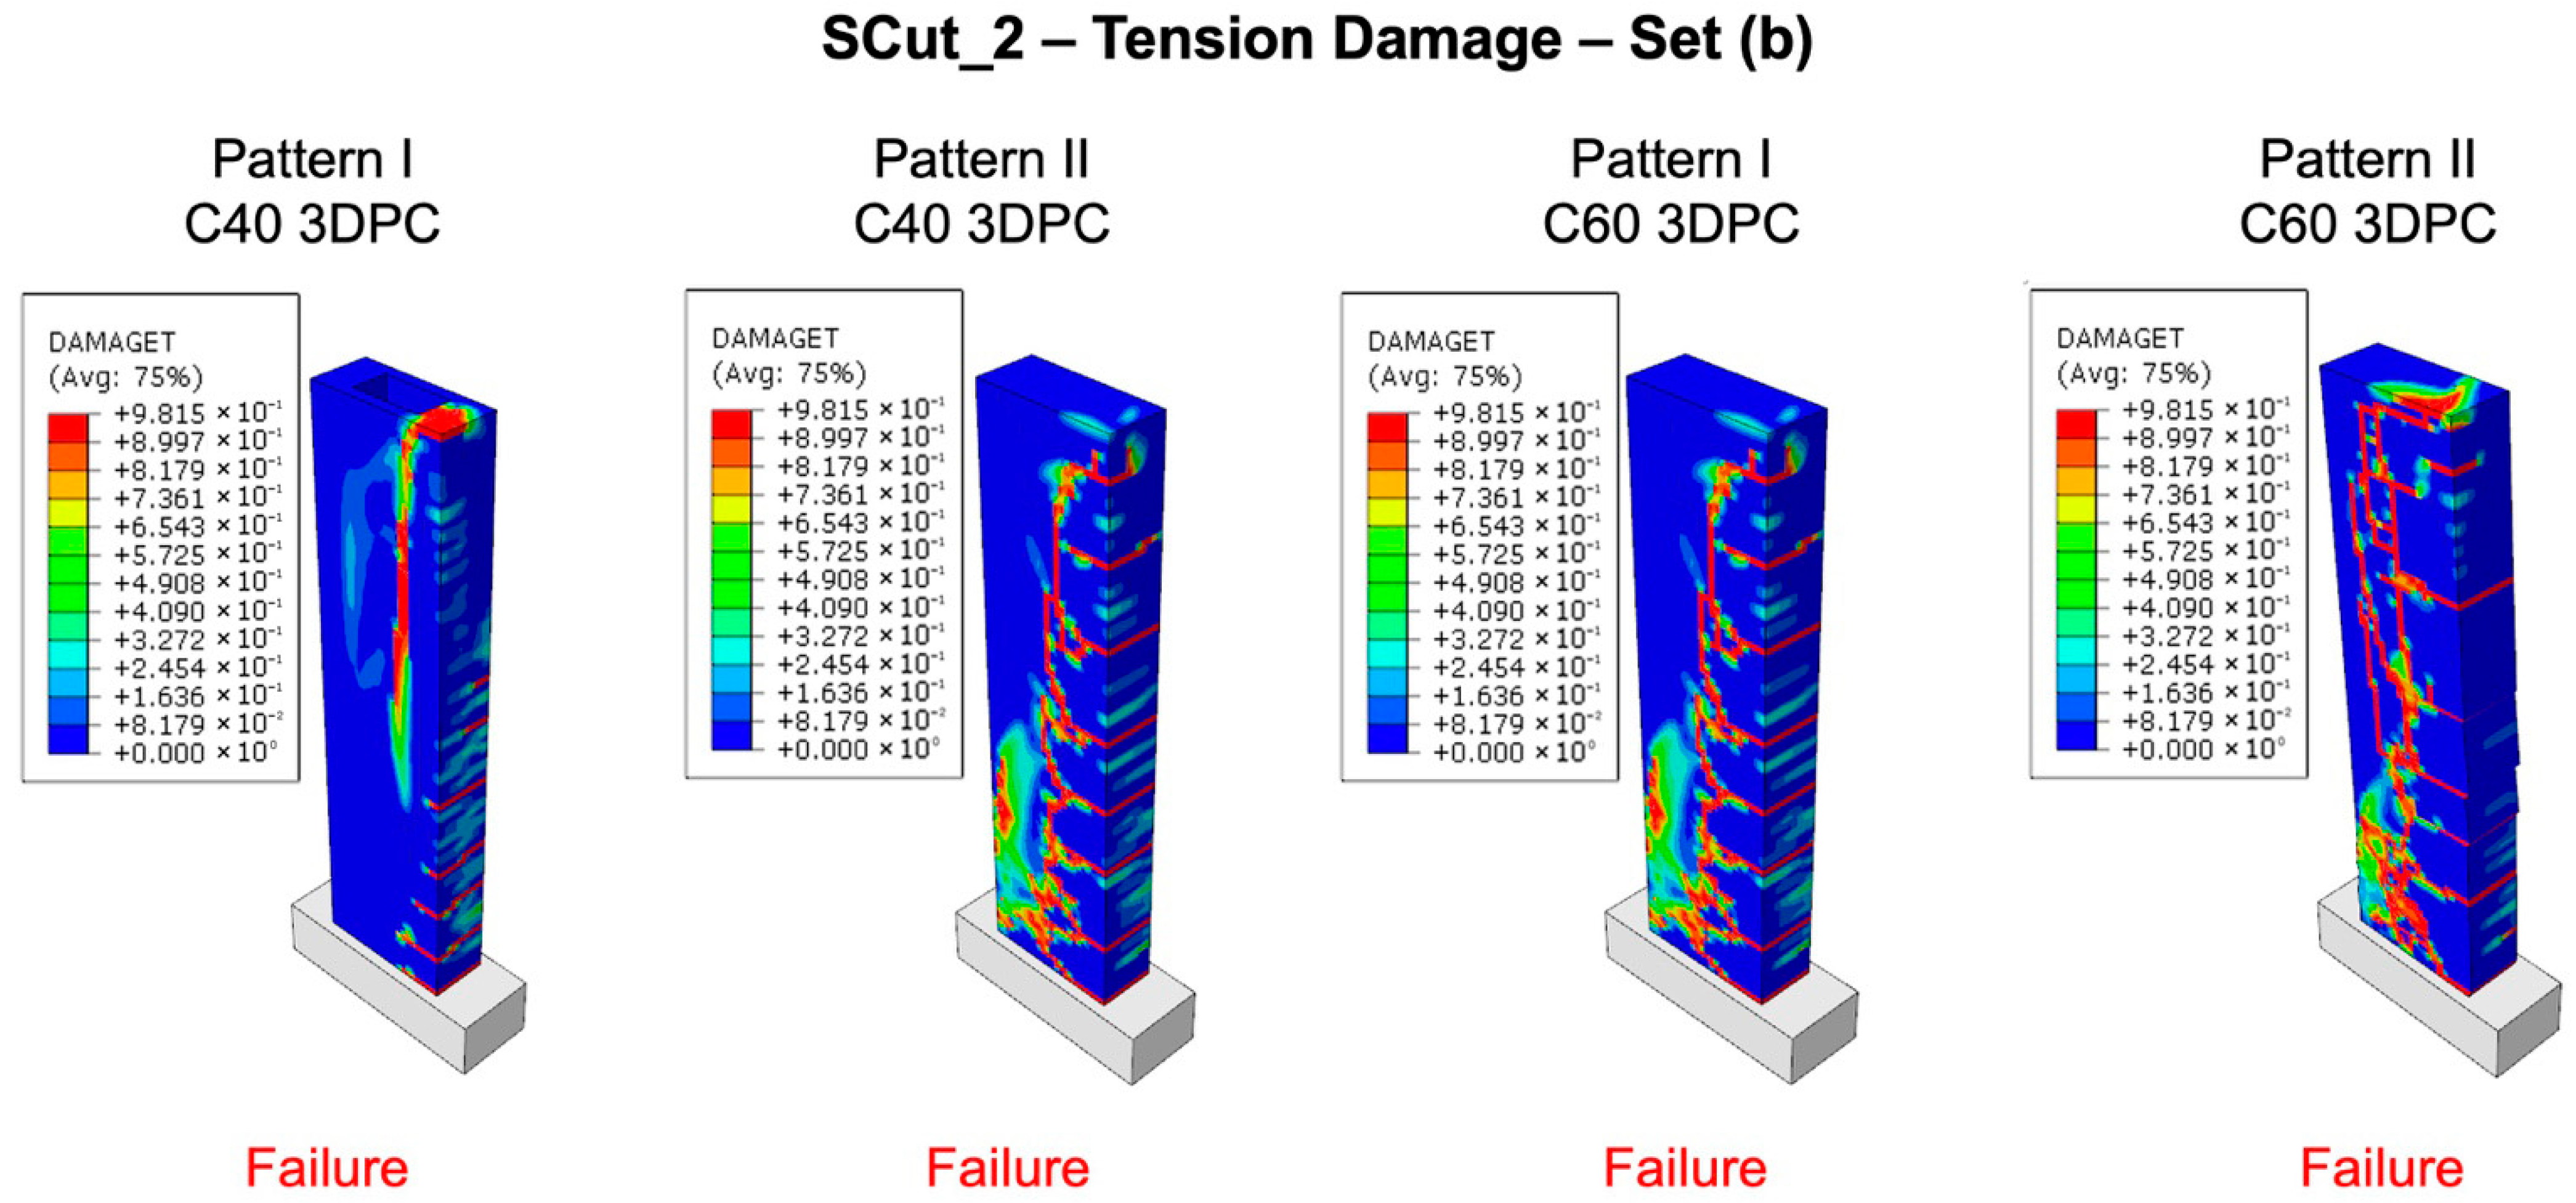
The model’s response (reference wall “SCut_1”, printing pattern IV) in terms of normal and shear stress distribution within the 3DPC wall element is illustrated in Figure 8. Distribution of plastic strains, tension, and compression damage is also shown in Figure 9. The most critical tension damage responses for the reference walls across different printing infill patterns are illustrated in Figure 10, Figure 11, Figure 12, Figure 13 and Figure 14. It is noted that no compression damage was observed at any of the reference walls, under either of the two applied load cases.

3.4. Numerical Predictions of Reinforced 3DPC Walls

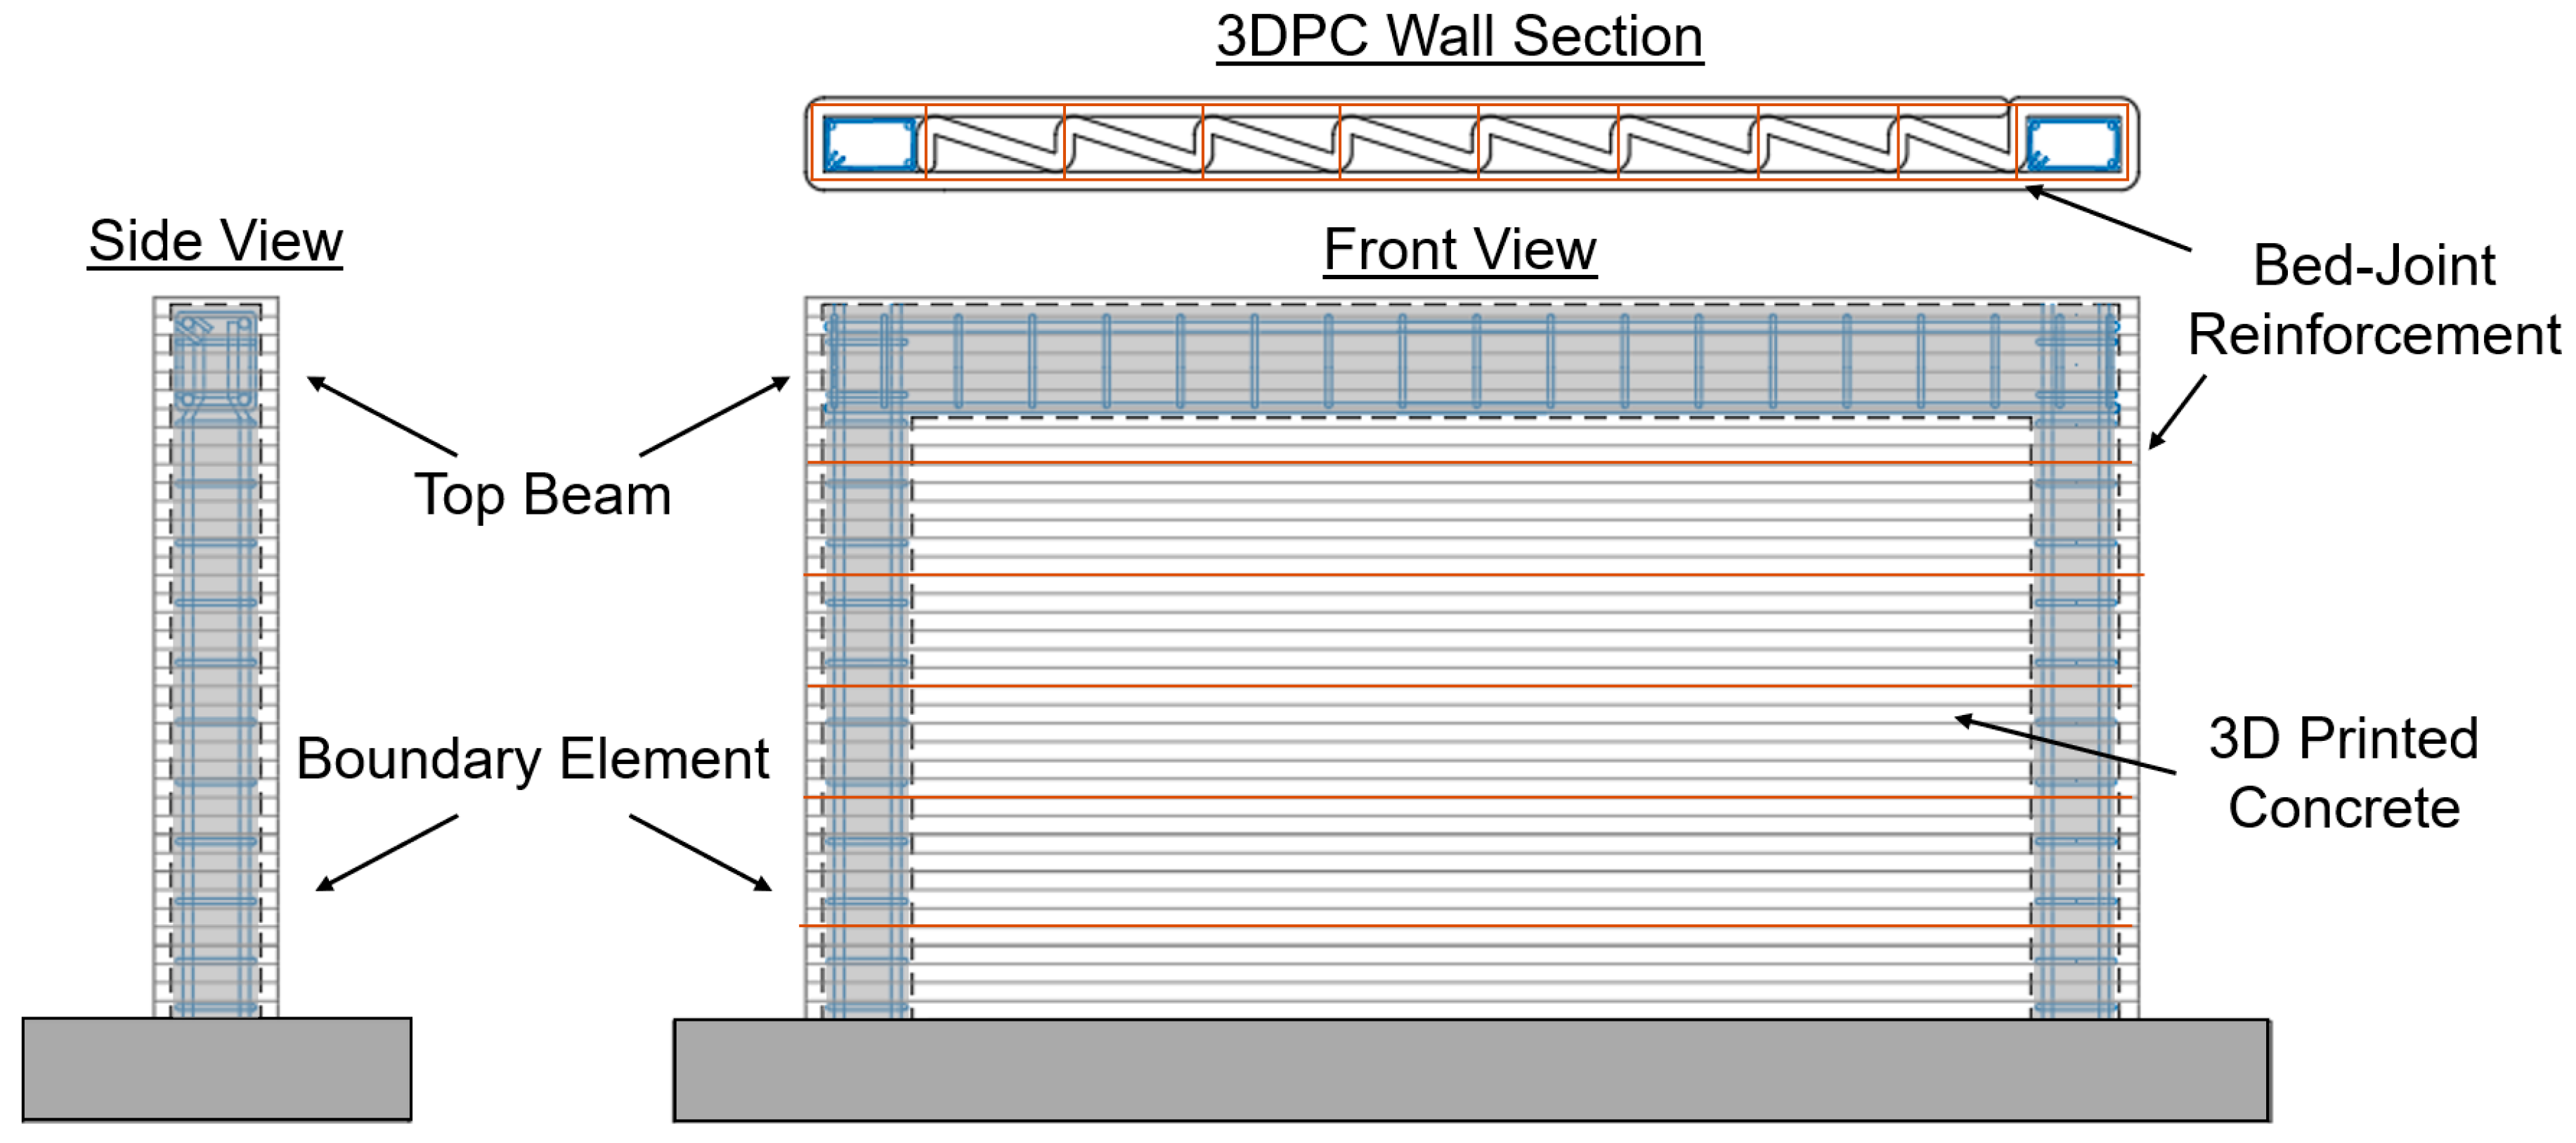
Since unreinforced 3DPC walls showcased brittle behavior and proved unable to provide the required safe and controlled response under the applied seismic loads, reinforcing strategies were introduced to the wall numerical models. As initially presented, 3DPC walls share conceptual and behavioral similarities with typical concrete block masonry (CBM) walls. The reinforcement strategies to be used were inspired by the conventional practices used in CBM walls. Firstly, vertical boundary elements made of cast concrete were added to the printed walls (Figure 15). These boundary elements were positioned at the hollow vertical edges of the 3DPC walls and were reinforced with both longitudinal and transverse reinforcement increasing the wall’s flexural capacity, since now any form of in-plane bending moment was resisted by a couple of axial forces (one tensile and one compressive) acting over a large lever arm [35,36]. To enhance ultimate strength and strain capacity and to ensure higher ductility, cast-in-place concrete was confined through the provided transverse reinforcement. The proposed reinforcement strategy addresses the interlayer bonding issues mentioned in the literature, as the reinforcing steel is not embedded into 3D-printed concrete but into conventional cast-in-place concrete; thus, conventional bonding is achieved between reinforcing steel and concrete. It must be noted that the two boundary elements were connected to each other through a top beam; thus, the hybrid system was practically equal to a 3D-printed concrete wall that was confined with a conventional reinforced concrete frame on its interior.
Additionally, bed-joint reinforcement (in the form of ladder mesh) was placed between the printed concrete layers. This results in significantly enhanced in-plane and out-of-plane resistance, while it also ensures better stability and integrity during printing of the wall system [37,38]. In fact, the horizontal reinforcement layers were placed at regular intervals across the wall height and were expected to bridge across potential weak interlayer zones enhancing shear performance.
Both printed and cast-in-place concrete were modeled using solid elements and the same CDP model, whose parameters were presented in Table 1. The material model used for the steel reinforcement B500C was defined as bilinear elastoplastic, with a strain hardening branch (up to 15%) following the yield plateau. Simulations were only conducted using printing pattern V, since this printing pattern offers high material efficiency. On top of that, printing pattern V minimizes printing time to a greater extent when compared to patterns II, III, and IV. Also, 3D-printed concrete walls using pattern V are particularly similar with conventional concrete block masonry walls. Lastly, a decrease in the printed concrete layer width from 50 mm to 30 mm was also examined during this study.
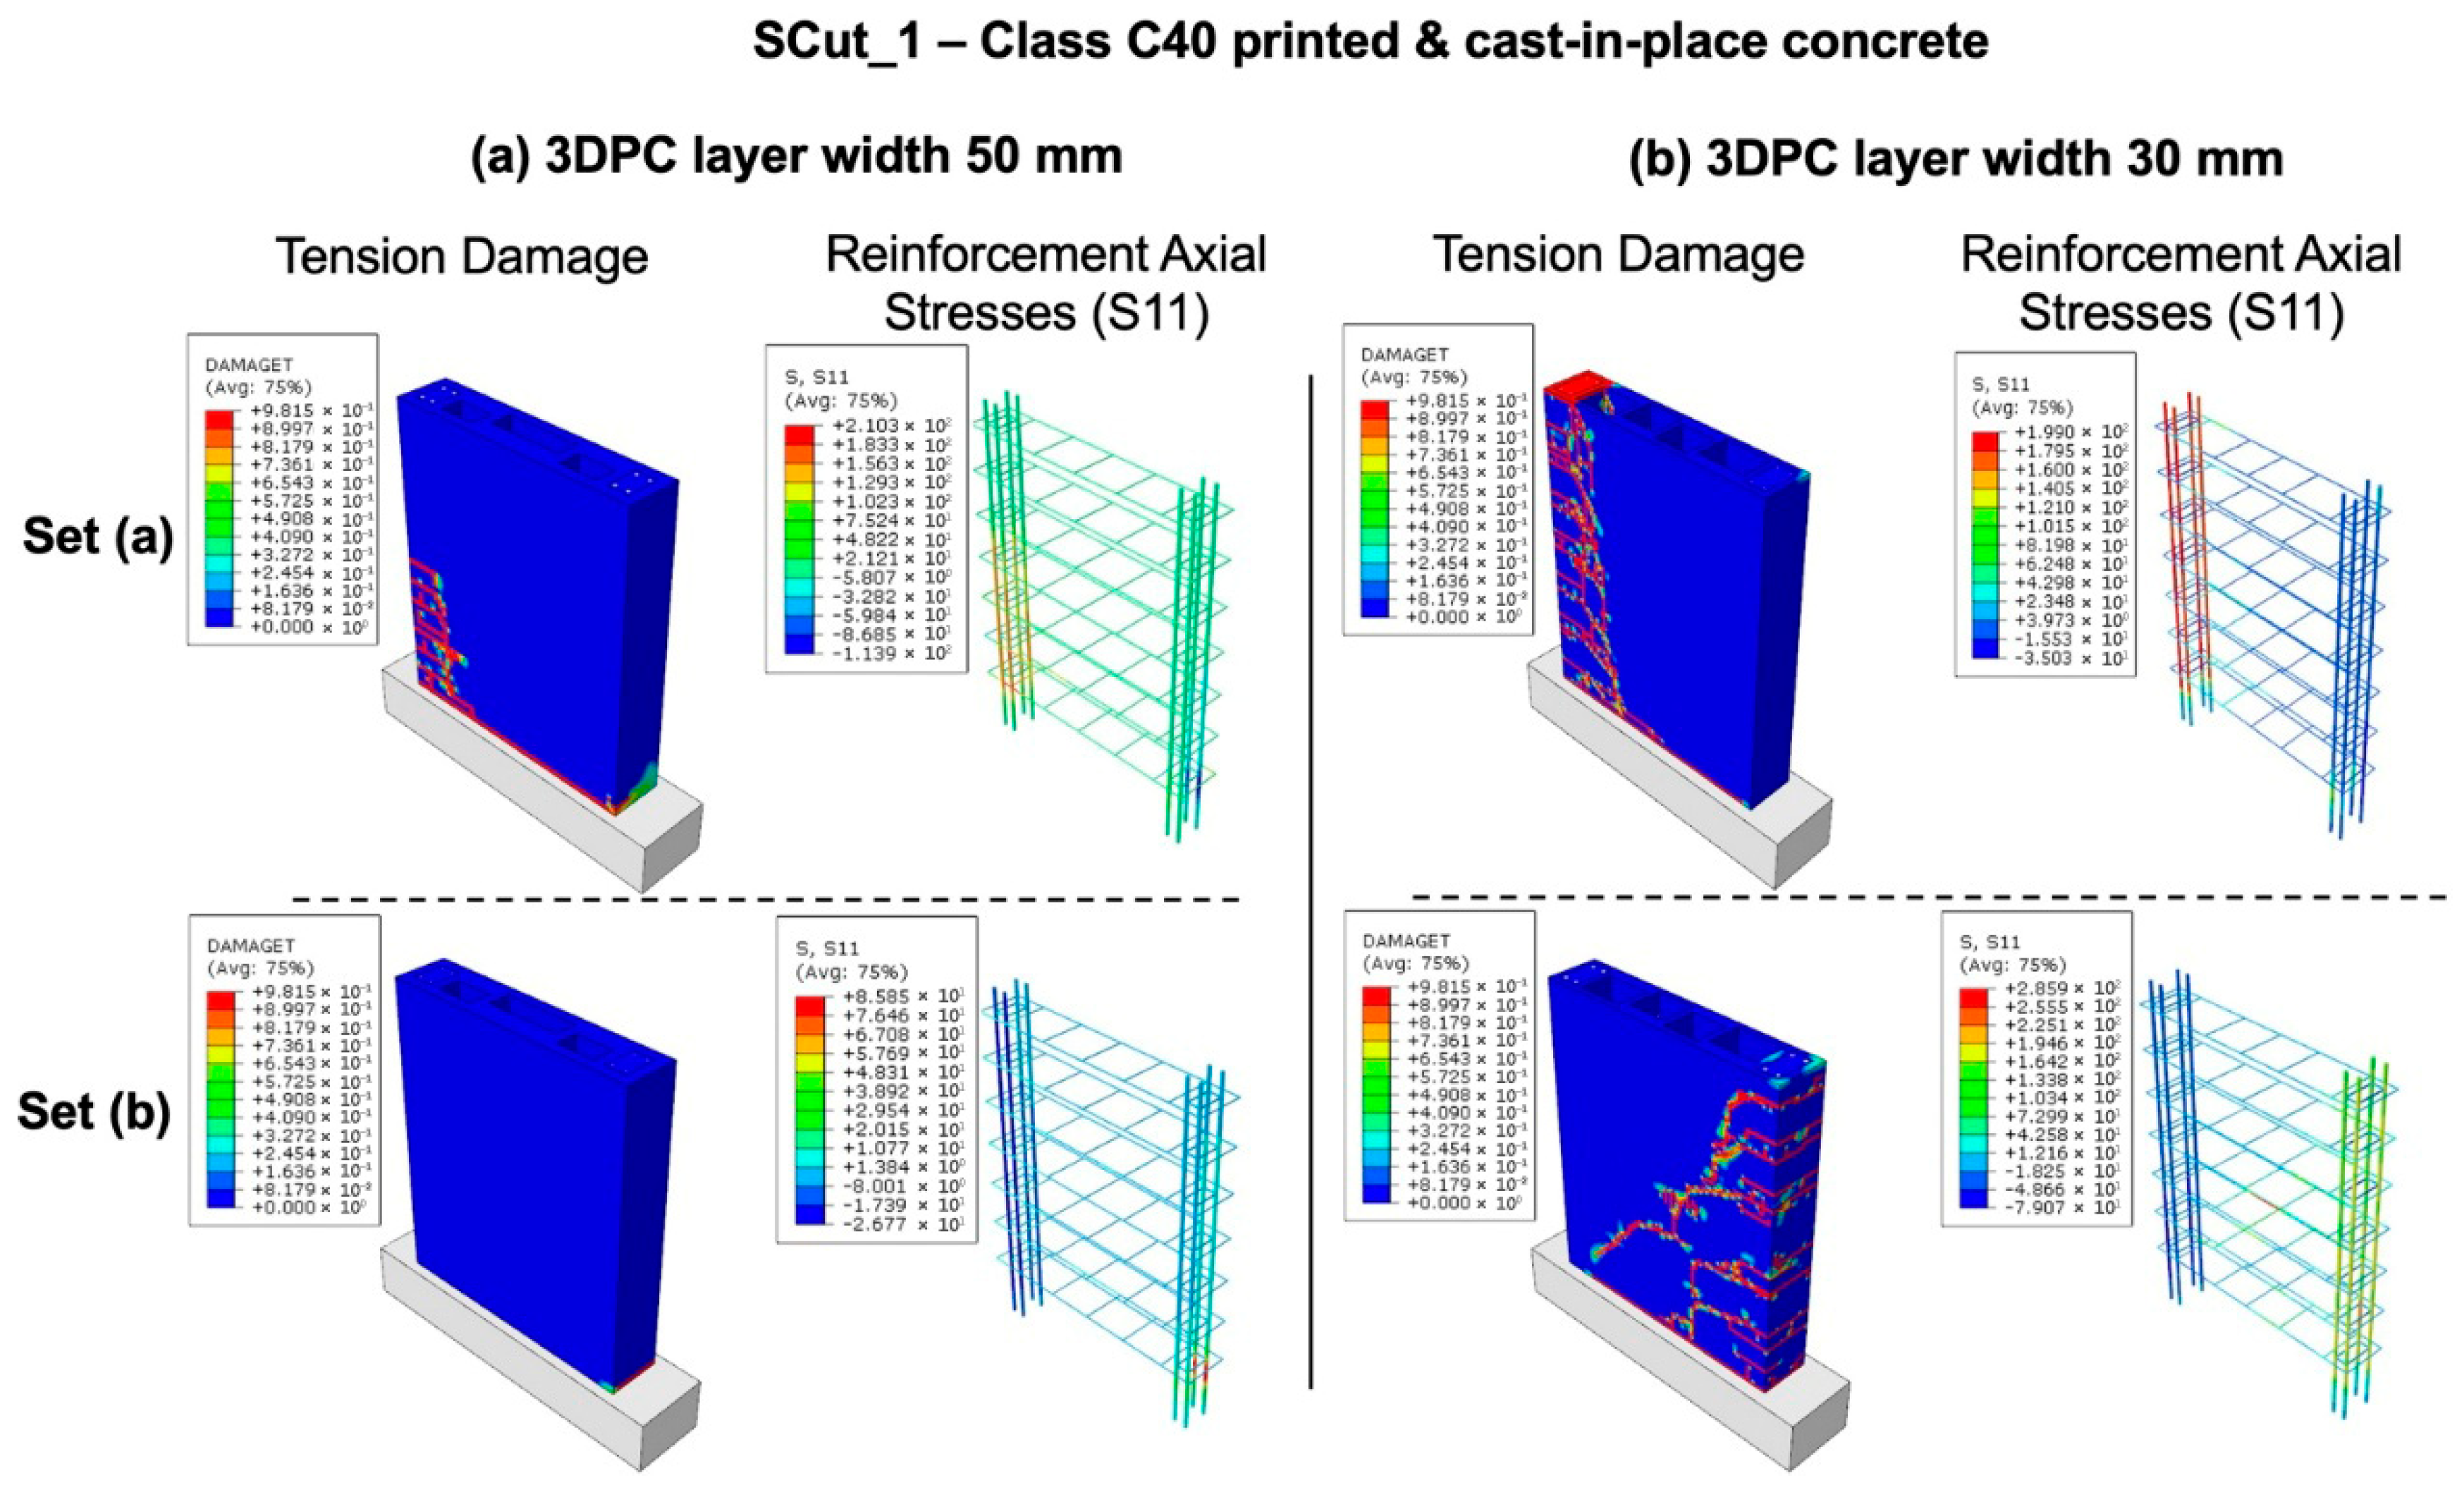
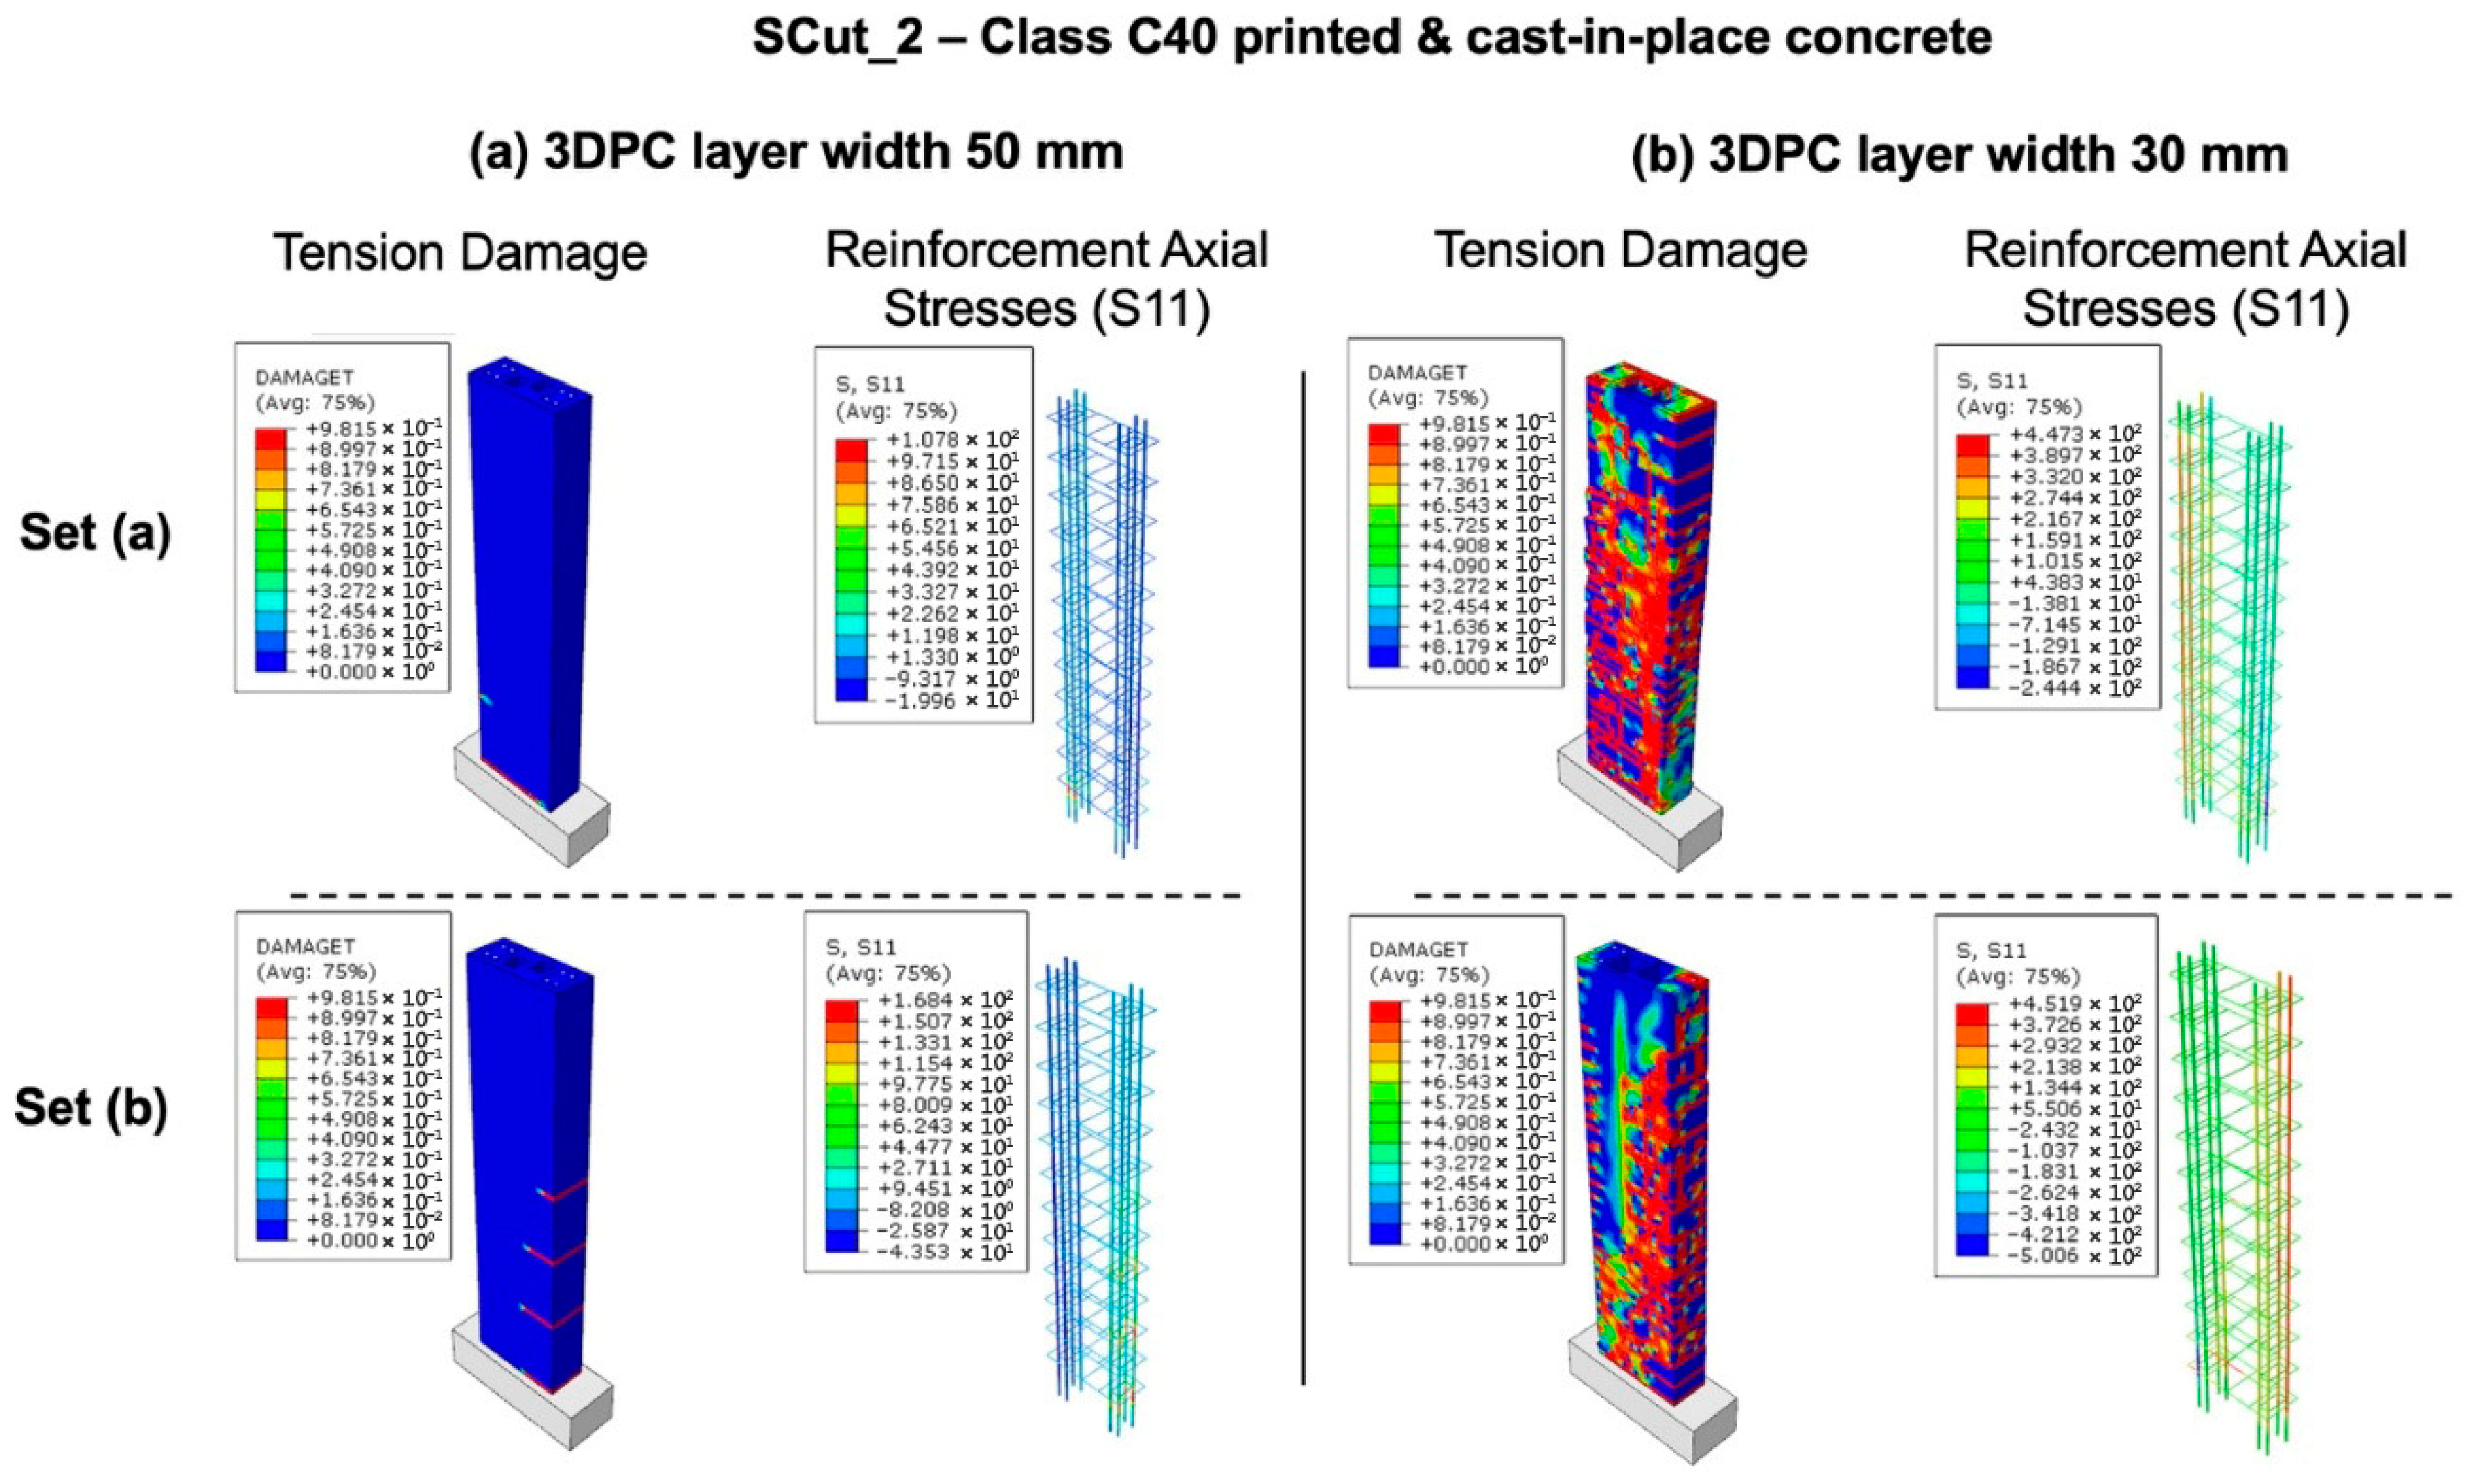
A detailed outline of the finite element results is presented in (Figure 16, Figure 17 and Figure 18). It is firstly noted that reinforced concrete shear walls typically fail in diagonal shear, flexural–shear, or, more rarely, in pure flexure, depending on their aspect ratio and the spacing of transverse reinforcement. The wall “SCut_1”, with a printed concrete layer width of 50 mm, exhibits pure flexural failure under the first load set, while it does not showcase any failure under the second one. Reducing the layer width to 30 mm leads to flexural–shear failure under both load sets. Regarding “SCut_2”, no significant failure is noticed under both load sets for 50 mm wide printed concrete layers. However, after reducing the layer width to 30 mm, excessive tensile cracking and compression zone degradation were both triggered. Lastly, wall “SCut_3”, which has got the lowest aspect ratio, remains structurally integral for both layer widths and load sets. A representation of the different failure types of reinforced 3DPC walls is illustrated in Figure 19.

3.5. Shell Element-Based Modelling of Reinforced 3DPC Walls

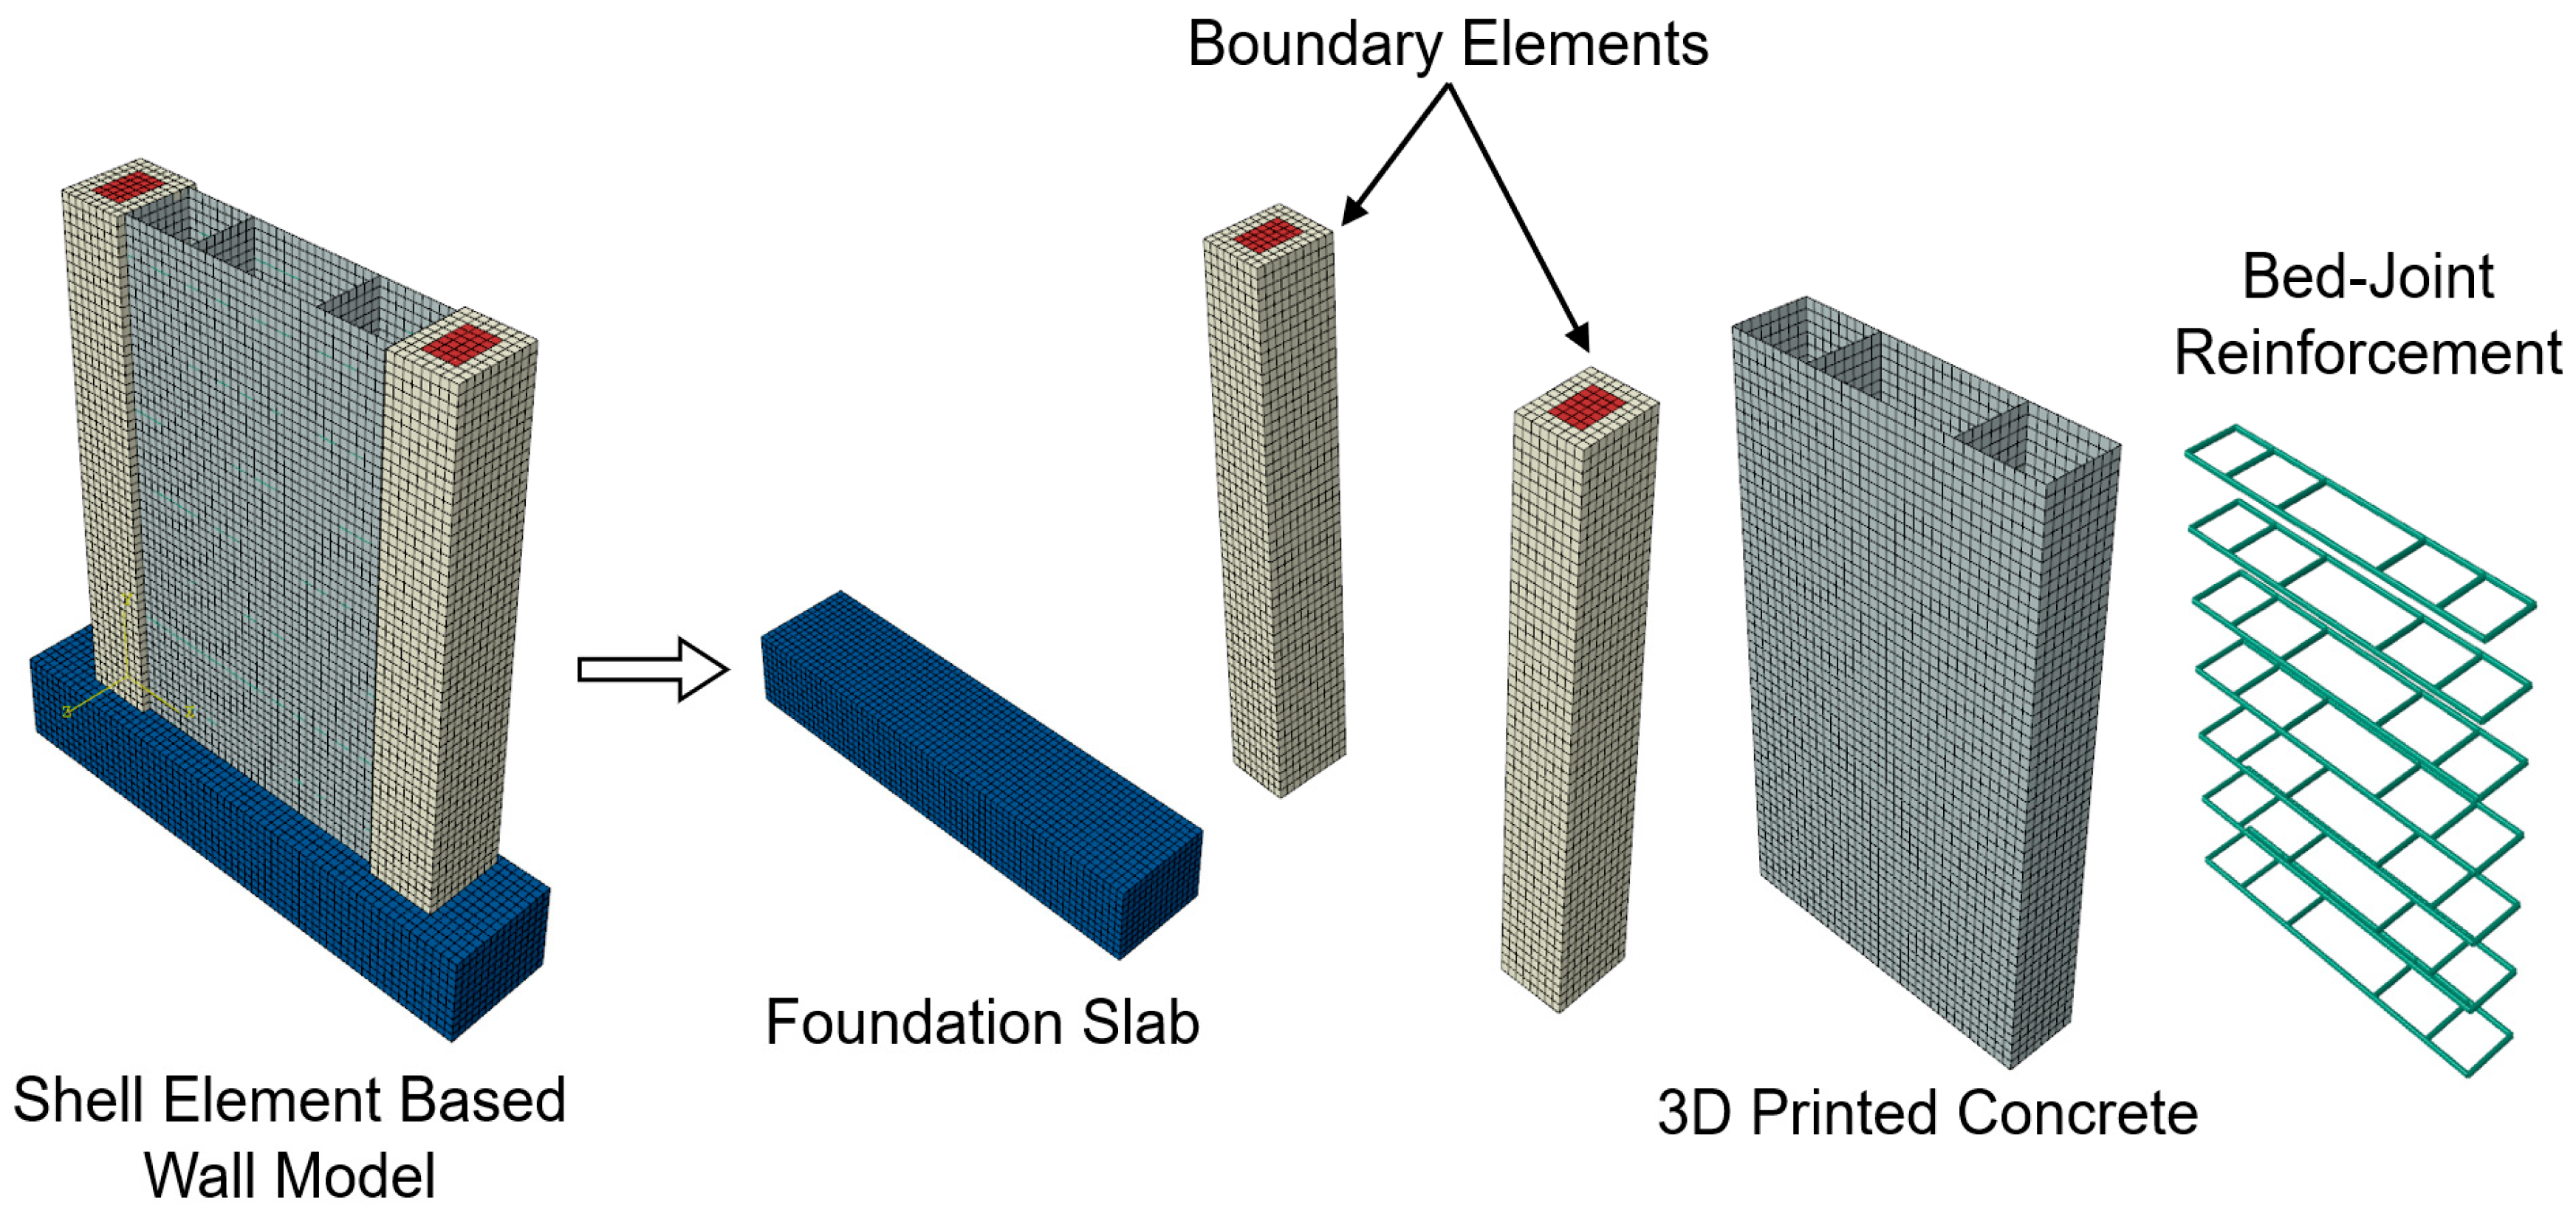
Reinforced 3DPC walls were modelled using shell elements, aiming to significantly decrease computational time and cost. Comparative analyses were conducted, and the same reinforced 3DPC wall configurations that were initially modeled using only solid elements were modelled using both solid and shell elements. Shell elements were used for the printed part of the wall, while boundary elements were again modeled using solid elements. Figure 20 presents a breakdown of the different parts used for the shell-based numerical modelling. Equivalent shell elements of double thickness were used to model the pattern’s geometry wherever needed. Comparative analyses were performed for all three reference walls, using printing pattern V and under both sets of internal forces.
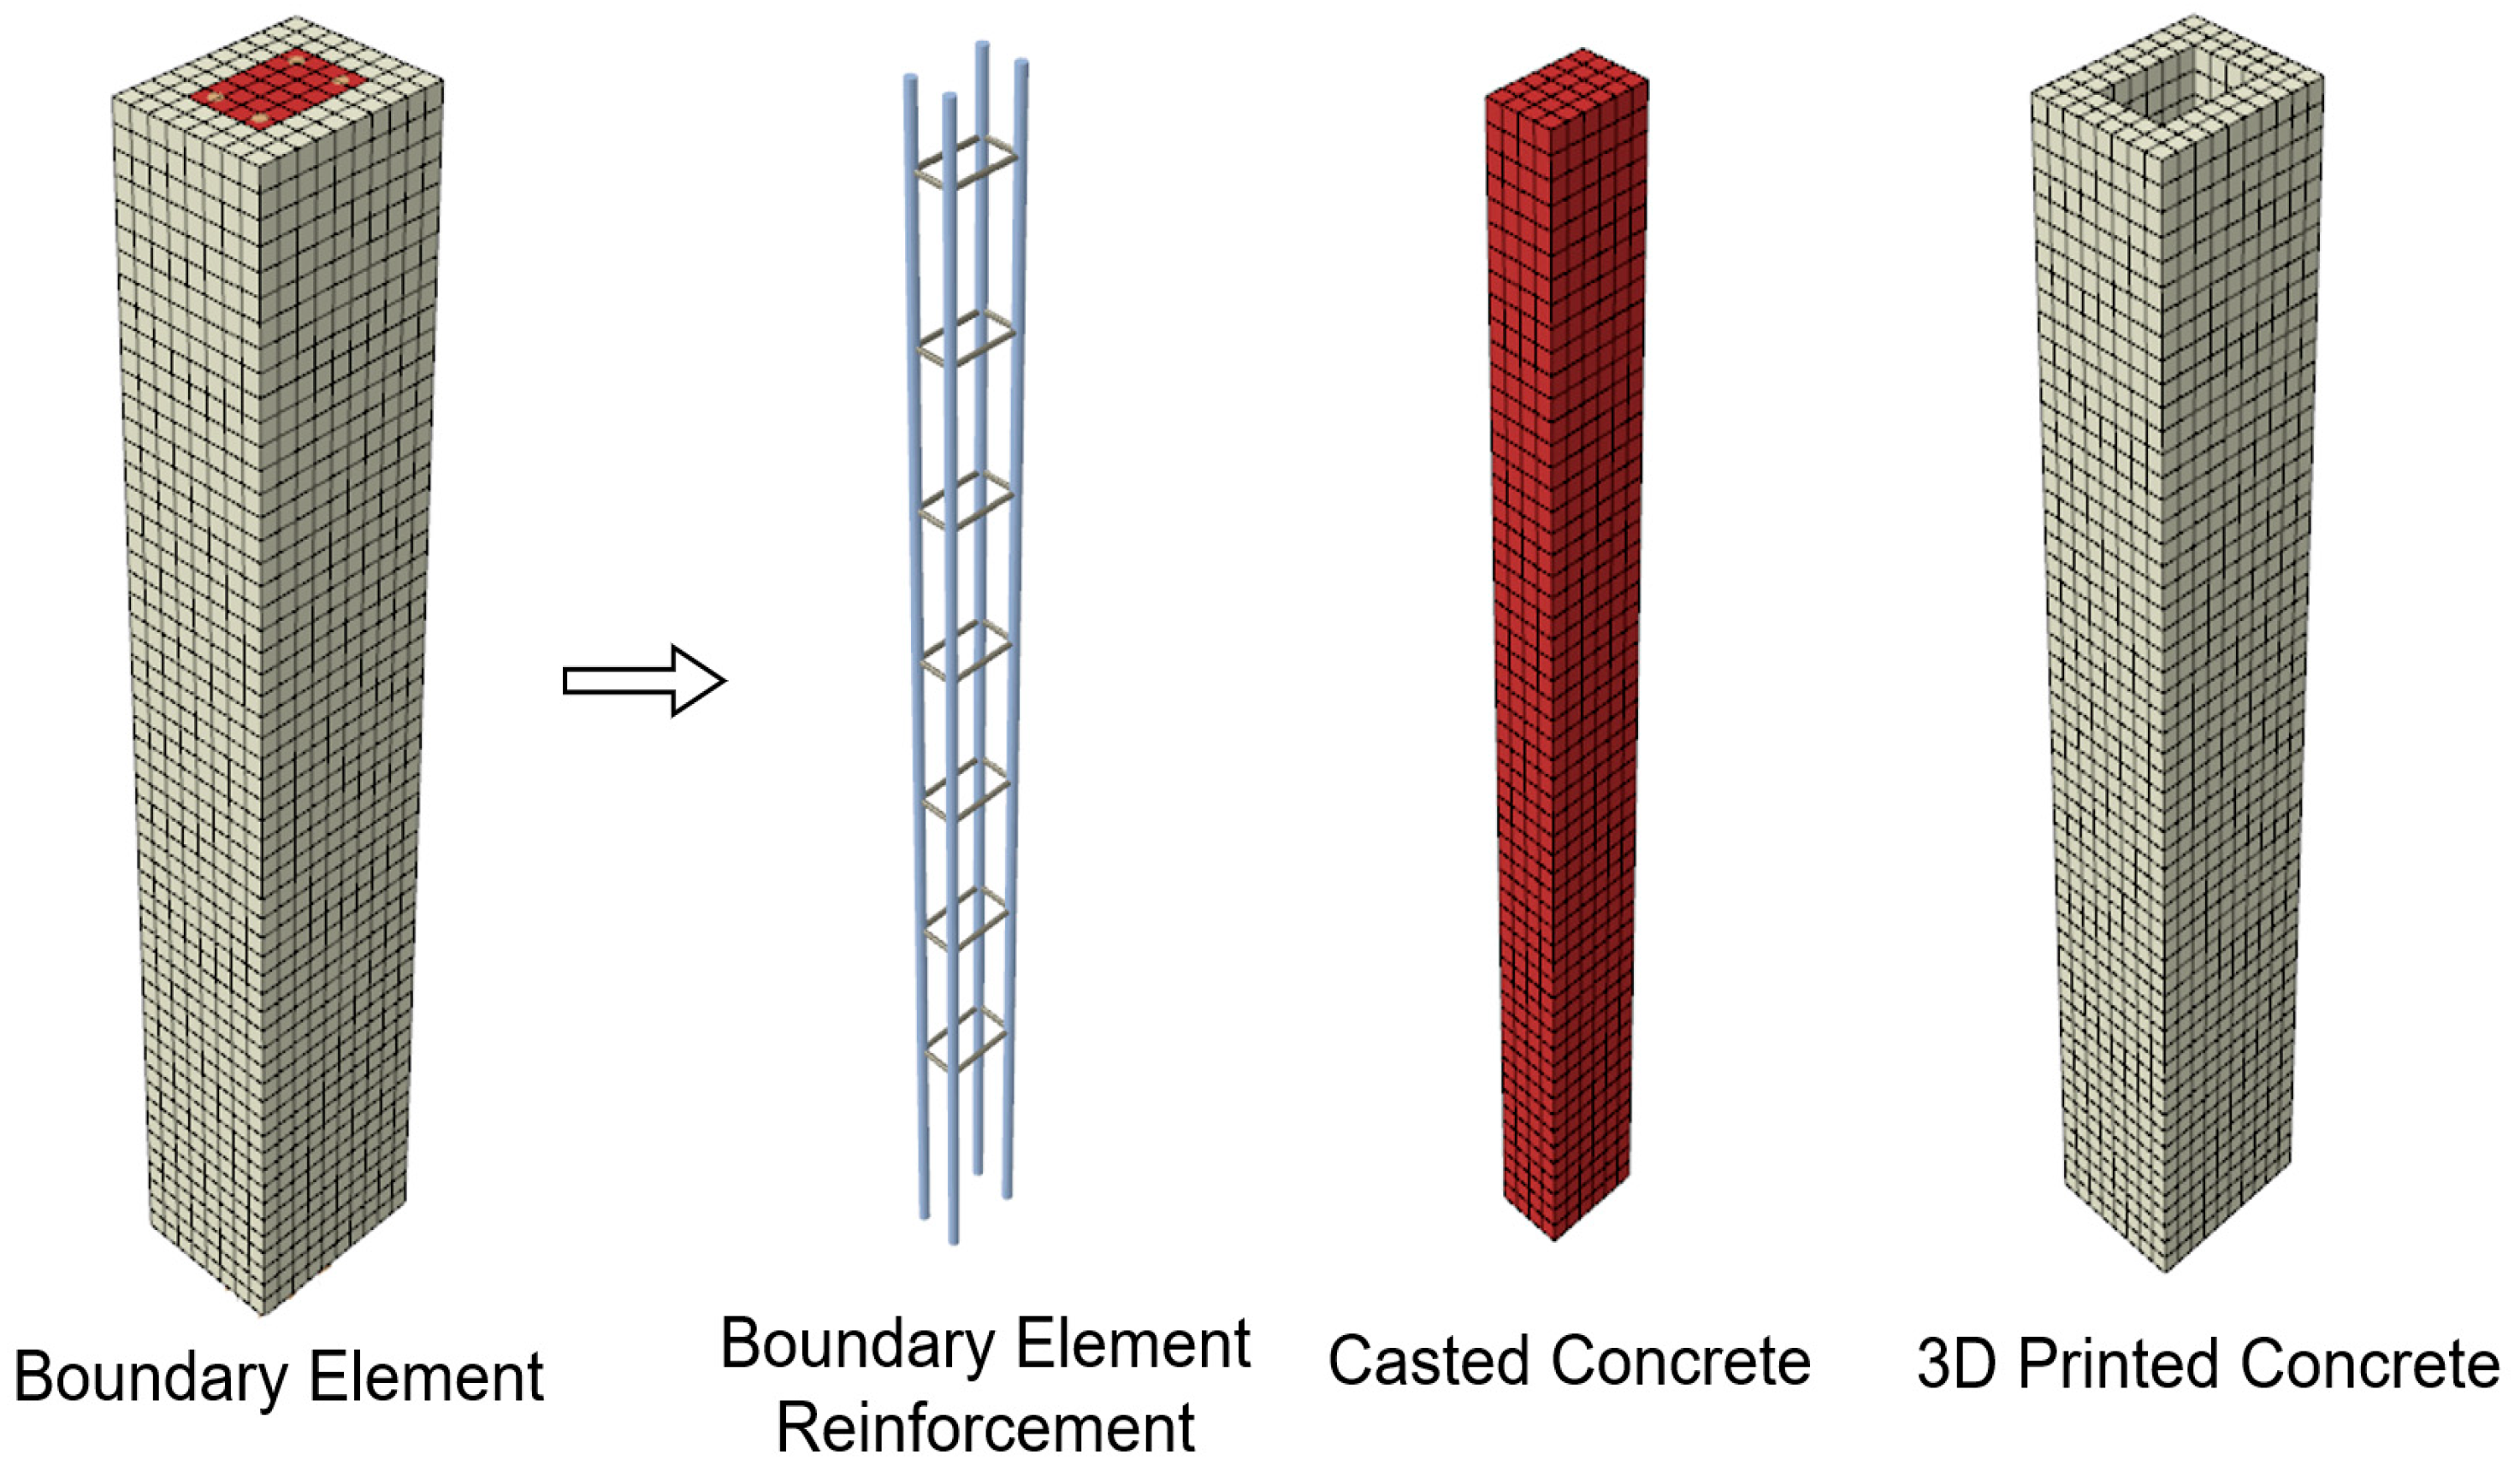
Boundary elements were modelled by implementing three different components. The modelling technique is schematically explained in Figure 21.
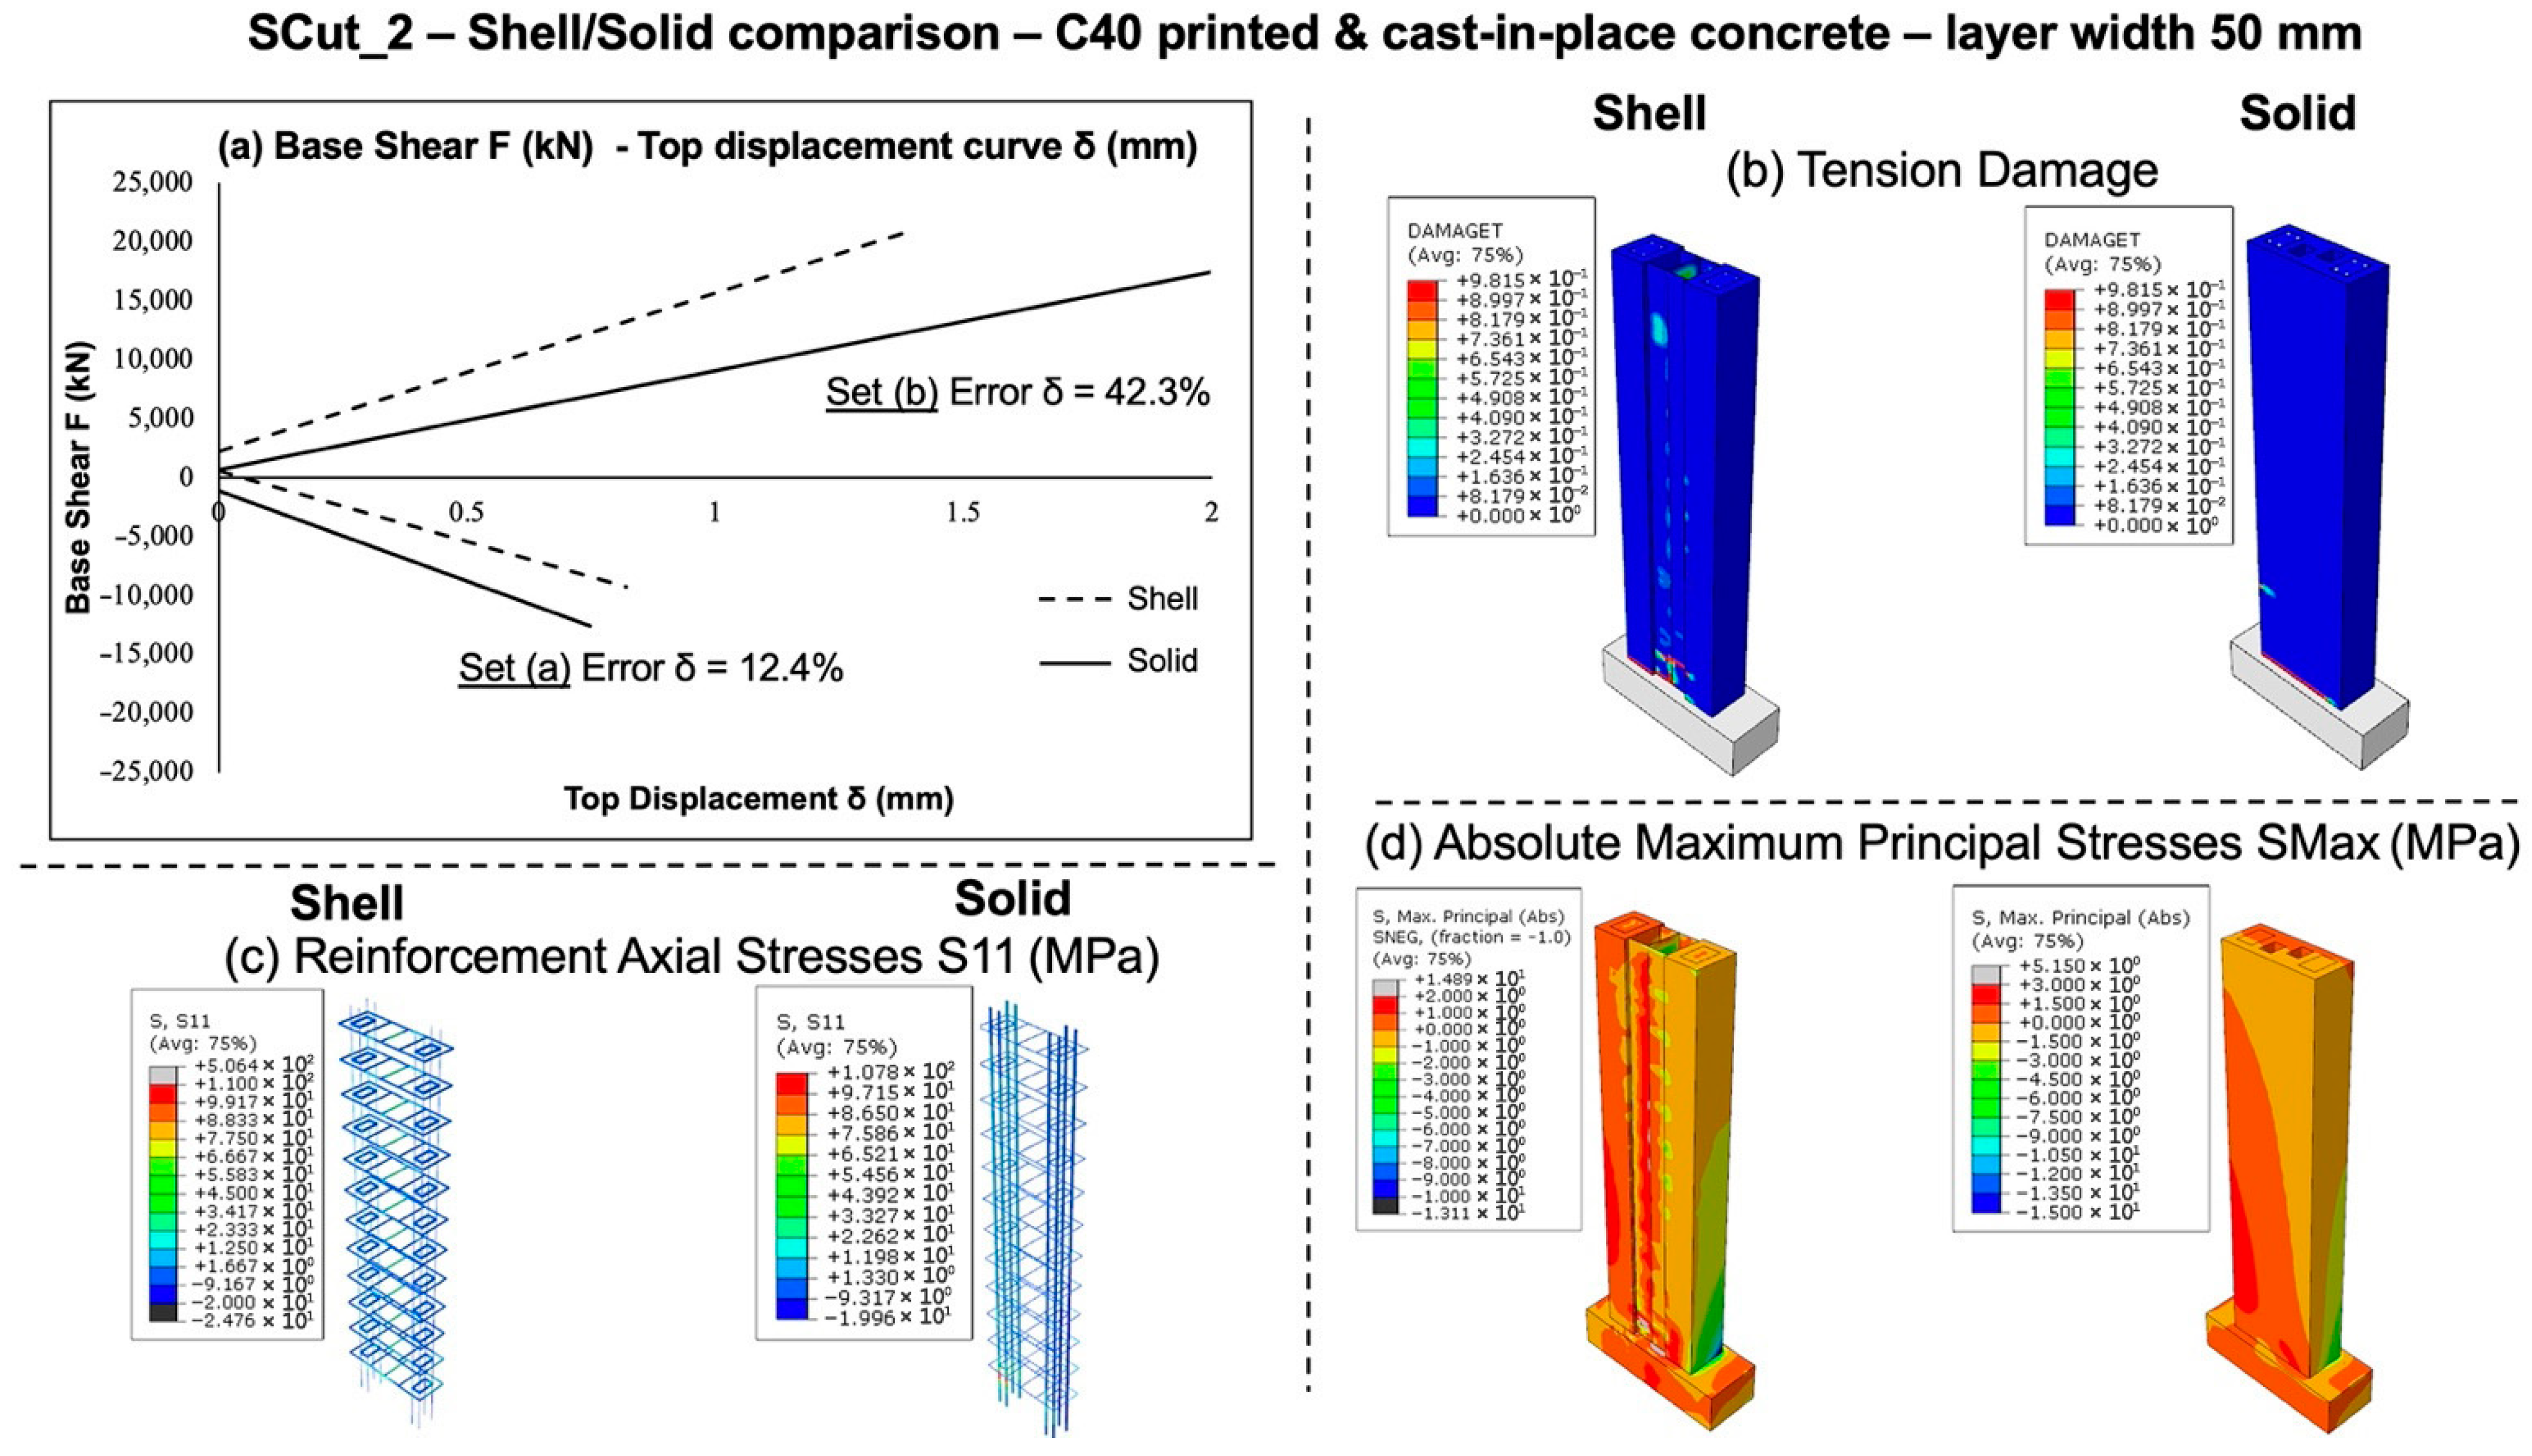
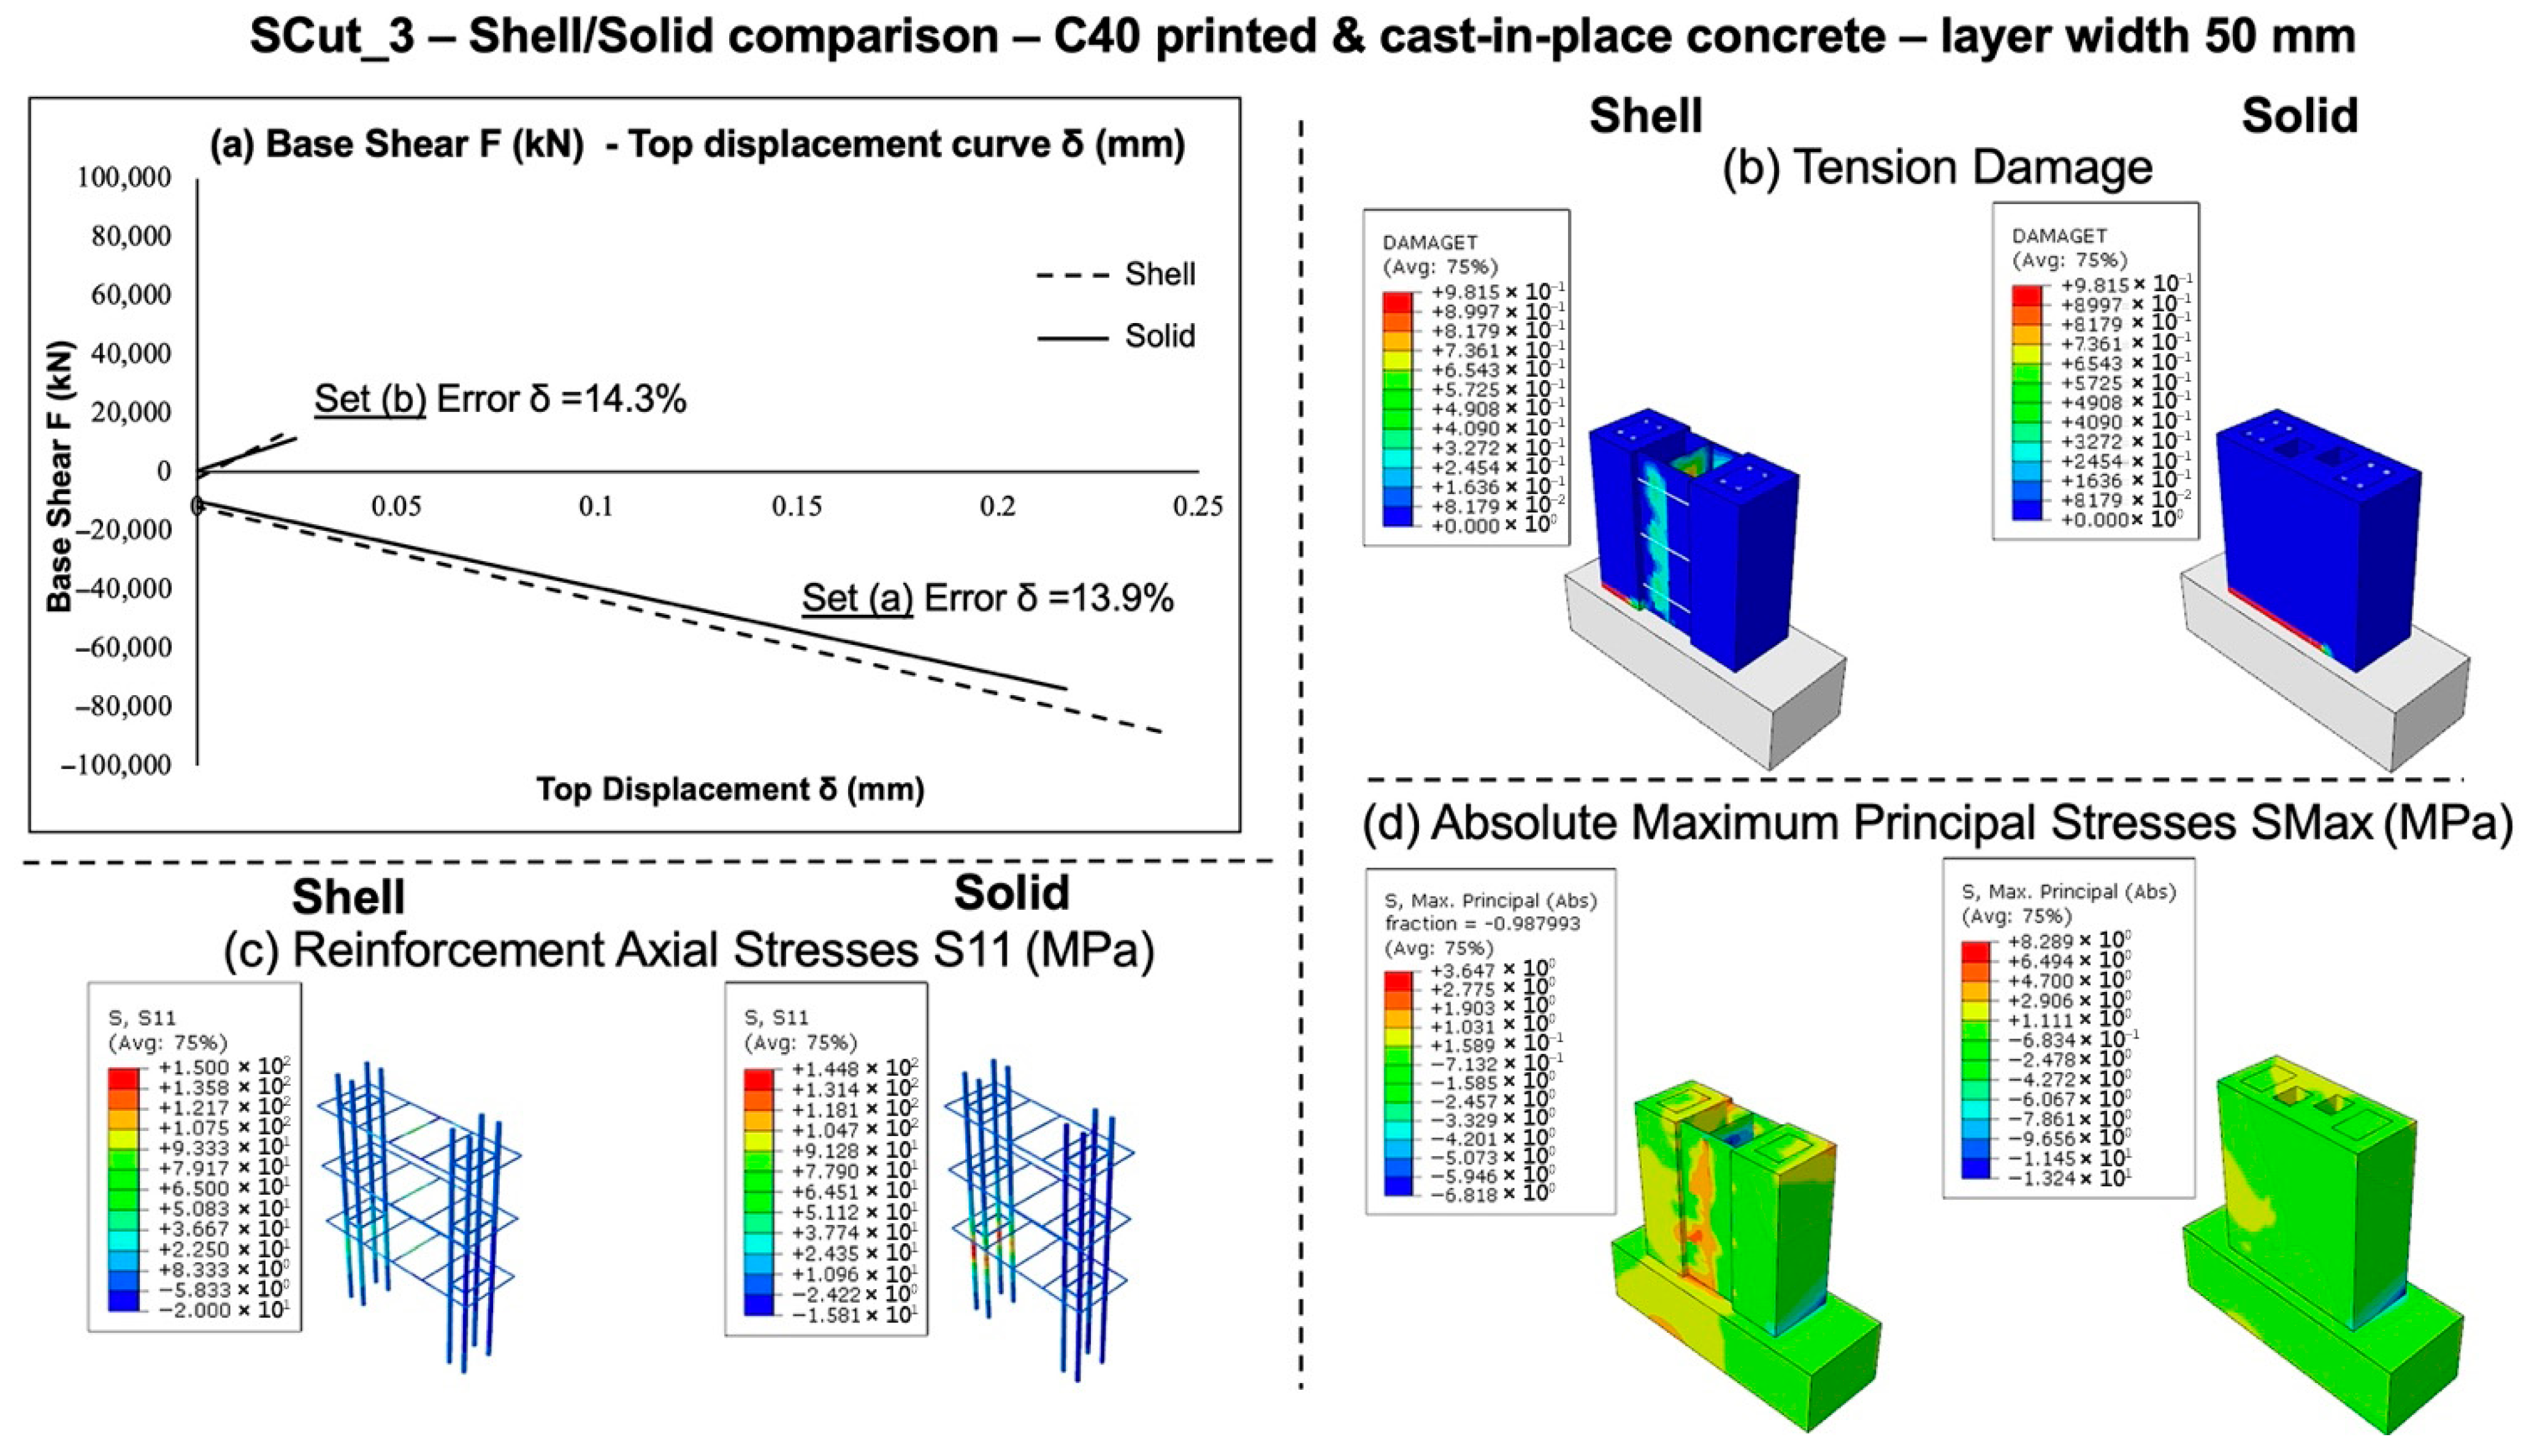
The results presented in Figure 22, Figure 23 and Figure 24 indicate that stress distributions within both printed and cast concrete, as well as in steel reinforcements (vertical and horizontal), are satisfactorily represented in the shell-based models compared to the full-solid ones. Additionally, when examining the base shear F versus top displacement δ curves, slight differences in peak base force were observed; thus, the lateral strength of the 3DPC walls is accurately represented through shell-element modelling. As for the displacement response, which reflects the overall stiffness of the wall, some differences were observed and mainly in wall “SCut_2” (Figure 22). This deviation could be attributed to the limited ability of shell elements to represent out-of-plane stiffness, which affects the top displacement to some extent. Nevertheless, this variation is considered to remain within acceptable margins of error, as the relative patterns of stress and deformation remain consistent. Thus, the use of shell elements for the simulation of reinforced 3D-printed concrete walls is deemed as an efficient modelling technique, capable of allowing the accurate investigation of the seismic response of the walls at a structural scale.
Future research to be conducted will expand upon the shell-based modelling technique by constructing a full-scale shell-based model of the two-story building into the nonlinear FEA software. More specifically, the full-scale model will allow for a better and more detailed understanding of the global seismic response. Furthermore, the computational efficiency is expected to be even more important in these future models, by allowing for a faster iterative design and optimization for 3D-printed concrete buildings.

4. Discussion

In this paper, a methodology for the structural design of a low-rise building constructed with 3D-printed concrete was discussed. The structure was simulated using SAP2000, following the guidelines of Eurocodes. Through the proposed analytical methodology, which is based on the conventional Mechanics stress distribution formulas, no wall is expected to fail at its top free edge under the applied loads. Simultaneously, the same piers on their bottom cross-sections exhibited failure. These initial predictions are validated through finite element analysis.
The nonlinear finite element simulations offer a valuable insight into the failure mechanisms of the examined unreinforced 3D-printed concrete (3DPC) walls. As illustrated in Figure 9, Figure 10, Figure 11, Figure 12, Figure 13 and Figure 14, the tension damage plots suggest that the dominant failure mode is tensile cracking, which occurs in localized regions, while minimal stress redistribution is observed. This behavior indicates a typical brittle failure behavior. In the case of the wall “SCut_1,” under the printing patterns I, III, and V, the analysis showed that horizontal tensile cracks were initially formed, eventually evolving into vertical cracking concentrated near mid-height or close to the wall ends. This pattern suggests failure primarily driven by flexural tension, either at the base or at the top of the wall. Adequate performance was only observed under the second set of internal forces and specifically when printing patterns I and V were used, regardless of the two examined concrete classes. The use of the higher-strength C60-printed concrete class reduced the extent of the observed tension damage, but it did not prevent failure entirely, confirming that increased strength leads to higher bearing capacity, but does not affect the brittle response. Regarding the wall “SCut_2,” tensile failure also occurred under both load sets and across both printing patterns I and II. Printing patterns III, IV, and V failed prematurely; thus, it was deemed unnecessary to be presented. The presence of the vertical cracks in these cases can be attributed mainly to the larger aspect ratio of the wall, which leads to increased flexural demands. Thus, the unreinforced wall failed to demonstrate the necessary structural safety. Lastly, for wall “SCut_3”, finite element analysis results are presented only for pattern II, as all other examined patterns failed prematurely. Under the first and second load sets, “SCut_3” exhibited clear failure when C40-printed concrete was used. However, when C60 class-printed concrete was used, the wall’s performance improved, remaining structurally adequate. This result is attributed to the wall’s small aspect ratio, which reduces bending effects. Nevertheless, the discussed findings confirm that unreinforced 3DPC walls are highly prone to brittle failure, showcasing limited capacity for stress redistribution or energy dissipation. The failure is heavily influenced by both the geometry and the selected infill pattern, with pattern V generally offering slightly improved overall performance for the wall “SCut_1”.
The proposed reinforcement strategy for 3D-printed concrete walls, which includes cast-in-place vertical boundary elements with embedded vertical reinforcement and horizontal bed-joint reinforcement, directly addresses two major challenges associated with 3DPC: (a) the weak interlayer interfaces and (b) the limited ductility and shear resistance of unreinforced walls. Firstly, the cast-in-place concrete in the boundary elements ensures sufficient confinement and bonding between the concrete material and the embedded rebars, thus mitigating the interfaces weakness challenge. Secondly, the implementation of horizontal bed-joint reinforcement across the printed layers enhances the out-of-plane stability and significantly improves the in-plane shear capacity of the walls. It is widely accepted that reinforcement is essential in seismic design; thus, the reinforcement configuration proposed in this study was adjusted to the geometric, constructional, and material-specific characteristics of 3DPC, suggesting a more practical and efficient solution within the limits of additive manufacturing.
Aiming to limit the computational cost of such numerical analysis, simplified numerical models were developed using shell elements. To quantify the computational efficiency of shell element-based modelling in comparison to the full solid models, simulation times were captured for both modelling approaches. The three reference wall configurations were analyzed under generally similar loading conditions (the internal forces presented in Table 2), while using identical mesh density and boundary conditions. The solid-based models required approximately 45, 55, and 25 min for “SCut_1”, “SCut_2”, and “SCut_3”, respectively. On the other hand, the shell-based simulations required significantly lower computational times. Specifically, 29, 37, and 14 min were noted, respectively. These reduced computational times correspond to a reduction range between 33.0% and 45.0%. The reduction can be attributed not only to the dimensional simplification of the shell elements—which indeed have one less dimension when compared to solid elements—but also to the significant decrease in the number of degrees of freedom and nodes used in the model. In fact, solid models contain several hundred thousand nodes—mesh refinement-dependent—while the shell-based models require only a small fraction of that. Therefore, computational memory consumption and solver time are reduced. On top of that, the processing requirements are less demanding, allowing for the simulations to take place on standard computational resources.
Despite this simplification, the structural responses captured by shell models remain generally accurate when compared to the solid-based simulations. Given the relatively small differences in stress fields and deformation patterns, the implementation of shell elements can be deemed as generally efficient in early design phases or in large-scale simulations where computational time is critical.

5. Conclusions

This paper proposed a Eurocode-compliant design methodology for 3D-printed concrete walls in a two-story building, combining analytical and numerical approaches to assess their seismic performance. The following key conclusions can be drawn from the study:
-
An elastic modal response spectrum analysis was initially conducted to identify the most critical wall segments, which were used to evaluate the performance of 3D-printed concrete (3DPC) walls under bi-directional seismic loading in the subsequent analysis.
-
A simplified analytical methodology was applied for the initial assessment of the three critical wall segments, in accordance with EN 1996-1 [39] principles for masonry structures. The method focuses on stress checks at cross-section level under combined axial, shear, and bending loads. Initial estimations showed that the unreinforced 3D-printed concrete walls were unlikely to fail at their top free edge under the applied loading conditions. In contrast, unreinforced 3D-printed concrete walls showcased tensile failure at their base. These predictions were later validated through the finite element simulations.
-
Numerical simulations confirmed that unreinforced 3D-printed concrete walls generally exhibit brittle failure modes, especially when subjected to increased seismic demands. The failure mode proved to be dimensional-dependent, where the slenderest wall “SCut_2” failed dramatically due to increased flexural demands. In contrast, the wall “SCut_3” showcased minimal failure due to having the smallest aspect ratio of the three examined walls, thus minimal flexural demands. Overall, the unreinforced 3DPC walls are deemed insufficient to provide safety and deformation capacity in general.
-
However, when the 3DPC wall models were reinforced with the proposed reinforcing strategy—by implementing vertical boundary elements made of cast-in-place concrete and bed-joint reinforcement between the printed concrete layers—they demonstrated enhanced lateral load capacity and more controlled failure modes. Flexural or flexural–shear failure modes were observed, depending greatly on the walls’ geometry and printing parameters.
-
Shell element-based numerical models were also evaluated aiming to reduce the high computational cost observed in the full solid models. The results of these analyses indicated that the stresses distributions in concrete and steel were accurately captured in the shell-based numerical models. Moreover, the base shear vs. top displacement response closely matched the response of the fully solid models. Minor discrepancies in displacements were noted (mostly in wall “SCut_2”), most likely due to limitations in representing the out-of-plane stiffness. Nevertheless, these deviations are considered to be within the acceptable bounds as the relative patterns of stress and deformation remained consistent. Overall, shell-element models proved to be computationally efficient and reliable for simulating the global behavior of reinforced 3DPC walls.
In summary, this study highlights the critical importance of reinforcement in 3D-printed concrete structural walls, particularly in seismic applications. While unreinforced configurations may be adequate under light loads and for walls with lower aspect ratio, they appear unable to provide the necessary safety and ductile response under seismic dynamic loading. In contrast, hybrid wall systems, inspired by conventional masonry design principles and practices, suggest an efficient solution to enhance structural behavior and resilience.
Finally, it is considered both important and necessary that future research shifts its focus from the isolated investigation of 3DPC walls to the global analysis of entire 3D-printed buildings, integrating parametric design variations directly into full-scale models. This direction will enable a more realistic understanding of seismic performance and support the development of reliable design guidelines for 3D-printed structures. Further research should also account for interlayer bonding degradation and time-dependent effects, which were not explicitly modeled in this research study. Sophisticated material modeling techniques could be utilized in future numerical modelling. For instance, the use of cohesive interfaces or tie-break elements would most likely allow for a more comprehensive and accurate representation of the delicate horizontal interfaces between printed concrete layers. In fact, the investigation of the anisotropic-dependent failure modes will be allowed. Such modeling strategies, although high computationally demanding and intensive, are especially relevant when research focuses on material-scale behavior or when experimental calibration data are available.

Author Contributions

Conceptualization, C.G. and A.C.; methodology, C.G., A.C. and L.M.; software, C.G.; validation, C.G. and A.C.; formal analysis, C.G. and A.C.; investigation, C.G., A.C. and L.M.; resources, C.G., A.C., L.M. and K.K.; data curation, C.G., A.C., L.M. and K.K.; writing—original draft preparation, C.G.; writing—review and editing, C.G., A.C. and L.M.; visualization, C.G. and A.C.; supervision, K.K.; project administration, K.K. All authors have read and agreed to the published version of the manuscript.

Funding

This research received no external funding.

Data Availability Statement

The original contributions presented in the study are included in the article; further inquiries can be directed to the corresponding author.

Acknowledgments

The authors would like to gratefully thank all the members of the Laboratory of Experimental Strength of Materials and Structures at Aristotle University of Thessaloniki for their valuable support and collaboration.

Conflicts of Interest

The authors declare no conflicts of interest.

Abbreviations

The following abbreviations are used in this manuscript:
CBM wallConcrete block masonry wall
SCutSection cut
3DPCThree-dimensional-printed concrete
CDPConcrete-damaged plasticity
SMaxMax principal stress

References

  1. Apis Cor. Fundamentals of Construction 3D Printing, C3D-1100; Apis Cor: Melbourne, FL, USA, 2021. [Google Scholar]
  2. Dilberoglu, U.M.; Gharehpapagh, B.; Yaman, U. The role of additive manufacturing in the era of Industry 4.0. Procedia Manuf. 2017, 11, 545–554. [Google Scholar] [CrossRef]
  3. Barbosa, F.; Woetzel, J.; Mischke, J. Reinventing Construction: A Route to Higher Productivity; McKinsey Global Institute: New York, NY, USA, 2017. [Google Scholar]
  4. U.S. Bureau of Labor Statistics. Productivity. Available online: https://www.bls.gov/ (accessed on 20 May 2025).
  5. Guidetti, F. Energy Consumption in Production of Concrete. Geoplast 2017. Available online: https://www.geoplast.com (accessed on 20 May 2025).
  6. Uratani, J.M.; Griffiths, S. A forward looking perspective on the cement and concrete industry: Implications of growth and development in the Global South. Energy Res. Soc. Sci. 2023, 97, 103051. [Google Scholar] [CrossRef]
  7. U.S. Environmental Protection Agency. The State of the Practice of Construction and Demolition Material Recovery; EPA: Washington, DC, USA, 2017.
  8. Eurostat. Hourly Labour Costs. Available online: https://ec.europa.eu/eurostat (accessed on 21 May 2025).
  9. Harbert, T. RLB Construction Cost Report North America Q2 2021; Rider Levett Bucknall: Phoenix, AZ, USA, 2021. [Google Scholar]
  10. Athens Chamber of Tradesmen. Labour Cost: 8.6% Increase in the Second Quarter. EEA, 2024. Available online: https://www.eea.gr (accessed on 21 May 2025).
  11. Liliopoulou, M. Construction Industry: Concerns Over Labor Shortage—Fears of Project Delays. Ethnos, 2024. Available online: https://www.ethnos.gr (accessed on 21 May 2025).
  12. Papakonstantinou, G. Projects at Risk Due to the Lack of Working “Hands”. Insider, 2023. Available online: https://www.insider.gr (accessed on 21 May 2025).
  13. Greener Ideal. Is 3D Printing the Next Big Thing in Sustainable Housing? Greener Ideal, 2023. Available online: https://www.greenerideal.com (accessed on 21 May 2025).
  14. Yossef, M.; Chen, A. Applicability and Limitations of 3D Printing for Civil Structures. In Proceedings of the Conference on Autonomous and Robotic Construction of Infrastructure, Ames, IA, USA, 2–3 June 2015. [Google Scholar]
  15. Liu, C.; Wang, Z.; Wu, Y. 3D printing concrete with recycled sand: The influence mechanism of extruded pore defects on constitutive relationship. J. Build. Eng. 2023, 68, 106279. [Google Scholar] [CrossRef]
  16. Jia, Z.; Zhou, M.; Chen, Y. Effect of steel fiber shape and content on printability, microstructure and mechanical properties of 3D printable high strength cementitious materials. Case Stud. Constr. Mater. 2024, 20, e01936. [Google Scholar] [CrossRef]
  17. Chortis, A.G.; Melidis, L.N.; Katakalos, K.V.; Iliadi-Manou, A.G. Geometry optimization of arched stone structures under gravity and seismic type loadings. In Proceedings of the COMPDYN 2023, Athens, Greece, 12–14 June 2023. [Google Scholar]
  18. Pemas, S.; Kladovasilakis, N.; Pechlivani, E.M. Utilizing LDPE as second life of waste plastic through pellet extruder 3D printing. In Supply Chains, Proceedings of the ICSC 2024, Katerini, Greece, 24–26 May 2024; Springer: Cham, Switzerland, 2024; pp. 26–38. [Google Scholar]
  19. Gibson, I.; Rosen, D.; Stucker, B.; Khorasani, M. Additive Manufacturing Technologies, 3rd ed.; Springer: New York, NY, USA, 2021. [Google Scholar]
  20. Alkhalidi, A.; Hatuqay, D. Energy efficient 3D printed buildings: Material and techniques selection worldwide study. J. Build. Eng. 2020, 30, 101261. [Google Scholar] [CrossRef]
  21. Wolfs, R.J.M.; Bos, F.P.; Salet, T.A.M. Early age mechanical behaviour of 3D printed concrete: Numerical modelling and experimental testing. Cem. Concr. Res. 2018, 106, 103–116. [Google Scholar] [CrossRef]
  22. Wolfs, R.J.M.; Bos, F.P.; Salet, T.A.M. Hardened properties of 3D printed concrete: The influence of process parameters on interlayer adhesion. Cem. Concr. Res. 2019, 119, 132–140. [Google Scholar] [CrossRef]
  23. Panda, B.; Paul, S.C.; Tan, M.J. Anisotropic mechanical performance of 3D printed fiber reinforced sustainable construction material. Mater. Lett. 2017, 209, 146–149. [Google Scholar] [CrossRef]
  24. Le, T.T.; Austin, S.A.; Lim, S. Hardened properties of high-performance printing concrete. Cem. Concr. Res. 2012, 42, 558–566. [Google Scholar] [CrossRef]
  25. BESIX3D. 3D Concrete Printing. Available online: https://3d.besix.com/ (accessed on 23 May 2025).
  26. Wang, J.; Zhang, P.; Feng, J. Experimental study and design approach on 3D printed concrete walls under eccentric axial compression. Case Stud. Constr. Mater. 2024, 20, e01929. [Google Scholar] [CrossRef]
  27. Delavar, M.A.; Chen, H.; Sideris, P. Analysis and design of 3D printed reinforced concrete walls under in-plane quasi-static loading. Eng. Struct. 2024, 303, 115812. [Google Scholar]
  28. Delavar, M.A.; Chen, H.; Sideris, P. Design of 3D printed concrete walls under in-plane seismic loading. In Proceedings of the 12th National Conference on Earthquake Engineering, Salt Lake City, UT, USA, 27 June–1 July 2022. [Google Scholar]
  29. Liu, C.; Liang, Z.; Liu, H. Seismic performance of 3D printed reinforced concrete walls: Experimental study and numerical simulation. Eng. Struct. 2025, 333, 116211. [Google Scholar] [CrossRef]
  30. Melidis, L.; Bares, D.; Katakalos, K.; Kotoulas, L. Design of a Two-Story Reinforced Masonry Building with a Novel Clay Unit Using Laboratory Measurements. In Proceedings of the 18th International Brick and Block Masonry Conference, IB2MaC 2024, Birmingham, UK, 21–24 July 2024; Milani, G., Ghiassi, B., Eds.; Lecture Notes in Civil Engineering. Springer: Cham, Switzerland, 2025; Volume 613. [Google Scholar] [CrossRef]
  31. Bares, D.; Melidis, L.; Katakalos, K.; Kotoulas, L. A Case Study for Seismic Assessment of Masonry Heritage Building Following Eurocode 8—Part 3 and Greek Code for Interventions (KADET). In Proceedings of the 18th International Brick and Block Masonry Conference, IB2MaC 2024, Birmingham, UK, 21–24 July 2024; Milani, G., Ghiassi, B., Eds.; Lecture Notes in Civil Engineering. Springer: Cham, Switzerland, 2025; Volume 613. [Google Scholar] [CrossRef]
  32. EN 1998-1; Eurocode 8: Design of Structures for Earthquake Resistance—Part 1: General Rules, Seismic Actions and Rules for Buildings. European Committee for Standardization (CEN): Brussels, Belgium, 2004.
  33. EN 1991-1-1; Eurocode 1: Actions on Structures—Part 1-1: General Actions—Densities, Self-Weight, Imposed Loads for Buildings. European Committee for Standardization (CEN): Brussels, Belgium, 2002.
  34. EN 1992-1-1; Eurocode 2: Design of Concrete Structures—Part 1-1: General Rules and Rules for Buildings. European Committee for Standardization (CEN): Brussels, Belgium, 2004.
  35. Aly, N.; Galal, K. In-plane cyclic response of high-rise reinforced concrete masonry structural walls with boundary elements. Eng. Struct. 2020, 219, 110918. [Google Scholar] [CrossRef]
  36. AbdelRahman, B.; Galal, K. Sensitivity of the seismic response of reinforced concrete masonry walls with boundary elements to design parameters. Eng. Struct. 2022, 255, 113931. [Google Scholar] [CrossRef]
  37. Penna, A.; Mandirola, M.; Rota, M. Experimental assessment of the in-plane lateral capacity of autoclaved aerated concrete (AAC) masonry walls with flat-truss bed-joint reinforcement. Constr. Build. Mater. 2015, 82, 155–166. [Google Scholar] [CrossRef]
  38. Baeen, S.D.; Dharek, M.S.; Raghunath, S. Effect of thin reinforcement in bed-joint on the compressive and shear strength of brick and block masonry: An experimental investigation. J. Build. Pathol. Rehabil. 2025, 10, 76. [Google Scholar] [CrossRef]
  39. EN 1996-1-1; Eurocode 6: Design of Masonry Structures—Part 1-1: General Rules for Reinforced and Unreinforced Masonry Structures. European Committee for Standardization (CEN): Brussels, Belgium, 2005.
Figure 1. Anisotropy of hardened 3D-printed concrete.
Buildings 15 03205 g001
Figure 2. (a) Plan view, (b) south elevation view, and (c) north elevation view of the two-story prototype building.
Buildings 15 03205 g002
Figure 3. (a) East elevation view, (b) west elevation view, and (c) SAP2000 Ultimate 26.0.0 shell element numerical model of the two-story prototype building.
Buildings 15 03205 g003
Figure 4. Modal analysis of the prototype two-story building where (a) translation—X contour of the 1st mode, (b) translation—Y contour of the 1st mode, (c) translation—X contour of the 2nd mode, and (d) translation—Y contour of the 2nd mode. For each mode, the natural period and the corresponding mass participation ratios ε in the X and Y directions are also provided.
Buildings 15 03205 g004
Figure 5. Printing wall patterns to be examined: (a) pattern I, (b) pattern II, (c) pattern III, (d) pattern IV, and (e) pattern V.
Buildings 15 03205 g005
Figure 6. Reference shells’ local axes used for the representation of the shell section’s internal forces.
Buildings 15 03205 g006
Figure 7. Shell stress-resultant (a) axial forces F33 in kN units, (b) out-of-plane bending moments M11 in kN-m units, and (c) shear forces F12 in kN units. The three reference cross-section cuts are highlighted.
Buildings 15 03205 g007
Figure 8. Stress distribution within the unreinforced reference 3DPC wall “SCut_1” in MPa units, where (a) S11 stresses, (b) S22 stresses, (c) S12 stresses, and (d) SMax principal stresses.
Buildings 15 03205 g008
Figure 9. (a) Plastic strains, (b) tension damage, and (c) compression damage on the unreinforced reference 3DPC wall “SCut_1”.
Buildings 15 03205 g009
Figure 10. Response of the reference unreinforced 3DPC wall “SCut_1” using printing patterns I, III, V, and C40 class-printed concrete, illustrated through tension damage plots for (a) set a and (b) set b of internal forces.
Buildings 15 03205 g010
Figure 11. Response of the reference unreinforced 3DPC wall “SCut_1” using printing patterns I, III, V, and C60 class-printed concrete, illustrated through tension damage plots for (a) set a and (b) set b of internal forces.
Buildings 15 03205 g011
Figure 12. Response of the reference unreinforced 3DPC wall “SCut_2” using printing patterns I, II, C40, and C60 class-printed concrete, illustrated through tension damage plots for set (a) of internal forces.
Buildings 15 03205 g012
Figure 13. Response of the reference unreinforced 3DPC wall “SCut_2” using printing patterns I, II, C40, and C60 class-printed concrete, illustrated through tension damage plots for set (b) of internal forces.
Buildings 15 03205 g013
Figure 14. Response of the reference unreinforced 3DPC wall “SCut_3” using printing patterns II, C40, and C60 class-printed concrete, illustrated through tension damage plots for set (a) and set (b) of internal forces.
Buildings 15 03205 g014
Figure 15. Reinforced 3DPC wall, where boundary elements and bed-joint reinforcement are used.
Buildings 15 03205 g015
Figure 16. Finite element simulation of the reinforced 3DPC wall “SCut_1” constructed with C40 class-printed and cast-in-place concrete, using (a) 50 mm layer width and (b) 30 mm layer width. The figures illustrate tension damage and axial stress in the reinforcement (in MPa units).
Buildings 15 03205 g016
Figure 17. Finite element simulation of the reinforced 3DPC wall “SCut_2” constructed with C40 class-printed and cast-in-place concrete using (a) 50 mm layer width and (b) 30 mm layer width. The figures illustrate tension damage and axial stress in the reinforcement (in MPa units).
Buildings 15 03205 g017
Figure 18. Finite element simulation of the reinforced 3DPC wall “SCut_3” constructed with C40 class-printed and cast-in-place concrete using (a) 50 mm layer width and (b) 30 mm layer width. The figures illustrate tension damage and axial stress in the reinforcement (in MPa units).
Buildings 15 03205 g018
Figure 19. Different failure types of reinforced 3DPC walls.
Buildings 15 03205 g019
Figure 20. Different parts that are used for shell-element-based wall numerical modelling.
Buildings 15 03205 g020
Figure 21. Numerical model of the boundary elements.
Buildings 15 03205 g021
Figure 22. Comparative shell-based and solid-based finite element analysis of the reference reinforced 3DPC wall “SCut_1”, using C40 class-printed and cast-in-place concrete. The printed concrete layer width was set to 50 mm. The presented results include (a) base shear (kN) vs. top displacement curve (mm), (b) tension damage distribution, (c) reinforcement axial stress (in MPa units), and (d) maximum principal stress (in MPa units).
Buildings 15 03205 g022
Figure 23. Comparative shell-based and solid-based finite element analysis of the reference reinforced 3DPC wall “SCut_2”, using C40 class-printed and cast-in-place concrete. The printed concrete layer width was set to 50 mm. The presented results include (a) base shear (kN) vs. top displacement curve (mm), (b) tension damage distribution, (c) reinforcement axial stress (in MPa units), and (d) maximum principal stress (in MPa units).
Buildings 15 03205 g023
Figure 24. Comparative shell-based and solid-based finite element analysis of the reference reinforced 3DPC wall “SCut_3”, using C40 class-printed and cast-in-place concrete. The printed concrete layer width was set to 50 mm. The presented results include (a) base shear (kN) vs. top displacement curve (mm), (b) tension damage distribution, (c) reinforcement axial stress (in MPa units), and (d) maximum principal stress (in MPa units).
Buildings 15 03205 g024
Table 1. Parameters of the concrete damaged plasticity model.
Parameterρ (10−9 t/m3)Dilation Angle ψ (deg)Eccentricity ε f b 0 f c 0 KViscosity Parameter
Value25.035.00.101.162/30.0002
Table 2. Two sets of internal forces demand for the three reference section cuts. Notation (a) and (b) refer to the two principal directions of seismic loading.
SCut ID F 1 (kN) F 2 (kN) F 3 (kN-m) M 1 (kN-m) M 2 (kN-m) M 3 (kN-m)
1 (a)67.832.4851.611.0034.325.28
1 (b)−78.82−1.22−263.58−0.63−52.86−7.58
2 (a)11.025.85−14.343.658.000.60
2 (b)−15.64−6.23−137.11−3.88−10.48−1.06
3 (a)65.9314.2010.435.292.511.08
3 (b)−52.03−21.18−158.24−4.46−4.61−2.20
Table 3. Walls’ geometric properties for printing infill patterns IV and V.
SCut ID—PatternA (cm2) I 1 (cm4) I 2 (cm4) w 1 (cm3) w 2 (cm3)
1—IV2097.0136,629.42,486,756.81093.04144.6
1—V2000.0140,416.72,461,041.71123.34101.7
2—IV1116.070,561.2323,650564.51078.8
2—V1050.070,290.6320,959.4562.31069.9
3—IV1116.070,561.2323,650564.51078.8
3—V1050.070,290.6320,959.4562.31069.9
Table 4. Normal σ and shear τ stress distribution in the reference cross-section cuts at the top of the walls’ segments, where the internal forces of Table 2 act. Printing patterns IV and V are used. Notation (a) and (b) refer to the two principal directions of seismic loading.
SCut ID—PatternIn-PlaneOut-of-Plane
Min   σ N + M 2 (MPa) Max   σ N + M 2 (MPa)τ (MPa) Min   σ N + M 1 (MPa) Max   σ N + M 1 (MPa)τ (MPa)
1 (a)—IV−0.611.100.320.150.340.01
1 (b)—IV−2.580.07−0.38−1.31−1.12−0.01
1 (a)—V−0.601.110.340.170.350.01
1 (b)—V−2.640.00−0.39−1.38−1.26−0.01
2 (a)—IV−0.870.610.10−0.780.520.05
2 (b)—IV−2.20−0.26−0.14−1.92−0.54−0.05
2 (a)—V−0.880.600.110.790.510.05
2 (b)—V−2.28−0.32−0.15−2.00−0.61−0.06
3 (a)—IV−0.190.330.59−0.841.030.13
3 (b)—IV−1.84−0.99−0.47−2.21−0.63−0.19
3 (a)—V−0.140.330.66−0.851.040.13
3 (b)—V−1.94−1.08−0.50−2.30−0.71−0.20
Table 5. Results of the proposed analytical methodology for response estimation of unreinforced 3DPC walls, evaluated at their free end where the internal forces are applied.
SCut IDInfill PatternCompressive Failure CheckTensile Failure Check
1IVNo failure—AdequateNo failure—Adequate
1VNo failure—AdequateNo failure—Adequate
2IVNo failure—AdequateNo failure—Adequate
2VNo failure—AdequateNo failure—Adequate
3IVNo failure—AdequateNo failure—Adequate
3VNo failure—AdequateNo failure—Adequate
Table 6. Normal σ and shear τ stress distribution in the reference cross-section cuts at the base of each reference wall. Printing patterns IV and V are used. Notation (a) and (b) refer to the two principal directions of seismic loading.
SCut ID—PatternIn-Plane Out-of-Plane
Min   σ N + M 2 (MPa) Max   σ N + M 2 (MPa)τ (MPa) Min   σ N + M 1 (MPa) Max   σ N + M 1 τ (MPa)
1 (a)—IV1.703.370.320.470.650.01
1 (b)—IV−5.19−2.64−0.38−1.47−1.36−0.01
1 (a)—V1.743.410.340.480.660.01
1 (b)—V−5.30−2.72−0.39−1.52−1.41−0.01
2 (a)—IV1.583.060.101.713.000.05
2 (b)—IV−5.68−3.74−0.14−4.56−3.19−0.05
2 (a)—V1.593.080.101.713.010.05
2 (b)—V−5.79−3.83−0.15−4.65−3.27−0.06
3 (a)—IV3.533.990.590.662.530.13
3 (b)—IV−4.79−3.88−0.47−4.47−2.88−0.19
3 (a)—V3.564.030.660.672.550.13
3 (b)—V−4.86−3.98−0.50−4.56−2.97−0.20
Table 7. Results of the proposed analytical methodology for response estimation of unreinforced 3DPC walls, evaluated at each wall’s base.
SCut IDInfill PatternCompressive Failure CheckTensile Failure Check
1IVNo failure—AdequateFailure—Inadequate
1VNo failure—AdequateFailure—Inadequate
2IVNo failure—AdequateFailure—Inadequate
2VNo failure—AdequateFailure—Inadequate
3IVNo failure—AdequateFailure—Inadequate
3VNo failure—AdequateFailure—Inadequate
Disclaimer/Publisher’s Note: The statements, opinions and data contained in all publications are solely those of the individual author(s) and contributor(s) and not of MDPI and/or the editor(s). MDPI and/or the editor(s) disclaim responsibility for any injury to people or property resulting from any ideas, methods, instructions or products referred to in the content.