Figure 1.
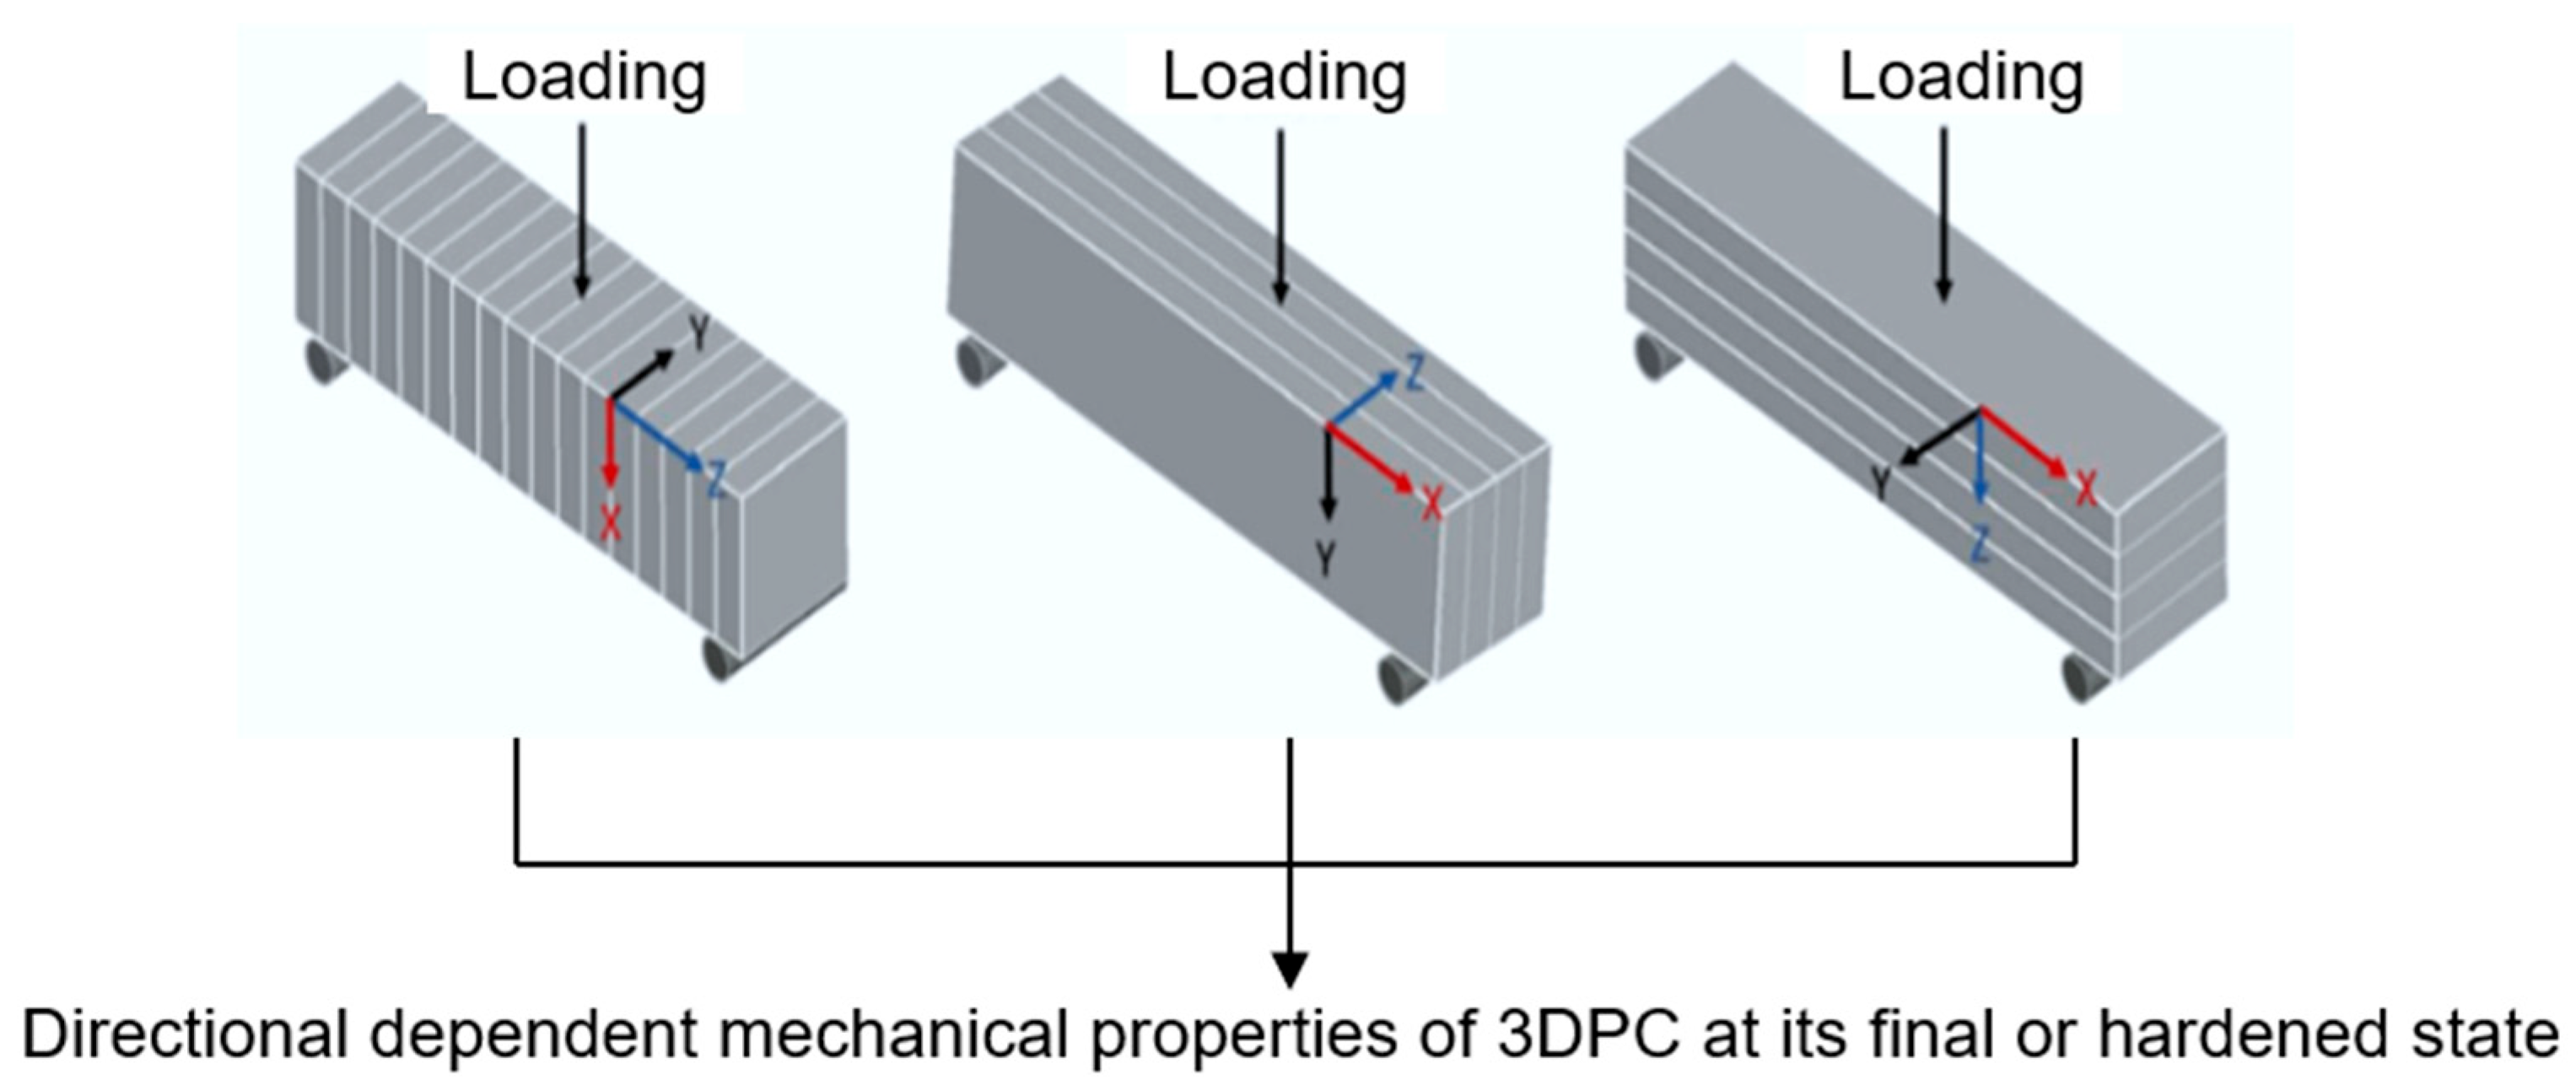
Anisotropy of hardened 3D-printed concrete.
Figure 1.
Anisotropy of hardened 3D-printed concrete.
Figure 2.
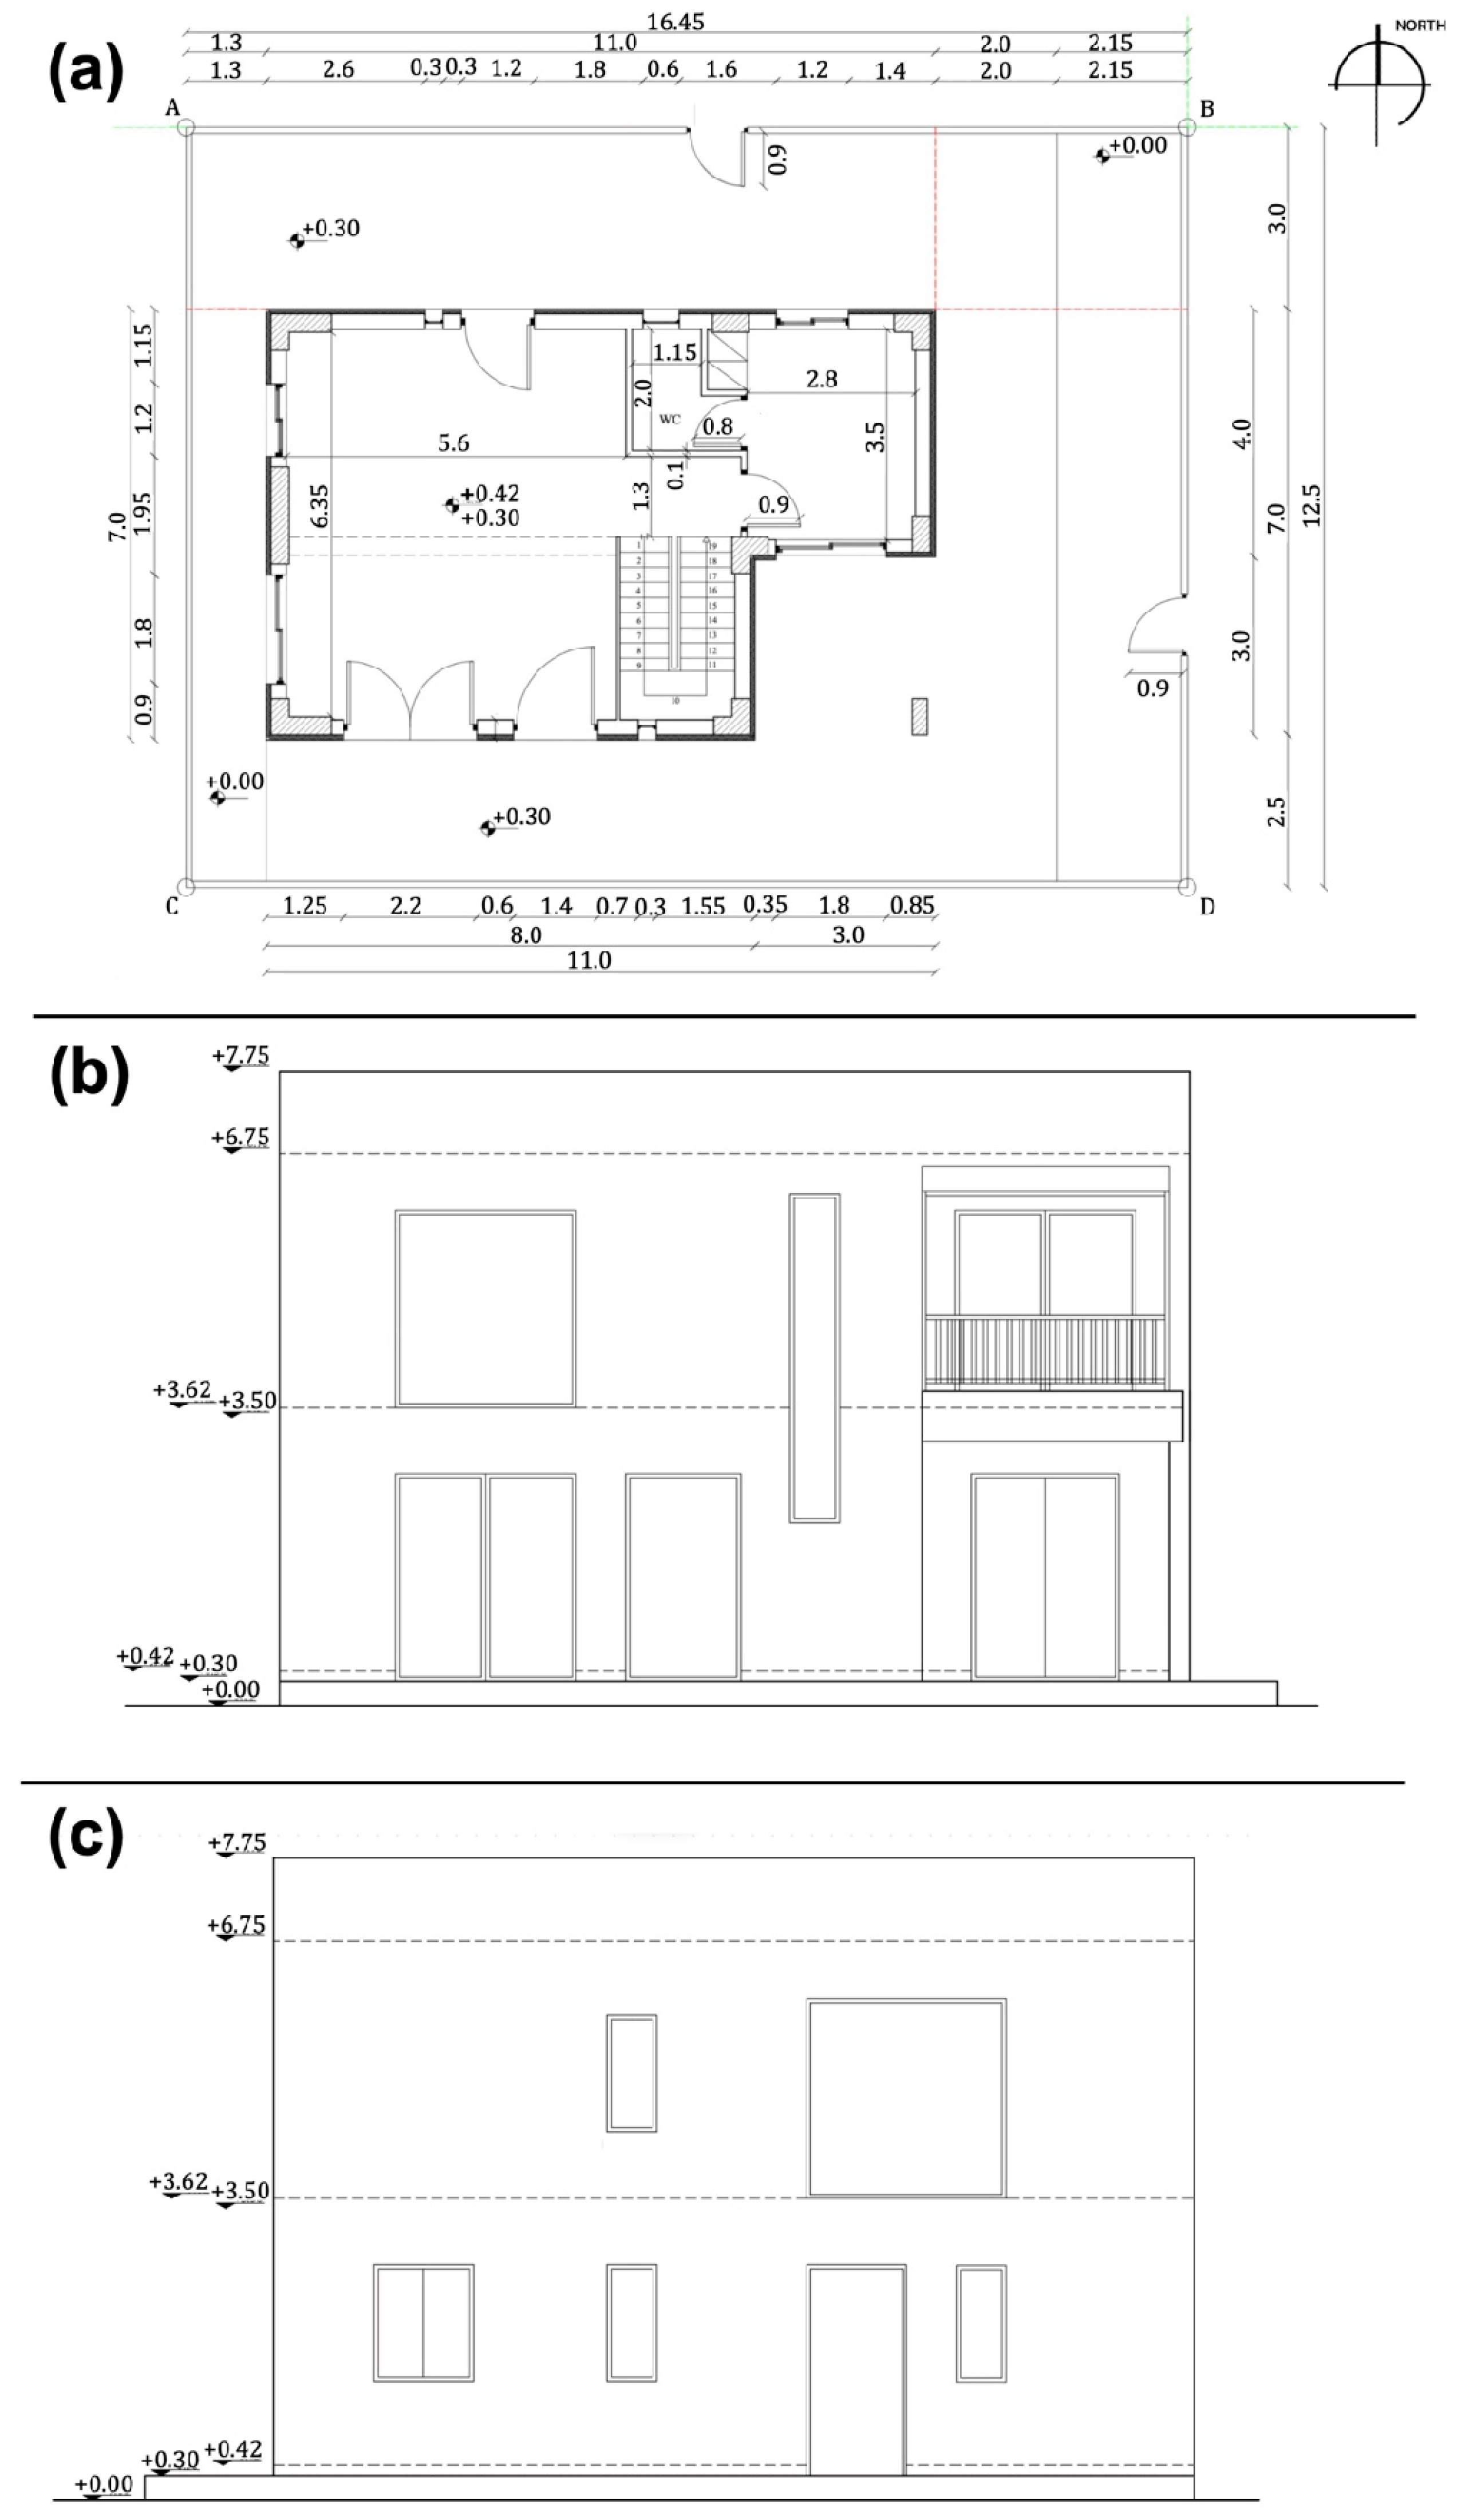
(a) Plan view, (b) south elevation view, and (c) north elevation view of the two-story prototype building.
Figure 2.
(a) Plan view, (b) south elevation view, and (c) north elevation view of the two-story prototype building.
Figure 3.
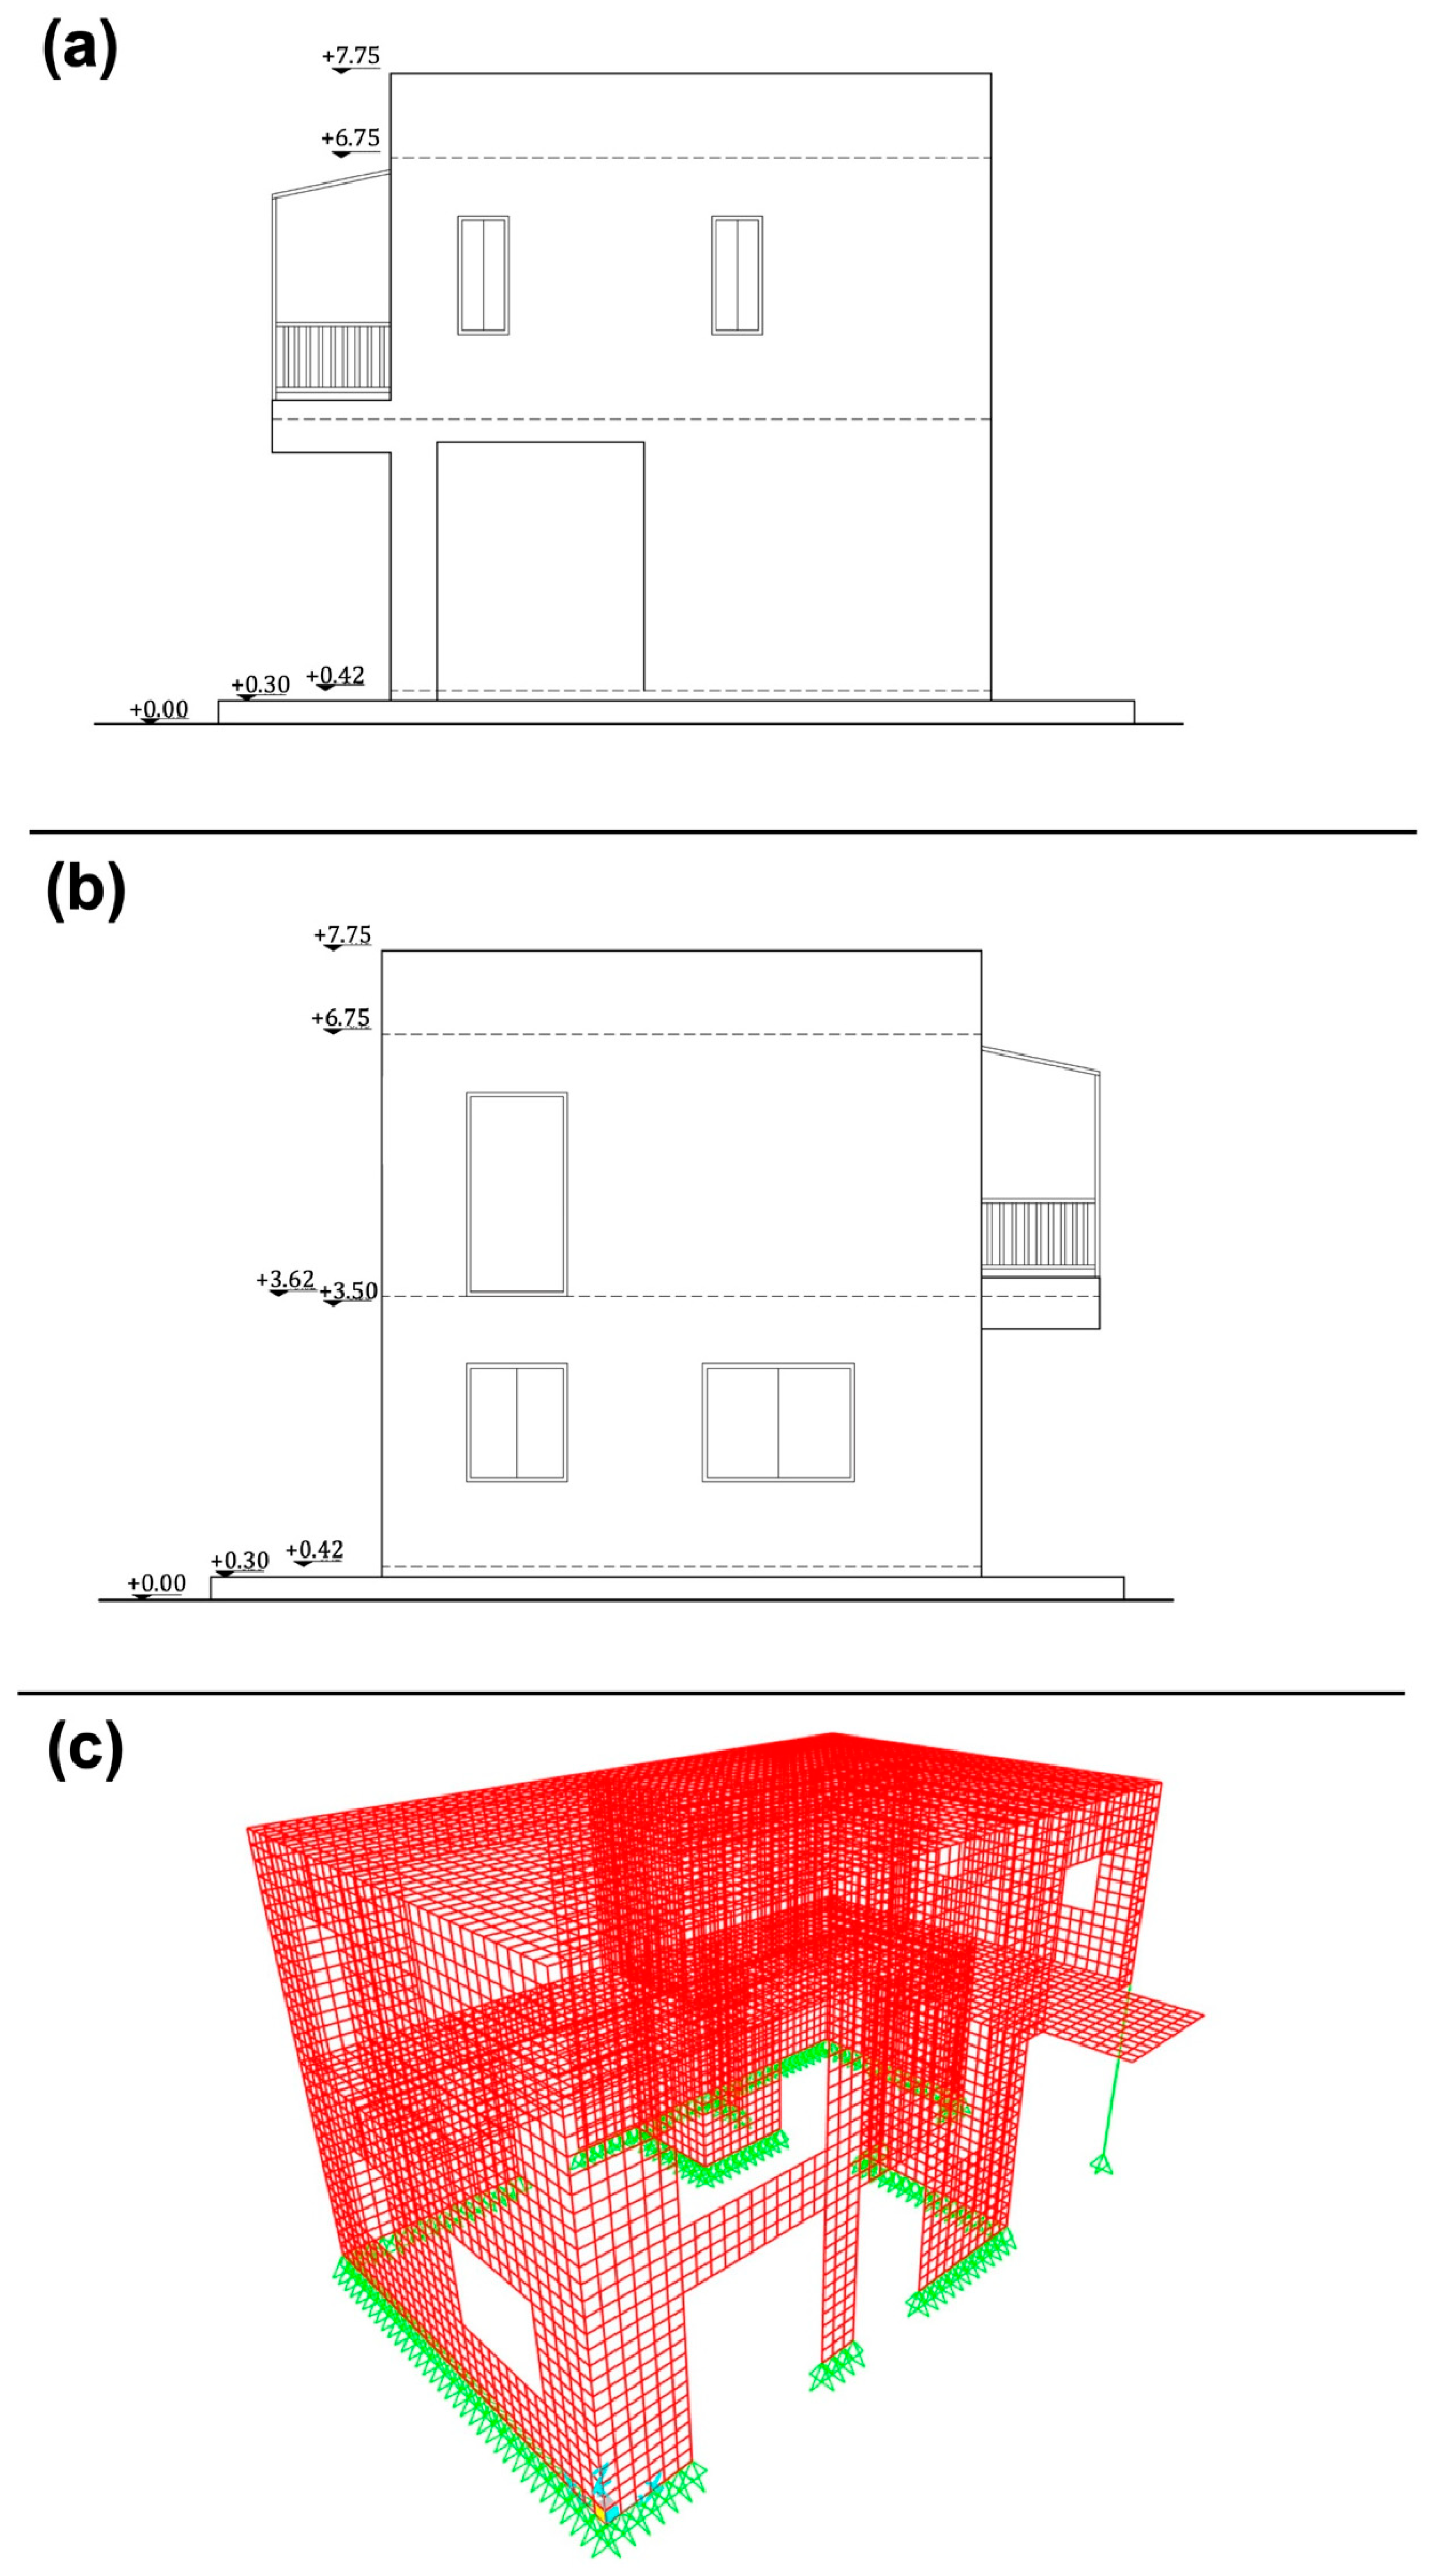
(a) East elevation view, (b) west elevation view, and (c) SAP2000 Ultimate 26.0.0 shell element numerical model of the two-story prototype building.
Figure 3.
(a) East elevation view, (b) west elevation view, and (c) SAP2000 Ultimate 26.0.0 shell element numerical model of the two-story prototype building.
Figure 4.
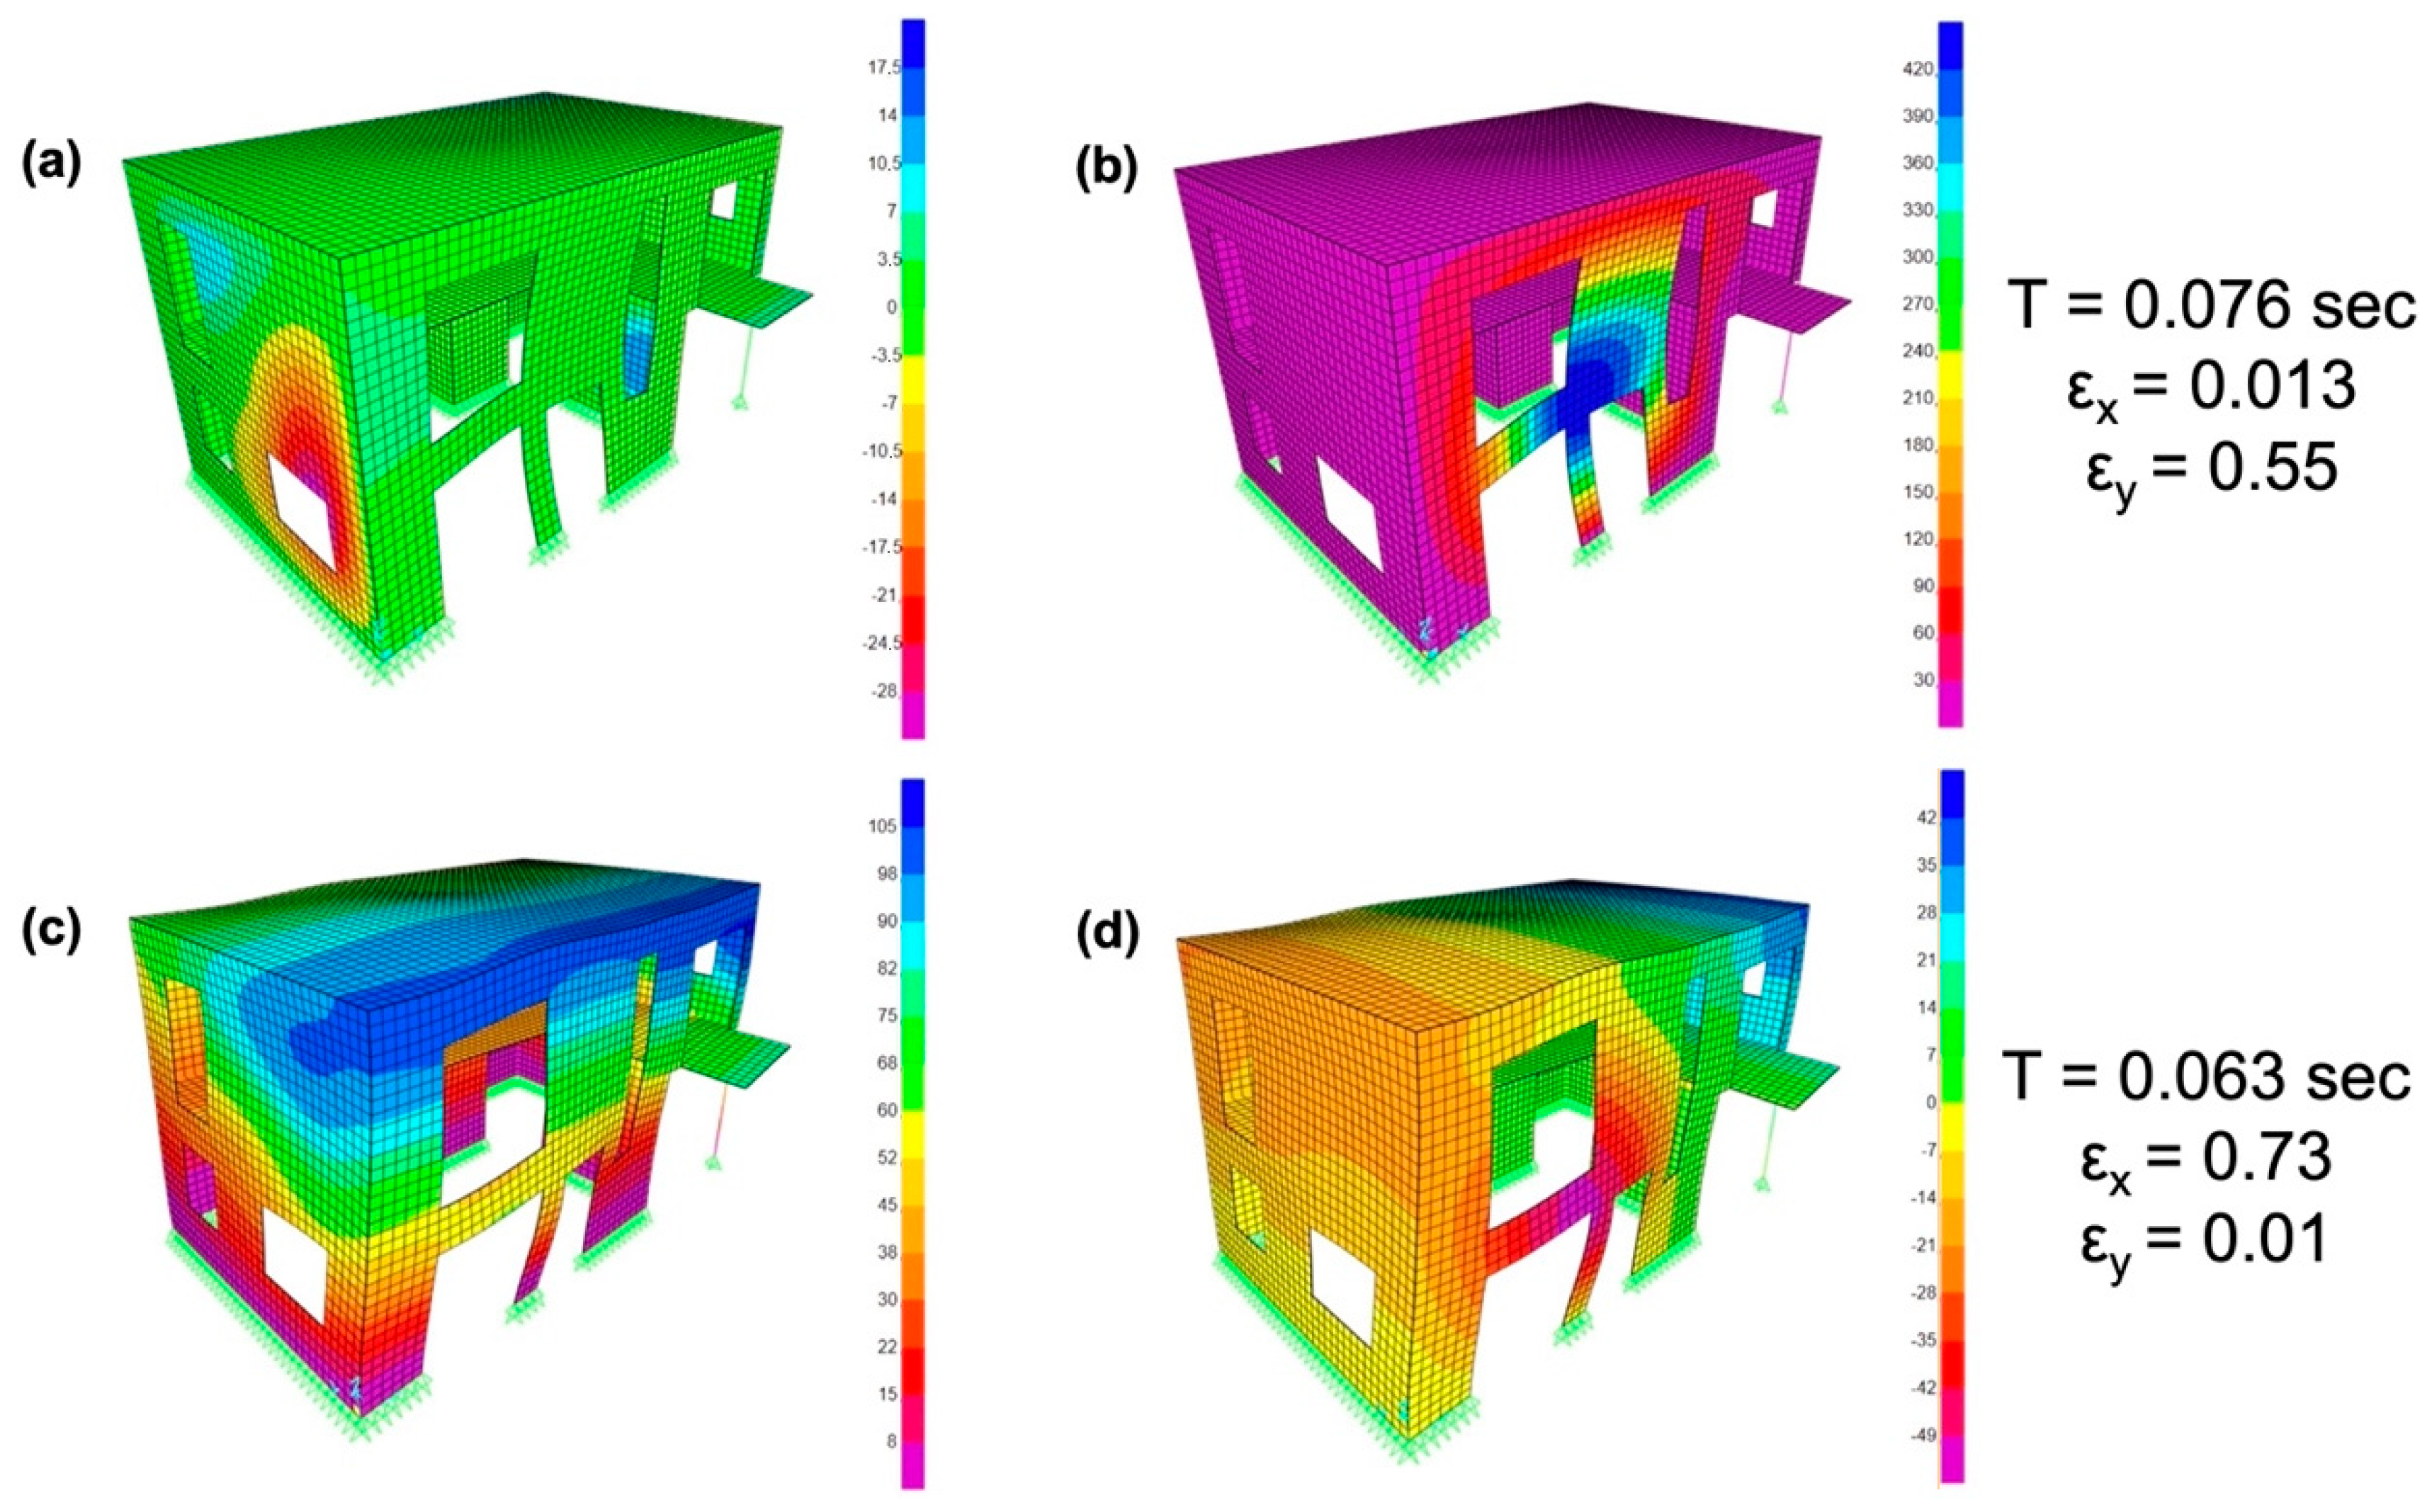
Modal analysis of the prototype two-story building where (a) translation—X contour of the 1st mode, (b) translation—Y contour of the 1st mode, (c) translation—X contour of the 2nd mode, and (d) translation—Y contour of the 2nd mode. For each mode, the natural period and the corresponding mass participation ratios ε in the X and Y directions are also provided.
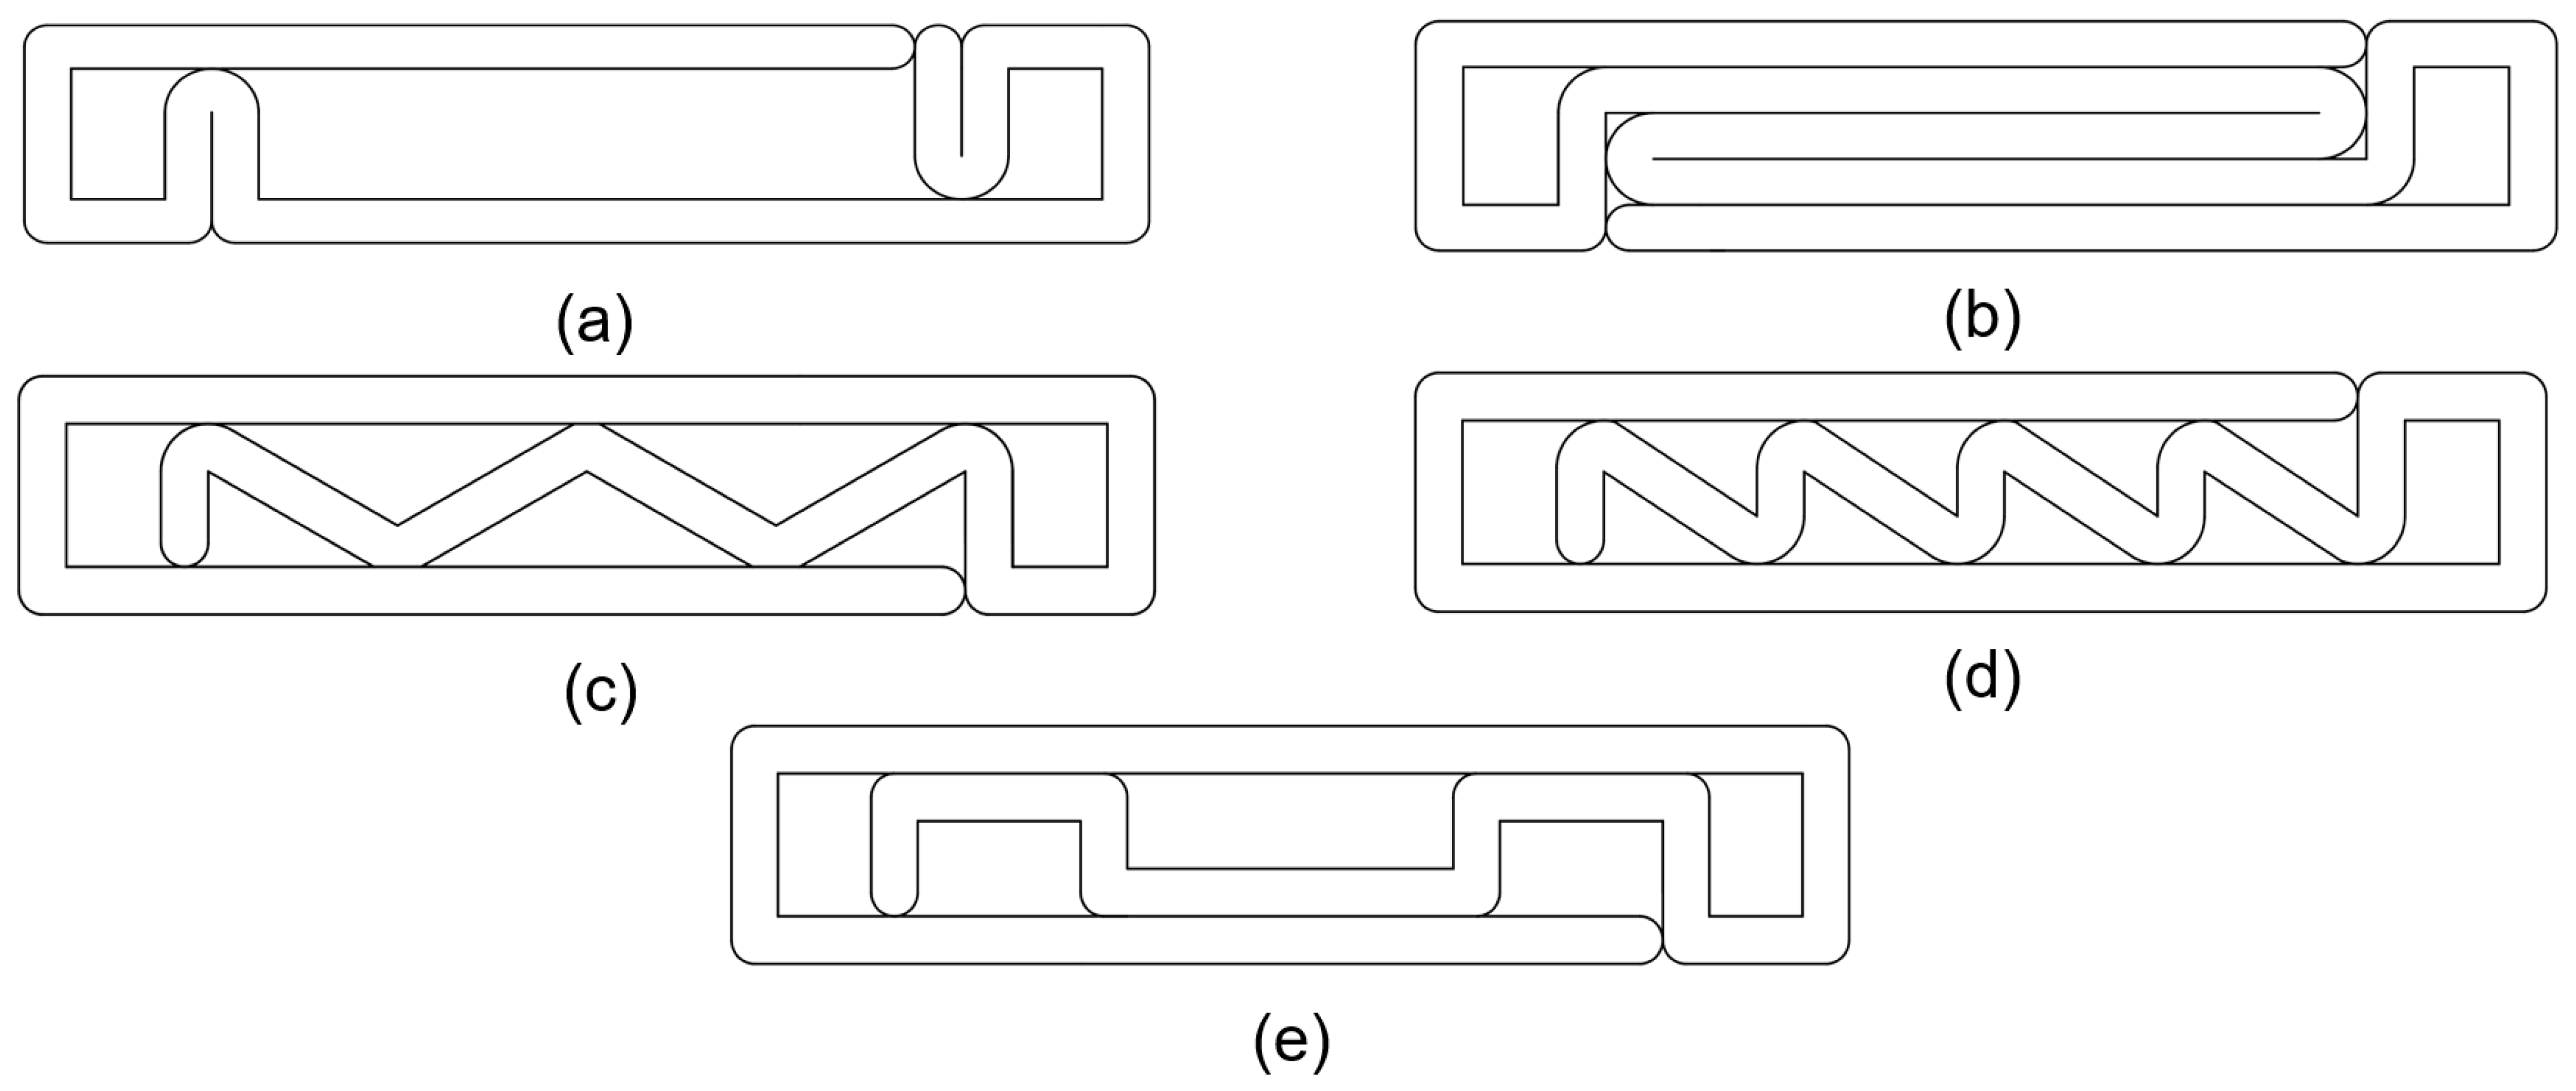
Figure 5.
Printing wall patterns to be examined: (a) pattern I, (b) pattern II, (c) pattern III, (d) pattern IV, and (e) pattern V.
Figure 5.
Printing wall patterns to be examined: (a) pattern I, (b) pattern II, (c) pattern III, (d) pattern IV, and (e) pattern V.
Figure 6.
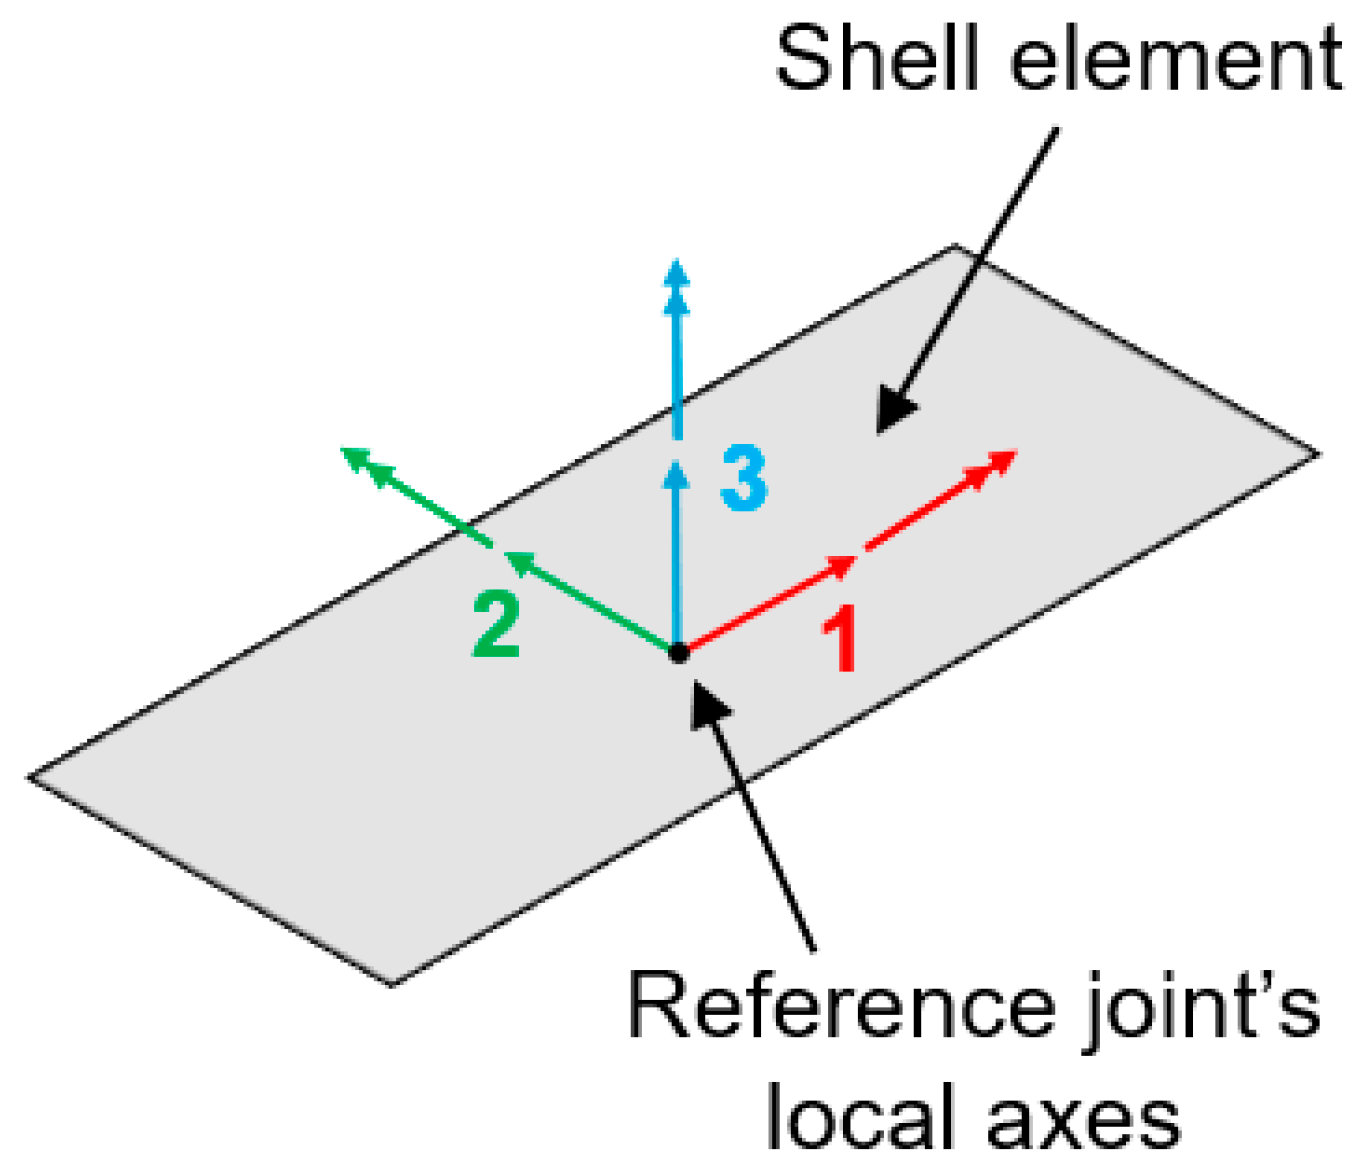
Reference shells’ local axes used for the representation of the shell section’s internal forces.
Figure 6.
Reference shells’ local axes used for the representation of the shell section’s internal forces.
Figure 7.
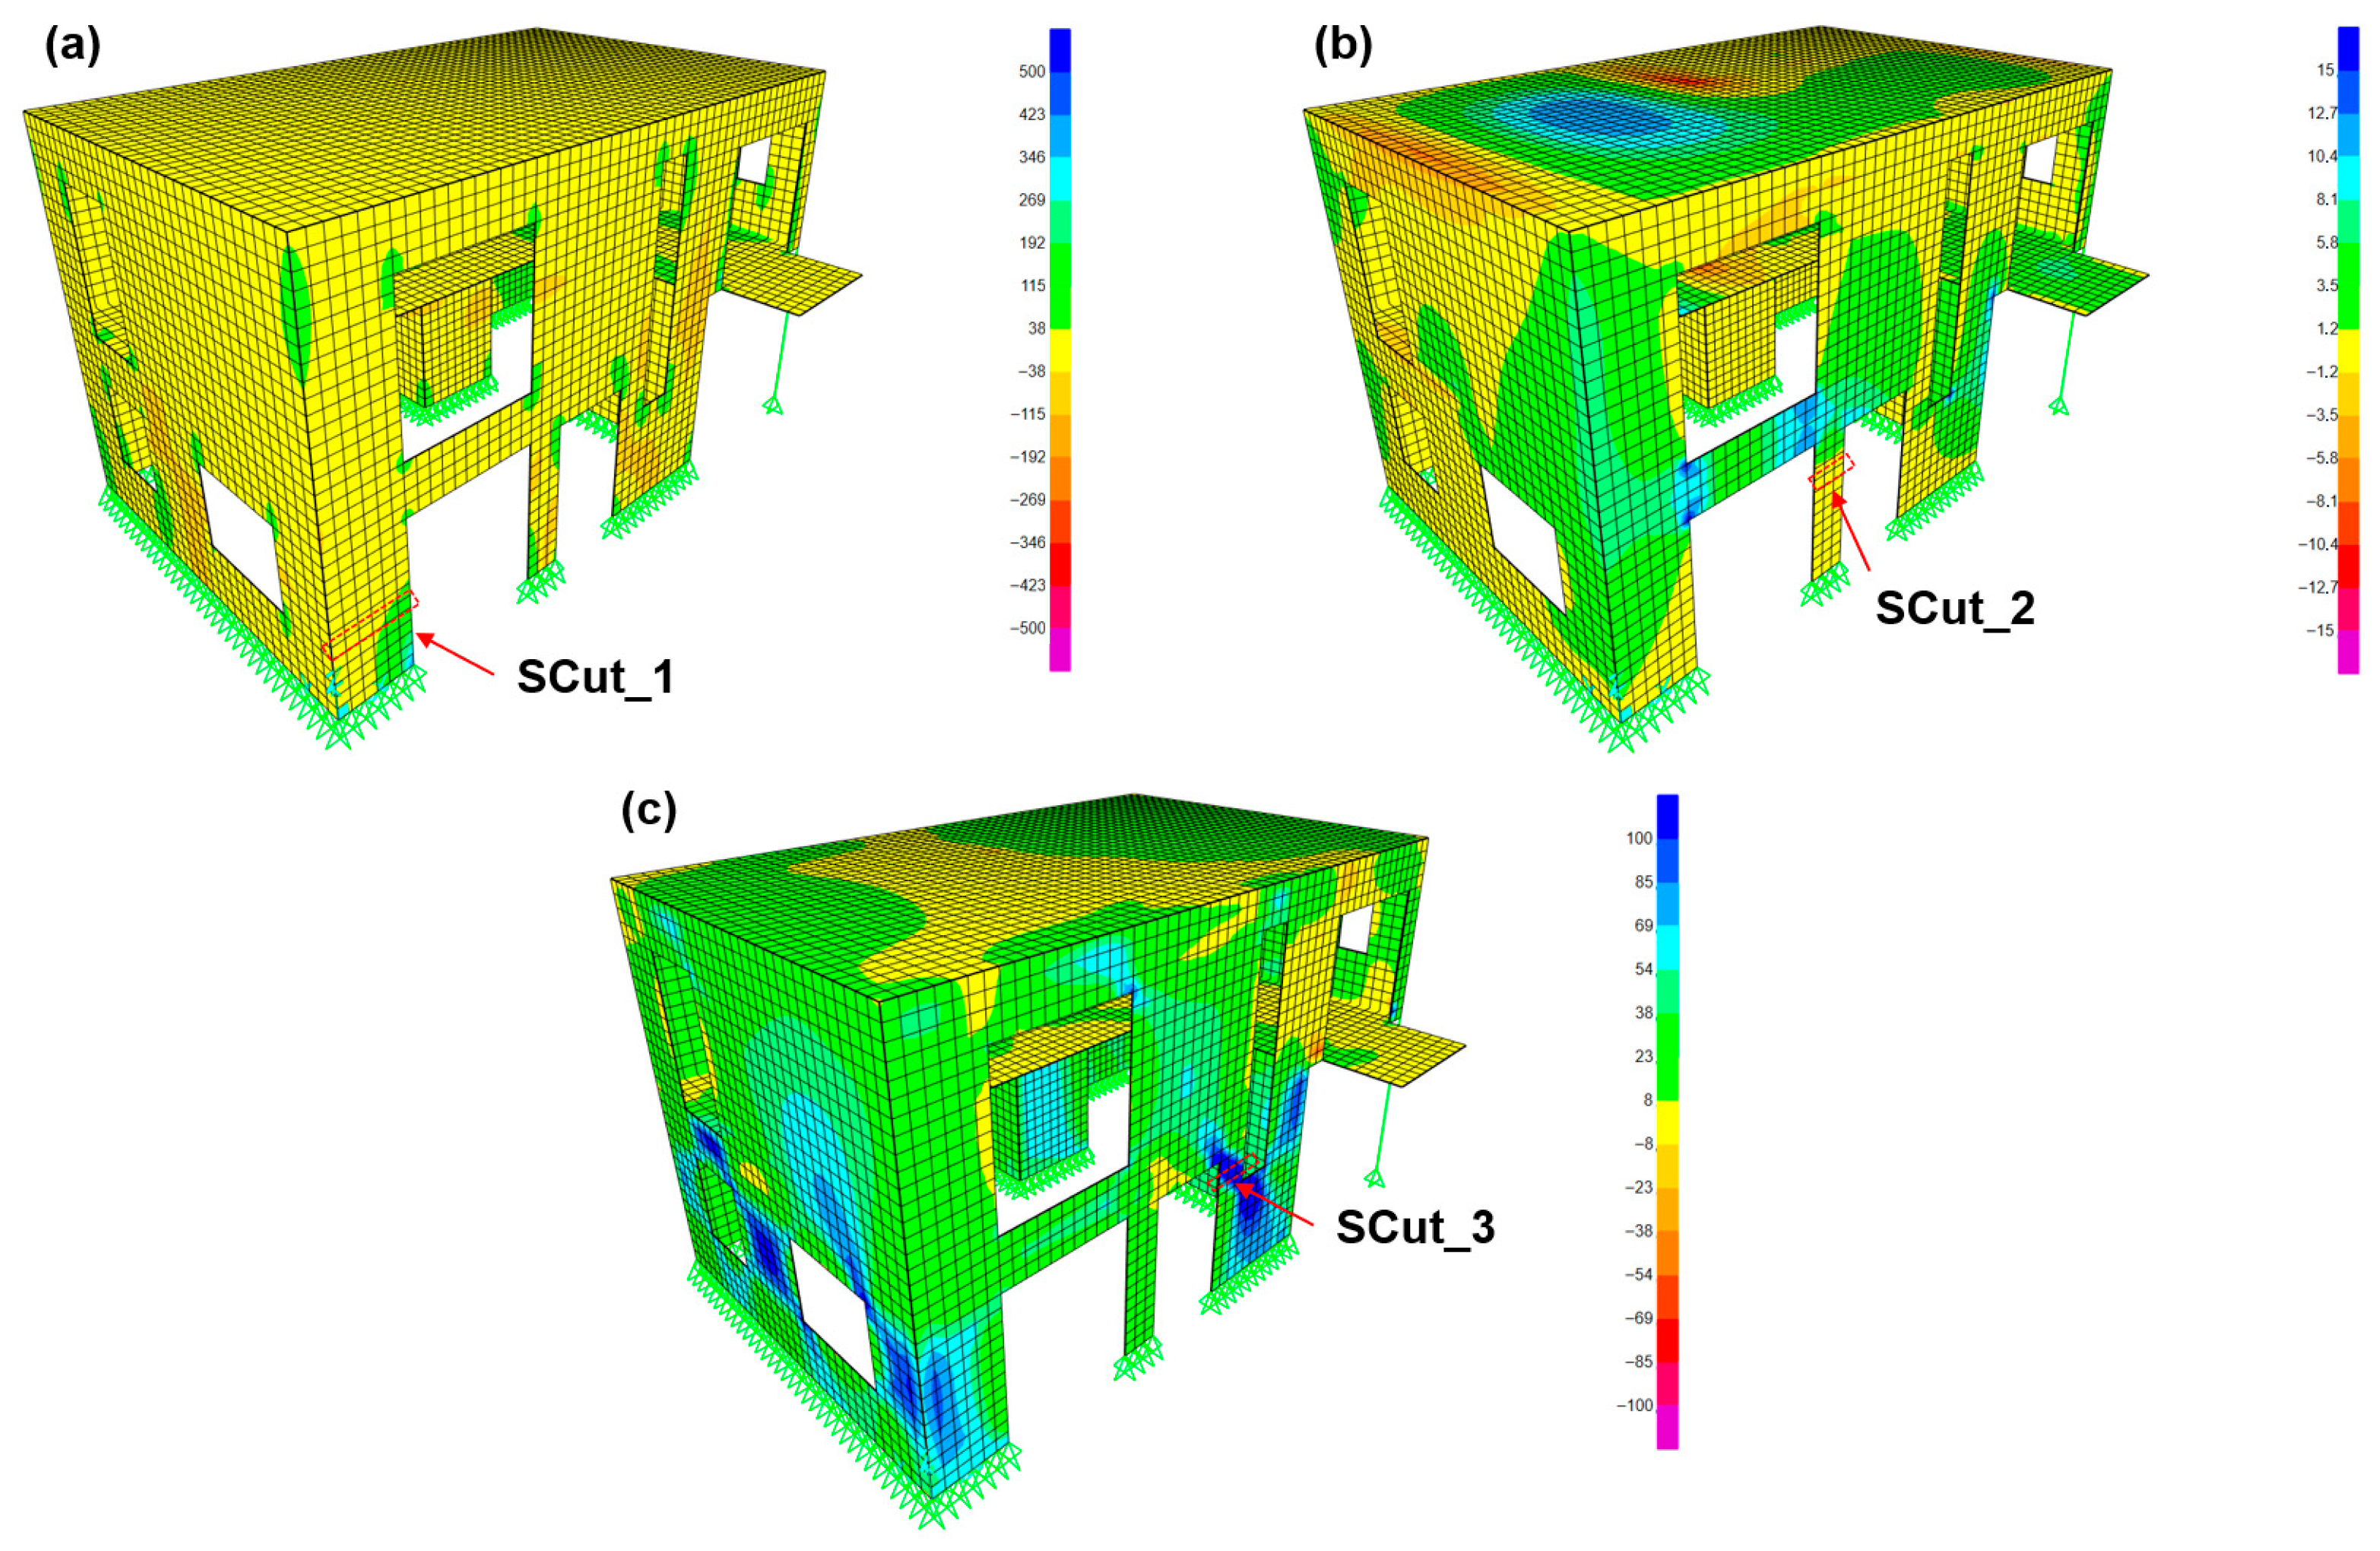
Shell stress-resultant (a) axial forces F33 in kN units, (b) out-of-plane bending moments M11 in kN-m units, and (c) shear forces F12 in kN units. The three reference cross-section cuts are highlighted.
Figure 7.
Shell stress-resultant (a) axial forces F33 in kN units, (b) out-of-plane bending moments M11 in kN-m units, and (c) shear forces F12 in kN units. The three reference cross-section cuts are highlighted.
Figure 8.
Stress distribution within the unreinforced reference 3DPC wall “SCut_1” in MPa units, where (a) S11 stresses, (b) S22 stresses, (c) S12 stresses, and (d) SMax principal stresses.
Figure 8.
Stress distribution within the unreinforced reference 3DPC wall “SCut_1” in MPa units, where (a) S11 stresses, (b) S22 stresses, (c) S12 stresses, and (d) SMax principal stresses.
Figure 9.
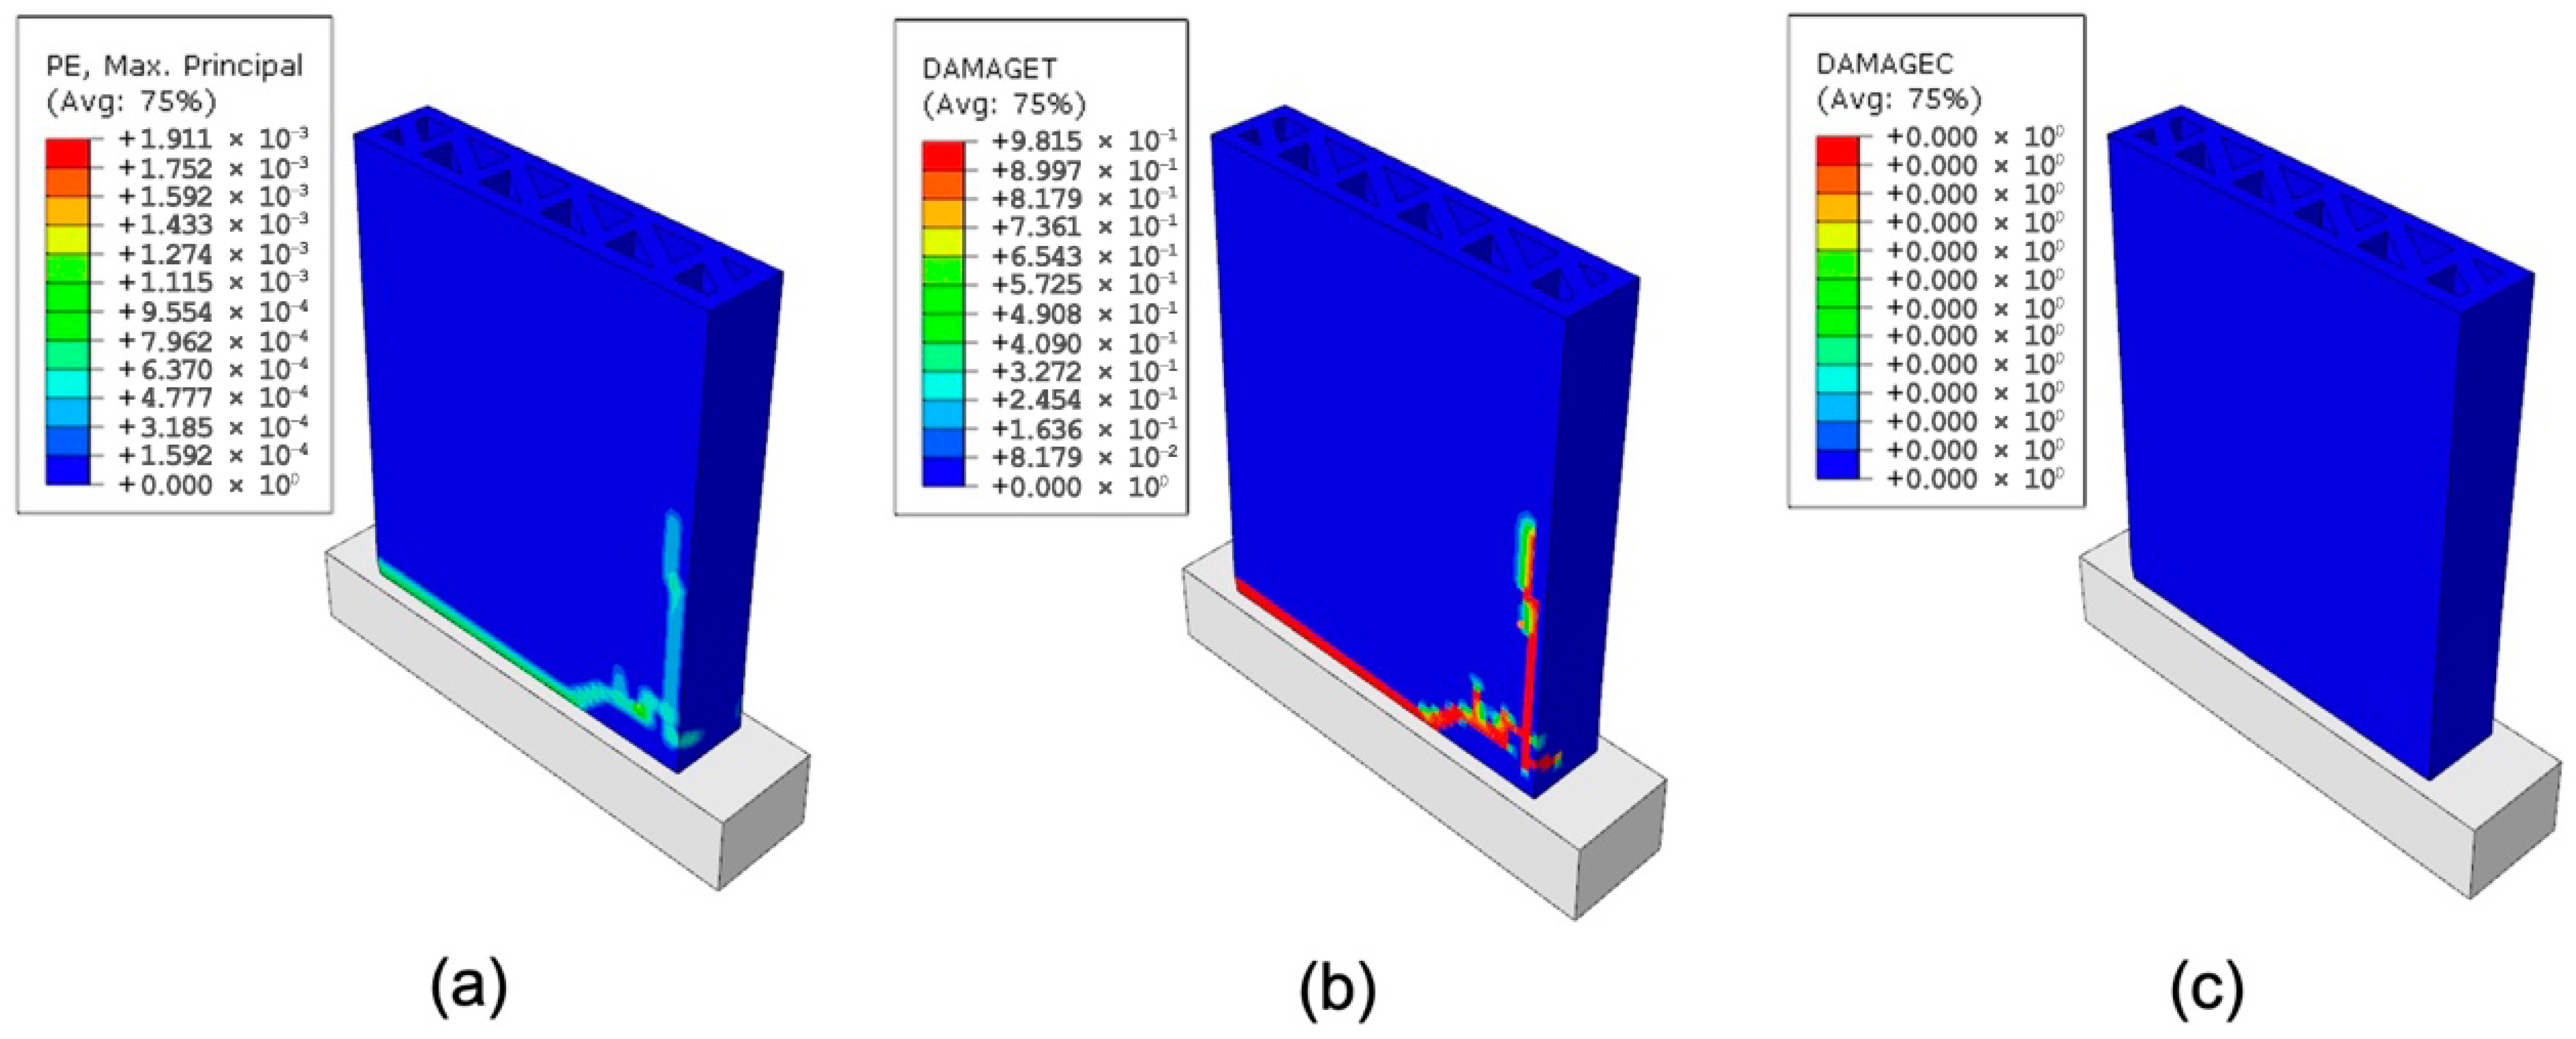
(a) Plastic strains, (b) tension damage, and (c) compression damage on the unreinforced reference 3DPC wall “SCut_1”.
Figure 9.
(a) Plastic strains, (b) tension damage, and (c) compression damage on the unreinforced reference 3DPC wall “SCut_1”.
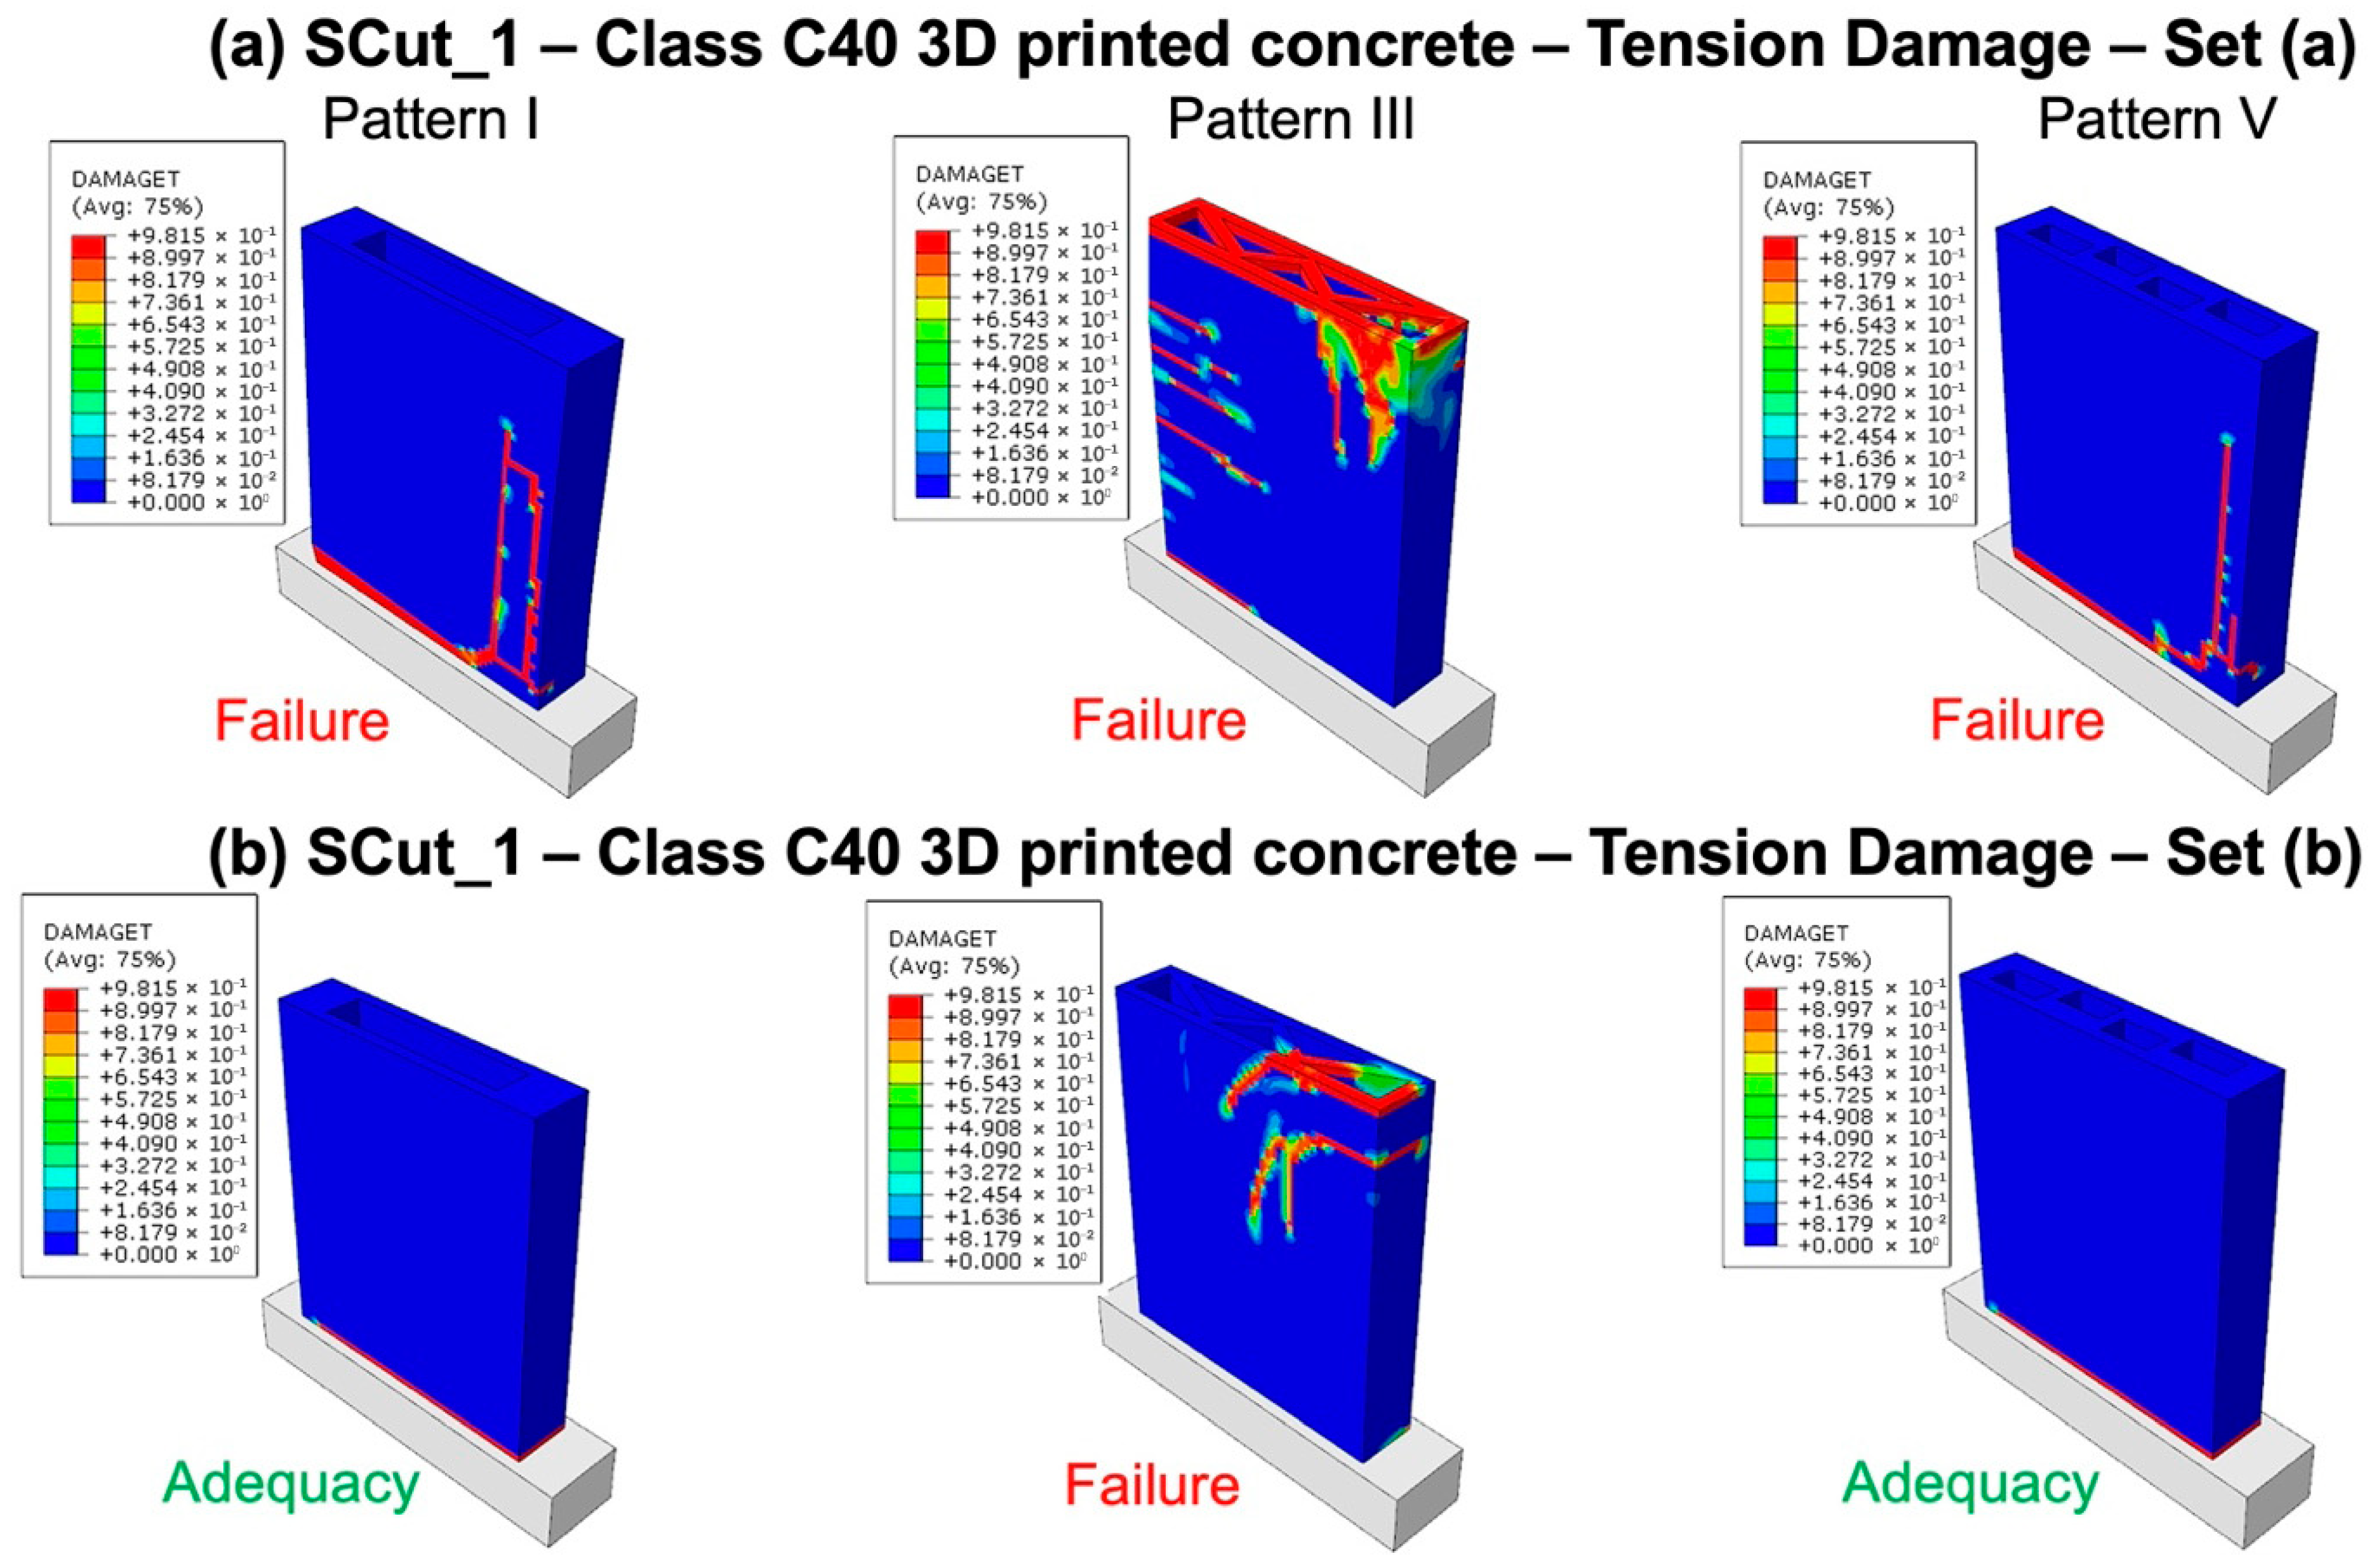
Figure 10.
Response of the reference unreinforced 3DPC wall “SCut_1” using printing patterns I, III, V, and C40 class-printed concrete, illustrated through tension damage plots for (a) set a and (b) set b of internal forces.
Figure 10.
Response of the reference unreinforced 3DPC wall “SCut_1” using printing patterns I, III, V, and C40 class-printed concrete, illustrated through tension damage plots for (a) set a and (b) set b of internal forces.
Figure 11.
Response of the reference unreinforced 3DPC wall “SCut_1” using printing patterns I, III, V, and C60 class-printed concrete, illustrated through tension damage plots for (a) set a and (b) set b of internal forces.
Figure 11.
Response of the reference unreinforced 3DPC wall “SCut_1” using printing patterns I, III, V, and C60 class-printed concrete, illustrated through tension damage plots for (a) set a and (b) set b of internal forces.
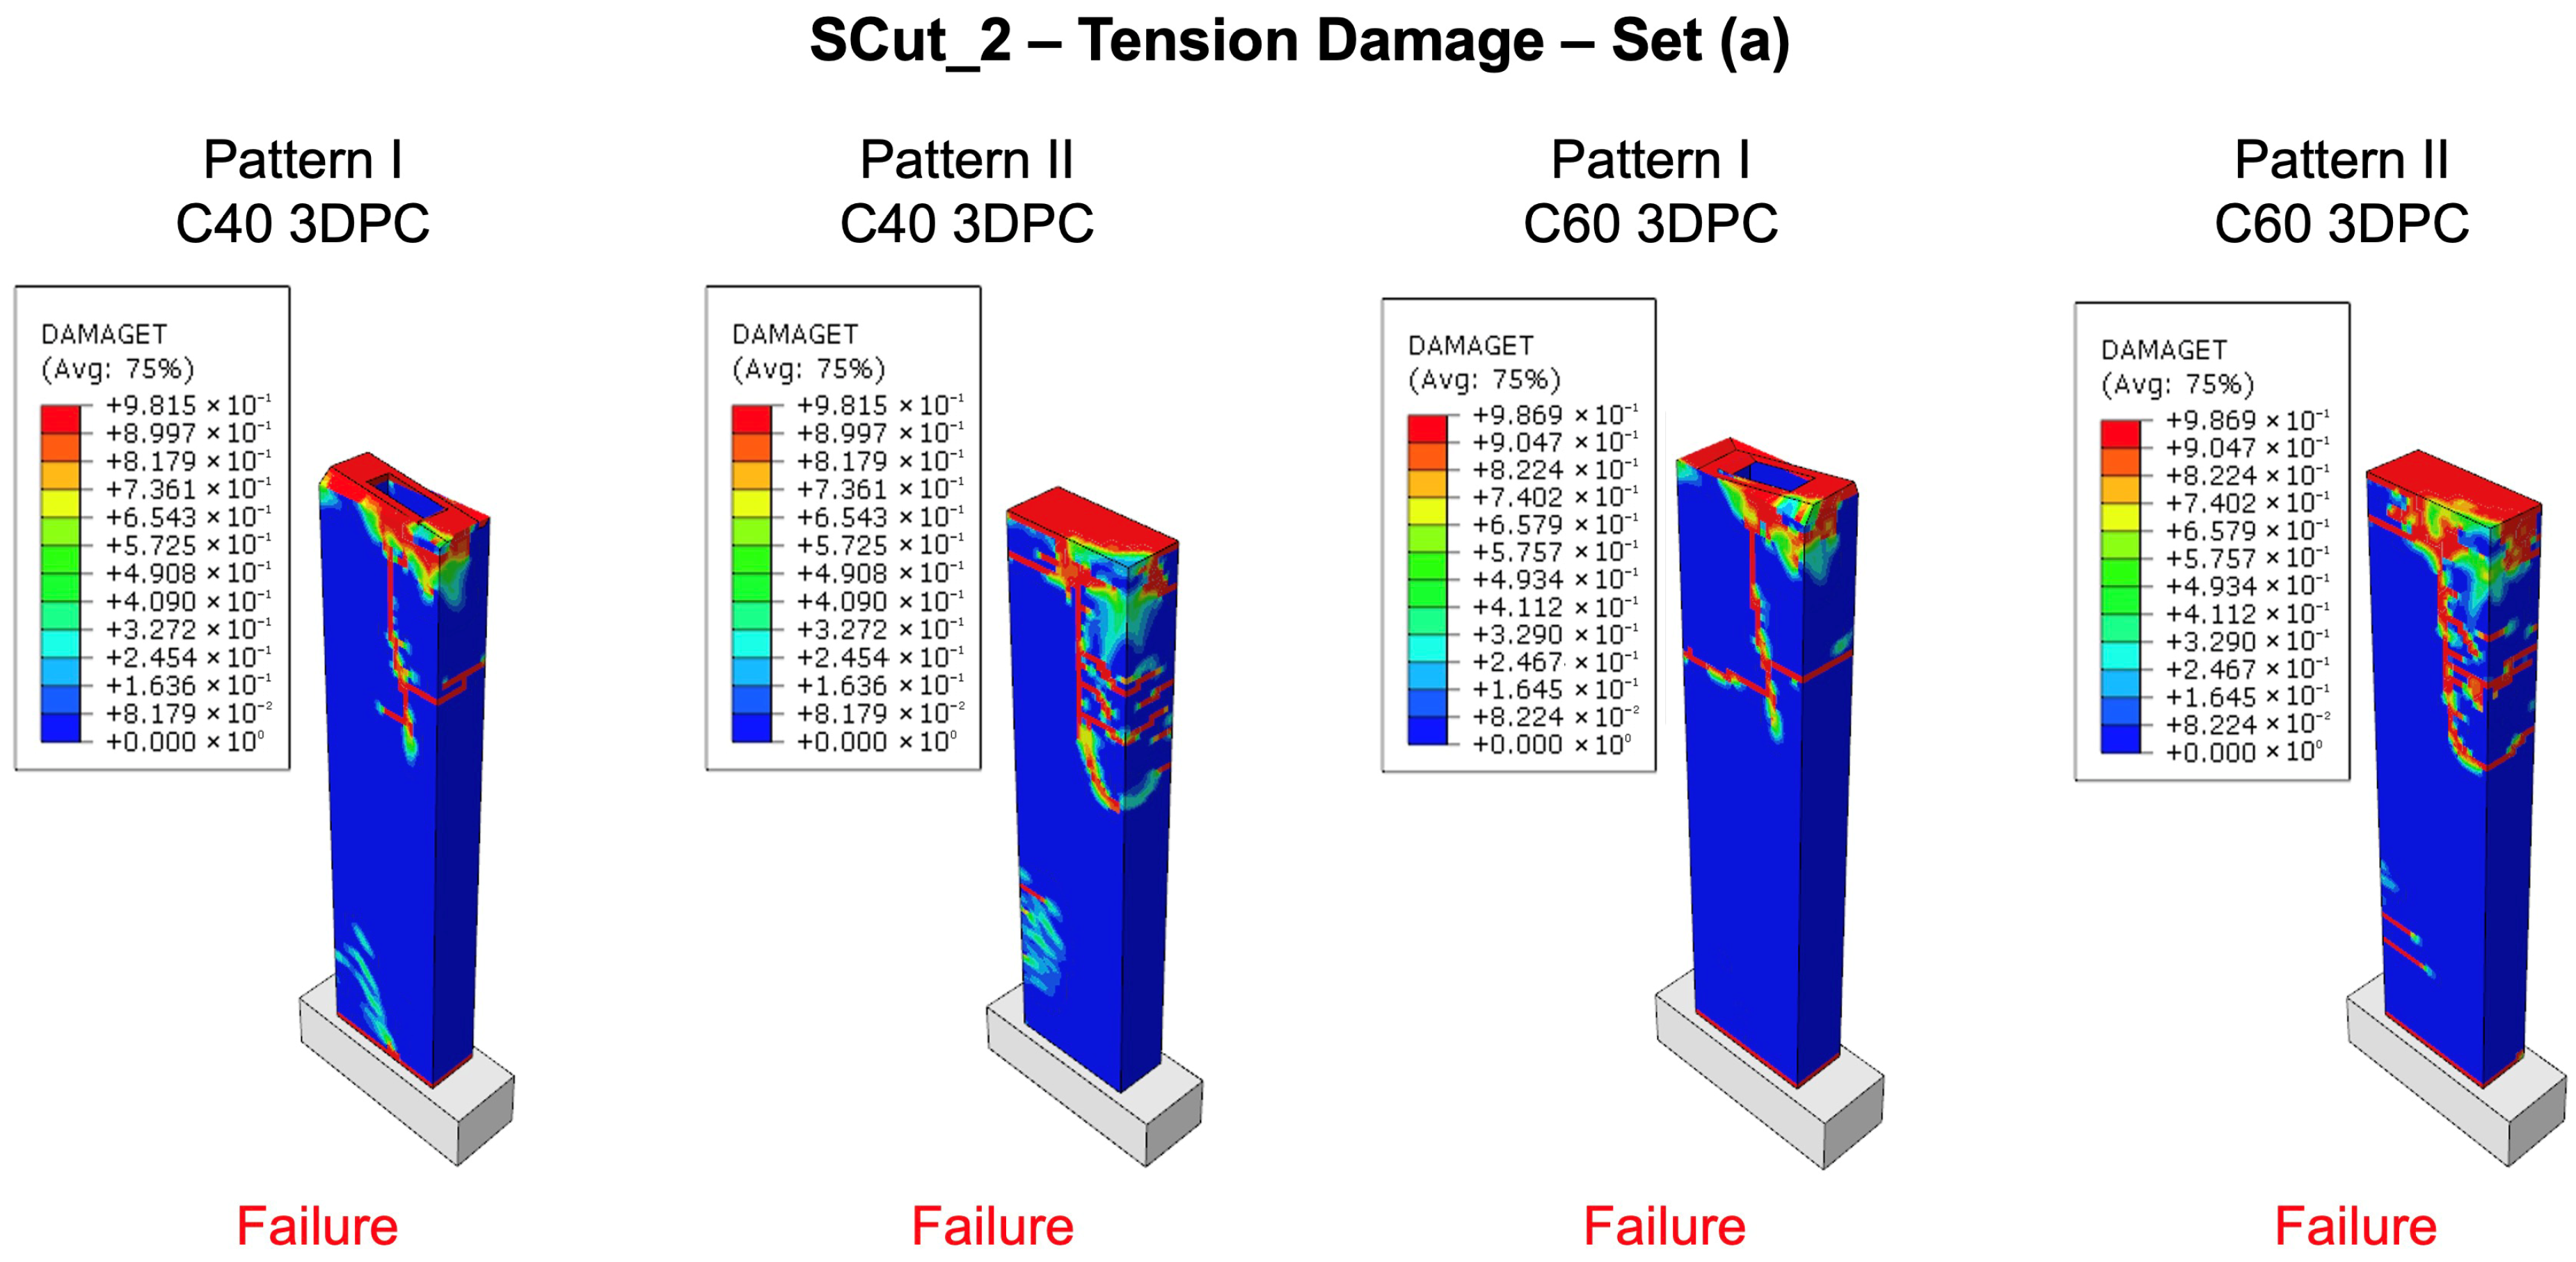
Figure 12.
Response of the reference unreinforced 3DPC wall “SCut_2” using printing patterns I, II, C40, and C60 class-printed concrete, illustrated through tension damage plots for set (a) of internal forces.
Figure 12.
Response of the reference unreinforced 3DPC wall “SCut_2” using printing patterns I, II, C40, and C60 class-printed concrete, illustrated through tension damage plots for set (a) of internal forces.
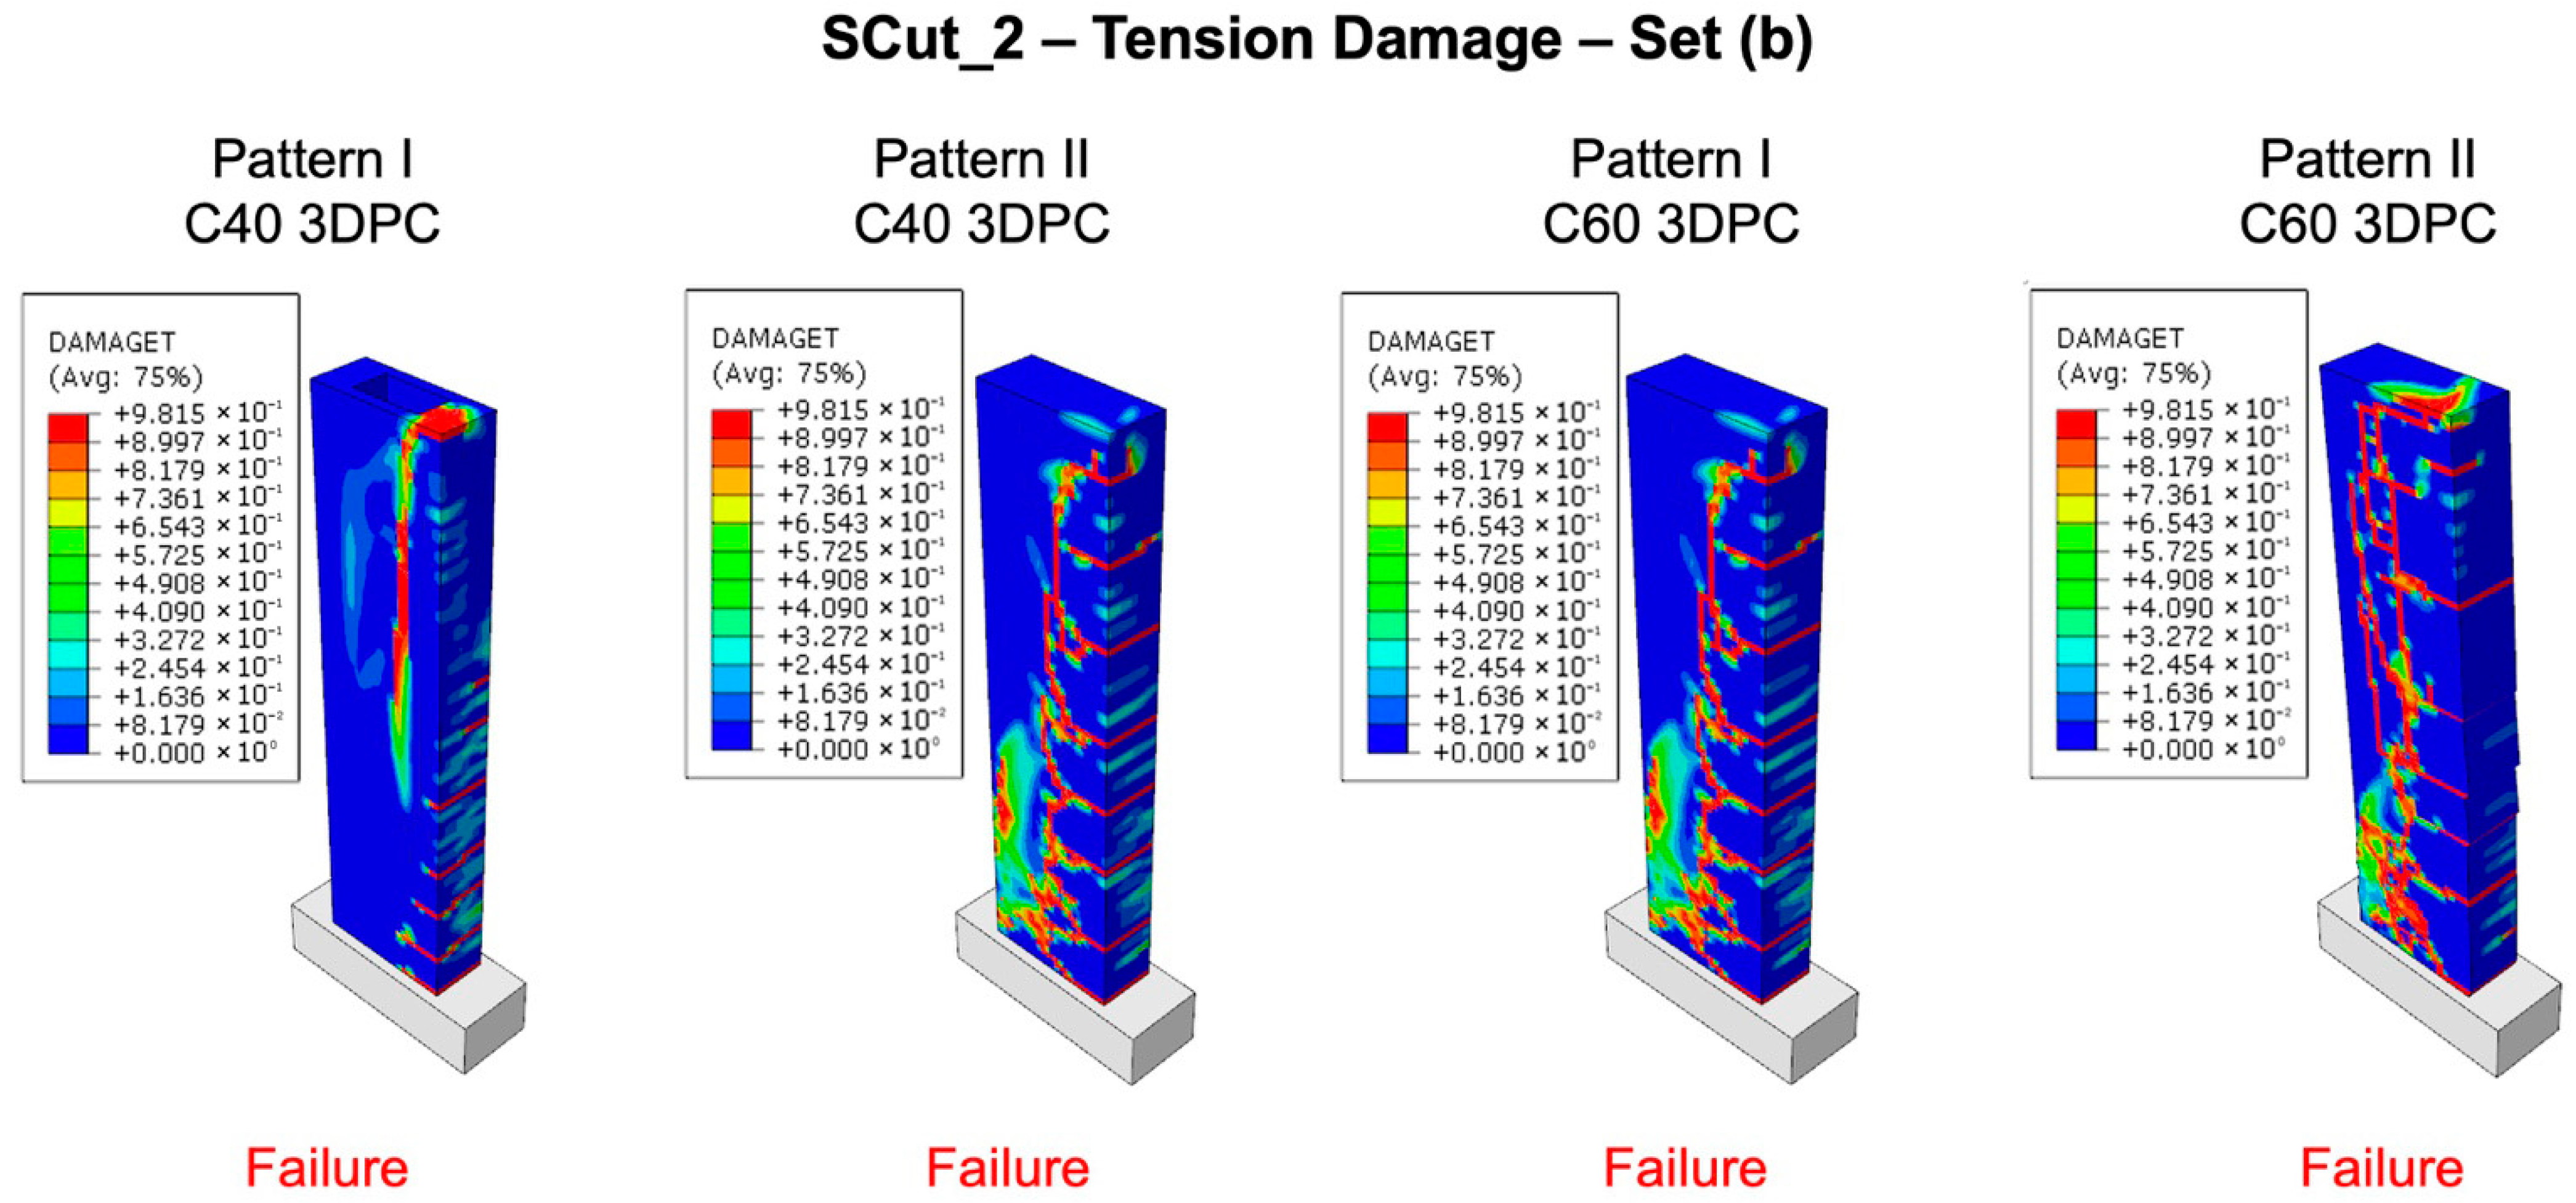
Figure 13.
Response of the reference unreinforced 3DPC wall “SCut_2” using printing patterns I, II, C40, and C60 class-printed concrete, illustrated through tension damage plots for set (b) of internal forces.
Figure 13.
Response of the reference unreinforced 3DPC wall “SCut_2” using printing patterns I, II, C40, and C60 class-printed concrete, illustrated through tension damage plots for set (b) of internal forces.
Figure 14.
Response of the reference unreinforced 3DPC wall “SCut_3” using printing patterns II, C40, and C60 class-printed concrete, illustrated through tension damage plots for set (a) and set (b) of internal forces.
Figure 14.
Response of the reference unreinforced 3DPC wall “SCut_3” using printing patterns II, C40, and C60 class-printed concrete, illustrated through tension damage plots for set (a) and set (b) of internal forces.
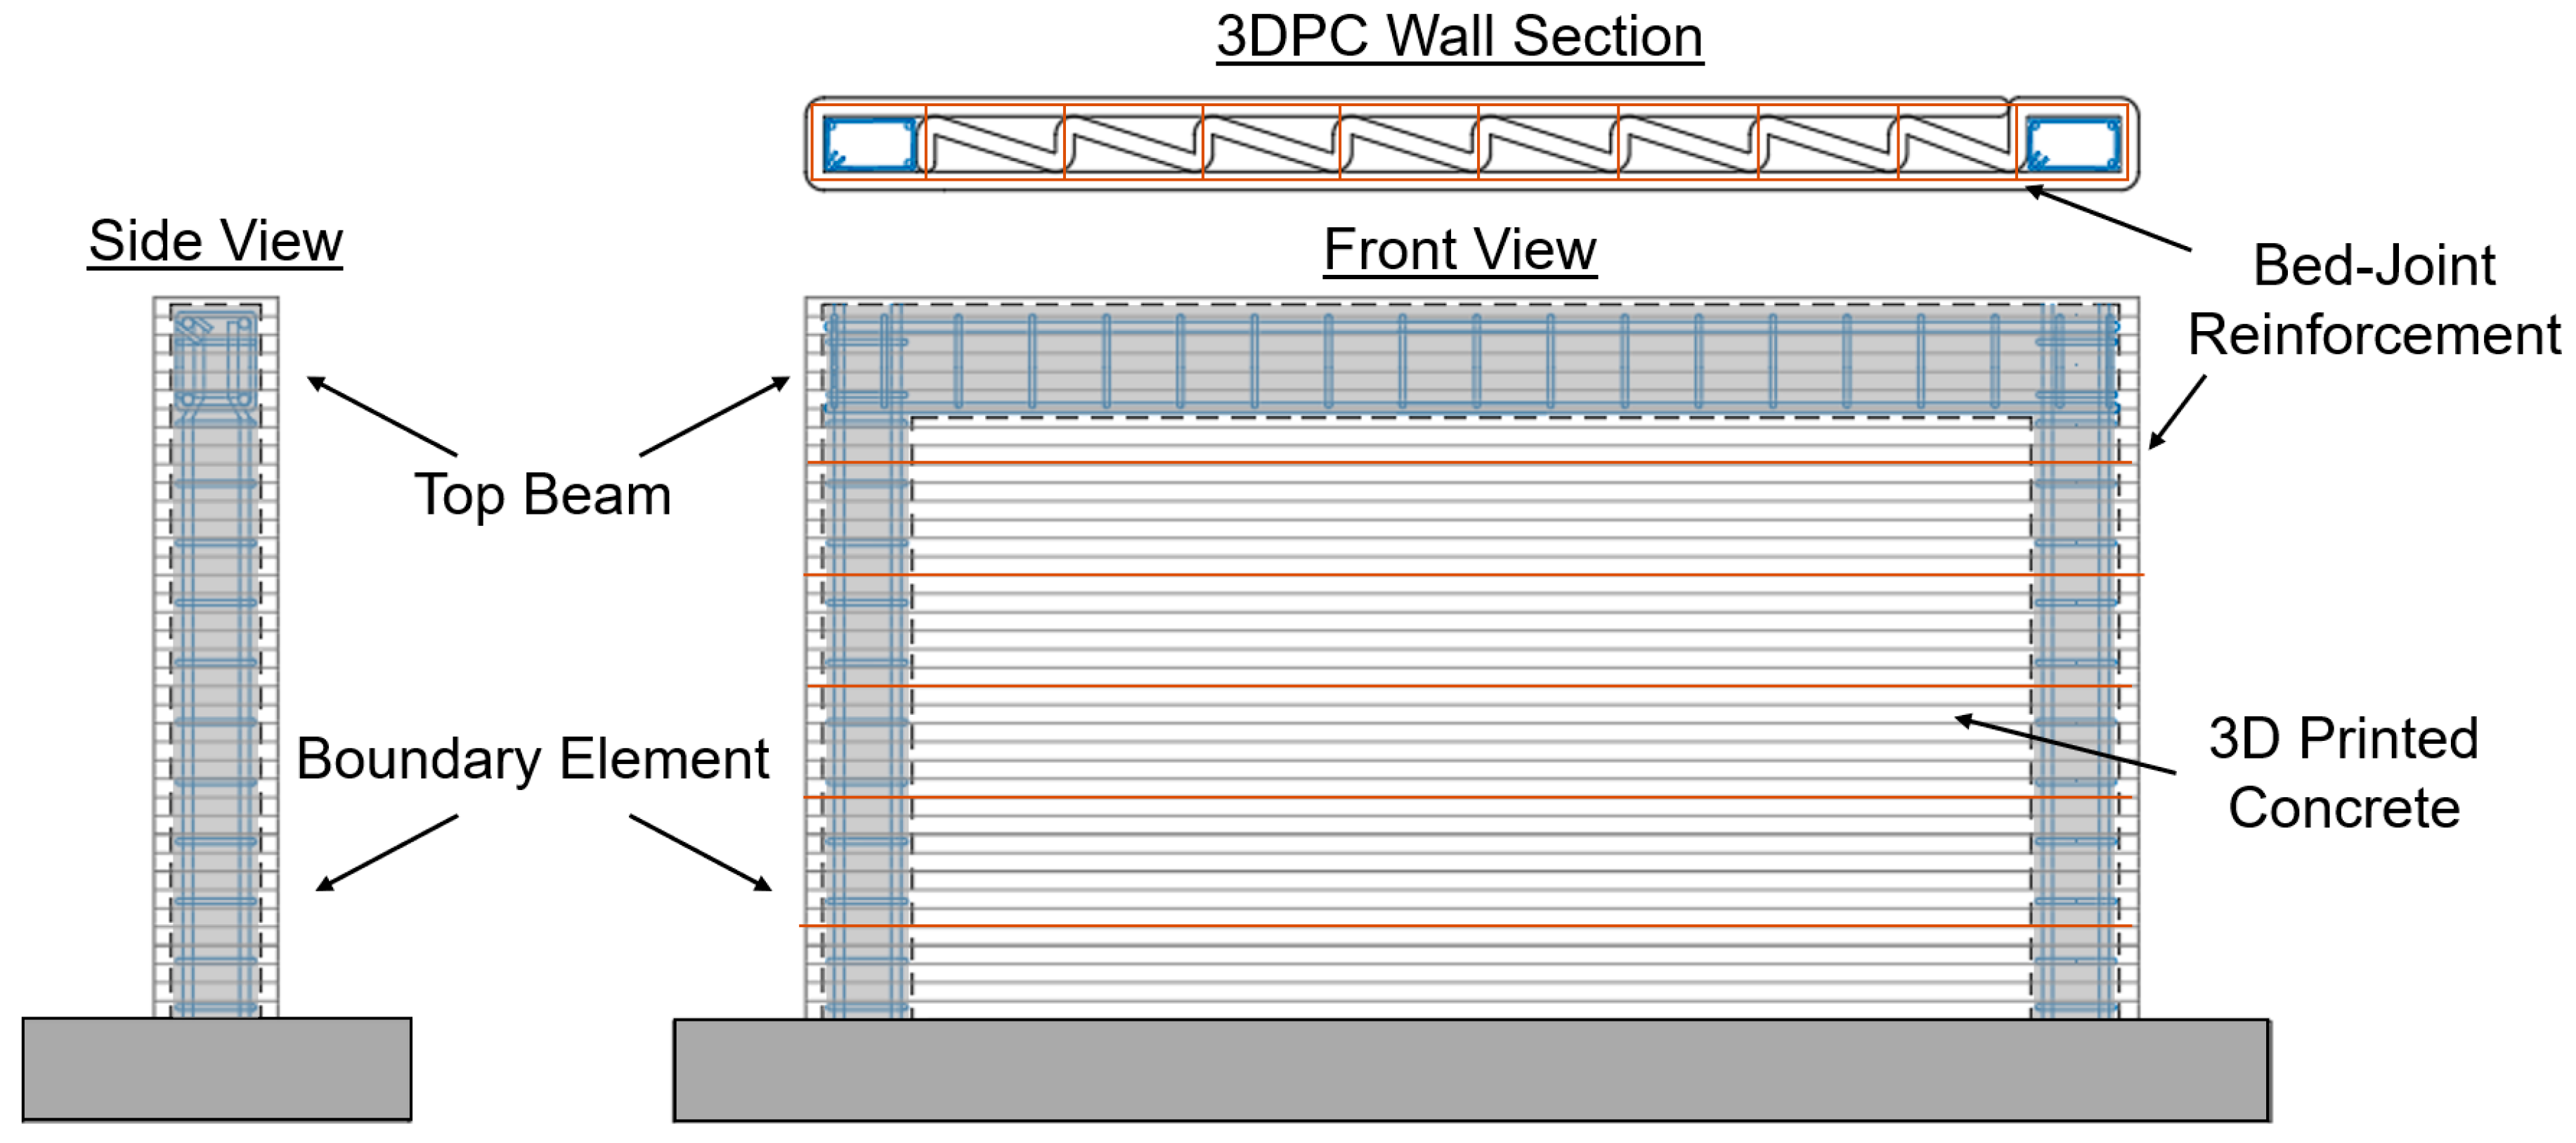
Figure 15.
Reinforced 3DPC wall, where boundary elements and bed-joint reinforcement are used.
Figure 15.
Reinforced 3DPC wall, where boundary elements and bed-joint reinforcement are used.
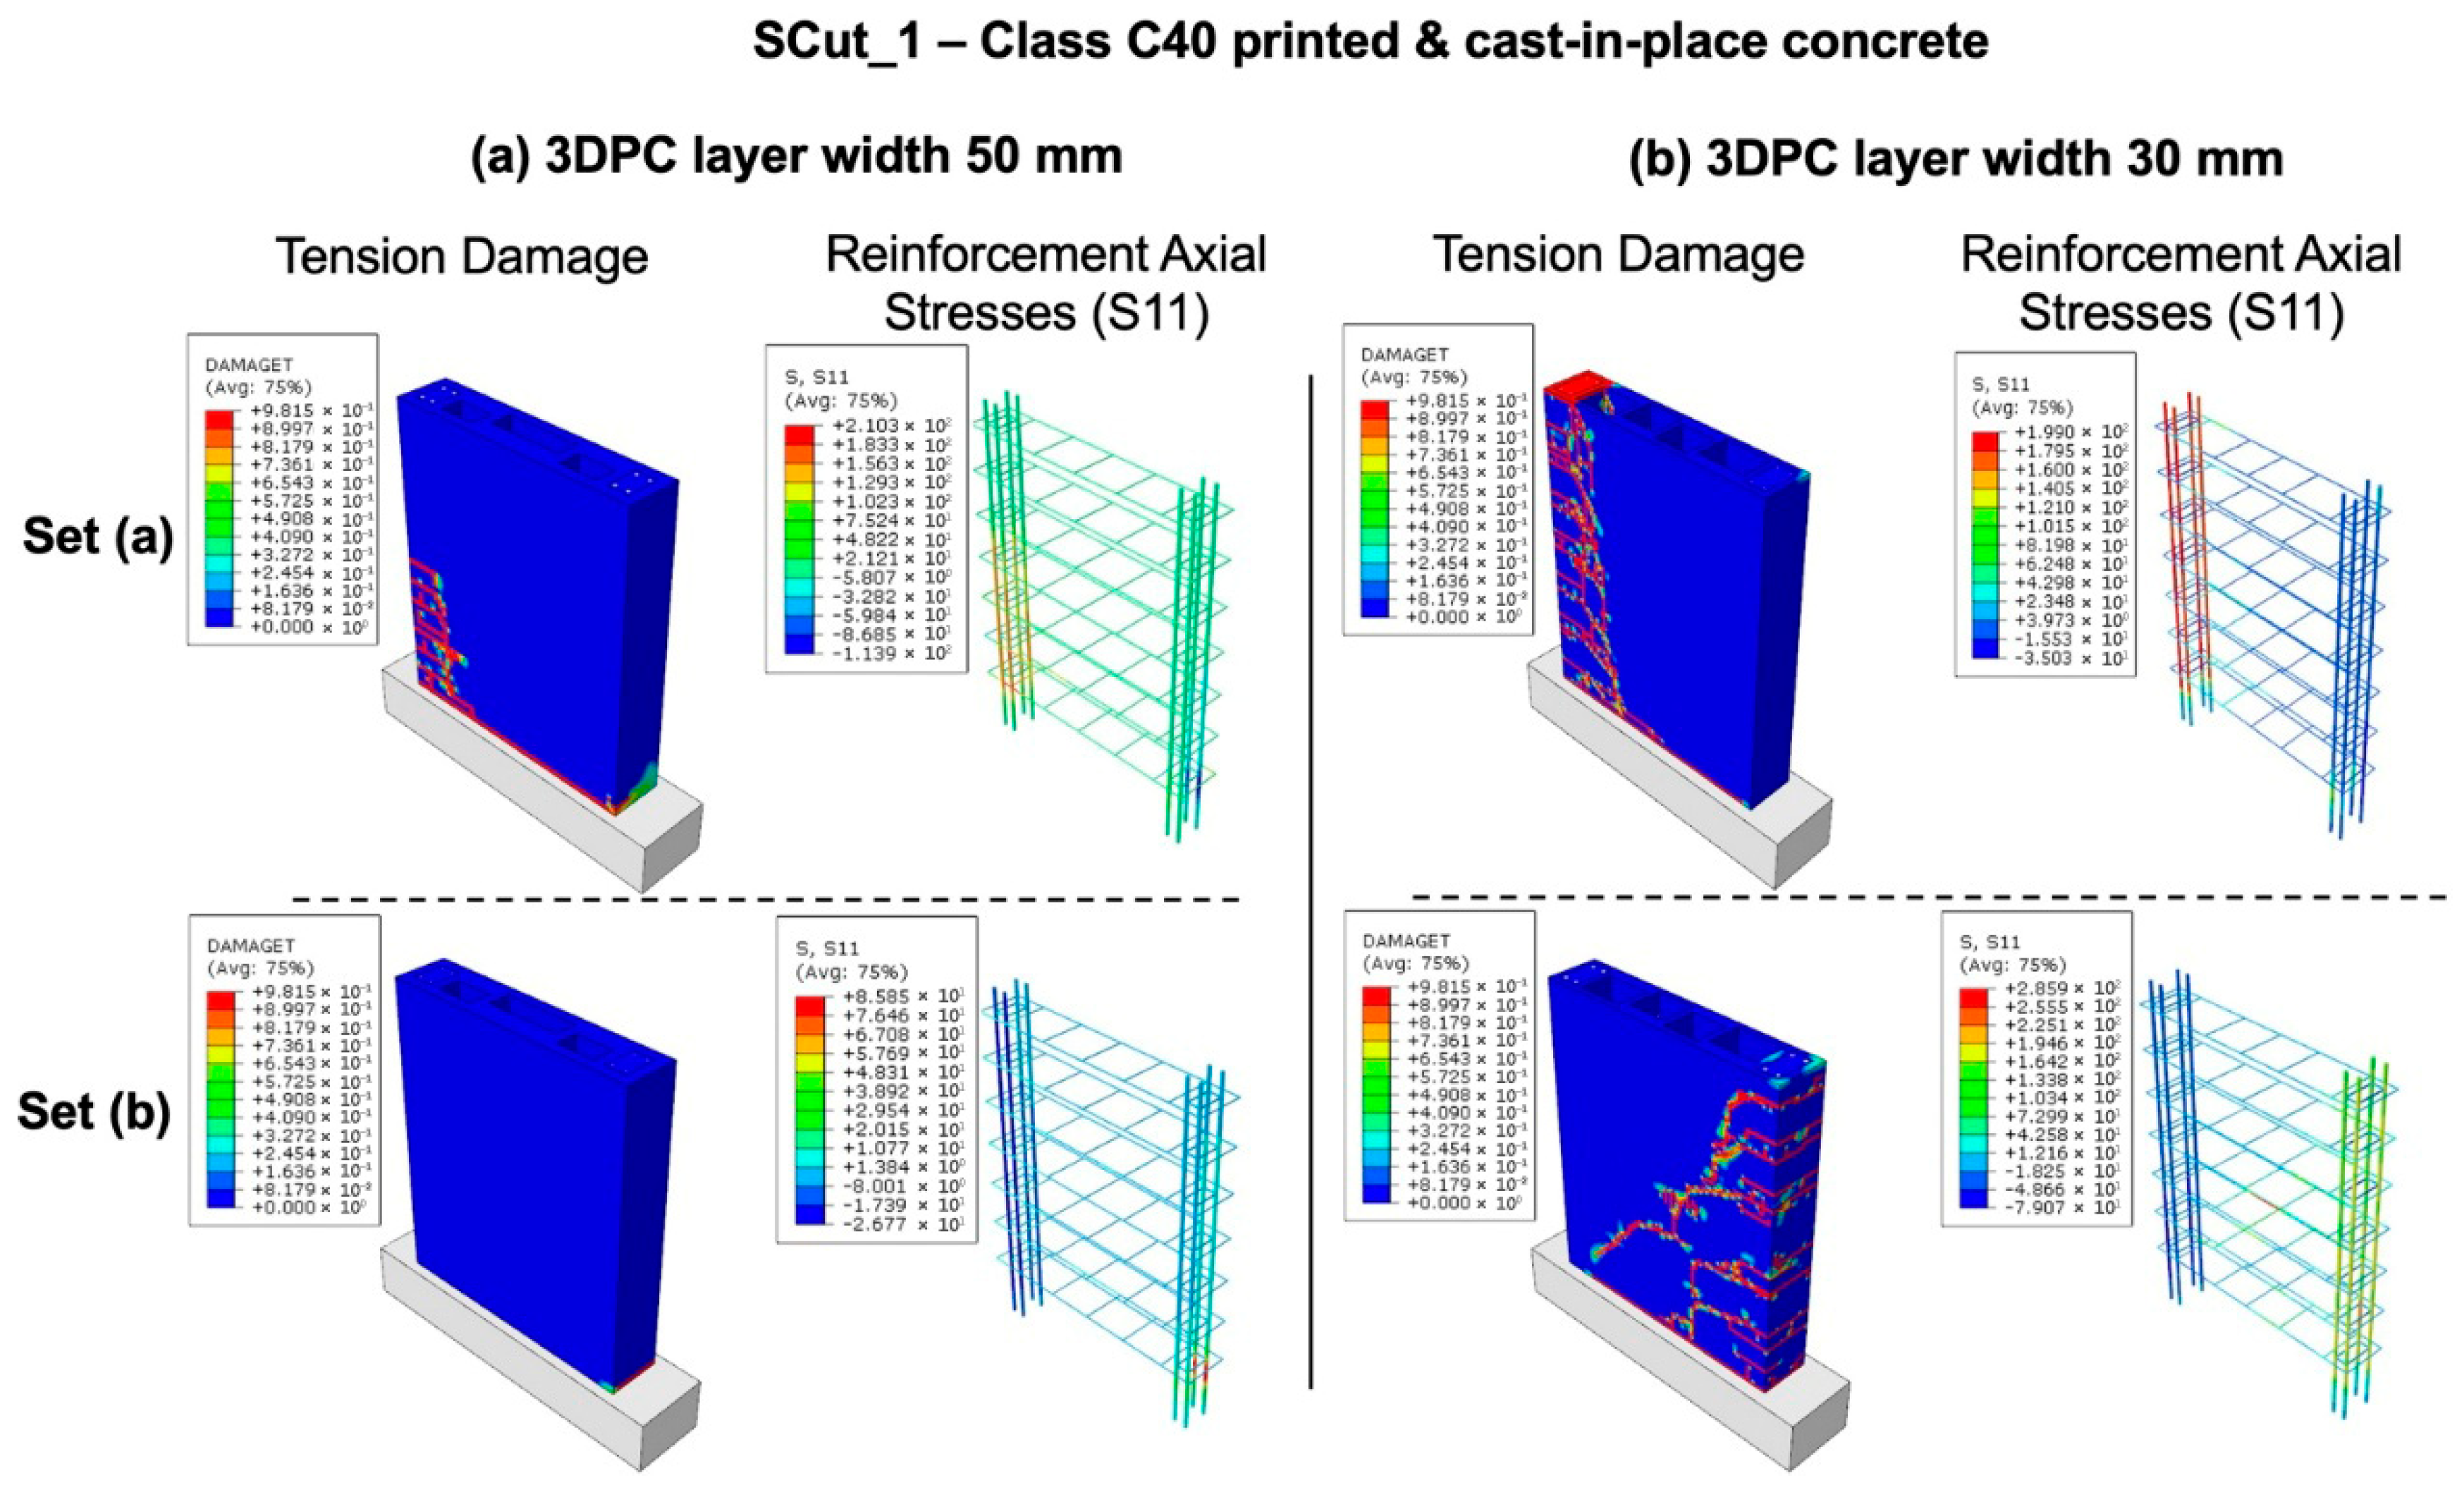
Figure 16.
Finite element simulation of the reinforced 3DPC wall “SCut_1” constructed with C40 class-printed and cast-in-place concrete, using (a) 50 mm layer width and (b) 30 mm layer width. The figures illustrate tension damage and axial stress in the reinforcement (in MPa units).
Figure 16.
Finite element simulation of the reinforced 3DPC wall “SCut_1” constructed with C40 class-printed and cast-in-place concrete, using (a) 50 mm layer width and (b) 30 mm layer width. The figures illustrate tension damage and axial stress in the reinforcement (in MPa units).
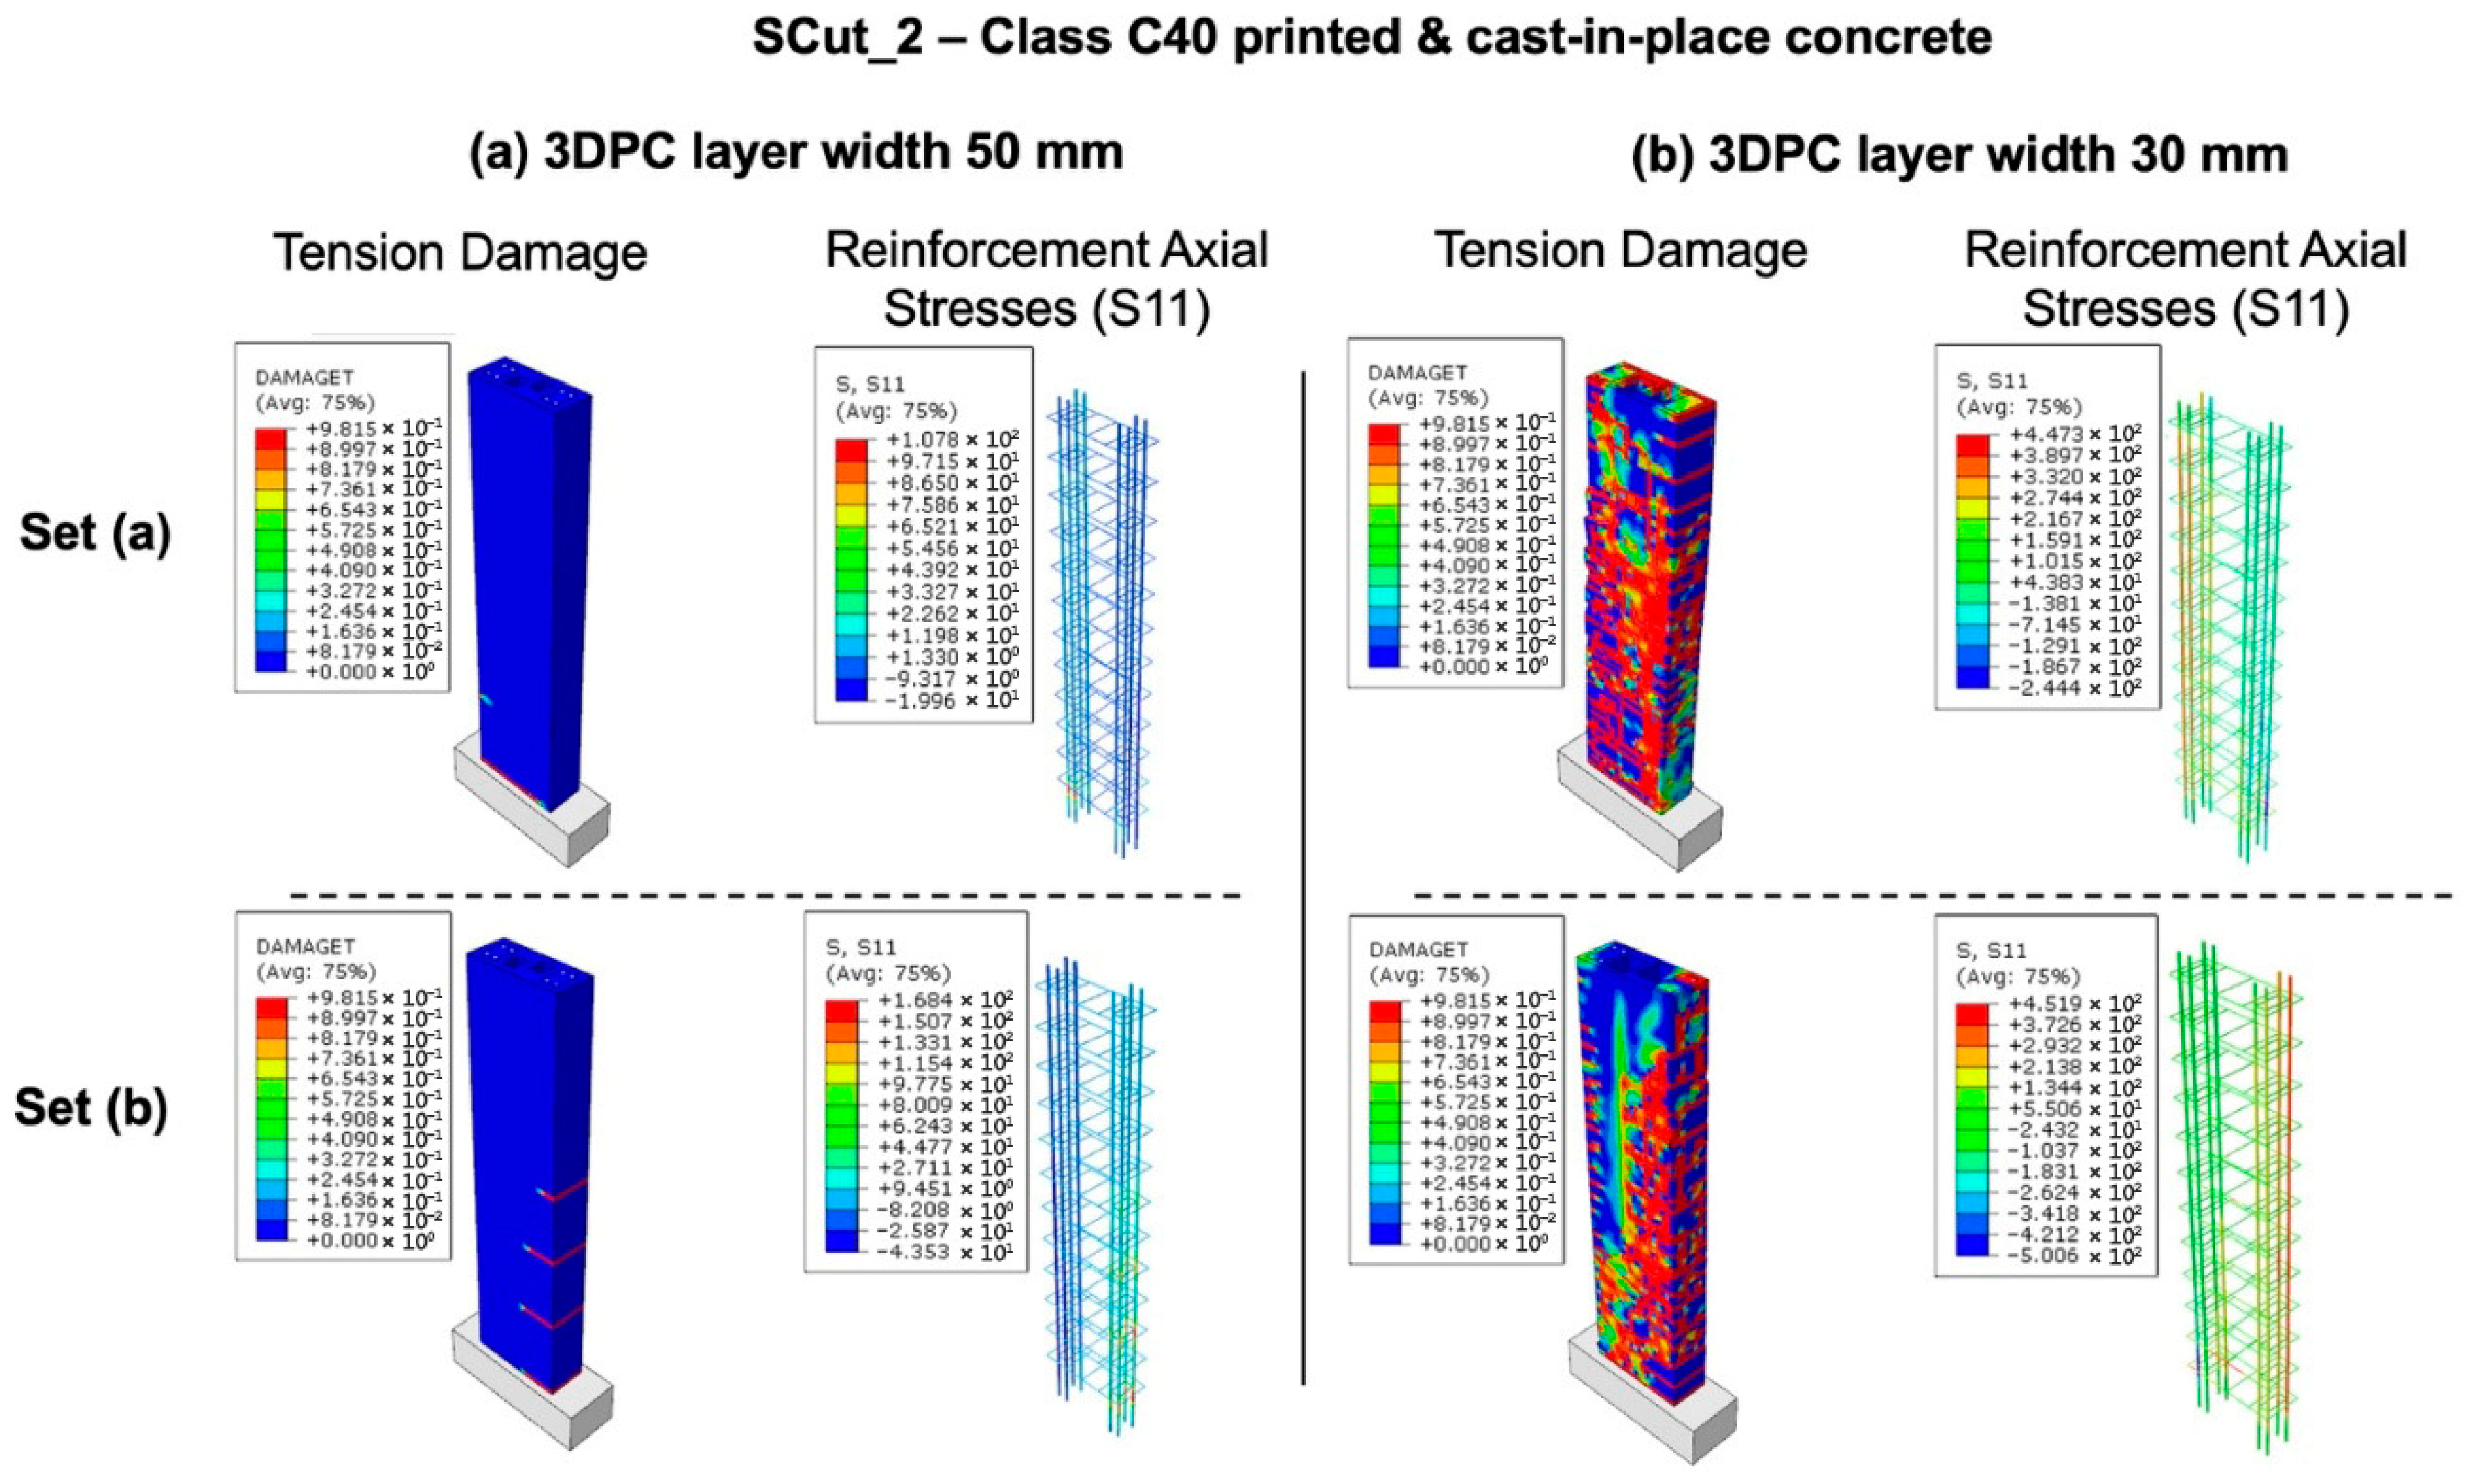
Figure 17.
Finite element simulation of the reinforced 3DPC wall “SCut_2” constructed with C40 class-printed and cast-in-place concrete using (a) 50 mm layer width and (b) 30 mm layer width. The figures illustrate tension damage and axial stress in the reinforcement (in MPa units).
Figure 17.
Finite element simulation of the reinforced 3DPC wall “SCut_2” constructed with C40 class-printed and cast-in-place concrete using (a) 50 mm layer width and (b) 30 mm layer width. The figures illustrate tension damage and axial stress in the reinforcement (in MPa units).
Figure 18.
Finite element simulation of the reinforced 3DPC wall “SCut_3” constructed with C40 class-printed and cast-in-place concrete using (a) 50 mm layer width and (b) 30 mm layer width. The figures illustrate tension damage and axial stress in the reinforcement (in MPa units).
Figure 18.
Finite element simulation of the reinforced 3DPC wall “SCut_3” constructed with C40 class-printed and cast-in-place concrete using (a) 50 mm layer width and (b) 30 mm layer width. The figures illustrate tension damage and axial stress in the reinforcement (in MPa units).
Figure 19.
Different failure types of reinforced 3DPC walls.
Figure 19.
Different failure types of reinforced 3DPC walls.
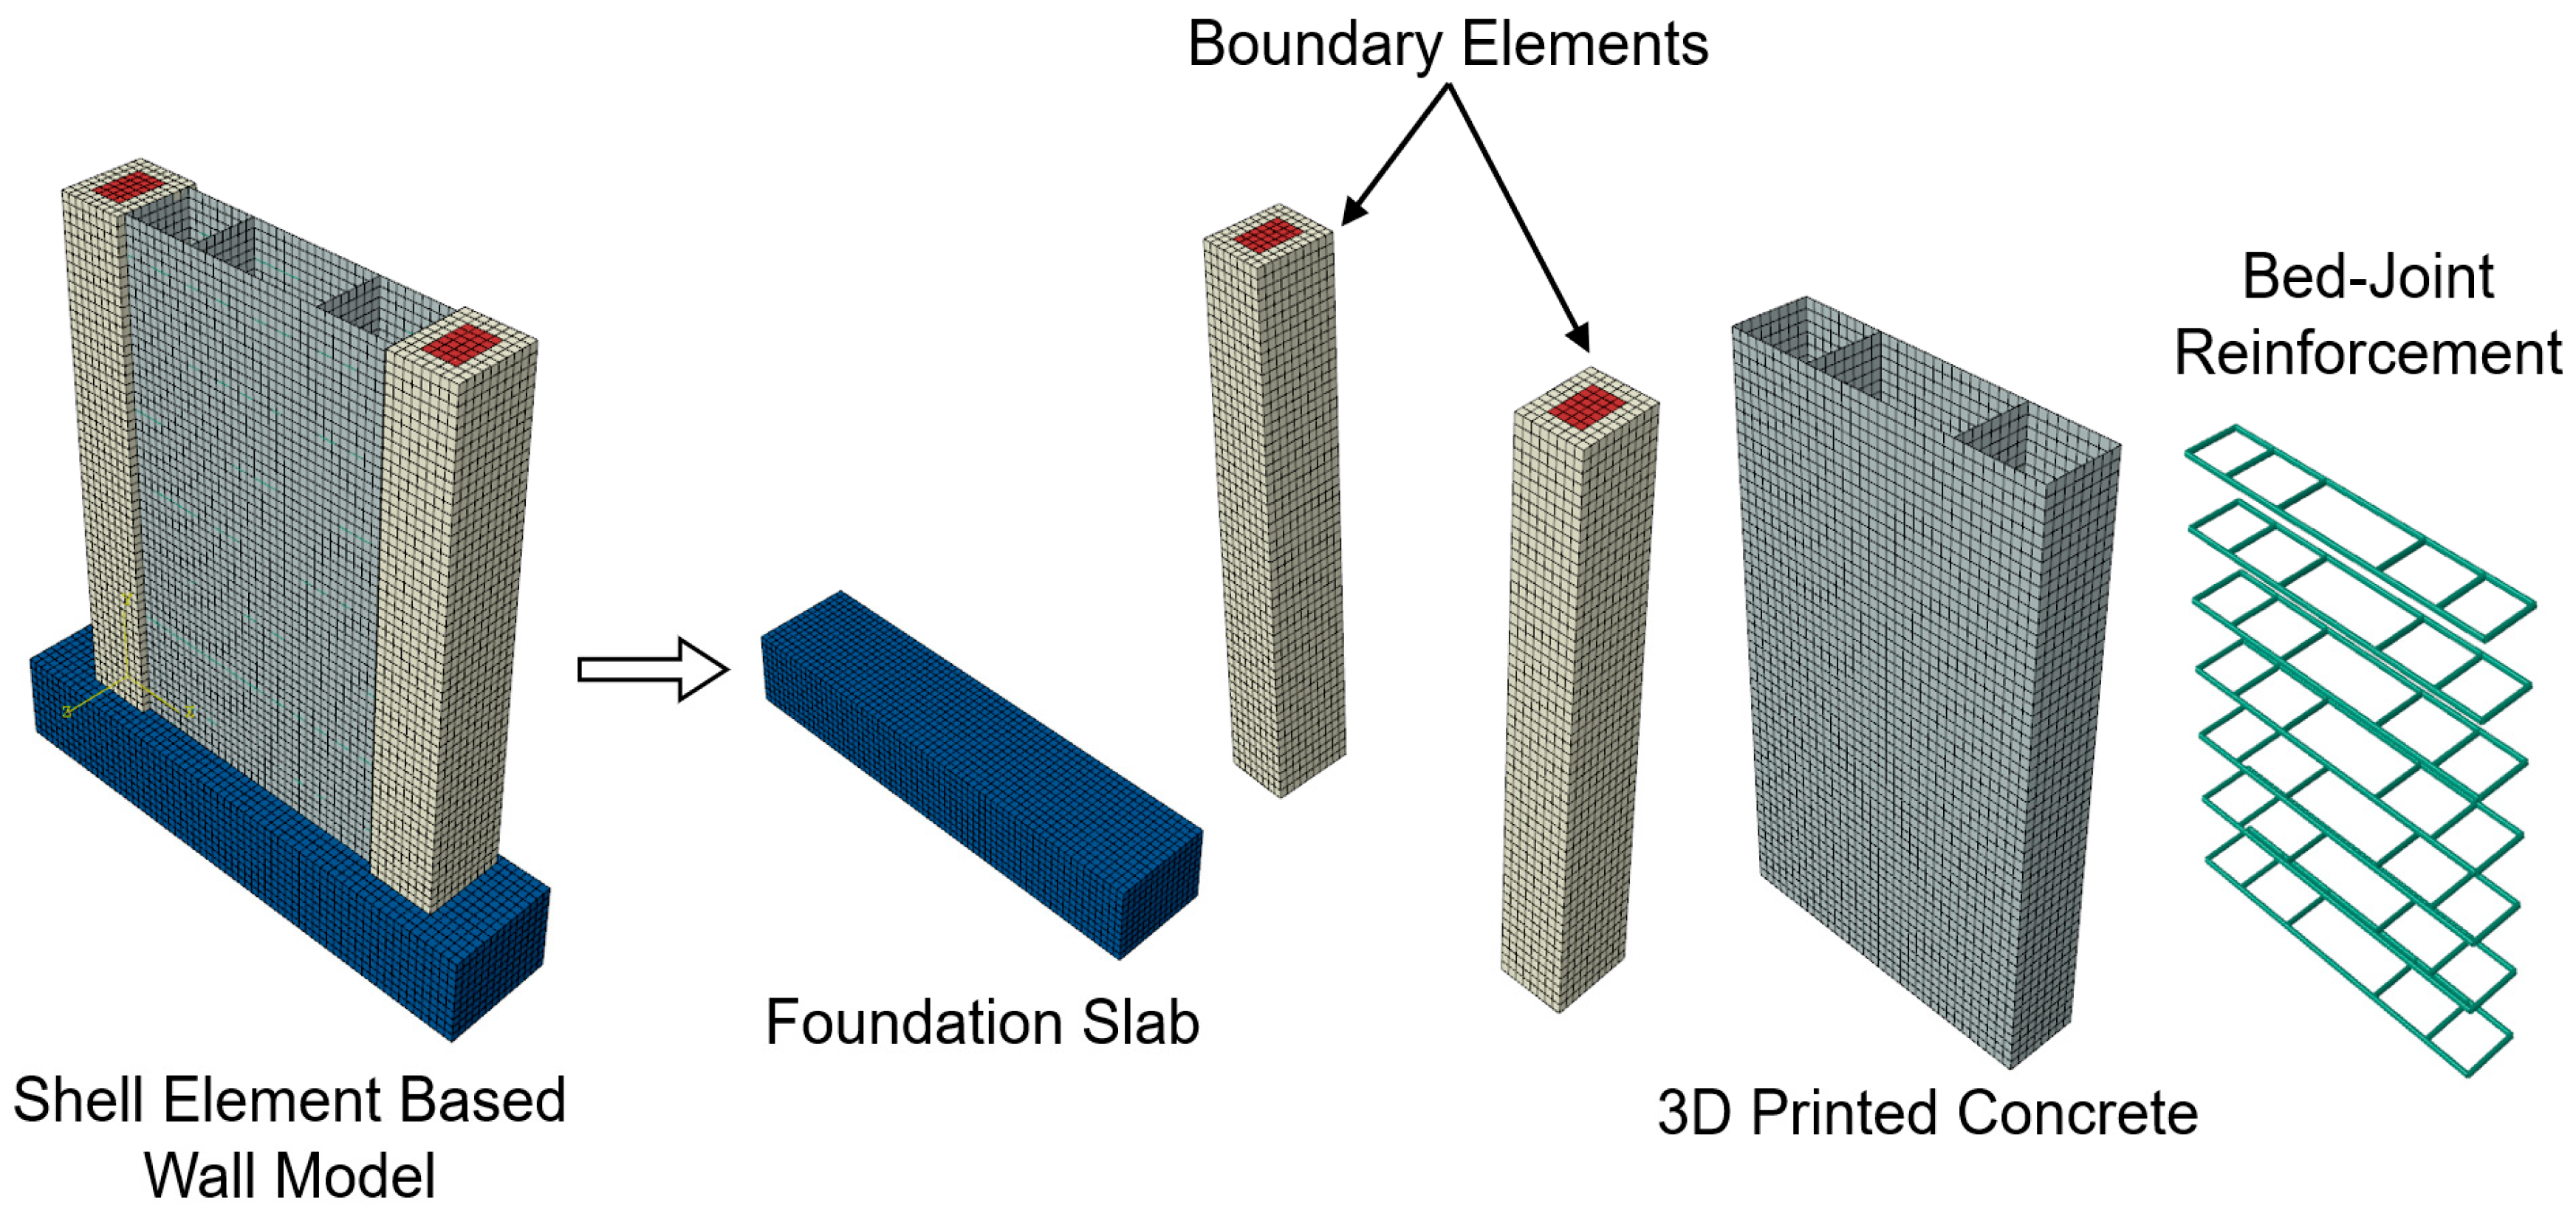
Figure 20.
Different parts that are used for shell-element-based wall numerical modelling.
Figure 20.
Different parts that are used for shell-element-based wall numerical modelling.
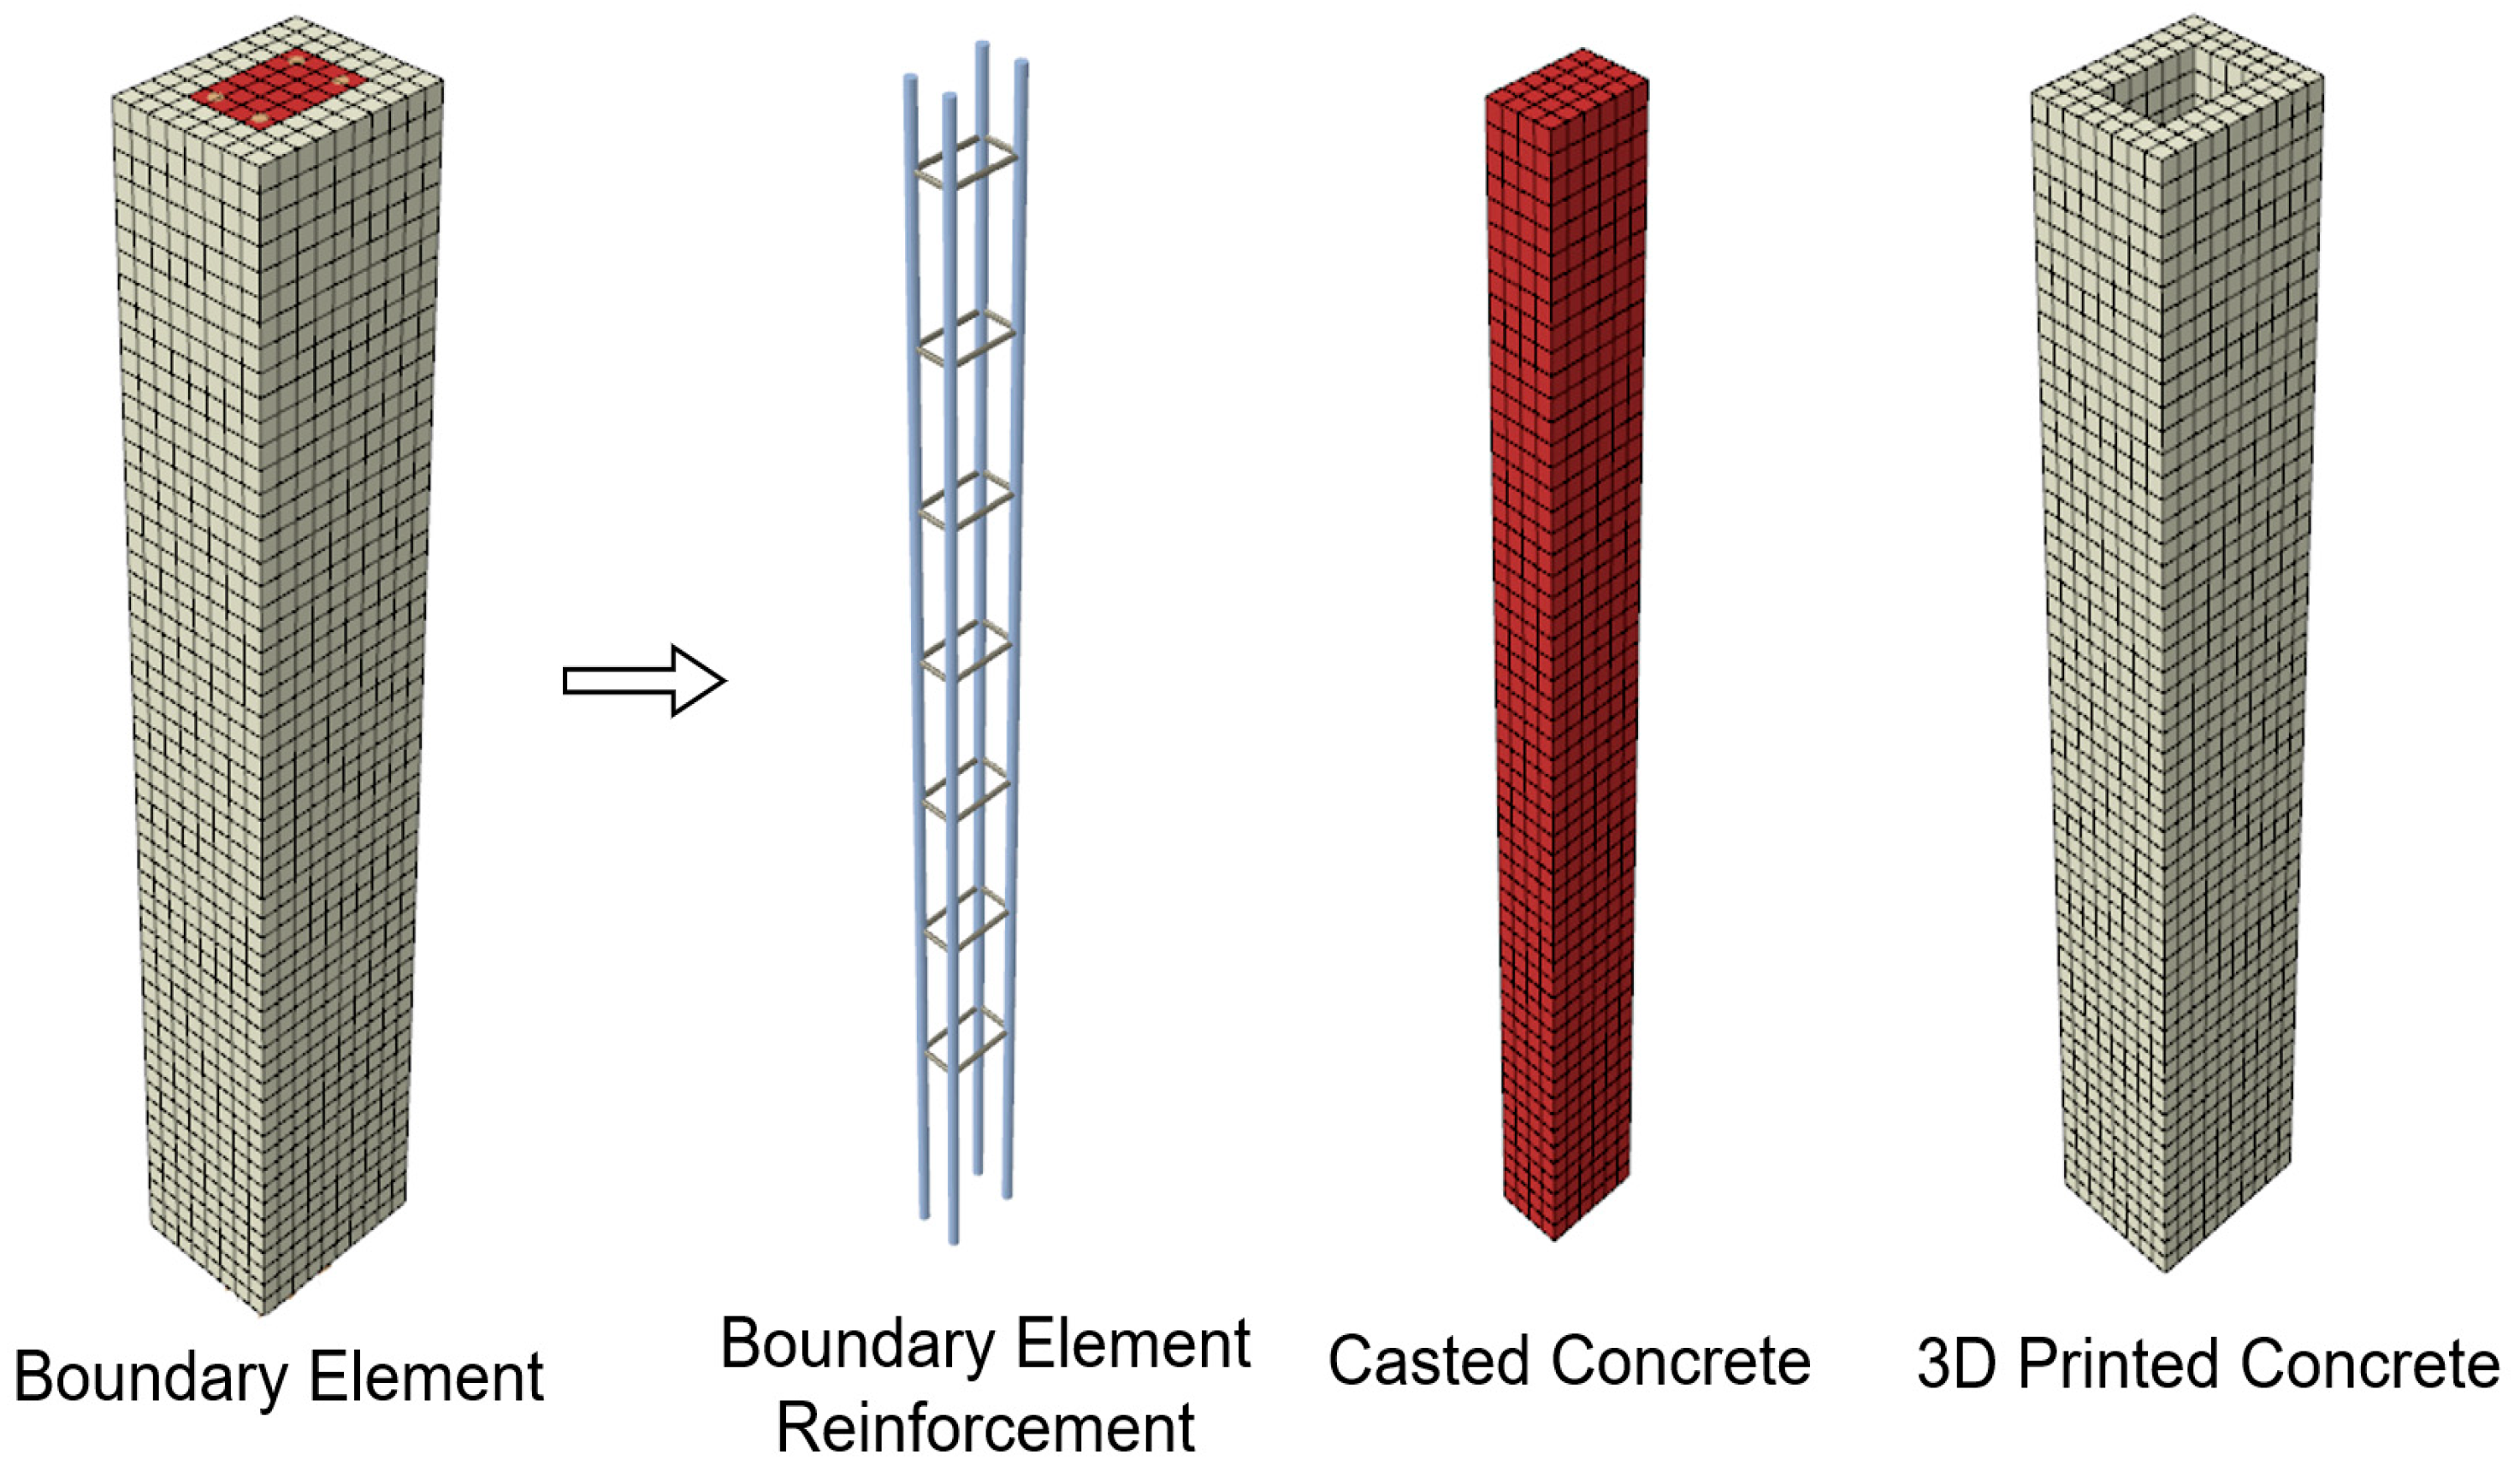
Figure 21.
Numerical model of the boundary elements.
Figure 21.
Numerical model of the boundary elements.
Figure 22.
Comparative shell-based and solid-based finite element analysis of the reference reinforced 3DPC wall “SCut_1”, using C40 class-printed and cast-in-place concrete. The printed concrete layer width was set to 50 mm. The presented results include (a) base shear (kN) vs. top displacement curve (mm), (b) tension damage distribution, (c) reinforcement axial stress (in MPa units), and (d) maximum principal stress (in MPa units).
Figure 23.
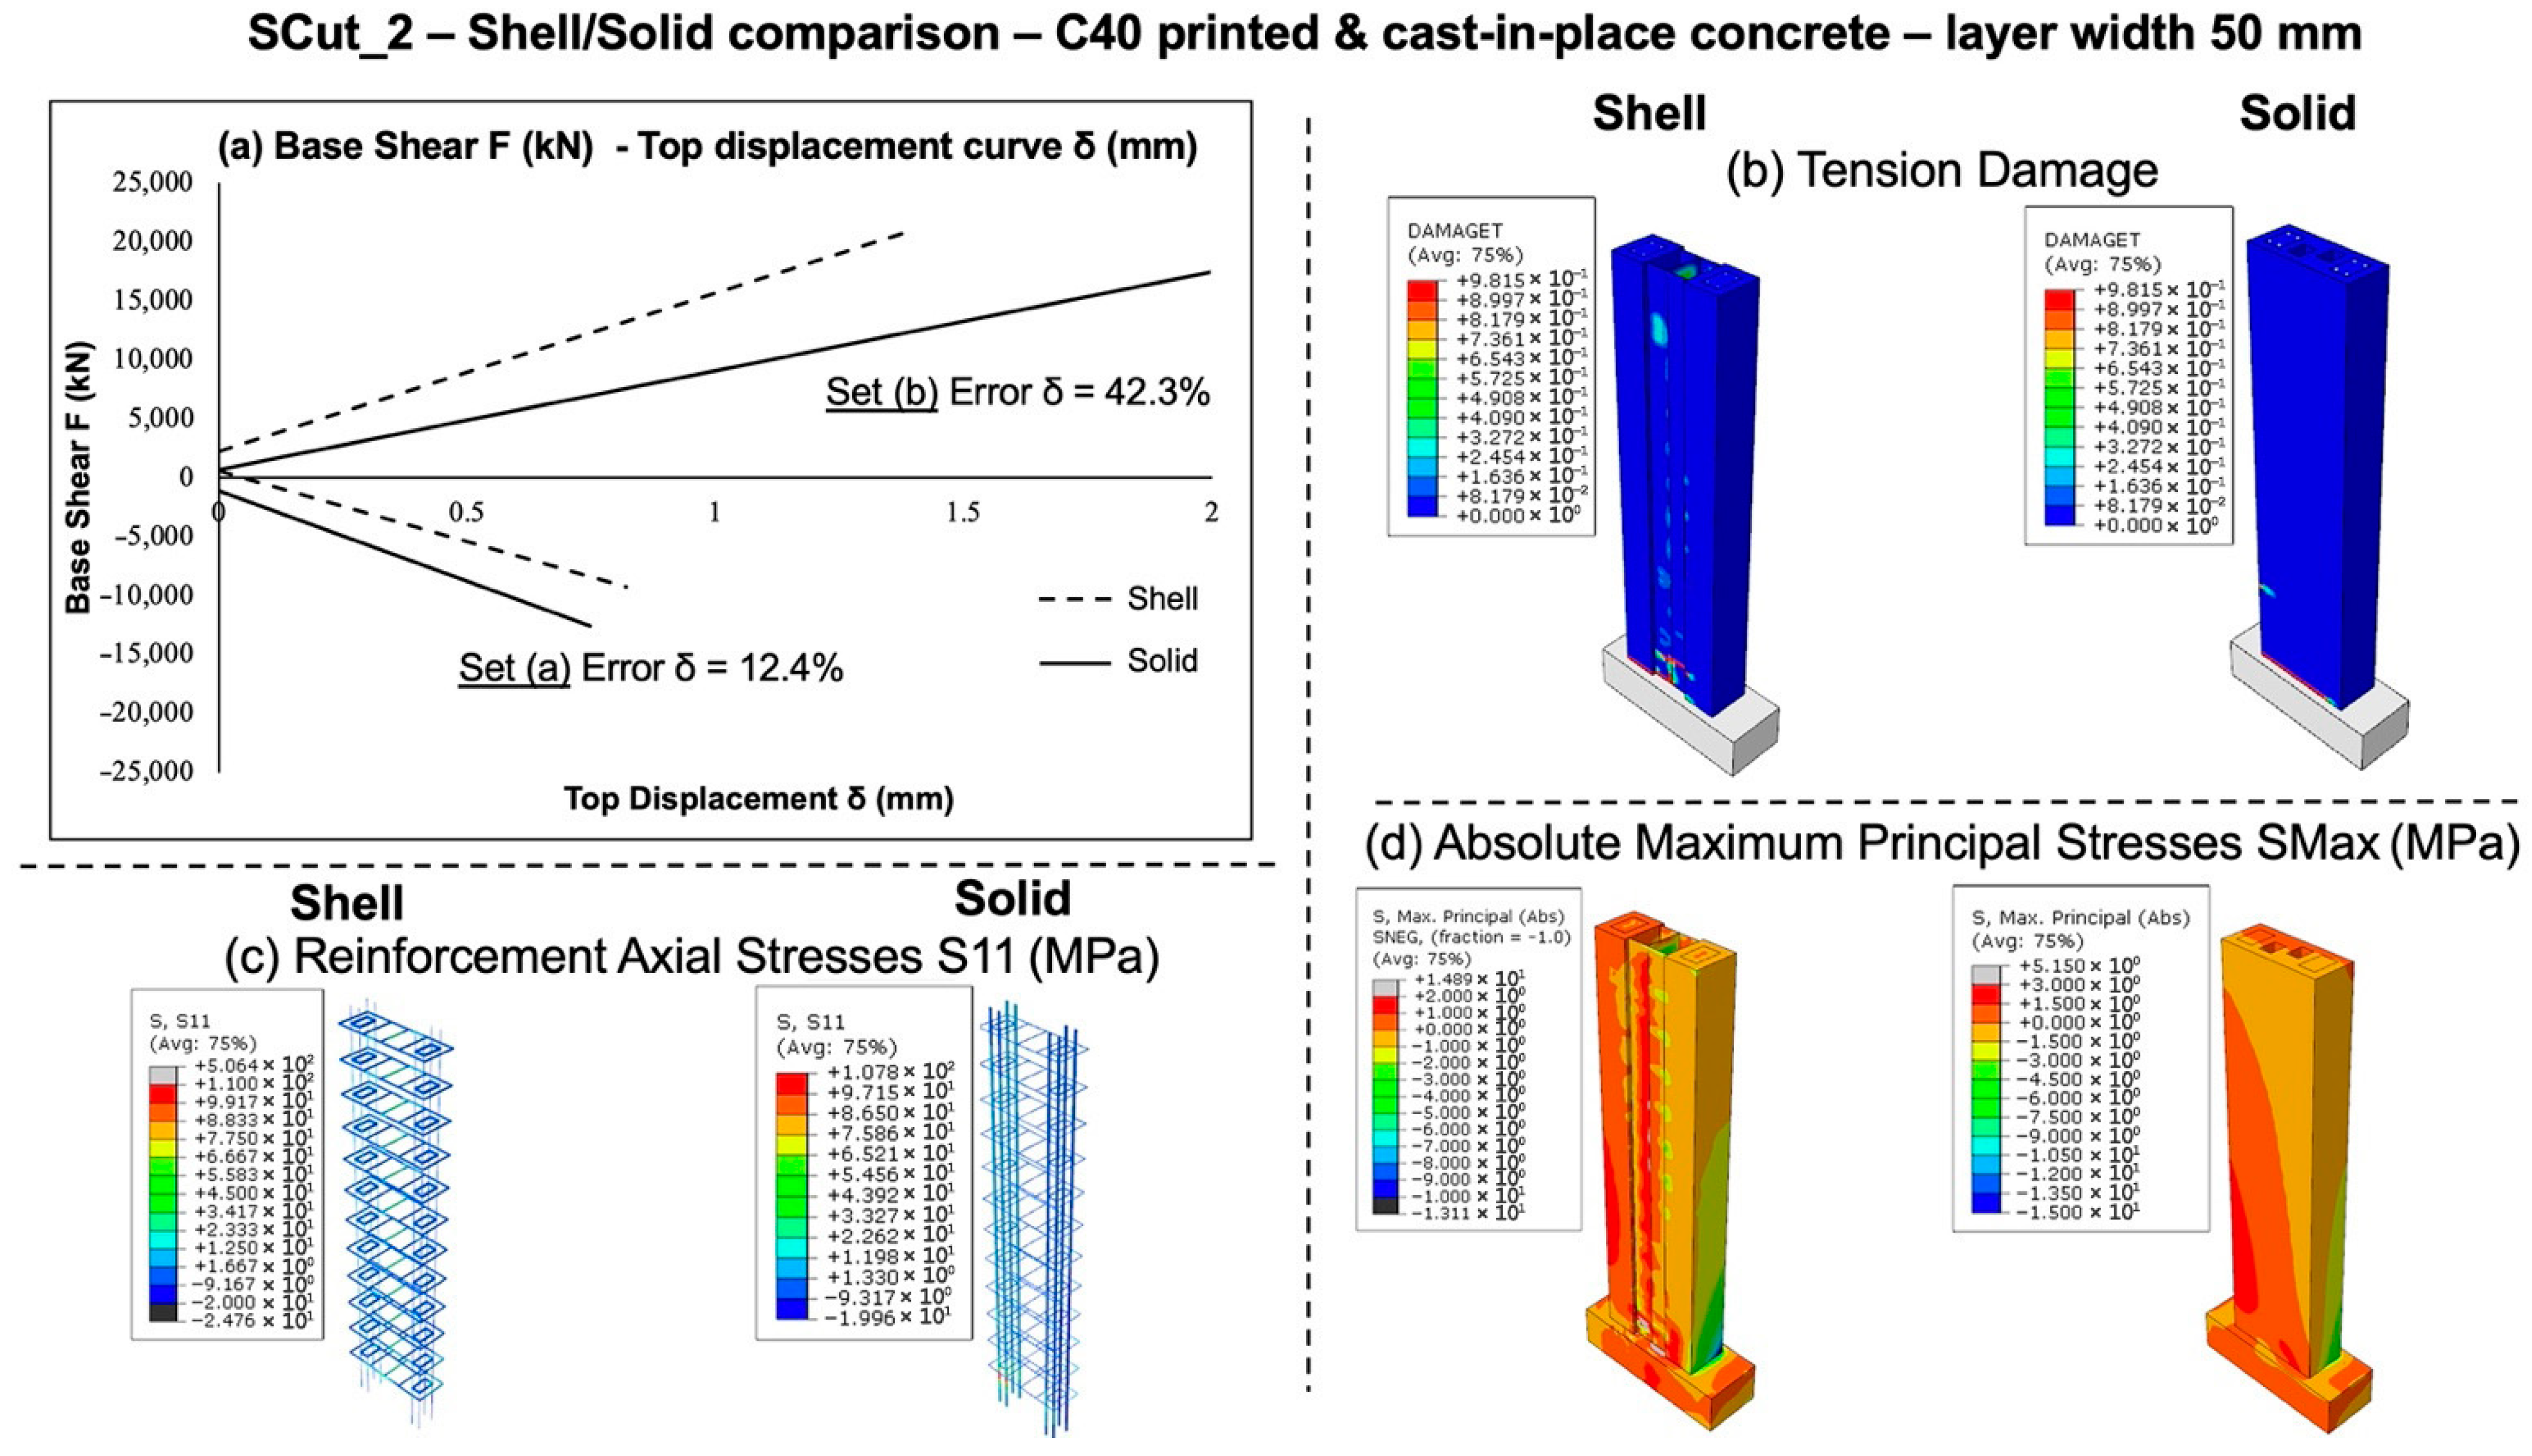
Comparative shell-based and solid-based finite element analysis of the reference reinforced 3DPC wall “SCut_2”, using C40 class-printed and cast-in-place concrete. The printed concrete layer width was set to 50 mm. The presented results include (a) base shear (kN) vs. top displacement curve (mm), (b) tension damage distribution, (c) reinforcement axial stress (in MPa units), and (d) maximum principal stress (in MPa units).
Figure 24.
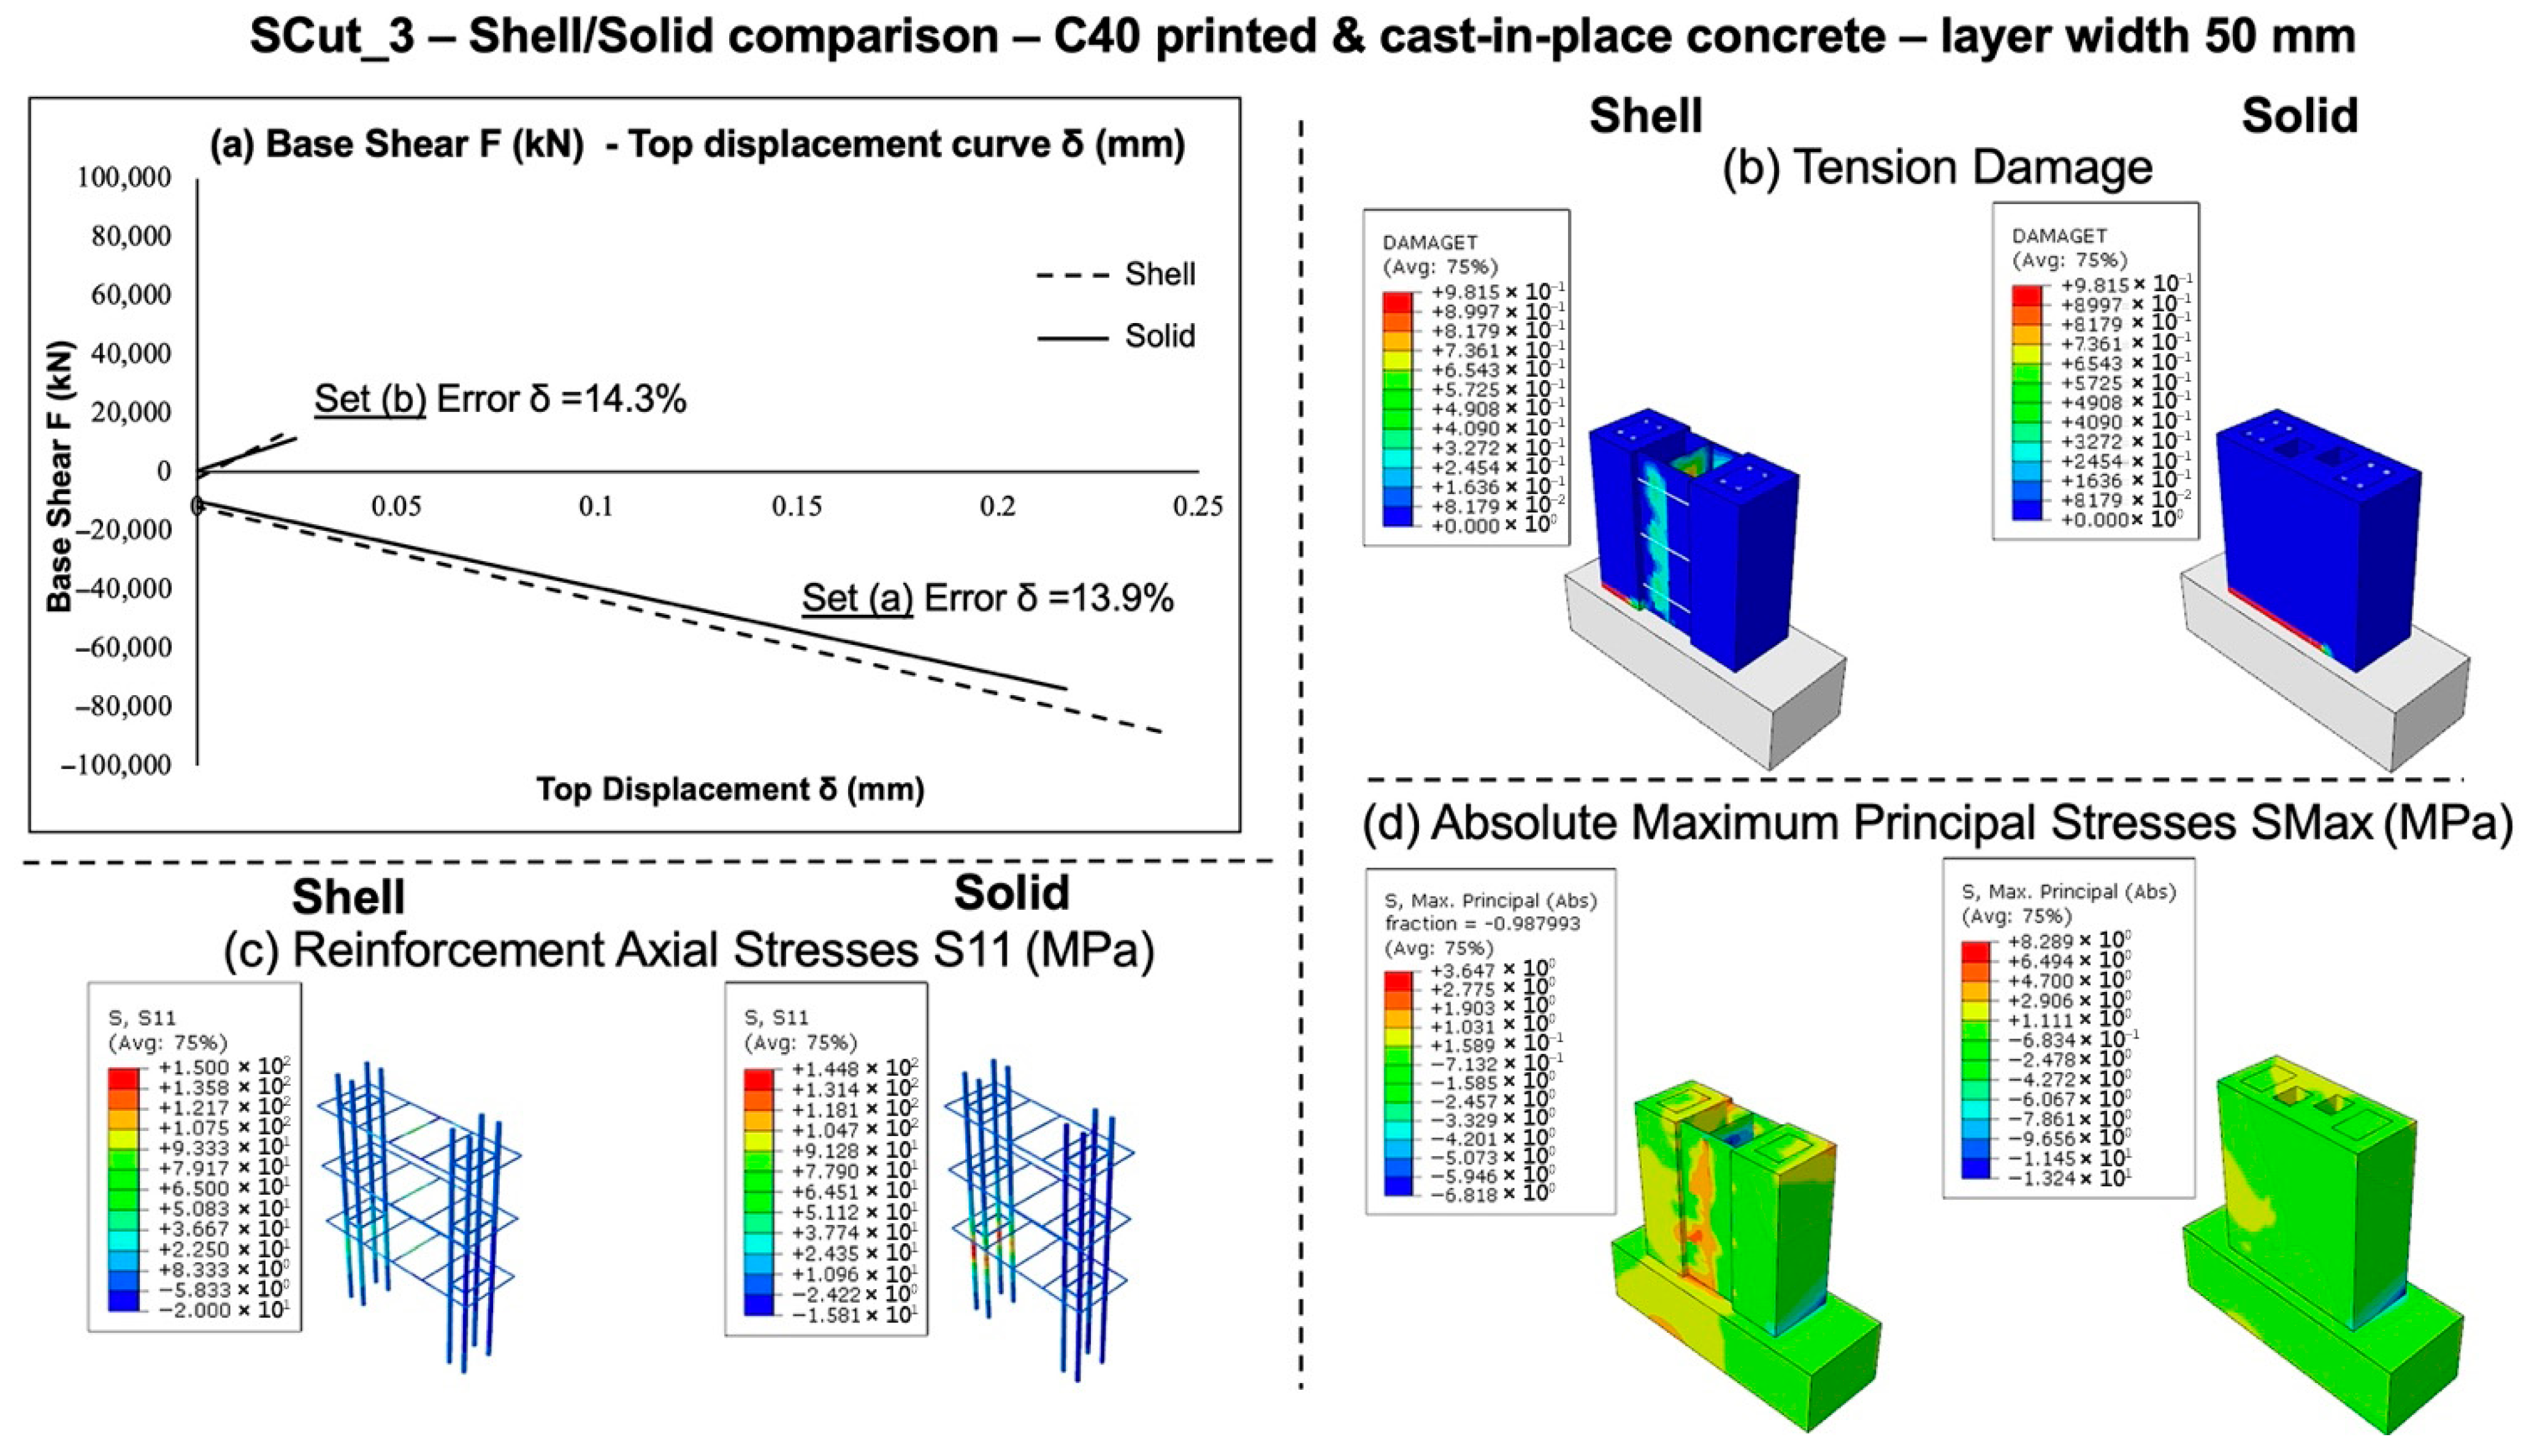
Comparative shell-based and solid-based finite element analysis of the reference reinforced 3DPC wall “SCut_3”, using C40 class-printed and cast-in-place concrete. The printed concrete layer width was set to 50 mm. The presented results include (a) base shear (kN) vs. top displacement curve (mm), (b) tension damage distribution, (c) reinforcement axial stress (in MPa units), and (d) maximum principal stress (in MPa units).
Table 1.
Parameters of the concrete damaged plasticity model.
Table 1.
Parameters of the concrete damaged plasticity model.
| Parameter | ρ (10−9 t/m3) | Dilation Angle ψ (deg) | Eccentricity ε | | K | Viscosity Parameter |
|---|
| Value | 25.0 | 35.0 | 0.10 | 1.16 | 2/3 | 0.0002 |
Table 2.
Two sets of internal forces demand for the three reference section cuts. Notation (a) and (b) refer to the two principal directions of seismic loading.
Table 2.
Two sets of internal forces demand for the three reference section cuts. Notation (a) and (b) refer to the two principal directions of seismic loading.
| SCut ID | (kN) | (kN) | (kN-m) | (kN-m) | (kN-m) | (kN-m) |
|---|
| 1 (a) | 67.83 | 2.48 | 51.61 | 1.00 | 34.32 | 5.28 |
| 1 (b) | −78.82 | −1.22 | −263.58 | −0.63 | −52.86 | −7.58 |
| 2 (a) | 11.02 | 5.85 | −14.34 | 3.65 | 8.00 | 0.60 |
| 2 (b) | −15.64 | −6.23 | −137.11 | −3.88 | −10.48 | −1.06 |
| 3 (a) | 65.93 | 14.20 | 10.43 | 5.29 | 2.51 | 1.08 |
| 3 (b) | −52.03 | −21.18 | −158.24 | −4.46 | −4.61 | −2.20 |
Table 3.
Walls’ geometric properties for printing infill patterns IV and V.
Table 3.
Walls’ geometric properties for printing infill patterns IV and V.
| SCut ID—Pattern | A (cm2) | (cm4) | (cm4) | (cm3) | (cm3) |
|---|
| 1—IV | 2097.0 | 136,629.4 | 2,486,756.8 | 1093.0 | 4144.6 |
| 1—V | 2000.0 | 140,416.7 | 2,461,041.7 | 1123.3 | 4101.7 |
| 2—IV | 1116.0 | 70,561.2 | 323,650 | 564.5 | 1078.8 |
| 2—V | 1050.0 | 70,290.6 | 320,959.4 | 562.3 | 1069.9 |
| 3—IV | 1116.0 | 70,561.2 | 323,650 | 564.5 | 1078.8 |
| 3—V | 1050.0 | 70,290.6 | 320,959.4 | 562.3 | 1069.9 |
Table 4.
Normal
σ and shear
τ stress distribution in the reference cross-section cuts at the top of the walls’ segments, where the internal forces of
Table 2 act. Printing patterns IV and V are used. Notation (a) and (b) refer to the two principal directions of seismic loading.
Table 4.
Normal
σ and shear
τ stress distribution in the reference cross-section cuts at the top of the walls’ segments, where the internal forces of
Table 2 act. Printing patterns IV and V are used. Notation (a) and (b) refer to the two principal directions of seismic loading.
| SCut ID—Pattern | In-Plane | Out-of-Plane |
|---|
| (MPa) | (MPa) | τ (MPa) | (MPa) | (MPa) | τ (MPa) |
|---|
| 1 (a)—IV | −0.61 | 1.10 | 0.32 | 0.15 | 0.34 | 0.01 |
| 1 (b)—IV | −2.58 | 0.07 | −0.38 | −1.31 | −1.12 | −0.01 |
| 1 (a)—V | −0.60 | 1.11 | 0.34 | 0.17 | 0.35 | 0.01 |
| 1 (b)—V | −2.64 | 0.00 | −0.39 | −1.38 | −1.26 | −0.01 |
| 2 (a)—IV | −0.87 | 0.61 | 0.10 | −0.78 | 0.52 | 0.05 |
| 2 (b)—IV | −2.20 | −0.26 | −0.14 | −1.92 | −0.54 | −0.05 |
| 2 (a)—V | −0.88 | 0.60 | 0.11 | 0.79 | 0.51 | 0.05 |
| 2 (b)—V | −2.28 | −0.32 | −0.15 | −2.00 | −0.61 | −0.06 |
| 3 (a)—IV | −0.19 | 0.33 | 0.59 | −0.84 | 1.03 | 0.13 |
| 3 (b)—IV | −1.84 | −0.99 | −0.47 | −2.21 | −0.63 | −0.19 |
| 3 (a)—V | −0.14 | 0.33 | 0.66 | −0.85 | 1.04 | 0.13 |
| 3 (b)—V | −1.94 | −1.08 | −0.50 | −2.30 | −0.71 | −0.20 |
Table 5.
Results of the proposed analytical methodology for response estimation of unreinforced 3DPC walls, evaluated at their free end where the internal forces are applied.
Table 5.
Results of the proposed analytical methodology for response estimation of unreinforced 3DPC walls, evaluated at their free end where the internal forces are applied.
| SCut ID | Infill Pattern | Compressive Failure Check | Tensile Failure Check |
|---|
| 1 | IV | No failure—Adequate | No failure—Adequate |
| 1 | V | No failure—Adequate | No failure—Adequate |
| 2 | IV | No failure—Adequate | No failure—Adequate |
| 2 | V | No failure—Adequate | No failure—Adequate |
| 3 | IV | No failure—Adequate | No failure—Adequate |
| 3 | V | No failure—Adequate | No failure—Adequate |
Table 6.
Normal σ and shear τ stress distribution in the reference cross-section cuts at the base of each reference wall. Printing patterns IV and V are used. Notation (a) and (b) refer to the two principal directions of seismic loading.
Table 6.
Normal σ and shear τ stress distribution in the reference cross-section cuts at the base of each reference wall. Printing patterns IV and V are used. Notation (a) and (b) refer to the two principal directions of seismic loading.
| SCut ID—Pattern | In-Plane | Out-of-Plane |
|---|
| (MPa) | (MPa) | τ (MPa) | (MPa) | | τ (MPa) |
|---|
| 1 (a)—IV | 1.70 | 3.37 | 0.32 | 0.47 | 0.65 | 0.01 |
| 1 (b)—IV | −5.19 | −2.64 | −0.38 | −1.47 | −1.36 | −0.01 |
| 1 (a)—V | 1.74 | 3.41 | 0.34 | 0.48 | 0.66 | 0.01 |
| 1 (b)—V | −5.30 | −2.72 | −0.39 | −1.52 | −1.41 | −0.01 |
| 2 (a)—IV | 1.58 | 3.06 | 0.10 | 1.71 | 3.00 | 0.05 |
| 2 (b)—IV | −5.68 | −3.74 | −0.14 | −4.56 | −3.19 | −0.05 |
| 2 (a)—V | 1.59 | 3.08 | 0.10 | 1.71 | 3.01 | 0.05 |
| 2 (b)—V | −5.79 | −3.83 | −0.15 | −4.65 | −3.27 | −0.06 |
| 3 (a)—IV | 3.53 | 3.99 | 0.59 | 0.66 | 2.53 | 0.13 |
| 3 (b)—IV | −4.79 | −3.88 | −0.47 | −4.47 | −2.88 | −0.19 |
| 3 (a)—V | 3.56 | 4.03 | 0.66 | 0.67 | 2.55 | 0.13 |
| 3 (b)—V | −4.86 | −3.98 | −0.50 | −4.56 | −2.97 | −0.20 |
Table 7.
Results of the proposed analytical methodology for response estimation of unreinforced 3DPC walls, evaluated at each wall’s base.
Table 7.
Results of the proposed analytical methodology for response estimation of unreinforced 3DPC walls, evaluated at each wall’s base.
| SCut ID | Infill Pattern | Compressive Failure Check | Tensile Failure Check |
|---|
| 1 | IV | No failure—Adequate | Failure—Inadequate |
| 1 | V | No failure—Adequate | Failure—Inadequate |
| 2 | IV | No failure—Adequate | Failure—Inadequate |
| 2 | V | No failure—Adequate | Failure—Inadequate |
| 3 | IV | No failure—Adequate | Failure—Inadequate |
| 3 | V | No failure—Adequate | Failure—Inadequate |
